Attached files
| file | filename |
|---|---|
| EX-32.1 - EXHIBIT 32.1 - SRC Energy Inc. | exhibit32120150831.htm |
| EX-31.3 - EXHIBIT 31.3 - SRC Energy Inc. | exhibit31320150831.htm |
| EX-23.1 - EXHIBIT 23.1 - SRC Energy Inc. | exhibit231ekshconsent.htm |
| EX-10.12 - EXHIBIT 10.12 - SRC Energy Inc. | exhibit1012hscattlelease.htm |
| EX-31.2 - EXHIBIT 31.2 - SRC Energy Inc. | exhibit31220150831.htm |
| EX-31.1 - EXHIBIT 31.1 - SRC Energy Inc. | exhibit31120150831.htm |
| EX-10.8 - EXHIBIT 10.8 - SRC Energy Inc. | exhibit108formofindemnific.htm |
| EX-23.2 - EXHIBIT 23.2 - SRC Energy Inc. | exhibit232ryderscottconsen.htm |
| EX-99.1 - EXHIBIT 99.1 - SRC Energy Inc. | exhibit991ryderscottletter.htm |
UNITED STATES
SECURITIES AND EXCHANGE COMMISSION
Washington, D.C. 20549
FORM 10-K
(Mark One)
ý | ANNUAL REPORT PURSUANT TO SECTION 13 OR 15(d) OF THE SECURITIES EXCHANGE ACT OF 1934 | |
For the fiscal year ended August 31, 2015
OR
o | TRANSITION REPORT PURSUANT TO SECTION 13 OR 15(d) OF THE SECURITIES EXCHANGE ACT OF 1934 | |
For the transition period from _______________________ to _______________________
Commission file number: 001-35245
SYNERGY RESOURCES CORPORATION
(Exact name of registrant as specified in its charter)
COLORADO | 20-2835920 |
(State or other jurisdiction of incorporation or organization) | (I.R.S. Employer Identification No.) |
1625 Broadway, Suite 300, Denver, CO | 80202 |
(Address of principal executive offices) | (Zip Code) |
Registrant's telephone number, including area code: (720) 616-4300
Securities registered pursuant to Section 12(b) of the Act:
Title of each class | Name of each exchange on which registered | |
Common Stock | NYSE MKT | |
Indicate by check mark if the registrant is a well-known seasoned issuer, as defined in Rule 405 of the Securities Act. Yes ý No o
Indicate by check mark if the registrant is not required to file reports pursuant to Section 13 or Section 15(d) of the Act. Yes o No ý
Indicate by check mark whether the registrant (1) has filed all reports to be filed by Section 13 or 15(d) of the Securities Exchange Act of 1934 during the preceding 12 months (or for such shorter period that the registrant was required to file such reports), and (2) has been subject to such filing requirements for the past 90 days. Yes ý No o
Indicate by check mark whether the registrant has submitted electronically and posted on its corporate Website, if any, every Interactive Data File required to be submitted and posted pursuant to Rule 405 of Regulations S-T (§232.405 of this chapter) during the preceding 12 months (or for such shorter period that the registrant was required to submit and post such filing). Yes ý No o
Indicate by check mark if disclosure of delinquent filers pursuant to Item 405 of Regulation S-K (§229.405 of this chapter) is not contained herein, and will not be contained, to the best of Registrant's knowledge, in definitive proxy or information statements incorporated by reference in Part III of this Form 10-K or any amendment to this Form 10-K. ý
Indicate by check mark whether the registrant is a large accelerated filer, an accelerated filer, a non-accelerated filer, or a smaller reporting company. See the definitions of “large accelerated filer,” “accelerated filer” and “smaller reporting company” in Rule 12b-2 of the Exchange Act.
Large accelerated filer x | Accelerated filer o |
Non-accelerated filer o (Do not check if a smaller reporting company) | Smaller reporting company o |
Indicate by check mark whether the registrant is a shell company (as defined in Rule 12b-2 of the Act): Yes ý No o
The aggregate market value of the voting stock held by non-affiliates of the registrant, based upon the closing sale price of the registrant’s common stock on February 28, 2015, was approximately $1.1 billion. Shares of the registrant’s common stock held by each officer and director and each person known to the registrant to own 10% or more of the outstanding voting power of the registrant have been excluded in that such persons may be deemed to be affiliates. This determination of affiliate status is not a determination for other purposes.
As of October 10, 2015, the Registrant had 105,111,133 issued and outstanding shares of common stock.
PART I
Cautionary Statement Concerning Forward-Looking Statements
This report contains “forward-looking statements” within the meaning of the Private Securities Litigation Reform Act of 1995. These statements are subject to risks and uncertainties and are based on the beliefs and assumptions of management and information currently available to management. The use of words such as “believes,” “expects,” “anticipates,” “intends,” “plans,” “estimates,” “should,” “likely,” or similar expressions indicate forward-looking statements.
The identification in this report of factors that may affect our future performance and the accuracy of forward-looking statements is meant to be illustrative and by no means exhaustive. All forward-looking statements should be evaluated with the understanding of their inherent uncertainty.
Factors that could cause our actual results to differ materially from those expressed or implied by forward-looking statements include, but are not limited to:
• | extended or further decline in oil and natural gas prices; |
• | operating hazards that adversely affect our ability to conduct business; |
• | uncertainties in the estimates of proved reserves; |
• | effect of seasonal weather conditions and wildlife restrictions on our operations; |
• | our ability to fund, develop, produce and acquire additional oil and natural gas reserves that are economically recoverable; |
• | our ability to obtain adequate financing; |
• | effect of local and regional factors on oil and natural gas prices; |
• | incurrence of ceiling test write-downs; |
• | our inability to control operations on properties we do not operate; |
• | availability and capacity of gathering systems and pipelines for our production; |
• | the strength and financial resources of our competitors; |
• | our ability to successfully identify, execute or effectively integrate future acquisitions; |
• | effect of federal, state and local laws and regulations; |
• | effects of new environmental legislation or regulatory initiatives, including those related to hydraulic fracturing; |
• | our ability to market our production; |
• | the effects of local moratoria or bans on our business; |
• | effect of environmental liabilities; |
• | effect of the adoption and implementation of new statutory and regulatory requirements for derivative transactions; |
• | changes in U.S. tax laws; |
• | our ability to satisfy our contractual obligations and commitments; |
• | the amount of our indebtedness and ability to maintain compliance with debt covenants; |
• | key executives allocating a portion of their time to other business interests; |
• | effectiveness of our disclosure controls and our internal controls over financial reporting; |
• | the geographic concentration of our principal properties; |
• | our ability to protect critical data and technology systems; |
• | the availability of water for use in our operations; and |
• | the risks and uncertainties described in "Risk Factors." |
1
GLOSSARY OF UNITS OF MEASUREMENT AND INDUSTRY TERMS
We have included below the definitions for various units of measurement and industry terms used in this Annual Report on Form 10-K.
Units of Measurement
The following presents a list of units of measurement used throughout the document.
Bbl - One stock tank barrel, or 42 U.S. gallons liquid volume, of crude oil or NGL.
Bcf - One billion cubic feet of natural gas volume.
BOE - One barrel of crude oil equivalent, which combines Bbls of oil and Mcf of gas by converting each six Mcf of gas to one Bbl of oil.
BOED - BOE per day.
Btu - British thermal unit.
MBOE - One thousand BOE.
MMBbls - One million barrels of crude oil.
Mcf - One thousand cubic feet of natural gas volume.
MMBtu - One million British thermal units.
MMcf - One million cubic feet of natural gas volume.
MMcf/d - MMcf per day.
Glossary of Industry Terms
The following are abbreviations and definitions of terms commonly used in the oil and gas industry and this report:
Completion - Refers to the work performed and the installation of permanent equipment for the production of crude oil and natural gas from a recently drilled well.
Developed acreage - Acreage assignable to productive wells.
Development well - A well drilled within the proved area of an oil or gas reservoir to the depth of a stratigraphic horizon known to be productive.
Differentials - The difference between the crude oil and natural gas index spot price and the corresponding cash spot price in a specified location.
Dry gas - Natural gas is considered dry when its composition is over 90% pure methane.
Dry well or dry hole - A well found to be incapable of producing hydrocarbons in sufficient quantities to justify completion as an oil or gas well.
EURs - Estimated ultimate recoveries.
Exploratory well - A well drilled to find a new field or to find a new reservoir in a field previously found to be productive of oil or gas in another reservoir.
Extensions and discoveries - As to any period, the increases to proved reserves from all sources other than the acquisition of proved properties or revisions of previous estimates.
Farm-out - Transfer of all or part of the operating rights from a working interest owner to an assignee, who assumes all or some of the burden of development in return for an interest in the property. The assignor usually retains an overriding royalty interest but may retain any type of interest.
Fracture or Fracturing - a procedure to stimulate production by forcing a mixture of fluid and proppant into the formation under high pressure. Fracturing creates artificial fractures in the reservoir rock to increase permeability, thereby allowing the release of trapped hydrocarbons.
Gross acres or wells - Refers to the total acres or wells in which we have a working interest.
2
Henry Hub - Henry Hub index. Natural gas distribution point where prices are set for natural gas futures contracts traded on the NYMEX.
Horizontal drilling - A drilling technique that permits the operator to drill a horizontal wellbore from the bottom of a vertical section of a well and thereby to contact and intersect a larger portion of the producing horizon than conventional vertical drilling techniques allow and may, depending on the horizon, result in increased production rates and greater ultimate recoveries of hydrocarbons.
Horizontal well - A well that has been drilled using the horizontal drilling technique. The term "horizontal wells" include wells where the productive length of the wellbore is drilled more or less horizontal to the earth's surface, to intersect the target formation on a parallel basis.
Joint interest billing - Process of billing/invoicing the costs related to well drilling, completions and production operations among working interest partners.
Natural gas liquid(s) or NGL(s) - Hydrocarbons which can be extracted from "wet" natural gas and become liquid under various combinations of increasing pressure and lower temperature. NGLs include ethane, propane, butane, and other condensates.
Net acres or wells - Refers to gross acres or wells we own multiplied, in each case, by our percentage working interest.
Net revenue interest - Refers to all working interests less all royalties.
Net production - Crude oil and natural gas production that we own, less royalties and production due to others.
Non-operated - A project in which another entity has responsibility over the daily operation of the project.
NYMEX - New York Mercantile Exchange.
OPEC - the Organization of Petroleum Exporting Countries.
Operator - The individual or company responsible for the exploration, development and/or production of an oil or gas well or lease.
Overriding royalty - An interest which is created out of the operating or working interest. Its term is coextensive with that of the operating interest.
Possible reserves - This term is defined in SEC Regulation S-X Section 4-10(a) and refers to those reserves that are less certain to be recovered than probable reserves. When deterministic methods are used, the total quantities ultimately recovered from a project have a low probability to exceed the sum of proved, probable and possible reserves. When probabilistic methods are used, there must be at least a 10 percent probability that the actual quantities recovered will equal or exceed the sum of proved, probable and possible estimates.
Present value of future net revenues or (PV-10) - PV-10 is a Non-GAAP financial measure calculated before the imposition of corporate income taxes. It is derived from the standardized measure of discounted future net cash flows relating to proved oil and gas reserves prepared in accordance with the provisions of Accounting Standards Codification Topic 932, Extractive Activities - Oil and Gas. The standardized measure of discounted future net cash flows is determined by using estimated quantities of proved reserves and the periods in which they are expected to be developed and produced based on specified economic conditions. The estimated future production is based upon benchmark prices that reflect the unweighted arithmetic average of the first-day-of-the-month price for oil and gas during the relevant period. The resulting estimated future cash inflows are then reduced by estimated future costs to develop and produce reserves based on current cost levels. No deduction is made for the depreciation, depletion or amortization of historical costs or for indirect costs, such as general corporate overhead. Present values are computed by discounting future net revenues by 10% per year.
Probable reserves - This term is defined in SEC Regulation S-X Section 4-10(a) and refers to those reserves that are less certain to be recovered than proved reserves but which, together with proved reserves, are as likely as not to be recovered. When deterministic methods are used, it is as likely as not that actual remaining quantities recovered will exceed the sum of estimated proved plus probable reserves. Similarly, when probabilistic methods are used, there must be at least a 50 percent probability that the actual quantities recovered will equal or exceed the proved plus probable reserves estimates.
3
Productive well - A well that is not a dry well or dry hole, as defined above, and includes wells that are mechanically capable of production.
Proved developed non-producing reserves or PDNPs - Reserves that consist of (i) proved reserves from wells which have been completed and tested but are not producing due to lack of market or minor completion problems which are expected to be corrected and/or (ii) proved reserves currently behind the pipe in existing wells and which are expected to be productive due to both the well log characteristics and analogous production in the immediate vicinity of the wells.
Proved developed producing reserves or PDPs - Proved reserves that can be expected to be recovered from currently producing zones under the continuation of present operating methods.
Proved developed reserves - The combination of proved developed producing and proved developed non-producing reserves.
Proved reserves - This term means "proved oil and gas reserves" as defined in SEC Regulation S-X Section 4-10(a) and refers to those quantities of crude oil and condensate, natural gas and NGLs, which, by analysis of geoscience and engineering data, can be estimated with reasonable certainty to be economically producible - from a given date forward, from known reservoirs, and under existing conditions, operating methods, and government regulations - prior to the time at which contracts providing the right to operate expire, unless evidence indicates that renewal is reasonably certain, regardless of whether deterministic or probabilistic methods are used for the estimation.
Proved undeveloped reserves or PUDs - Proved reserves that are expected to be recovered from new wells on undrilled acreage, or from existing wells where a relatively major expenditure is required for recompletion.
Recomplete or Recompletion - The modification of an existing well for the purpose of producing crude oil and natural gas from a different producing formation.
Reserves - Estimated remaining quantities of crude oil, natural gas, NGLs and related substances anticipated to be economically producible, as of a given date, by application of development projects to known accumulations. In addition, there must exist, or there must be a reasonable expectation that there will exist, the legal right to produce or a revenue interest in the production, installed means of delivering crude oil, natural gas and NGLs or related substances to market, and all permits and financing required to implement the project.
Royalty - An interest in a crude oil and natural gas lease or mineral interest that gives the owner of the royalty the right to receive a portion of the production from the leased acreage or mineral interest (or of the proceeds of the sale thereof), but generally does not require the owner to pay any portion of the costs of drilling or operating the wells on the leased acreage. Royalties may be either landowner’s royalties, which are reserved by the owner of the leased acreage at the time the lease is granted, or overriding royalties, which are usually reserved by an owner of the leasehold in connection with a transfer to a subsequent owner.
Section - A square tract of land one mile by one mile, containing 640 acres.
Spud - To begin drilling; the act of beginning a hole.
Standardized measure of discounted future net cash flows or standardized measure - Future net cash flows discounted at a rate of 10%. Future net cash flows represent the estimated future revenues to be generated from the production of proved reserves determined in accordance with SEC guidelines, net of estimated production and future development costs, using prices and costs as of the date of estimation without future escalation, giving effect to (i) estimated future abandonment costs, net of the estimated salvage value of related equipment and (ii) future income tax expense.
Undeveloped acreage - Leased acreage on which wells have not been drilled or completed to a point that would permit the production of commercial quantities of crude oil and natural gas, regardless of whether such acreage contains proved reserves.
Vertical well - Directional wells that are drilled at an angle toward a target area where the productive length of the wellbore intersects the target formation on a perpendicular basis.
Wet gas or wet natural gas - Natural gas that contains a larger quantity of hydrocarbon liquids than dry natural gas, such as NGLs, condensate and crude oil.
4
Working interest - An interest in a crude oil and natural gas lease that gives the owner of the interest the right to drill and produce crude oil and natural gas on the leased acreage. It requires the owner to pay its share of the costs of drilling and production operations.
Workover - Major remedial operations on a producing well to restore, maintain or improve the well's production.
WTI - West Texas Intermediate. A specific grade of crude oil used as a benchmark in oil pricing. It is the underlying commodity of NYMEX's oil futures contracts.
ITEM 1. | BUSINESS |
Overview
Synergy Resources Corporation ("we," "us," "Synergy" or the "Company") is a growth-oriented independent oil and natural gas company engaged in the acquisition, development, and production of crude oil and natural gas in and around the Denver-Julesburg Basin (“D-J Basin”) of Colorado, which we believe to be one of the premier liquids-rich oil and gas resource plays in the United States. The D-J Basin generally extends from the Denver metropolitan area throughout northeast Colorado into Wyoming, Nebraska, and Kansas. It contains hydrocarbon-bearing deposits in several formations, including the Niobrara, Codell, Greenhorn, Shannon, Sussex, J-Sand and D-Sand. The area has produced oil and gas for over fifty years and benefits from established infrastructure, including midstream and refining capacity, long reserve life, and multiple service providers.
Our drilling and completion activities are focused in the Wattenberg Field, an area that covers the western flank of the D-J Basin, predominantly in Weld County, Colorado. Currently we are focused on the horizontal development of the Codell and Niobrara formations, which are characterized by relatively high liquids content. We operate the majority of the horizontal wells in which we have working interests, and we strive to maintain a high net revenue interest in all of our operations.
Core Operations
Since commencing active operations in September 2008, we have undergone significant growth. From inception through August 31, 2015, we have completed, acquired or participated in 582 gross (407 net) productive oil and gas wells. As of August 31, 2015, we are the operator of 423 producing wells and participate as non-operators in 159 producing wells. In addition to the wells that reached productive status by August 31, 2015, there were 28 gross (17 net) wells in various stages of drilling or completion as of that date.
Our early development efforts were focused on drilling vertical wells into the Niobrara, Codell, and J-Sand formations. In May 2013, we shifted our efforts to horizontal well development within the Wattenberg Field. Since shifting to horizontal development, we have drilled or participated in the drilling of 142 gross (78 net) horizontal wells. As of August 31, 2015, we are the operator of 33 gross (32 net) Codell horizontal wells and 38 gross (37 net) Niobrara horizontal wells.
For the fiscal year ended August 31, 2015, our average net daily production was 8,750 BOED. By comparison, during our 2014 and 2013 fiscal years, our average production rate was 4,290 BOED and 2,117 BOED, respectively. By the end of our 2015 fiscal year, over 80% of our daily operated production was from horizontal wells. At the beginning of fiscal 2014, less than 10% of our production was from horizontal wells.
2015 Key Developments
During the fiscal year ended August 31, 2015, we continued to execute our plans for rapid growth, more than doubling our oil and gas production on a BOE basis through development of our existing oil and gas properties and strategic acquisitions of producing properties. During the year, oil prices declined 49%, which directly impacted both our revenues for the year and our costs to produce oil and gas. Revenue for the year ended August 31, 2015 was $124.8 million and net income was $18.0 million, or $0.19 per diluted share, compared to revenue of $104.2 million and net income of $28.9 million for the prior fiscal year. See further discussion of our financial and operational results for the year ended August 31, 2015 in Part II, Item 7 Management's Discussion and Analysis of Financial Condition and Results of Operations.
5
Significant business developments for the year ended August 31, 2015 are described below.
Acquisition Activity
Pending Acquisition
Subsequent to our fiscal year end, on September 15, 2015, we announced an agreement for the purchase of interests in producing wells and non-producing leaseholds in the Wattenberg Field from K.P. Kauffman Company, Inc. The assets include leasehold rights for 4,300 net acres in the Wattenberg Field and non-operated working interests in 25 gross (approximately 5 net) horizontal wells in the Niobrara and Codell formations. Current net production associated with the purchased assets is approximately 1,200 BOED. The purchase price for the assets is $78.0 million, comprised of $35.0 million in cash and approximately 4.4 million restricted shares of Synergy common stock, subject to closing adjustments. The transaction has an effective date of September 1, 2015 and is expected to close on or before October 30, 2015.
2015 Acquisition
During the fiscal 2015, we completed the acquisition of certain assets from three independent oil and gas companies collectively known as “Bayswater”. The Bayswater acquisition encompassed 4,227 net acres with rights to the Codell and Niobrara formations, and 1,480 net acres with rights to other formations including the Sussex, Shannon and J-Sand. Additionally, as part of the Bayswater acquisition, we acquired working interests in 17 non-operated horizontal wells, 73 operated vertical wells, and 11 non-operated vertical wells. Consideration paid to Bayswater, after customary closing and post-closing adjustments, consisted of approximately $74.2 million in cash and 4.6 million shares of our common stock plus the assumption of certain liabilities.
Financing
Equity offering
During fiscal 2015, we completed a public offering of 18,613,952 shares of our common stock (including the shares sold pursuant to an over-allotment option exercised by the underwriters) at a price to the public of $10.75 per share. On February 2, 2015, we received net proceeds of approximately $190.8 million after deducting underwriting discounts, commissions and other offering expenses.
Revolving Credit Facility
We continue to maintain a borrowing arrangement with our bank syndicate to provide us with needed liquidity, which we will use to develop oil and gas properties, acquire new oil and gas properties, and for working capital and other general corporate purposes. This revolving credit facility (the "Revolver"), which was amended twice during our 2015 fiscal year to increase our maximum loan commitment and to increase our borrowing base, currently provides for maximum borrowings of $500 million, subject to adjustments based upon a borrowing base calculation, which is re-determined semi-annually using updated reserve reports. As of August 31, 2015, the Revolver provided for a borrowing base of $163 million, of which $85 million was available to us for future borrowings. The Revolver is collateralized by certain of our assets, including producing properties, and bears a minimum interest rate on borrowings of 2.5%, with the effective rate varying with utilization. The Revolver expires on December 15, 2019. See further discussion in Note 6 to our consolidated financial statements.
Commodity Contracts
We utilize put options, swaps and collars to reduce the impact of commodity price changes on a portion of our anticipated future oil and gas production. Our objective in using derivative financial instruments is to achieve more predictable cash flows in an environment of volatile oil and gas prices and to manage our exposure to commodity price risk. Using puts and collars as of October 1, 2015, we have contracted for approximately 0.7 million Bbls of oil and 3,036 MMcf of gas through August 31, 2017. The high average commodity prices experienced during 2014 enabled us to enter oil and natural gas contracts which were designed to protect us against potential price declines in 2015. The settlement and partial liquidation of these positions during the 2015 fiscal year created a realized gain of $30.5 million, including gains of $10.0 million from the settlement of contracts at their scheduled maturity dates and gains of $20.5 million from the early liquidation of “in-the-money” contracts. Additionally, the decline in posted prices at the end of our fiscal year created an unrealized increase in the fair value of our open commodity contracts of $1.8 million. Subsequent to August 31, 2015, the Company added an additional put option for 120,000 Bbls of oil at a floor price of $45 per Bbl.
6
Properties
As of August 31, 2015, our estimated net proved oil and gas reserves, as prepared by our independent reserve engineering firm Ryder Scott Company, L.P. ("Ryder Scott"), were 27.7 MMBbls of oil and condensate and 174.0 Bcf of natural gas. As of August 31, 2015, we had approximately 442,000 gross and 342,000 net acres under lease, substantially all of which are located in the greater D-J Basin. We further delineate our acreage into specific areas, including the areas we refer to as the “core" Wattenberg Field (approximately 50,000 gross and 37,000 net acres) and the “North East Extension Area” of the Wattenberg Field (approximately 109,000 gross and 52,000 net acres). In addition, we hold approximately 186,000 gross (182,000 net) acres in southwest Nebraska, a conventional oil-prone prospect, and approximately 90,000 gross (64,000 net) acres in far eastern Colorado.
Within our leasehold in the North East Extension Area we have drilled and as of the 2015 fiscal year end were in the process of completing our first horizontal well targeting the Greenhorn formation. Within our southwestern Nebraska leasehold, we have entered into a joint exploration agreement with a private operating company based in Denver to drill up to ten wells in a defined Area of Mutual Interest. Our eastern Colorado mineral assets are located in Yuma and Washington Counties, in an area that has a history of dry gas production from the Niobrara formation.
We currently operate over 82% of our proved producing reserves and over 98% of our fiscal 2015 drilling and completion expenditures were focused on the Wattenberg Field. A high degree of operational and capital control gives us both operational focus and development flexibility to maximize returns on our leasehold position.
During fiscal 2015, in addition to increasing our proved reserves via drilling activities and increasing our leasehold via organic leasing, we increased our estimated reserves and mineral leasehold acres through the acquisition of additional oil and gas properties and assets, as described in “2015 Acquisition” above.
Business Strategy
Our primary objective is to enhance shareholder value by increasing our net asset value, net reserves and cash flow through development, exploitation, exploration, and acquisitions of oil and gas properties. We intend to follow a balanced risk strategy by allocating capital expenditures to a combination of lower risk development and exploitation activities and higher potential exploration prospects. Key elements of our business strategy include the following:
• | Concentrate on our existing core area in and around the D-J Basin, where we have significant operating experience. All of our current wells are located within the D-J Basin and our undeveloped acreage is located either in or adjacent to the D-J Basin. Focusing our operations in this area leverages our management, technical and operational experience in the basin. |
• | Develop and exploit existing oil and natural gas properties. Since inception our principal growth strategy has been to develop and exploit our acquired and leased properties to add proved reserves. In the Wattenberg Field, we target three benches of the Niobrara formation as well as the Codell formation for horizontal drilling and production. Our plans focus on horizontal development as we believe horizontal drilling is the most efficient way to recover the potential hydrocarbons. We consider the Wattenberg Field to be relatively low-risk because information gained from the large number of existing wells can be applied to potential future wells. There is enough similarity between wells in the Wattenberg Field that the exploitation process is generally repeatable. |
• | Improve hydrocarbon recovery through increased well density. We utilize the best available industry practices in our effort to determine the optimal recovery area for each well. When we began our operated horizontal well development program in the Wattenberg Field, we assumed spacing of 16 wells per 640 acre section. With increased experience and industry knowledge, we are now testing up to 24 horizontal wells per section. |
• | Complete selective acquisitions. We seek to acquire developed and undeveloped oil and gas properties, primarily in the D-J Basin and certain adjacent areas. We generally seek acquisitions that will provide us with opportunities for reserve additions and increased cash flow through production enhancement and additional development and exploratory prospect generation. |
• | Retain control over the operation of a substantial portion of our production. As operator of a majority of our wells and undeveloped acreage, we control the timing and selection of new wells to be drilled or existing wells to be re-completed. This allows us to modify our capital spending as our financial resources and underlying lease terms allow and market conditions permit. |
7
• | Maintain financial flexibility while focusing on operational cost control. We strive to be a cost-efficient operator in the D-J Basin. Our relatively low utilization of debt enhances our financial flexibility and our high degree of operational control, as well as our focus on operating efficiencies and short return on investment cycle times, is central to our operating strategy. Additionally, we seek to maintain low lease operating, drilling and completion costs. We intend to finance our operations through a mixture of cash from operations, debt and equity capital as market conditions allow. |
• | Use the latest technology to maximize returns. Beginning in fiscal 2013, we shifted our emphasis away from drilling vertical wells towards drilling horizontal wells. In doing so, we have significantly increased our production and the value of our asset base. While horizontal drilling requires higher up-front costs, these wells have generated relatively higher returns on our capital deployed. Increasing the number of wells drilled within a given drilling section and applying technical advances in drilling and completion designs is leading to enhanced productivity. Production results from various well designs are analyzed and the conclusions from each analysis are factored into future well designs that take into account spacing between hydraulic fracturing stages, potential communication between wellbores, lateral length, timing and economics. Similarly, we evaluate the use of different completion fluids. |
Competitive Strengths
We believe that we are positioned to successfully execute our business strategy because of the following competitive strengths:
• | Core acreage position in the Wattenberg Field. Wells in our core properties in the Wattenberg Field generally exhibit high liquids content, and those properties are generally prospective for Niobrara A, B, and C bench and Codell development. We believe these factors will lead to attractive EURs per well, per unit capital and operating costs and rates of return. Increased well density within the Codell and Niobrara formations as well as our acquisition efforts and organic leasing efforts within the core Wattenberg Field have added to our multi-year drilling inventory. We also believe our core acreage could be prospective for Greenhorn, Sussex, and J-Sand development. |
• | Financial flexibility. Our capital structure and high degree of operational control continues to provide us with significant financial flexibility. We have historically utilized very little debt in our capital structure. In addition to being a potential future source of liquidity, our low debt level has enabled us to make capital decisions with limited restrictions imposed by debt covenants, lender oversight and/or mandatory repayment schedules. Additionally, as the operator of 66% of our anticipated future net drilling locations, we control the timing and selection of drilling locations as well as completion schedules. This allows us to modify our capital spending program depending on financial resources, leasehold requirements and market conditions. |
• | Management experience. Our key management team possesses an average of over thirty years of experience in oil and gas exploration and production in multiple resource plays, including the Wattenberg Field. |
• | Balanced oil and natural gas reserves and production. At August 31, 2015, approximately 49% of our estimated proved reserves were oil and condensate and 51% were natural gas and natural gas liquids, measured on a Btu equivalent basis. We believe this balanced commodity mix will provide diversification of sources of cash flow. |
• | Cost-efficient operator. We have continued to demonstrate our ability to drill wells in a cost efficient way and to successfully integrate acquired assets without incurring significant increases in overhead. |
• | High success rate. We have concentrated our drilling in areas that we perceive as relatively low risk and, as a result, have had a very high success rate in our drilling program throughout the Wattenberg Field. |
8
Drilling Operations
During the periods presented below, we drilled or participated in the drilling of a number of wells that reached productive status in each respective fiscal year. During fiscal 2015, we drilled 67 horizontal wells that are classified as exploratory. Although the wells were drilled in an area that contained productive vertical wells, the area had not been proved on a horizontal basis. Therefore, the new wells met the definition of exploratory wells.
Years Ended August 31, | |||||||||||||||||
2015 | 2014 | 2013 | |||||||||||||||
Gross | Net | Gross | Net | Gross | Net | ||||||||||||
Development Wells: | |||||||||||||||||
Productive: | |||||||||||||||||
Oil | 8 | 1 | 47 | 22 | 48 | 32 | |||||||||||
Gas | 1 | — | 2 | 1 | — | — | |||||||||||
Nonproductive | — | — | — | — | — | — | |||||||||||
Exploratory Wells: | |||||||||||||||||
Productive: | |||||||||||||||||
Oil | 67 | 40 | 11 | 10 | — | — | |||||||||||
Gas | — | — | — | — | — | — | |||||||||||
Nonproductive | — | — | 1 | — | — | — | |||||||||||
As of August 31, 2015, there were 28 gross (17 net) wells in progress that were not included in the above well counts. All of the oil wells are located in, or adjacent to, the Wattenberg Field of the D-J Basin. Three gas wells are located in Yuma County, Colorado.
Production Data
The following table shows our net production of oil and gas, average sales prices and average production costs for the periods presented:
Years Ended August 31, | |||||||||||
2015 | 2014 | 2013 | |||||||||
Production: | |||||||||||
Oil (MBbls) | 1,970 | 941 | 421 | ||||||||
Gas (MMcf) | 7,344 | 3,747 | 2,108 | ||||||||
MBOE | 3,194 | 1,566 | 773 | ||||||||
Average sales price: | |||||||||||
Oil ($/Bbl) | $ | 50.75 | $ | 89.98 | $ | 85.95 | |||||
Gas ($/Mcf) | $ | 3.39 | $ | 5.21 | $ | 4.75 | |||||
BOE | $ | 39.09 | $ | 66.56 | $ | 59.83 | |||||
Average production cost per BOE | $ | 4.70 | $ | 5.10 | $ | 4.42 | |||||
Major Customers
Historically, we sold our crude oil production to local refineries and, to a lesser degree, third-party marketers. During fiscal 2015, we secured contracts with additional oil purchasers who intend to transport oil via pipelines. Under the contracts, we
9
have delivery commitments covering a portion of our anticipated future production over the next five years. Our natural gas and natural gas liquids are sold under contracts with two midstream gas gathering and processing companies. We believe both gas processing and crude oil takeaway capacity are sufficient to meet our anticipated production growth. See further discussion in Note 14 to our consolidated financial statements.
Oil and Gas Properties, Wells, Operations and Acreage
We evaluate undeveloped oil and gas prospects and participate in drilling activities on those prospects that our management believes are favorable for the production of oil or gas. If, through our review, a geographical area indicates geological and economic potential, we will attempt to acquire leases or other interests in the area. We may then attempt to sell portions of our leasehold interests in a prospect to third parties, thus sharing the risks and rewards of the exploration and development of the prospect with the other owners. One or more wells may be drilled on a prospect, and if the results indicate the presence of sufficient oil and gas reserves, additional wells may be drilled on the prospect.
We may also:
• | acquire a working interest in one or more prospects from others and participate with the other working interest owners in drilling, and if warranted, completing oil or gas wells on a prospect, or |
• | purchase producing oil or gas properties. |
We believe the title to our oil and gas properties is good and defensible in accordance with standards generally accepted in the oil and gas industry, subject to such exceptions which, in our opinion, are not so material as to detract substantially from the use or value of such properties. Our properties are typically subject, in one degree or another, to one or more of the following:
• | royalties and other burdens and obligations, expressed or implied, under oil and gas leases; |
• | overriding royalties and other burdens created by us or our predecessors in title; |
• | a variety of contractual obligations (including, in some cases, development obligations) arising under operating agreements, farm-out agreements, production sales contracts and other agreements that may affect the properties or title thereto; |
• | back-ins and reversionary interests existing under purchase agreements and leasehold assignments; |
• | liens that arise in the normal course of operations, such as those for unpaid taxes, statutory liens securing obligations to unpaid suppliers and contractors and contractual liens under operating agreements; |
• | pooling, unitization and communitization agreements, declarations and orders; and |
• | easements, restrictions, rights-of-way and other matters that commonly affect property. |
To the extent that such burdens and obligations affect our rights to production revenues, they have been taken into account in calculating our net revenue interests and in estimating the size and value of our reserves. We believe that the burdens and obligations affecting our properties are customary in the industry for properties of the kind that we own.
10
The following table shows, as of October 10, 2015, by state, our producing wells, developed acreage, and undeveloped acreage, excluding service (injection and disposal) wells:
Productive Wells | Developed Acreage | Undeveloped Acreage 1 | |||||||||||||||
State | Gross | Net | Gross | Net | Gross | Net | |||||||||||
Colorado | 582 | 407 | 24,555 | 19,400 | 232,411 | 139,400 | |||||||||||
Nebraska | — | — | — | — | 191,520 | 187,677 | |||||||||||
Wyoming | — | — | — | — | 1,143 | 472 | |||||||||||
Kansas | — | — | — | — | 840 | 840 | |||||||||||
Total | 582 | 407 | 24,555 | 19,400 | 425,914 | 328,389 | |||||||||||
1 Undeveloped acreage includes leasehold interests on which wells have not been drilled or completed to the point that would permit the production of commercial quantities of oil and natural gas regardless of whether the leasehold interest is classified as containing proved undeveloped reserves.
The following table shows, as of October 10, 2015, the status of our gross acreage:
State | Held by Production | Not Held by Production | |||
Colorado | 24,555 | 232,411 | |||
Nebraska | — | 191,520 | |||
Wyoming | — | 1,143 | |||
Kansas | — | 840 | |||
Total | 24,555 | 425,914 | |||
Leases that are held by production generally remain in force so long as oil or gas is produced from the well on the particular lease. Leased acres which are not held by production may require annual rental payments to maintain the lease until the expiration of the lease or the time oil or gas is produced from one or more wells drilled on the leased acreage. At the time oil or gas is produced from wells drilled on the leased acreage, the lease is considered to be held by production.
The following table shows the calendar years during which our leases not currently held by production will expire unless a productive oil or gas well is drilled on the lease.
Leased Acres (Gross) | Expiration of Lease | |
76,537 | 2016 | |
31,361 | 2017 | |
51,110 | 2018 | |
266,906 | After 2018 | |
The overriding royalty interests that we own are not material to our business.
Oil and Gas Reserves
As a result of our drilling, acquisition and participation activities, we increased our estimated proved reserve quantities by 76% from August 31, 2014 to August 31, 2015. Our August 31, 2015, reserve report indicated that we had estimated proved reserves of 27.7 million barrels of oil and 174.0 billion cubic feet of gas. The estimated PV-10 value of our reserves at that date was $438.3 million. PV-10 is a non-GAAP measure that reflects the present value, discounted at 10%, of estimated future net revenues from our proved reserves. We present a reconciliation of PV-10 value to the standardized measure of discounted future net cash flows in Item 7 "Non-GAAP Financial Measures."
Ryder Scott Company, L.P. (“Ryder Scott”) prepared the estimates of our proved reserves, future production and income
11
attributable to our leasehold interests as of August 31, 2015. Ryder Scott is an independent petroleum engineering firm that has been providing petroleum consulting services worldwide for over seventy years. The estimates of proved reserves, future production and income attributable to certain leasehold and royalty interests are based on technical analyses conducted by teams of geoscientists and engineers employed at Ryder Scott. The office of Ryder Scott that prepared our reserves estimates is registered in the State of Texas (License #F-1580). Ryder Scott prepared our reserve estimate based upon a review of property interests being appraised, historical production, lease operating expenses, price differentials, authorizations for expenditure, and geological and geophysical data.
The report of Ryder Scott dated October 2, 2015, which contains further discussions of the reserve estimates and evaluations prepared by Ryder Scott, as well as the qualifications of Ryder Scott’s technical personnel responsible for overseeing such estimates and evaluations, is attached as Exhibit 99 to this Annual Report on Form 10-K.
Ed Holloway, our co-Chief Executive Officer, in collaboration with our lead engineer, oversaw the preparation of the reserve estimates by Ryder Scott to ensure accuracy and completeness of the data prior to and after submission. Mr. Holloway has over thirty years of experience in oil and gas exploration and development.
Our proved reserves include only those amounts which we reasonably expect to recover in the future from known oil and gas reservoirs under existing economic and operating conditions, at current prices and costs, under existing regulatory practices and with existing technology. Accordingly, any changes in prices, operating and development costs, regulations, technology or other factors could significantly increase or decrease estimates of proved reserves.
Estimates of volumes of proved reserves at year end are presented in Bbls for oil and Mcf for natural gas at the official temperature and pressure bases of the areas in which the gas reserves are located.
The proved reserves attributable to producing wells and/or reservoirs were estimated by performance methods. These performance methods include decline curve analysis, which utilized extrapolations of historical production and pressure data available through August 31, 2015 in those cases where this data was considered to be definitive. The data used in this analysis was obtained from public sources and was considered sufficient for calculating producing reserves. The proved non-producing and undeveloped reserves were estimated by the analogy method. The analogy method uses pertinent well data obtained from public sources that was available through August 31, 2015.
Below are estimates of our net proved reserves at August 31, 2015, all of which are located in Colorado:
Oil (MBbls) | Gas (MMcf) | MBOE | ||||||
Proved: | ||||||||
Developed | 7,393 | 46,026 | 15,064 | |||||
Undeveloped | 20,299 | 127,932 | 41,621 | |||||
Total | 27,692 | 173,958 | 56,685 | |||||
The following tabulations present the PV-10 value of our estimated reserves as of August 31, 2015, 2014, and 2013 (in thousands):
Proved - August 31, 2015 | |||||||||||||||
Developed | Total | ||||||||||||||
Producing | Nonproducing | Undeveloped | Proved | ||||||||||||
Future cash inflow | $ | 554,366 | $ | — | $ | 1,492,249 | $ | 2,046,615 | |||||||
Future production costs | (211,911 | ) | — | (441,098 | ) | (653,009 | ) | ||||||||
Future development costs | (29,486 | ) | — | (481,234 | ) | (510,720 | ) | ||||||||
Future pre-tax net cash flows | $ | 312,969 | $ | — | $ | 569,917 | $ | 882,886 | |||||||
PV-10 (Non-U.S. GAAP) | $ | 227,063 | $ | — | $ | 211,218 | $ | 438,281 | |||||||
12
Proved - August 31, 2014 | |||||||||||||||
Developed | Total | ||||||||||||||
Producing | Nonproducing | Undeveloped | Proved | ||||||||||||
Future cash inflow | $ | 511,252 | $ | 234,452 | $ | 1,094,283 | $ | 1,839,987 | |||||||
Future production costs | (127,900 | ) | (48,990 | ) | (218,129 | ) | (395,019 | ) | |||||||
Future development costs | (13,245 | ) | (29,403 | ) | (369,869 | ) | (412,517 | ) | |||||||
Future pre-tax net cash flows | $ | 370,107 | $ | 156,059 | $ | 506,285 | $ | 1,032,451 | |||||||
PV-10 (Non-U.S. GAAP) | 250,749 | 76,593 | 206,356 | $ | 533,698 | ||||||||||
Proved - August 31, 2013 | |||||||||||||||
Developed | Total | ||||||||||||||
Producing | Nonproducing | Undeveloped | Proved | ||||||||||||
Future cash inflow | $ | 206,065 | $ | 286,207 | $ | 256,758 | $ | 749,030 | |||||||
Future production costs | (46,410 | ) | (52,605 | ) | (47,337 | ) | (146,352 | ) | |||||||
Future development costs | — | (26,086 | ) | (82,204 | ) | (108,290 | ) | ||||||||
Future pre-tax net cash flows | $ | 159,655 | $ | 207,516 | $ | 127,217 | $ | 494,388 | |||||||
PV-10 (Non-U.S. GAAP) | $ | 92,888 | $ | 104,392 | $ | 38,836 | $ | 236,116 | |||||||
The combined effect of our drilling, acquisition, and participation activities, partially offset by declining future commodity prices, during the year ended August 31, 2015 generated an increase in projected future cash inflow from proved reserves of $206.6 million compared to the year ended August 31, 2014. However, future pre-tax net cash flow decreased $149.6 million from August 31, 2015 to August 31, 2014 as per-unit costs did not decline commensurate with per-unit future cash inflow. During that same period, our PV-10 from proved reserves decreased by $95.4 million. During the year ended August 31, 2015, we incurred capital expenditures of approximately $203.2 million related to the acquisition and development of proved reserves. The prices for the 2015 oil and gas reserves are based on the twelve-month arithmetic average for the first of month prices from September 1, 2014 through August 31, 2015. The 2015 crude oil price of $53.27 per barrel (West Texas Intermediate Cushing) was $36.21 lower than the 2014 crude oil price of $89.48 per barrel. The 2015 natural gas price of $3.28 per Mcf (Henry Hub) was $1.75 lower than the 2014 price of $5.03 per Mcf.
Our drilling, acquisition, and participation activities during the year ended August 31, 2014, generated increases in projected future cash inflow from proved reserves of $1.1 billion and future pre-tax net cash flow of $538.1 million from August 31, 2013. During that same period, our PV-10 from proved reserves increased by $297.6 million. During the year ended August 31, 2014, we incurred capital expenditures of approximately $185.1 million related to the acquisition and development of proved reserves.
Our drilling, acquisition, and participation activities during the year ended August 31, 2013, generated increases in projected future cash inflow from proved reserves of $211.6 million and future pre-tax net cash flow of $143.4 million from August 31, 2012. During that same period, our PV-10 from proved reserves increased by $87.2 million. During the year ended August 31, 2013, we incurred capital expenditures of approximately $104.3 million related to the acquisition and development of proved reserves.
In general, the volume of production from our oil and gas properties declines as reserves are depleted. Unless we acquire additional properties containing proved reserves or conduct successful exploration and development activities, or both, our proved reserves will decline as reserves are produced. Accordingly, volumes generated from our future activities are highly dependent upon our success in acquiring or finding additional reserves and the costs incurred in doing so.
13
Proved Undeveloped Reserves | ||
Net Reserves (MBOE) | ||
Beginning September 1, 2013 | 4,859 | |
Converted to proved developed | (587 | ) |
Extensions | 13,436 | |
Acquisitions | 1,522 | |
Revisions | (19 | ) |
Ending August 31, 2014 | 19,211 | |
Converted to proved developed | (414 | ) |
Extensions | 17,633 | |
Acquisitions | 3,780 | |
Divestitures | (1,278 | ) |
Revisions | 2,689 | |
Ending August 31, 2015 | 41,621 | |
At August 31, 2015, our proved undeveloped reserves were 41,621 MBOE. In an effort to delineate more of our acreage, much of our 2015 capital program was dedicated to drilling exploratory wells rather than developing our proved undeveloped well locations. As a result, we drilled 40 net exploratory wells and one net development well during 2015. This generated proved developed reserves from those exploratory wells, as well as new proved undeveloped reserves due to direct offset locations. In addition, our reserve estimates reflect the positive impact of additional offset operator activities within the Wattenberg Field. As a result, we recognized an increase in proved undeveloped reserves from extensions of 17,633 MBOE. The one net development well converted 414 MBOE, or 2%, of our proved undeveloped reserves into proved developed reserves.
Our operational focus since 2013 has been to delineate our leasehold rather than continue to develop our proven areas. This has resulted in increases to our proved undeveloped reserves as we delineate new exploratory areas, but slower conversion of existing proved undeveloped reserves to producing status. Furthermore, the result of this exploratory drilling, in conjunction with our efforts to determine the proper density of wellbores, has resulted in undeveloped lands moving directly to the proven developed category. In fiscal year 2015, this effect has increased with the downturn in commodity prices as we have scaled back our drilling and completion operations in the reduced price environment. Based on our current drilling plans for the next five years, we expect to allocate more funds to developmental drilling in areas of established production where ongoing and planned infrastructure buildout continues. In addition to the undeveloped locations added as a result of recent drilling, we eliminated all undeveloped locations related to all vertical wellbores as well as all recompletion activities related to existing vertical wellbores. This reduced proved undeveloped reserves by 4.1 MBOE and is included in revisions. None of the proved undeveloped reserves have been in this category for more than five years and all are scheduled to be drilled within five years of their initial booking.
In addition, our proved undeveloped reserves on undrilled locations were revised upwards by 2,689 MBOE during fiscal 2015 as a result of improved well performance as compared to original estimates. This improved performance was attributable to advances in drilling and completion designs, better takeaway capacity and longer well history, allowing for more accurate projections.
At August 31, 2014, our proved undeveloped reserves were 19,211 MBOE. During fiscal 2014, 587 MBOE or 12% of our proved undeveloped reserves were converted into proved developed reserves, requiring $14.9 million of drilling and completion capital expenditures. Executing our 2014 capital program resulted in the addition of 13,436 MBOE in proved undeveloped reserves.
Delivery Commitments
See "Volume Commitments" in Note 14 to our consolidated financial statements, included elsewhere in this report.
Government Regulation
Our operations are subject to various federal, state and local laws and regulations that change from time to time. Many of these regulations are intended to prevent pollution and protect environmental quality, including regulations related to permit requirements for the drilling of wells, bonding requirements to drill or operate wells, the location of wells, the method of drilling, completing and casing wells, the surface use and restoration of properties upon which wells are drilled, the sourcing and disposal
14
of water used in the drilling and completion process, groundwater testing, air emissions, noise, lighting and traffic abatement, and the plugging and abandonment of wells. Other regulations are intended to prevent the waste of oil and gas and to protect the rights among owners in a common reservoir. These include regulation of the size of drilling and spacing units or proration units, the number, or density, of wells which may be drilled in an area, the unitization or pooling of oil and natural gas wells, and regulations that generally prohibit the venting or flaring of natural gas and that impose certain requirements regarding the ratability or fair apportionment of production from fields and individual wells. In addition, our operations are subject to regulations governing the pipeline gathering and transportation of oil and natural gas, as well as various federal, state and local tax laws and regulations.
Failure to comply with applicable laws and regulations can result in substantial penalties. Our competitors in the oil and natural gas industry are generally subject to the same regulatory requirements and restrictions that affect our operations. The regulatory burden on the industry increases the cost of doing business and affects profitability. Although we believe we are in substantial compliance with all applicable laws and regulations, such laws and regulations are frequently amended or reinterpreted. Therefore, we are unable to predict the future costs or impact of compliance.
Regulation of production
Federal, state, and local agencies have promulgated extensive rules and regulations applicable to our oil and natural gas exploration, production and related operations. Most states require drilling permits, drilling and operating bonds and the filing of various reports and impose other requirements relating to the exploration and production of oil and natural gas. Many states also have statutes or regulations addressing conservation matters including provisions governing the size of drilling and spacing units or proration units, the density of wells, and the unitization or pooling of oil and natural gas properties. Some states like Colorado allow the forced pooling or integration of tracts to facilitate exploration while other states rely primarily or exclusively on the voluntary pooling of lands and leases. In areas with voluntary pooling, it may be more difficult to develop a project if the operator owns less than 100% of the leasehold. The statutes and regulations of some states limit the rate at which oil and gas is produced from properties, prohibit the venting or flaring of natural gas, and impose certain requirements regarding the ratability of production. This may limit the amount of oil and gas we can produce from our wells and may limit the number of wells or locations at which we can drill. The federal and state regulatory burden on the oil and natural gas industry increases our cost of doing business and affects our profitability. Because these rules and regulations are amended or reinterpreted frequently, we are unable to predict the future cost or impact of complying with these laws.
The Colorado Oil and Gas Conservation Commission (“COGCC”) is the primary regulator of exploration and production of oil and gas resources in the principal area in which we operate. The COGCC regulates oil and gas operators through rules, policies, written guidance, orders, permits, and inspections. Among other criteria, the COGCC enforces specifications regarding drilling, development, production, abandonment, enhanced recovery, safety, aesthetics, noise, waste, flowlines, and wildlife. In recent years, the COGCC has amended its existing regulatory requirements and adopted new requirements with increased frequency. For example, in August 2013, the COGCC implemented new setback rules for oil and natural gas wells and production facilities near occupied buildings. The COGCC increased its setback distance to a uniform 500 feet statewide setback from occupied buildings and imposed new notice, meeting, and mitigation requirements for nearby homes and communities. In January 2013, the COGCC approved new rules that require operators to sample groundwater for hydrocarbons and other indicator compounds both before and after drilling. In December 2013, the COGCC issued new and more restrictive rules regarding spill reporting and remediation. In December 2014, the COGCC issued amendments clarifying and modifying a number of existing rules, including those governing drilling, plugging, mechanical integrity testing, blow out prevention, and waste management. In January 2015, the COGCC amended its enforcement and penalty rules to increase the maximum penalty for regulatory violations. In March 2015, the COGCC adopted new requirements for operations within floodplains. In June 2015, the COGCC announced that it would begin a new rulemaking to implement two recommendations by a task force appointed by Colorado Governor John Hickenlooper. This new rulemaking will address both local government collaboration with oil and gas operators concerning locations for large scale oil and gas facilities in urban mitigation areas and the sharing by operators with municipalities of information regarding current and planned drilling operations. The COGCC has also announced that it expects to amend its noise control regulations during the first quarter of 2016.
Regulation of sales and transportation of natural gas
Historically, the transportation and sales for resale of natural gas in interstate commerce have been regulated pursuant to the Natural Gas Act of 1938 (“NGA”), the Natural Gas Policy Act of 1978 and the Federal Energy Regulatory Commission (“FERC”) regulations. Effective January 1, 1993, the Natural Gas Wellhead Decontrol Act deregulated the price for all “first sales” of natural gas. Thus, all of our sales of gas may be made at market prices, subject to applicable contract provisions. Sales of natural gas are affected by the availability, terms and cost of pipeline transportation. Since 1985, the FERC has implemented regulations intended to make natural gas transportation more accessible to gas buyers and sellers on an open-access, non-discriminatory basis. We cannot predict what further action the FERC will take on these matters. Some of the FERC's more recent proposals may,
15
however, adversely affect the availability and reliability of interruptible transportation service on interstate pipelines. We do not believe that we will be affected by any action taken materially differently than other natural gas producers, gatherers and marketers with which we compete.
Our natural gas sales are generally made at the prevailing market price at the time of sale. Therefore, even though we sell significant volumes to major purchasers, we believe that other purchasers would be willing to buy our natural gas at comparable market prices.
On August 8, 2005, the Energy Policy Act of 2005 (the “2005 EPA”) was signed into law. This comprehensive act contains many provisions that will encourage oil and gas exploration and development in the U.S. The 2005 EPA directs the FERC, Bureau of Ocean Energy Management (“BOEM”) and other federal agencies to issue regulations that will further the goals set out in the 2005 EPA. The 2005 EPA amends the NGA to make it unlawful for “any entity,” including otherwise non-jurisdictional producers such as us, to use any deceptive or manipulative device or contrivance in connection with the purchase or sale of natural gas or the purchase or sale of transportation services subject to regulation by the FERC, in contravention of rules prescribed by the FERC. On January 20, 2006, the FERC issued rules implementing this provision. The rules make it unlawful in connection with the purchase or sale of natural gas subject to the jurisdiction of the FERC, or the purchase or sale of transportation services subject to the jurisdiction of the FERC, for any entity, directly or indirectly, to use or employ any device, scheme or artifice to defraud; to make any untrue statement of material fact or omit to make any such statement necessary to make the statements made not misleading; or to engage in any act or practice that operates as a fraud or deceit upon any person. The new anti-manipulation rule does not apply to activities that relate only to intrastate or other non-jurisdictional sales or gathering, but does apply to activities of otherwise non-jurisdictional entities to the extent the activities are conducted “in connection with” gas sales, purchases or transportation subject to FERC jurisdiction. It therefore reflects a significant expansion of the FERC's enforcement authority. To date, we do not believe we have been, nor do we anticipate we will be, affected any differently than other producers of natural gas.
In 2007, the FERC issued a final rule on annual natural gas transaction reporting requirements, as amended by subsequent orders on rehearing (“Order 704”). Under Order 704, wholesale buyers and sellers of more than 2.2 million MMBtu of physical natural gas in the previous calendar year, including interstate and intrastate natural gas pipelines, natural gas gatherers, natural gas processors and natural gas marketers, are now required to report, on May 1 of each year, aggregate volumes of natural gas purchased or sold at wholesale in the prior calendar year to the extent such transactions utilize, contribute to, or may contribute to the formation of price indices. It is the responsibility of the reporting entity to determine which individual transactions should be reported based on the guidance of Order 704. The monitoring and reporting required by these rules have increased our administrative costs. To date, we do not believe we have been, nor do we anticipate that we will be, affected any differently than other producers of natural gas.
Regulation of sales and transportation of oil
Our sales of crude oil are affected by the availability, terms and cost of transportation. Interstate transportation of oil by pipeline is regulated by the FERC pursuant to the Interstate Commerce Act (“ICA”), the Energy Policy Act of 1992 and the rules and regulations promulgated under those laws. The ICA and its implementing regulations require that tariff rates for interstate service on oil pipelines, including interstate pipelines that transport crude oil and refined products (collectively referred to as “petroleum pipelines”) be just and reasonable and non-discriminatory and that such rates and terms and conditions of service be filed with the FERC.
Intrastate oil pipeline transportation rates are subject to regulation by state regulatory commissions. The basis for intrastate oil pipeline regulation, and the degree of regulatory oversight and scrutiny given to intrastate oil pipeline rates, varies from state to state. Insofar as effective interstate and intrastate rates are equally applicable to all comparable shippers, we do not believe that the regulation of oil transportation rates will affect our operations in any way that is materially different than those of our competitors who are similarly situated.
Regulation of derivatives and reporting of government payments
The Dodd-Frank Wall Street Reform and Consumer Protection Act (the “Dodd-Frank Act”) was passed by Congress and signed into law in July 2010. The Dodd-Frank Act is designed to provide, among other things, a comprehensive framework for the regulation of the over-the-counter derivatives market with the intent to provide greater transparency and reduction of risk between counterparties. The Dodd-Frank Act subjects swap dealers and major swap participants to capital and margin requirements and requires many derivative transactions to be cleared on exchanges. The Dodd-Frank Act provides for a potential exemption from certain of these requirements for commercial end-users. In addition, in August 2012, the SEC issued a final rule under Section 1504 of the Dodd-Frank Act, Disclosure of Payment by Resource Extraction Issuers, which would have required resource extraction
16
issuers, such as us, to file annual reports that provide information about the type and total amount of payments made for each project related to the commercial development of oil, natural gas, or minerals to each foreign government and the federal government. In July 2013, the U.S. District Court for the District of Columbia vacated the rule, and the SEC has announced it will not appeal the court's decision. However, the SEC may propose revised resource extraction payments disclosure rules applicable to our business.
Environmental Regulations
As with the oil and natural gas industry in general, our properties are subject to extensive and changing federal, state and local laws and regulations designed to protect and preserve natural resources and the environment. The recent trend in environmental legislation and regulation is generally toward stricter standards, and this trend is likely to continue. These laws and regulations often require a permit or other authorization before construction or drilling commences and for certain other activities; limit or prohibit access, seismic acquisition, construction, drilling and other activities on certain lands lying within wilderness and other protected areas; mandate requirements and standards for operations; impose substantial liabilities and remedial obligations for pollution; and require the reclamation of certain lands.
The permits required for many of our operations are subject to revocation, modification and renewal by issuing authorities. Governmental authorities have the power to enforce compliance with their regulations, and violations are subject to fines, injunctions or both. In March 2015, the COGCC implemented regulatory and statutory amendments that significantly increase the potential penalties for violating the Colorado Oil and Gas Conservation Act or its implementing regulations, orders, or permits. These amendments increase the maximum penalty per violation per day from $1,000 to $15,000; eliminate the $10,000 maximum penalty for violations without significant consequences; require the COGCC to assess a penalty for each day of violation; and authorize the COGCC to prohibit the issuance of new permits and suspend certificates of clearance for egregious violations. In the opinion of our management, we are in substantial compliance with current applicable environmental laws and regulations, and we have no material commitments for capital expenditures to comply with existing environmental requirements. Nevertheless, changes in existing environmental laws and regulations or in their interpretation could have a significant impact on us, as well as the oil and natural gas industry in general.
The Comprehensive Environmental Response, Compensation and Liability Act (“CERCLA”) and comparable state statutes impose strict and joint and several liabilities on owners and operators of certain sites and on persons who disposed of or arranged for the disposal of “hazardous substances” found at such sites. Persons responsible for the release or threatened release of hazardous substances under CERCLA may be subject to liability for the costs of cleaning up those substances and for damages to natural resources. It is not uncommon for the neighboring landowners and other third parties to file claims for personal injury and property damage allegedly caused by the hazardous substances released into the environment. The Resource Conservation and Recovery Act (“RCRA”) and comparable state statutes govern the disposal of “solid waste” and “hazardous waste” and authorize the imposition of substantial fines and penalties for noncompliance. Although CERCLA currently excludes petroleum from its definition of “hazardous substance,” state laws affecting our operations impose clean-up liability relating to petroleum and petroleum related products. In addition, although RCRA classifies certain oil field wastes as “non-hazardous,” such exploration and production wastes could be reclassified as hazardous wastes, thereby making such wastes subject to more stringent handling and disposal requirements.
Certain of our operations are subject to the federal Clean Air Act (“CAA”) and similar state and local requirements. The CAA may require certain pollution control requirements with respect to air emissions from our operations. The Environmental Protection Agency (“EPA”) and states continue to develop regulations to implement these requirements. We may be required to incur certain capital expenditures in the next several years for air pollution control equipment in connection with maintaining or obtaining operating permits and approvals addressing other air emission-related issues. Greenhouse gas recordkeeping and reporting requirements under the CAA took effect in 2011 and impose increased administrative and control costs. Federal New Source Performance Standards regarding oil and gas operations (“NSPS OOOO”) took effect in 2012, with more amendments effective in 2013 and 2014, all of which have likewise added administrative and operational costs. In August 2015, the EPA proposed a package of new regulations under the CAA to reduce methane emissions from new and modified sources in the oil and gas sector. Concurrent with the proposed methane rules, the EPA also proposed a new rule for aggregating adjacent operational units into a single source for review and permitting and recommended guidelines for reducing volatile organic compound emissions from existing equipment. Colorado adopted new regulations to meet the requirements of NSPS OOOO and promulgated significant new rules in February 2014 relating specifically to crude oil and natural gas operations that are more stringent than NSPS OOOO and directly regulate methane emissions from affected facilities.
In October 2015 the EPA lowered the national ambient air quality standard (“NAAQS”) for ozone under the CAA from 75 parts per billion to 70 parts per billion. Any resulting expansion of the ozone nonattainment areas in Colorado could cause oil
17
and natural gas operations in such areas to become subject to more stringent emissions controls, emission offset requirements and increased permitting delays and costs.
The federal Clean Water Act (“CWA”) and analogous state laws impose requirements regarding the discharge of pollutants into waters of the U.S. and the state, including spills and leaks of hydrocarbons and produced water. The CWA also requires approval for the construction of facilities in wetlands and other waters of the U.S., and it imposes requirements on storm water run-off. In April 2015, the EPA proposed new CWA regulations that would prevent onshore unconventional oil and gas wells from discharging wastewater pollutants to public treatment facilities. In June 2015, the EPA and the U.S. Army Corps of Engineers adopted a new regulatory definition of “waters of the U.S.,” which governs which waters and wetlands are subject to the CWA. Depending upon how the new definition is implemented, it could significantly expand the jurisdictional reach of the CWA in many states, including Colorado.
The Endangered Species Act restricts activities that may affect endangered or threatened species or their habitats. Some of our operations may be located in areas that are or may be designated as habitats for threatened or endangered species. In such areas, we may be prohibited from conducting operations at certain locations or during certain periods, and we may be required to develop plans for avoiding potential adverse effects. In addition, certain species are subject to varying degrees of protection under state laws.
Federal laws including the CWA require certain owners or operators of facilities that store or otherwise handle oil and produced water to prepare and implement spill prevention, control, countermeasure and response plans addressing the possible discharge of oil into surface waters. The Oil Pollution Act of 1990 (“OPA”) subjects owners and operators of facilities to strict joint and several liability for all containment and cleanup costs and certain other damages arising from crude oil spills, including the government’s response costs. Spills subject to the OPA may result in varying civil and criminal penalties and liabilities.
Climate change has emerged as an important topic in public policy debate regarding our environment. It is a complex issue, with some scientific research suggesting that rising global temperatures are the result of an increase in greenhouse gases, which may ultimately pose a risk to society and the environment. In 2009, the EPA found that emissions of greenhouse gases present an endangerment to human health and the environment because such emissions are, according to the EPA, contributing to global warming and other climatic changes. Congress has considered a number of legislative proposals to restrict greenhouse gas emissions, and a number of states have begun taking actions to control or reduce such emissions. Products produced by the oil and natural gas exploration and production industry are a source of certain greenhouse gases, namely carbon dioxide and methane, and future restrictions on the combustion of fossil fuels or the venting of natural gas could have a significant impact on our future operations.
Hydraulic Fracturing
We operate primarily in the Wattenberg Field of the D-J Basin where the rock formations are typically tight and it is a common practice to utilize hydraulic fracturing to allow for or increase hydrocarbon production. Hydraulic fracturing involves the process of injecting substances such as water, sand and additives (some proprietary) under pressure into a targeted subsurface formation to create pores and fractures, thus creating a passageway for the release of oil and gas. Hydraulic fracturing is a technique we commonly employ and expect to employ extensively in future wells that we drill and complete.
We outsource all hydraulic fracturing services to service providers with significant experience, and which we deem to be competent and responsible. Our service providers supply all personnel, equipment and materials needed to perform each stimulation, including the chemical mixtures that are injected into our wells. We require our service companies to carry insurance covering incidents that could occur in connection with their activities. In addition to the drilling permit we are required to obtain and the notice of intent we provide the appropriate regulatory authorities, our service providers are responsible for obtaining any regulatory permits necessary for them to perform their services in the relevant geographic location. We have not had any incidents, citations or lawsuits relating to any environmental issues resulting from hydraulic fracture stimulation and we are not presently aware of any such matters.
In recent years, environmental opposition to hydraulic fracturing has increased, and various governmental and regulatory authorities have adopted or are considering new requirements for this process. To the extent these requirements increase our costs or restrict our development activities, our business and prospects may be adversely affected.
The EPA has asserted that the Safe Drinking Water Act (“SDWA”) applies to hydraulic fracturing involving diesel fuel and in February 2014 it issued final guidance on this subject. The guidance defines the term “diesel fuel,” describes the permitting requirements that apply under SDWA for the underground injection of diesel fuel in hydraulic fracturing, and makes recommendations for permit writers. Although the guidance applies only in those states, excluding Colorado, where the EPA
18
directly implements the Underground Injection Control Class II program, it could encourage state regulatory authorities to adopt permitting and other requirements for hydraulic fracturing. In addition, from time to time Congress has considered legislation that would provide for broader federal regulation of hydraulic fracturing under the SDWA. If such legislation were enacted, hydraulic fracturing operations could be required to meet additional federal permitting and financial assurance requirements, adhere to certain construction specifications, fulfill monitoring, reporting, and recordkeeping obligations, and provide for additional public disclosure of the chemicals used in the fracturing process.
The EPA is also conducting a nationwide study into the effects of hydraulic fracturing on drinking water. In June 2015, the EPA released a draft study report for peer review and comment. The draft report did not find evidence of widespread systemic impacts to drinking water, but did find a relatively small number of site-specific impacts. The EPA noted that these results could indicate that such effects are rare or that other limiting factors exist. A final report is expected in 2015.
Federal agencies have also adopted or are considering additional regulation of hydraulic fracturing. In September 2013, the U.S. Occupational Safety and Health Administration (“OSHA”) proposed stricter standards for worker exposure to silica, which would apply to the use of sand in hydraulic fracturing. In May 2014, the EPA issued an advance notice of proposed rulemaking under the Toxic Substances Control Act (“TSCA”) to obtain data on chemical substances and mixtures used in hydraulic fracturing. In March 2015, the Bureau of Land Management (“BLM”) issued a new rule regulating hydraulic fracturing activities involving federal and tribal lands and minerals, including requirements for chemical disclosure, wellbore integrity and handling of flowback and produced water.
In Colorado, the primary regulator is the COGCC, which has adopted regulations regarding chemical disclosure, pressure monitoring, prior agency notice, emission reduction practices, and offset well setbacks with respect to hydraulic fracturing operations and may in the future adopt additional requirements for this purpose. As part of these requirements, operators must report all chemicals used to hydraulically fracture a well to a publicly searchable registry website developed and maintained by the Ground Water Protection Council and the Interstate Oil and Gas Compact Commission.
Apart from these ongoing federal and state initiatives, local governments are adopting new requirements and restrictions on hydraulic fracturing and other oil and gas operations. Some local governments in Colorado, for instance, have amended their land use regulations to impose new requirements on oil and gas development, while other local governments have entered memoranda of agreement with oil and gas producers to accomplish the same objective. Beyond that, during the past few years a total of five Colorado cities have passed voter initiatives temporarily or permanently prohibiting hydraulic fracturing. None of these cities currently have significant oil and gas development, and the oil and gas industry and the State have challenged four of these initiatives in court. Although one case remains pending, the trial courts in the other three cases have invalidated the initiatives on the ground that state law preempts local governments from banning hydraulic fracturing. In September 2015, the Colorado Supreme Court announced that it would review two of these cases for the purpose of deciding whether local hydraulic fracturing bans are preempted.
During 2014, opponents of hydraulic fracturing also sought statewide ballot initiatives that would have restricted oil and gas development in Colorado by, among other things, significantly increasing the setback between oil and gas wells and occupied buildings. These initiatives were withdrawn from the November 2014 ballot in return for the creation of a task force to craft recommendations for minimizing land use conflicts over the location of oil and gas facilities. In February 2015, the task force submitted six recommendations to the Governor, including recommendations that the COGCC adopt new rules providing for local government involvement in the siting of certain large scale oil and gas facilities and the sharing with municipalities of information on current and planned drilling operations. Depending upon the success of these recommendations, the Colorado Supreme Court’s preemption decision, and other considerations, opponents of hydraulic fracturing could pursue state legislation or additional local or statewide ballot initiatives to restrict hydraulic fracturing or oil and gas development generally.
Competition and Marketing
We are faced with strong competition from many other companies and individuals engaged in the oil and gas business, many of which are very large, well-established energy companies with substantial capabilities and established earnings records. We may be at a competitive disadvantage in acquiring oil and gas prospects since we must compete with these individuals and companies, many of which have greater financial resources and larger technical staffs. It is nearly impossible to estimate the number of competitors; however, it is known that there are a large number of companies and individuals in the oil and gas business.
Exploration for and production of oil and gas are affected by the availability of pipe, casing and other tubular goods and certain other oil field equipment including drilling rigs and tools. We depend upon independent drilling contractors to furnish rigs, equipment and tools to drill our wells. Higher prices for oil and gas may result in competition among operators for drilling
19
equipment, tubular goods and drilling crews, which may affect our ability expeditiously to drill, complete, recomplete and work-over wells.
The market for oil and gas is dependent upon a number of factors beyond our control, which at times cannot be accurately predicted. These factors include the proximity of wells to, and the capacity of, natural gas pipelines, the extent of competitive domestic production and imports of oil and gas, the availability of other sources of energy, fluctuations in seasonal supply and demand, and governmental regulation. In addition, there is always the possibility that new legislation may be enacted, which would impose price controls or additional excise taxes upon crude oil or natural gas, or both. Oversupplies of natural gas can be expected to recur from time to time and may result in the gas producing wells being shut-in. Imports of natural gas may adversely affect the market for domestic natural gas.
The market price for crude oil is significantly affected by policies adopted by the member nations of OPEC. Members of OPEC establish prices and production quotas among themselves for petroleum products from time to time with the intent of controlling the current global supply and consequently price levels. We are unable to predict the effect, if any, that OPEC or other countries will have on the amount of, or the prices received for, crude oil and natural gas.
Gas prices, which were once effectively determined by government regulations, are now largely influenced by competition. Competitors in this market include producers, gas pipelines and their affiliated marketing companies, independent marketers, and providers of alternate energy supplies, such as residual fuel oil. Changes in government regulations relating to the production, transportation and marketing of natural gas have also resulted in significant changes in the historical marketing patterns of the industry.
Generally, these changes have resulted in the abandonment by many pipelines of long-term contracts for the purchase of natural gas, the development by gas producers of their own marketing programs to take advantage of new regulations requiring pipelines to transport gas for regulated fees, and an increasing tendency to rely on short-term contracts priced at spot market prices.
General
Beginning October 15, 2015, our offices are located at 1625 Broadway Suite 300, Denver, CO 80202. Our office telephone number is (720) 616-4300 and our fax number is (720) 616-4301.
Previously, our Platteville offices, which included both our headquarters (until October 15, 2015) and which still include field offices and an equipment yard, are rented to us pursuant to a lease with HS Land & Cattle, LLC, a firm controlled by Ed Holloway and William E. Scaff, Jr., our co-Chief Executive Officers. The 2015 lease, which expired on July 1, 2015, required monthly payments of $15,000. The lease is currently on a month-to-month basis at a rental of $15,000 per month.
As of August 31, 2015, we had 36 full-time employees. Subsequent to August 31, 2015, concurrent with the relocation of our offices to Denver, CO, we have continued to add additional employees to better prepare the business for execution of our future growth strategy.
Available Information
We make available on our website, www.syrginfo.com, under “Investor Relations, SEC Filings,” free of charge, our annual reports on Form 10-K, quarterly reports on Form 10-Q, current reports on Form 8-K, and amendments to those reports as soon as reasonably practicable after we electronically file or furnish them to the U.S. Securities and Exchange Commission (“SEC”). You may also read or copy any document we file at the SEC's public reference room in Washington, D.C., located at 100 F Street, N.E., Room 1580, Washington D.C. 20549, or may obtain copies of such documents at the SEC's website at www.sec.gov. Please call the SEC at (800) SEC-0330 for further information on the public reference room.
20
ITEM 1A. | RISK FACTORS |
Investors should be aware that any purchase of our securities involves certain risks, including those described below, which could adversely affect the value of our common stock. We do not make, nor have we authorized any other person to make, any representation about the future market value of our common stock. In addition to the other information contained in this annual report, the following factors should be considered carefully in evaluating an investment in our securities.
Risks Related to Our Business, Industry and Strategy
An extended or further decline in oil and natural gas prices may adversely affect our business, financial condition or results of operations and our ability to meet our financial commitments.
The prices we will receive for our oil and natural gas will significantly affect many aspects of our business, including our revenue, profitability, access to capital, quantity and present value of proved reserves and future rate of growth. Oil and natural gas are commodities and their prices are subject to wide fluctuations in response to relatively minor changes in supply and demand. Historically, the markets for oil and natural gas have been volatile. In the last two years, oil prices have fallen from highs of over $100 per Bbl to lows of under $40 per Bbl and natural gas prices have experienced declines of comparable magnitude. Oil and natural gas prices will likely continue to be volatile in the future and will depend on numerous factors beyond our control. These factors include the following:
• | worldwide and regional economic conditions impacting the global supply and demand for oil and natural gas; |
• | the actions of OPEC; |
• | the price and quantity of imports of foreign oil and natural gas; |
• | political conditions in or hostilities in oil-producing and natural gas-producing regions and related sanctions, including current conflicts in the Middle East and conditions in Africa, South America, Russia and Ukraine; |
• | the level of global oil and domestic natural gas exploration and production; |
• | the level of global oil and domestic natural gas inventories; |
• | prevailing prices on local oil and natural gas price indexes in the areas in which we operate; |
• | localized supply and demand fundamentals and gathering, processing and transportation availability; |
• | weather conditions and natural disasters; |
• | domestic and foreign governmental regulations; |
• | authorization of exports from the United States of liquefied natural gas or oil; |
• | speculation as to the future price of oil and the speculative trading of oil and natural gas futures contracts; |
• | price and availability of competitors’ supplies of oil and natural gas; |
• | technological advances affecting energy consumption; and |
• | the price and availability of alternative fuels. |
Lower oil and natural gas prices will reduce our cash flows and our borrowing ability. Our business has historically relied on the availability of additional capital, including proceeds from the sale of equity and convertible securities, to execute our business strategy. Further, our future growth strategy requires substantial additional capital, the availability of which will depend in significant part on current and expected commodity prices. If we are unable to raise capital on acceptable terms in the future, we may be unable to pursue our current acquisition, drilling and development plans. While our current revolving credit facility provides for borrowings of up to $500 million, actual borrowings may not exceed our borrowing base in effect at any time, which is subject to re-determination on a semi-annual basis. Our borrowing base is based in substantial part on the value of our oil and natural gas reserves which are, in turn, impacted by prevailing oil and natural gas prices. Accordingly, declining oil and natural gas prices have a direct impact on the amount we can borrow under our revolving credit facility, which could affect our cash flows and ability to execute on our business plans.
In addition, lower prices have reduced and may further reduce the amount of oil and natural gas that we can produce economically and may cause the value of our estimated proved reserves at future reporting dates to decline compared to the value of our estimated proved reserves at August 31, 2015, our most recent fiscal year end.
To attempt to reduce our price risk, we periodically enter into hedging transactions with respect to a portion of our expected future production. We cannot assure you that such transactions will reduce the risk or minimize the effect of any decline in oil or natural gas prices. Hedging arrangements can expose us to risk of financial loss in some circumstances, including when production is less than expected, a counterparty to a hedging contract fails to perform under the contract or there is a change in the expected differential between the underlying price in the hedging contract and the actual prices received.
21
Any substantial or extended decline in the prices we receive for our production would have a material adverse effect on our financial condition, liquidity, ability to meet our financial obligations and our results of operations.
Operating hazards may adversely affect our ability to conduct business.
Our operations are subject to risks inherent in the oil and natural gas industry, such as:
• | unexpected drilling conditions including blowouts, cratering and explosions; |
• | uncontrollable flows of oil, natural gas or well fluids; |
• | equipment failures, fires or accidents; |
• | pollution and other environmental risks; and |
• | shortages in experienced labor or shortages or delays in the delivery of equipment. |
These risks could result in substantial losses to us from injury and loss of life, damage to and destruction of property and equipment, pollution and other environmental damage and suspension of operations. We do not maintain insurance for all of these risks, nor in amounts that cover all of the losses to which we may be subject, and the insurance we have may not continue to be available on acceptable terms. Moreover, some risks we face are not insurable. Also, we could in some circumstances have liability for actions taken by third parties over which we have no or limited control, including operators of properties in which we have an interest. The occurrence of an uninsured or underinsured loss could result in significant costs that could have a material adverse effect on our financial condition and liquidity. In addition, maintenance activities undertaken to reduce operational risks can be costly and can require exploration, exploitation and development operations to be curtailed while those activities are being completed.
Our actual production, revenues and expenditures related to our reserves are likely to differ from our estimates of proved reserves. We may experience production that is less than estimated, and drilling costs that are greater than estimated, in our reserve report. These differences may be material.
Although the estimates of our oil and natural gas reserves and future net cash flows attributable to those reserves were prepared by Ryder Scott, our independent petroleum and geological engineers, we are ultimately responsible for the disclosure of those estimates. Reserve engineering is a complex and subjective process of estimating underground accumulations of oil and natural gas that cannot be measured in an exact manner. Estimates of economically recoverable oil and natural gas reserves and of future net cash flows necessarily depend upon a number of variable factors and assumptions, including:
• | historical production from the area compared with production from similar producing wells; |
• | the assumed effects of regulations by governmental agencies; |
• | assumptions concerning future oil and natural gas prices; and |
• | assumptions concerning future operating costs, severance and excise taxes, development costs and work-over and remedial costs. |
Because all reserve estimates are to some degree subjective, each of the following items may differ from those assumed in estimating proved reserves:
• | the quantities of oil and natural gas that are ultimately recovered; |
• | the production and operating costs incurred; |
• | the amount and timing of future development expenditures; and |
• | future oil and natural gas sales prices. |
Historically, there has been a difference between our actual production and the production estimated in a prior year’s reserve report. We cannot assure you that these differences will not be material in the future.
Approximately 73% of our estimated proved reserves at August 31, 2015 are undeveloped. Recovery of undeveloped reserves requires significant capital expenditures and successful drilling operations. Our estimates of proved undeveloped reserves reflect our plans to make significant capital expenditures to convert those reserves into proved developed reserves, including approximately $481.2 million in estimated capital expenditures during the five years ending August 31, 2020. The estimated development costs may not be accurate, development may not occur as scheduled and results may not be as estimated. If we choose not to develop proved undeveloped reserves, or if we are not otherwise able to successfully develop them, we will be required to remove the associated volumes from our reported proved reserves. In addition, under the SEC’s reserve reporting rules, proved undeveloped reserves generally may be booked only if they relate to wells scheduled to be drilled within five years of the
22
date of initial booking, and we may therefore be required to downgrade to probable or possible any proved undeveloped reserves that are not developed or expected to be developed within this five-year time frame.
You should not assume that the standardized measure of discounted cash flows is the current market value of our estimated oil and natural gas reserves. In accordance with SEC requirements, the standardized measure of discounted cash flows from proved reserves at August 31, 2015 is based on twelve-month average prices and costs as of the date of the estimate. These prices and costs will change and may be materially higher or lower than the prices and costs as of the date of the estimate. Any changes in consumption by oil and natural gas purchasers or in governmental regulations or taxation may also affect actual future net cash flows. The timing of both the production and the expenses from the development and production of oil and natural gas properties will affect the timing of actual future net cash flows from proved reserves and their present value. In addition, the 10% discount factor we use when calculating standardized measure of discounted cash flows for reporting requirements in compliance with accounting requirements is not necessarily the most appropriate discount factor. The effective interest rate at various times and the risks associated with our operations or the oil and natural gas industry in general will affect the accuracy of our estimated oil and gas reserves.
Seasonal weather conditions, wildlife restrictions and other constraints could adversely affect our ability to conduct operations.
Our operations could be adversely affected by weather conditions and wildlife restrictions. In the Rocky Mountains, certain activities cannot be conducted as effectively during the winter months. Winter and severe weather conditions limit and may temporarily halt operations. These constraints and resulting shortages or high costs could delay or temporarily halt our operations and materially increase our operational and capital costs, which could have a material adverse effect on our business, financial condition and results of operations. Similarly, some of our properties are located in relatively populated areas in the Wattenberg Field, and our operations in those areas may be subject to additional expenses and limitations. In addition, a critical habitat designation for certain wildlife under the U.S. Endangered Species Act or similar state laws could result in material restrictions to public or private land use and could delay or prohibit land access or development. The listing of certain species as threatened or endangered could have a material impact on our operations in areas where such listed species are found.
Our future success depends upon our ability to find, develop, produce and acquire additional oil and natural gas reserves that are economically recoverable. Drilling activities may be unsuccessful or may be less successful than anticipated.
In order to maintain or increase our reserves, we must locate and develop or acquire new oil and natural gas reserves to replace those being depleted by production. We must do this even during periods of low oil and natural gas prices when it is difficult to raise the capital necessary to finance our exploration, development and acquisition activities. Without successful exploration, development or acquisition activities, our reserves and revenues will decline rapidly. We may not be able to find and develop or acquire additional reserves at an acceptable cost or have access to necessary financing for these activities, either of which would have a material adverse effect on our financial condition.
Our management has specifically identified and scheduled drilling locations as an estimation of our future multi-year drilling activities on our existing acreage. These identified drilling locations represent a significant part of our strategy. Our ability to drill and develop these locations depends on a number of uncertainties, including the availability of capital, seasonal conditions, regulatory approvals, oil and natural gas prices, costs, drilling results and the accuracy of our assumptions and estimates regarding potential well communication issues and other matters affecting the spacing of our wells. Because of these uncertainties, we do not know if the numerous potential drilling locations we have identified will ever be drilled or if we will be able to produce oil and natural gas from these or any other potential drilling locations. As such, our actual drilling activities may differ materially from those presently identified, which could adversely affect our business and reserves.
Drilling for oil and natural gas may involve unprofitable efforts, not only from dry wells but also from wells that are productive but do not produce sufficient quantities to cover drilling, operating and other costs. In addition, even a commercial well may have production that is less, or costs that are greater, than we projected. The cost of drilling, completing and operating a well is often uncertain, and many factors can adversely affect the economics of a well or property. There can be no assurance that proved or unproved property acquired by us or undeveloped acreage leased by us will be profitably developed, that new wells drilled by us in prospects that we pursue will be productive or that we will recover all or any portion of our investment in such proved or unproved property or wells.
23
We may not be able to obtain adequate financing when the need arises to execute our long-term operating strategy.
Our ability to execute our long-term operating strategy is highly dependent on our having access to capital when the need arises. We historically have addressed our liquidity needs through credit facilities, issuances of equity and debt securities, sales of assets, joint ventures and cash provided by operating activities. We will examine the following alternative sources of capital in light of economic conditions in existence at the relevant time:
• | borrowings from banks or other lenders; |
• | the sale of non-core assets; |
• | the issuance of debt securities; |
• | the sale of common stock, preferred stock or other equity securities; |
• | joint venture financing; and |
• | production payments. |
The availability of these sources of capital when the need arises will depend upon a number of factors, some of which are beyond our control. These factors include general economic and financial market conditions, oil and natural gas prices, our credit ratings, interest rates, market perceptions of us or the oil and gas industry, our market value and our operating performance. We may be unable to execute our long-term operating strategy if we cannot obtain capital from these sources when the need arises.
Oil and natural gas prices may be affected by local and regional factors.
The prices to be received for our production will be determined to a significant extent by factors affecting the local and regional supply of and demand for oil and natural gas, including the adequacy of the pipeline and processing infrastructure in the region to process, and transport our production and that of other producers. Those factors result in basis differentials between the published indices generally used to establish the price received for regional natural gas production and the actual (frequently lower) price we receive for our production. These differentials are difficult to predict and may widen or narrow in the future based on market forces. The unpredictability of future differentials makes it more difficult for us to effectively hedge our production. Many of our hedging arrangements are based on benchmark prices and therefore do not protect us from adverse changes in the differential applicable to our production.
Lower oil and natural gas prices may cause us to record ceiling test write-downs, which could negatively impact our results of operations.
We use the full cost method of accounting to account for our oil and natural gas operations. Accordingly, we capitalize the cost to acquire, explore for and develop oil and natural gas properties. Under full cost accounting rules, the net capitalized costs of oil and natural gas properties may not exceed a “full cost ceiling” which is based upon the present value of estimated future net cash flows from proved reserves, including the effect of hedges in place, discounted at 10%, plus the lower of cost or fair market value of unproved properties. If, at the end of any fiscal period, we determine that the net capitalized costs of oil and natural gas properties exceed the full cost ceiling, we must charge the amount of the excess to earnings in the period then ended. This is called a “ceiling test write-down.” This charge does not impact cash flow from operating activities, but does reduce our net income and stockholders’ equity. Once incurred, a write-down of oil and natural gas properties is not reversible at a later date.
We review the net capitalized costs of our properties quarterly, using a single price based on the beginning-of-the-month average of oil and natural gas prices for the preceding 12 months. We also assess investments in unproved properties periodically to determine whether impairment has occurred. The risk that we will be required to further write down the carrying value of our oil and gas properties increases when oil and natural gas prices are low or volatile. In addition, write-downs may occur if we experience substantial downward adjustments to our estimated proved reserves or our unproved property values, or if estimated future development costs increase. For the year ended August 31, 2015, we recognized a $16.0 million impairment related to our ceiling test calculations during the year. We may experience further ceiling test write-downs or other impairments in the future. In addition, any future ceiling test cushion would be subject to fluctuation as a result of acquisition or divestiture activity.
24
We cannot control the activities on properties we do not operate and we are unable to ensure the proper operation and profitability of these non-operated properties.
We do not operate all of the properties in which we have an interest. As a result, we have limited ability to exercise influence over, and control the risks associated with, the operation of these properties. The success and timing of drilling and development activities on our partially owned properties operated by others therefore will depend upon a number of factors outside of our control, including the operator’s:
• | timing and amount of capital expenditures; |
• | expertise and diligence in adequately performing operations and complying with applicable agreements; |
• | financial resources; |
• | inclusion of other participants in drilling wells; and |
• | use of technology. |
As a result of any of the above or an operator’s failure to act in ways that are in our best interest, our allocated production revenues and results of operations could be adversely affected. In addition, our lack of control over non-operated properties makes it more difficult for us to forecast future capital expenditures and production.
We are dependent on third party pipeline, trucking and rail systems to transport our production and, in the Wattenberg Field, gathering and processing systems to prepare our production. These systems have limited capacity and at times have experienced service disruptions. Curtailments, disruptions or lack of availability in these systems interfere with our ability to market the oil and natural gas we produce, and could materially and adversely affect our cash flow and results of operations.
Market conditions or the unavailability of satisfactory oil and natural gas transportation arrangements may hinder our access to oil and natural gas markets or delay our production. The marketability of our oil and natural gas and production, particularly from our wells located in the Wattenberg Field, depends in part on the availability, proximity and capacity of gathering, processing, pipeline, trucking and rail systems. The amount of oil and natural gas that can be produced and sold is subject to limitation in certain circumstances, such as pipeline interruptions due to scheduled and unscheduled maintenance, accidents, excessive pressure, physical damage to the gathering or transportation system, lack of contracted capacity on such systems, inclement weather, labor or regulatory issues or other interruptions. A portion of our production may be interrupted, or shut in, from time to time as a result of these factors. Curtailments and disruptions in these systems may last from a few days to several months or longer. These risks are greater for us than for some of our competitors because our operations are focused on areas where there has been a substantial amount of development activity in recent years and resulting increases in production, and this has increased the likelihood that there will be periods of time in which there is insufficient midstream capacity to accommodate the increased production. For example, the gas gathering systems serving the Wattenberg Field have in recent years experienced high line pressures, and at times this has reduced capacity and caused gas production to either be shut in or flared. In addition, we might voluntarily curtail production in response to market conditions. Any significant curtailment in gathering, processing or pipeline system capacity, significant delay in the construction of necessary facilities or lack of availability of transport, would interfere with our ability to market the oil and natural gas we produce, and could materially and adversely affect our cash flow and results of operations and the expected results of our drilling program. We may face similar risks in other areas.
We may be unable to satisfy our contractual obligations to deliver oil from our own production or other sources.
We have entered into agreements that require us to deliver minimum amounts of crude oil to a third party marketer and to two counterparties that transport crude oil via pipelines. Pursuant to these agreements, we must deliver specific amounts, either from our own production or from oil we acquire, over the next five years. Beginning in October of 2015, we must deliver a combined volume of 6,157 Bbls of oil per day to two of these counterparties. We have also committed to deliver 5,000 Bbls of oil per day to the third counterparty for five years beginning in the latter half of the 2016 calendar year. In addition, we have committed to deliver 7,500 Bbls of oil per day for the remainder of calendar 2015 to a third party refiner. If we are unable to fulfill all of our contractual delivery obligations from our own production, we may be required to pay penalties or damages pursuant to these agreements or we may have to purchase oil from third parties to fulfill our delivery obligations. This could adversely impact our cash flows, profit margins and net income.
25
We face strong competition from larger oil and natural gas companies that may negatively affect our ability to carry on operations.
We operate in the highly competitive areas of oil and natural gas exploration, development and production. Factors that affect our ability to compete successfully in the marketplace include:
• | the availability of funds for, and information relating to, properties; |
• | the standards established by us for the minimum projected return on investment; and |
• | the transportation of natural gas and crude oil. |
Our competitors include major integrated oil companies, substantial independent energy companies, affiliates of major interstate and intrastate pipelines and national and local natural gas gatherers, many of which possess greater financial and other resources than we do. If we are unable to successfully compete against our competitors, our business, prospects, financial condition and results of operations may be adversely affected.
We may be unable to successfully identify, execute or effectively integrate future acquisitions, which may negatively affect our results of operations.
Acquisitions of oil and gas businesses and properties have been an important element of our business, and we will continue to pursue acquisitions in the future. In the last several years, we have pursued and consummated acquisitions that have provided us opportunities to grow our production and reserves. Although we regularly engage in discussions with, and submit proposals to, acquisition candidates, suitable acquisitions may not be available in the future on reasonable terms. If we do identify an appropriate acquisition candidate, we may be unable to successfully negotiate the terms of an acquisition, finance the acquisition or, if the acquisition occurs, effectively integrate the acquired business into our existing business. Negotiations of potential acquisitions and the integration of acquired business operations may require a disproportionate amount of management’s attention and our resources. Even if we complete additional acquisitions, any new businesses may not generate revenues comparable to our existing business, the anticipated cost efficiencies or synergies may not be realized and these businesses may not be integrated successfully or operated profitably. The success of any acquisition will depend on a number of factors, including our ability to estimate accurately the recoverable volumes of reserves associated with the acquired assets, rates of future production and future net revenues attainable from the reserves and to assess possible environmental liabilities. Our inability to successfully identify, execute or effectively integrate future acquisitions may negatively affect our results of operations.
Even though we perform due diligence reviews (including a review of title and other records) of the major properties we seek to acquire that we believe is consistent with industry practices, these reviews are inherently incomplete. It is generally not feasible for us to perform an in-depth review of every individual property and all records involved in each acquisition. Moreover, even an in-depth review of records and properties may not necessarily reveal existing or potential liabilities or other problems or permit us to become familiar enough with the properties to assess fully their deficiencies and potential. We may assume known and unknown environmental and other risks and liabilities in connection with the acquired businesses and properties. The discovery of any material liabilities associated with our acquisitions could harm our results of operations.
In addition, acquisitions of businesses may require additional debt or equity financing, resulting in additional leverage or dilution of ownership. Our credit facility contains, and future debt agreements may contain, covenants that limit our ability to complete acquisitions.
We may incur substantial costs to comply with the various federal, state and local laws and regulations that affect our oil and natural gas operations.
We are affected significantly by a substantial number of governmental regulations that increase costs related to the drilling, completion, production, and abandonment of wells, the transportation and processing of oil and natural gas, the management and disposal of waste, and other aspects of our operations. It is possible that the number and extent of these regulations, and the costs to comply with them, will increase significantly in the future. In Colorado, for example, significant governmental regulations have been adopted in recent years to address well siting, well construction, hydraulic fracturing, water quality, public safety, air emissions, aesthetics, waste management, spill reporting, land reclamation, wildlife protection, and data collection. These government regulatory requirements may result in substantial costs that are not possible to pass through to our customers and could impact the profitability of our operations.
Our oil and natural gas operations are subject to stringent federal, state and local laws and regulations relating to the release or disposal of materials into the environment or otherwise relating to health and safety, land use, environmental protection or the oil and natural gas industry generally. Legislation affecting the industry is under constant review for amendment or expansion,
26
frequently increasing our regulatory burden. Compliance with such laws and regulations often increases our cost of doing business and, in turn, decreases our profitability. Failure to comply with these laws and regulations may result in the assessment of administrative, civil and criminal penalties, the incurrence of investigatory or remedial obligations, or the issuance of cease and desist orders.
The environmental laws and regulations to which we are subject may, among other things:
• | require us to apply for and receive a permit before drilling commences or certain associated facilities are developed; |
• | restrict the types, quantities and concentration of substances that can be released into the environment in connection with drilling, hydraulic fracturing, and production activities; |
• | limit or prohibit drilling activities on certain lands lying within wilderness, wetlands, threatened and endangered species habitat and other protected areas; |
• | require remedial measures to mitigate pollution from former operations, such as plugging abandoned wells; and |
• | impose substantial liabilities for pollution resulting from our operations. |
Changes in environmental laws and regulations occur frequently, and any changes that result in more stringent or costly waste handling, storage, transport, disposal or cleanup requirements could require us to make significant expenditures to maintain compliance, and may otherwise have a material adverse effect on our earnings, results of operations, competitive position or financial condition. Changes to the requirements for drilling, completing, operating, and abandoning wells and related facilities could have similar adverse effects on us.
New environmental legislation or regulatory initiatives, including those related to hydraulic fracturing, could result in increased costs and additional operating restrictions or delays.
We are subject to extensive federal, state, and local laws and regulations concerning health, safety, and environmental protection. Government authorities frequently add to those requirements, and both oil and gas development generally and hydraulic fracturing specifically are receiving increased regulatory attention. Our operations utilize hydraulic fracturing, an important and commonly used process in the completion of oil and natural gas wells in low-permeability formations. Hydraulic fracturing involves the injection of water, proppant, and chemicals under pressure into rock formations to stimulate hydrocarbon production.
In 2012, the EPA issued final rules that establish new air emission controls for natural gas processing operations, as well as for oil and natural gas production. Among other things, the latter rules cover the completion and operation of hydraulically fractured gas wells and associated equipment. After several parties challenged the new air regulations in court, the EPA reconsidered certain requirements and amended the rules in 2013 and 2014. In August 2015, the EPA proposed a package of additional emission control requirements that likewise cover the completion and operation of hydraulically fractured wells and associated equipment. At this point, we cannot predict the final regulatory requirements or the cost to comply with them.
Some activists have attempted to link hydraulic fracturing to various environmental problems, including potential adverse effects on drinking water supplies as well as migration of methane and other hydrocarbons. As a result, the federal government is studying the environmental risks associated with hydraulic fracturing and evaluating whether to adopt additional regulatory requirements. For example, the EPA has commenced a multi-year study of the potential impacts of hydraulic fracturing on drinking water resources, and the draft results were released for public and peer review in June 2015. In addition, in February 2014, the EPA issued final guidance for underground injection permits that regulate hydraulic fracturing using diesel fuel, where the EPA has permitting authority under the SDWA. This guidance eventually could encourage other regulatory authorities to adopt to permitting and other restrictions on the use of hydraulic fracturing. In May 2014, the EPA issued an advance notice of proposed rulemaking under TSCA to obtain data on chemical substances and mixtures used in hydraulic fracturing. In April 2015, the EPA proposed regulations under the CWA to impose pretreatment standards on wastewater discharges associated with hydraulic fracturing activities. Aside from the EPA, the BLM has issued new rules for hydraulic fracturing activities involving federal and tribal lands and minerals that, in general, would cover disclosure of fracturing fluid components, wellbore integrity, and handling of flowback and produced water, and OSHA has proposed stricter standards for worker exposure to silica, which would apply to use of sand as a proppant for hydraulic fracturing. In 2013, OSHA proposed regulations lowering the permissible exposure limit for airborne silica, and OSHA and the National Institute of Occupational Safety and Health have issued hazard alerts to the hydraulic fracturing industry regarding risks to workers from silica exposure and other hazards, which include recommendations to reduce those risks and proposals for additional study of the industry.
In the United States Congress, bills have been introduced from time to time that would amend the SDWA to eliminate an existing exemption for certain hydraulic fracturing activities from the definition of "underground injection," thereby requiring the oil and natural gas industry to obtain SDWA permits for fracturing not involving diesel fuels, and to require disclosure of the chemicals used in the process. If adopted, such legislation could establish an additional level of regulation and permitting at the
27
federal level, but some form of chemical disclosure is already required by most oil and gas producing states. At this time, it is not clear what action, if any, the United States Congress will take on hydraulic fracturing.
Apart from these ongoing federal initiatives, state governments where we operate have moved to impose stricter requirements on hydraulic fracturing and other aspects of oil and gas production. Colorado, for example, comprehensively updated its oil and gas regulations in 2008 and adopted significant additional amendments in 2011, 2013, 2014 and 2015. Among other things, the updated and amended regulations require operators to reduce methane emissions associated with hydraulic fracturing, compile and report additional information regarding wellbore integrity, satisfy more stringent reclamation and remediation standards, avoid certain wildlife habitat, publicly disclose the chemical ingredients used in hydraulic fracturing, increase the minimum distance between occupied structures and oil and gas wells, undertake additional mitigation for nearby residents, implement additional groundwater testing, and take additional actions to prevent blowouts and avoid subsurface well communication. Colorado has also adopted new regulations for air emissions from oil and gas operations as well as new legislation and implementing regulations increasing the monetary penalties for regulatory violations and lowering the threshold for reporting spills. Additionally, local governments are adopting new requirements on hydraulic fracturing and other oil and gas operations, including local county and city governments in Colorado.
The trend toward stricter standards and greater enforcement in environmental legislation and regulation is likely to continue. For example, concern has recently arisen in several states over increasing numbers of earthquakes that may be associated with underground injection wells used for the disposal of oil and gas wastewater. Such concerns could eventually limit the use of such wells in certain areas and increase the cost of disposal in others. Similarly, concerns have recently been expressed over the flaring of natural gas associated with crude oil production in certain areas, and the BLM is expected to propose new regulations in 2015 or 2016 for flaring involving federal land and minerals. These concerns and regulations could limit or increase the cost of crude oil production in certain areas. Other environmental issues and concerns may periodically arise in the future and lead to new and additional legislative and regulatory initiatives.
The adoption of future federal, state or local laws or implementing regulations or orders imposing new environmental obligations on, or otherwise limiting, our operations could make it more difficult and more expensive to complete oil and natural gas wells, increase our costs of compliance and doing business, delay or prevent the development of certain resources (including especially shale formations that are not commercial without the use of hydraulic fracturing), or alter the demand for and consumption of our products and services. We cannot assure you that any such outcome would not be material, and any such outcome could have a material and adverse impact on our cash flows and results of operations.
Any local moratoria or bans on our activities could have a negative impact on our business, financial condition and results of operations.
Some local governments are adopting new requirements and restrictions on hydraulic fracturing and other oil and gas operations. Some local governments in Colorado, for instance, have amended their land use regulations to impose new requirements on oil and gas development, while other local governments have entered memoranda of agreement with oil and gas producers to accomplish the same objective. Beyond that, during the past few years a total of five Colorado cities have passed voter initiatives temporarily or permanently prohibiting hydraulic fracturing. The oil and gas industry and the State of Colorado have challenged four of these initiatives in court, and the trial courts in three of the cases have invalidated the initiatives. In September 2015, the Colorado Supreme Court announced that it would review two of these cases for the purpose of deciding whether local hydraulic fracturing bans are preempted.
In addition, during 2014, opponents of hydraulic fracturing sought statewide ballot initiatives that would have restricted oil and gas development in Colorado. These initiatives were withdrawn in return for the creation of a task force to craft recommendations for minimizing land use conflicts over the location of oil and gas facilities. Although the task force has completed its work, opponents of hydraulic fracturing could still pursue state legislation or additional local or statewide ballot initiatives to restrict hydraulic fracturing or oil and gas development generally. If we are required to cease operating in any of the areas in which we now operate as the result of bans or moratoria on drilling or related oilfield services activities, it could have a material effect on our business, financial condition and results of operations.
Environmental liabilities could have a material adverse effect on our financial condition and operations.
Our operations could result in liability for personal injuries, property damage, oil spills, discharge of hazardous materials, remediation and clean-up costs and other environmental damages. We could also be liable for environmental damages caused by previous property owners. As a result, substantial liabilities to third parties or governmental entities may be incurred which could have a material adverse effect on our financial condition and results of operations. We maintain insurance coverage for our operations, but this insurance may not extend to the full potential liability to which we may be subject and further may not cover
28
all potential environmental damages. Accordingly, we may be subject to liability or may lose the ability to continue exploration or production activities upon substantial portions of our properties if certain environmental damages occur.
For example, over the years we have owned or leased numerous properties for oil and natural gas activities upon which petroleum hydrocarbons or other materials may have been released by us or by predecessor property owners or lessees who were not under our control. Under applicable environmental laws and regulations, including CERCLA, RCRA and state laws, we could be held liable for the removal or remediation of previously released materials or property contamination at such locations regardless of whether we were responsible for the release or whether the operations at the time of the release were standard industry practice.
Similarly, the OPA imposes a variety of regulations on “responsible parties” related to the prevention of oil spills. The implementation of new, or the modification of existing, environmental laws or regulations, including regulations promulgated pursuant to the OPA, could have a material adverse impact on us.
The adoption and implementation of new statutory and regulatory requirements for derivative transactions could have an adverse impact on our ability to hedge risks associated with our business and increase the working capital requirements to conduct these activities.
The Dodd-Frank Act authorizes federal oversight and regulation of the over-the-counter derivatives market and entities that participate in that market. Regulations under the Dodd-Frank Act may, among other things, require us to comply with margin requirements in connection with our derivative activities, although the application of those provisions to us is uncertain at this time. If we are required to post cash collateral in connection with some or all of our derivative positions, this would make it difficult or impossible to pursue our current hedging strategy. The regulations may also require the counterparties to our derivative instruments to spin off some of their derivatives activities to separate entities, which may not be as creditworthy as the current counterparties. The regulations may also reduce the number of potential counterparties in the market, which could make hedging more expensive.
If we reduce our use of derivatives as a result of the Dodd-Frank Act and its implementing regulations, our results of operations may be more volatile and our cash flows may be less predictable, which could adversely affect our ability to plan for and fund capital expenditures. Any of these consequences could have a material adverse effect on our consolidated financial position, results of operations and cash flows. In addition, derivative instruments create a risk of financial loss in some circumstances, including when production is less than the volume covered by the instruments.
Proposed changes to U.S. tax laws, if adopted, could have an adverse effect on our business, financial condition, results of operations and cash flows.
From time to time legislative proposals are made that would, if enacted, make significant changes to U.S. tax laws. These proposed changes have included, among others, eliminating the immediate deduction for intangible drilling and development costs, eliminating the deduction from income for domestic production activities relating to oil and natural gas exploration and development, repealing the percentage depletion allowance for oil and natural gas properties and extending the amortization period for certain geological and geophysical expenditures. Such proposed changes in the U.S. tax laws, if adopted, or other similar changes that reduce or eliminate deductions currently available with respect to oil and natural gas exploration and development, could adversely affect our business, financial condition, results of operations and cash flows.
Our indebtedness may adversely affect our cash flow and our ability to operate our business, remain in compliance with debt covenants and make payments on our debt.
As of August 31, 2015, the aggregate amount of our outstanding indebtedness was $78 million, which could have important consequences for you, including the following:
• | the covenants contained in our credit facility limit our ability to borrow money in the future for acquisitions, capital expenditures or to meet our operating expenses or other general corporate obligations and may limit our flexibility in operating our business; |
• | the amount of our interest expense may increase because amounts borrowed under our credit facility bear interest at variable rates, which, if interest rates increase, could result in higher interest expense; |
• | we may have a higher level of debt than some of our competitors, which may put us at a competitive disadvantage; |
• | we may be more vulnerable to economic downturns and adverse developments in our industry or the economy in general, especially extended or further declines in oil and natural gas prices; and |
• | our debt level could limit our flexibility in planning for, or reacting to, changes in our business and the industry in which we operate. |
29
Our ability to meet our expenses and debt obligations will depend on our future performance, which will be affected by financial, business, economic, regulatory and other factors. We will not be able to control many of these factors, such as economic conditions and governmental regulation. We cannot be certain that our cash flow from operations will be sufficient to allow us to pay the principal and interest on our debt and meet our other obligations. If we do not have enough cash to service our debt, we may be required to refinance all or part of our existing debt, sell assets, borrow more money or raise equity. We may not be able to refinance our debt, sell assets, borrow more money or raise equity on terms acceptable to us, if at all.
To service our indebtedness, we will require a significant amount of cash. Our ability to generate cash depends on many factors beyond our control, and any failure to meet our debt obligations could harm our business, financial condition and results of operations.
Our ability to make payments on and to refinance our indebtedness and to fund planned capital expenditures will depend on our ability to generate sufficient cash flow from operations in the future. To a certain extent, this is subject to general economic, financial, competitive, legislative and regulatory conditions and other factors that are beyond our control, including the prices that we receive for our oil and natural gas production.
We cannot assure you that our business will generate sufficient cash flow from operations or that future borrowings will be available to us under our credit facility in an amount sufficient to enable us to pay principal and interest on our indebtedness or to fund our other liquidity needs. If our cash flow and existing capital resources are insufficient to fund our debt obligations, we may be forced to reduce our planned capital expenditures, sell assets, seek additional equity or debt capital or restructure our debt, and any of these actions, if completed, could adversely affect our business and/or our shareholders. We cannot assure you that any of these remedies could, if necessary, be effected on commercially reasonable terms, in a timely manner or at all. In addition, any failure to make scheduled payments of interest and principal on our outstanding indebtedness could harm our ability to incur additional indebtedness on acceptable terms. Our cash flow and capital resources may be insufficient for payment of interest on and principal of our debt in the future and any such alternative measures may be unsuccessful or may not permit us to meet scheduled debt service obligations, which could cause us to default on our obligations and could impair our liquidity.
Restrictive debt covenants could limit our growth and our ability to finance our operations, fund our capital needs, respond to changing conditions and engage in other business activities that may be in our best interests.
Our credit facility contains, and future debt agreements may contain, covenants that restrict or limit our ability to:
• | pay dividends or distributions on our capital stock or issue preferred stock; |
• | repurchase, redeem or retire our capital stock or subordinated debt; |
• | make certain loans and investments; |
• | sell assets; |
• | enter into certain transactions with affiliates; |
• | create or assume certain liens on our assets; |
• | enter into sale and leaseback transactions; |
• | merge or to enter into other business combination transactions; or |
• | engage in certain other corporate activities. |
Also, our credit facility requires us to maintain compliance with specified financial ratios and satisfy certain financial tests. Our ability to comply with these ratios and tests may be affected by events beyond our control, and we cannot assure you that we will meet these ratios and tests in the future. These restrictions could limit our ability to obtain future financings, make needed capital expenditures, withstand a future downturn in our business or the economy in general or otherwise conduct necessary corporate activities. We may also be prevented from taking advantage of business opportunities that arise because of the restrictive covenants under our credit facility. Future debt agreements may have similar, or more restrictive, provisions.
A breach of any of the covenants in our debt agreements or our inability to comply with the required ratios or tests could result in a default under the agreement. A default, if not cured or waived, could result in all indebtedness outstanding under the agreement becoming immediately due and payable. If that should occur, we may not be able to pay all such debt or borrow sufficient funds to refinance it. Even if new financing were then available, it may not be on terms that are acceptable to us. If we were unable to repay those amounts, the lenders could accelerate the maturity of the debt or proceed against any collateral granted to them to secure such defaulted debt.
30
Our two co-Chief Executive Officers may allocate some portion of their time to other business interests, which could have a negative impact on our operations.
Our two co-Chief Executive Officers have other business interests to which they allocate a portion of their professional time. Because of this, their employment agreements provide that they are only obligated to devote eighty percent of their time to our affairs. While in the past they have devoted substantially all of their time to our business, they could allocate more of their time to these other interests, which could have a negative impact on our operations.
Our disclosure controls and procedures may not prevent or detect potential acts of fraud.
Our disclosure controls and procedures are designed to provide reasonable assurance that information required to be disclosed by us in reports we file or submit under the Exchange Act is accumulated and communicated to management, and recorded, processed, summarized and reported within the time periods specified in the SEC rules and forms.
Our management, including our co-Chief Executive Officers and Chief Financial Officer, believes that any disclosure controls and procedures or internal controls and procedures, no matter how well conceived and operated, can provide only reasonable, not absolute, assurance that the objectives of the control system are met. Further, the design of a control system must reflect the fact that there are resource constraints, and the benefits of controls must be considered relative to their costs. Because of the inherent limitations in all control systems, they cannot provide absolute assurance that all control issues and instances of fraud, if any, within our company have been prevented or detected. These inherent limitations include the realities that judgments in decision-making can be faulty, and that breakdowns can occur because of a simple error or mistake. Additionally, controls can be circumvented by the individual acts of some persons, by collusion of two or more people, or by an unauthorized override of the controls. The design of any system of controls also is based in part upon certain assumptions about the likelihood of future events, and we cannot assure you that any design will succeed in achieving its stated goals under all potential future conditions. Accordingly, because of the inherent limitations in a cost effective control system, misstatements due to error or fraud may occur and not be detected.
Failure to maintain an effective system of internal control over financial reporting may have an adverse effect on our stock price.
Pursuant to Section 404 of the Sarbanes-Oxley Act of 2002, and the rules and regulations promulgated by the SEC to implement Section 404, we are required to furnish a report by our management in our annual report on Form 10-K regarding the effectiveness of our internal control over financial reporting. The report includes, among other things, an assessment of the effectiveness of our internal control over financial reporting as of the end of our fiscal year, including a statement as to whether or not our internal control over financial reporting is effective. This assessment must include disclosure of any material weaknesses in our internal control over financial reporting identified by management. If we are unable to assert that our internal control over financial reporting is effective now or in any future period, or if our auditors are unable to express an opinion on the effectiveness of our internal controls, we could lose investor confidence in the accuracy and completeness of our financial reports, which could have an adverse effect on our stock price.
Substantially all of our producing properties are located in the D-J Basin in Colorado, making us vulnerable to risks associated with operating in one major geographic area.
Our operations have been focused on the D-J Basin in Colorado, which means our current producing properties and new drilling opportunities are geographically concentrated in that area. Because our operations are not as diversified geographically as many of our competitors, the success of our operations and our profitability may be disproportionately exposed to the effect of any regional events, including fluctuations in prices of oil and natural gas produced from the wells in the region, natural disasters, restrictive governmental regulations, transportation capacity constraints, weather, curtailment of production or interruption of transportation and processing services, and any resulting delays or interruptions of production from existing or planned new wells.
Failure to adequately protect critical data and technology systems could materially affect our operations.
Information technology solution failures, network disruptions and breaches of data security could disrupt our operations by causing delays or cancellation of customer orders, impeding processing of transactions and reporting financial results, resulting in the unintentional disclosure of customer, employee or other information, or damage to our reputation. A system failure or data security breach may have a material adverse effect on our financial condition, results of operations or cash flows.
31
Our operations are substantially dependent on the availability of water. Restrictions on our ability to obtain water may have an adverse effect on our financial condition, results of operations and cash flows.
Water is an essential component of shale oil and natural gas production during both the drilling and hydraulic fracturing processes. Historically, we have been able to purchase water from local land owners for use in our operations. When drought conditions occur, governmental authorities may restrict the use of water subject to their jurisdiction for hydraulic fracturing to protect local water supplies. If we are unable to obtain water to use in our operations from local sources, we may be unable to produce oil, natural gas and NGLs economically, which could have an adverse effect on our financial condition, results of operations and cash flows.
Risks Relating to our Common Stock
We do not intend to pay dividends on our common stock and our ability to pay dividends on our common stock is restricted.
Since inception, we have not paid any cash dividends on common stock. Cash dividends are restricted under the terms of our credit facility and we presently intend to continue the policy of using retained earnings for expansion of our business. Any future dividends also may be restricted by future agreements.
Our stock price could be volatile, which could cause you to lose part or all of your investment.
The stock market has from time to time experienced significant price and volume fluctuations that may be unrelated to the operating performance of particular companies. In particular, the market price of our common stock, like that of the securities of other energy companies, has been and may continue to be highly volatile.
From time to time, there has been limited trading volume in our common stock. In addition, there can be no assurance that there will continue to be a trading market or that any securities research analysts will continue to provide research coverage with respect to our common stock. It is possible that such factors will adversely affect the market for our common stock.
The market valuation of our business may fluctuate due to factors beyond our control and the value of the investment of our stockholders may fluctuate correspondingly.
The market valuations of energy companies, such as us, frequently fluctuate due to factors unrelated to the past or present operating performance of such companies. Our market valuation may fluctuate significantly in response to a number of factors, many of which are beyond our control, including:
•Changes in securities analysts’ estimates of our financial performance;
•Fluctuations in stock market prices and volumes, particularly among securities of energy companies;
•Changes in market valuations of similar companies;
• | Announcements by us or our competitors of significant contracts, new acquisitions, discoveries, commercial relationships, joint ventures or capital commitments; |
•Variations in our quarterly operating results;
•Fluctuations in oil and natural gas prices;
•Loss of a major customer;
•Loss of a relationship with a partner; and
•Additions or departures of key personnel.
As a result, the value of your investment in our common stock may fluctuate.
Additional financings may subject our existing stockholders to significant dilution.
To the extent that we raise additional funds or complete acquisitions by issuing equity securities, our stockholders may experience significant dilution. In addition, debt financing, if available, may involve restrictive covenants. We may seek to access the public or private capital markets whenever conditions are favorable, even if we do not have an immediate need for additional capital at that time. Our access to the financial markets and the pricing and terms we receive in those markets could be adversely impacted by various factors, including changes in general market conditions and commodity price changes.
ITEM 1B. | UNRESOLVED STAFF COMMENTS |
None.
32
ITEM 2. | PROPERTIES |
See Item 1 of this report.
33
ITEM 3. | LEGAL PROCEEDINGS |
On June 1, 2015, the Company filed a complaint in the District Court of Weld County, Colorado, against Briller, Inc., R.W.L. Enterprises and Robert W. Loveless (together, the “Defendants”) arising from a dispute concerning the validity of certain leases covering properties in Weld County. On June 23, 2015, the Defendants removed the case to the Federal District Court of Colorado and filed an answer and counterclaims against the Company and two officers of the Company. The essence of the Defendants’ counterclaims is that the Company unlawfully drilled wells through properties leased by the Defendants and extracted oil and gas from these properties causing physical damage and economic damages measured by the value of hydrocarbons to be produced of approximately $42 million. Although the Company believes Defendants’ counterclaims are without merit, it is not possible at this time to predict the outcome of this matter.
ITEM 4. | MINE SAFETY DISCLOSURES |
Not applicable.
34
PART II
ITEM 5. | MARKET FOR REGISTRANT'S COMMON EQUITY, RELATED STOCKHOLDER MATTERS AND ISSUER PURCHASES OF EQUITY SECURITIES |
Our common stock is listed on the NYSE MKT under the symbol “SYRG”.
Shown below is the range of high and low sales prices for our common stock as reported by the NYSE MKT for the past two fiscal years.
Quarter Ended | High | Low | ||
November 30, 2014 | $13.75 | $8.05 | ||
February 29, 2015 | $13.50 | $8.14 | ||
May 31, 2015 | $12.98 | $10.40 | ||
August 31, 2015 | $12.82 | $9.04 | ||
Quarter Ended | High | Low | ||
November 30, 2013 | $11.40 | $8.86 | ||
February 29, 2014 | $10.69 | $8.11 | ||
May 31, 2014 | $12.96 | $9.70 | ||
August 31, 2014 | $14.11 | $10.13 | ||
As of October 10, 2015, the closing price of our common stock on the NYSE MKT was $11.90.
As of October 10, 2015 we had 105,111,133 outstanding shares of common stock and 143 shareholders of record.
Since inception, we have not paid any cash dividends on common stock. Cash dividends are restricted under the terms of our credit facility and we presently intend to continue the policy of using retained earnings for expansion of our business.
Issuer Purchases of Equity Securities
Period | Total Number of Shares (or Units) Purchased | Average Price Paid per Share (or Unit) | Total Number of Shares (or Units) Purchased as Part of Publicly Announced Plans or Programs | Maximum Number (or Approximate Dollar Value) of Shares (or Units) that May Yet Be Purchased Under the Plans or Programs) | |||||||||
June 1, 2015 - June 30, 2015 (1) | 1,600 | $ | 11.79 | — | — | ||||||||
July 1, 2015 - July 31, 2015 (1) | 1,600 | $ | 10.75 | — | — | ||||||||
August 1, 2015 - August 31, 2015 (1) | 1,600 | $ | 9.77 | — | — | ||||||||
Total | 4,800 | ||||||||||||
(1) Pursuant to statutory minimum withholding requirements, certain of our executives exercised their right to "withhold to cover" as a tax payment method for the vesting and exercise of certain shares. These elections were outside of a publicly announced repurchase plan.
35
Comparison of Cumulative Return
The performance graph below compares the cumulative total return of our common stock over the five-year period ended August 31, 2015, with the cumulative total returns for the same period for the Standard and Poor's ("S&P") 500 Index and the companies with a Standard Industrial Code ("SIC") of 1311. The SIC Code 1311 consists of a weighted average composite of publicly traded crude petroleum and natural gas companies. The cumulative total shareholder return assumes that $100 was invested, including reinvestment of dividends, if any, in our common stock on August 31, 2010 and in the S&P 500 Index and all companies with the SIC Code 1311 on the same date. The results shown in the graph below are not necessarily indicative of future performance.
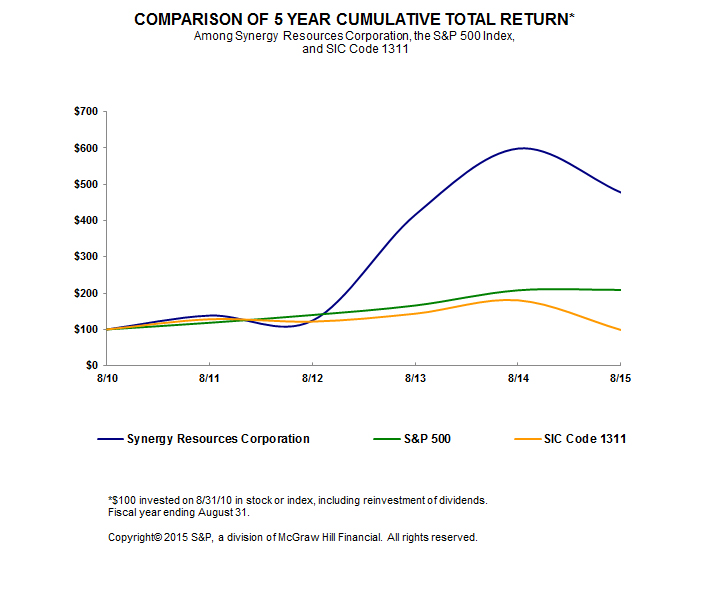
August 31, | |||||||||||||
2010 | 2011 | 2012 | 2013 | 2014 | 2015 | ||||||||
Synergy Resources Corporation | 100.00 | 138.22 | 124.44 | 416.00 | 598.22 | 477.33 | |||||||
S&P 500 | 100.00 | 118.50 | 139.83 | 165.99 | 207.89 | 208.88 | |||||||
SIC Code 1311 | 100.00 | 128.07 | 121.59 | 143.53 | 180.23 | 98.77 | |||||||
The stock price performance included in this graph is not necessarily indicative of future stock price performance.
36
ITEM 6. | SELECTED FINANCIAL DATA |
The selected financial data presented in this item has been derived from our audited financial statements that are either included in this report or in reports previously filed with the SEC. The information in this item should be read in conjunction with the financial statements and accompanying notes and other financial data included in this report.
For the Years Ended August 31, | |||||||||||||||||||
2015 | 2014 | 2013 | 2012 | 2011 | |||||||||||||||
Results of Operations (in thousands): | |||||||||||||||||||
Revenues | $ | 124,843 | $ | 104,219 | $ | 46,223 | $ | 24,969 | $ | 10,002 | |||||||||
Net income (loss) | 18,042 | 28,853 | 9,581 | 12,124 | (11,600 | ) | |||||||||||||
Net income (loss) per common share: | |||||||||||||||||||
Basic | $ | 0.19 | $ | 0.38 | $ | 0.17 | $ | 0.26 | $ | (0.45 | ) | ||||||||
Diluted | $ | 0.19 | $ | 0.37 | $ | 0.16 | $ | 0.25 | $ | (0.45 | ) | ||||||||
Certain Balance Sheet Information (in thousands): | |||||||||||||||||||
Total Assets | $ | 746,449 | $ | 448,542 | $ | 291,236 | $ | 120,731 | $ | 63,698 | |||||||||
Working (Deficit) Capital | 93,129 | (35,338 | ) | 50,608 | 10,875 | 685 | |||||||||||||
Total Liabilities | 174,052 | 167,052 | 88,016 | 19,619 | 14,590 | ||||||||||||||
Equity | 572,397 | 281,490 | 203,220 | 101,112 | 49,108 | ||||||||||||||
Certain Operating Statistics: | |||||||||||||||||||
Production: | |||||||||||||||||||
Oil (MBbls) | 1,970 | 941 | 421 | 236 | 90 | ||||||||||||||
Gas (MMcf) | 7,344 | 3,747 | 2,108 | 1,109 | 451 | ||||||||||||||
Total production in MBOE | 3,194 | 1,566 | 773 | 421 | 165 | ||||||||||||||
Average sales price per BOE | $ | 39.09 | $ | 66.56 | $ | 59.83 | $ | 59.38 | $ | 59.24 | |||||||||
LOE per BOE | $ | 4.70 | $ | 5.10 | $ | 4.42 | $ | 2.89 | $ | 2.94 | |||||||||
DDA per BOE | $ | 20.62 | $ | 21.05 | $ | 17.26 | $ | 14.29 | $ | 16.62 | |||||||||
The fluctuation in results of operations and financial position is due in part to acquisitions of producing oil and gas properties coupled with the aggressive drilling program we executed during 2013, 2014 and 2015.
See Note 17 to the Financial Statements included as part of this report for our quarterly financial data.
ITEM 7. | MANAGEMENT'S DISCUSSION AND ANALYSIS OF FINANCIAL CONDITION AND RESULTS OF OPERATIONS |
Introduction
The following discussion and analysis was prepared to supplement information contained in the accompanying financial statements and is intended to explain certain items regarding the Company's financial condition as of August 31, 2015, and its results of operations for the years ended August 31, 2015, 2014 and 2013. It should be read in conjunction with the “Selected Financial Data” and the accompanying audited financial statements and related notes thereto contained in this Annual Report on Form 10-K.
This section and other parts of this Annual Report on Form 10-K contain forward-looking statements that involve risks and uncertainties. See the “Cautionary Statement Concerning Forward-Looking Statements” at the beginning of this Annual Report on Form 10-K. Forward-looking statements are not guarantees of future performance and our actual results may differ significantly from the results discussed in the forward-looking statements. Factors that might cause such differences include, but
37
are not limited to, those discussed in “Risk Factors”. We assume no obligation to revise or update any forward-looking statements for any reason, except as required by law.
Overview
We are a growth-oriented independent oil and natural gas company engaged in the acquisition, development, and production of crude oil and natural gas in and around the D-J Basin, which we believe to be one of the premier, liquids-rich oil and gas resource plays in the United States. The D-J Basin generally extends from the Denver metropolitan area throughout northeast Colorado into Wyoming, Nebraska, and Kansas. It contains hydrocarbon-bearing deposits in several formations, including the Niobrara, Codell, Greenhorn, Shannon, Sussex, J-Sand and D-Sand. The area has produced oil and gas for over fifty years and benefits from established infrastructure including midstream and refining capacity, long reserve life, and multiple service providers.
Our drilling and completion activities are focused in the Wattenberg Field, an area that covers the western flank of the D-J Basin, predominantly in Weld County, Colorado. Currently we are focused on the horizontal development of the Codell and Niobrara formations, which are characterized by relatively high liquids content. We operate the majority of the horizontal wells we have working interests in, and we strive to maintain a high net revenue interest in all of our operations.
Substantially all of our producing wells are either in or adjacent to the Wattenberg Field. We operate over 82% of our proved producing reserves and over 98% of our fiscal 2015 and planned 2016 drilling and completion expenditures are focused on the Wattenberg Field. This gives us both operational focus and development flexibility to maximize returns on our leasehold position.
Core Operations
Since commencing active operations in September 2008, we have undergone significant growth. From inception through August 31, 2015, we have completed, acquired or participated in 582 gross (407 net) successful oil and gas wells. We are the operator of 423 producing wells and participate with other operators in 159 producing wells. In addition to the wells that had reached productive status at the end of our fiscal year, there are 28 gross (17 net) wells in various stages of drilling or completion as of August 31, 2015.
Our early development efforts were focused on drilling vertical wells into the Niobrara, Codell, and J-Sand formations. In May 2013, we shifted our efforts to horizontal well development within the Wattenberg Field. Since shifting to horizontal development, we have drilled or participated in the drilling of 142 gross (78 net) horizontal wells. As of August 31, 2015, we were the operator of 33 gross (32 net) Codell horizontal wells and 38 gross (37 net) horizontal Niobrara wells.
The following table provides details about our ownership interests with respect to vertical and horizontal producing wells:
Vertical Wells | ||||||||||||||||
Operated Wells | Non-Operated Wells | Totals | ||||||||||||||
Gross | Net | Gross | Net | Gross | Net | |||||||||||
352 | 304 | 71 | 21 | 423 | 325 | |||||||||||
Horizontal Wells | ||||||||||||||||
Operated Wells | Non-Operated Wells | Totals | ||||||||||||||
Gross | Net | Gross | Net | Gross | Net | |||||||||||
71 | 69 | 88 | 13 | 159 | 82 | |||||||||||
In addition to the producing wells summarized in the preceding table, as of August 31, 2015, we were the operator of 21 wells in progress and we were participating as a non-operating working interest owner in 7 wells in progress.
For the twelve months ended August 31, 2015, our average net daily production was 8,750 BOED. By comparison, during our 2014 and 2013 fiscal years, our average production rate was 4,290 BOED and 2,117 BOED, respectively. By the end of our 2015 fiscal year, over 80% of our daily production was from horizontal wells. At the beginning of 2014, less than 10% of our production was from horizontal wells.
38
During the twelve months ended August 31, 2015, crude oil prices declined by approximately 49%. Price declines, especially of this magnitude, can impact many aspects of our operations. For additional discussion concerning the potential impacts of declining commodity prices, please see “Drilling and Completion Operations,” “Market Conditions,” “Oil and Gas Commodity Contracts,” and “Trends and Outlook.”
Significant Developments
Acquisition Activity
Acquisition of K.P. Kauffman assets
Subsequent to our fiscal year end, on September 15, 2015, we announced an agreement for the purchase of interests in producing wells and non-producing leaseholds in the Wattenberg Field from K.P. Kauffman Company, Inc. The assets include leasehold rights for 4,300 net acres in the core Wattenberg Field and non-operated working interests in 25 gross (approximately 5 net) horizontal wells in the Niobrara and Codell formations. Current net production associated with the purchased assets is approximately 1,200 BOED. The purchase price for the assets is $78 million, comprised of $35 million in cash and approximately 4.4 million restricted shares of our common stock, subject to closing adjustments. The transaction has an effective date of September 1, 2015 and is expected to close on or before October 30, 2015.
Acquisition of Mineral Assets from Bayswater on December 15, 2014
On December 15, 2014, we completed the acquisition of certain assets from three independent oil and gas companies collectively known as “Bayswater.” Consideration paid to Bayswater, after customary closing and post-closing adjustments, consisted of approximately $74.2 million in cash and 4.6 million shares in our common stock plus the assumption of certain liabilities. For accounting purposes, the Bayswater acquisition was treated as a business combination and the assets acquired were recorded at fair value. The final purchase price allocation and evaluation of fair value was recognized during our fourth fiscal quarter and is described more fully in Note 3 to our consolidated financial statements, which are included as part of this report.
The Bayswater acquisition encompasses 4,227 net acres with rights to the Codell and Niobrara formations, and 1,480 net acres with rights to other formations including the Sussex, Shannon and J-Sand. Additionally, we acquired working interests in 17 non-operated horizontal wells, 73 operated vertical wells, and 11 non-operated vertical wells. We anticipate this acreage will provide a multi-year drilling inventory and, when fully developed, expect these assets to be accretive to cash flow and earnings per share.
Financing and Other
Completion of Public Stock Offering on February 2, 2015
During our second fiscal quarter, we completed a public offering of 18,613,952 shares (including the shares sold pursuant to an over-allotment option exercised by the underwriters) at a price to the public of $10.75 per share. On February 2, 2015, we received net proceeds of approximately $190.8 million after deducting underwriting discounts, commissions and other offering expenses. For more information, see “Liquidity and Capital Resources.”
Amendments to Revolving Credit Facility (“Revolver”)
On December 15, 2014, we closed on the Fifth Amendment to our Amended and Restated Credit Agreement (“Fifth Amendment”). The terms of the Fifth Amendment included an expansion of the bank syndicate to eight members, an increase in the loan commitment from $300 million to $500 million, and an increase in our borrowing base from $110 million to $230 million. On June 2, 2015, we closed on the Sixth Amendment to the Revolver in connection with the regular semi-annual borrowing base redetermination. The Sixth Amendment provides for a borrowing base of $175 million, which was subsequently revised to $163 million as a result of the liquidation of certain commodity derivative contracts. The facility continues to bear a minimum interest rate on borrowings of 2.5%, with the effective rate varying with utilization, and expires on December 15, 2019. Amounts borrowed under the Revolver will be used to develop oil and gas properties, acquire new oil and gas properties, and for working capital and other general corporate purposes.
Early Liquidation of In-The-Money Commodity Contracts
During the fiscal year ended August 31, 2015, we liquidated a portion of our deep in-the-money commodity contracts and
39
purchased crude oil put contracts with $55/Bbl, $50/Bbl, and $45/Bbl strike prices. These transactions allowed us to monetize what would have otherwise been unrealized gains, thereby increasing cash flow. In addition to working with our existing counterparties, we purchased a portion of the put contracts on the Chicago Mercantile Exchange, which we believe will enhance the liquidity of our overall position.
Impairment of full cost pool
Every quarter, we perform a ceiling test as prescribed by SEC regulations for entities following the full cost method of accounting. This test determines a limit on the book value of oil and gas properties using a formula to estimate future net cash flows from oil and gas reserves. This formula is dependent on several factors and assumes future oil and natural gas prices to be equal to an unweighted arithmetic average of oil and natural gas prices derived from each of the 12 months prior to the reporting period. During our 2015 fiscal year, this calculation indicated that the ceiling amount had declined, largely as a result of the decline in oil and natural gas prices, such that the ceiling was less than the net book value of oil and gas properties. As a result, we recorded a ceiling test impairment totaling $16.0 million during our 2015 fiscal year. This full cost ceiling impairment is recognized as a charge to earnings and may not be reversed in future periods, even if oil and natural gas prices subsequently increase.
Properties
As of August 31, 2015, our estimated net proved oil and gas reserves, as prepared by Ryder Scott, were 27.7 MMBbls of oil and condensate and 174.0 Bcf of natural gas. As of August 31, 2015, we had approximately 442,000 gross and 342,000 net acres under lease, substantially all of which are located in the greater D-J Basin. We further delineate our acreage into specific areas, including the areas we refer to as the “core" Wattenberg Field (approximately 50,000 gross and 37,000 net acres) and the “North East Extension Area” of the Wattenberg Field (approximately 109,000 gross and 52,000 net acres). In addition, we hold approximately 186,000 gross (182,000 net) acres in southwest Nebraska, a conventional oil-prone prospect, and approximately 90,000 gross (64,000 net) acres in far eastern Colorado.
Within our leasehold in the North East Extension Area we have drilled and, as of the 2015 fiscal year end were in the process of completing, our first horizontal well targeting the Greenhorn formation. Within our southwestern Nebraska leasehold, we have entered into a joint exploration agreement with a private operating company based in Denver to drill up to ten wells in a defined Area of Mutual Interest. Our eastern Colorado mineral assets are located in Yuma and Washington Counties, in an area that has a history of dry gas production from the Niobrara formation.
Drilling and Completion Operations
Our drilling and completion schedule has a material impact on our production forecast and a corresponding impact on our expected future cash flows. As commodity prices have fallen over the preceding fiscal year, we have been able to reduce per well drilling and completion costs by approximately 35%. We believe we can achieve even lower costs in the future, but believe that at current drilling and completion cost levels and with currently prevailing commodity prices, we can achieve reasonable well-level rates of return. Should commodity prices weaken further, our operational flexibility will allow us to adjust our drilling and completion schedule, if prudent. If management believes the well-level internal rate of return will be at or below our weighted-average cost of capital, we may choose to delay completions and/or forego drilling altogether.
During the twelve months ended August 31, 2015, we drilled 44 and completed 38 horizontal wells. This included drilling 20 “standard length” (approximately 4,200-foot lateral length) horizontal wells targeting the various benches of the Niobrara formation, and 15 standard length wells targeting the Codell formation. We drilled three “mid-length” (approximately 7,000-foot lateral length) horizontal Niobrara wells and one mid-length horizontal Codell well. In addition, we drilled four “extended length” (approximately 9,600-foot lateral length) horizontal wells, all of which targeted the Niobrara formation.
During fiscal 2015, we completed 20 Niobrara horizontal wells and 18 Codell horizontal wells. As of August 31, 2015, there are 21 horizontal wells in various stages of completion, comprised of 13 standard length, 4 mid-length, and 4 extended length wells.
Other Operations
We continue to be opportunistic with respect to acquisition efforts. We continue to enter into land and working interest swaps to increase our overall leasehold control. During the year ended August 31, 2015, we consummated several asset and acreage swaps, resulting in a higher working interest in several of our operated pads as well as a higher working interest in yet-to-be-developed leaseholds.
40
In our North East Extension Area, we drilled an exploratory well targeting the Greenhorn formation. As of August 31, 2015, this well was in the process of being completed. Initial results from the well are expected in the coming months.
In western Nebraska, we have entered into a joint exploration agreement with a Denver-based private operating company to drill up to ten wells in an AMI covering approximately 8,000 acres.
In Yuma and Washington Counties, Colorado, we maintain leases covering over 63,000 net acres in an area that has historically produced dry gas from the Niobrara formation. We continue to evaluate the economics of this play to determine when or if it might be economic to develop further.
Production
Our production increased from 4,290 BOED for the fiscal year ended August 31, 2014 to 8,750 BOED for the fiscal year ended August 31, 2015. The additional production volumes from recently completed wells more than offset the natural decline of our existing wells. The increase was achieved despite continuing mid-stream constraints, high line pressures in the northern portion of the Wattenberg Field, and the temporary suspension of production from shut-in wells due to offset operator completion activities.
Market Conditions
Market prices for our products significantly impact our revenues, net income, and cash flow. The market prices for crude oil and natural gas are inherently volatile. To provide historical perspective, the following table presents the average annual NYMEX prices for oil and natural gas for each of the last five fiscal years.
Years Ended August 31, | |||||||||||||||||||
2015 | 2014 | 2013 | 2012 | 2011 | |||||||||||||||
Average NYMEX prices | |||||||||||||||||||
Oil (per Bbl) | $ | 60.65 | $ | 100.39 | $ | 94.58 | $ | 94.88 | $ | 91.79 | |||||||||
Natural gas (per Mcf) | $ | 3.12 | $ | 4.38 | $ | 3.55 | $ | 2.82 | $ | 4.12 | |||||||||
For the periods presented in this report, the following table presents the Reference Price (derived from average NYMEX prices weighted to reflect monthly sales volumes) as well as the differential between the Reference Price and the wellhead prices realized by us.
Fiscal Years Ended August 31, | |||||||||||
2015 | 2014 | 2013 | |||||||||
Oil (NYMEX WTI) | |||||||||||
Average NYMEX Price | $ | 60.65 | $ | 100.39 | $ | 94.58 | |||||
Realized Price | $ | 50.75 | $ | 89.98 | $ | 85.95 | |||||
Differential | $ | (9.90 | ) | $ | (10.41 | ) | $ | (8.63 | ) | ||
Gas (NYMEX Henry Hub) | |||||||||||
Average NYMEX Price | $ | 3.12 | $ | 4.38 | $ | 3.55 | |||||
Realized Price | $ | 3.39 | $ | 5.21 | $ | 4.75 | |||||
Differential | $ | 0.27 | $ | 0.83 | $ | 1.20 | |||||
Market conditions in the Wattenberg Field require us to sell oil at prices less than the prices posted by the NYMEX. The negative differential between the prices actually received by us at the wellhead and the published indices reflects deductions imposed upon us by the purchasers for location and quality adjustments. We continue to negotiate with crude oil purchasers to obtain better differentials. With regard to the sale of natural gas and liquids, we are able to sell production at prices greater than the prices posted for dry gas, primarily because prices we receive include payment for the natural gas liquids produced with the gas.
41
There has been a significant decline in the price of oil since the summer of 2014. As reflected in published data, the price for WTI oil settled at $95.96 per Bbl on Friday, August 29, 2014, the last trading day of our 2014 fiscal year. Subsequently, the price of WTI declined 60%, to a low of $38.24 per Bbl on Monday, August 24, 2015. The price of oil settled at $49.20 per Bbl on Monday, August 31, 2015, the last trading day of our 2015 fiscal year, down 49% from the end of our 2014 fiscal year. Our revenues, results of operations, profitability and future growth, and the carrying value of our oil and natural gas properties, depend primarily on the prices we receive for our oil and natural gas production.
A further decline in oil and natural gas prices will adversely affect our financial condition and results of operations. Furthermore, low oil and natural gas prices can result in an impairment of the value of our properties and the calculation of the “ceiling test” required under the accounting principles for companies following the “full cost” method of accounting. Our ceiling tests resulted in a total impairment charge of $16.0 million in our 2015 fiscal year, and additional impairments may occur in the future.
Results of Operations
Material changes of certain items in our statements of operations included in our financial statements for the periods presented are discussed below.
For the year ended August 31, 2015, compared to the year ended August 31, 2014
For the year ended August 31, 2015, we reported net income of $18.0 million compared to net income of $28.9 million during the year ended August 31, 2014. Net income per basic and diluted share were $0.19 and $0.19, respectively, for our 2015 fiscal year compared to earnings per share of $0.38 and $0.37 per basic and diluted share for the 2014 fiscal year. Revenues increased $20.6 million during the year ended August 31, 2015 compared to the year ended August 31, 2014 due to rapid growth production as discussed above. As of August 31, 2015, we had 582 gross producing wells, compared to 404 gross producing wells as of August 31, 2014. However, although our production more than doubled during the comparable periods, our revenues during the 2015 period increased only 20% as a result of declining oil and gas prices. The impact of changing prices on our commodity derivative positions also drove significant differences in our results of operations between the two periods.
Oil and Gas Production and Revenues - For the year ended August 31, 2015 we recorded total oil and gas revenues of $124.8 million compared to $104.2 million for the year ended August 31, 2014, an increase of $20.6 million or 20%.
Year over year, we added 48 net horizontal wells, including 3 (net) Bayswater horizontal wells, increasing our reserves, producing wells and daily production totals. Net oil and gas production for the year ended August 31, 2015 averaged 8,750 BOED, an increase of 104% over average production of 4,290 BOED in the year ended August 31, 2014. When the price of oil declined in 2014, we temporarily postponed the final completion of certain wells under development. With the exception of one pad, all of the temporarily delayed wells commenced production during the third and fourth quarters of fiscal 2015.
Our revenues are sensitive to changes in commodity prices. As shown in the following table, there has been a decrease of 41% in average realized prices between the periods presented. This decline in average sales prices mostly offset the effects of increased production. The following table presents actual realized prices, without the effect of commodity derivative transactions. The impact of commodity derivative transactions is presented later in this discussion.
42
Key production information is summarized in the following table:
Years Ended August 31, | ||||||||||
2015 | 2014 | Change | ||||||||
Production: | ||||||||||
Oil (MBbls) | 1,970 | 941 | 109 | % | ||||||
Gas (MMcf) | 7,344 | 3,747 | 96 | % | ||||||
Total production in MBOE | 3,194 | 1,566 | 104 | % | ||||||
Revenues (in thousands): | ||||||||||
Oil | $ | 99,969 | $ | 84,693 | 18 | % | ||||
Gas | 24,874 | 19,526 | 27 | % | ||||||
$ | 124,843 | $ | 104,219 | 20 | % | |||||
Average sales price: | ||||||||||
Oil | $ | 50.75 | $ | 89.98 | -44 | % | ||||
Gas | $ | 3.39 | $ | 5.21 | -35 | % | ||||
BOE | $ | 39.09 | $ | 66.56 | -41 | % | ||||
Lease Operating Expenses (“LOE”) - Direct operating costs of producing oil and natural gas are reported as follows (in thousands):
Year Ended August 31, | |||||||
2015 | 2014 | ||||||
Production costs | $ | 13,879 | $ | 7,794 | |||
Workover | 1,138 | 197 | |||||
Total LOE | $ | 15,017 | $ | 7,991 | |||
Per BOE: | |||||||
Production costs | $ | 4.35 | $ | 4.98 | |||
Workover | 0.35 | 0.12 | |||||
Total LOE | $ | 4.70 | $ | 5.10 | |||
Lease operating and workover costs tend to increase or decrease primarily in relation to the number of wells in production, and, to a lesser extent, on fluctuation in oil field service costs and changes in the production mix of crude oil and natural gas. During our 2015 fiscal year, we experienced decreased production costs per BOE primarily as a result of increased production. Partially offsetting this decline in costs was increased costs resulting from intermittent midstream restrictions that reduced the efficiency and capacity of the gas gathering system. We continue to work diligently to mitigate production difficulties in the Wattenberg Field.
Production taxes - During the year ended August 31, 2015, production taxes were $11.3 million, or $3.55 per BOE, compared to $9.7 million, or $6.17 per BOE, during the prior year. Taxes tend to increase or decrease primarily based on the value of oil and gas sold. As a percent of revenues, taxes were 9.1% and 9.3% for the years ended August 31, 2015 and 2014, respectively.
43
Depletion, Depreciation, Accretion, and Amortization (“DDA”) - The following table summarizes the components of DDA:
Year Ended August 31, | |||||||
(in thousands) | 2015 | 2014 | |||||
Depletion of oil and gas properties | $ | 65,158 | $ | 32,132 | |||
Depreciation, accretion, and amortization | 711 | 826 | |||||
Total DDA | $ | 65,869 | $ | 32,958 | |||
DDA expense per BOE | $ | 20.62 | $ | 21.05 | |||
For the year ended August 31, 2015, depletion of oil and gas properties was $20.62 per BOE compared to $21.05 per BOE for the year ended August 31, 2014. The decrease in the DDA rate was the result of a decrease in the ratio of total costs capitalized in the full cost pool to the estimated recoverable reserves. Capitalized costs of proved oil and gas properties are depleted quarterly using the units-of-production method based on estimated reserves, wherein the ratio of production volumes for the quarter to beginning-of-quarter estimated total reserves determine the depletion rate. Since DDA expense represents amortization of historical costs, our recently implemented reductions in well costs are not fully reflected in the rate.
Full cost ceiling impairment - During the year ended August 31, 2015, we recognized a total impairment of $16.0 million, representing the amount by which the net capitalized costs of our oil and gas properties exceeded our full cost ceiling. See “Oil and Gas Properties, including Ceiling Test,” included in the discussion of Critical Accounting Policies below.
General and Administrative (“G&A”) - The following table summarizes G&A expenses incurred and capitalized during the periods presented:
Years Ended August 31, | |||||||
(in thousands) | 2015 | 2014 | |||||
G&A costs incurred | $ | 21,044 | $ | 11,369 | |||
Capitalized costs | (2,049 | ) | (1,230 | ) | |||
Total G&A | $ | 18,995 | $ | 10,139 | |||
G&A Expense per BOE | $ | 5.95 | $ | 6.48 | |||
G&A includes all overhead costs associated with employee compensation and benefits, insurance, facilities, professional fees, and regulatory costs, among others. In an effort to minimize overhead costs, we employ a total staff of 36 employees and use consultants, advisors, and contractors to perform certain tasks when it is cost effective.
Although G&A costs have increased as we grow the business, we strive to maintain an efficient overhead structure. For the year ended August 31, 2015, G&A was $5.95 per BOE compared to $6.48 per BOE for the year ended August 31, 2014.
Our G&A expense for the year ended August 31, 2015 includes stock-based compensation of $7.7 million compared to $3.0 million for the year ended August 31, 2014. Stock-based compensation includes a calculated value for stock options or shares of common stock that we grant for compensatory purposes. It is a non-cash charge, which, for stock options, is calculated using the Black-Scholes-Merton option pricing model to estimate the fair value of options. Amounts are pro-rated over the vesting terms of the option agreements, which are generally three to five years.
Pursuant to the requirements under the full cost accounting method for oil and gas properties, we identify all general and administrative costs that relate directly to the acquisition of undeveloped mineral leases and the development of properties. Those costs are reclassified from G&A expenses and capitalized into the full cost pool. The increase in capitalized costs from 2014 to 2015 reflects our increasing activities to acquire leases and develop the properties.
Commodity derivative gains (losses) - As more fully described in the paragraphs titled “Oil and Gas Commodity Contracts” located in “Liquidity and Capital Resources,” we use commodity contracts to mitigate the risks inherent in the price volatility of oil and natural gas. For the year ended August 31, 2015, we realized a cash settlement gain of $30.5 million, including gains of
44
$10.0 million from the settlement of contracts at their scheduled maturity dates and gains of $20.5 million from the early liquidation of “in-the-money” contracts. For the prior year, we realized a cash settlement loss of $2.1 million.
In addition, for the year ended August 31, 2015, we recorded an unrealized gain of $1.8 million to recognize the mark-to-market change in fair value of our commodity contracts for the year ended August 31, 2015. In comparison, in the year ended August 31, 2014, we reported an unrealized gain of $2.5 million. Unrealized gains are non-cash items.
Income taxes - We reported income tax expense of $11.7 million for the twelve months ended August 31, 2015, calculated at an effective tax rate of 39%. During the comparable prior year period, we reported income tax expense of $15.0 million, calculated at an effective tax rate of 34%. For both periods, it appears that the tax liability will be substantially deferred into future years. During both fiscal years the effective tax rate differed from the federal and state statutory rate primarily by the impact of deductions for percentage depletion.
For tax purposes, we have a net operating loss (“NOL”) carryover of $21.3 million, which is available to offset future taxable income. The NOL will begin to expire, if not used, in 2031.
Each year, management evaluates all the positive and negative evidence regarding our tax position and reaches a conclusion on the most likely outcome. During 2015 and 2014, we concluded that it was more likely than not that we would be able to realize a benefit from the net operating loss carryforward, and have therefore included it in our inventory of deferred tax assets.
For the year ended August 31, 2014, compared to the year ended August 31, 2013
For the year ended August 31, 2014, we reported net income of $28.9 million compared to net income of $9.6 million for the twelve months ended August 31, 2013. Earnings per basic and diluted share were $0.38 per basic and $0.37 per diluted share for the year ended August 31, 2014 compared to $0.17 per basic and $0.16 per diluted share during the same period one year prior. Rapid growth in production and the impact of changing prices on our commodity derivative positions drove this increase. The significant variances between the two years were primarily caused by increased revenues and expenses associated with production from 31 new horizontal wells and the acquisition of producing properties included in the Trilogy and Apollo transactions. The following discussion expands upon significant items that affected results of operations.
Oil and Gas Production and Revenues - For the year ended August 31, 2014, we recorded total oil and gas revenues of $104.2 million compared to $46.2 million for the year ended August 31, 2013, an increase of $58.0 million or 125%.
As of August 31, 2014, we owned interests in 404 producing wells. Net oil and gas production averaged 4,290 BOED in fiscal 2014, compared to 2,117 BOED for 2013, a year-over-year increase of 103%. The significant increase in production from the prior year reflects our increased well count and shift to horizontal wells.
Our rate of growth was even more pronounced at the end of our 2014 fiscal year. During the fourth quarter of 2014, we completed 15 new horizontal wells. Production for the fourth fiscal quarter of 2014 averaged 5,894 BOED.
Our revenues are sensitive to changes in commodity prices. As shown in the following table, there was an increase of 11% in average realized sales prices between 2013 and 2014. The following table presents actual realized prices, without the effect of commodity derivative transactions. The impact of derivative transactions is presented later in this discussion.
45
Key production information is summarized in the following table:
Years Ended August 31, | ||||||||||
2014 | 2013 | Change | ||||||||
Production: | ||||||||||
Oil (MBbls) | 941 | 421 | 123.5 | % | ||||||
Gas (MMcf) | 3,747 | 2,108 | 77.8 | % | ||||||
Total production in MBOE | 1,566 | 773 | 102.6 | % | ||||||
Revenues (in thousands): | ||||||||||
Oil | $ | 84,693 | $ | 36,206 | 133.9 | % | ||||
Gas | 19,526 | 10,017 | 94.9 | % | ||||||
$ | 104,219 | $ | 46,223 | 125.5 | % | |||||
Average sales price: | ||||||||||
Oil | $ | 89.98 | $ | 85.95 | 4.7 | % | ||||
Gas | $ | 5.21 | $ | 4.75 | 9.7 | % | ||||
BOE | $ | 66.56 | $ | 59.83 | 11.2 | % | ||||
LOE and Production Taxes - Direct operating costs of producing oil and natural gas and taxes on production and properties are reported as lease operating expenses as follows (in thousands):
Years Ended August 31, | |||||||
2014 | 2013 | ||||||
Production costs | $ | 7,794 | $ | 3,198 | |||
Workover | 197 | 219 | |||||
Total LOE | $ | 7,991 | $ | 3,417 | |||
Per BOE: | |||||||
Production costs | $ | 4.98 | $ | 4.14 | |||
Workover | 0.12 | 0.28 | |||||
Total LOE | 5.10 | 4.42 | |||||
From 2013 to 2014, we experienced an increase in production cost per BOE in connection with additional costs to bolster output from some of our older wells as well as additional costs to operate horizontal wells. We continue to work diligently to mitigate production difficulties within the Wattenberg Field. Additional wellhead compression was added at some well locations and older equipment was replaced or refurbished. During 2014, we incurred additional costs related to the integration of newly acquired producing properties. In particular, the acquisition of a disposal well in one of the acquisitions added to our average cost per BOE, as the disposal well had a slightly different cost profile than our other wells. As expected, horizontal wells are more costly to operate than vertical wells, especially during the early stages of production. Finally, costs incurred to comply with new environmental regulations were significant.
Production taxes - During the year ended August 31, 2014, production taxes were $9.7 million, or $6.17 per BOE, compared to $4.2 million or $5.48 per BOE during the year ended August 31, 2013. Taxes make up the largest single component of direct costs and tend to increase or decrease primarily based on the value of oil and gas sold. As a percentage of revenues, taxes averaged 9.3% in 2014 and 9.2% in 2013.
46
DDA - The following table summarizes the components of DDA:
Years ended August 31, | |||||||
(in thousands) | 2014 | 2013 | |||||
Depletion of oil and gas properties | $ | 32,132 | $ | 13,046 | |||
Depreciation, accretion, and amortization | 826 | 290 | |||||
Total DDA | $ | 32,958 | $ | 13,336 | |||
DDA expense per BOE | $ | 21.05 | $ | 17.26 | |||
For the year ended August 31, 2014, depletion of oil and gas properties was $21.05 per BOE compared to $17.26 for the year ended August 31, 2013. The increase in the DDA rate was the result of an increase in both the ratio of reserves produced and the total costs capitalized in the full cost pool. Capitalized costs of evaluated oil and gas properties are depleted quarterly using the units-of-production method based on estimated reserves, wherein the ratio of production volumes for the quarter to beginning of quarter estimated total reserves determine the depletion rate. For fiscal year 2014, production represented 4.6% of our reserve base compared to 5.2% for the year ended August 31, 2013. A contributing factor to the change in the ratio was the inclusion of additional horizontal wells in the calculation.
In addition to a change in the ratio of production to EUR, our DDA rate was affected by the increasing costs of mineral leases, included as proven properties, and the costs associated with the acquisition of producing properties. Leasing costs in the D-J Basin continue to increase with the success of horizontal development. For acquisition of producing properties, substantially all of the costs are allocated to proved reserves and included in the full cost pool. The allocation of the purchase price related to the November 2013 Trilogy and Apollo acquisitions was at a higher cost per BOE than our historical cost of acquiring leaseholds and developing our properties. Therefore, the increase in the ratio of costs subject to amortization to the reserves acquired is greater than our internally developed properties.
G&A - The following table summarizes G&A expenses incurred and capitalized during the periods presented:
Years Ended August 31, | |||||||
(in thousands) | 2014 | 2013 | |||||
G&A costs incurred | $ | 11,369 | $ | 6,325 | |||
Capitalized costs | (1,230 | ) | (637 | ) | |||
Total G&A | $ | 10,139 | $ | 5,688 | |||
G&A Expense per BOE | $ | 6.48 | $ | 7.36 | |||
G&A includes all overhead costs associated with employee compensation and benefits, insurance, facilities, professional fees, and regulatory costs, among others. For the fiscal year ended August 31, 2014, G&A was $6.48 per BOE compared to $7.36 for the fiscal year ended August 31, 2013, primarily as a result of the increase in BOE produced during fiscal 2014. Our G&A expense for fiscal 2014 includes stock-based compensation of $3.0 million, compared to $1.4 million in 2013.
The increase in capitalized costs from 2013 to 2014 reflects our increasing activities to acquire leases and develop the properties.
Other Income (Expense) - Neither interest expense nor interest income had a significant impact on our results of operations for fiscal 2014 or 2013. The interest costs that we incurred under our credit facility were eligible for capitalization into the full cost pool. We capitalize interest costs that are related to the cost of assets during the period of time before they are placed into service.
Commodity derivative gains (losses) - In the year ended August 31, 2014, we realized a cash settlement loss of $2.1 million related to contracts that settled during the period. For the year ended August 31, 2013, we realized a cash settlement loss of $0.4 million.
In addition, we recorded an unrealized gain of $2.5 million to recognize the mark-to-market change in fair value of our
47
futures contracts for the year ended August 31, 2014. In comparison, in the year ended August 31, 2013 we reported an unrealized loss of $2.6 million.
Income Taxes - We reported income tax expense of $15.0 million for the fiscal year ended August 31, 2014, calculated at an effective tax rate of 34%. During the comparable prior year, we reported income tax expense of $6.9 million, calculated at an effective tax rate of 42%. For both periods, it appears that the tax liability will be substantially deferred into future years. During fiscal year 2014, the effective tax rate was reduced from the federal and state statutory rate by the impact of deductions for percentage depletion.
During 2014 and 2013, we concluded that it was more likely than not that we would be able to realize a benefit from the net operating loss carryforward, and have therefore included it in our inventory of deferred tax assets.
Liquidity and Capital Resources
Historically, our primary sources of capital have been net cash provided by the sale of equity and debt securities, cash flow from operations, proceeds from the sale of properties, and borrowings under bank credit facilities. Our primary use of capital has been for the exploration, development and acquisition of oil and natural gas properties. Our future success in growing proved reserves and production will be highly dependent on capital resources available to us.
We believe our capital resources, including cash on hand, amounts available under our revolving credit facility, and cash flow from operating activities, will be sufficient to fund our planned capital expenditures and operating expenses for the next twelve months. To the extent actual operating results differ from our anticipated results, or available borrowings under our credit facility are reduced, or we experience other unfavorable events, our liquidity could be adversely impacted. Terms of future financings may be unfavorable and we cannot assure investors that funding will be available on acceptable terms.
As operator of the majority of our wells and undeveloped acreage, we control the timing and selection of new wells to be drilled or existing wells to be recompleted. This allows us to modify our capital spending as our financial resources allow and market conditions support. Additionally, our relatively low utilization of debt enhances our financial flexibility as it provides a potential source of future liquidity while currently not burdening us with restrictive financial covenants and mandatory repayment schedules.
Sources and Uses
Our sources and uses of capital are heavily influenced by the prices we receive for our production. Over the past year, the NYMEX-WTI oil price ranged from a high of $95.96 per Bbl on Friday, August 29, 2014, the last day of our 2014 fiscal year, to a low during the 2015 fiscal year of $38.24 per Bbl, while the NYMEX-Henry Hub natural gas price ranged from a high of $4.49 per MMBtu to a recent low of $2.48 per MMBtu. These markets will likely continue to be volatile in the future. To deal with the volatility in commodity prices, we maintain a flexible capital investment program and seek to maintain a high operating interest in our leaseholds with limited long-term capital commitments. This enables us to accelerate or decelerate our activities quickly in response to changing industry environments. Additionally, we believe our conservative use of leverage and corresponding strong balance sheet helps mitigate the impact of lower commodity prices.
At August 31, 2015, we had cash and cash equivalents of $133.9 million and an outstanding balance of $78 million under our revolving credit facility. Our sources and (uses) of funds for the twelve months ended August 31, 2015, 2014, and 2013 are summarized below (in thousands):
For the years ended August 31, | |||||||||||
2015 | 2014 | 2013 | |||||||||
Cash provided by operations | $ | 125,087 | $ | 74,905 | $ | 32,120 | |||||
Acquisitions and development of oil and gas properties and equipment | (275,808 | ) | (155,602 | ) | (80,469 | ) | |||||
Short-term investments | — | 60,018 | (60,000 | ) | |||||||
Cash provided by other investing activities | 6,239 | 704 | — | ||||||||
Cash provided by equity financing activities | 204,953 | 35,265 | 74,528 | ||||||||
Net borrowings on Revolver | 38,684 | — | 34,000 | ||||||||
Net increase in cash and equivalents | $ | 99,155 | $ | 15,290 | $ | 179 | |||||
48
Net cash provided by operations has improved during each of the last three years. The significant improvement reflects the operating contribution from new wells that were drilled and producing wells that were acquired. The increase in net cash provided by operations allowed us to become less reliant on equity sales for financing our capital expenditures in fiscal 2015.
Net cash provided by operating activities was $125.1 million and $74.9 million for the years ended August 31, 2015 and 2014, respectively. The significant improvement in cash from operating activities reflects the operating contribution from new wells that were drilled and producing wells that were acquired.
During the year ended August 31, 2015, we received cash proceeds from the following financing activities:
• | $15.4 million from the exercise of Series C warrants. As of August 31, 2015, all Series C warrants had been exercised. |
• | Approximately $190.8 million (after underwriting discounts, commissions and expenses) from our public offering of 18,613,952 shares (including the shares sold pursuant to an over-allotment option exercised by the underwriters) at a price to the public of $10.75 per share. These proceeds have been, or will be, used to fund additional asset acquisitions in the Wattenberg Field which may become available from time to time, to pay down outstanding indebtedness under our revolving credit facility and for other corporate purposes, including working capital. |
• | Net proceeds of $38.7 million drawn under our revolving credit facility. |
Credit Arrangements
We maintain a borrowing arrangement with a banking syndicate. The arrangement, in the form of a revolving credit facility, was most recently amended with the Sixth Amendment to the credit facility on June 2, 2015. The arrangement provides for a maximum loan commitment of $500 million; however, the maximum amount we can borrow at any one time is subject to a borrowing base limitation, which stipulates that we may borrow up to the lesser of the maximum loan commitment or the borrowing base. The borrowing base can increase or decrease based upon the value of the collateral, which secures any amounts borrowed under the line of credit. The value of the collateral will generally be derived with reference to the estimated future net cash flows from our proved oil and gas reserves, discounted by 10%. Amounts borrowed under the facility are secured by substantially all of our producing wells and developed oil and gas leases.
As of August 31, 2015, our borrowing base was $163 million and we had $78 million outstanding under the facility. The maturity date of the facility is December 15, 2019.
Interest on our revolving line of credit accrues at a variable rate, which will equal or exceed the minimum rate of 2.5%. The interest rate pricing grid contains a graduated escalation in applicable margin for increased utilization.
Reconciliation of Cash Payments to Capital Expenditures
Capital expenditures reported in the statement of cash flows are calculated on a strict cash basis, which differs from the accrual basis used to calculate other amounts reported in our financial statements. Specifically, cash payments for acquisition of property and equipment as reflected in the statement of cash flows excludes non-cash capital expenditures and includes an adjustment (plus or minus) to reflect the timing of when the capital expenditure obligations are incurred and when the actual cash payment is made. On the accrual basis, capital expenditures totaled $304.9 million and $214.0 million for the years ended August 31, 2015 and 2014, respectively. A reconciliation of the differences between cash payments and the accrual basis amounts is summarized in the following table (in thousands):
For the years ended August 31, | |||||||||||
2015 | 2014 | 2013 | |||||||||
Cash payments for capital expenditures | $ | 275,808 | $ | 155,602 | $ | 80,469 | |||||
Accrued costs, beginning of period | (71,849 | ) | (25,491 | ) | (5,733 | ) | |||||
Accrued costs, end of period | 33,072 | 71,849 | 25,491 | ||||||||
Non-cash acquisitions, common stock | 60,221 | 11,184 | 16,684 | ||||||||
Other | 7,622 | 905 | 1,233 | ||||||||
Accrual basis capital expenditures | $ | 304,874 | $ | 214,049 | $ | 118,144 | |||||
49
Capital Expenditures
The majority of capital expenditures during our 2015 fiscal year were associated with the acquisition of the Bayswater assets, including goodwill and deferred taxes, and the costs of drilling and completing wells that we operate. As of August 31, 2015, we had drilled, completed and brought into productive status 38 wells in our 2015 drilling program. In addition, we had drilled 21 gross (17 net) wells that had not been brought into productive status. All of the wells in progress are scheduled to commence production before August 31, 2016.
With respect to our ownership interest in wells operated by other companies, we participated in drilling and completion activities on 38 gross (4 net) wells.
Capital Requirements
Our primary need for cash will be to fund our drilling and acquisition programs for our 2016 fiscal year. Our cash requirements have increased significantly since May 2013, when we implemented our horizontal drilling program. However, as commodity prices have dropped, we have negotiated lower costs from our service providers and have revised our completion design. Accordingly, we currently anticipate that the standard-length horizontal wells to be drilled in 2016 will cost between $2.5 million and $3.0 million each as compared to fiscal year 2015 costs of $2.5 million to $3.8 million.
Our preliminary capital expenditure plan for fiscal 2016 contemplates utilizing one drilling rig and provides for spending of $115 million to $135 million for drilling, completion and leasing activities. We are planning to drill 32 to 35 gross operated horizontal wells, including 18 gross extended reach lateral wells. In order to maximize the efficient use of our capital, we have reduced the amount of our working interests in wells operated by others, primarily by executing leasehold swaps. We currently anticipate participating in two to four net, standard length equivalent, non-operated wells at an estimated cost of $2.7 million to $3.5 million per well. Finally, leasing and other activities are planned at $10 million to $15 million. As has been our historical practice, we regularly review capital expenditures throughout the year and will adjust our investments based on changes in commodity prices, service costs and drilling success. Our level of exploration, development and acreage expenditures is largely discretionary and the amount of funds devoted to any particular activity may increase or decrease significantly depending on available opportunities, commodity prices, cash flows and development results, among other factors.
We plan to generate profits by producing oil and natural gas from wells that we drill or acquire. For the near term, we believe that we have sufficient liquidity to fund our needs through cash on hand, cash flow from operations, proceeds from the exercise of warrants, and additional borrowings available under our revolving credit facility. However, to meet all of our long-term goals, we may need to raise some of the funds required to drill new wells through the sale of our securities, from our revolving credit facility or from third parties willing to pay our share of drilling and completing the wells. We may not be successful in raising the capital needed to drill or acquire oil or gas wells. Any wells which may be drilled by us may not produce oil or gas in commercial quantities.
Oil and Gas Commodity Contracts
We use derivative contracts to protect against the variability in cash flows created by short-term price fluctuations associated with the sale of future oil and gas production. We typically enter into contracts covering between 45% and 85% of anticipated production from our proved developed producing reserves, as projected in our most recent semi-annual reserve report, for a period of 24 months. At October 1, 2015, we had open positions covering 0.7 million barrels of oil and 3,036 MMcf of natural gas. We do not use derivative instruments for speculative purposes.
Our commodity derivative instruments may include but are not limited to “collars,” “swaps,” and “put” positions. Our derivative strategy, including the volume amounts, whether we invest in oil and/or natural gas, and at what prices we invest, is based in part on our view of expected future market conditions and our analysis of well-level economic return potential. In addition, our use of derivative contracts is subject to stipulations set forth in our credit facility.
During periods of significant price declines, for settled contracts structured as “collars,” we will receive settlement payments from the contracts’ counterparties for the difference between the contracted “floor” price and the average posted price for the contract period. For settled “swaps,” we will receive the difference between the contracted swap price and the average posted price for the contract period, if lower. For settled “put” contracts, we will receive the difference between the put’s strike price and the average posted price for the contract period. If we decide to liquidate an “in-the-money” position prior to settlement date, we will receive the approximate fair value of the contract at that time. These realized gains increase our cash flows for the period in which they are recognized.
50
Conversely, during periods of significant price increases, upon settlement we would be obligated to pay the counterparties the difference between the contract’s “ceiling” and/or swap price and the average posted price for the contract period. If liquidated prior to settlement, we would pay the approximate fair market value to close the position at that time. Losses associated with puts that expire out-of-the-money are simply the original premium paid for the contract and are recognized upon expiration. These realized losses reduce our cash flows for the period in which they are recognized.
The fair values of our open, but not yet settled, derivative contracts are estimated by obtaining independent market quotes, as well as using industry standard models that consider various assumptions, including quoted forward prices for commodities, risk-free interest rates, and estimated volatility factors, as well as other relevant economic measures. We compare the valuations calculated by us to valuations provided by the counterparties to assess the reasonableness of each valuation. The discount rate used in the fair values of these instruments includes a measure of nonperformance risk by the counterparty or us, as appropriate.
The mark-to-market fair value of the open commodity derivative contracts will generally be inversely related to the price movement of the underlying commodity. If commodity price trends reverse from period to period, prior unrealized gains may become unrealized losses and vice versa. Higher underlying commodity price volatility will generally lead to higher volatility in our unrealized gains and losses and by association, the fair value of our commodity derivative contracts. These unrealized gains and losses will also impact our net income in the period recorded.
We do not designate our commodity contracts as accounting hedges. Accordingly, we use mark-to-market accounting to value the portfolio at the end of each reporting period. Mark-to-market accounting can create non-cash volatility in our reported earnings during periods of commodity price volatility. We have experienced such volatility in the past and are likely to experience it in the future. Mark-to-market accounting treatment results in volatility of our results as unrealized gains and losses from derivatives are reported. As commodity prices increase or decrease, such changes will have an opposite effect on the mark-to-market value of our derivatives. Gains on our derivatives generally indicate lower wellhead revenues in the future while losses indicate higher future wellhead revenues.
During the year ended August 31, 2015, we reported an unrealized commodity activity gain of $1.8 million. Unrealized gains and losses are non-cash items. We also reported a realized gain of $30.5 million, representing the cash settlement cost for contracts settled during the period and amortization of cash premiums paid for commodity contracts.
At August 31, 2015, we estimated that the fair value of our various commodity derivative contracts was a net asset of $4.5 million. We value these contracts using fair value methodology that considers various inputs including a) quoted forecast prices, b) time value, c) volatility factors, d) counterparty risk, and e) other relevant factors. The fair value of these contracts as estimated at August 31, 2015 may differ significantly from the realized values at their respective settlement dates.
Our commodity derivative contracts as of October 10, 2015 are summarized below:
Volumes | Average Collar Prices (1) | Average Put Prices (1) | ||||||||||
Month | Oil (Bbl) | Gas (MMBtu) | Average Oil (Bbl) Price | Average Gas (MMBtu) Price | Average Oil (Bbl) Price | Average Gas (MMBtu) Price | ||||||
Oct 1 to Dec 31, 2015 | 152,000 | 516,000 | N/A | $2.64 - $3.65 | $50.99 | N/A | ||||||
Jan 1 to Dec 31, 2016 | 420,000 | 1,680,000 | N/A | $3.03 - $3.47 | $48.57 | N/A | ||||||
Jan 1 to Aug 31, 2017 | 160,000 | 840,000 | N/A | $2.64 - $3.48 | $50.50 | N/A | ||||||
(1) Price is at NYMEX WTI and NYMEX Henry Hub.
51
Contractual Commitments
The following table summarizes our contractual obligations as of August 31, 2015 (in thousands):
Less than One Year | One to Three Years | Three to Five Years | More Than Five Years | Total | |||||||||||||||
Rig Contract(1) | $ | 2,340 | $ | — | $ | — | $ | — | $ | 2,340 | |||||||||
Volume commitments(2) | 11,626 | 45,272 | 45,272 | 11,010 | 113,180 | ||||||||||||||
Revolving credit facility(3) | 1,950 | 3,900 | 80,681 | — | 86,531 | ||||||||||||||
Operating Leases | 408 | 101 | — | — | 509 | ||||||||||||||
Total | $ | 16,324 | $ | 49,273 | $ | 125,953 | $ | 11,010 | $ | 202,560 | |||||||||
1 | Represents an estimate of the remaining commitment related to the use of one rig. Actual amounts will vary as a result of a number of variables, including target formations, measured depth, and other technical details. |
2 | We have entered into agreements that require us to deliver minimum amounts of crude oil to certain third parties through 2021. Production can be sourced via third party contract, in-kind agreements, or self-sustained production. We will incur a charge of approximately $5.56 per Bbl if a minimum quantity of crude oil is not delivered to the pipeline-related counterparties. Additionally, we may be subject to potential damages should we fail to deliver committed volumes to a third party refiner. Amounts reflect the estimated deficiency payments under our pipeline-related commitments assuming no deliveries are made. Potential damages and other charges related to nonperformance under these contracts are not included in the amounts above. See further discussion in Note 14 to our consolidated financial statements. |
3 | Includes interest payments assuming a constant interest rate of 2.5%. |
Off-Balance Sheet Arrangements
We do not have any off-balance sheet arrangements that have or are reasonably likely to have a current or future material effect on our financial condition, changes in financial condition, results of operations, liquidity or capital resources.
Non-GAAP Financial Measures
In addition to financial measures presented on the basis of accounting principles generally accepted in the United States of America ("US GAAP"), we present certain financial measures which are not prescribed by US GAAP ("non-GAAP"). A summary of these measures is described below.
Adjusted EBITDA
We use "adjusted EBITDA," a non-GAAP financial measure for internal managerial purposes, when evaluating period-to-period comparisons. This measure is not a measure of financial performance under US GAAP and should be considered in addition to, not as a substitute for, cash flows from operations, investing, or financing activities, nor as a liquidity measure or indicator of cash flows reported in accordance with US GAAP. The non-GAAP financial measure that we use may not be comparable to measures with similar titles reported by other companies. Also, in the future, we may disclose different non-GAAP financial measures in order to help our investors more meaningfully evaluate and compare our future results of operations to our previously reported results of operations. We strongly encourage investors to review our financial statements and publicly filed reports in their entirety and to not rely on any single financial measure.
We define adjusted EBITDA as net income adjusted to exclude the impact of interest expense, interest income, income tax expense, DDA, ceiling test impairments, stock-based compensation, and the plus or minus change in fair value of derivative assets or liabilities. We believe adjusted EBITDA is relevant because it is a measure of cash flow available to fund our capital expenditures and service our debt and because similar measures are widely used in our industry.
52
The following table presents a reconciliation of adjusted EBITDA, a non-GAAP financial measure, to net income, its nearest GAAP measure:
Years Ended August 31, | |||||||||||
2015 | 2014 | 2013 | |||||||||
Adjusted EBITDA: | |||||||||||
Net income | $ | 18,042 | $ | 28,853 | $ | 9,581 | |||||
Depreciation, depletion and amortization | 65,869 | 32,958 | 13,336 | ||||||||
Full cost ceiling impairment | 16,000 | — | — | ||||||||
Provision for income tax | 11,677 | 15,014 | 6,870 | ||||||||
Stock-based compensation | 7,691 | 2,968 | 1,362 | ||||||||
Commodity derivative change | (1,790 | ) | (2,459 | ) | 2,649 | ||||||
Interest expense (income) | 159 | (82 | ) | 50 | |||||||
Adjusted EBITDA | $ | 117,648 | $ | 77,252 | $ | 33,848 | |||||
PV-10
PV-10 is a non-GAAP financial measure. We believe that the presentation of PV-10 is relevant and useful to investors because it presents the discounted future net cash flows attributable to our estimated net proved reserves prior to taking into account future corporate income taxes, and it is a useful measure for evaluating the relative monetary significance of our oil and natural gas properties. It is not intended to represent the current market value of our estimated reserves. PV-10 should not be considered in isolation or as a substitute for the standardized measure reported in accordance with US GAAP, but rather should be considered in addition to the standardized measure.
PV-10 is derived from the standardized measure, which is the most directly comparable GAAP financial measure. PV-10 is calculated using the same inputs and assumptions as the standardized measure, with the exception that it omits the impact of future income taxes. It is considered to be a pre-tax measurement.
The following table provides a reconciliation of the standardized measure to PV-10 at August 31, 2015, 2014, and 2013 (in thousands):
As of August 31, | |||||||||||
2015 | 2014 | 2013 | |||||||||
Standardized measure of discounted future net cash flows: | $ | 365,829 | $ | 402,699 | $ | 181,732 | |||||
Add: 10 percent annual discount, net of income taxes | 372,658 | 376,827 | 199,111 | ||||||||
Add: future undiscounted income taxes | 144,399 | 252,925 | 113,545 | ||||||||
Future pre-tax net cash flows | $ | 882,886 | $ | 1,032,451 | $ | 494,388 | |||||
Less: 10 percent annual discount, pre-tax | $ | (444,605 | ) | $ | (498,753 | ) | $ | (258,272 | ) | ||
PV-10 | $ | 438,281 | $ | 533,698 | $ | 236,116 | |||||
Trends and Outlook
Oil traded at $95.96 per Bbl on Friday, August 29, 2014, the last day of our 2014 fiscal year, but have since declined more than 60%. A continuing decline in oil and gas prices (i) will reduce our cash flow which, in turn, will reduce the funds available for exploring and replacing oil and gas reserves, (ii) will potentially reduce our current Revolver borrowing base capacity and increase the difficulty of obtaining equity and debt financing and worsen the terms on which such financing may be obtained, (iii) will reduce the number of oil and gas prospects which have reasonable economic returns, (iv) may cause us to allow leases to expire based upon the value of potential oil and gas reserves in relation to the costs of exploration, (v) may result in marginally productive oil and gas wells being abandoned as non-commercial, and (vi) may cause a ceiling test impairment. However, price declines reduce the competition for oil and gas properties and correspondingly reduce the prices paid for leases and prospects.
53
Other factors that will most significantly affect our results of operations include (i) activities on properties that we operate, (ii) the marketability of our production, (iii) our ability to satisfy our financial obligations, (iv) completion of acquisitions of additional properties and reserves, and (v) competition from larger companies. Our revenues will also be significantly impacted by our ability to maintain or increase oil or gas production through exploration and development activities.
Horizontal well development in the Wattenberg Field is still relatively new and the geology is enabling operators to utilize higher density drilling within designated spacing units. When we began our operated horizontal well development program in the Wattenberg Field, we allowed for up to 16 wells per 640 acre section, but we are now testing up to 24 horizontal wells per section.
The recent decline in commodity prices has led to a corresponding decline in service costs, which directly relate to our drilling and completion costs. On average, we have been able to reduce drilling and completion costs by approximately 35% per well during fiscal 2015 due to a combination of optimizing well designs, moving to day-rate drilling, lower contract rates for drilling rigs, and lower completion costs. This focus on cost reduction has supported well-level economics in spite of the severe price drop in crude oil and natural gas. We believe that at current drilling and completion cost levels and with current prevailing commodity prices, we can achieve reasonable well-level rates of return.
Our production continues to be adversely impacted by high natural gas gathering line pressures, especially in the northern area of the Wattenberg Field. This problem has persisted since 2012 and has grown along with the expansion of horizontal drilling in the area. High line pressure restricts our ability to produce crude oil and natural gas. As line pressures increase, it becomes more difficult to inject gas produced by our wells into gathering pipelines. When line pressure is greater than the operating pressure of our wellhead equipment, the wellhead equipment is unable to inject gas into the pipeline, and our production is restricted or shut-in. Since our wells produce a mixture of crude oil and natural gas, restrictions in gas production also restrict oil production.
Although various factors can cause increased line pressure, a significant factor in our area of the Wattenberg Field is the success of horizontal wells that have been drilled over the last several years. As new horizontal wells come on-line with increased pressures and volumes, they produce more gas than the gathering system was designed to handle. Once a pipeline is at capacity, pressures increase and older wells with less natural pressure are not able to compete with the new wells.
We are continuing our efforts to mitigate the adverse impact of high line pressures. Where it is cost effective, we install wellhead compression to enhance our ability to inject gas into the gathering system. Additionally, along with our midstream service provider, we are evaluating and in some instances installing larger gathering pipelines to our operated pads.
Over the longer term, midstream companies that operate the gas gathering pipelines have continued to make significant capital investments to increase system capacity. As publicly disclosed, DCP Midstream Partners (“DCP”), the principal third-party provider that we employ to gather production from our wells, brought online a 160 MMcf/d gas processing plant in La Salle, CO (the O’Connor plant), which is part of an eight-plant system owned by the DCP enterprise with approximately 600 MMcf/d capacity. DCP’s Lucerne II plant, northeast of Greeley in Weld County, is designed to operate with a maximum rated capacity of approximately 200 MMcf/d. The Lucerne II plant recently became fully operational and we believe this additional processing capacity has helped lower line pressures in the northern area of the Wattenberg Field where we have several operated pads and anticipate further completion activity in the near future. However, we do not know if this new capacity will completely mitigate the problem and it does not help alleviate increasing line pressures in the west and/or south portions of the field.
The success of horizontal drilling techniques in the D-J Basin has also significantly increased quantities of oil produced in the region. Local crude oil refineries do not have sufficient capacity to process all of the oil available and the imbalance of supply and demand is increasing the transportation of oil out of the D-J Basin via pipeline and rail. This imbalance has also impacted the prices paid by oil purchasers in the basin, leading to generally wider differentials between the wellhead prices we realize and the crude oil prices posted on NYMEX. However, as commodity prices have contracted and transportation options have increased, we anticipate price differentials may narrow in the coming quarters and we continue to explore various alternatives with other oil purchasers to ensure we realize the highest net prices available. In all cases, we believe we will continue to have sufficient take-away capacity for all of our oil production. Further details regarding posted prices and average realized prices are discussed in the section entitled “Market Conditions,” presented in this Item 7.
Other than the foregoing, we do not know of any trends, events or uncertainties that will have had or are reasonably expected to have a material impact on our sales, revenues, expenses, liquidity or capital resources.
Critical Accounting Policies
We prepare our financial statements and the accompanying notes in conformity with US GAAP, which requires management to make estimates and assumptions about future events that affect the reported amounts in the financial statements
54
and the accompanying notes. We identify certain accounting policies as critical based on, among other things, their impact on the portrayal of our financial condition, results of operations, or liquidity and the degree of difficulty, subjectivity, and complexity in their deployment. Critical accounting policies cover accounting matters that are inherently uncertain because the future resolution of such matters is unknown. Management routinely discusses the development, selection, and disclosure of each of the critical accounting policies.
Oil and Gas Reserves: Oil and gas reserves represent theoretical, estimated quantities of crude oil and natural gas which, using geological and engineering data, are estimated with reasonable certainty to be recoverable in future years from known reservoirs under existing economic and operating conditions. Numerous assumptions are used in the reserve estimation process. Various engineering and geologic criteria are interpreted to derive volumetric estimates, and financial assumptions are made with regard to realized pricing, costs to be incurred to develop and operate the properties, and future tax regimes.
In spite of the imprecise nature of reserves estimates, they are a critical component of our financial statements. The determination of the depletion component of our depletion, depreciation and amortization expenses ("DDA"), as well as the ceiling test calculation, is highly dependent on estimates of proved oil and natural gas reserves. For example, if estimates of proved reserves decline, our DDA rate will increase, resulting in a decrease in net income. A decline in estimates of proved reserves may result from a number of factors including lower prices, evaluation of additional operating history, mechanical problems on our wells and catastrophic events. Lower prices can also make it uneconomical to drill wells or produce from properties with high operating costs.
Oil and Gas Properties, including Ceiling Test: There are two alternative methods of accounting for enterprises involved in the oil and gas industry: the successful efforts method and the full cost method. We use the full cost method of accounting. Accordingly, all costs associated with acquisition, exploration, and development of oil and gas reserves (including the costs of dry holes, abandoned leases, delay rentals and overhead costs directly related to acquisition, exploration, and development activities) are capitalized into a single full cost pool.
Under the successful efforts method, exploration costs, including the cost of exploratory wells that do not increase proved reserves, the cost of geological and geophysical activities, seismic costs, and lease rentals, are charged to expense as incurred. Depletion of oil and gas properties and the evaluation for impairment are generally calculated on a narrowly defined asset basis compared to an aggregated "pool" basis under the full cost method. The conveyance of oil and gas assets generally results in recognition of gain or loss. In comparison, the conveyance or abandonment of full cost properties does not generally result in the recognition of gain or loss. Under full cost accounting, recognition of gain or loss is only allowable when the transaction would significantly alter the relationship between capitalized costs and proved reserves.
Our calculation of DDA expense incorporates all the costs capitalized under full cost accounting plus the estimate of costs to be incurred to develop proved reserves. The sum of historical and future costs are allocated to our estimated quantities of proved oil and gas reserves and depleted using the units-of-production method. Changes in commodity prices, as well as associated changes in costs that are affected by commodity prices, can have a significant impact on the estimates used in our calculations.
Companies that use full cost accounting perform a ceiling test each quarter. The full cost ceiling test is the impairment test prescribed by SEC Regulation S-X Rule 4-10. The test compares capitalized costs in the full cost pool, less accumulated DDA and related deferred income taxes, to a calculated ceiling amount. The calculated ceiling amount is equal to the sum of the present value of estimated future net revenues, plus the cost of properties not being amortized, plus the lower of cost or estimated fair value of unproven properties included in costs being amortized, less the income tax effects related to differences between the book and tax basis of the properties. The present value of estimated future net revenues is computed by applying current prices of oil and gas reserves to estimated future production of proved oil and gas reserves, less estimated future expenditures to be incurred in developing and producing the proved reserves; the result of which is discounted at 10% and assumes continuation of current economic conditions. Future cash outflows associated with settling accrued asset retirement obligations that have been accrued on the balance sheet are excluded from the calculation of the present value of future net revenues. The calculation of income tax effects takes into account the tax basis of oil and gas properties, net operating loss carryforwards, and the impact of statutory depletion. In accordance with SEC Staff Accounting Bulletin Topic 12D, the income tax effect is calculated by using the present value of estimated future net revenue as pre-tax income, deducting the aforementioned tax effects, and applying the statutory tax rate. If the net capitalized costs exceed the ceiling amount, the excess must be charged to expense in recognition of the impairment.
Under the ceiling test, the estimate of future revenues is calculated using a current price (as defined in the SEC rules to include data points over a trailing 12-month period). Thus, the full impact of a sudden price decline is not recognized immediately. As prices decline, the economic performance of certain properties in the reserve estimate may deteriorate to the point that they are removed from the proved reserve category, thus reducing the quantity and value of proved reserves. The use of a 12-month average will tend to spread the impact of the change on the financial statements over several reporting periods.
55
During the twelve months ended August 31, 2015, our ceiling test resulted in a cumulative impairment of $16.0 million, which was driven by the previously discussed declines in the price of oil and gas. A further decline in oil and gas prices, or an increase in oil and gas prices that is insufficient to overcome the impact of price declines in the year-ago periods on the ceiling test calculation, could result in additional ceiling test impairments in future periods.
Oil and Gas Sales: Our proportionate interests in transactions are recorded as revenue when products are delivered to the purchasers. This method can require estimates of volumes, ownership interests, and settlement prices. Differences between estimates and actual volumes and prices, if any, are adjusted upon final settlement. Historically, such differences have not been material. During periods of increased price volatility, it will be more difficult to estimate final settlement prices, and retroactive price adjustments pertaining to prior periods could become significant.
Asset Retirement Obligations ("ARO"): We are subject to legal and contractual obligations to reclaim, remediate, or otherwise restore properties at the time the asset is permanently removed from service. Calculation of an ARO requires estimates about several future events, including the life of the asset, the costs to remove the asset from service, and inflation factors. The ARO is initially estimated based upon discounted cash flows over the life of the asset and is accreted to full value over time using our credit adjusted risk free interest rate. Estimates are periodically reviewed and adjusted to reflect changes.
The present value of a liability for the ARO is initially recorded when it is incurred if a reasonable estimate of fair value can be made. This is typically when a well is completed or an asset is placed in service. When the ARO is initially recorded, we capitalize the cost (asset retirement cost or “ARC”) by increasing the carrying value of the related asset. ARCs related to wells are capitalized to the full cost pool and subject to depletion. Over time, the liability increases for the change in its present value (accretion of ARO), while the capitalized cost decreases over the useful life of the asset, recognized as depletion.
Commodity Derivative Instruments: Our use of commodity derivative instruments helps us mitigate the cash flow impact of short-term commodity price volatility. We typically enter into contracts covering a portion of our expected oil and gas production over 24 months. We record realized gains and losses for contracts that settle during the reporting periods. Contracts either settle at their scheduled maturity date or settle prior to their scheduled maturity date as a result of our decision to early liquidate an open position. Realized gains and losses represent cash transactions. Under our commodity derivative strategy, we typically receive cash payments when the posted price for the settlement period is less than the derivative price. Conversely, when the posted price for the settlement period is greater than the derivative price, we typically disburse a cash payment to the counterparty. Thus, realized gains and losses tend to offset increases or decreases in our revenue stream that are caused by changing prices.
In comparison, unrealized gains and losses are related to positions that have not yet settled and do not represent cash transactions. At each reporting date, we estimate the fair value of the open (not settled) commodity contract positions and record a gain or loss based upon the change in fair value since the previous reporting date. The fair values are an approximation of the contracts' values as if we sold them on the reporting date. Since these amounts represent a calculated value for a hypothetical transaction, the actual value realized at the cash settlement date may be significantly different.
A downward trend in commodity prices would be expected to result in reduced oil and gas revenues and partially offset realized gains in our hedge transactions. During any reporting period in which the commodity prices decline, we expect to report unrealized gains on our open commodity derivative contracts. However, during any period in which the downward trend reverses, we expect to report unrealized losses. Looking forward, we expect current contracts to be settled or liquidated over the next 24 months. We expect to periodically enter into new commodity derivative contracts at then-current prices. Newer commodity derivative contracts at lower prices will reduce the amount of potential price protection provided by the newer contracts.
Business Combinations: The Company accounts for its acquisitions that qualify using the acquisition method under ASC 805, Business Combinations. Under the acquisition method, assets acquired and liabilities assumed are measured at their fair values, which requires the use of significant judgment since some of the acquired assets and liabilities do not have fair values that are readily determinable. Different techniques may be used to determine fair values, including market prices (when available), appraisals, comparisons to transactions for similar assets and liabilities, and present values of estimated future cash flows, among others. Since these estimates involve the use of significant judgment, they can change as new information becomes available.
Once the fair values of the assets acquired and the liabilities assumed are determined, the excess, if any, of the purchase price over the net fair value amounts assigned to assets acquired and liabilities assumed is recognized as goodwill. Conversely, the excess, if any, of the fair value of assets acquired and liabilities assumed over the purchase price of the acquired entity is recognized immediately in earnings as a gain from bargain purchase.
56
Goodwill: Goodwill represents the excess of the purchase price over the estimated fair value of the net assets acquired in a business combination. Pursuant to ASC 350, goodwill has an indefinite useful life and is not amortized, but rather is tested for impairment annually, or more often if events or circumstances indicate that the fair value of the reporting unit may have been reduced below its carrying value. If our qualitative analysis indicates that it is more likely than not that the fair value of the reporting unit is less than its carrying value, we then perform a quantitative impairment test, which consists of a two-step approach. The first step compares the carrying value of the reporting unit to its fair value computed using discounted estimated future cash flows from the reporting unit, which are inherently subject to judgment. If the carrying value of the reporting unit exceeds its fair value, then the implied fair value of the reporting unit’s goodwill is compared to its carrying amount and any excess of the carrying value over the fair value is charged against earnings. For purposes of the impairment test, management has determined we have one reporting segment, and has tested goodwill for impairment accordingly. We did not recognize an impairment to goodwill during any of the periods presented herein.
Income Taxes: Deferred income taxes are recorded for timing differences between items of income or expense reported in the financial statements and those reported for income tax purposes using the asset/liability method of accounting for income taxes. Deferred income taxes and tax benefits are recognized for the future tax consequences attributable to differences between the financial statement carrying amounts of existing assets and liabilities and their respective tax bases, and for tax loss and credit carryforwards. Deferred tax assets and liabilities are measured using enacted tax rates expected to apply to taxable income in the years in which those temporary differences are expected to be recovered or settled. We provide for deferred taxes for the estimated future tax effects attributable to temporary differences and carryforwards when realization is more likely than not. If we conclude that it is more likely than not that some portion, or all, of the net deferred tax asset will not be realized, the balance of net deferred tax assets is reduced by a valuation allowance.
We consider many factors in our evaluation of deferred tax assets, including the following sources of taxable income that may be available under the tax law to realize a portion or all of a tax benefit for deductible timing differences and carryforwards:
•Future reversals of existing taxable temporary differences,
•Taxable income in prior carry back years, if permitted,
•Tax planning strategies, and
•Future taxable income exclusive of reversing temporary differences and carryforwards.
Recent Accounting Pronouncements
We evaluate the pronouncements of various authoritative accounting organizations to determine the impact of new accounting pronouncements on us.
In January 2015, the FASB issued Accounting Standards Update 2015-01, “Simplifying Income Statement Presentation by Eliminating the Concept of Extraordinary Items” (“ASU 2015-01”), which eliminates from US GAAP the concept of extraordinary items, while retaining certain presentation and disclosure guidance for items that are unusual in nature or occur infrequently. The standard is effective prospectively for fiscal years and interim periods within those fiscal years, beginning after December 15, 2015, with early adoption permitted provided the guidance is applied from the beginning of the fiscal year of adoption. Adoption of ASU 2015-01 is not expected to have a material effect on our financial position, results of operations, or cash flows.
In November 2014, the FASB issued Accounting Standards Update 2014-16, “Determining Whether the Host Contract in a Hybrid Financial Instrument Issued in the Form of a Share Is More Akin to Debt or to Equity” (“ASU 2014-16”), which clarifies how to evaluate the economic characteristics and risks of a host contract in a hybrid financial instrument that is issued in the form of a share. Specifically, ASU 2014-16 requires that an entity consider all relevant terms and features in evaluating the nature of the host contract and clarifies that the nature of the host contract depends upon the economic characteristics and the risks of the entire hybrid financial instrument. An entity should assess the substance of the relevant terms and features, including the relative strength of the debt-like or equity-like terms and features given the facts and circumstances, when considering how to weight those terms and features. ASU 2014-16 is effective for public businesses for fiscal years, and interim periods within those fiscal years, beginning after December 15, 2015, with early adoption permitted. We are currently evaluating the impact of the adoption of this standard on our consolidated financial statements.
In April 2014, the FASB issued Accounting Standards Update (“ASU”) No. 2014-08, Presentation of Financial Statements (Topic 205) and Property, Plant, and Equipment (Topic 360): Reporting Discontinued Operations and Disclosures of Disposals of Components of an Entity. ASU 2014-08 modifies the criteria for disposals to qualify as discontinued operations and expands related disclosures. The guidance is effective for annual and interim reporting periods beginning after December 15, 2014. Adoption of this amendment will not have a material effect on the Company's financial position or results of operations.
57
In May 2014, the FASB issued Accounting Standards Update 2014-09, “Revenue from Contracts with Customers (Topic 606)” (“ASU 2014-09”), which establishes a comprehensive new revenue recognition standard designed to depict the transfer of goods or services to a customer in an amount that reflects the consideration the entity expects to receive in exchange for those goods or services. In doing so, companies may need to use more judgment and make more estimates than under current revenue recognition guidance. ASU 2014-09 allows for the use of either the full or modified retrospective transition method, and the standard will be effective for annual reporting periods beginning after December 15, 2016 including interim periods within that period. Early adoption is not permitted. We are currently evaluating which transition approach to use and the impact of the adoption of this standard on our consolidated financial statements.
In August 2014, the FASB issued ASU No. 2014-15, which requires management of public and private companies to evaluate whether there are conditions and events that raise substantial doubt about the entity’s ability to continue as a going concern within one year after the financial statements are issued (or available to be issued when applicable) and, if so, to disclose that fact. Management will be required to make this evaluation for both annual and interim reporting periods, if applicable. ASU No. 2014-15 is effective for annual periods ending after December 15, 2016 and interim periods within annual periods beginning after December 15, 2016. We do not expect the adoption of this amendment to have a material impact on our consolidated financial statements.
There were various updates recently issued by the FASB, most of which represented technical corrections to the accounting literature or application to specific industries and are not expected to a have a material impact on our reported financial position, results of operations or cash flows.
ITEM 7A. | QUANTITATIVE AND QUALITATIVE DISCLOSURE ABOUT MARKET RISKS |
Commodity Price Risk - Our financial condition, results of operations and capital resources are highly dependent upon the prevailing market prices of oil and natural gas. The volatility of oil prices affects our results to a greater degree than the volatility of gas prices, as approximately 80% of our revenue during our fiscal 2015 was from the sale of oil. A $10 per barrel change in our realized oil price would have resulted in a $19.7 million change in revenues during our 2015 fiscal year, while a $0.50 per Mcf change in our realized gas price would have resulted in a $3.7 million change in our natural gas revenues in our 2015 fiscal year.
During our 2015 fiscal year, the price of oil declined significantly. These commodity prices are subject to wide fluctuations and market uncertainties due to a variety of factors that are beyond our control. Factors influencing oil and natural gas prices include the level of global demand for oil, the global supply of oil and natural gas, the establishment of and compliance with production quotas by oil exporting countries, weather conditions which determine the demand for natural gas, the price and availability of alternative fuels, the strength of the US dollar compared to other currencies, and overall economic conditions. It is impossible to predict future oil and natural gas prices with any degree of certainty. Sustained weakness in oil and natural gas prices may adversely affect our financial condition and results of operations, and may also reduce the amount of oil and natural gas reserves that we can produce economically. Any reduction in our oil and natural gas reserves, including reductions due to price fluctuations, can have an adverse effect on our ability to obtain capital for our exploration and development activities. Similarly, any improvements in oil and natural gas prices can have a favorable impact on our financial condition, results of operations and capital resources.
We attempt to mitigate fluctuations in short-term cash flow resulting from changes in commodity prices by entering into derivative positions on a portion of our expected oil and gas production. We use derivative contracts to cover no less than 45% and no more than 85% of expected proved developed producing production as projected in our semi-annual reserve report, generally over a period of two years. We do not enter into derivative contracts for speculative or trading purposes. As of August 31, 2015, we had open crude oil derivatives in a net asset position with a fair value of $4.5 million. A hypothetical upward or downward shift of 10% in the NYMEX forward curve of crude oil and natural gas prices would change the fair value of our position by $0.1 million.
Interest Rate Risk - At August 31, 2015, we had debt outstanding under our bank credit facility totaling $78 million. Interest on our bank credit facility accrues at a variable rate, based upon either the Prime Rate or the London InterBank Offered Rate (“LIBOR”) plus an applicable margin. At August 31, 2015, we were incurring interest at a rate of 2.5%. We are exposed to interest rate risk on the bank credit facility if the variable reference rates increase. A decrease in the variable interest rates would not have a significant impact on us, as the bank credit facility has a minimum interest rate of 2.5%. If interest rates increase, our monthly interest payments would increase and our available cash flow would decrease. We estimate that if market interest rates increased by 1% to an annual rate of 3.5%, our interest payments in fiscal 2015 would have increased by approximately $1.0 million per year.
58
Under current market conditions, we do not anticipate significant changes in prevailing interest rates for the next year and we have not undertaken any activities to mitigate potential interest rate risk. There was no material change in interest rate risk during the year ended August 31, 2015.
Counterparty Risk - As described in the discussion about Commodity Price Risk, we enter into commodity derivative agreements to mitigate short-term price volatility. These derivative financial instruments present certain counterparty risks. We are exposed to potential loss if a counterparty fails to perform according to the terms of the agreement. The failure of any of the counterparties to fulfill their obligations to us could adversely affect our results of operations and cash flows. We do not require collateral or other security to be furnished by counterparties. We seek to manage the counterparty risk associated with these contracts by limiting transactions to well capitalized, well established and well known counterparties that have been approved by our senior officers. There can be no assurance, however, that our practice effectively mitigates counterparty risk.
Our exposure to counterparty risk has increased during the last year as the amounts due to us from counterparties has increased.
ITEM 8. | FINANCIAL STATEMENTS AND SUPPLEMENTARY DATA |
The consolidated financial statements and supplementary data are filed with this Annual Report in a separate section following Part IV, as shown in the index on page F-1 of this Annual Report.
ITEM 9. | CHANGES IN AND DISAGREEMENTS WITH ACCOUNTANTS ON ACCOUNTING AND FINANCIAL DISCLOSURE |
None.
ITEM 9A. | CONTROLS AND PROCEDURES |
Evaluation of Disclosure Controls and Procedures
Our management, with the participation of our co-Chief Executive Officers and Chief Financial Officer, has evaluated the effectiveness of the design and operation of our disclosure controls and procedures, as defined in Rules 13a-15(e) and 15d-15(e) under the Securities Exchange Act of 1934, as amended (the “Exchange Act”) as of the end of the period covered by this report on Form 10-K (the “Evaluation Date”). Based on such evaluation, our co-Chief Executive Officers and Chief Financial Officer concluded that, as of the Evaluation Date, our disclosure controls and procedures were effective.
Changes in Internal Control over Financial Reporting
There have been no changes in our internal control over financial reporting (as defined in Rules 13a-15(f) and 15d-15(f) under the Exchange Act) during the most recently completed fiscal quarter that have materially affected, or are reasonably likely to materially affect, our internal control over financial reporting.
Management's Report on Internal Control over Financial Reporting
Our management is responsible for establishing and maintaining adequate internal control over financial reporting, as defined in Rules 13a-15(f) and 15d-15(f) under the Exchange Act. Because of its inherent limitations, internal control over financial reporting may not prevent or detect misstatements. Also, projections of any evaluation of effectiveness to future periods are subject to the risk that controls may become inadequate because of changes in conditions, or that the degree of compliance with the policies or procedures may deteriorate.
Under the supervision and with the participation of our management, including Ed Holloway and William E. Scaff, Jr., our co-Chief Executive Officers, and James P. Henderson, our Chief Financial Officer, we conducted an evaluation of the effectiveness of our internal control over financial reporting as of August 31, 2015 based on criteria established in the Internal Control - Integrated Framework (2013) issued by the Committee of Sponsoring Organizations of the Treadway Commission, or the “COSO Framework.” Based on this evaluation, management concluded that our internal control over financial reporting was effective as of August 31, 2015.
Attestation Report of Registered Public Accounting Firm
59
The attestation report required under this Item 9A is set forth under the caption "Report of Independent Registered Public Accounting Firm," which is included with the financial statements and supplemental data required by Item 8.
ITEM 9B. | OTHER INFORMATION |
None.
PART III
ITEM 10. | DIRECTORS, EXECUTIVE OFFICERS AND CORPORATE GOVERNANCE |
The information responsive to Items 401, 405, 406, and 407 of Regulation S-K to be included in our definitive Proxy Statement for our Annual Meeting of Shareholders, to be filed within 120 days of August 31, 2015, pursuant to Regulation 14A under the Exchange Act (the “2015 Proxy Statement”), is incorporated herein by reference.
ITEM 11. | EXECUTIVE COMPENSATION |
The information responsive to Items 402 and 407 of Regulation S-K to be included in our 2015 Proxy Statement is incorporated herein by reference.
ITEM 12. | SECURITY OWNERSHIP OF CERTAIN BENEFICIAL OWNERS AND MANAGEMENT AND RELATED STOCKHOLDER MATTERS |
The information responsive to Items 201(d) and 403 of Regulation S-K to be included in our 2015 Proxy Statement is incorporated herein by reference.
ITEM 13. | CERTAIN RELATIONSHIPS AND RELATED TRANSACTIONS, DIRECTOR INDEPENDENCE |
The information responsive to Items 404 and 407 of Regulation S-K to be included in our 2015 Proxy Statement is incorporated herein by reference.
ITEM 14. | PRINCIPAL ACCOUNTING FEES AND SERVICES |
The information responsive to Items 9(e) of Schedule 14A to be included in our 2015 Proxy Statement is incorporated herein by reference.
60
PART IV
ITEM 15 EXHIBITS, FINANCIAL STATEMENT SCHEDULES
Financial Statements
See page F-1 for a description of the financial statements filed with this report.
Exhibits
Exhibit Number | Exhibit |
3.1 | Restated Articles of Incorporation of Synergy Resources Corporation (the “Company”) (incorporated by reference to Exhibit 3.1 to the Current Report on Form 8-K of the Company filed on September 16, 2015) |
3.2 | Bylaws of the Company (incorporated by reference to Exhibit 3.2 to the Registration Statement of the Company on Form SB-2 filed on October 9, 2007) |
10.1 | Amended and Restated Credit Agreement, dated as of November 28, 2012 (the “Credit Agreement”), by and among the Company, Community Banks of Colorado, as administrative agent and the lenders party thereto as amended by the First Amendment to Credit Agreement dated as of February 12, 2013 and the Second Amendment to Credit Agreement dated June 28, 2013 (incorporated by reference to Exhibit 10.21 to the Annual Report on Form 10-K of the Company filed on October 30, 2014) |
10.1.1 | Third Amendment to Credit Agreement, dated as of December 20, 2013, by and among the Company, Community Banks of Colorado as administrative agent and the lenders party thereto (incorporated by reference to Exhibit 10.22 to the Current Report on Form 8-K of the Company filed on December 26, 2013) |
10.1.2 | Fourth Amendment to Credit Agreement, dated as of June 3, 2014, by and among the Company, Community Banks of Colorado, as administrative agent and the lenders party thereto (incorporated by reference to Exhibit 10.23 to the Current Report on Form 8-K of the Company filed on June 10, 2014) |
10.1.3 | Fifth Amendment to Credit Agreement, dated as of December 15, 2014, by and among the Company, SunTrust Bank as administrative agent and the lenders and other parties thereto (incorporated by reference to Exhibit 10.32 to the Quarterly Report on Form 10-Q of the Company filed on January 9, 2015) |
10.1.4 | Sixth Amendment to Credit Agreement, dated as of June 2, 2015, by and among the Company, SunTrust Bank, as administrative agent, and the lenders party thereto (incorporated by reference to Exhibit 10.35 to the Current Report on Form 8-K of the Company filed on June 8, 2015) |
10.2 | Employment agreement dated as of June 1, 2013 between the Company and Ed Holloway (incorporated by reference to Exhibit 10.1 to the Current Report on Form 8-K of the Company filed on June 7, 2013)+ |
10.3 | Employment agreement dated as of June 1, 2013 between the Company and William E. Scaff, Jr. (incorporated by reference to Exhibit 10.2 to the Current Report on Form 8-K of the Company filed on June 7, 2013)+ |
10.4 | Employment agreement dated as of May 27, 2015 between the Company and Lynn A. Peterson (incorporated by reference to Exhibit 10.34 to the Current Report on Form 8-K of the Company filed on June 2, 2015)+ |
10.5 | Employment agreement dated as of June 4, 2014 between the Company and Frank L. Jennings (incorporated by reference to Exhibit 10.24 to the Current Report on Form 8-K of the Company filed on June 10, 2014)+ |
10.6 | Employment agreement dated as of June 4, 2014 between the Company and Craig Rasmuson (incorporated by reference to Exhibit 10.25 to the Current Report on Form 8-K of the Company filed on June 10, 2014)+ |
10.7 | Employment agreement dated as of June 4, 2014 between the Company and Valerie S. Dunn (incorporated by reference to Exhibit 10.26 to the Current Report on Form 8-K of the Company filed on June 10, 2014)+ |
10.8 | Form of Indemnification Agreement* |
10.9 | 2011 Non-Qualified Stock Option Plan (incorporated by reference to Exhibit 4.2 to the Registration Statement of the Company on Form S-8 filed on October 11, 2013)+ |
10.10 | 2011 Incentive Stock Option Plan (incorporated by reference to Exhibit 4.3 to the Registration Statement of the Company on Form S-8 filed on October 11, 2013)+ |
10.11 | 2011 Stock Bonus Plan (incorporated by reference to Exhibit 4.1 to the Registration Statement of the Company on Form S-8 filed on October 11, 2013)+ |
10.12 | Lease dated as of July 1, 2014 between the Company and HS Land & Cattle, LLC* |
10.13 | Agreement Regarding Conflicting Interest Transactions among the Company, Ed Holloway, William E. Scaff, Jr., Petroleum Management, LLC, Petroleum Exploration and Management, LLC, and HS Land & Cattle, LLC (incorporated by reference to Exhibit 10.4 to the Annual Report on Form 10-K/A of the Company filed on June 3, 2011) |
61
10.14 | Purchase and Sale Agreement dated September 16, 2013, with Trilogy Resources, LLC (incorporated by reference to Exhibit 10.18 to the Quarterly Report on Form 10-Q of the Company filed on January 9, 2014) |
10.15 | Purchase and Sale Agreement dated August 27, 2013, with Apollo Operating, LLC (incorporated by reference to Exhibit 10.18 to the Quarterly Report on Form 10-Q of the Company filed on January 9, 2014) |
10.16 | Purchase and Sale Agreement between Bayswater Exploration and Production, LLC, et al, as Sellers, and Synergy Resources Corporation, as Buyer, dated October 29, 2014 (incorporated by reference to Exhibit 10.33 to the Quarterly Report on Form 10-Q of the Company filed on January 9, 2015) |
10.17 | Exploration Agreement dated as of March 1, 2013 between the Company and Vecta Oil & Gas Ltd. (incorporated by reference to Exhibit 10.18 to the Quarterly Report on Form 10-Q filed on April 9, 2013) |
21.1 | Subsidiaries of the Company - None |
23.1 | Consent of EKS&H LLLP* |
23.2 | Consent of Ryder Scott Company, L.P. * |
31.1 | Certification of the Principal Executive Officer pursuant to Rule 13a-14(a) and Rule 15d-14(a) of the Securities Exchange Act of 1934, as amended* |
31.2 | Certification of the Principal Executive Officer pursuant to Rule 13a-14(a) and Rule 15d-14(a) of the Securities Exchange Act of 1934, as amended* |
31.3 | Certification of the Principal Financial Officer pursuant to Rule 13a-14(a) and Rule 15d-14(a) of the Securities Exchange Act of 1934, as amended* |
32.1 | Certifications of the Principal Executive Officers and Principal Financial Officer pursuant to 18 USC 1350, as adopted, pursuant to Section 906 of the Sarbanes-Oxley Act of 2002* |
99.1 | Report of Ryder Scott Company, L.P.* |
101.INS | XBRL Instance Document * |
101.SCH | XBRL Taxonomy Extension Schema* |
101.CAL | XBRL Taxonomy Extension Calculation Linkbase* |
101.DEF | XBRL Taxonomy Extension Definition Linkbase* |
101.LAB | XBRL Taxonomy Extension Label Linkbase* |
101.PRE | XBRL Taxonomy Extension Presentation Linkbase* |
* Furnished herewith
+ Management contract or compensatory plan or arrangement
62
SYNERGY RESOURCES CORPORATION
INDEX TO FINANCIAL STATEMENTS
Index to Financial Statements | |
Report of Independent Registered Public Accounting Firm | |
Balance Sheets as of August 31, 2015 and 2014 | |
Statements of Operations for the years ended August 31, 2015, 2014 and 2013 | |
Statements of Changes in Shareholders’ Equity for the years ended August 31, 2015, 2014 and 2013 | |
Statements of Cash Flows for the years ended August 31, 2015, 2014 and 2013 | |
Notes to Financial Statements | |
F-1
REPORT OF INDEPENDENT REGISTERED PUBLIC ACCOUNTING FIRM
To the Board of Directors and Shareholders
Synergy Resources Corporation
Denver, Colorado
We have audited the accompanying balance sheets of Synergy Resources Corporation (the Company) as of August 31, 2015 and 2014, and the related statements of operations, changes in shareholders’ equity, and cash flows for each of the years in the three-year period ended August 31, 2015. We also have audited the Company’s internal control over financial reporting as of August 31, 2015, based on criteria established in Internal Control - Integrated Framework (2013) issued by the Committee of Sponsoring Organizations of the Treadway Commission (COSO). The Company’s management is responsible for these financial statements, for maintaining effective internal control over financial reporting, and for its assessment of the effectiveness of internal control over financial reporting, included in the accompanying Management’s Report on Internal Control over Financial Reporting. Our responsibility is to express an opinion on these financial statements and an opinion on the Company’s internal control over financial reporting based on our audits.
We conducted our audits in accordance with the standards of the Public Company Accounting Oversight Board (United States). Those standards require that we plan and perform the audits to obtain reasonable assurance about whether the financial statements are free of material misstatement and whether effective internal control over financial reporting was maintained in all material respects. Our audits of the financial statements included examining, on a test basis, evidence supporting the amounts and disclosures in the financial statements, assessing the accounting principles used and significant estimates made by management, and evaluating the overall financial statement presentation. Our audit of internal control over financial reporting included obtaining an understanding of internal control over financial reporting, assessing the risk that a material weakness exists, and testing and evaluating the design and operating effectiveness of internal control based on the assessed risk. Our audits also included performing such other procedures as we considered necessary in the circumstances. We believe that our audits provide a reasonable basis for our opinions.
A company’s internal control over financial reporting is a process designed to provide reasonable assurance regarding the reliability of financial reporting and the preparation of financial statements for external purposes in accordance with generally accepted accounting principles. A company’s internal control over financial reporting includes those policies and procedures that (1) pertain to the maintenance of records that, in reasonable detail, accurately and fairly reflect the transactions and dispositions of the assets of the company; (2) provide reasonable assurance that transactions are recorded as necessary to permit preparation of financial statements in accordance with generally accepted accounting principles, and that receipts and expenditures of the company are being made only in accordance with authorizations of management and directors of the company; and (3) provide reasonable assurance regarding prevention or timely detection of unauthorized acquisition, use, or disposition of the company’s assets that could have a material effect on the financial statements.
Because of its inherent limitations, internal control over financial reporting may not prevent or detect misstatements. Also, projections of any evaluation of effectiveness to future periods are subject to the risk that controls may become inadequate because of changes in conditions, or that the degree of compliance with the policies or procedures may deteriorate.
In our opinion, the financial statements referred to above present fairly, in all material respects, the financial position of Synergy Resources Corporation as of August 31, 2015 and 2014, and the results of its operations and its cash flows for each of the years in the three-year period ended August 31, 2015, in conformity with accounting principles generally accepted in the United States of America. Also, in our opinion, Synergy Resources Corporation maintained, in all material respects, effective internal control over financial reporting as of August 31, 2015, based on criteria established in Internal Control - Integrated Framework, issued by the Committee of Sponsoring Organizations of the Treadway Commission (2013).
/s/ EKS&H LLLP
October 15, 2015
Denver, Colorado
F-2
SYNERGY RESOURCES CORPORATION
BALANCE SHEETS
(in thousands, except share data)
ASSETS | August 31, 2015 | August 31, 2014 | |||||
Current assets: | |||||||
Cash and cash equivalents | $ | 133,908 | $ | 34,753 | |||
Accounts receivable: | |||||||
Oil and gas sales | 13,601 | 16,974 | |||||
Joint interest billing and other | 15,325 | 15,398 | |||||
Commodity derivative | 2,897 | 365 | |||||
Other current assets | 1,109 | 750 | |||||
Total current assets | 166,840 | 68,240 | |||||
Oil and gas properties, full cost method: | |||||||
Proved properties, net | 452,393 | 275,018 | |||||
Unproved properties and properties under development, not being amortized | 77,564 | 95,278 | |||||
Other property and equipment, net | 4,783 | 9,104 | |||||
Property and equipment, net | 534,740 | 379,400 | |||||
Commodity derivative | 1,565 | 54 | |||||
Goodwill | 40,711 | — | |||||
Other assets | 2,593 | 848 | |||||
Total assets | $ | 746,449 | $ | 448,542 | |||
LIABILITIES AND SHAREHOLDERS' EQUITY | |||||||
Current liabilities: | |||||||
Trade accounts payable | $ | 670 | $ | 1,747 | |||
Well costs payable | 33,071 | 71,849 | |||||
Revenue payable | 19,044 | 14,487 | |||||
Production taxes payable | 20,899 | 14,376 | |||||
Other accrued expenses | 27 | 817 | |||||
Commodity derivative | — | 302 | |||||
Total current liabilities | 73,711 | 103,578 | |||||
Revolving credit facility | 78,000 | 37,000 | |||||
Commodity derivative | — | 307 | |||||
Deferred tax liability, net | 10,007 | 21,437 | |||||
Asset retirement obligations | 12,334 | 4,730 | |||||
Total liabilities | 174,052 | 167,052 | |||||
Commitments and contingencies (See Note 14) | |||||||
Shareholders' equity: | |||||||
Preferred stock - $0.01 par value, 10,000,000 shares authorized: no shares issued and outstanding | — | — | |||||
Common stock - $0.001 par value, 200,000,000 shares authorized: 105,099,342 and 77,999,082 shares issued and outstanding, respectively | 105 | 78 | |||||
Additional paid-in capital | 538,631 | 265,793 | |||||
Retained earnings | 33,661 | 15,619 | |||||
Total shareholders' equity | 572,397 | 281,490 | |||||
Total liabilities and shareholders' equity | $ | 746,449 | $ | 448,542 | |||
The accompanying notes are an integral part of these financial statements
F-3
SYNERGY RESOURCES CORPORATION
STATEMENTS OF OPERATIONS
(in thousands, except share and per share data)
For the Years Ended August 31, | |||||||||||
2015 | 2014 | 2013 | |||||||||
Oil and gas revenues | $ | 124,843 | $ | 104,219 | $ | 46,223 | |||||
Expenses | |||||||||||
Lease operating expenses | 15,017 | 7,991 | 3,417 | ||||||||
Production taxes | 11,340 | 9,667 | 4,237 | ||||||||
Depreciation, depletion, accretion, and amortization | 65,869 | 32,958 | 13,336 | ||||||||
Full cost ceiling impairment | 16,000 | — | — | ||||||||
General and administrative | 18,995 | 10,139 | 5,688 | ||||||||
Total expenses | 127,221 | 60,755 | 26,678 | ||||||||
Operating (loss) income | (2,378 | ) | 43,464 | 19,545 | |||||||
Other income (expense) | |||||||||||
Commodity derivative realized gain (loss) | 30,466 | (2,138 | ) | (395 | ) | ||||||
Commodity derivative unrealized gain (loss) | 1,790 | 2,459 | (2,649 | ) | |||||||
Interest expense, net | (245 | ) | — | (97 | ) | ||||||
Interest income | 86 | 82 | 47 | ||||||||
Total other income (expense) | 32,097 | 403 | (3,094 | ) | |||||||
Income before income taxes | 29,719 | 43,867 | 16,451 | ||||||||
Income tax provision | 11,677 | 15,014 | 6,870 | ||||||||
Net income | $ | 18,042 | $ | 28,853 | $ | 9,581 | |||||
Net income per common share: | |||||||||||
Basic | $ | 0.19 | $ | 0.38 | $ | 0.17 | |||||
Diluted | $ | 0.19 | $ | 0.37 | $ | 0.16 | |||||
Weighted-average shares outstanding: | |||||||||||
Basic | 94,628,665 | 76,214,737 | 57,089,362 | ||||||||
Diluted | 95,319,269 | 77,808,054 | 59,088,761 | ||||||||
The accompanying notes are an integral part of these financial statements
F-4
SYNERGY RESOURCES CORPORATION
STATEMENTS OF CHANGES IN SHAREHOLDERS' EQUITY
(in thousands, except share data)
Number of Common Shares | Par Value Common Stock | Additional Paid - In Capital | Accumulated Earnings (Deficit) | Total Shareholders' Equity | ||||||||||||||
Balance, August 31, 2012 | 51,409,340 | $ | 52 | $ | 123,876 | $ | (22,815 | ) | $ | 101,113 | ||||||||
Shares issued for Orr Energy acquisition | 3,128,422 | 3 | 13,515 | — | 13,518 | |||||||||||||
Shares issued in exchange for mineral assets | 687,122 | 1 | 3,165 | — | 3,166 | |||||||||||||
Shares issued for cash at $6.25 per share pursuant to the June 13, 2013 offering memorandum, net of offering costs of $4.4 million | 13,225,000 | 13 | 78,230 | — | 78,243 | |||||||||||||
Shares issued for exercise of warrants | 1,052,698 | 1 | 3,274 | — | 3,275 | |||||||||||||
Payment of tax withholdings using withheld shares | — | — | (6,990 | ) | — | (6,990 | ) | |||||||||||
Shares issued for exercise of stock options | 1,030,057 | 1 | (1 | ) | — | — | ||||||||||||
Stock-based compensation | 55,084 | — | 1,314 | — | 1,314 | |||||||||||||
Net income | — | — | — | 9,581 | 9,581 | |||||||||||||
Balance, August 31, 2013 | 70,587,723 | $ | 71 | $ | 216,383 | $ | (13,234 | ) | $ | 203,220 | ||||||||
Shares issued in exchange for mineral assets | 357,901 | — | 2,856 | — | 2,856 | |||||||||||||
Shares issued for Trilogy and Apollo acquisitions | 872,483 | 1 | 8,327 | — | 8,328 | |||||||||||||
Shares issued for exercise of warrants | 6,063,801 | 6 | 35,628 | — | 35,634 | |||||||||||||
Shares issued under stock bonus plan | 89,875 | — | 1,201 | — | 1,201 | |||||||||||||
Shares issued for exercise of stock options | 27,299 | — | — | — | — | |||||||||||||
Stock-based compensation for vested options | — | — | 1,767 | — | 1,767 | |||||||||||||
Payment of tax withholdings using withheld shares | — | — | (369 | ) | — | (369 | ) | |||||||||||
Net income | — | — | — | 28,853 | 28,853 | |||||||||||||
Balance, August 31, 2014 | 77,999,082 | $ | 78 | $ | 265,793 | $ | 15,619 | $ | 281,490 | |||||||||
Shares issued for cash at $10.75 per share pursuant to the February 2, 2015 stock offering memorandum, net of offering costs of $9.3 million | 18,613,952 | 19 | 190,826 | — | 190,845 | |||||||||||||
Shares issued in exchange for mineral assets | 995,672 | 1 | 11,786 | — | 11,787 | |||||||||||||
Shares issued for Bayswater acquisition | 4,648,136 | 5 | 48,429 | — | 48,434 | |||||||||||||
Shares issued for exercise of warrants | 2,562,473 | 2 | 15,368 | — | 15,370 | |||||||||||||
Shares issued under stock bonus plan | 161,755 | — | 2,950 | — | 2,950 | |||||||||||||
Shares issued for exercise of stock options | 118,272 | — | — | — | — | |||||||||||||
Stock-based compensation for vested options | — | — | 4,741 | — | 4,741 | |||||||||||||
Payment of tax withholdings using withheld shares | — | — | (1,262 | ) | — | (1,262 | ) | |||||||||||
Net income | — | — | — | 18,042 | 18,042 | |||||||||||||
Balance, August 31, 2015 | 105,099,342 | $ | 105 | $ | 538,631 | $ | 33,661 | $ | 572,397 | |||||||||
The accompanying notes are an integral part of these financial statements
F-5
SYNERGY RESOURCES CORPORATION
STATEMENTS OF CASH FLOWS
(in thousands)
For the Years Ended August 31, | |||||||||||
2015 | 2014 | 2013 | |||||||||
Cash flows from operating activities: | |||||||||||
Net income | $ | 18,042 | $ | 28,853 | $ | 9,581 | |||||
Adjustments to reconcile net income to net cash provided by operating activities: | |||||||||||
Depletion, depreciation, accretion, and amortization | 65,869 | 32,958 | 13,336 | ||||||||
Full cost ceiling impairment | 16,000 | — | — | ||||||||
Provision for deferred taxes | 11,679 | 15,014 | 6,870 | ||||||||
Stock-based compensation | 7,691 | 2,968 | 1,362 | ||||||||
Cash settlements on commodity derivative contracts | 31,721 | (2,138 | ) | (395 | ) | ||||||
Cash premiums paid for commodity derivative contracts | (4,117 | ) | — | — | |||||||
(Gain) loss on commodity derivatives contracts | (32,256 | ) | (321 | ) | 3,044 | ||||||
Changes in operating assets and liabilities: | |||||||||||
Accounts receivable | |||||||||||
Oil and gas sales | 3,373 | (9,613 | ) | (3,756 | ) | ||||||
Joint interest billing | 73 | (10,698 | ) | (1,432 | ) | ||||||
Accounts payable | |||||||||||
Trade | (1,077 | ) | 798 | (550 | ) | ||||||
Revenue | 4,557 | 8,406 | 1,921 | ||||||||
Production taxes | 5,121 | 8,099 | 2,472 | ||||||||
Accrued expenses | (1,230 | ) | 448 | (141 | ) | ||||||
Other | (359 | ) | 131 | (192 | ) | ||||||
Total adjustments | 107,045 | 46,052 | 22,539 | ||||||||
Net cash provided by operating activities | 125,087 | 74,905 | 32,120 | ||||||||
Cash flows from investing activities: | |||||||||||
Acquisition of property and equipment | (275,808 | ) | (155,602 | ) | (80,469 | ) | |||||
Short-term investments | — | 60,018 | (60,000 | ) | |||||||
Net proceeds from sales of oil and gas properties | 6,239 | 704 | — | ||||||||
Net cash used in investing activities | (269,569 | ) | (94,880 | ) | (140,469 | ) | |||||
Cash flows from financing activities: | |||||||||||
Proceeds from sale of stock | 200,100 | — | 82,656 | ||||||||
Offering costs | (9,255 | ) | — | (4,413 | ) | ||||||
Proceeds from exercise of warrants | 15,370 | 35,634 | 3,275 | ||||||||
Shares withheld for payment of employee payroll taxes | (1,262 | ) | (369 | ) | (6,990 | ) | |||||
Proceeds from revolving credit facility | 186,000 | — | 34,000 | ||||||||
Principal repayments on revolving credit facility | (145,000 | ) | — | — | |||||||
Financing fee | (2,316 | ) | — | — | |||||||
Net cash provided by financing activities | 243,637 | 35,265 | 108,528 | ||||||||
Net increase in cash and equivalents | 99,155 | 15,290 | 179 | ||||||||
Cash and equivalents at beginning of period | 34,753 | 19,463 | 19,284 | ||||||||
Cash and equivalents at end of period | $ | 133,908 | $ | 34,753 | $ | 19,463 | |||||
Supplemental Cash Flow Information (See Note 15)
The accompanying notes are an integral part of these financial statements
F-6
SYNERGY RESOURCES CORPORATION
NOTES TO FINANCIAL STATEMENTS
August 31, 2015, 2014 and 2013
1. | Organization and Summary of Significant Accounting Policies |
Organization: Synergy Resources Corporation (the “Company”) is engaged in oil and gas acquisition, exploration, development and production activities, primarily in the Denver-Julesburg Basin ("D-J Basin") of Colorado. The Company’s common stock is listed and traded on the NYSE MKT under the symbol “SYRG.”
Basis of Presentation: The Company has adopted August 31st as the end of its fiscal year. The Company does not utilize any special purpose entities. The Company operates in one business segment and all of its operations are located in the United States of America.
At the directive of the Securities and Exchange Commission to use “plain English” in public filings, the Company will use such terms as “we,” “our,” “us” or “the Company” in place of Synergy Resources Corporation. When such terms are used in this manner throughout this document, they are in reference only to the corporation, Synergy Resources Corporation, and are not used in reference to the Board of Directors, corporate officers, management, or any individual employee or group of employees.
The Company prepares its financial statements in accordance with accounting principles generally accepted in the United States of America (“US GAAP”).
Use of Estimates: The preparation of financial statements in conformity with US GAAP requires management to make estimates and assumptions that affect the reported amount of assets and liabilities, including oil and gas reserves and goodwill, business combinations, derivatives, the disclosure of contingent assets and liabilities at the date of the financial statements, and the reported amounts of revenues and expenses during the reporting period. Management routinely makes judgments and estimates about the effects of matters that are inherently uncertain. Management bases its estimates and judgments on historical experience and on various other factors that are believed to be reasonable under the circumstances, the results of which form the basis for making judgments about the carrying values of assets and liabilities that are not readily apparent from other sources. Estimates and assumptions are revised periodically and the effects of revisions are reflected in the financial statements in the period it is determined to be necessary. Actual results could differ from these estimates.
Cash and Cash Equivalents: The Company considers cash in banks, deposits in transit, and highly liquid debt instruments purchased with original maturities of less than three months to be cash and cash equivalents.
Short-Term Investments: As part of its cash management strategies, the Company invests in short-term interest bearing deposits such as certificates of deposits with maturities of less than one year.
Inventory: Inventories consist primarily of tubular goods and well equipment to be used in future drilling operations or repair operations and are carried at the lower of cost or market.
Oil and Gas Properties: The Company uses the full cost method of accounting for costs related to its oil and gas properties. Accordingly, all costs associated with acquisition, exploration, and development of oil and gas reserves (including the costs of unsuccessful efforts) are capitalized into a single full cost pool. These costs include land acquisition costs, geological and geophysical expense, carrying charges on non-producing properties, costs of drilling and overhead charges directly related to acquisition, exploration, and development activities. Under the full cost method, no gain or loss is recognized upon the sale or abandonment of oil and gas properties unless non-recognition of such gain or loss would significantly alter the relationship between capitalized costs and proved oil and gas reserves.
Capitalized costs of oil and gas properties are depleted using the unit-of-production method based upon estimates of proved reserves. For depletion purposes, the volume of proved petroleum reserves and production is converted into a common unit of measure at the energy equivalent conversion rate of six thousand cubic feet of natural gas to one barrel of crude oil. Investments in unproved properties and major development projects are not amortized until proved reserves associated with the projects can be determined or until impairment occurs. If the results of an assessment indicate that the properties are impaired, the amount of the impairment is added to the capitalized costs to be amortized.
Under the full cost method of accounting, a ceiling test is performed each quarter. The full cost ceiling test is the impairment test prescribed by SEC regulations. The ceiling test determines a limit on the net book value of oil and gas properties. The ceiling is calculated as the sum of the present value of estimated future net revenues from proved oil and gas reserves, plus the cost of
F-7
properties not being amortized, plus the lower of cost or estimated fair value of unproven properties included in the costs being amortized, less the income tax effects related to differences between the book and tax basis of the properties. The present value of estimated future net revenues is computed by applying current prices of oil and gas reserves to estimated future production of proved oil and gas reserves, less estimated future expenditures to be incurred in developing and producing the proved reserves; the result of which is discounted at 10% and assumes continuation of current economic conditions. Future cash outflows associated with settling accrued asset retirement obligations that have been accrued on the balance are excluded from the calculation of the present value of future net revenues. The calculation of income tax effects takes into account the tax basis of oil and gas properties, net operating loss carryforwards, and the impact of statutory depletion. If the capitalized costs of proved and unproved oil and gas properties, net of accumulated depreciation, depletion, and amortization, and the related deferred income taxes exceed the ceiling limit, the excess is charged to expense. Once impairment expense is recognized, it cannot be reversed in future periods, even if increasing prices raise the ceiling amount.
The oil and natural gas prices used to calculate the full cost ceiling limitation are based upon a 12-month rolling average, calculated as the unweighted arithmetic average of the first day of the month price for each month within the preceding 12-month period, unless prices are defined by contractual arrangements. Prices are adjusted for basis or location differentials and are held constant for the productive life of each well.
Oil and Gas Reserves: Oil and gas reserves represent theoretical, estimated quantities of crude oil and natural gas which geological and engineering data estimate with reasonable certainty to be recoverable in future years from known reservoirs under existing economic and operating conditions. There are numerous uncertainties inherent in estimating oil and gas reserves and their values, including many factors beyond the Company’s control. Accordingly, reserve estimates are different from the future quantities of oil and gas that are ultimately recovered and the corresponding lifting costs associated with the recovery of these reserves.
The determination of depletion and amortization expenses, as well as the ceiling test calculation related to the recorded value of the Company’s oil and natural gas properties, is highly dependent on estimates of proved oil and natural gas reserves.
Capitalized Interest: The Company capitalizes interest on expenditures made in connection with acquisition of mineral interests and exploration and development projects that are not subject to current amortization. Interest is capitalized during the period that activities are in progress to bring the projects to their intended use. See Note 9 for additional information.
Capitalized Overhead: A portion of the Company’s overhead expenses are directly attributable to acquisition, exploration, and development activities. Under the full cost method of accounting, these expenses in the amounts shown in the table below were capitalized in the full cost pool (in thousands).
For the Years Ended August 31, | |||||||||||
2015 | 2014 | 2013 | |||||||||
Capitalized overhead | $ | 2,049 | $ | 1,230 | $ | 637 | |||||
Well Costs Payable: The cost of wells in progress are recorded as incurred, generally based upon invoiced amounts or joint interest billings (“JIB”). For those instances in which an invoice or JIB is not received on a timely basis, estimated costs are accrued to oil and gas properties, generally based on the authorization for expenditure.
Other Property and Equipment: Support equipment (including such items as vehicles, well servicing equipment, and office furniture and equipment) is stated at the lower of cost or market. Depreciation of support equipment is computed using primarily the straight-line method over periods ranging from five to seven years.
Asset Retirement Obligations: The Company’s activities are subject to various laws and regulations, including legal and contractual obligations to reclaim, remediate, or otherwise restore properties at the time the asset is permanently removed from service. Calculation of an asset retirement obligation ("ARO") requires estimates about several future events, including the life of the asset, the costs to remove the asset from service, and inflation factors. The ARO is initially estimated based upon discounted cash flows over the life of the asset and is accreted to full value over time using the Company’s credit adjusted risk-free interest rate. Estimates are periodically reviewed and adjusted to reflect changes.
The present value of a liability for the ARO is initially recorded when it is incurred if a reasonable estimate of fair value can be made. This is typically when a well is completed or an asset is placed in service. When the ARO is initially recorded, the Company capitalizes the cost (asset retirement cost or “ARC”) by increasing the carrying value of the related asset. ARCs related
F-8
to wells are capitalized to the full cost pool and subject to depletion. Over time, the liability increases for the change in its present value (accretion of ARO), while the net capitalized cost decreases over the useful life of the asset, as depletion expense is recognized. In addition, ARCs are included in the ceiling test calculation when assessing the full cost pool for impairment.
Business Combinations: The Company accounts for its acquisitions using the acquisition method under ASC 805, Business Combinations. Under the acquisition method, assets acquired and liabilities assumed are recognized and measured at their fair values. The use of fair value accounting requires the use of significant judgment since some transaction components do not have fair values that are readily determinable. The excess, if any, of the purchase price over the net fair value amounts assigned to assets acquired and liabilities assumed is recognized as goodwill. Conversely, if the fair value of assets acquired exceeds the purchase price, including liabilities assumed, the excess is immediately recognized in earnings as a bargain purchase gain.
Goodwill: Goodwill results from business combinations and represents the excess of the purchase price over the estimated fair value of the net assets acquired in a business combination. Goodwill has an indefinite useful life and is not amortized, but rather is tested by the Company for impairment annually, or more often if events or circumstances indicate that the fair value of a reporting unit may have been reduced below its carrying value. If the Company’s qualitative analysis indicates that it is more likely than not that the fair value of the reporting unit is less than its carrying value, the Company then performs a quantitative impairment test. If the carrying value of the reporting unit exceeds its fair value, goodwill is written down to its implied fair value with an offsetting charge to earnings. During the year ended August 31, 2015, the Company did not recognize an impairment to goodwill.
Oil and Gas Sales: The Company derives revenue primarily from the sale of crude oil and natural gas produced on its properties. Revenues from production on properties in which the Company shares an economic interest with other owners are recognized on the basis of the Company's pro-rata interest. Revenues are reported on a net revenue interest basis, which excludes revenues that are attributable to other parties' working or royalty interests. Revenue is recorded and receivables are accrued in the month production is delivered to the purchaser, at which time ownership of the oil is transferred to the purchaser. Payment is generally received between thirty and ninety days after the date of production. Provided that reasonable estimates can be made, revenue and receivables are accrued to recognize delivery of product to the purchaser. Differences between estimates and actual volumes and prices, if any, are adjusted upon final settlement.
Major Customers: The Company sells production to a small number of customers, as is customary in the industry. As a result, during the fiscal years ended August 31, 2015, 2014 and 2013, certain of the Company’s customers represented 10% or more of its oil and gas revenue (“major customers”). For the fiscal year ended August 31, 2015, the Company had two major customers, which represented 65% and 11% of its revenue during the period. For the fiscal year ended August 31, 2014, the Company had two major customers, which represented 54% and 13% of its revenue during the period. For the fiscal year ended August 31, 2013, the Company had two major customers, which represented 50% and 15% of its revenue during the period.
Based on the current demand for oil and natural gas, the availability of other buyers, and the Company having the option to sell to other buyers if conditions warrant, the Company believes that its oil and gas production can be sold in the market in the event that it is not sold to the Company’s existing customers. However, in some circumstances, a change in customers may entail significant transition costs and/or shutting in or curtailing production for weeks or even months during the transition to a new customer.
Accounts receivable consist primarily of trade receivables from oil and gas sales and amounts due from other working interest owners who are liable for their proportionate share of well costs. The Company typically has the right to withhold future revenue disbursements to recover outstanding joint interest billings on outstanding receivables from joint interest owners.
Customers with balances greater than 10% of total receivable balances as of each of the periods presented are shown in the following table:
As of August 31, | |||||
2015 | 2014 | 2013 | |||
Company A | 30% | 37% | 24% | ||
Company B | * | * | 23% | ||
Company C | * | * | 12% | ||
* less than 10%
The Company operates exclusively within the United States of America and, except for cash and short-term investments,
F-9
all of the Company’s assets are employed in and all of its revenues are derived from the oil and gas industry.
Lease Operating Expenses: Costs incurred to operate and maintain wells and related equipment and facilities are expensed as incurred. Lease operating expenses (also referred to as production or lifting costs) include the costs of labor to operate the wells and related equipment and facilities, repairs and maintenance, materials, supplies, and fuel consumed and supplies utilized in operating the wells and related equipment and facilities, property taxes and insurance applicable to proved properties and wells and related equipment and facilities.
Stock-Based Compensation: The Company recognizes all equity-based compensation as stock-based compensation expense based on the fair value of the compensation measured at the grant date. For stock options, fair value is calculated using the Black-Scholes-Merton option pricing model. For restricted stock awards, fair value is the closing stock price for the Company's common stock on the grant date. The expense is recognized over the vesting period of the grant. See Note 11 for additional information.
Income Tax: Income taxes are computed using the asset and liability method. Accordingly, deferred tax assets and liabilities are recognized for the future tax consequences attributable to differences between the financial statement carrying amounts of existing assets and liabilities, their respective tax bases as well as the effect of net operating losses, tax credits and tax credit carryforwards. Deferred tax assets and liabilities are measured using enacted tax rates expected to apply to taxable income in the year in which the differences are expected to be recovered or settled. The effect on deferred tax assets and liabilities of a change in income tax rates is recognized in the results of operations in the period that includes the enactment date.
No significant uncertain tax positions were identified as of any date on or before August 31, 2015. The Company’s policy is to recognize interest and penalties related to uncertain tax benefits in income tax expense. As of August 31, 2015, the Company has not recognized any interest or penalties related to uncertain tax benefits. See Note 12 for further information.
Financial Instruments: Financial instruments, whether measured on a recurring or non-recurring basis, are recorded at fair value. A fair value hierarchy, established by the Financial Accounting Standards Board (“FASB”), prioritizes the inputs used to measure fair value. The hierarchy gives the highest priority to unadjusted quoted prices in active markets for identical assets or liabilities (Level 1 measurements) and the lowest priority to unobservable inputs (Level 3 measurements).
Commodity Derivative Instruments: The Company has entered into commodity derivative instruments, primarily utilizing swaps, puts, or “no premium” collars to reduce the effect of price changes on a portion of its future oil and gas production. The Company’s commodity derivative instruments are measured at fair value and are included in the accompanying balance sheets as commodity derivative assets and liabilities. Unrealized gains and losses are recorded based on the changes in the fair values of the derivative instruments. Realized gains and losses resulting from the contract settlement of derivatives are recorded in the commodity derivative line on the statement of operations. The Company values its derivative instruments by obtaining independent market quotes, as well as using industry standard models that consider various assumptions, including quoted forward prices for commodities, risk-free interest rates, and estimated volatility factors, as well as other relevant economic measures. The Company compares the valuations calculated by it to valuations provided by the counterparties to assess the reasonableness of each valuation. The discount rate used in the fair values of these instruments includes a measure of nonperformance risk by the counterparty or the Company, as appropriate. For additional discussion, please refer to Note 7.
Earnings Per Share Amounts: Basic earnings per share includes no dilution and is computed by dividing net income by the weighted-average number of shares outstanding during the period. Diluted earnings per share reflect the potential dilution of securities that could share in the earnings of the Company. The number of potential shares outstanding relating to stock options, non-vested restricted stock, and warrants is computed using the treasury stock method. Potentially dilutive securities outstanding are not included in the calculation when such securities would have an anti-dilutive effect on earnings per share.
F-10
The following table sets forth the share calculation of diluted earnings per share:
For the Years Ended August 31, | ||||||||
2015 | 2014 | 2013 | ||||||
Weighted-average shares outstanding - basic | 94,628,665 | 76,214,737 | 57,089,362 | |||||
Potentially dilutive common shares from: | ||||||||
Stock options | 672,493 | 479,222 | 1,881,682 | |||||
Restricted stock | 18,111 | — | — | |||||
Warrants | — | 1,114,095 | 117,717 | |||||
Weighted-average shares outstanding - diluted | 95,319,269 | 77,808,054 | 59,088,761 | |||||
The following potentially dilutive securities outstanding for the fiscal years presented were not included in the respective earnings per share calculation above, as such securities had an anti-dilutive effect on earnings per share:
For the Years Ended August 31, | ||||||||
2015 | 2014 | 2013 | ||||||
Potentially dilutive common shares from: | ||||||||
Stock options | 2,785,500 | 533,000 | 670,000 | |||||
Restricted stock | 145,000 | — | — | |||||
Warrants | — | — | 8,500,000 | |||||
Total | 2,930,500 | 533,000 | 9,170,000 | |||||
Recent Accounting Pronouncements: We evaluate the pronouncements of various authoritative accounting organizations to determine the impact of new accounting pronouncements on us.
In January 2015, the FASB issued Accounting Standards Update 2015-01, “Simplifying Income Statement Presentation by Eliminating the Concept of Extraordinary Items” (“ASU 2015-01”), which eliminates from US GAAP the concept of extraordinary items, while retaining certain presentation and disclosure guidance for items that are unusual in nature or occur infrequently. The standard is effective prospectively for fiscal years and interim periods within those fiscal years, beginning after December 15, 2015, with early adoption permitted provided the guidance is applied from the beginning of the fiscal year of adoption. Adoption of ASU 2015-01 is not expected to have a material effect on our financial position, results of operations, or cash flows.
In November 2014, the FASB issued Accounting Standards Update 2014-16, “Determining Whether the Host Contract in a Hybrid Financial Instrument Issued in the Form of a Share Is More Akin to Debt or to Equity” (“ASU 2014-16”), which clarifies how to evaluate the economic characteristics and risks of a host contract in a hybrid financial instrument that is issued in the form of a share. Specifically, ASU 2014-16 requires that an entity consider all relevant terms and features in evaluating the nature of the host contract and clarifies that the nature of the host contract depends upon the economic characteristics and the risks of the entire hybrid financial instrument. An entity should assess the substance of the relevant terms and features, including the relative strength of the debt-like or equity-like terms and features given the facts and circumstances, when considering how to weight those terms and features. ASU 2014-16 is effective for public businesses for fiscal years, and interim periods within those fiscal years, beginning after December 15, 2015, with early adoption permitted. We are currently evaluating the impact of the adoption of this standard on our consolidated financial statements.
In April 2014, the FASB issued Accounting Standards Update (“ASU”) No. 2014-08, Presentation of Financial Statements (Topic 205) and Property, Plant, and Equipment (Topic 360): Reporting Discontinued Operations and Disclosures of Disposals of Components of an Entity. ASU 2014-08 modifies the criteria for disposals to qualify as discontinued operations and expands related disclosures. The guidance is effective for annual and interim reporting periods beginning after December 15, 2014. Adoption of this amendment will not have a material effect on the Company's financial position or results of operations.
In May 2014, the FASB issued Accounting Standards Update 2014-09, “Revenue from Contracts with Customers (Topic 606)” (“ASU 2014-09”), which establishes a comprehensive new revenue recognition standard designed to depict the transfer of goods or services to a customer in an amount that reflects the consideration the entity expects to receive in exchange for those
F-11
goods or services. In doing so, companies may need to use more judgment and make more estimates than under current revenue recognition guidance. ASU 2014-09 allows for the use of either the full or modified retrospective transition method, and the standard will be effective for annual reporting periods beginning after December 15, 2016 including interim periods within that period. Early adoption is not permitted. We are currently evaluating which transition approach to use and the impact of the adoption of this standard on our consolidated financial statements.
In August 2014, the FASB issued ASU No. 2014-15, which requires management of public and private companies to evaluate whether there are conditions and events that raise substantial doubt about the entity’s ability to continue as a going concern within one year after the financial statements are issued (or available to be issued when applicable) and, if so, to disclose that fact. Management will be required to make this evaluation for both annual and interim reporting periods, if applicable. ASU No. 2014-15 is effective for annual periods ending after December 15, 2016 and interim periods within annual periods beginning after December 15, 2016. We do not expect the adoption of this amendment to have a material impact on our consolidated financial statements.
There were various updates recently issued by the FASB, most of which represented technical corrections to the accounting literature or application to specific industries and are not expected to a have a material impact on our reported financial position, results of operations or cash flows.
2. | Property and Equipment |
The capitalized costs related to the Company’s oil and gas producing activities were as follows (in thousands):
As of August 31, | |||||||
2015 | 2014 | ||||||
Oil and gas properties, full cost method: | |||||||
Unevaluated costs, not subject to amortization: | |||||||
Lease acquisition and other costs | $ | 58,068 | $ | 41,531 | |||
Wells in progress | 19,496 | 53,747 | |||||
Subtotal, unevaluated costs | 77,564 | 95,278 | |||||
Evaluated costs: | |||||||
Producing and non-producing | 588,802 | 329,926 | |||||
Total capitalized costs | 666,366 | 425,204 | |||||
Less, accumulated depletion and full cost ceiling impairments | (136,409 | ) | (54,908 | ) | |||
Oil and gas properties, net | 529,957 | 370,296 | |||||
Land | 4,478 | 3,898 | |||||
Other property and equipment | 875 | 5,961 | |||||
Less, accumulated depreciation | (570 | ) | (755 | ) | |||
Other property and equipment, net | 4,783 | 9,104 | |||||
Total property and equipment, net | $ | 534,740 | $ | 379,400 | |||
The Company periodically reviews its oil and gas properties to determine if the carrying value of such assets exceeds estimated fair value. For proved producing and non-producing properties, the Company performs a ceiling test each quarter to determine whether there has been an impairment to its capitalized costs. Under the ceiling test, the value of the Company’s reserves is calculated using the average of the published spot prices for WTI oil (per barrel) as of the first day of each of the previous twelve months, as well as the average of the published spot prices for Henry Hub (per MMBtu) as of the first day of each of the previous twelve months, each adjusted by lease or field for quality, transportation fees and regional price differentials. The ceiling test used average realized prices of $53.27 per barrel and $3.28 per MMBtu. The oil prices used at August 31, 2015 were approximately 40% lower than the prices used at August 31, 2014. Using these prices, the Company's net capitalized costs for oil and natural gas properties exceeded the ceiling amount by $16 million at August 31, 2015, resulting in immediate recognition of a ceiling test impairment. No such cost ceiling test impairment was recognized during the fiscal years ended August 31, 2014 and 2013.
F-12
The Company also reviews the fair value of its unproved properties. The review for the fiscal year ended August 31, 2015 indicated that estimated carrying values of such assets exceeded fair values. Therefore, the Company recorded an impairment of $15.4 million, and these costs were moved into the full cost pool and subject to the aforementioned ceiling test. No such impairments were recognized during the fiscal year ended August 31, 2014.
In addition, during the year ended August 31, 2015, certain amounts previously recorded were reclassified from one category to another without changing the total amounts recorded as property and equipment. Specifically, costs associated with a disposal well and related equipment were reclassified from other property and equipment into producing oil and gas properties to more closely reflect use of the disposal well to process flow-back water from oil and gas operations. Similarly, accumulated depreciation associated with the disposal well was reclassified from accumulated depreciation to accumulated depletion. The updated classification for the disposal well, related equipment, and accumulated depreciation did not require a change to previously reported depletion, depreciation, and amortization expense (“DDA”). Secondly, as discussed in Note 3, the analysis of assets acquired in the 2014 business combination transactions with Apollo and Trilogy were completed and fair values associated with probable horizontal well development were reclassified from proved properties into unproved properties.
Costs Incurred: Costs incurred in oil and gas property acquisition, exploration and development activities for the fiscal years presented were (in thousands):
For the Years Ended August 31, | |||||||||||
2015 | 2014 | 2013 | |||||||||
Acquisition of property: | |||||||||||
Unproved | $ | 32,701 | $ | 15,002 | $ | 12,295 | |||||
Proved | 51,400 | 33,795 | 43,143 | ||||||||
Exploration costs | 146,892 | 43,089 | — | ||||||||
Development costs | 4,957 | 111,238 | 61,128 | ||||||||
Other property and equipment | 741 | 9,315 | — | ||||||||
Asset retirement obligation | 7,051 | 1,610 | 1,578 | ||||||||
Total costs incurred | $ | 243,742 | $ | 214,049 | $ | 118,144 | |||||
Capitalized Costs Excluded from Amortization: The following table summarizes costs related to unevaluated properties that have been excluded from amounts subject to depletion, depreciation, and amortization at August 31, 2015 (in thousands).
Period Incurred | Total as of | ||||||||||||||||||
2015 | 2014 | 2013 | 2012 and prior | August 31, 2015 | |||||||||||||||
Unproved leasehold acquisition costs | $ | 32,701 | $ | 8,246 | $ | 8,007 | $ | 9,114 | $ | 58,068 | |||||||||
Unevaluated development costs | 19,496 | — | — | — | 19,496 | ||||||||||||||
Total unevaluated costs | $ | 52,197 | $ | 8,246 | $ | 8,007 | $ | 9,114 | $ | 77,564 | |||||||||
There were no individually significant properties or significant development projects included in the Company’s unevaluated property balance. The Company regularly evaluates these costs to determine whether impairment has occurred. The majority of these costs are expected to be evaluated and included in the amortization base within three years.
3. | Acquisitions |
During the fiscal years ended August 31, 2015 and 2014, the Company acquired certain oil and gas and other assets, as described below.
Bayswater transaction
On December 15, 2014, the Company completed the acquisition of certain assets from three independent oil and gas companies (collectively known as “Bayswater”) for a total purchase price of $126.0 million, net of customary closing adjustments.
F-13
The purchase price was composed of $74.2 million in cash and $48.4 million in restricted common stock plus the assumption of certain liabilities.
The Bayswater acquisition encompassed 4,227 net acres with rights to the Codell and Niobrara formations, and 1,480 net acres with rights to other formations including the Sussex, Shannon and J-Sand. Additionally, the Company acquired non-operated working interests in 17 horizontal wells, and 73 operated vertical wells as well as working interests in 11 non-operated vertical wells. The working interests in the horizontal wells range from 6% to 40% while the working interests in the vertical wells range from 5% to 100%. The purpose of the transaction was to provide additional mineral acres upon which the Company could drill wells and produce hydrocarbons. It is believed that the transaction will improve the Company's cash flow and earnings per share.
The acquisition was accounted for using the acquisition method under ASC 805, Business Combinations, which requires the acquired assets and liabilities to be recorded at fair values as of the acquisition date of December 15, 2014. Transaction costs related to the Bayswater acquisition were expensed as incurred. The following table summarizes the final purchase price and final fair values of assets acquired and liabilities assumed (in thousands):
Purchase Price | December 15, 2014 | ||
Consideration given: | |||
Cash | $ | 74,221 | |
Synergy Resources Corp. Common Stock (1) | 48,434 | ||
Net liabilities assumed, including asset retirement obligations | 3,315 | ||
Total consideration given | $ | 125,970 | |
Allocation of Purchase Price | |||
Proved oil and gas properties (2) | $ | 51,400 | |
Unproved oil and gas properties | 6,500 | ||
Other assets, including accounts receivable | 3,392 | ||
Deferred tax asset | 23,967 | ||
Total fair value of assets acquired | $ | 85,259 | |
Goodwill | $ | 40,711 | |
(1) The fair value of the consideration attributed to the Common Stock under ASC 805 was based on the Company's closing stock price on the measurement date of December 15, 2014 (4,648,136 shares at $10.42 per share).
(2) Proved oil and gas properties were measured primarily using an income approach. The fair value measurements of the oil and gas assets were based, in part, on significant inputs not observable in the market and thus represent a Level 3 measurement. The significant inputs included assumed future production profiles, commodity prices (mainly based on observable market inputs), a discount rate of 10%, and assumptions on the timing and amount of future development and operating costs.
The fair value analysis concluded that the purchase price exceeded the fair value of assets acquired. Accordingly, goodwill was recognized for book purposes. For tax purposes, no goodwill has been recognized as the entire purchase price was allocated to proved and unproved oil and gas properties. The difference between the book and tax basis of oil and gas properties created a deferred tax asset of $24.0 million. In the accompanying balance sheet, the deferred tax asset was offset against deferred liabilities. The amount allocated to goodwill as a result of the Bayswater acquisition totaled $40.7 million for book purposes. Goodwill is primarily attributable to the operational and financial benefits expected to be realized from the acquisition, including employing optimized completion techniques on Bayswater's undrilled acreage which will improve hydrocarbon recovery, realized savings in drilling and well completion costs, functional synergies due to geographic location, and the ability to participate in future commodity price increase.
Differences between the preliminary allocation and final allocation of the purchase price were treated as a change in accounting estimate, and no retroactive adjustments were made to previously reported financial statements. The preliminary analysis and allocation of the purchase price focused on the values inherent in the proved producing wells and the associated proved undeveloped reserves. The final analysis concluded that the fair value of unproved oil and gas properties was $6.5 million and that fair value should be attributed to deferred tax assets and goodwill. The re-allocation of $64.7 million from unproved properties not subject to amortization to goodwill and deferred tax asset did not impact the full cost amortization base, and no prior period adjustment was necessary.
F-14
The results of operations of Bayswater from the December 15, 2014 closing date through August 31, 2015, representing approximately $7.7 million of revenue and $4.8 million of net income, have been included in the Company's consolidated statement of operations for the year ended August 31, 2015.
The following table presents the pro forma combined results of operations for the two years ended August 31, 2015 as if the Bayswater transaction had occurred on September 1, 2013, the first day of our 2014 fiscal year. The unaudited pro forma results reflect significant pro forma adjustments related to funding the acquisition through the issuance of common stock and cash, additional depreciation expense, costs directly attributable to the acquisition and operating costs incurred as a result of the assets acquired. The unaudited pro forma results do not include any cost savings or other synergies that may result from the acquisition or any estimated costs that have been or will be incurred by the Company to integrate the properties acquired. The unaudited pro forma results are not necessarily indicative of what actually would have occurred if the acquisition had been completed as of the beginning of the period, nor are they necessarily indicative of future results.
Year Ended August 31, | |||||||
(in thousands) | 2015 | 2014 | |||||
Oil and gas revenues | $ | 131,716 | $ | 108,740 | |||
Net income | $ | 19,822 | $ | 27,720 | |||
Earnings per common share | |||||||
Basic | $ | 0.21 | $ | 0.34 | |||
Diluted | $ | 0.21 | $ | 0.34 | |||
2014 transactions
During the year ended August 31, 2014, the Company closed on two transactions that qualified as Business Combinations under ASC 805. The initial accounting treatment of the transactions was based upon the preliminary analysis of the assets acquired. During the first fiscal quarter of 2015, the Company completed its analysis and finalized the allocation of purchase price to the assets acquired. The values presented in this Note, including the tables herein, present the final result of the analysis.
Trilogy transaction
On September 16, 2013, the Company entered into a definitive purchase and sale agreement with Trilogy Resources, LLC (“Trilogy”), for its interests in 21 producing oil and gas wells and approximately 800 net mineral acres (the “Trilogy Assets”). On November 12, 2013, the Company closed the transaction for a combination of cash and stock. Trilogy received 301,339 shares of the Company’s common stock valued at $2.9 million and cash consideration of approximately $15.9 million. No material transaction costs were incurred in connection with this acquisition.
F-15
The acquisition was accounted for using the acquisition method under ASC 805, Business Combinations, which requires the acquired assets and liabilities to be recorded at fair values as of the acquisition date of November 12, 2013. The following table summarizes the final purchase price and the final fair values of assets acquired and liabilities assumed (in thousands):
Purchase Price | November 12, 2013 | ||
Consideration given: | |||
Cash | $ | 15,902 | |
Synergy Resources Corp. Common Stock * | 2,896 | ||
Net liabilities assumed, including asset retirement obligations | 977 | ||
Total consideration given | $ | 19,775 | |
Allocation of Purchase Price | |||
Proved oil and gas properties | $ | 11,514 | |
Unproved oil and gas properties | 7,725 | ||
Other assets, including accounts receivable | 536 | ||
Total fair value of assets acquired | $ | 19,775 | |
* The fair value of the consideration attributed to the Common Stock under ASC 805 was based on the Company's closing stock price on the measurement date of November 12, 2013 (301,339 shares at $9.61 per share).
Apollo transaction
On August 27, 2013, the Company entered into a definitive purchase and sale agreement (“the Agreement”), with Apollo Operating, LLC (“Apollo”), for its interests in 38 producing oil and gas wells, partial interest (25%) in one water disposal well (the “Disposal Well”), and approximately 3,639 gross (1,000 net) mineral acres (“the Apollo Operating Assets”). On November 13, 2013, the Company closed the transaction for a combination of cash and stock. Apollo received cash consideration of approximately $11.0 million and 550,518 shares of the Company’s common stock valued at $5.2 million. Following the Company’s acquisition of the Apollo Operating Assets, the Company acquired all other remaining interests in the Disposal Well (the “Related Interests”) through several transactions with the individual owners of such interests. The Company acquired the Related Interests for approximately $3.7 million in cash consideration and 20,626 shares of the Company’s common stock, valued at $0.2 million. No material transaction costs were incurred in connection with this acquisition.
F-16
The acquisition was accounted for using the acquisition method under ASC 805, Business Combinations, which requires the acquired assets and liabilities to be recorded at fair values as of the acquisition date of November 13, 2013. The following table summarizes the final purchase price and the final fair values of assets acquired and liabilities assumed (in thousands):
Purchase Price | November 13, 2013 | ||
Consideration given: | |||
Cash | $ | 14,688 | |
Synergy Resources Corp. Common Stock * | 5,432 | ||
Net liabilities assumed, including asset retirement obligation | 1,403 | ||
Total consideration given | $ | 21,523 | |
Allocation of Purchase Price | |||
Proved oil and gas properties | $ | 13,284 | |
Unproved oil and gas properties | 7,577 | ||
Other assets, including accounts receivable | 662 | ||
Total fair value of assets acquired | $ | 21,523 | |
* The fair value of the consideration attributed to the Common Stock under ASC 805 was based on the Company's closing stock prices on the measurement dates (including 550,518 shares at $9.49 per share on November 13, 2013 plus 20,626 shares at various measurement dates at an average per share price of $10.08).
The motivation for both the Trilogy and Apollo acquisitions was the expectation that each was accretive to cash flow and earnings per share. The acquisitions qualify as business combinations, and as such, the Company estimated the fair value of each property as of the acquisition date (the date on which the Company obtained control of the properties). Fair value measurements utilize assumptions of market participants. To determine the fair value of the oil and gas assets, the Company used an income approach based on a discounted cash flow model and made market assumptions as to future commodity prices, projections of estimated quantities of oil and natural gas reserves, expectations for timing and amount of future development and operating costs, projections of future rates of production, expected recovery rates and risk adjusted discount rates. The Company determined the appropriate discount rates used for the discounted cash flow analyses by using a weighted-average cost of capital from a market participant perspective plus property-specific risk premiums for the assets acquired. The Company estimated property-specific risk premiums taking into consideration the gas-to-oil ratio of the related reserves, among other items. Given the unobservable nature of the significant inputs, they are deemed to be Level 3 in the fair value hierarchy. The working capital assets acquired were determined to be at fair value due to their short-term nature.
The preliminary analysis and allocation of the purchase price focused on the values inherent in the proved producing wells and the associated proved undeveloped reserves. All of the producing wells acquired in the transactions were vertical wells and the initial estimates allocated 100% of the fair value to proved properties associated with vertical well development. The final analysis also considered the additional value provided by virtue of the ability to drill horizontal wells in the acquired acreage. Adding horizontal wells to the development plan required a further evaluation as to the classification of the horizontal reserves, as reserves classified as proved under a vertical well drilling plan may be classified differently under a horizontal drilling plan. In the subject acres, the horizontal well reserves are classified as unproved even though the vertical well reserves are proved. Thus, the final analysis attributed $15.3 million of fair value to unproved horizontal properties and $24.8 million of fair value to proved properties.
Differences between the preliminary allocation and final allocation of acquired fair value have been treated as a change in accounting estimate, and no retroactive adjustments were made to the previously reported financial statements. Furthermore, since the reclassification of $15.3 million from proved properties subject to amortization to unproved properties not subject to amortization represents approximately 2% of the full cost amortization base, no prior period adjustment was recorded during the current year.
The following table presents the pro forma combined results of operations for the two years ended August 31, 2014 and 2013 as if the Trilogy and Apollo transactions had occurred on September 1, 2012, the first day of our 2013 fiscal year. The unaudited pro forma results reflect significant pro forma adjustments related to funding the acquisition through the issuance of common stock and cash, additional depreciation expense, costs directly attributable to the acquisition and operating costs incurred
F-17
as a result of the assets acquired. The unaudited pro forma results do not include any cost savings or other synergies that may result from the acquisition or any estimated costs that have been or will be incurred by the Company to integrate the properties acquired. The unaudited pro forma results are not necessarily indicative of what actually would have occurred if the acquisition had been completed as of the beginning of the period, nor are they necessarily indicative of future results.
Year Ended August 31, | |||||||
(in thousands) | 2014 | 2013 | |||||
Oil and gas revenues | $ | 106,584 | $ | 55,633 | |||
Net income | $ | 29,681 | $ | 13,191 | |||
Earnings per common share | |||||||
Basic | $ | 0.39 | $ | 0.23 | |||
Diluted | $ | 0.38 | $ | 0.22 | |||
4. | Depletion, depreciation, accretion, and amortization (“DDA”) |
Depletion, depreciation, accretion, and amortization consisted of the following (in thousands):
For the Years Ended August 31, | |||||||||||
2015 | 2014 | 2013 | |||||||||
Depletion of oil and gas properties | $ | 65,158 | $ | 32,132 | $ | 13,046 | |||||
Depreciation, accretion, and amortization | 711 | 826 | 290 | ||||||||
Total DDA Expense | $ | 65,869 | $ | 32,958 | $ | 13,336 | |||||
Capitalized costs of proved oil and gas properties are depleted quarterly using the units-of-production method based on a depletion rate, which is calculated by comparing production volumes for the quarter to estimated total reserves at the beginning of the quarter. For the fiscal year ended August 31, 2015, production of 3,194 MBOE represented 5.3% of estimated total proved reserves. For the fiscal year ended August 31, 2014, production of 1,566 MBOE represented 4.6% of estimated total proved reserves. DDA expense was $20.62 per BOE, $21.05 per BOE, and $17.26 per BOE for the years ended August 31, 2015, 2014, and 2013, respectively.
5. | Asset Retirement Obligations |
Upon completion or acquisition of a well, the Company recognizes obligations for its oil and gas operations for anticipated costs to remove and dispose of surface equipment, plug and abandon the wells, and restore the drilling sites to its original use. The estimated present value of such obligations is determined using several assumptions and judgments about the ultimate settlement amounts, inflation factors, credit adjusted discount rates, timing of settlement, and changes in regulations. Changes in estimates are reflected in the obligations as they occur. If the fair value of a recorded asset retirement obligation changes, a revision is recorded to both the asset retirement obligation and the asset retirement capitalized cost. For the purpose of determining the fair value of ARO incurred during the fiscal years presented, the Company used the following assumptions:
For the Years Ended August 31, | |||
2015 | 2014 | ||
Inflation rate | 3.90% | 3.90% | |
Estimated asset life | 16.0 - 30.0 years | 25.0 - 39.0 years | |
Credit adjusted risk free interest rate | 8% | 8% | |
F-18
The following table summarizes the changes in asset retirement obligations associated with the Company's oil and gas properties (in thousands).
As of August 31, | |||||||
2015 | 2014 | ||||||
Beginning asset retirement obligation | $ | 4,730 | $ | 2,777 | |||
Liabilities incurred | 1,372 | 1,024 | |||||
Liabilities assumed | 1,913 | 586 | |||||
Accretion expense | 553 | 343 | |||||
Revisions in previous estimates | 3,766 | — | |||||
$ | 12,334 | $ | 4,730 | ||||
During fiscal 2015, the Company increased its asset retirement obligation by $3.8 million due to revising its assumption of the average cost to plug and abandon each well.
6. | Revolving Credit Facility |
The Company maintains a revolving credit facility ("Revolver") with a bank syndicate. The Revolver is available for working capital requirements, capital expenditures, acquisitions, general corporate purposes and to support letters of credit. As most recently amended on June 2, 2015, the terms of the Revolver provide for up to $500 million in borrowings, subject to a borrowing base limitation, as further described below. The maturity date of the Revolver is December 15, 2019.
Certain of the Company’s assets, including substantially all of the producing wells and developed oil and gas leases, have been designated as collateral under the Revolver. The borrowing commitment is subject to adjustment based upon a borrowing base calculation that includes the value of oil and gas reserves. The borrowing base limitation is subject to scheduled redeterminations on a semi-annual basis. In certain events, and at the discretion of the bank syndicate, an unscheduled redetermination could be prepared. During the quarter ended August 31, 2015, the Company's borrowing base was adjusted to $163 million. Accordingly, as of August 31, 2015, based on a borrowing base of $163 million and an outstanding principal balance of $78 million, the unused borrowing base available for future borrowing totaled approximately $85 million. The next semi-annual redetermination is scheduled for November 2015 and will be based on the Company's August 31, 2015 reserve report.
Interest under the Revolver is payable monthly and accrues at a variable rate, subject to a minimum rate of 2.5%. For each borrowing, the Company designates its choice of reference rates, which can be either the Prime Rate plus a margin or the London Interbank Offered Rate (“LIBOR”) plus a margin. The interest rate margin, as well as other bank fees, varies with utilization of the Revolver. The average annual interest rate for borrowings during the year ended August 31, 2015 was 2.5%.
The Revolver also contains covenants that, among other things, restrict the payment of dividends. In addition, the Revolver generally requires an overall commodity derivative position that covers a rolling 24 months of estimated future production with a minimum position of no less than 45% and a maximum position of no more than 85% of hydrocarbon production as projected in the semi-annual reserve report.
Furthermore, the Revolver requires the Company to maintain certain financial and liquidity ratio compliance covenants. Under the requirements, as most recently amended, the Company, on a quarterly basis, must (a) not, at any time, permit its ratio of total funded debt as of such time to EBITDAX, as defined in the agreement, to be greater than or equal to 4.0 to 1.0; and (b) maintain a minimum liquidity, defined as cash and cash equivalents plus the unused availability under the Revolver, of not less than $25 million. As of August 31, 2015, the most recent compliance date, the Company was in compliance with all loan covenants.
7. | Commodity Derivative Instruments |
The Company has entered into commodity derivative instruments, as described below. The Company has utilized swaps, puts or “no premium” collars to reduce the effect of price changes on a portion of its future oil and gas production. A swap requires a payment to the counterparty if the settlement price exceeds the strike price and the same counterparty is required to make a payment if the settlement price is less than the strike price. A collar requires a payment to the counterparty if the settlement price is above the ceiling price and requires the counterparty to make a payment if the settlement price is below the floor price. A put requires the counterparty to make a payment if the settlement price is below the strike price. The objective of the Company’s use of derivative financial instruments is to achieve more predictable cash flows in an environment
F-19
of volatile oil and gas prices and to manage its exposure to commodity price risk. While the use of these derivative instruments limits the downside risk of adverse price movements, such use may also limit the Company’s ability to benefit from favorable price movements. The Company may, from time to time, add incremental derivatives to cover additional production, restructure existing derivative contracts or enter into new transactions to modify the terms of current contracts in order to realize the current value of the Company’s existing positions. The Company does not enter into derivative contracts for speculative purposes.
The use of derivatives involves the risk that the counterparties to such instruments will be unable to meet the financial terms of such contracts. The Company’s derivative contracts are currently with four counterparties. Two of the counterparties are lenders in the Company’s credit facility. The Company has netting arrangements with the counterparties that provide for the offset of payables against receivables from separate derivative arrangements with the counterparty in the event of contract termination. The derivative contracts may be terminated by a non-defaulting party in the event of default by one of the parties to the agreement.
The Company’s commodity derivative instruments are measured at fair value and are included in the accompanying balance sheets as commodity derivative assets and liabilities. Unrealized gains and losses are recorded based on the changes in the fair values of the derivative instruments. Both the unrealized and realized gains and losses resulting from contract settlement of derivatives are recorded in the statements of operations. The Company’s cash flow is only impacted when the actual settlements under commodity derivative contracts result in making or receiving a payment to or from the counterparty. Actual cash settlements can occur at either the scheduled maturity date of the contract or at an earlier date if the contract is liquidated prior to its scheduled maturity. These settlements under the commodity derivative contracts are reflected as operating activities in the Company’s statements of cash flows.
The Company’s valuation estimate takes into consideration the counterparty’s creditworthiness, the Company’s creditworthiness, and the time value of money. The consideration of the factors results in an estimated exit-price for each derivative asset or liability under a market place participant’s view. Management believes that this approach provides a reasonable, non-biased, verifiable, and consistent methodology for valuing commodity derivative instruments.
F-20
The Company’s commodity derivative contracts as of August 31, 2015 are summarized below:
Settlement Period | Derivative Instrument | Average Volumes (Bbls per month) | Average Fixed Price | Floor Price | Ceiling Price | |||||||||||
Crude Oil - NYMEX WTI | ||||||||||||||||
Sep 1, 2015 - Dec 31, 2015 | Put | 40,000 | — | $ | 50.00 | — | ||||||||||
Sep 1, 2015 - Oct 31, 2015 | Put | 2,000 | — | $ | 50.00 | — | ||||||||||
Sep 1, 2015 - Dec 31, 2015 | Put | 10,000 | — | $ | 55.00 | — | ||||||||||
Jan 1, 2016 - Dec 31, 2016 | Put | 25,000 | — | $ | 50.00 | — | ||||||||||
Jan 1, 2017 - Apr 30, 2017 | Put | 20,000 | — | $ | 50.00 | — | ||||||||||
May 1, 2017 - Aug 31, 2017 | Put | 20,000 | — | $ | 55.00 | — | ||||||||||
Settlement Period | Derivative Instrument | Average Volumes (MMBtu per month) | Average Fixed Price | Floor Price | Ceiling Price | |||||||||||
Natural Gas - NYMEX Henry Hub | ||||||||||||||||
Sep 1, 2015 - Dec 31, 2015 | Collar | 72,000 | — | $ | 4.15 | $ | 4.49 | |||||||||
Jan 1, 2016 - May 31, 2016 | Collar | 60,000 | — | $ | 4.05 | $ | 4.54 | |||||||||
Jun 1, 2016 - Aug 31, 2016 | Collar | 60,000 | — | $ | 3.90 | $ | 4.14 | |||||||||
Natural Gas - CIG Rocky Mountain | ||||||||||||||||
Sep 1, 2015 - Dec 31, 2015 | Collar | 100,000 | — | $ | 2.20 | $ | 3.05 | |||||||||
Jan 1, 2016 - Dec 31, 2016 | Collar | 100,000 | — | $ | 2.65 | $ | 3.10 | |||||||||
Jan 1, 2017 - Apr 30, 2017 | Collar | 100,000 | — | $ | 2.80 | $ | 3.95 | |||||||||
May 1 2017 - Aug 31, 2017 | Collar | 110,000 | — | $ | 2.50 | $ | 3.06 | |||||||||
Subsequent to August 31, 2015, the Company added the following position:
Settlement Period | Derivative Instrument | Average Volumes (Bbls per month) | Average Fixed Price | Floor Price | Ceiling Price | ||||||||||
Crude Oil - NYMEX WTI | |||||||||||||||
Jan 1, 2016 - Dec 31, 2016 | Put | 10,000 | — | $ | 45.00 | — | |||||||||
Offsetting of Derivative Assets and Liabilities
As of August 31, 2015 and 2014, all derivative instruments held by the Company were subject to enforceable master netting arrangements held by various financial institutions. In general, the terms of the Company’s agreements provide for offsetting of amounts payable or receivable between the Company and the counterparty, at election of both parties, for transactions that occur on the same date and in the same currency. The Company’s agreements also provide that in the event of an early termination, the counterparties have the right to offset amounts owed or owing under that and any other agreement with the same counterparty. The Company’s accounting policy is to offset these positions in its accompanying balance sheets.
F-21
The following table provides a reconciliation between the net assets and liabilities reflected on the accompanying balance sheets and the potential effect of master netting arrangements on the fair value of the Company’s derivative contract (in thousands):
As of August 31, 2015 | ||||||||||||||
Underlying Commodity | Balance Sheet Location | Gross Amounts of Recognized Assets and Liabilities | Gross Amounts Offset in the Balance Sheet | Net Amounts of Assets and Liabilities Presented in the Balance Sheet | ||||||||||
Commodity Derivative contracts | Current assets | $ | 3,047 | $ | (150 | ) | $ | 2,897 | ||||||
Commodity Derivative contracts | Noncurrent assets | $ | 1,774 | $ | (209 | ) | $ | 1,565 | ||||||
Commodity Derivative contracts | Current liabilities | $ | 150 | $ | (150 | ) | $ | — | ||||||
Commodity Derivative contracts | Noncurrent liabilities | $ | 209 | $ | (209 | ) | $ | — | ||||||
As of August 31, 2014 | ||||||||||||||
Underlying Commodity | Balance Sheet Location | Gross Amounts of Recognized Assets and Liabilities | Gross Amounts Offset in the Balance Sheet | Net Amounts of Assets and Liabilities Presented in the Balance Sheet | ||||||||||
Commodity Derivative contracts | Current assets | $ | 903 | $ | (538 | ) | $ | 365 | ||||||
Commodity Derivative contracts | Noncurrent assets | $ | 718 | $ | (664 | ) | $ | 54 | ||||||
Commodity Derivative contracts | Current liabilities | $ | 840 | $ | (538 | ) | $ | 302 | ||||||
Commodity Derivative contracts | Noncurrent liabilities | $ | 971 | $ | (664 | ) | $ | 307 | ||||||
The amount of gain (loss) recognized in the statements of operations related to derivative financial instruments was as follows (in thousands):
For the Years Ended August 31, | |||||||||||
2015 | 2014 | 2013 | |||||||||
Realized gain (loss) on commodity derivatives | $ | 30,466 | $ | (2,138 | ) | $ | (395 | ) | |||
Unrealized gain (loss) on commodity derivatives | 1,790 | 2,459 | (2,649 | ) | |||||||
Total gain (loss) | $ | 32,256 | $ | 321 | $ | (3,044 | ) | ||||
Realized gains and losses include cash received from the monthly settlement of derivative contracts at their scheduled maturity date along with the proceeds from early liquidation of in-the-money derivative contracts. During fiscal year 2015, the Company liquidated oil derivatives with an average price of $82.79 and covering 372,500 barrels and received cash settlements of approximately $20.5 million. The following table summarizes derivative realized gains and losses during the periods presented (in thousands):
Year Ended August 31, | ||||||||||||
2015 | 2014 | 2013 | ||||||||||
Monthly settlement | $ | 9,957 | $ | (2,138 | ) | $ | (395 | ) | ||||
Early liquidation | 20,509 | — | — | |||||||||
Total realized gain (loss) | $ | 30,466 | $ | (2,138 | ) | $ | (395 | ) | ||||
Credit Related Contingent Features
As of August 31, 2015, two of the four counterparties to the Company's derivative instruments were members of the Company’s credit facility syndicate. The Company’s obligations under the credit facility and its derivative contracts are secured by liens on substantially all of the Company’s producing oil and gas properties. The agreement with the third
F-22
counterparty, which is not a lender under the credit facility, is unsecured and does not require the posting of collateral. The agreement with the fourth counterparty is subject to an inter-creditor agreement between the counterparty and the Company’s lenders under the credit facility.
8. | Fair Value Measurements |
ASC Topic 820, Fair Value Measurements and Disclosure, establishes a hierarchy for inputs used in measuring fair value for financial assets and liabilities that maximizes the use of observable inputs and minimizes the use of unobservable inputs by requiring that the most observable inputs be used when available. Observable inputs are inputs that market participants would use in pricing the asset or liability based on market data obtained from sources independent of the Company. Unobservable inputs are inputs that reflect the Company’s assumptions of what market participants would use in pricing the asset or liability based on the best information available in the circumstances. The hierarchy is broken down into three levels based on the reliability of the inputs as follows:
• | Level 1: Quoted prices available in active markets for identical assets or liabilities; |
• | Level 2: Quoted prices in active markets for similar assets and liabilities that are observable for the asset or liability; |
• | Level 3: Unobservable pricing inputs that are generally less observable from objective sources, such as discounted cash or valuation models. |
The financial assets and liabilities are classified based on the lowest level of input that is significant to the fair value measurement. The Company’s assessment of the significance of a particular input to the fair value measurement requires judgment, and may affect the valuation of the fair value of assets and liabilities and their placement within the fair value hierarchy levels.
The Company’s non-recurring fair value measurements include asset retirement obligations and purchase price allocations for the fair value of assets and liabilities acquired through business combinations. Please refer to Notes 3 and 5 for further discussion of business combinations and asset retirement obligations, respectively.
The Company determines the estimated fair value of its asset retirement obligations by calculating the present value of estimated cash flows related to plugging and abandonment liabilities using Level 3 inputs. The significant inputs used to calculate such liabilities include estimates of costs to be incurred, the Company’s credit adjusted discount rates, inflation rates and estimated dates of abandonment. The asset retirement liability is accreted to its present value each period and the capitalized asset retirement cost is depleted as a component of the full cost pool using the units-of-production method. See Note 5 for additional information.
The acquisition of a group of assets in a business combination transaction requires fair value estimates for assets acquired and liabilities assumed. The fair value of assets and liabilities acquired through business combinations is calculated using a net discounted-cash flow approach for the producing properties. The discounted cash flows are developed using the income approach and are based on management’s expectations for the future. Unobservable inputs include estimates of future oil and gas production from the Company’s reserve reports, commodity prices based on the NYMEX forward price curves as of the date of the estimate (adjusted for basis differentials), estimated operating and development costs, and a risk-adjusted discount rate (all of which are designated as Level 3 inputs within the fair value hierarchy). For unproved properties, fair value is determined using market comparables. See Note 3 for additional information.
The following table presents the Company’s financial assets and liabilities that were accounted for at fair value on a recurring basis as of August 31, 2015 and 2014 by level within the fair value hierarchy (in thousands):
Fair Value Measurements at August 31, 2015 | |||||||||||||||
Level 1 | Level 2 | Level 3 | Total | ||||||||||||
Financial assets and liabilities: | |||||||||||||||
Commodity derivative asset | $ | — | $ | 4,462 | $ | — | $ | 4,462 | |||||||
Commodity derivative liability | $ | — | $ | — | $ | — | $ | — | |||||||
Fair Value Measurements at August 31, 2014 | |||||||||||||||
Level 1 | Level 2 | Level 3 | Total | ||||||||||||
Financial assets and liabilities: | |||||||||||||||
Commodity derivative asset | $ | — | $ | 419 | $ | — | $ | 419 | |||||||
Commodity derivative liability | $ | — | $ | 609 | $ | — | $ | 609 | |||||||
F-23
Commodity Derivative Instruments
The Company determines its estimate of the fair value of commodity derivative instruments using a market approach based on several factors, including quoted market prices in active markets, quotes from third parties, the credit rating of each counterparty, and the Company’s own credit standing. In consideration of counterparty credit risk, the Company assessed the possibility of whether the counterparties to its derivative contracts would default by failing to make any contractually required payments. The Company considers the counterparties to be of substantial credit quality and believes that they have the financial resources and willingness to meet their potential repayment obligations associated with the derivative transactions. At August 31, 2015, derivative instruments utilized by the Company consist of puts, “no premium” collars and swaps. The crude oil and natural gas derivative markets are highly active. Although the Company’s derivative instruments are based on several factors including public indices, the instruments themselves are traded with third-party counterparties and are not openly traded on an exchange. As such, the Company has classified these instruments as Level 2.
Fair Value of Financial Instruments
The Company’s financial instruments consist primarily of cash and cash equivalents, accounts receivable, accounts payable, commodity derivative instruments (discussed above) and credit facility borrowings. The carrying values of cash and cash equivalents, accounts receivable and accounts payable are representative of their fair values due to their short-term maturities. The carrying amount of the Company’s credit facility approximated fair value as it bears interest at variable rates over the term of the loan.
9. | Interest Expense |
The components of interest expense are (in thousands):
For the Years Ended August 31, | |||||||||||
2015 | 2014 | 2013 | |||||||||
Revolving bank credit facility | $ | 2,776 | $ | 986 | $ | 1,067 | |||||
Amortization of debt issuance costs | 853 | 448 | 160 | ||||||||
Less, interest capitalized | (3,384 | ) | (1,434 | ) | (1,130 | ) | |||||
Interest expense, net | $ | 245 | $ | — | $ | 97 | |||||
10. | Shareholders’ Equity |
The Company's classes of stock are summarized as follows:
For the Years Ended August 31, | |||||||||||
2015 | 2014 | 2013 | |||||||||
Preferred stock, shares authorized | 10,000,000 | 10,000,000 | 10,000,000 | ||||||||
Preferred stock, par value | $ | 0.01 | $ | 0.01 | $ | 0.01 | |||||
Preferred stock, shares issued and outstanding | nil | nil | nil | ||||||||
Common stock, shares authorized | 200,000,000 | 200,000,000 | 100,000,000 | ||||||||
Common stock, par value | $ | 0.001 | $ | 0.001 | $ | 0.001 | |||||
Common stock, shares issued and outstanding | 105,099,342 | 77,999,082 | 70,587,723 | ||||||||
Preferred Stock may be issued in series with such rights and preferences as may be determined by the Board of Directors. Since inception, the Company has not issued any preferred shares.
Shares of the Company’s common stock were issued during each of the years ended August 31, 2015, 2014, and 2013, as described further below.
F-24
Sales of common stock
During the years ended August 31, 2015 and 2013, the Company sold shares of its common stock in public offerings as follows:
• | In February 2015, the Company completed the sale of common stock in an underwritten public offering led by Seaport Global Securities LLC. |
• | In June 2013, the Company completed the sale of common stock in an underwritten public offering led by Johnson Rice LLC. |
Certain details of each transaction are shown in the following table. Net proceeds represent amounts received by the Company after deductions for underwriting discounts, commissions and expenses of the offering.
For the Years Ended August 31, | |||||||||||
2015 | 2014 | 2013 | |||||||||
Number of common shares sold | 18,613,952 | — | 13,225,000 | ||||||||
Offering price per common share | $ | 10.75 | $ | — | $ | 6.25 | |||||
Net proceeds (in thousands) | $ | 190,845 | $ | — | $ | 78,243 | |||||
Common stock issued for acquisition of mineral property interests
During the fiscal years presented, the Company issued shares of common stock in exchange for mineral property interests. The value of each transaction was determined using the market price of the Company’s common stock on the date of each transaction.
For the Years Ended August 31, | |||||||||||
2015 | 2014 | 2013 | |||||||||
Number of common shares issued for mineral property leases | 995,672 | 357,901 | 687,122 | ||||||||
Number of common shares issued for acquisitions | 4,648,136 | 872,483 | 3,128,422 | ||||||||
Total common shares issued | 5,643,808 | 1,230,384 | 3,815,544 | ||||||||
Average price per common share | $ | 10.67 | $ | 9.09 | $ | 4.37 | |||||
Aggregate value of shares issues (in thousands) | $ | 60,221 | $ | 11,184 | $ | 16,684 | |||||
Common stock warrants
The Company previously issued warrants to purchase common stock, many of which remained outstanding at the beginning of the Company's 2015 fiscal year. The relevant terms of the warrants are described in the following paragraphs.
Series A – During the year ended August 31, 2009, the Company issued 4,098,000 Series A warrants, each of which was immediately exercisable. Each Series A warrant entitled the holder to purchase one share of common stock for $6.00. All of the Series A warrants expired on December 31, 2012.
Series B – During the year ended August 31, 2009, the Company issued 1,000,000 Series B warrants, each of which was immediately exercisable. Each Series B warrant entitled the holder to purchase one share of common stock for $10.00. All of the Series B warrants expired on December 31, 2012.
Series C – During the year ended August 31, 2010, the Company issued 9,000,000 Series C warrants in connection with a unit offering. Each unit included one convertible promissory note with a face value of $100,000 and 50,000 Series C warrants. Each Series C warrant entitled the holder to purchase one share of common stock for $6.00 and expired on December 31, 2014, if not previously exercised. In the three year period ended August 31, 2015, the following Series C warrants were exercised: 2,561,415 during fiscal 2015, 5,938,585 during fiscal 2014, and 500,000 during fiscal 2013.
F-25
Series D – During the year ended August 31, 2010, the Company issued 1,125,000 Series D warrants to the placement agent for the Series C unit offering. Each Series D warrant entitled the holder to purchase one share of common stock for $1.60, and contained a net settlement provision that provided for exercise of the warrants on a cashless basis. The Series D warrants expired, if not previously exercised, on December 31, 2014. In the three year period ended August 31, 2015, the following warrants were exercised: 1,058 during fiscal 2015, 140,744 during fiscal 2014, and 627,799 during fiscal 2013.
Sales Agent Warrants – During the year ended August 31, 2009, the Company issued 31,733 warrants to the sales agent for an equity offering (the "Sales Agent Warrants"). Each Sales Agent Warrant entitled the holder to purchase two shares of common stock for $1.80 per share. All of the Sales Agent Warrants were exercised during the year ended August 31, 2013.
Investor Relations Warrants – During the year ended August 31, 2012, the Company issued 100,000 warrants to a firm providing investor relations services (the "Investor Relations Warrants"). Each Investor Relations Warrant entitled the holder to purchase one share of common stock for $2.69, and contained a net settlement provision that provided for exercise of the warrants on a cashless basis. The warrants became exercisable in equal quarterly installments over a one year period. During the year ended August 31, 2013, warrants to purchase 50,000 shares became exercisable and warrants to purchase 50,000 shares were forfeited due to early termination of the agreement with the firm. During each of the three years ended August 31, 2015, the following Investor Relations Warrants were exercised: nil during fiscal 2015, 25,000 during fiscal 2014, and 25,000 during fiscal 2013.
The following table summarizes activity for common stock warrants for the fiscal years presented:
Number of Shares Issuable Upon Warrant Exercise | Weighted-Average Exercise Price Per Share | |||||
Outstanding, August 31, 2012 | 15,031,067 | $ | 6.02 | |||
Exercised | 1,216,265 | $ | 3.44 | |||
Forfeited/Expired | 5,148,000 | $ | 6.74 | |||
Outstanding, August 31, 2013 | 8,666,802 | $ | 5.92 | |||
Exercised | 6,104,329 | $ | 5.88 | |||
Forfeited / Expired | — | $ | — | |||
Outstanding, August 31, 2014 | 2,562,473 | $ | 6.00 | |||
Exercised | 2,562,473 | $ | 6.00 | |||
Forfeited / Expired | — | $ | — | |||
Outstanding, August 31, 2015 | — | $ | — | |||
11. | Stock-Based Compensation |
In addition to cash compensation, the Company may compensate certain service providers, including employees, directors, consultants, and other advisors, with equity based compensation in the form of stock options, stock bonus shares, and warrants. The Company records an expense related to equity compensation by pro-rating the estimated grant date fair value of each grant over the period of time that the recipient is required to provide services to the Company (the “vesting phase”). The calculation of fair value is based, either directly or indirectly, on the quoted market value of the Company’s common stock. Indirect valuations are calculated using the Black-Scholes-Merton option pricing model. For the periods presented, all stock-based compensation expense was classified as a component within general and administrative expense in the Company's statements of operations.
The amount of stock-based compensation expense is as follows (in thousands):
For the Years Ended August 31, | |||||||||||
2015 | 2014 | 2013 | |||||||||
Stock options | $ | 4,741 | $ | 1,767 | $ | 1,039 | |||||
Stock bonus shares | 2,950 | 1,201 | 277 | ||||||||
Investor relations warrants | — | — | 46 | ||||||||
$ | 7,691 | $ | 2,968 | $ | 1,362 | ||||||
F-26
General Description of Stock Option and Other Stock Award Plans
The Company has three stock award plans: (i) a 2011 non-qualified stock option plan, (ii) a 2011 incentive stock option plan, and (iii) a 2011 stock bonus plan. Shareholders authorized the issuance of up to 5 million shares under the non-qualified stock option plan, and up to 2 million shares under each of the incentive stock option and stock bonus plans.
Each plan authorizes the issuance of shares of the Company's common stock to persons that exercise options granted pursuant to the plan. Employees, directors, officers, consultants and advisors are eligible to receive such awards, provided that bona fide services be rendered by such consultants or advisors and such services must not be in connection with promoting the Company's stock or the sale of securities in a capital-raising transaction. The option exercise price is determined by the Board of Directors, based on the quoted closing market price of Company's common stock at the time of grant.
As of August 31, 2015, there were 384,500 shares available for future issuance under the non-qualified plan, 2,000,000 shares available for issuance under the incentive stock option plan, and 723,937 shares available for future issuance under the stock bonus plan.
Stock options under the non-qualified stock option plan
During the respective fiscal years, the Company granted the following non-qualified stock options:
For the Years Ended August 31, | |||||||||||
2015 | 2014 | 2013 | |||||||||
Number of options to purchase common shares | 2,377,500 | 433,000 | 1,025,000 | ||||||||
Weighted-average exercise price | $ | 11.55 | $ | 10.37 | $ | 6.05 | |||||
Term (in years) | 10 years | 10 years | 10 years | ||||||||
Vesting Period (in years) | 3-5 years | 5 years | 3-5 years | ||||||||
Fair Value (in thousands) | $ | 13,266 | $ | 3,009 | $ | 4,179 | |||||
The assumptions used in valuing stock options granted during each of the fiscal years presented were as follows:
For the Years Ended August 31, | ||||||||
2015 | 2014 | 2013 | ||||||
Expected term | 6.5 years | 6.7 years | 6.2 years | |||||
Expected volatility | 47 | % | 73 | % | 77 | % | ||
Risk free rate | 1.4 - 2.0% | 1.8 - 2.3% | 0.9 - 2.1% | |||||
Expected dividend yield | 0.0 | % | 0.0 | % | 0.0 | % | ||
Average forfeiture rate | 3.5 | % | 0.0 | % | 0.0 | % | ||
F-27
The following table summarizes activity for stock options for the fiscal years presented:
Number of Shares | Weighted-Average Exercise Price ($) | Weighted-Average Remaining Contractual Life | Aggregate Intrinsic Value ($ thousands) | |||||||||
Outstanding, August 31, 2012 | 4,915,000 | $ | 5.09 | 2.2 years | $ | 3,656 | ||||||
Granted | 1,025,000 | $ | 6.05 | |||||||||
Exercised | (2,120,000 | ) | $ | 1.10 | 15,690 | |||||||
Forfeited | (2,000,000 | ) | $ | 10.00 | ||||||||
Outstanding, August 31, 2013 | 1,820,000 | $ | 4.88 | 8.7 years | 8,160 | |||||||
Granted | 433,000 | $ | 10.37 | |||||||||
Exercised | (61,000 | ) | $ | 3.71 | 481 | |||||||
Expired | (25,000 | ) | $ | 10.32 | ||||||||
Outstanding, August 31, 2014 | 2,167,000 | $ | 5.94 | 8.0 years | 16,287 | |||||||
Granted | 2,377,500 | $ | 11.55 | |||||||||
Exercised | (258,000 | ) | $ | 3.81 | 2,103 | |||||||
Forfeited | (110,000 | ) | $ | 4.97 | ||||||||
Outstanding, August 31, 2015 | 4,176,500 | $ | 9.29 | 8.6 years | $ | 8,187 | ||||||
Outstanding, Exercisable at August 31, 2015 | 1,330,600 | $ | 7.03 | 7.5 years | $ | 5,211 | ||||||
Outstanding, Vested and expected to vest at August 31, 2015 | 4,027,604 | $ | 9.21 | 8.6 years | $ | 8,180 | ||||||
The following table summarizes information about issued and outstanding stock options as of August 31, 2015:
Outstanding Options | Exercisable Options | ||||||||||
Range of Exercise Prices | Options | Weighted-Average Remaining Contractual Life (Years) | Weighted-Average Exercise Price per Share | Options | Weighted-Average Exercise Price per Share | ||||||
Under $5.00 | 679,000 | 6.1 years | $ | 3.53 | 463,000 | $3.52 | |||||
$5.00 - $6.99 | 637,000 | 7.5 years | 6.54 | 412,000 | 6.59 | ||||||
$7.00 - $10.99 | 563,000 | 8.6 years | 9.65 | 89,600 | 8.97 | ||||||
$11.00 - $13.46 | 2,297,500 | 9.6 years | 11.66 | 366,000 | 11.50 | ||||||
Total | 4,176,500 | 8.6 years | $ | 9.29 | 1,330,600 | $7.03 | |||||
The estimated unrecognized compensation cost from unvested stock options as of August 31, 2015, which will be recognized ratably over the remaining vesting phase, is as follows:
Unvested Options at August 31, 2015 | |||
Unrecognized compensation expense (in thousands) | $ | 12,733 | |
Remaining vesting phase | 3.6 years | ||
F-28
Restricted stock awards under the stock bonus plan
The Company grants shares of restricted stock to directors, eligible employees and officers as a part of its equity incentive plan.
Restrictions and vesting periods for the awards are determined by the Compensation Committee of the Board of Directors and are set forth in the award agreements. Each share of restricted stock represents one share of the Company’s common stock to be released from restrictions upon completion of the vesting period. The awards typically vest in equal increments over three to five years. Shares of restricted stock are valued at the closing price of the Company’s common stock on the grant date and are recognized as general and administrative expense over the vesting period of the award.
The following table summarizes activity for restricted stock awards for the fiscal years presented:
Number of Shares | Weighted-Average Grant-Date Fair Value ($) | ||||||
Non-vested, August 31, 2012 | 13,750 | $ | 3.06 | ||||
Granted | 109,096 | $ | 6.41 | ||||
Vested | (76,179 | ) | $ | 5.60 | |||
Forfeited | — | $ | — | ||||
Non-vested, August 31, 2013 | 46,667 | $ | 6.75 | ||||
Granted | 343,780 | $ | 11.34 | ||||
Vested | (97,114 | ) | $ | 11.38 | |||
Forfeited | — | $ | — | ||||
Non-vested, August 31, 2014 | 293,333 | $ | 10.60 | ||||
Granted | 547,699 | $ | 11.17 | ||||
Vested | (208,532 | ) | $ | 11.09 | |||
Forfeited | — | $ | — | ||||
Non-vested, August 31, 2015 | 632,500 | $ | 10.93 | ||||
The estimated unrecognized compensation cost from unvested restricted stock awards as of August 31, 2015, which will be recognized ratably over the remaining vesting phase, is as follows:
Unvested awards as of August 31, 2015 | |||
Unrecognized compensation expense (in thousands) | $ | 6,720 | |
Remaining vesting phase | 2.2 years | ||
F-29
12. | Income Taxes |
The income tax provision is comprised of the following (in thousands):
As of August 31, | |||||||||||
2015 | 2014 | 2013 | |||||||||
Current: | |||||||||||
Federal | $ | (4 | ) | $ | 4 | $ | — | ||||
State | (111 | ) | 111 | — | |||||||
Total current income tax expense (benefit) | $ | (115 | ) | $ | 115 | $ | — | ||||
Deferred: | |||||||||||
Federal | $ | 10,820 | $ | 13,748 | $ | 6,367 | |||||
State | 972 | 1,151 | 503 | ||||||||
Total deferred income tax expense | $ | 11,792 | $ | 14,899 | $ | 6,870 | |||||
Income tax provision | $ | 11,677 | $ | 15,014 | $ | 6,870 | |||||
A reconciliation of expected federal income taxes on income from continuing operations at statutory rates with the expense (benefit) for income taxes is presented in the following table (in thousands):
As of August 31, | |||||||||||
2015 | 2014 | 2013 | |||||||||
Federal income tax at statutory rate | $ | 10,105 | $ | 14,915 | $ | 5,594 | |||||
State income taxes, net of federal tax | 908 | 1,341 | 503 | ||||||||
Statutory depletion | (451 | ) | (1,266 | ) | (929 | ) | |||||
Stock-based compensation | 92 | — | 1,911 | ||||||||
Nondeductible compensation | 850 | 125 | — | ||||||||
Other | 173 | (101 | ) | (209 | ) | ||||||
Income tax provision | $ | 11,677 | $ | 15,014 | $ | 6,870 | |||||
Effective rate expressed as a percentage | 39 | % | 34 | % | 42 | % | |||||
In assessing the realizability of deferred tax assets, the Company considers whether it is more likely than not that some portion or all of the deferred tax assets will not be realized. Management considers all available evidence (both positive and negative) in determining whether a valuation allowance is required. Such evidence includes the scheduled reversal of deferred tax liabilities, projected future taxable income and tax planning strategies in making this assessment. Judgment is required in considering the relative weight of negative and positive evidence. The Company continues to monitor facts and circumstances in the reassessment of the likelihood that operating loss carryforwards, credits and other deferred tax assets will be utilized prior to their expiration. As a result, it may be determined that a deferred tax asset valuation allowance should be established or released. Any increases or decreases in a deferred tax asset valuation allowance would impact net income through offsetting changes in income tax expense.
F-30
The tax effects of temporary differences that give rise to significant components of the deferred tax assets and deferred tax liabilities at each of the fiscal year ends is presented in the following table (in thousands):
As of August 31, | |||||||
2015 | 2014 | ||||||
Deferred tax assets: | |||||||
Net operating loss carryforward | $ | 3,387 | $ | 8,589 | |||
Stock-based compensation | 2,788 | 1,115 | |||||
Statutory depletion | 2,652 | 2,194 | |||||
Unrealized loss on commodity derivative | — | 70 | |||||
Other | 192 | 4 | |||||
Gross deferred tax assets | $ | 9,019 | $ | 11,972 | |||
Deferred tax liabilities: | |||||||
Basis of oil and gas properties | 18,433 | 33,409 | |||||
Unrealized gain on commodity derivative | 593 | — | |||||
Gross deferred tax liabilities | 19,026 | 33,409 | |||||
Deferred tax liability, net | $ | 10,007 | $ | 21,437 | |||
At August 31, 2015, the Company has a net operating loss carryforward for federal and state tax purposes of approximately $21.3 million that could be utilized to offset taxable income of future years. For financial reporting purposes, the Company has net operating losses of approximately $9.2 million for federal and state. The difference of $12.1 million relates to tax deductions for compensation expense for financial reporting purposes for which the benefit will not be recognized until the related deductions reduce taxes payable. The net operating loss carryovers may be carried back two years and forward twenty years from the year the net operating loss was generated. Substantially all of the carryforward will commence expiring in 2031, 2032, and 2033.
The realization of the deferred tax assets related to the NOL carryforwards is dependent on the Company’s ability to generate sufficient future taxable income within the applicable carryforward periods. As of August 31, 2015, the Company believes it will be able to generate sufficient future taxable income within the carryforward periods and, accordingly, believes that it is more likely than not that its net deferred income tax assets will be fully realized.
The ability of the Company to utilize its NOL carryforwards to reduce future taxable income is subject to various limitations under the Internal Revenue Code of 1986, as amended (the “Code”). The utilization of such carryforwards may be limited upon the occurrence of certain ownership changes, including the purchase or sale of stock by 5% shareholders and the offering of stock by the Company during any three-year period resulting in an aggregate change of more than 50% in the beneficial ownership of the Company. In the event of an ownership change, Section 382 of the Code imposes an annual limitation on the amount of a Company’s taxable income that can be offset by these carryforwards. The Company completed a study of the impact of the Code Section 382 limitation on future payments and determined that the statutory provisions were unlikely to limit the Company's ability to realize future tax benefits.
As of August 31, 2015, the Company had no unrecognized tax benefits. The Company believes that there are no new items, nor changes in facts or judgments that should impact the Company’s tax position. Given the substantial NOL carryforwards at both the federal and state levels, it is anticipated that any changes resulting from a tax examination would simply adjust the carryforwards, and would not result in significant interest expense or penalties. Most of the Company's tax returns filed since August 31, 2011 are still subject to examination by tax authorities.
13. | Related Party Transactions |
Whenever the Company engages in transactions with its officers, directors, or other related parties, the terms of the transaction are reviewed by the disinterested directors. All transactions must be on terms no less favorable to the Company than similar transactions with unrelated parties.
Lease Agreement: The Company leases its Platteville facilities under a lease agreement with HS Land & Cattle, LLC (“HSLC”). HSLC is controlled by Ed Holloway and William Scaff, Jr., the Company’s co-Chief Executive Officers. The current
F-31
lease, dated June 30, 2014, is currently on a month-to-month basis. Historically, the lease has been renewed annually. Under this agreement, the Company incurred the following expenses to HSLC for the fiscal years presented (in thousands):
For the Years Ended August 31, | |||||||||||
2015 | 2014 | 2013 | |||||||||
Rent expense | $ | 180 | $ | 180 | $ | 130 | |||||
Mineral Leasing Program: During 2010, the Company initiated a program to acquire mineral interests in several Colorado and Nebraska counties that are considered the eastern portion of the D-J Basin. George Seward, a member of the Company’s board of directors, agreed to lead that program. The Company agreed to compensate certain persons, including Mr. Seward, to assist the Company with the acquisitions at a specific rate per qualifying net mineral acre. The compensation is paid in the form of restricted shares of the Company’s common stock, as follows:
For the Years Ended August 31, | |||||||||||
2015 | 2014 | 2013 | |||||||||
Shares of restricted common stock | — | 15,883 | 31,454 | ||||||||
Value of common stock (in thousands) | $ | — | $ | 106 | $ | 105 | |||||
Mineral Leases Acquired from Director: Mr. Seward owns mineral interests in several Colorado and Nebraska counties. He agreed to lease his interests to the Company in exchange for restricted shares of common stock. The following table discloses the acquisition of mineral leases from Mr. Seward during each of the fiscal years presented:
For the Years Ended August 31, | |||||||||||
2015 | 2014 | 2013 | |||||||||
Mineral acres leased | — | 4,844 | 2,263 | ||||||||
Shares of restricted common stock | — | 40,435 | 22,202 | ||||||||
Value of common stock (in thousands) | $ | — | $ | 313 | $ | 91 | |||||
Revenue Distribution Processing: Effective January 1, 2012, the Company commenced processing revenue distribution payments to all persons that own a mineral interest in wells that it operates. Payments to mineral interest owners included payments to entities controlled by three of the Company’s directors, Ed Holloway, William Scaff Jr, and George Seward. The following table summarizes the royalty payments made to directors or their affiliates for the fiscal years presented (in thousands):
For the Years Ended August 31, | |||||||||||
2015 | 2014 | 2013 | |||||||||
Total royalty payments | $ | 209 | $ | 292 | $ | 304 | |||||
14. | Other Commitments and Contingencies |
Drilling rig
As of August 31, 2015, the Company was using one drilling rig under a contract with Ensign United States Drilling, Inc. The contract for this rig terminates on December 31, 2015. As of August 31, 2015, the remaining minimum payments due under the contract are approximately $2.3 million.
F-32
Volume Commitments
During 2015, the Company entered into agreements that require us to deliver minimum amounts of crude oil to a third party marketer and to two counterparties that transport crude oil via pipelines. Pursuant to these agreements, we must deliver specific amounts, either from our own production or from oil we acquire, over the next five years, as follows:
Year ending August 31, | |||
(in MBbls/year) | |||
2016 | 2,213 | ||
2017 | 4,072 | ||
2018 | 4,072 | ||
2019 | 4,072 | ||
2020 | 4,072 | ||
Thereafter | 1,860 | ||
Total | 20,361 | ||
Additionally, we have committed to deliver 7,500 Bbls of oil per day for the remainder of the 2015 calendar year to a third party refiner. If we are unable to fulfill all of our contractual delivery obligations from our own production, we may be required to pay penalties or damages pursuant to these agreements or we may have to purchase oil from third parties to fulfill our delivery obligations.
Office leases
The Company leases its Platteville offices and other facilities from a related party, as described in Note 13. In addition, subsequent to August 31, 2015, the Company moved its principal offices to leased facilities in Denver. The Denver office lease requires monthly payments of approximately $30,000 and terminates in October 2016.
Litigation
From time to time, the Company is a party to various commercial and regulatory claims, pending or threatened legal action, and other proceedings that arise in the ordinary course of business. It is the opinion of management that none of the current matters of contention are reasonably likely to have a material adverse impact on its business, financial position, results of operations or cash flows.
15. | Supplemental Schedule of Information to the Statements of Cash Flows |
The following table supplements the cash flow information presented in the financial statements for the fiscal years presented (in thousands):
For the Years Ended August 31, | |||||||||||
Supplemental cash flow information: | 2015 | 2014 | 2013 | ||||||||
Interest paid | $ | 2,817 | $ | 989 | $ | 995 | |||||
Income taxes paid | 202 | — | — | ||||||||
Non-cash investing and financing activities: | |||||||||||
Accrued well costs | $ | 33,071 | $ | 71,849 | $ | 25,491 | |||||
Assets acquired in exchange for common stock | 60,221 | 11,184 | 16,684 | ||||||||
Asset retirement costs and obligations | 7,051 | 1,610 | 1,578 | ||||||||
16. | Unaudited Oil and Gas Reserves Information |
Oil and Natural Gas Reserve Information: Proved reserves are the estimated quantities of crude oil, natural gas, and natural gas liquids which geological and engineering data demonstrate with reasonable certainty to be recoverable in future years
F-33
from known reservoirs under existing economic and operating conditions (prices and costs held constant as of the date the estimate is made). Proved developed reserves are reserves that can be expected to be recovered through existing wells with existing equipment and operating methods. Proved undeveloped reserves are reserves that are expected to be recovered from new wells on undrilled acreage, or from existing wells where a relatively major expenditure is required for recompletion.
Proved oil and natural gas reserve information as of the fiscal year ends presented, and the related discounted future net cash flows before income taxes, are based on estimates prepared by Ryder Scott Company LP. Reserve information for the properties was prepared in accordance with guidelines established by the SEC.
The reserve estimates prepared as of each of the fiscal year ends presented were prepared in accordance with “Modernization of Oil and Gas Reporting” published by the SEC. The guidance included updated definitions of proved developed and proved undeveloped oil and gas reserves, oil and gas producing activities and other terms. Proved oil and gas reserves were calculated based on the prices for oil and gas during the twelve-month period before the respective reporting date, determined as the unweighted arithmetic average of the first day of the month price for each month within such period, rather than the year-end spot prices, which had been used in prior years. This average price is also used in calculating the aggregate amount and changes in future cash inflows related to the standardized measure of discounted future cash flows. Undrilled locations can be classified as having proved undeveloped reserves only if a development plan has been adopted indicating that they are scheduled to be drilled within five years of initial booking. The guidance broadened the types of technologies that may be used to establish reserve estimates.
F-34
The following table sets forth information regarding the Company’s net ownership interests in estimated quantities of proved developed and undeveloped oil and gas reserve quantities and changes therein for each of the fiscal years presented:
Oil (MBbl) | Gas (MMcf) | MBOE | ||||||
Balance, August 31, 2012 | 5,086 | 33,446 | 10,660 | |||||
Revision of previous estimates | (194 | ) | (2,924 | ) | (681 | ) | ||
Purchase of reserves in place | 1,000 | 7,361 | 2,228 | |||||
Extensions, discoveries, and other additions | 1,576 | 4,915 | 2,395 | |||||
Sale of reserves in place | — | — | — | |||||
Production | (421 | ) | (2,108 | ) | (773 | ) | ||
Balance, August 31, 2013 | 7,047 | 40,690 | 13,829 | |||||
Revision of previous estimates | 83 | 3,047 | 591 | |||||
Purchase of reserves in place | 1,028 | 5,956 | 2,021 | |||||
Extensions, discoveries, and other additions | 9,142 | 49,289 | 17,357 | |||||
Sale of reserves in place | (35 | ) | (56 | ) | (44 | ) | ||
Production | (941 | ) | (3,747 | ) | (1,566 | ) | ||
Balance, August 31, 2014 | 16,324 | 95,179 | 32,188 | |||||
Revision of previous estimates | (1,699 | ) | (4,889 | ) | (2,513 | ) | ||
Purchase of reserves in place | 4,201 | 21,957 | 7,860 | |||||
Extensions, discoveries, and other additions | 11,465 | 73,392 | 23,696 | |||||
Sale of reserves in place | (629 | ) | (4,337 | ) | (1,352 | ) | ||
Production | (1,970 | ) | (7,344 | ) | (3,194 | ) | ||
Balance, August 31, 2015 | 27,692 | 173,958 | 56,685 | |||||
Proved developed and undeveloped reserves: | ||||||||
Developed at August 31, 2013 | 4,659 | 25,866 | 8,970 | |||||
Undeveloped at August 31, 2013 | 2,388 | 14,824 | 4,859 | |||||
Balance, August 31, 2013 | 7,047 | 40,690 | 13,829 | |||||
Developed at August 31, 2014 | 6,616 | 38,162 | 12,977 | |||||
Undeveloped at August 31, 2014 | 9,708 | 57,017 | 19,211 | |||||
Balance, August 31, 2014 | 16,324 | 95,179 | 32,188 | |||||
Developed at August 31, 2015 | 7,393 | 46,026 | 15,064 | |||||
Undeveloped at August 31, 2015 | 20,299 | 127,932 | 41,621 | |||||
Balance, August 31, 2015 | 27,692 | 173,958 | 56,685 | |||||
Notable changes in proved reserves for the year ended August 31, 2015 included:
• | Purchases of reserves in place. In 2015, purchases of reserves in place of 7,860 MBOE were attributable to the acquisition of proved reserves from Bayswater. Please see Note 3 for further information. |
• | Revision of previous estimates. In 2015, revisions to previous estimates decreased proved developed and undeveloped reserves by a net amount of 2,513 MBOE. As the Company continued to revise its drilling plans toward horizontal drilling, the vertical proved undeveloped and vertical developed non-producing locations were removed from its development plan. |
• | Extensions and discoveries. In 2015, total extensions and discoveries of 23,696 MBOE were primarily attributable to successful drilling in the Wattenberg Field. The Company drilled 67 successful exploratory wells. In addition, successful drilling by other operators in adjacent acreage allowed us to increase our proved undeveloped locations. |
F-35
Notable changes in proved reserves for the year ended August 31, 2014 included:
• | Purchases of reserves in place. In 2014, purchases of reserves in place of 2,021 MBOE were attributable to the acquisition of producing oil and gas wells and undeveloped acreage from Trilogy Resources, LLC and Apollo Operating, LLC. Please see Note 3 for further information. |
• | Revision of previous estimates. In 2014, revisions to previous estimates increased proved developed and undeveloped reserves by a net amount of 591 MBOE. The prices for the 2014 oil and gas reserves are based on the 12 month arithmetic average for the first of month prices as adjusted for our differentials from September 1, 2013 through August 31, 2014. The 2014 crude oil price of $89.48 per barrel (West Texas Intermediate Cushing) was $3.08 higher than the 2013 crude oil price of $86.40 per barrel. The 2014 natural gas price of $5.03 per Mcf (Henry Hub) was $0.63 higher than the 2013 price of $4.40 per Mcf. |
• | Extensions and discoveries. In 2014, total extensions and discoveries of 17,357 MBOE were primarily attributable to successful drilling in the Wattenberg Field. The new producing wells in this area and their adjacent proved undeveloped locations added during the year increased the Company’s proved reserves. |
Notable changes in proved reserves for the year ended August 31, 2013 included:
• | Purchases of reserves in place. In 2013, purchases of reserves in place of 2,228 MBOE were attributable to the acquisition of 36 producing oil and gas wells and undeveloped acreage from Orr Energy, LLC. |
• | Revision of previous estimates. In 2013, revisions to previous estimates decreased proved developed and undeveloped reserves by a net amount of 681 MBOE as the Company’s drilling schedule was adjusted to reflect the elimination of previously planned vertical drilling locations as the development focus shifted from vertical to horizontal drilling. |
• | Extensions and discoveries. In 2013, total extensions and discoveries of 2,395 MBOE were primarily attributable to successful drilling in the Wattenberg Field. The new producing wells in this area and their adjacent proved undeveloped locations added during the year increased the Company’s proved reserves. |
Standardized Measure of Discounted Future Net Cash Flows: The following analysis is a standardized measure of future net cash flows and changes therein related to estimated proved reserves. Future oil and gas sales have been computed by applying average prices of oil and gas during each of the fiscal years presented. Future production and development costs were computed by estimating the expenditures to be incurred in developing and producing the proved oil and gas reserves at the end of the year, based on year-end costs. The calculation assumes the continuation of existing economic conditions, including the use of constant prices and costs. Future income tax expenses were calculated by applying year-end statutory tax rates, with consideration of future tax rates already legislated, to future pretax cash flows relating to proved oil and gas reserves, less the tax basis of properties involved and tax credits and loss carryforwards relating to oil and gas producing activities. All cash flow amounts are discounted at 10% annually to derive the standardized measure of discounted future cash flows. Actual future cash inflows may vary considerably, and the standardized measure does not necessarily represent the fair value of the Company’s oil and gas reserves. Actual future net cash flows from oil and gas properties will also be affected by factors such as actual prices the Company receives for oil and gas, the amount and timing of actual production, supply of and demand for oil and gas, and changes in governmental regulations or taxation.
The following table sets forth the Company’s future net cash flows relating to proved oil and gas reserves based on the standardized measure prescribed by the SEC (in thousands):
For the Years Ended August 31, | |||||||||||
2015 | 2014 | 2013 | |||||||||
Future cash inflow | $ | 2,046,615 | $ | 1,839,987 | $ | 749,030 | |||||
Future production costs | (653,009 | ) | (395,019 | ) | (146,352 | ) | |||||
Future development costs | (510,720 | ) | (412,517 | ) | (108,290 | ) | |||||
Future income tax expense | (144,399 | ) | (252,925 | ) | (113,545 | ) | |||||
Future net cash flows | 738,487 | 779,526 | 380,843 | ||||||||
10% annual discount for estimated timing of cash flows | (372,658 | ) | (376,827 | ) | (199,111 | ) | |||||
Standardized measure of discounted future net cash flows | $ | 365,829 | $ | 402,699 | $ | 181,732 | |||||
There have been significant fluctuations in the posted prices of oil and natural gas during the last three years. Prices actually received from purchasers of the Company’s oil and gas are adjusted from posted prices for location differentials, quality differentials, and Btu content. Estimates of the Company’s reserves are based on realized prices.
F-36
The following table presents the prices used to prepare the reserve estimates, based upon the unweighted arithmetic average of the first day of the month price for each month within the twelve-month period prior to the end of the respective reporting period presented as adjusted for our differentials:
Oil (Bbl) | Gas (Mcf) | ||||||
August 31, 2013 (Average) | $ | 86.40 | $ | 4.40 | |||
August 31, 2014 (Average) | $ | 89.48 | $ | 5.03 | |||
August 31, 2015 (Average) | $ | 53.27 | $ | 3.28 | |||
The prices for the 2015 oil and gas reserves are based on the twelve-month arithmetic average for the first of month prices as adjusted for our differentials from September 1, 2014 through August 31, 2015. The 2015 crude oil price of $53.27 per barrel (West Texas Intermediate Cushing) was $36.21 lower than the 2014 crude oil price of $89.48 per barrel. The 2015 natural gas price of $3.28 per Mcf (Henry Hub) was $1.75 lower than the 2014 price of $5.03 per Mcf.
Changes in the Standardized Measure of Discounted Future Net Cash Flows: The principle sources of change in the standardized measure of discounted future net cash flows are (in thousands):
For the Years Ended August 31, | |||||||||||
2015 | 2014 | 2013 | |||||||||
Standardized measure, beginning of year | $ | 402,699 | $ | 181,732 | $ | 102,505 | |||||
Sale and transfers, net of production costs | (98,486 | ) | (86,808 | ) | (38,569 | ) | |||||
Net changes in prices and production costs | (233,051 | ) | 15,828 | (4,550 | ) | ||||||
Extensions, discoveries, and improved recovery | 173,918 | 300,087 | 70,191 | ||||||||
Changes in estimated future development costs | 10,002 | (20,817 | ) | (6,006 | ) | ||||||
Development costs incurred during the period | 4,957 | 15,000 | 5,106 | ||||||||
Revision of quantity estimates | (38,340 | ) | 4,589 | (14,214 | ) | ||||||
Accretion of discount | 57,629 | 23,612 | 35,103 | ||||||||
Net change in income taxes | 58,547 | (76,616 | ) | (7,850 | ) | ||||||
Divestitures of reserves | (19,234 | ) | (925 | ) | — | ||||||
Purchase of reserves in place | 56,795 | 47,017 | 40,016 | ||||||||
Changes in timing and other | (9,607 | ) | — | — | |||||||
Standardized measure, end of year | $ | 365,829 | $ | 402,699 | $ | 181,732 | |||||
F-37
17. | Unaudited Quarterly Financial Data |
The Company’s unaudited quarterly financial information for the years ended August 31, 2015 and 2014 is as follows (in thousands, except share data):
For the Year Ended August 31, 2015 | |||||||||||||||
First Quarter | Second Quarter | Third Quarter | Fourth Quarter | ||||||||||||
Revenues | $ | 42,538 | $ | 23,713 | $ | 26,033 | $ | 32,559 | |||||||
Expenses | 27,783 | 25,417 | 29,102 | 44,919 | |||||||||||
Operating income (loss) | 14,755 | (1,704 | ) | (3,069 | ) | (12,360 | ) | ||||||||
Other income (expense) | 18,140 | 9,563 | (1,245 | ) | 5,639 | ||||||||||
Income (loss) before income taxes | 32,895 | 7,859 | (4,314 | ) | (6,721 | ) | |||||||||
Income tax provision (benefit) | 11,744 | 3,207 | (1,833 | ) | (1,441 | ) | |||||||||
Net income (loss) | $ | 21,151 | $ | 4,652 | $ | (2,481 | ) | $ | (5,280 | ) | |||||
Net income (loss) per common share: (1) | |||||||||||||||
Basic | $ | 0.27 | $ | 0.05 | $ | (0.02 | ) | $ | (0.05 | ) | |||||
Diluted | $ | 0.26 | $ | 0.05 | $ | (0.02 | ) | $ | (0.05 | ) | |||||
Weighted-average shares outstanding: | |||||||||||||||
Basic | 79,008,719 | 89,903,288 | 104,234,519 | 105,084,651 | |||||||||||
Diluted | 80,141,152 | 90,636,107 | (2) | (2) | |||||||||||
For the Year Ended August 31, 2014 | |||||||||||||||
First Quarter | Second Quarter | Third Quarter | Fourth Quarter | ||||||||||||
Revenues | $ | 19,266 | $ | 23,028 | $ | 25,672 | $ | 36,253 | |||||||
Expenses | 12,048 | 13,550 | 14,413 | 20,744 | |||||||||||
Operating income | 7,218 | 9,478 | 11,259 | 15,509 | |||||||||||
Other income (expense) | 2,269 | (1,979 | ) | (983 | ) | 1,096 | |||||||||
Income before income taxes | 9,487 | 7,499 | 10,276 | 16,605 | |||||||||||
Income tax provision | 3,387 | 2,338 | 3,116 | 6,173 | |||||||||||
Net income | $ | 6,100 | $ | 5,161 | $ | 7,160 | $ | 10,432 | |||||||
Net income per common share: (1) | |||||||||||||||
Basic | $ | 0.08 | $ | 0.07 | $ | 0.09 | $ | 0.13 | |||||||
Diluted | $ | 0.08 | $ | 0.07 | $ | 0.09 | $ | 0.13 | |||||||
Weighted-average shares outstanding: | |||||||||||||||
Basic | 73,674,865 | 76,203,938 | 77,176,420 | 77,771,916 | |||||||||||
Diluted | 76,044,605 | 77,990,416 | 79,008,619 | 79,698,720 | |||||||||||
1 | The sum of net income (loss) per common share for the four quarters may not agree with the annual amount reported because the number used as the denominator for each quarterly computation is based on the weighted-average number of shares outstanding during that quarter whereas the annual computation is based upon an average for the entire year. |
2 | Common share equivalents were excluded from the calculation of net income (loss) per share as the inclusion of the common share equivalents was anti-dilutive. |
F-38
18. | Subsequent Events |
Kauffman Acquisition
On September 14, 2015, the Company entered into an agreement with K.P. Kauffman Company, Inc. ("Kauffman") to acquire from Kauffman approximately 4,300 net acres of oil and gas leasehold interests and related assets in the D-J Basin of Colorado for $35 million in cash and approximately 4.4 million restricted shares of the Company's common stock, in each case subject to certain customary adjustments. The agreement contains provisions relating to title and environmental due diligence, purchase price adjustments, indemnification, representations and covenants typical for this type of transaction. Current net production associated with the purchased assets is approximately 1,200 barrels of oil equivalent per day (BOED). The transaction has an effective date of September 1, 2015 and is expected to close on or before October 30, 2015.
F-39
SIGNATURES
Pursuant to the requirements of Section 13 or 15(a) of the Securities Exchange Act of 1934, the Registrant has duly caused this Report to be signed on its behalf by the undersigned, thereunto duly authorized on the 15th day of October, 2015.
SYNERGY RESOURCES CORPORATION | |
Ed Holloway, Co-Chief Executive Officer (Co-Principal Executive Officer) | |
William E. Scaff, Jr., Co-Chief Executive Officer (Co-Principal Executive Officer) | |
James P. Henderson, Principal Financial Officer | |
Frank L. Jennings, Principal Accounting Officer | |
Pursuant to the requirements of the Securities Exchange Act of l934, this Report has been signed below by the following persons on behalf of the Registrant and in the capacities and on the dates indicated.
Signature | Title | Date | ||
/s/ Ed Holloway | Co-Chief Executive Officer and Director | October 15, 2015 | ||
Ed Holloway | (Principal Executive Officer) | |||
/s/ William E. Scaff, Jr. | Co-Chief Executive Officer, Treasurer and Director | October 15, 2015 | ||
William E. Scaff, Jr. | (Principal Executive Officer) | |||
/s/ Lynn A. Peterson | President and Director | October 15, 2015 | ||
Lynn A. Peterson | ||||
/s/ Rick Wilber | Director | October 15, 2015 | ||
Rick Wilber | ||||
/s/ Raymond E. McElhaney | Director | October 15, 2015 | ||
Raymond E. McElhaney | ||||
/s/ Bill M. Conrad | Director | October 15, 2015 | ||
Bill M. Conrad | ||||
/s/ R. W. Noffsinger, III | Director | October 15, 2015 | ||
R. W. Noffsinger, III | ||||
/s/ George Seward | Director | October 15, 2015 | ||
George Seward | ||||
/s/ Jack Aydin | Director | October 15, 2015 | ||
Jack Aydin | ||||