Attached files
| file | filename |
|---|---|
| 8-K - FORM 8-K - SIMMONS FIRST NATIONAL CORP | gff8k_021115.htm |
Exhibit 99.1

Investo r Presentation N AS D A Q - GS: SFNC
Certain statements contained in this presentation m a y not be based on his t orica l fact s an d ar e “for w ard - looking statements” within the meaning of Sec t ion 27A of the Securities Act of 1933, as amended, and Section 21E of the Securities E x change Act of 1934, as ame n ded. These for w ard - looking statements m a y b e identifie d b y referenc e to a futur e period(s ) o r b y th e us e o f for w ard - lookin g terminol og y , such as “anticipate , ” “estimate , ” “expect , ” “foresee , ” “m a y , ” “might , ” “will , ” “would , ” “could” or “intend , ” future or conditional v e rb tenses, and v a riations or negati v e s of such terms. These for w ard - looking sta t ements include, without lim i tation, t h ose relating to the Compa n y ’ s future growth, re v e nue, assets, asset qualit y , profitabilit y an d custome r service , critic al accounting policies, net interest margin, non - interest re v e nue, mar k et c o nditions related to the Compa n y ’ s sto c k repurchas e prog r am , allo w anc e for loa n losses , th e effec t o f certai n new accounting standards on the Compa n y ’ s financial statements, income tax deductions, credit qualit y , the le v e l of credit losses from lending commitment s , net interest re v e nue, interest r a te sensitivit y , loa n los s experien ce, liquidit y , capital resources, mar k et ris k , earnings, effect of pending litigation, acquisition st r a teg y , legal and regulatory li m itations and compliance and competition. R e aders are cautioned not to place undue reliance on the for w ard - looking statements contained in this presentation in that actual results could differ m a terially from those indicated in such for w ard - looking statements, due to a v ariet y o f factors . Thes e factor s inc l ude, but are not limited t o , changes in the Compa n y ’ s ope r ating or expansion st r ateg y , a v ailabilit y o f an d cost s assoc i ated with obtaining adequate and tim e l y source s o f liquidit y , th e abilit y to maintain credit qualit y , possible ad v erse rulings, judgments, settlements and o t her outcomes of pending litigation, the ability of the Compa n y to collect amounts due under loan agreements, change s i n consume r preferences, effecti v eness of the Compa n y ’ s interest r a te risk manag e ment st r a tegies, l a ws and r e gulations affecting financial institutions in gene r a l or relating to ta x e s, the effect of pending or future legislation, the ability of the Compa n y to repurchase its Common Stock on f av o r a ble terms and other risk factors . Othe r rele v an t ris k factor s m a y b e detailed from time to time in the Compa n y ’ s press releases and filings with the Securities and E x change Commission. W e underta k e no obligation to update the s e for w ard - looking statements to refle c t e v ents or circumstances that occur after the date of this R e port. Forward - Lookin g Statement 2
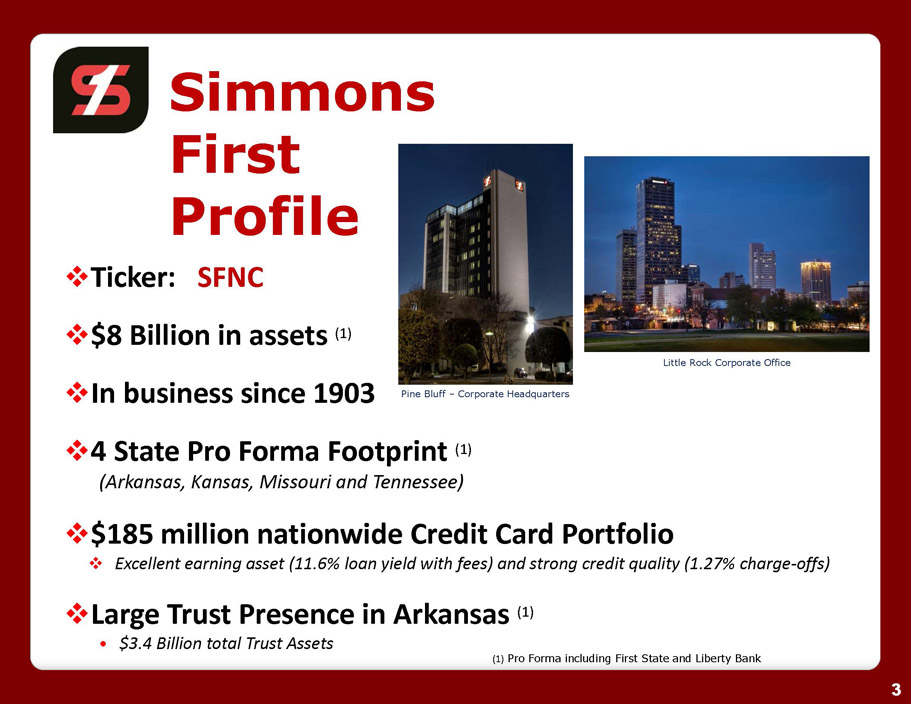
□ Tic k er : SFNC □ $8 Billion in ass e ts (1) □ In business since 1903 □ 4 S ta t e P r o F o rm a F ootpri n t (1) (Ar k ansas, K ansas , Missouri an d T ennessee) □ $185 million n a tio n wid e C r edi t Ca r d P o rt f olio □ E x c e lle n t earning asse t (11.6 % loa n yiel d wit h f ees) an d s t r on g credit qualit y (1.27 % charg e-of f s) □ La r g e T r u s t P r esence in Ar k ansas (1) • $3. 4 Billio n t o t a l T r u s t Assets Simmons First Profile P i ne Bl u f f – Corporate Headquarters 3 Littl e R o c k Corporat e Office (1 ) Pr o Form a i n c l ud i ng F i rs t Stat e an d L i bert y Bank
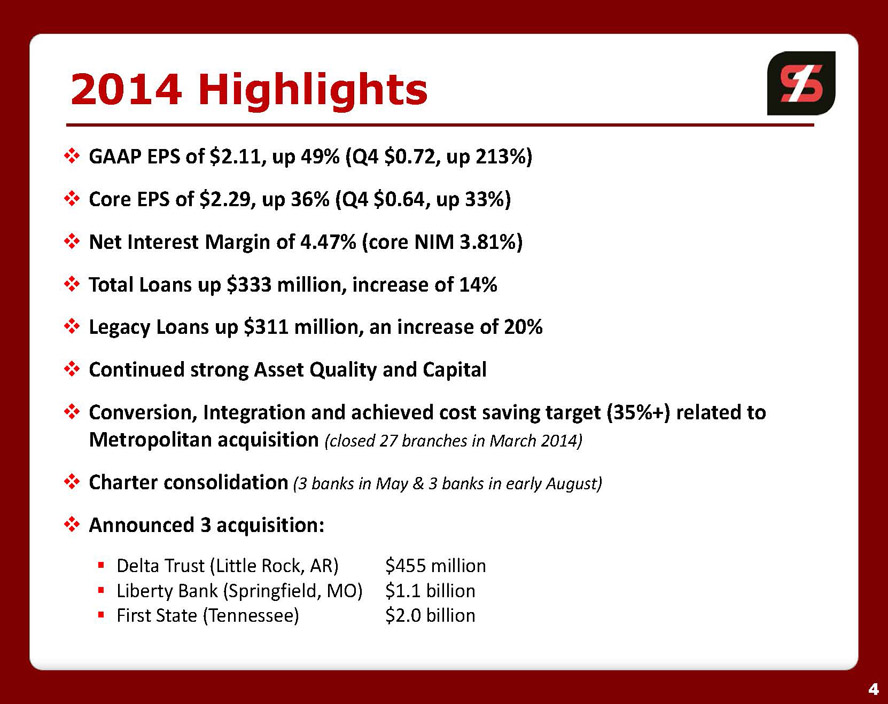
□ GAAP EP S of $2.11, up 49% (Q4 $0.72, up 213%) □ Co r e EP S of $2.29, up 36% (Q4 $0.64, up 33%) □ Ne t I n t e r e s t Ma r gin of 4.47% ( c o r e NIM 3.81%) □ T o t a l Loans up $333 million, inc r eas e of 14% □ Le g ac y Loans up $311 million, an inc r eas e of 20% □ Co n t inued s t r ong Ass e t Qualit y and Capi t a l □ Co n v e r sion, I n t eg r a t ion and achie v ed c o s t s a ving t a rg e t (35%+) r e l a t ed to Met r opoli t an acquisition (closed 2 7 branche s i n Marc h 2014) □ Char t e r c onsolid a t ion ( 3 ban k s i n Ma y & 3 ban k s i n early Augu s t) □ Announced 3 acquisition: ▪ Del t a T r u s t (Li t tl e R o c k , AR) ▪ Libert y Bank (Springfield, MO) ▪ Fi r s t S t a t e ( T ennessee) $455 million $1.1 billion $2.0 billion 201 4 Highlights 4
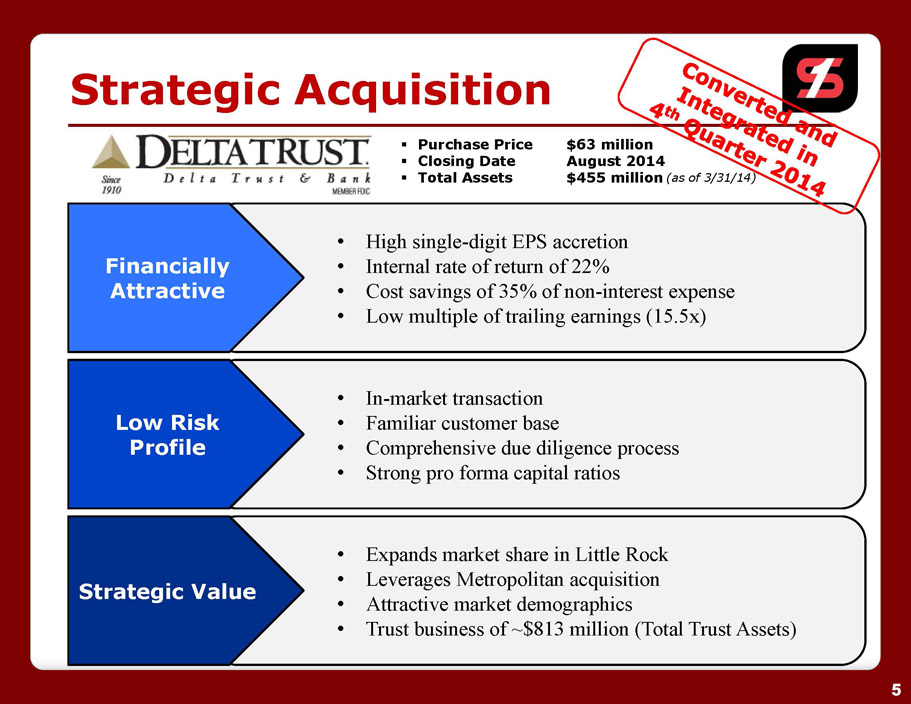
• Hig h single - digi t EP S accretion • Internal rate of return of 22% • Cost savings of 35% of non - interest expense • Lo w multipl e o f trailin g earning s (15.5x) Strategi c Acquisition Financially Attractive • In - marke t transaction • Familia r custome r base • Comprehensiv e du e diligenc e process • Stron g pr o form a capita l ratios Low Risk Profile • Expand s marke t shar e i n Littl e Rock • Leverage s Metropolita n acquisition • Attractiv e marke t demographics • T r us t busines s o f ~$81 3 millio n ( T ota l T r us t Assets) Strategic Value ▪ Purchas e Price ▪ Closin g Date ▪ Tota l Assets $6 3 million Augus t 2014 $45 5 millio n (a s o f 3/31/14) 5
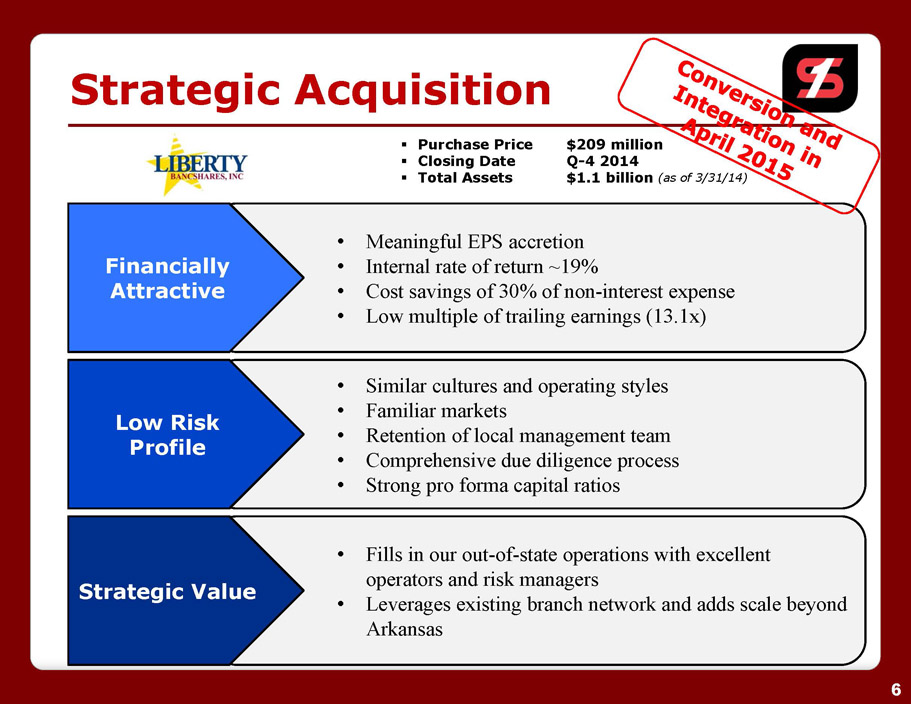
• Meaningfu l EP S accretion • Internal rate of return ~19% • Cost savings of 30% of non - interest expense • Lo w multipl e o f trailin g earning s (13.1x) Strategi c Acquisition Financially Attractive • Simila r culture s an d operatin g styles • Familia r markets • Retentio n o f loca l managemen t team • Comprehensiv e du e diligenc e process • Stron g pr o form a capita l ratios Low Risk Profile • Fill s i n ou r out - of - stat e operation s wit h excellent operators and risk managers • Leverage s existin g branc h networ k an d add s scal e beyond Arkansas Strategic Value ▪ Purchas e Price ▪ Closin g Date ▪ Tota l Assets $20 9 million Q - 4 2014 $1. 1 billio n (a s o f 3/31/14) 6
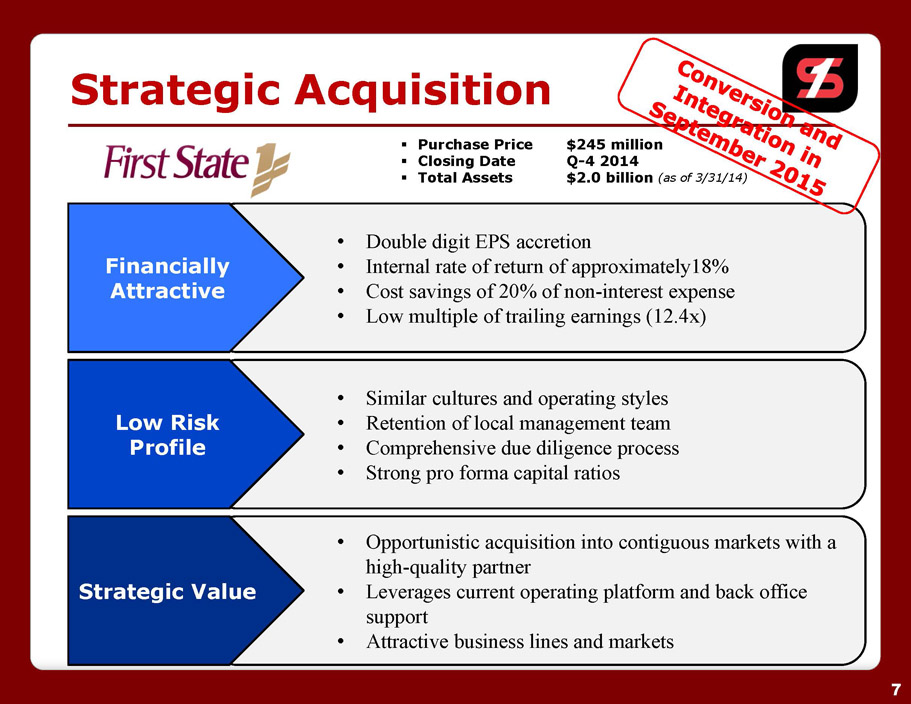
• Doubl e digi t EP S accretion • Internal rate of return of approximately18% • Cost savings of 20% of non - interest expense • Lo w multipl e o f trailin g earning s (12.4x) Strategi c Acquisition Financially Attractive • Simila r culture s an d operatin g styles • Retentio n o f loca l managemen t team • Comprehensiv e du e diligenc e process • Stron g pr o form a capita l ratios Low Risk Profile • Opportunisti c acquisitio n int o contiguou s market s wit h a high - qualit y partner • Leverage s curren t operatin g platfor m an d bac k o f fice support • Attractiv e busines s line s an d markets Strategic Value ▪ Purchas e Price ▪ Closin g Date ▪ Tota l Assets $24 5 million Q - 4 2014 $2. 0 billio n (a s o f 3/31/14) 7
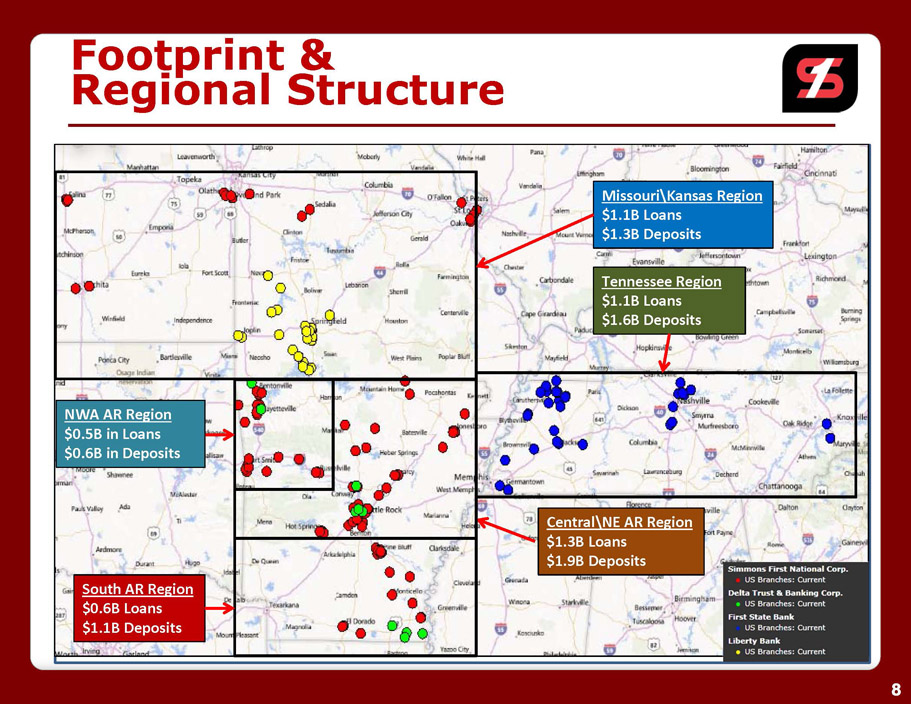
Footprin t & Regiona l Structure South AR Region $0.6 B Loans $1.1 B Deposits NWA AR Region $0.5 B in Loans $0.6 B in Deposits Central \ NE AR Region $1.3 B Loans $1.9 B Deposits Missouri \ Kansas Region $1.1 B Loans $1.3 B Deposits Tennessee Region $1.1 B Loans $1.6 B Deposits 8
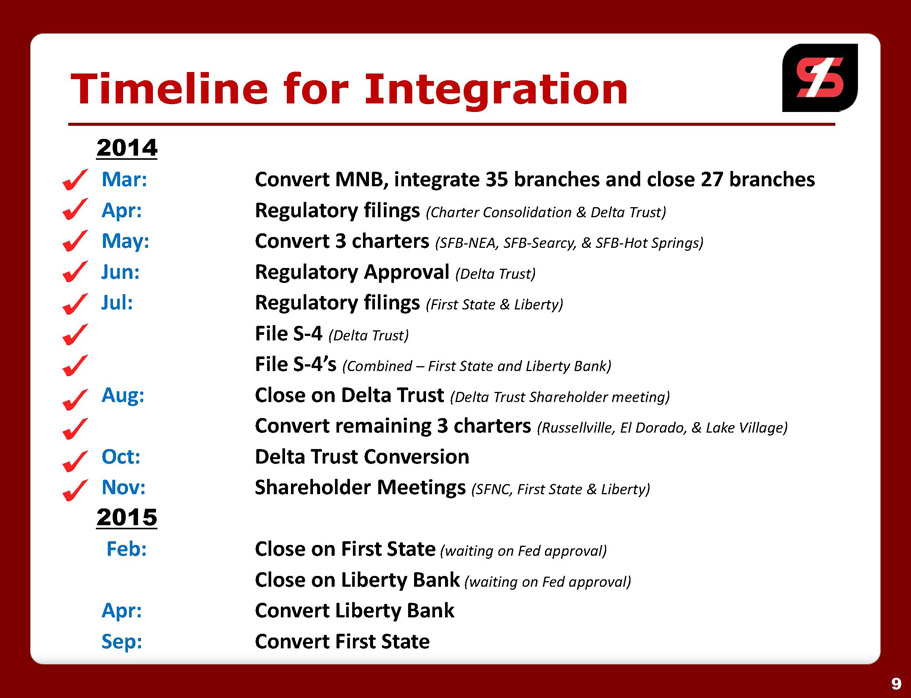
Timelin e fo r Integration 2014 Mar: Apr: M a y: Jun: Jul: Co n v er t MN B , i n t eg r a t e 35 b r anches and clos e 27 b r anches R egul at o r y filing s (Char t e r Consolid at io n & Del t a T ru s t ) Co n v er t 3 char t e r s (SF B- N E A , SF B- Searc y , & SF B-Hot Springs) R egul at o r y App r o v a l (Del t a T ru s t ) R egul at o r y filing s (Fir s t S t a t e & Liberty) File S - 4 (Del t a T ru s t ) File S - 4 ’ s (Combined – F ir s t S t a t e and Libert y Bank) Clos e on Del t a T ru s t (Del t a T ru s t Shareholde r me e ting) Co n v er t r e mainin g 3 char t e r s (Russellville, El Dorad o , & La k e Vill a g e) Del t a T ru s t Co n v e r sion Sha r eholde r Meeting s (SFNC , Fir s t S t a t e & Liberty) Aug: Oct : Nov : 2015 F eb: Clos e on Fi r s t S ta t e (waiting on F e d approval) Clos e on Liberty Bank (waiting on F e d approval) Co n v er t Liberty Bank Co n v er t Fi r s t S ta t e Apr: Sep: 9
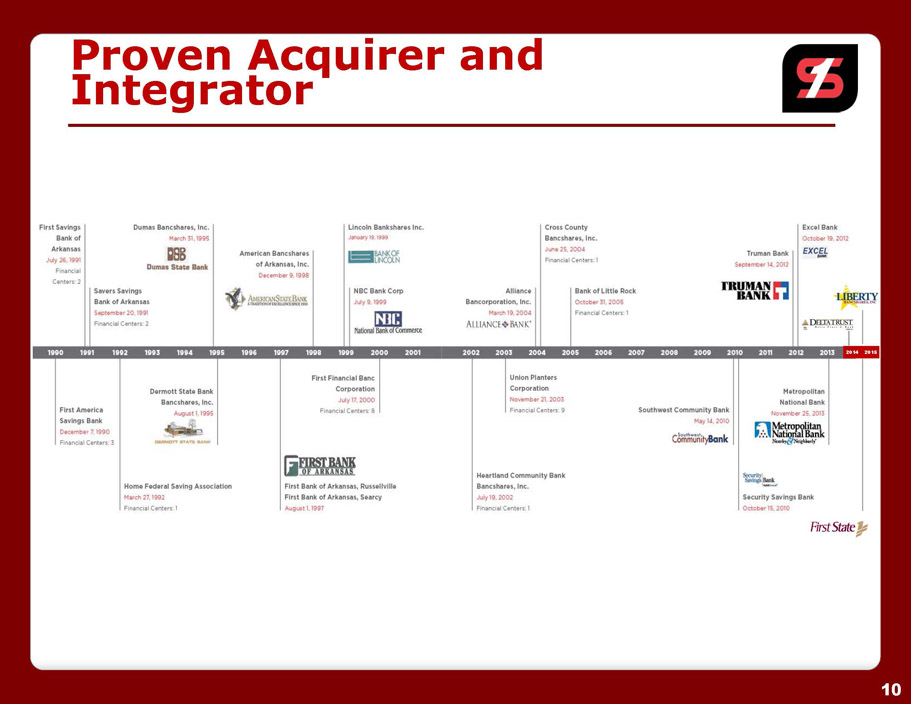
Prove n Acquire r and Integrator 20 1 4 20 15 10
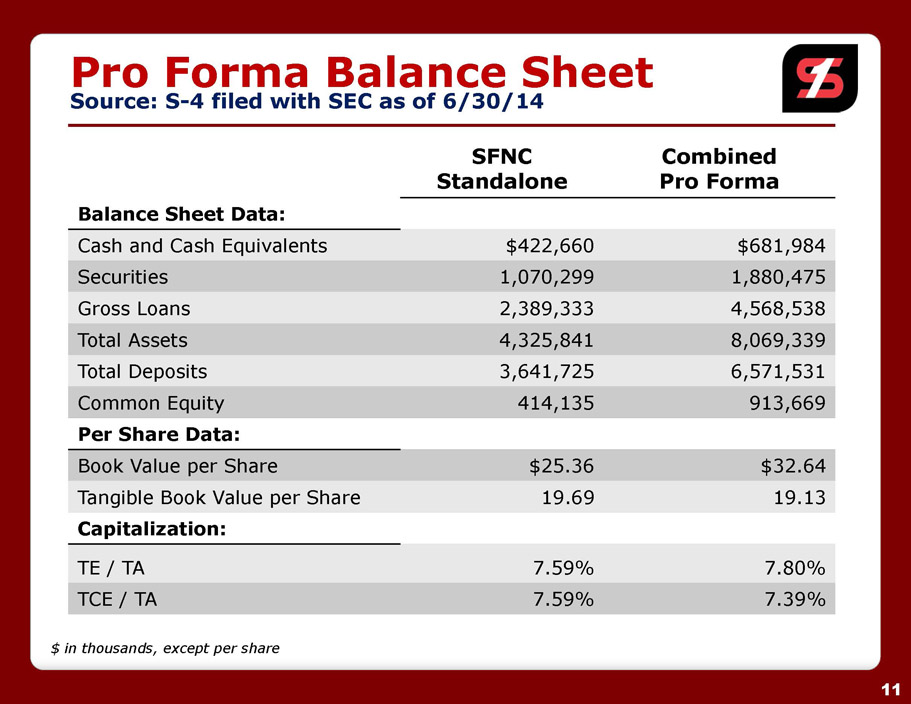
Pr o Form a Balanc e Sheet Source : S - 4 file d wit h SE C a s o f 6/30/14 11 SFNC Standalone Combined Pr o Forma Balanc e Shee t Data: $ in thousands, except per share Cas h an d Cas h Equi v alents $422,660 $681,984 Securities 1,070,299 1,880,475 Gros s Loans 2 ,389,333 4,568,538 T ota l A ssets 4,325,841 8,069,339 T ota l Deposits 3,641,725 6,571,531 Commo n E qui t y 414,135 913,669 Per Share Data: Book V a lue per Share $25.36 $32.64 T a ngible Book V a lue per Share 19.69 19.13 Capitalization: TE / T A 7.59% 7.80% T C E / T A 7.59% 7.39%
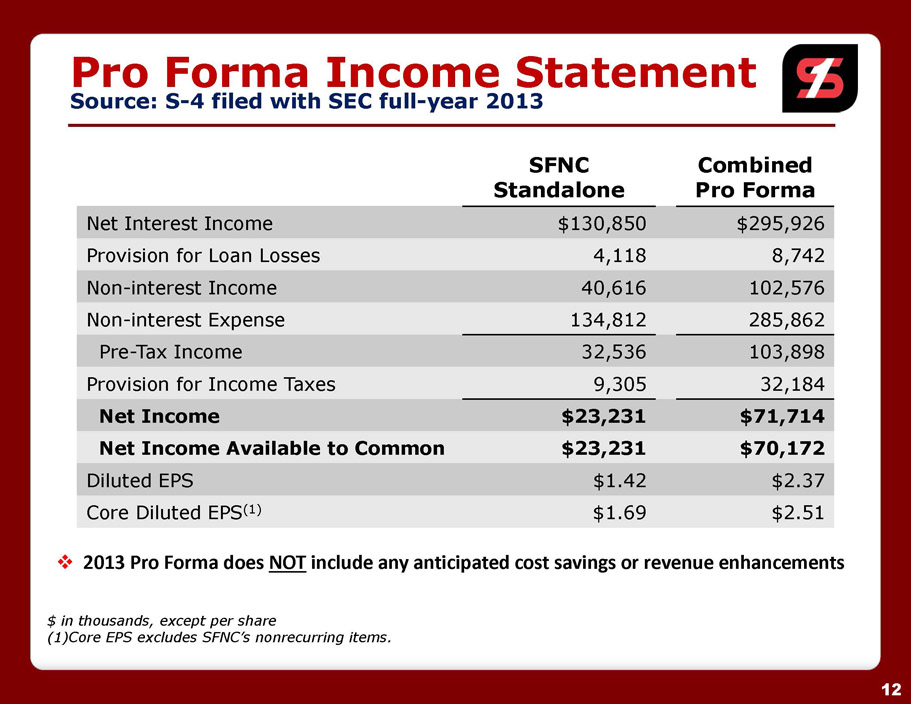
Pr o Form a Incom e Statement Source: S - 4 filed with SEC full - year 2013 TB U – SFN C a s o f 2013 (BF / DG) 12 SFNC Standalone Combined Pr o Forma $ in thousands, except per share (1 ) Core EPS excludes SFNC’s nonrecurring items. □ 2013 P r o F o r m a does N O T include a n y a n ticip a t ed cos t s a ving s o r r e v e nu e enhanceme n ts Ne t Interes t Income $130,850 $295,926 Pr o vision for Loan Losses 4,118 8,742 Non - interes t Income 40,616 102,576 Non - interes t Expense 134,812 285,862 Pre - T a x Income 32,536 103,898 Pr o vision for Income T a x e s 9,305 32,184 Net Income $23,231 $71,714 Net Income Available to Common $23,231 $70,172 Diluted EPS $1.42 $2.37 Cor e Dilute d EP S (1) $1.69 $2.51
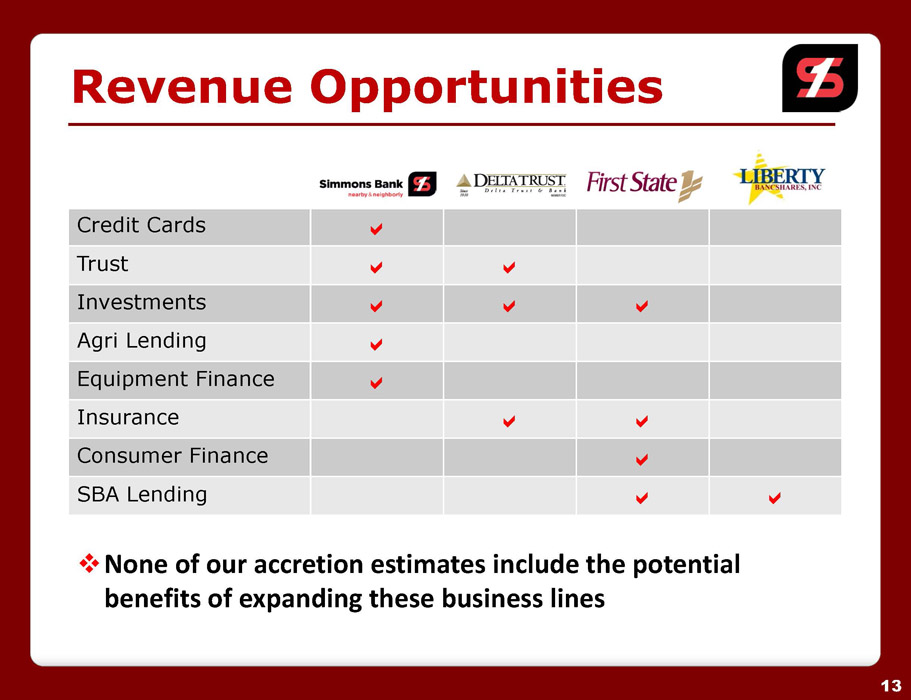
Revenue Opportunities Credi t Cards T r u s t I nv e stments Agri Lending Equipmen t Finance Insu r ance Consume r Finance SBA Lending □ None of our acc r e tion e s tim a t e s include the po t e n tial ben e fits of e xpanding these business lines 13
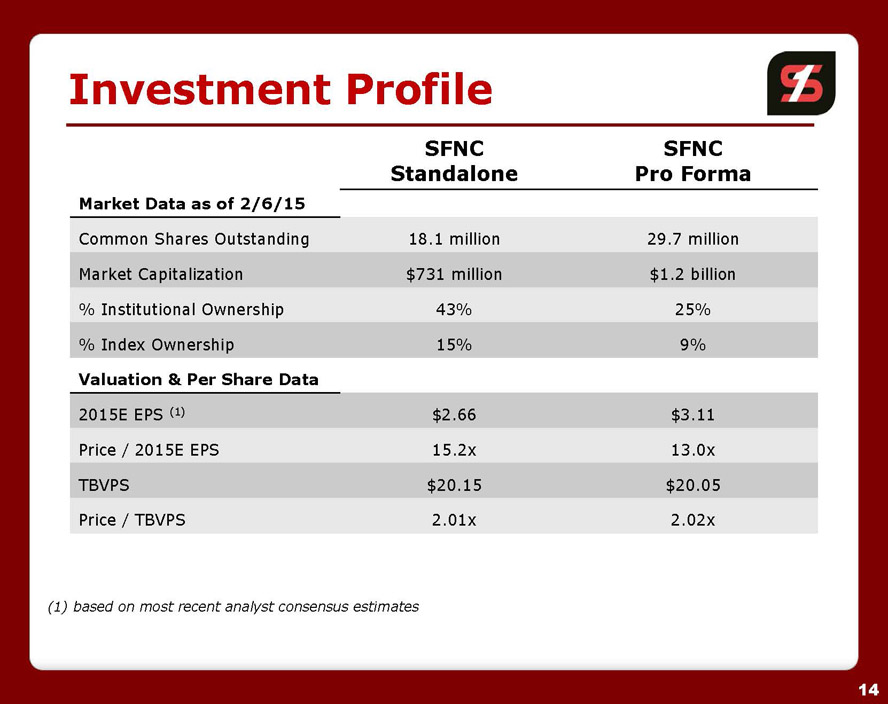
Investmen t Profile (1) based on most recent analyst consensus estimates 14 SFNC Standalone SFNC Pr o Forma Market Data as of 2/6/15 Valuation & Per Share Data Commo n Share s Outstanding 18. 1 million 29. 7 million Mar k e t Capitalization $73 1 million $1. 2 billion % Institutiona l Ownersh i p 43% 25% % Inde x Ownersh i p 15% 9% 2015 E EP S (1) $2.66 $3.11 Pric e / 2015E EPS 15.2x 13.0x TBVPS $20.15 $20.05 Price / TBVPS 2 .01x 2.02x
▪ Multiple p a th s t o abo v e av e r a g e earning s g r owth □ M&A acc r e t ion, co s t s a ving s and r e v enue enhanceme n ts □ Co n t inue d e fficienc y initi a ti v es □ O r g a nic le g a cy loa n g r owth □ Risin g i n t e r e s t r a t es ▪ Experienced an d deep mana g e me n t ▪ E x ce ptional balance she e t ▪ Consi s t e n t hi s t ori c al earning s per f ormance ▪ A t t r acti v e dividend yield Commi t t ed t o deli v ering a sophi s t i c a t ed an d di v e r s e r a n g e of p r oduct s with th e le v e l of se r vice of a communit y bank Wh y Simmon s First? 15
Supplemental Information 16
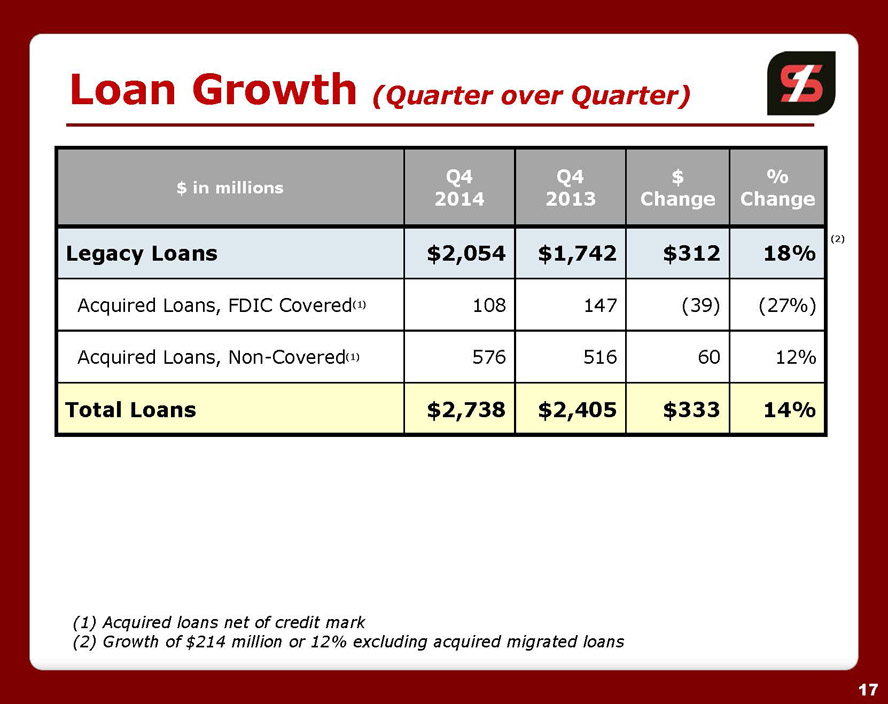
Loa n Growt h (Quarte r ove r Quarter) (1) Acquire d loan s ne t o f credi t mark (2) Growt h o f $21 4 millio n o r 12% excludin g acquire d migrate d loans ( 2) 17 $ in millions Q4 2014 Q4 2013 $ Change % Change Legac y Loans $2,054 $1,742 $312 18% Acquire d Loans , FDI C C ov ere d ( 1) 108 147 (39) (27%) Acquire d Loans , Non - C ov ere d ( 1) 576 516 60 12% Tota l Loans $2,738 $2,405 $333 14%
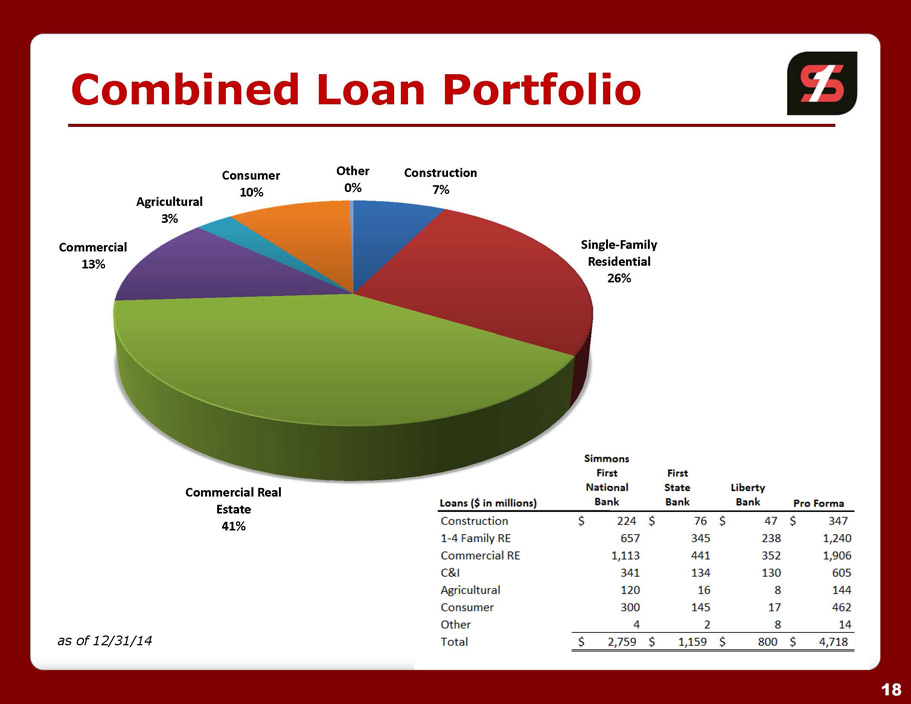
Combine d Loa n Portfolio Cons truction 7% 18 Single- F a mily R e s id e n ti al 26% Comme r c ial R e al E state 41% Comme r c ial 13% Agricultu r al 3% Consumer 10% Other 0% a s o f 12/31/14
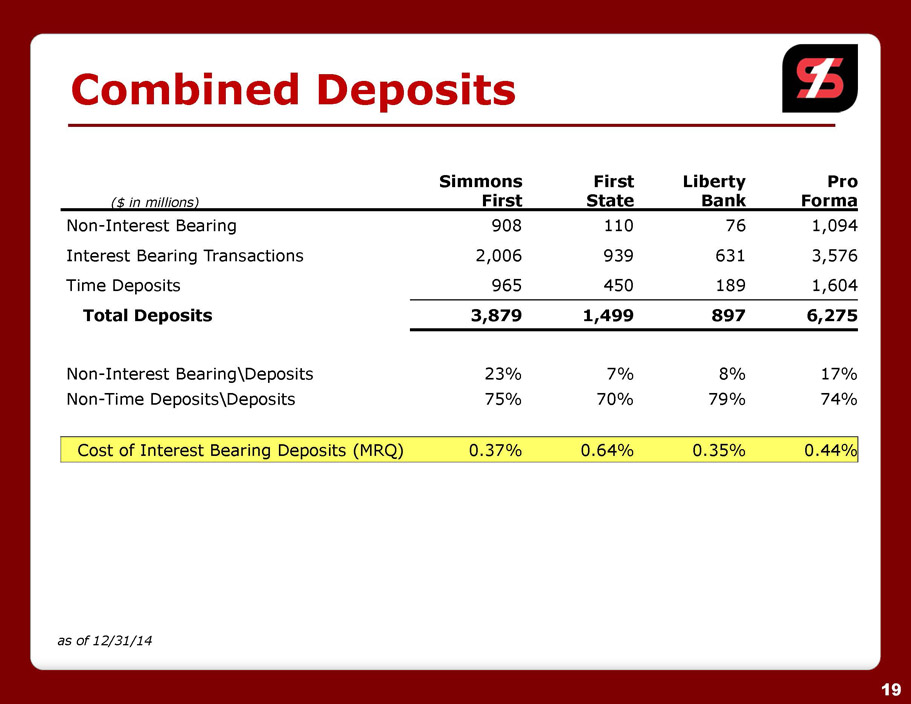
Combine d Deposits a s o f 12/31/14 19 Cos t o f Interes t Bearin g Deposit s (MRQ ) 0.37% 0.64% 0.35% 0.44% ( $ i n millions) Simmons First First State Liberty Bank Pro Forma Non - Interes t Bearing 908 110 76 1,094 Interes t Bearin g T r ansactions 2,006 939 631 3,576 Time Deposits 965 450 189 1,604 Total Deposits 3,879 1,499 897 6,275 Non - Interes t Bearing \ Deposits 23% 7 % 8 % 17% Non - Tim e Deposits \ Deposits 75% 70% 79% 74%
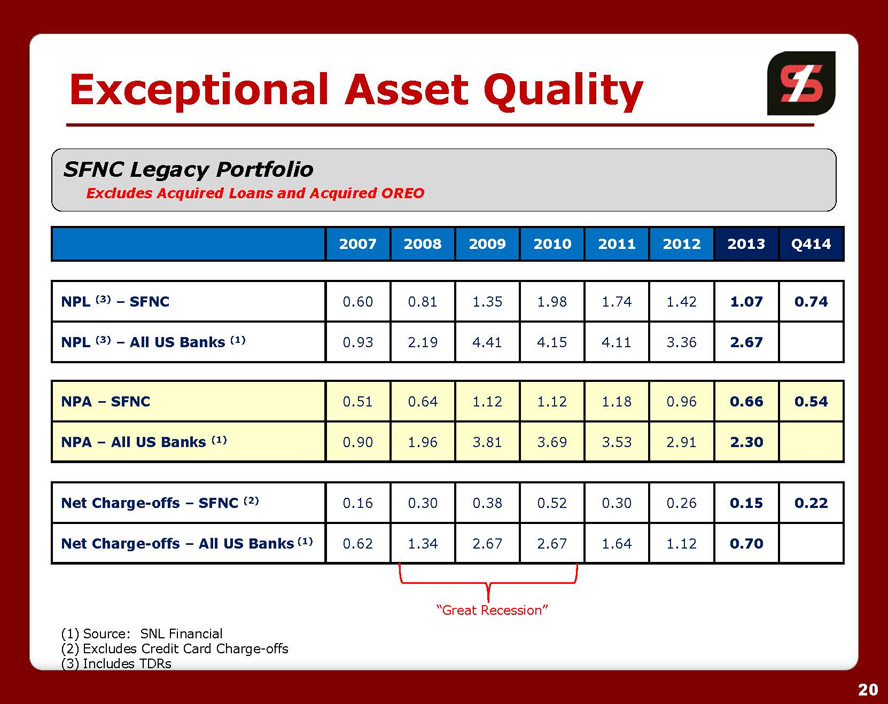
SFNC Legacy Portfolio Exclude s Acquire d L oans and Acquired OREO “Grea t Recession” (1) Source : SN L Financial (2) E xclude s Credi t Car d Charge - offs (3) Include s TDRs Exceptiona l Asse t Quality 20 2007 2008 2009 2010 2011 2012 2013 Q414 NP A – SFNC 0.51 0.64 1.12 1.12 1.18 0.96 0.66 0.54 NP A – Al l U S Bank s ( 1) 0.90 1.96 3.81 3.69 3.53 2.91 2.30 NP L ( 3) – SFNC 0.60 0.81 1.35 1.98 1.74 1.42 1.07 0.74 NP L ( 3) – Al l U S B a nk s ( 1) 0.93 2.19 4.41 4.15 4.11 3.36 2.67 Ne t C harge - off s – SFN C ( 2) 0.16 0.30 0.38 0.52 0.30 0.26 0.15 0.22 Ne t Charge - off s – Al l U S Bank s ( 1) 0.62 1.34 2.67 2.67 1.64 1.12 0.70
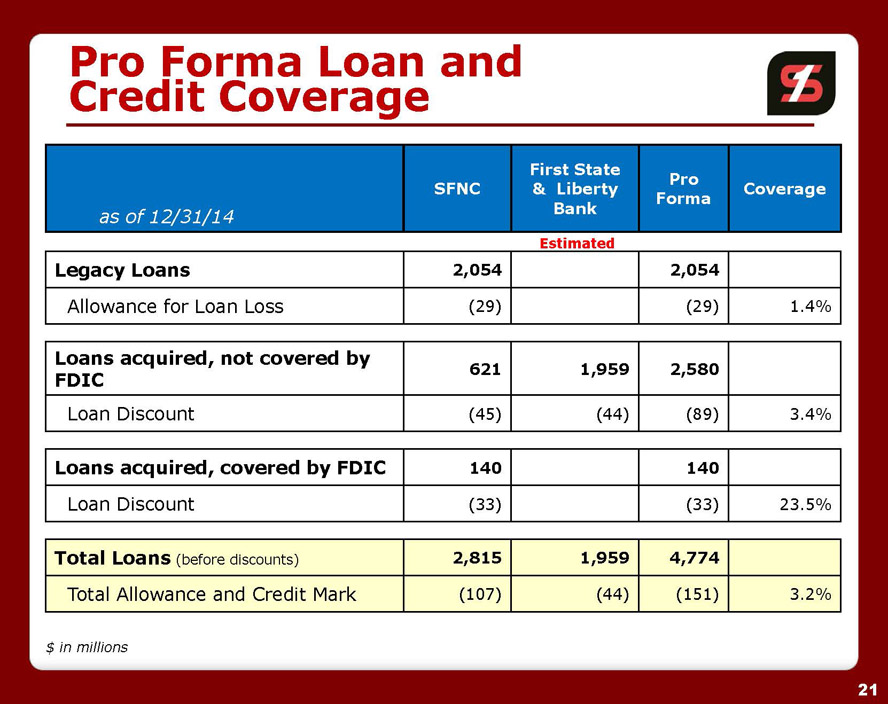
Pro Forma Loan and Credit Coverage $ i n millions 21 Estimated as of 12/31/14 SFNC First State & Liberty Bank Pro Forma Coverage Tota l Loan s (befor e discounts) 2,815 1,959 4,774 T ota l Allo w anc e an d Credi t Mark (107) (44) (151) 3.2% Legac y Loans 2,054 2,054 Allo w anc e fo r L oa n Loss (29) (29) 1.4% Loan s acquired , no t covere d by FDIC 621 1,959 2,580 Loa n Discount (45) (44) (89) 3.4% Loan s acquired , covere d b y FDIC 140 140 Loa n Discount (33) (33) 23.5%
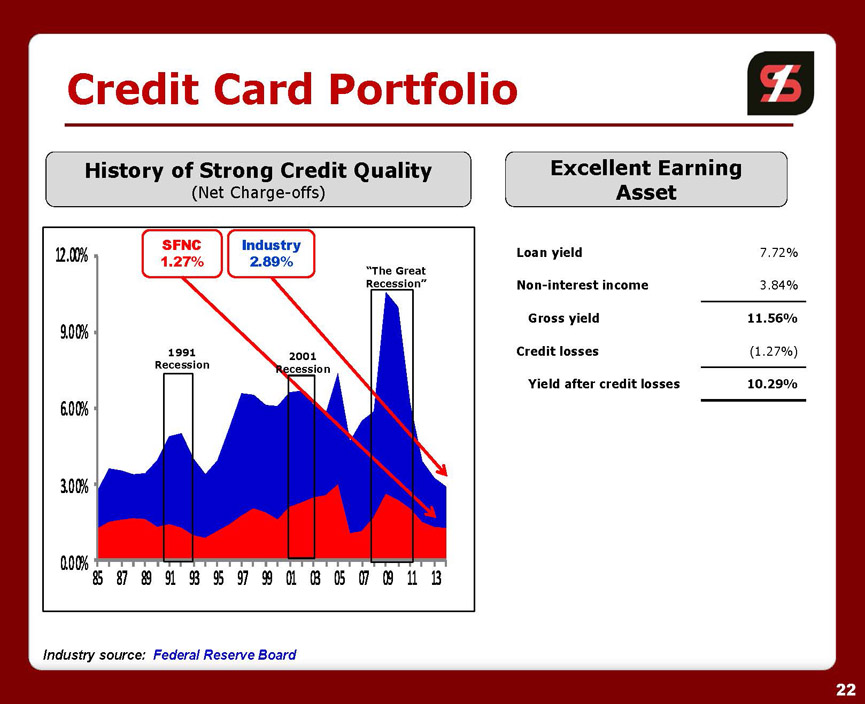
0 . 0 0 % 6 . 0 0 % 3 . 0 0 % 9 . 0 0 % 1 2 . 0 0% 8 5 8 7 8 9 9 1 9 3 9 5 9 7 9 9 0 1 0 3 0 5 0 7 0 9 1 1 13 Industr y source : Federa l Reserv e Board Credi t Car d Portfolio History of Strong Credit Quality (Net Charge - offs) Indust r y 2.89% SFNC 1.27% 1991 Recession 2001 Recession “The Great Recession” Excellent Earning Asset Loan yield 22 7.72% Non - interest income 3.84% Gros s yield 11.56% Credit losses (1.27%) Yiel d a fte r credi t losses 10.29%
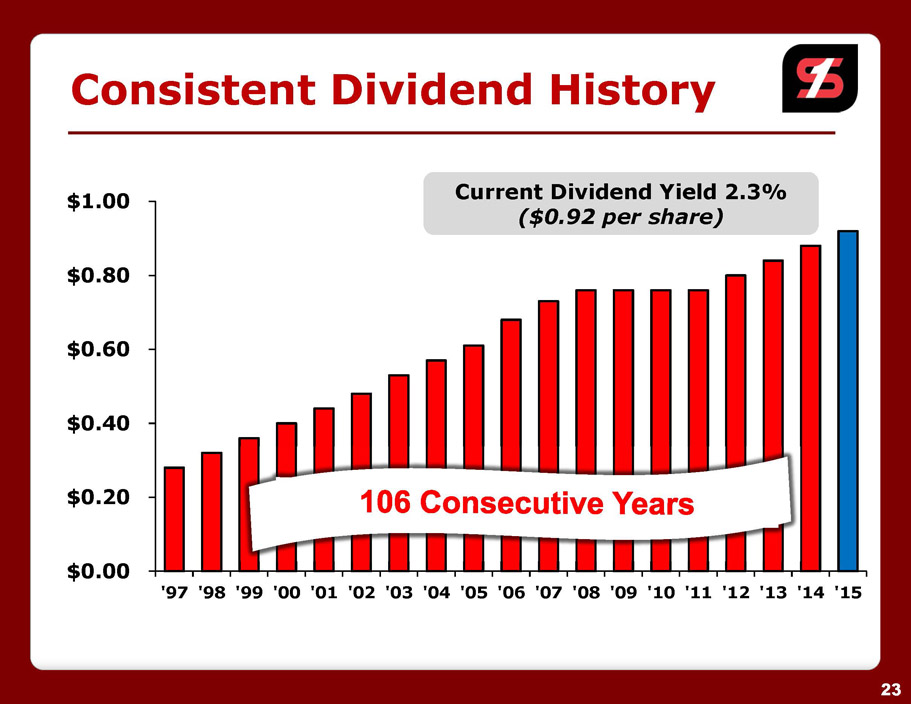
$0.80 $0.60 $0.40 $0.20 $0.00 $1.00 ' 9 7 ' 9 8 ' 9 9 ' 0 0 ' 0 1 ' 0 2 ' 0 3 ' 0 4 ' 0 5 ' 0 6 ' 0 7 ' 0 8 ' 0 9 ' 1 0 ' 1 1 ' 1 2 ' 1 3 ' 1 4 ' 1 5 Consisten t Dividen d History Current Dividend Yield 2.3% ($0.9 2 pe r share) 23
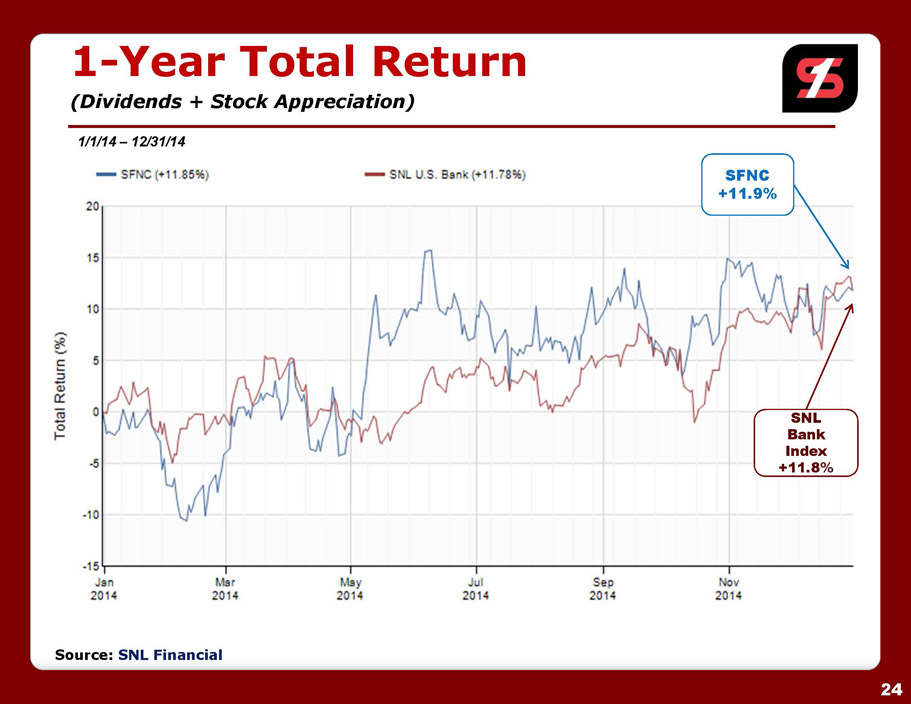
1 - Yea r Tota l Return (Dividends + Stock Appreciation) 1/1/1 4 – 12/31/14 SFNC +11.9% SNL Bank Ind e x +11.8% Source : SN L Financial 24
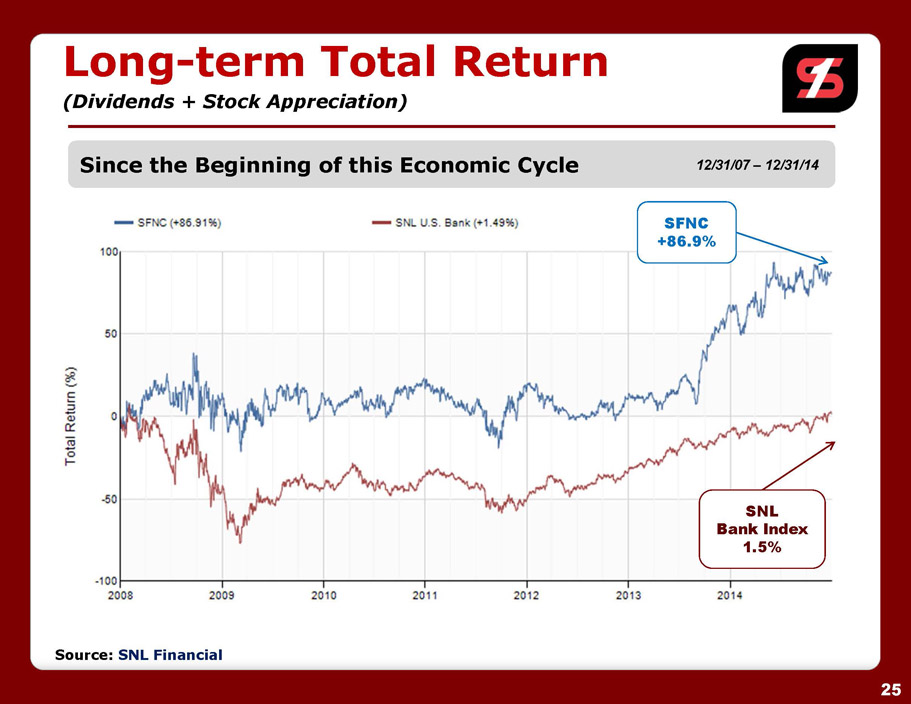
Since the Beginning of this Economic Cycle 12/31/0 7 – 12/31/14 SFNC +86.9% SNL Ban k Ind e x 1.5% Long - ter m Tota l Return (Dividends + Stock Appreciation) Source : SN L Financial 25
N AS D A Q - GS: SFNC Pin e Bluf f – C o r po r at e Headqua r te rs Littl e Roc k Corp o r at e O ffice