Attached files
| file | filename |
|---|---|
| EX-99.1 - EXHIBIT 99.1 - Covisint Corp | exhibit991q32015.htm |
| 8-K - 8-K - Covisint Corp | a8kfy15q3earnings123114.htm |

Covisint Corporation Third Quarter Fiscal 2015 Results

2 Forward Looking Statements This presentation contains “forward-looking” statements that involve risks, uncertainties and assumptions. If the risks or uncertainties ever materialize or the assumptions prove incorrect, our results may differ materially from those expressed or implied by such forward-looking statements. All statements other than statements of historical fact could be deemed forward-looking, including, but not limited to, any projections of financial information; any statements about historical results that may suggest trends for our business and results of operations; any statements of the plans, strategies and objectives of management for future operations; any statements of expectation or belief regarding future events, potential markets or market size, technology developments, or enforceability of our intellectual property rights; and any statements of assumptions underlying any of the foregoing. These statements are based on estimates and information available to us at the time of this presentation and are not guarantees of future performance. Actual results could differ materially from our current expectations as a result of many factors, including but not limited to: quarterly fluctuations in our business and results of operations; our ability to address market needs and sell our applications and services successfully; the general market conditions of the industry; and the effects of competition. These and other risks and uncertainties associated with our business are described in our Annual Report on Form 10-K for the fiscal year ended March 31, 2014. We assume no obligation and do not intend to update these forward-looking statements. In addition to U.S. GAAP financials, this presentation includes certain non-GAAP financial measures. These historical and forward-looking non-GAAP measures are in addition to, not a substitute for or superior to, measures of financial performance prepared in accordance with GAAP. A reconciliation between GAAP and non-GAAP measures is included in the appendix to this presentation. Covisint is a registered trademark of Covisint Corporation. This presentation also contains additional trademarks and service marks of ours and of other companies. We do not intend our use or display of other companies’ trademarks or service marks to imply a relationship with, or endorsement or sponsorship of us by, these other companies.

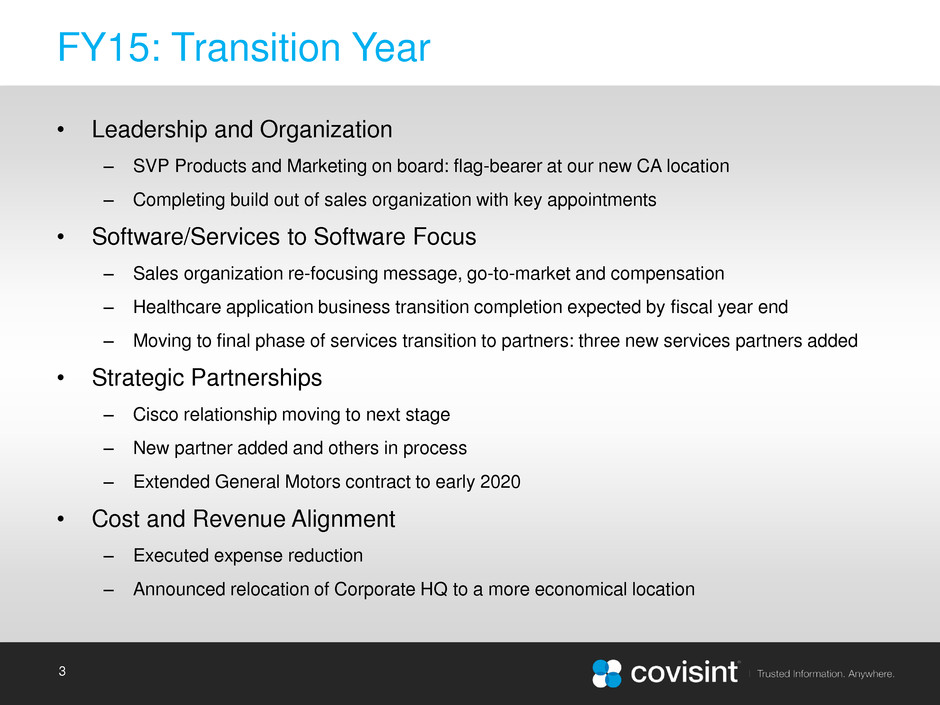
3 FY15: Transition Year • Leadership and Organization – SVP Products and Marketing on board: flag-bearer at our new CA location – Completing build out of sales organization with key appointments • Software/Services to Software Focus – Sales organization re-focusing message, go-to-market and compensation – Healthcare application business transition completion expected by fiscal year end – Moving to final phase of services transition to partners: three new services partners added • Strategic Partnerships – Cisco relationship moving to next stage – New partner added and others in process – Extended General Motors contract to early 2020 • Cost and Revenue Alignment – Executed expense reduction – Announced relocation of Corporate HQ to a more economical location

4 Q3FY15: Non-GAAP Financial Overview Non-GAAP* income Statement ($ in thousands) Q3FY15 Y/Y Q/Q REVENUE Subscription 15,660 (11)% (7)% Services 6,095 (7)% 22% Total revenue 21,755 (10)% 0% COST OF REVENUE 12,657 7% 1% GROSS PROFIT 9,098 (26)% (1)% Gross margin 42% OPERATING EXPENSES Research and development 3,679 (16)% 15% Sales and marketing 6,505 (11)% (14)% General and administrative 3,234 (24)% (2)% Total operating expenses 13,418 Operating Loss (4,320) Other Income 15 Income (loss) before tax (4,305) Income tax provision 21 NET INCOME (LOSS) (4,326) Diluted EPS ( 0.11) Guidance FY15 Subscription Revenue** (2)% - 0% Services Revenue** (34)% - (24)% Total Revenue** (11)% - (9)% Total Shares 39 mil *Excludes the impact of stock compensation and the expensing of certain R&D costs (rather than capitalizing such costs) **Y/Y growth Rounding may affect some variances and subtotals

Appendix

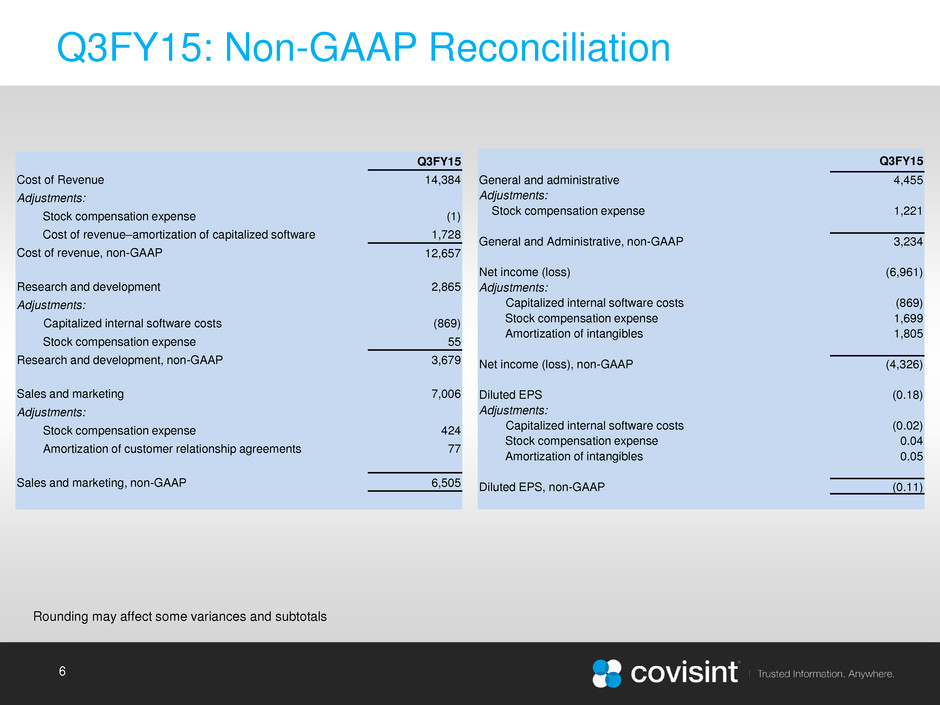
6 Q3FY15: Non-GAAP Reconciliation Rounding may affect some variances and subtotals Q3FY15 Cost of Revenue 14,384 Adjustments: Stock compensation expense (1) Cost of revenue–amortization of capitalized software 1,728 Cost of revenue, non-GAAP 12,657 Research and development 2,865 Adjustments: Capitalized internal software costs (869) Stock compensation expense 55 Research and development, non-GAAP 3,679 Sales and marketing 7,006 Adjustments: Stock compensation expense 424 Amortization of customer relationship agreements 77 Sales and marketing, non-GAAP 6,505 Q3FY15 General and administrative 4,455 Adjustments: Stock compensation expense 1,221 General and Administrative, non-GAAP 3,234 Net income (loss) (6,961) Adjustments: Capitalized internal software costs (869) Stock compensation expense 1,699 Amortization of intangibles 1,805 Net income (loss), non-GAAP (4,326) Diluted EPS (0.18) Adjustments: Capitalized internal software costs (0.02) Stock compensation expense 0.04 Amortization of intangibles 0.05 Diluted EPS, non-GAAP (0.11)
