Attached files
| file | filename |
|---|---|
| EX-23.2 - EXHIBIT 23.2 - Covisint Corp | exhibit23233116.htm |
| EX-32.1 - EXHIBIT 32.1 - Covisint Corp | exhibit32133116.htm |
| EX-31.2 - EXHIBIT 31.2 - Covisint Corp | exhibit31233116.htm |
| EX-31.1 - EXHIBIT 31.1 - Covisint Corp | exhibit31133116.htm |
| EX-23.1 - EXHIBIT 23.1 - Covisint Corp | exhibit23133116.htm |
| EX-10.27 - EXHIBIT 10.27 - Covisint Corp | exhibit102733116.htm |
UNITED STATES
SECURITIES AND EXCHANGE COMMISSION
Washington, D.C. 20549
FORM 10-K
(Mark One)
x | ANNUAL REPORT PURSUANT TO SECTION 13 OR 15(d) OF THE SECURITIES EXCHANGE ACT OF 1934 |
For the fiscal year ended March 31, 2016
Commission file number 001-36088
Covisint Corporation
(Exact name of registrant as specified in its charter)
MICHIGAN (State or other jurisdiction of incorporation or organization) | 26-2318591 (I.R.S. Employer Identification Number) | |||
26533 Evergreen Road, Suite 500, Southfield, Michigan 48076 |
(Address of registrant’s principal executive offices, including zip code)
Registrant's telephone number, including area code: (248) 483-2000
Indicate by check mark if the registrant is a well-known seasoned issuer, as defined in Rule 405 of the Securities Act of 1933. Yes o No x
Indicate by check mark if the registrant is not required to file reports pursuant to Section 13 or Section 15(d) of the Securities Exchange Act of 1934. Yes o No x
Indicate by check mark whether the registrant (1) has filed all reports required to be filed by Section 13 or 15(d) of the Securities Exchange Act of 1934 during the preceding 12 months (or for such shorter period that the registrant was required to file such reports), and (2) has been subject to such filing requirements for the past 90 days. Yes x No o
Indicate by check mark whether the registrant has submitted electronically and posted on its corporate Web site, if any, every Interactive Data File required to be submitted and posted pursuant to Rule 405 of Regulation S-T during the preceding 12 months (or for such shorter period that the registrant was required to submit and post such files). Yes x No o
Indicate by check mark if disclosure of delinquent filers pursuant to Item 405 of Regulation S-K is not contained herein, and will not be contained, to the best of the registrant's knowledge, in definitive proxy or information statements incorporated by reference in Part III of this Form 10-K or any amendment to this Form 10-K. Yes x No o
Indicate by check mark whether the registrant is a large accelerated filer, an accelerated filer, a non-accelerated filer, or a smaller reporting company. See the definitions of “large accelerated filer,” “accelerated filer” and “smaller reporting company” in Rule 12b-2 of the Exchange Act. (Check one):
Large accelerated filer o | Accelerated filer x | |||
Non-accelerated filer o | (Do not check if a smaller reporting company) | Smaller reporting company o | ||
Indicate by check mark whether the registrant is a shell company (as defined in Rule 12b-2 of the Exchange Act). Yes o No x
The aggregate market value of the voting stock held by non-affiliates of the registrant as of September 30, 2015, was $ 85.0 million, based upon the closing sales price of the common stock on that date of $2.15 as reported on The NASDAQ Global Select Market. For purposes of this computation, all executive officers, directors and 10% beneficial owners of the registrant are assumed to be affiliates. Such determination should not be deemed an admission that such officers, directors and beneficial owners are, in fact, affiliates of the registrant.
As of June 2, 2016, there were outstanding 40,512,356 shares of Common Stock, no par value, of the registrant.
DOCUMENTS INCORPORATED BY REFERENCE
Portions of the definitive Proxy Statement for the registrant's 2016 Annual Meeting of Shareholders (the “Proxy Statement”) filed pursuant to Regulation 14A are incorporated by reference in Part III.
Covisint Corporation
Form 10-K
Table of Contents
Page | |
PART I. | |
Item 1. Business | |
Item 1A. Risk Factors | |
Item 1B. Unresolved Staff Comments | |
Item 2. Properties | |
Item 3. Legal Proceedings | |
Item 4. Mine Safety Disclosures | |
Part II. | |
Item 5. Market for Registrant's Common Equity, Related Stockholder Matters | |
Item 6. Selected Financial Data and Non-GAAP Financial Measures | |
Item 7. Management's Discussion and Analysis of Financial Condition and Results of Operations | |
Item 7A. Quantitative and Qualitative Disclosure About Market Risk | |
Item 8. Financial Statements and Supplementary Data | |
Item 9. Changes in Disagreements with Accountants on Accounting and Financial Disclosure | |
Item 9A. Controls and Procedures | |
Item 9B. Other Information | |
Part III. | |
Item 10. Directors, Executive Officers and Corporate Governance | |
Item 11. Executive Compensation | |
Item 12. Security Ownership of Certain Beneficial Owners and Management Related Stockholder Matters | |
Item 13. Certain Relationships and Related Transactions, and Director Independence | |
Item 14. Principal Accountant Fees and Services | |
Part IV. | |
Item 15. Exhibits and Financial Statement Schedules | |
In this Annual Report on Form 10-K, the terms “Covisint”, “the Company”, “we”, “us”, or “our”, mean Covisint Corporation and its subsidiaries on a consolidated basis unless otherwise expressly stated or the context otherwise requires.
This Annual Report on Form 10-K and the documents incorporated herein by reference contain forward-looking statements, within the meaning of Section 27A of the Securities Act of 1933 (the “Securities Act”) and Section 21E of the Securities Exchange Act of 1934 (the “Exchange Act”), based on expectations, estimates, and projections as of the date of this filing. Actual results may differ materially from those expressed in forward-looking statements. See Item 1A -“Risk Factors” of this Annual Report.
PART I
ITEM 1. BUSINESS
Covisint was incorporated in April 2008 in the State of Michigan. Our predecessor, Covisint LLC, was founded in February 2000 by a consortium of automotive manufacturers, led by General Motors Corporation (“General Motors” or “GM”), Ford Motor Company, Chrysler, Nissan, Renault and Peugeot to streamline collaboration with their global network of parts suppliers. The consortium made a significant investment in the development of a robust, highly-secure cloud-based multiparty business-to-business (“B2B”) exchange. This effort resulted in a Software as a Service (“SaaS”) application called the Auto Supply Portal which went live in 2003.
In March 2004, Compuware Corporation (“Compuware”) purchased substantially all of the assets of Covisint LLC including its name and technology. In January 2013, Compuware contributed the Covisint business assets to Covisint (“January 2013 Contribution”) in preparation for our initial public offering, which was completed in October 2013 (“IPO”). On October 31, 2014, Compuware completed its distribution of 31,384,920 shares of Covisint common stock to Compuware shareholders (“October 2014 Distribution”). Our principal corporate offices are located in Southfield, Michigan. Our common stock is listed on the Nasdaq Global Select Market under the symbol “COVS.”
Overview
The Auto Supply Portal involved the development and integration of three cloud-based technologies - identity management, data integration and exchange services, and portal services. This innovative solution enabled any member of the consortium to securely access the applications and information they needed, anytime, and anywhere to get their job done efficiently and effectively. This auto exchange is still in operation today, and it is the largest of its kind, supporting more than 3,000 global customers worldwide, 212,000 connected businesses, handling 4 billion transactions annually, and worth more than $1 trillion in total.
In the decade that followed the launch of the Auto Supply Portal, Covisint leveraged these technologies (collectively the “Covisint Cloud Platform” or “Platform”) to help customers across industries to transform their businesses by enabling applications that require secure identification, authentication, and exchange information across users, devices, and applications. These efforts resulted in significant contribution to innovative solutions such as General Motors’ OnStar™ (“OnStar”), Hyundai’s BlueLink™, and Cisco Systems’ Service Exchange Platform™ (“SXP”).
In fiscal 2015, Covisint opened our Platform to developers and customers, by (a) exposing the capabilities within the platform via application programming interfaces (“APIs”), (b) making the Platform infrastructure agnostic and infrastructure-independent to satisfy data privacy and geographic regulatory requirements and (c) automating the build and deploy activities to facilitate the deployment of the Platform in seconds. We believe there is a large and rapidly growing available market for our technologies, particularly in the automotive and manufacturing industries, and spanning three horizontal use cases - cloud identity and access management, business-to-business collaboration and the Internet of Things (“IoT”).
The automotive industry is in the midst of significant disruptive change, including new models of consumption such as car-sharing, ride-sharing, direct-to-consumer sales, and fully-connected and autonomous cars. Traditional automotive original equipment manufacturers (“OEMs”) realize that connecting and sharing information between their vehicles and the complex ecosystem of drivers, dealers, service centers, other cars, value added services, and the world around them can help improve their customers’ experience, deliver personalization, and ultimately increase brand loyalty, enhancing repurchase rates.
The manufacturing industry is undergoing similarly disruptive changes with IoT, which will fundamentally change the way products are designed, sold, operated, and use. In some cases, capital goods will shift from asset sales to services. Additionally, industry supply chains continue to become increasingly globalized and complex, further exacerbating the challenges of secure business-to-business collaboration and information exchange.
We believe the markets and use cases our Platform serves are still in the early stages of development. As such, we will continue to invest in sales and marketing, select technology and go-to-market partnerships, as well as our core Platform technologies to extend our leadership position in the marketplace.
2
The Company operates in a single reportable segment.
Our Platform
Our Platform is delivered via the cloud as a Platform as a Service (“PaaS”). It has supported production-critical applications for over 13 years, and offers unparalleled levels of security, scalability and reliability. Major Platform capabilities include:
• | Identity services - identity and access management capabilities for identity lifecycle management, provisioning, access governance, authentication, federation, and identity intelligence; |
• | Messaging and orchestration services - data integration and exchange capabilities for secure connectivity, multi-protocol support, robust and resilient extraction, mapping, transformation of multiple data elements, any-to-any messaging, orchestration capabilities for defining and executing business rules, workflows and notifications; and |
• | IoT Services - capabilities for the dynamic management and governance of relationships among connected entities (users, applications, systems, “things”), including capabilities for building, operating, managing and monitoring connected product ecosystems. |
In fiscal 2017, our roadmap is focused on enhancing and extending the following capabilities of the Platform:
• | Solution “catalysts” - accelerators (solution templates, solutions builders), reference data models and reference implementations to facilitate the development of vertical business applications on our Platform by developers; |
• | Messaging and orchestration services - consolidation and improved packaging of current real time, non real time messaging services and data integration adapters for more intuitive and rapid use by third-party developers; |
• | Analytics Adapters - services and frameworks for easy integration with third-party security analytics and “Big Data” infrastructure, including services for operational monitoring and automated decision-making; |
• | Identity services - modern, simplified user experience improved support for federated login and multi-factor authentication; new support for user-managed consent (opt-in) and user and entity behavioral analytics; addition of new features to support more business-to-business, business-to-partner, business-to-customer, business-to-consumer identity management scenarios; and |
• | Developer experience - self-service capabilities, sample apps, improved resources for developers to build and use new applications on our Platform. |
Our Differentiation
The Covisint Platform is an integrated whole that is greater than the sum of its parts - a proven Platform, with a complete set of integrated technologies that gives our customers a substantial strategic advantage by enabling them to rapidly develop and deploy applications faster and more cost-effectively, and in so doing, speeding up their digital transformation to compete more effectively in their markets.
Our Growth Strategies
Elements of our growth strategy include:
• | Expand in our installed customer base. We believe there is a significant opportunity to expand the adoption of our Platform within our current customer base by expanding usage of already-deployed solutions and selling additional solutions. As our existing customers derive value from our Platform, we believe they will expand their use of our Platform from a single business initiative within a specific business unit or geography to new business initiatives. We believe our Platform is well-suited to support a wider range of business needs (business-to-business, business-to-partner, business-to-customer, business-to-consumer). |
• | Win new customers in the automotive industry. We have a well-established footprint in the automotive industry with deep customer relationships, high brand recognition and a demonstrated track record of success. Our Platform can help enable new strategic business solutions around connected vehicle, customer engagement, dealer intelligence, and other scenarios which are large, high-profile and funded digital investments by the largest automakers in the world. |
• | Land new customers via our channel partners. We are actively developing strategic alliances with partners, similar to our alliance with Cisco Systems, Inc. (“Cisco”), where our Platform is used as the base of the partner’s IoT technology solution strategy. We believe that the ever-increasing security and threat landscape will drive substantial need for IoT and |
3
identity-centric solutions our Platform enables. We also believe these alliances will improve our access to and ability to support new industry vertical, geographic markets and prospective customers.
• | Sell the Platform via outbound OEM agreements with ISVs. Our Platform provides core functional capabilities that are required for all vertical (e.g. automotive) as well as horizontal (cloud identity, IoT) solutions, and our partners are key to creating the solutions that use these capabilities on behalf of the end customer. We will continue to invest in our existing relationships with partners like Tech Mahindra, VisionIT, and other existing partners, as well as new independent software vendors (“ISVs”). |
Customers
Our customers include large, globally-distributed organizations and mid-sized organizations with complex external business relationships, as well as the participants in their business relationships. While we have over 2,000 customers, approximately 150 of these customers represent 90%, 92%, and 93% of our total revenue for the years ended March 31, 2016, 2015, and 2014, respectively. Our core Platform customers include organizations in the automotive, energy, travel, life sciences, consumer goods and national and regional insurance industries. Our remaining customers include a variety of organizations that pay us a relatively nominal fee to either connect to one of our core Platform customers or use one of our industry-specific solutions.
The automotive industry accounted for 54%, 45%, and 47% of our total revenue for the years ended March 31, 2016, 2015, and 2014, respectively. The healthcare industry accounted for 19%, 32%, and 34% of our total revenue for the years ended March 31, 2016, 2015, and 2014, respectively. Revenue from outside of the U.S. accounted for 14%, 14%, and 14% of our total revenue for the years ended March 31, 2016, 2015, and 2014, respectively. We intend to continue expanding our business into additional vertical markets and geographies and expect our revenue to diversify accordingly.
We continue to advance our strategic partnership with Cisco. Following entry into our Software License and Hosting Services Agreement (“Cisco Contract”) with Cisco in November 2013, we worked with Cisco to integrate our Platform with Cisco applications to build the Cisco SXP. We receive significant subscription revenue directly from Cisco relating to the use and development of the Platform as part of the Cisco SXP Contract. Moreover, in January and April 2015, we enabled Cisco to enter into the prime contracts (collectively, the “GM Contracts”) with various divisions of General Motors, with Cisco as prime contractor and Covisint as subcontractor, to provide most of the service that we historically provided to GM (collectively, the “Prior GM Contracts”). Under the GM Contracts, we receive annual service fees in advance. With Cisco’s involvement, we were able to extend the terms of each contract through April 2020 and eliminate GM’s ability to terminate these agreements for convenience. Notwithstanding these contractual changes, we remain actively engaged in further expanding our deep relationship with GM.
For the year ended March 31, 2016, Cisco accounted for 36% of our total revenue, of which 26% of total revenue is related to the transfer of the GM Contracts and the augmentation of the SXP platform. Our stand-alone business with General Motors, which is primarily services, accounted for 6% of our total revenue in the year ended March 31, 2016. Losing all or a significant portion of our business with General Motors or Cisco could have a material impact on our business, liquidity and results of operations. See “Risk Factors - We derive a significant percentage of our total revenue from our largest customer, Cisco, as well as our ten largest customers” in Item 1A of this Annual Report.
Services
We provide implementation and consulting services to our customers. Over the course of fiscal 2015 and 2016, we moved from delivering service based solutions through our own resources to creating a network of certified service partners who are able to create and deploy solutions on our Platform. However, in certain circumstances, we continue to perform implementation services, which typically consist of user migration, content migration, solution deployment, configuration, and training to support customer-specific workflows. Our services engagements typically occur in phases and can vary from a few weeks to several months depending on the scope and complexity of the solution. Our customers may choose to do much of this work in-house, through a third party or with Covisint. We currently subcontract, and expect to continue to subcontract, portions of our consulting engagements to our third-party implementation partners. We support our customers and partners as they independently implement solutions using APIs and our developer portal.
Sales and Marketing
We sell our Platform through both direct sales and our channel partners. Our direct sales team includes field sales and solution engineering personnel. We will continue to invest in attracting and retaining skilled professionals with knowledge and relationships in our target industries, use cases and technologies, in order to achieve our corporate objectives.
4
Our marketing and lead generation activities consist primarily of high-touch account-based sales and marketing activities, as well as participation in key industry, analyst and technology events. We principally target line of business decision makers, as well as senior business and IT executives seeking to drive digital business transformation. We are also developing specific marketing programs and campaigns targeted at developers.
Customer Support
Our customer support services are available 24x7x365 globally and include live-agent telephonic support as well as web-based and self-help options. Our customer support team is staffed by highly-skilled and experienced personnel who receive extensive training on the deployment and maintenance of our services and on the operation of our data centers. A standard deployment includes level-two support. Customers may contract for optional level-one support services to augment our standard support offering, which entitles them to single point of contact, issue resolution and escalation services and more stringent service level agreements (“SLAs”).
Technology and Operations
Covisint’s Platform is designed to support mission-critical business processes of large organizations. It is (a) highly-scalable and designed to process millions of transactions, manage terabytes of data and provide access for millions of users every day, and (b) enterprise-grade, continuously available across the globe and addresses our customers’ most demanding uptime requirements.
Our Platform is written in Java and is optimized for scalability and performance. To expand the value of our Platform, we have created a software development kit, including a broad set of APIs that enable our strategic partners and customers to use our PaaS to develop custom applications and integrations. Our solutions often combine proprietary and open source technologies. Open source technology reduces the overall cost to our customers and allows us to bring innovations and enhancements to market in a more expedient and efficient manner.
For our existing customers, we operate both multi-instance and multi-tenant architectures depending on their need for dedicated applications and databases. Our new customers are onboarded on the multi-tenant public cloud instance of our PaaS.
We work with CenturyLink, Inc. and Amazon Web Services (“AWS”) for hosting. We currently utilize facilities located in Chicago, Illinois; Southfield, Michigan; Allen, Texas; Northern Virginia; Tokyo, Japan; Frankfurt, Germany; and Shanghai, China. This allows us to ensure reliability, redundancy and performance for all our customer solutions. We are increasingly utilizing AWS' Infrastructure as a Service (“IaaS”) to optimize our costs and provide flexibility and geographic coverage for our customers.
Research and Development
Our engineering efforts support product development of our cloud-based Platform. We continue investing to grow our product management team. This aims to accelerate our ability to deliver leading IoT and identity capabilities, and drive continued innovation in our Platform. We work closely with our customers, strategic and delivery partners to continually improve and enhance our Platform and develop new products and features. By leveraging the cloud architecture of our Platform, we are able to deploy new features and functions across our customer community. This allows us to rapidly react to customer support issues, new compliance regulations and customer feature and functionality requests.
Our Competition
We sell our Platform in an extremely competitive environment characterized by rapid technological change, new and emerging use cases, such as IoT and cloud identity, shifting customer needs and significant investment by large organizations to be a cloud Platform of choice. We expect the rate of change to continue to be rapid with additional competition in the future. We believe that the key competitive factors in our market include:
Security - we believe it is imperative that all aspects of security are managed from securing what can connect, to providing encryption services for the data in motion and at rest, to what systems and devices can access what data.
Scalability - we believe that the ability to scale to massive ecosystems, to ecosystems of ecosystems that can have millions of connected identities, to exchange millions of messages an hour, and to consume massive amounts of bandwidth and storage is significantly important for our Platform to provide.
Speed of implementation - we believe that speed is paramount, particularly with speed to enable a proof of concept to allow businesses to prove out their business ideas and resulting applications using a production grade environment.
5
Openness of Platform - we believe that there will not be a single platform that manages all facets of an IoT and identity ecosystem and provides all services, rather only vendors that facilitate interoperability with other vendors for services and integration of data across a plethora of sources will succeed.
Ability to enable users to maintain regulatory compliance - we believe that large enterprises will continue to demand regulatory and industry standard audit compliance factors and that the push towards managing more and more consumer data and the continued fears of governmental access to data will increase demands in this area.
Infrastructure reliability - we believe that providing an enterprise-class platform requires providing enterprise-grade service level agreements that are acceptable for mission critical systems.
Comprehensiveness of Platform features and functionality - we believe that platform vendors are measured on how full featured their offering is, particularly in how easily the various services offered operate together, as well as the ease of interoperating to external systems necessary to build a comprehensive IoT solution.
Price - we believe that price competitiveness will continue to be an important factor in buying decisions particularly as computing and storage costs continue to decline with Infrastructure-as-a-Service (“IaaS”) vendors.
The overall market for enterprise cloud-based platforms and solutions is maturing. We expect that the competitive landscape will continue to mature as the market evolves and IoT centric solutions become more commonplace. We believe that our competition follows two different approaches:
• | Build their own. We continue to see end customers building their own solutions, despite the significant complexity and advanced technology required for successful identity and IoT solutions. This approach typically requires substantial investment and time to develop a viable initial solution. |
• | Buy/license and integrate. We have seen customers attempt to create a solution by integrating solutions from multiple technology providers either themselves, or using large systems integrators such as IBM, Accenture, and PwC. Vendors of competitive point technologies include: |
◦ | Microsoft Azure, IBM BlueMix, AWS IoT, Salesforce IoT Cloud, and PTC Thingworx for IoT functionality, and |
◦ | Microsoft Azure ADFS, Okta Platform, IBM BlueMix and CA Secure Cloud for cloud identity functionality, and |
◦ | Mulesoft, Informatica, SnapLogic, Talend, and Dell Boomi for messaging and orchestration functionality. |
We believe we offer a superior alternative to both of the above approaches. By offering a complete set of integrated technologies for IoT and identity-centric solutions in the cloud, we are able to offer faster time to market, as well as superior return on investment. Furthermore, we continuously update our Platform with new and innovative technology, enhanced security and regulatory compliance which these approaches cannot match.
Intellectual Property
We protect our intellectual property rights by relying on federal, state and common law rights, as well as contractual restrictions. We manage ownership of and access to our proprietary technology by requiring the execution of confidentiality and invention assignment agreements by our employees, contractors and consultants, and confidentiality agreements with third parties. We also rely on a combination of trade secret, copyright, trademark, trade dress and domain name protections to maintain our intellectual property rights, including the registration of our domain names, trademarks and service marks in the United States and in certain locations outside the United States.
We hold a patent in the U.S. on our core technology in the context of an industry-wide B2B exchange. This patent will expire in 2028.
Circumstances outside our control could pose a threat to our intellectual property rights. Effective intellectual property protection may not be available in the United States or other countries in which our solutions are distributed. In addition, the efforts we have taken to protect our proprietary rights may not be sufficient or effective. Any impairment of our intellectual property rights could harm our business or our ability to compete and harm our operating results. See “Risk Factors - We may not be able to adequately protect our intellectual property rights and efforts to protect them may be costly and may substantially harm our business” in Item 1A of this Annual Report.
6
Employees
As of March 31, 2016, we had 338 full-time employees. None of our employees are represented by a labor union or covered by a collective bargaining agreement. We have not experienced any work stoppages, and we consider our relations with our employees to be good.
Facilities
We maintain our principal offices at 26533 Evergreen Road, Suite 500, Southfield, Michigan, which is leased under an 11-year lease of 33,786 square feet of space. We have also entered into stand-alone operating lease agreements for office space in Shanghai, China; Frankfurt, Germany; London, England; and San Francisco, California. Pursuant to third-party hosting agreements, we also have access to facilities in Chicago, Illinois and Tokyo, Japan.
We believe that our existing facilities and offices are adequate to meet our current requirements and that suitable additional or substitute space will be available as needed to accommodate expansion of our operations.
Backlog
We consider our backlog balance to be future years of contractually committed arrangements, of which only the billed amounts are included in deferred revenue. As of March 31, 2016 and 2015, our backlog balance was $125.4 million and $97.3 million, respectively, of which $19.5 million and $21.9 million, respectively, was billed and included in deferred revenue. Of the March 31, 2016 backlog, approximately $69 million is not expected to be recognized in fiscal 2017.
Internet Address and SEC Reports
We maintain a website with the address www.covisint.com. We are not including the information contained on our website as a part of, or incorporating it by reference into, this Annual Report. We make available free of charge through our website our Annual Reports on Form 10-K, Quarterly Reports on Form 10-Q, Current Reports on Form 8-K, and amendments to these reports, as soon as reasonably practicable after we electronically file such material with, or furnish such material to, the Securities and Exchange Commission (“SEC”). We also include our corporate governance guidelines, certain policies and the charters for each of the major committees of our board of directors on our website and intend to update these documents if amended as soon as reasonably practicable. The SEC maintains an internet site that contains reports, proxy and information statements, and other information regarding issuers that file electronically with the SEC, and the address of that site is www.sec.gov.
Executive Officers of the Registrant
The following tables set forth certain information regarding our Executive Officers as of June 6, 2016:
Name | Age | Position | |||||
Samuel M. Inman, III | 65 | President, Chief Executive Officer, and Director | |||||
Enrico Digirolamo | 61 | Chief Financial Officer | |||||
Steven R. Asam | 42 | Senior Vice President, Delivery, Operations and Engineering | |||||
Samuel M. Inman, III. Mr. Inman has served as a director of Covisint since January 2014, and as Interim President and Chief Executive Officer of Covisint since March 2014. Effective May 22, 2014, Mr. Inman became the permanent President and Chief Executive Officer of Covisint. From April 2011 to May 22, 2014, Mr. Inman served as an independent consultant providing advice to the management and boards of directors of technology companies. From April 2008 through April 2011, Mr. Inman was President and CEO of Comarco Wireless Technologies, Inc. a technology company with extensive intellectual property for power adapter products. Mr. Inman has extensive experience in the management of technology companies, including being CEO of Viking Components, Inc. and Centura Software Corporation. Mr. Inman has been a director of Comarco Wireless Technologies, Inc. (CMRO); Centura Software Corporation (CNTR); and Objectshare, Inc. (OBJS).
Enrico Digirolamo. Mr. Digirolamo has served as Chief Financial Officer since July 2013. From 2010 until July 2013, he served as Senior Vice President - Sales & Marketing and Finance at Allstate Insurance. Mr. Digirolamo served as the Chief Financial Officer and Vice President of General Motors Europe AG from 2008 to 2010. Mr. Digirolamo also served as the Chief Financial Officer and acting Chief Executive Officer of Covisint LLC (our predecessor) at the time of its formation. He currently serves on the board of directors of Metromedia International Group LLC, a privately held owner of interests in communications and media businesses operating in the Republic of Georgia. Mr. Digirolamo has served as a member of the GM European Strategy Board,
7
Opel Supervisory Board and the board of directors of Saab Automobile, GM Russia and Allstate New Jersey. Mr. Digirolamo has a Bachelor of Science degree in mathematics and accounting from Central Michigan University, a Master of Business Administration from Eastern Michigan University and has completed the International Executive Program at the International Institute for Management Development in Lausanne, Switzerland.
Steven R. Asam. Mr. Asam has been with Covisint since it was originally founded in 2000. Since 2012, Mr. Asam has served as Covisint’s Senior Vice President of Delivery, Operations and Engineering. In this position, he oversees all research and development of the Covisint Platform and vertical specific solutions. In addition, Mr. Asam manages our customer support, implementation, solution deployment, on-boarding and data center operations for all industry sectors. Prior to joining Covisint, Mr. Asam provided technology leadership at Ford Motor Company on several large scale business-to-business and business-to-consumer projects. Mr. Asam earned both his Bachelor of Science degree in computer engineering and a Master of Science degree in computer information systems from the University of Michigan.
ITEM 1A. RISK FACTORS
We have a history of losses, we expect to continue to incur losses and we may not achieve or sustain profitability in the future.
We have incurred losses in each fiscal year since 2011, including fiscal 2016. These losses were mainly due to the investments we made, and continue to make, to build our Platform, grow and maintain our business and acquire customers. Key elements of our growth strategy include (1) expanding our installed customer base; (2) acquiring new customers in the automotive industry; (3) landing new customers via our channel partners; and (4) selling the Platform via outbound original equipment manufacturer agreements with independent software vendors and system integrators. Furthermore, to the extent that we are successful in increasing our customer base, we will incur increased expenses, as costs associated with generating and supporting customer agreements are generally incurred up front, while revenue is generally recognized ratably over the term of the agreement. We cannot predict our revenue growth, and you should not rely upon our revenue performance in prior fiscal years as indicative of our future performance. Accordingly, we cannot assure you that we will reach profitability in the future or at any specific time in the future or that, if and when we do become profitable, we will sustain profitability. If we are ultimately unable to meet our financial targets to create sufficient revenue to become profitable and have sustainable positive cash flows, investors could lose all or part of their investment.
During fiscal 2015, we made strategic decisions to shift our focus away from providing services to our customers and to stop selling our Platform as a part of a set of healthcare applications, and we may not be able to replace the lost revenue.
During fiscal 2015, we made a strategic decision to stop providing certain unprofitable applications to the healthcare industry, and shift from being a services business to being an enterprise-grade Platform company. The healthcare industry accounted for 19%, 32%, and 34% of our total revenue in the years ended March 31, 2016, 2015, and 2014, respectively. Our services revenue was 17%, 25%, and 31% of our total revenue in the years ended March 31, 2016, 2015, and 2014, respectively. If healthcare or services revenue continues to decline and we are unable to replace it, there could be a material adverse effect on our results of operations.
We derive a significant percentage of our total revenue from a few customers, and the loss of revenue from these customers could have a material impact on our results of operations.
In January 2015 and April 2015, we completed negotiations with Cisco and GM, pursuant to which we: (a) terminated the Prior GM Contracts under which we provided our Platform and various services to GM to support GM’s EDI process and its OnStar services; (2) enabled Cisco to enter into the GM Contracts to provide our Platform and those services to GM under non-cancelable five-year agreements; and (3) entered into two five-year agreements with Cisco under which we will continue to provide the Platform to GM as a subcontractor to Cisco (collectively, the “Cisco Agreements”). Unlike the Prior GM Contracts, which were terminable by GM for convenience with six months’ prior notice, the GM Contracts and Cisco Agreements are non-cancelable, and therefore, we have secured our GM business through April 2020. While we maintain strong relationships within GM, we are no longer the prime contractor, and we may lose ability over time to influence GM’s decisions regarding the extended use of the Platform. Losing all or a significant portion of our services business with General Motors could have a material impact on results of operations.
Our relationship with Cisco continues to grow in importance. In addition to the GM Contracts noted above, we have entered into multiple statements of work, through which Cisco has access to our Platform for the purpose of selling its functionality into its customer base. Accordingly, loss of Cisco revenue could adversely affect our financial condition, operating results and cash flows.
8
Overall, our total revenue is also concentrated with two key customers, Cisco and GM. For the twelve months ended March 31, 2016, Cisco accounted for 36% of our total revenue, of which 26% of total revenue is related to the transfer of the GM Contracts and the augmentation of Cisco’s Service Exchange PlatformTM. Our stand-alone business with General Motors accounted for 6% of our total revenue in the twelve months ended March 31, 2016.
We cannot accurately predict subscription rates, and negative impact to these rates may have on our future revenue and operating results.
Our customers have no obligation to renew their subscriptions for our solution after the expiration of their initial subscription period, which is typically 36 months, and some customers have elected not to renew. In addition, our customers may renew at a lower contract value or renew for shorter contract lengths. Moreover, many of our contracts are terminable for convenience with as little as 30 days’ prior written notice, and some of our customers have elected to terminate all or part of their subscription service contract for convenience. Accordingly, we cannot predict our subscription rates as they may decline or fluctuate as a result of a number of factors, including decreases in usage by our customers, competitive offerings, customer dissatisfaction with our service, customer's ability to continue their operations and spending levels, and deteriorating general economic conditions. If our customers terminate our contract for convenience, do not renew their subscriptions for our solutions or reduce the value of their subscription at the time of renewal, our revenue may grow more slowly than expected or decline, and our results of operations could be adversely affected.
If the prices we charge for our services are unacceptable to our customers, our operating results will be harmed.
As the market for our Platform matures, or as new or existing competitors introduce new products or services that compete with ours, we may experience pricing pressure and be unable to renew our agreements with existing customers or attract new customers at prices that are consistent with our pricing model and operating budget. If this were to occur, it is possible that we would have to change our pricing model or reduce our prices, which could harm our revenue, gross margin and operating results.
Because we recognize revenue from subscriptions over the term of the subscription, downturns or upturns in sales may not be immediately reflected in our operating results.
We generally recognize subscription revenue from customers ratably over the terms of their subscription agreements, which are typically 36 months. As a result, most of the subscription revenue we report in each quarter is related to subscription agreements entered into during previous quarters. Consequently, a decline in new or renewed subscriptions in any one quarter will not be fully reflected in our subscription revenue results for that quarter and will negatively affect our subscription revenue growth rate or subscription revenue in future quarters. Our subscription model also makes it difficult for us to rapidly increase our subscription revenue through additional sales in any period, as subscription revenue from new customers must be recognized over the applicable subscription term. In addition, despite our efforts to increase our ability to have variable costs for the implementation of our Platform, we may be unable to adjust our cost structure to reflect unanticipated changes in revenue.
Our sales cycle can be long and unpredictable, particularly with respect to large enterprises. As a result, our sales are difficult to predict and may vary from quarter to quarter, which may cause our operating results to fluctuate significantly.
The timing of our sales is difficult to predict. Due to the nature, scope and complexity of the technology solution that we provide, our sales efforts require a consultative sale educating our customers about the use, technical capabilities and benefits of our Platform. It may be challenging to find the correct sales approach to foster significant adoption of our Platform. Our Platform provides solutions to business problems in a distributed environment of customers and partners. The buyers of these solutions may differ in different organizations, with IT professionals being the buyer in some cases and a consultant to the business being the buyer in others. As a result, customers often undertake a prolonged evaluation process, which frequently involves not only our solutions, but also those of our competitors. New sales opportunities, whether through direct sales or a partner, may require us to devote significant sales support to individual customers and, thus, to incur substantial costs. In addition, decisions to purchase our services are frequently subject to budget constraints, multiple approvals and unplanned administrative, processing and other delays. If sales expected from a specific customer for a particular period are not realized in that period or at all, our results could fall short of public expectations and our business, operating results and financial condition could be materially adversely affected.
In certain instances, our Platform solutions may be complex and include multiple dependencies that may cause our customers difficulty in implementing our service, which could negatively impact our future revenue and financial results.
Due to the scope and complexity of the solutions built on the Platform, the implementation cycle can be lengthy. Implementation of these solutions in certain circumstances may require integration with the customer and its partners’ existing computer systems, software programs, and databases. This process can be time-consuming for our customers and can result in delays in implementation and deployment of the solution. As a result, some of our customers have had, and may in the future have,
9
difficulty implementing their solutions successfully or otherwise achieving their expected benefits. Additionally, while a customer may decide to purchase our Platform, the customer or its partners may require us to delay the implementation of our solutions due to their scheduling, resource or budgetary constraints.
Delayed or ineffective implementation of our Platform may limit our future sales opportunities, reduce revenue and net income, cause customer dissatisfaction, harm our reputation or cause non-payment issues due to any of the following events:
The withholding of cash payments or cancellation of contracts if we fail to meet our commitments;
The cancellation or scaling back of one or more of our larger projects which could have a material adverse impact on our reputation and future revenue; or
An inability to recognize subscription revenue due to delays in the launch date of the customer’s access to our production environment.
Competition from current competitors and new market entrants, as well as from internally developed technologies, could adversely affect our ability to sell our solutions and related services.
We sell our Platform in an extremely competitive environment characterized by rapid technological change, shifting customer needs and frequent introductions of new products and services. We believe that the key competitive factors in our market include: security, scalability, speed of implementation, openness of platform, ability to enable users to maintain regulatory compliance, infrastructure reliability, features and functionality, ability to meet customer service level requirements and price. If we are less successful at addressing one or more of these factors than our competitors, we may not gain or even lose market share which could have a material adverse effect on our business, financial condition and operating results.
We compete with a wide range of established companies in a variety of different markets. In certain markets we compete with system integrators, such as IBM, Hewlett Packard Enterprise and Dell, Inc. cloud-based platform vendors, such as Salesforce.com and Microsoft Azure, and business-to-business integration and data exchange vendors, such as Open Text Corporation and Sterling Commerce, a division of IBM, all of which have substantially greater name recognition and resources than we do. Our competition often subscribes to or licenses other cloud-based platforms and third-party solutions to solve their customers’ specific business problems. Certain cloud-based platform vendors also offer development resources and consulting services that allow them to customize their platform to the customer’s requirements. We face other specialized competitors in the automotive vertical and may face new competitors as we expand into new vertical markets. These competitors may have more resources and be more successful in penetrating the market for cloud-based services then we are. We also encounter competition from technologies developed by the in-house information technology departments of our customers and potential customers. If we fail to compete successfully, our operating results and financial condition will be materially adversely affected.
If we do not effectively hire, expand and train our sales force, we may be unable to adequately penetrate the market and grow, and our business may be harmed.
We are dependent on our sales force to obtain new customers and to sell additional solutions to our existing customers. Our ability to achieve sustainable revenue growth will depend, in large part, on our success in recruiting, training and retaining sufficient numbers of sales personnel to support our growth. There is significant competition for sales personnel with the skills, understanding of the digital transformation and technical knowledge that we require. When hired, it generally takes significant time before they achieve full productivity. Our hires may not become as productive as we expect, and we may need to hire new sales personnel, who would require the same training and time to become effective. Moreover, we may be unable to hire or retain sufficient numbers of qualified individuals in the automotive market where we do business or other markets in which we plan to do business. These individuals may also have difficulty implementing our go-to-market strategy on repeatable, platform-based sales. If we are unable to hire and train sufficient numbers of effective sales personnel who can effectively sell our Platform, our revenue may grow at a slower rate than we anticipate and our financial condition could suffer.
If we fail to manage our sales and distribution channels effectively or if our partners choose not to market and sell our solutions to their customers, our operating results could be adversely affected.
We derive a significant portion of our revenue from sales of our Platform to and through our strategic partners. Accordingly, our strategic partners will be responsible for a significant portion of our sales now and in the future. In order to scale our channel program to support growth in our business, it is important that we help our partners enhance their ability to independently sell and deploy the Platform. Accordingly, we have invested and continue to invest in enhancements to our Platform to facilitate the sale and implementation of our Platform by our partners. Moreover, we are investing significant time and resources into our strategic partners to educate them on the Platform to accelerate their ability to become productive in selling our Platform. Despite these investments and efforts, we may be unable to successfully expand and improve the effectiveness of our channel sales program.
10
We expect that agreements with strategic partners will be generally non-exclusive and that strategic partners may enter into strategic relationships with our competitors or may be competitors themselves. Further, we expect that many strategic partners will have multiple strategic relationships and may not regard us as significant for their businesses. Strategic partners may terminate their respective relationships with us with limited or no notice and with limited or no penalty, pursue other partnerships or relationships, or attempt to develop or acquire technologies or services that compete with our solutions. Strategic partners may also impair our ability to enter into other desirable strategic relationships or sell additional business with our customers or other partners.
If strategic partners do not effectively market and sell our solutions, if they choose to place greater emphasis on technologies of their own or those offered by our competitors, or if they fail to meet the needs of our customers, our ability to grow our business and sell our solutions may be adversely affected. The loss of Cisco, or a substantial number of other strategic partners, and our possible inability to replace them, the failure to recruit additional strategic partners, any reduction or delay in their sales of our solutions, or any conflicts between channel sales and our direct sales and marketing activities could materially and adversely affect our results of operations.
We operate in an emerging and evolving market which may lead to period to period variability in our revenue and make it difficult to evaluate our future prospects.
We believe our Platform is unique in the marketplace as it flexibly provides the framework to improve business processes involving a user's extended enterprise ranging from customers, suppliers and other stakeholders. However, the markets for our Platform are in an early stage of development, and it is uncertain how these markets will develop and how fast. Even if they do develop, it is not certain our Platform will satisfy the needs of the market to achieve and sustain high levels of demand and acceptance. Because our Platform has a significant number of uses across many industries, our ability to grow revenue will be dependent upon our ability to determine which industries are most likely to be ready to utilize our technologies to solve their business issues. If we do not select wisely, we lose the opportunity to service a market as the need matures, and thereby incur significant costs without securing our position in the marketplace.
If companies do not perceive or value the benefits of our solutions, or if companies are unwilling to accept our Platform as an alternative to the traditional approach to solving business process problems in their extended enterprise, the market for our Platform might not continue to develop or might develop more slowly than we expect, either of which could significantly affect our revenue and growth prospects.
We provide service level commitments to our customers, and our failure to meet the stated service levels could significantly harm our financial results and our reputation.
Our customer agreements require that we maintain certain service level commitments to our customers relating primarily to functionality, network uptime and critical infrastructure availability. For example, our service level agreements generally require that our solutions are available up to 99.9% of the time. If we are unable to meet the stated service level commitments, we may be contractually obligated to provide customers with financial credits. Additionally, if we fail to meet our service level commitments a specified number of times within a given time frame or for a specified duration, our customers may terminate their agreements with us. As a result, a failure to deliver services for a relatively short duration could cause us to issue financial credits to a large number of affected customers or result in the loss of customers. In addition, we cannot assure you that our customers will accept these credits or termination rights in lieu of other legal remedies that may be available to them, and, therefore, we could be liable for other related damages incurred by our customers. Our failure to meet our commitments could also result in substantial customer dissatisfaction or loss. If we fail to meet our service level commitments to our customers, the resulting issuance of credits, loss of customers or other potential liabilities could significantly and adversely impact our financial results.
If our security measures are breached or unauthorized access to data is otherwise obtained, our solutions may be perceived as not being secure, customers may reduce the use of, or stop using, our solutions and we may incur significant liabilities.
Our operations enable the exchange of, and access to, sensitive information, and security breaches could result in the loss of this information, litigation, indemnity obligations and other liability. While we have security measures in place, if our security measures are breached as a result of third-party action, employee error or otherwise, our reputation could be significantly damaged, our business may suffer and we could incur substantial liability. Because techniques used to obtain unauthorized access to or sabotage systems change frequently and generally are not identified until they are launched against a target, we may be unable to anticipate these techniques or to implement adequate preventative measures. Any or all of these issues could negatively impact our ability to attract new customers and increase engagement by existing customers, cause existing customers to elect not to renew their subscriptions or subject us to third-party lawsuits, regulatory fines or other action or liability, thereby harming our operating results.
11
Because our Platform is often used to collect and store personal information, privacy concerns could result in additional cost and liability to us or inhibit sales of our solutions.
Many federal, state and foreign government bodies and agencies have adopted or are considering adopting laws and regulations regarding the collection, use and disclosure of personal information. In the U.S., these include rules and regulations promulgated under the authority of the Federal Trade Commission, the Health Insurance Portability and Accountability Act of 1996 (HIPAA), the Health Information Technology for Economic and Clinical Health Act (HITECH), state breach notification laws and other state privacy and data security laws. Outside of the U.S., these privacy and data security requirements include rules and regulations promulgated under the European Union data protection directive. Virtually every jurisdiction in which we operate has established its own data security and privacy legal framework with which we or our customers must comply.
In addition to government regulation, privacy advocacy and industry groups may propose new and different self-regulatory standards that either legally or contractually apply to us. Because the interpretation and application of privacy and data protection laws are still complex, evolving and uncertain, it is possible that these laws may be interpreted and applied in a manner that is inconsistent with our existing data management practices or the features of our solutions. If so, in addition to the possibility of fines, lawsuits and other claims, we could be required to fundamentally change our business activities and practices or modify our solutions, which could have an adverse effect on our business. Any inability to adequately address privacy concerns, even if unfounded, or comply with applicable privacy or data protection laws, regulations and policies, could result in additional cost and liability to us, damage our reputation, inhibit sales and harm our business.
Furthermore, the costs of compliance with, and other burdens imposed by, the laws, regulations and policies that are applicable to the businesses of our customers may limit the use and adoption of, and reduce the overall demand for, our solutions. While we carry insurance to provide coverage for potential remediation of privacy breaches, the cost of remediation may far exceed the policy limits that we purchase. Moreover, privacy concerns, whether or not valid, may inhibit market adoption of our solutions particularly in certain industries and foreign countries.
Our solutions are hosted at multiple data centers around the world. Any disruption of service at our facilities or our third-party hosting providers could interrupt or delay our customers’ access to our solutions, which could harm our operating results.
The ability of our customers to access our solutions is critical to our business. We currently serve customers from data centers located in Chicago, Illinois; Southfield, Michigan; Allen, Texas: Northern Virginia; Tokyo, Japan; Frankfurt, Germany; and Shanghai, China. We cannot assure you that the measures we have taken to eliminate single points of failure in our data centers located in Chicago, Frankfurt, and Northern Virginia will be effective to prevent or minimize interruptions to our operations. Our facilities are vulnerable to interruption or damage from a number of sources, many of which are beyond our control, including, without limitation:
Extended power loss;
Telecommunications failures from multiple telecommunication providers;
Natural disaster or an act of terrorism;
Software and hardware errors, or failures in our own systems or in other systems;
Network environment disruptions such as computer viruses, hacking and similar problems in our own systems and in other systems;
Theft and vandalism of equipment; and
Actions or events caused by or related to third parties.
We attempt to mitigate these risks through various business continuity efforts, including redundant infrastructure, stand-by systems, failover sites, 24x7x365 system activity monitoring, backup and recovery procedures, use of a secure off-site storage facility for backup media, separate test systems and change management and system security measures, but our precautions may not protect against all potential problems. Our data recovery centers are equipped with physical space, power, storage and networking infrastructure and Internet connectivity to support the solutions we provide in the event of the interruption of services at our primary data center. Even with this data recovery center, however, our operations would be interrupted during the transition process should our primary data center experience a failure.
Disruptions at our data centers could cause disruptions in our services and data loss or corruption. This could damage our reputation, cause us to issue credits to customers, subject us to potential liability or costs related to defending against claims or cause customers to terminate or elect not to renew their agreements, any of which could negatively impact our revenue.
CenturyLink and AWS currently host the majority of our solutions. We cannot guarantee that we will be able to continue to receive reasonable pricing and terms from CenturyLink, AWS, or our other hosting providers in the future. Failure to negotiate
12
reasonable terms could result in increased costs, which could negatively impact our financial condition. If our providers stop providing services or we fail to negotiate terms on an acceptable basis, we could be required to move our solutions to other third-party hosting providers, which would be a distraction to our business, could increase costs and could cause a disruption in our services.
We could be sued for contract claims, and such lawsuits, if successful, may have an adverse effect on our financial results.
Our Platform performs significant volume of transactions in mission-critical systems for our customers. General errors, defects, inaccuracies or other performance problems in our solutions or inaccuracies in or loss of the data we provide to our customers could result in financial or other damages to our customers, which damages could prompt them to make claims for damages against us. We cannot assure you that the limitations of liability set forth in our contracts would be enforceable or would otherwise protect us from liability for damages. We maintain liability insurance coverage, including coverage for errors and omissions, in amounts and under terms that we believe are appropriate. We cannot assure you that this coverage will continue to be available on terms acceptable to us, or at all, or in sufficient amounts to cover one or more large contract claims, or that the insurer will not limit or deny coverage for any future claim. The successful assertion of one or more large contract claims against us that exceeds available insurance coverage, could have a material adverse effect on our business, prospects, financial condition and results of operations.
Changes in federal law or regulation could adversely impact our Physician Quality Reporting System offering.
Revenue from our Physician Quality Reporting System (“PQRS”) offering represented approximately 3%, 4%, and 2% of our total revenue for the years ended March 31, 2016, 2015, and 2014, respectively. PQRS revenue is recognized as performed at the time of the annual submission to the government typically during our fourth quarter. PQRS is a voluntary federal program that incentivizes certain quality care data reporting by healthcare professionals. As a federal program, a change in federal law or regulation could alter or eliminate PQRS, which, in turn, could adversely impact our revenue.
Our Platform must integrate with a variety of operating systems, software applications and hardware that are developed by others. If we are unable to devote the necessary resources to ensure that our solutions interoperate with such software and hardware, we may fail to increase, or we may lose, market share and we may experience reduced demand for our offerings.
Our Platform must integrate with a variety of network, hardware, and software platforms, and we will need to continuously modify and enhance our Platform to adapt to changes in mobility, Internet-related hardware, software, communication, browser and database technologies. The cost to make our Platform broadly interoperable may be significant. Any failure of our solutions to operate effectively with future platforms and technologies could reduce the demand for our Platform, result in customer dissatisfaction and harm our business. If we are unable to respond to these changes in a timely, cost-effective manner, our solutions may become less marketable and less competitive or obsolete and our operating results may be negatively impacted. If we cannot effectively make our Platform available on mobile devices, we may experience difficulty attracting and retaining customers.
We rely on third-party software that may be difficult to replace or which could cause errors or failures of our service that could lead to lost customers or harm to our reputation.
We rely on software licensed from third parties to offer our solutions. This software may not continue to be available to us at all or on commercially reasonable terms. Any loss of the right to use any of this software could result in delays in the provisioning of our service until equivalent technology is either developed by us, or, if available, is identified, obtained and integrated, which could harm our business. Any errors or defects in third-party software could result in errors or a failure of our solutions, which could harm our business.
The loss of certain key employees and technical personnel or our inability to hire additional qualified personnel could have a material adverse effect on our business.
Our success depends in part upon the continued service of our key management, technical and administrative personnel. Such personnel are employed at-will and may leave Covisint at any time. Our success also depends on our continuing ability to attract and retain highly-qualified technical, managerial and sales personnel. The market for professional services and software development personnel has historically been, and we expect that it will continue to be, intensely competitive. We cannot assure you that we will continue to be successful in attracting or retaining such personnel. We have lost qualified personnel and may lose additional personnel due to the performance of the Company. Should we lose key employees, or we are unable to attract and retain other qualified employees, it could have a material adverse effect on our business.
We could incur substantial costs as a result of any claim of infringement of another party’s intellectual property rights.
13
In recent years, there has been significant litigation in the U.S. and elsewhere involving patents and other intellectual property rights. Companies providing Internet-related products and services are increasingly bringing and becoming subject to suits alleging infringement, misappropriation or other violations of patents, copyrights, trademarks, trade secrets or other intellectual property rights. These risks have been amplified by an increase in the number of third parties whose sole or primary business is to assert such claims. We could incur substantial costs in prosecuting or defending any intellectual property litigation. Additionally, the defense or prosecution of claims could be time-consuming and could divert our management’s attention away from the execution of our business plan.
We cannot be certain that our solutions and services do not infringe the intellectual property rights of third parties. Claims of alleged infringement or misappropriation could be asserted against us by third parties in the future, and if made, we cannot be certain that we would prevail. In addition to possible claims with respect to our solutions, some of our solutions contain technology developed by and licensed from third parties, and we may likewise be susceptible to infringement or misappropriation claims with respect to these third-party technologies.
Moreover, any settlement or adverse judgment resulting from a claim could require us to pay substantial amounts or obtain a license to continue to use the technology that is the subject of the claim, or otherwise restrict or prohibit our use of the technology. We cannot assure you that we would be able to obtain a license from the third party asserting the claim at all or on commercially reasonable terms, that we would be able to develop alternative technology on a timely basis, or that we would be able to obtain a license to use a suitable alternative technology to permit us to continue offering, and our customers to continue using, our affected solution or service. In addition, we may be required to indemnify our customers for third-party intellectual property infringement claims, which would increase the cost to us. An adverse determination could also prevent us from offering our products or services to others. Infringement claims asserted with or without merit against us may have an adverse effect on our business, financial condition and results of operations.
Our contracts with customers include contractual obligations to indemnify them against claims that our solutions infringe the intellectual property rights of third parties. The results of any intellectual property litigation to which we might become a party, or for which we are required to provide indemnification, may force us to do one or more of the following:
Participate in or pay the costs of the defense of such litigation;
Cease selling or using solutions or services that incorporate the challenged technology;
Make substantial payments for costs or damages;
Obtain a license, which may not be available on reasonable terms, to sell or use the relevant technology; or
Redesign those solutions or services to avoid infringement.
If we are required to make substantial payments or undertake any of the other actions noted above as a result of any intellectual property infringement claims against us or any obligation to indemnify our customers for such claims, such payments or costs could have a material adverse effect upon our business and financial results. Even if we are not a party to any litigation between a customer and a third party, an adverse outcome in any such litigation could make it more difficult for us to defend our technology in any subsequent litigation in which we are a named party. Moreover, such infringement claims with or without merit may harm our relationships with our existing customers and may deter future customers from subscribing to our solutions and related services on acceptable terms, if at all.
We may not be able to adequately protect our intellectual property rights and efforts to protect them may be costly and may substantially harm our business.
Our ability to compete effectively is dependent in part upon our ability to protect our intellectual property rights. While we hold an issued patent and a pending patent application covering certain elements of our technology, this patent and patent application, and, more generally, existing patent laws, may not provide adequate protection for portions of the technology that are important to our business. In addition, our pending patent application may not result in an issued patent. We have largely relied on copyright, trade secret and trademark laws, as well as generally relying on confidentiality procedures and agreements with our employees, consultants, customers and vendors, to control access to, and distribution of, technology, software, documentation and other confidential information. Despite these precautions, it may be possible for a third party to copy or otherwise obtain, use or distribute our technology without authorization. If this were to occur, we could lose revenue as a result of competition from products infringing or misappropriating our technology and intellectual property and we may be required to initiate litigation to protect our proprietary rights and market position.
U.S. patent, copyright, trademark, and trade secret laws offer us only limited protection, and the laws of some foreign countries do not protect proprietary rights to the same extent. Accordingly, defense of our trademarks and proprietary technology may become an increasingly important issue as we continue to expand our operations and solution development into countries that provide a lower level of intellectual property protection than the United States. Policing unauthorized use of our trademarks
14
and technology is difficult and the steps we take may not prevent misappropriation of the trademarks or technology on which we rely. If competitors are able to use our trademarks or technology without recourse, our ability to compete would be harmed and our business could be materially and adversely affected.
We may elect to initiate litigation in the future to enforce or protect our proprietary rights or to determine the validity and scope of the rights of others. That litigation may not be ultimately successful and could result in substantial costs to us, the reduction or loss in intellectual property protection for our technology, the diversion of our management’s attention and harm to our reputation, any of which could materially and adversely affect our business and results of operations.
Confidentiality arrangements with employees and others may not adequately prevent disclosure of trade secrets and other proprietary information.
We have devoted substantial resources to the development of our technology, business operations and business plans. In order to protect our trade secrets and proprietary information, we rely in significant part on confidentiality arrangements with our employees, licensees, independent contractors, advisers and customers. These arrangements, some of which were acquired through acquisitions, may not be effective to prevent disclosure of confidential information, including trade secrets, and may not provide an adequate remedy in the event of unauthorized disclosure of confidential information. Laws regarding trade secret rights in certain markets in which we operate may afford little or no protection to our trade secrets. The loss of trade secret protection could make it easier for third parties to compete with our solutions by copying functionality. In addition, any changes in, or unexpected interpretations of, the trade secret and other intellectual property laws in any country in which we operate may compromise our ability to enforce our trade secret and intellectual property rights. Costly and time-consuming litigation could be necessary to enforce and determine the scope of our proprietary rights, and failure to obtain or maintain trade secret protection could adversely affect our competitive business position.
We may be subject to damages resulting from claims that we, our employees or contractors, have wrongfully used or disclosed alleged trade secrets of their former employers or other parties.
We could in the future be subject to claims that our employees or contractors, or we, have inadvertently or otherwise used or disclosed trade secrets or other proprietary information of their former employers or other parties. Litigation may be necessary to defend against these claims. If we fail in defending against such claims, a court could order us to pay substantial damages and prohibit us from using technologies or features that are essential to our solutions, if such technologies or features are found to incorporate or be derived from the trade secrets or other proprietary information of these parties. In addition, we may lose valuable intellectual property rights or personnel. A loss of key personnel or their work product could hamper or prevent our ability to develop, market and support potential solutions or enhancements, which could severely harm our business. Even if we are successful in defending against these claims, such litigation could result in substantial costs and be a distraction to management.
Our use of “open source” software could negatively affect our ability to sell our services and solutions or protect our intellectual property and subject us to possible litigation.
A portion of the technology licensed from others by us and that we use to make our solutions available currently incorporates “open source” software, and we may incorporate open source software into our solutions in the future. Such open source software is generally licensed by its authors or other third parties under various open source licenses. Terms of many source licenses have not been interpreted by U.S. or foreign courts, and there is a risk that such licenses could be construed in a manner that could impose unanticipated conditions or restrictions on our ability to offer our Platform. In that event, we could be required to seek licenses from third parties in order to continue offering our services, to re-engineer our products or to discontinue sales of our affected solutions, any of which could materially adversely affect our business. In addition, if we fail to comply with these licenses, we may be subject to certain conditions, including requirements that we make available source code for modifications or derivative works we create based upon, incorporating or using the open source software or source code of our proprietary software and that we license such modifications, alterations or source code under the terms of the particular open source license. If a third party were to allege that we had not complied with the conditions of one or more of these licenses, we could be:
Required to defend against such allegations;
Subject to significant damages;
Enjoined from the sale of our solutions that contained the open source software;
Required to comply with the conditions described above; or
Required to discontinue our use of such open source software or the sale of our affected solutions in the event we could not maintain compliance with such licenses.
Any of the foregoing events could disrupt the distribution and sale of some of our solutions while forcing us to incur significant legal expenses.
15
Additionally, the use of open source software can lead to greater risks than the use of third-party commercial software, as open source software does not come with warranties or other contractual protections regarding infringement claims or the quality of the code. From time to time, parties have asserted claims against companies that use open source software in their products and services, asserting that open source software infringes their intellectual property rights. We could be subject to suits by parties claiming infringement of intellectual property rights with respect to what we believe to be open source software. In such event, we could be required to seek licenses from third parties in order to continue using such software or offering certain of our solutions and services or to discontinue the use of such software or the sale of our affected solutions and services in the event we could not obtain such licenses, any of which could adversely affect our business, operating results and financial condition.
Our success depends in part on our ability to develop or acquire solution enhancements and new solutions, and we may not be able to timely develop or acquire new and enhanced solutions to satisfy changes in demand.
The markets for our products and services are characterized by intense competition, evolving industry standards, emerging business models, disruptive technology developments, short product and service life cycles, and frequent new product introductions. Accordingly, our success depends in part on our ability to develop and market solution enhancements and new solutions that keep pace with continuing changes in technology and customer preferences. We may not be able to develop and market new or enhanced solutions in a timely or cost-effective manner or to develop and introduce solutions that satisfy customer requirements. Our solutions also may not achieve market acceptance or correctly anticipate technological changes. If any competing products or services achieve widespread acceptance, our operating results could suffer. In addition, there has been and will continue to be significant consolidation of participants in the markets in which we compete. Further consolidation in these markets may subject to us to increased competitive pressures. Our failure to develop technological improvements or to adapt our solutions to technological or market changes may, over time, have a material adverse effect on our business.
We may expand our business by acquiring or investing in other products, services, technologies or businesses, which may divert our management’s attention, result in dilution to our shareholders and consume resources that are necessary to sustain our business.
We may in the future acquire complementary products, services, technologies or businesses. We also may enter into relationships with other businesses to expand our portfolio of solutions or our ability to provide our solutions in foreign jurisdictions. Negotiating these transactions can be time-consuming, difficult and expensive, and our ability to complete these transactions may often be subject to conditions or approvals that are beyond our control. Consequently, these transactions, even if undertaken and announced, may not close.
An acquisition, investment or new business relationship may result in unforeseen operating difficulties and expenditures. In particular, we may encounter difficulties assimilating or integrating the businesses, technologies, products, personnel, or operations of acquired companies, particularly if the key personnel of the acquired company choose not to work for us, the acquired company’s technology is not easily adapted to be compatible with ours, or we have difficulty retaining the customers of any acquired business due to changes in management or other concerns. Acquisitions may also disrupt our business, divert our resources and require significant management attention that would otherwise be available for the development of our business. Moreover, the anticipated benefits of any acquisition, investment or business relationship may not be realized or we may be exposed to unknown liabilities, including litigation against the companies we may acquire. For one or more of those transactions, we may:
Issue additional equity securities that would dilute our shareholders;
Use cash that we may need in the future to operate our business;
Incur debt on terms unfavorable to us or that we are unable to repay or that may place burdensome restrictions on our operations;
Incur significant charges or substantial liabilities; or
Become subject to adverse tax consequences, or substantial depreciation, deferred compensation or other acquisition-related accounting charges.
Any of these risks could harm our business and operating results.
Unanticipated changes in our effective tax rate or exposure to additional income tax liabilities could have a material impact on our financial results and could increase the volatility of those results.
Due to the global nature of our business, we are subject to income taxes in both the United States and several foreign jurisdictions. In the event we generate net income in certain jurisdictions but incur net losses in other jurisdictions, we generally cannot offset the income from one jurisdiction with the loss from another, which could increase our effective tax rate. Furthermore, significant judgment is required in determining our worldwide provision for income taxes. In the ordinary course of our business
16
there are many transactions and calculations for which the ultimate tax determination is uncertain. Although we believe our tax positions are reasonable, we are subject to routine corporate income tax audits in the jurisdictions in which we operate. Our provision for income taxes includes amounts intended to satisfy income tax assessments that are likely to result from the examination of our tax returns that have been filed in these jurisdictions. The amounts ultimately paid upon resolution of such examinations could be materially different from the amounts included in the provision for income taxes and could have a material impact on our financial position, results of operations or cash flows in the period or periods for which that determination is made.
We recognize reserves for uncertain tax positions through tax expense for estimated exposures related to our current and historical tax positions. We evaluate the need for reserves for uncertain tax positions on a quarterly basis and any change in the amount is recorded in our results of operations, as appropriate. It could take several years to resolve certain of these reserves for uncertain tax positions.
Additionally, one of the components that we evaluate in establishing the provision for income taxes is the realization of our deferred tax assets. We must assess the likelihood that our deferred tax assets will be recovered from future taxable income and, to the extent we believe that recovery is not likely, we must establish a valuation allowance. Changes in estimates of projected future operating results or in assumptions regarding our ability to generate future taxable income could result in increases to our total valuation allowance and tax expense that would reduce net income.
We earn a portion of our income, and accumulate a portion of cash flow, in foreign jurisdictions. Any repatriation of funds currently held in foreign jurisdictions may result in a higher effective tax rate and larger incremental cash tax payments. In addition, there have been proposals to amend U.S. tax laws that would significantly impact the manner in which U.S. companies are taxed on foreign earnings. Although we cannot predict whether or in what form any legislation will pass, if enacted, such legislation could have an adverse impact on our U.S. tax expense and cash flows.
We are exposed to exchange rate risks on foreign currencies and to other international risks that may adversely affect our business and results of operations.
Approximately 14% of our total revenue for each of the years ended March 31, 2016, 2015, and 2014, respectively, was derived from foreign operations. We currently have foreign sales denominated in the local currency of several foreign countries, and our solutions and services may be priced in the currency of the country in which they are sold. Changes in the exchange rates of foreign currencies or exchange controls may adversely affect our results of operations. We have not previously engaged in foreign currency hedging. If we decide to hedge our foreign currency exposure, we may not be able to hedge effectively due to lack of experience, unreasonable costs or illiquid markets.
The international business environment is also subject to other risks, including the need to comply with foreign and U.S. laws and the greater difficulty of managing business operations overseas. In addition, our foreign operations are affected by general economic conditions in the international markets in which we do business. A worsening of economic conditions in these markets could cause customers to delay or forego decisions to acquire or renew subscriptions or to reduce their requirements for services.
We face many risks associated with our plans to expand our international presence, which could harm our business, financial condition and operating results.
We currently operate internationally and intend to expand into additional international markets. In some international markets, customer preferences and buying behaviors may be different, and we may use business or pricing models that are different from our traditional subscription model to provide our Platform to customers in those markets or we may be unsuccessful in implementing the appropriate business model. Our revenue from new foreign markets may not exceed the costs of establishing, marketing and maintaining our offerings in those markets. In addition, the current instability in the eurozone could have many adverse consequences on our international operations, including sovereign default, liquidity and capital pressures on eurozone financial institutions, reducing the availability of credit and increasing the risk of financial sector failures and the risk of one or more eurozone member states leaving the euro, resulting in the possibility of capital and exchange controls and uncertainty about the impact of contracts and currency exchange rates.
In addition, conducting our operations in a new international market may subject us to new risks. These risks include:
Localization of our solutions, including the addition of the local language and adaptation to new local practices;
Strong local competitors;
The cost and burden of complying with, lack of familiarity with, and unexpected changes in, local legal and regulatory requirements;
Fluctuations in local currency exchange rates or restrictions on local currency;
17
Potentially adverse tax consequences, including the complexities of transfer pricing, value-added or other tax systems, double taxation and restrictions and/or taxes on the repatriation of earnings;
Hiring and training a local sales force;
Development of a local marketing strategy;
Dependence on third parties, including commercial partners with whom we do not have extensive experience;
Increased financial accounting and reporting burdens and complexities;
Political, social and economic instability, terrorist attacks and security concerns in general; and
Reduced or varied protection for intellectual property rights in some countries.
Operating in new international markets also requires significant management attention and financial resources. The investment and additional resources required to establish operations and manage growth in other countries may not produce desired levels of revenue or profitability.
Our solutions contain encryption technologies, certain types of which are subject to U.S. and foreign export control regulations and, in some foreign countries, restrictions on importation and/or use. Any failure on our part to comply with encryption or other applicable export control requirements could result in financial penalties or other sanctions under the U.S. export regulations, including restrictions on future export activities, which could harm our business and operating results. Regulatory restrictions could impair our access to technologies needed to improve our solutions and may also limit or reduce the demand for our solutions outside of the U.S.
Our operating results may be harmed if we are required to collect sales, services or other related taxes for our solutions in jurisdictions where we have not historically done so.
We do not believe that we are required to collect sales, use, services or other similar taxes from our customers in certain jurisdictions. However, one or more countries or states may seek to impose sales, use, services, or other tax collection obligations on us, including for past sales. A successful assertion by one or more jurisdictions that we should collect sales or other taxes on the sale of our solutions could result in substantial tax liabilities for past sales and decrease our ability to compete for future sales. Each country and each state has different rules and regulations governing such taxes and these rules and regulations are subject to varying interpretations that may change over time. We review these rules and regulations periodically and, when we believe such taxes apply in a particular jurisdiction, we comply with their rules and regulations. We cannot assure you that we will not be subject to such taxes or related interest and penalties for past sales in jurisdictions where we presently believe such taxes are not due. We reserve estimated amounts with respect to such taxes on our financial statements but we cannot be certain that we have made sufficient reserves to cover such tax liabilities or such taxes.
Providers of goods or services are typically held responsible by taxing authorities for the collection and payment of any applicable sales and similar taxes. If one or more taxing authorities determines that taxes should have, but have not, been paid with respect to our solutions, we may be liable for past taxes in addition to being required to collect sales or similar taxes in respect of our solutions going forward. Liability for past taxes may also include very substantial interest and penalty charges. Our customer contracts generally provide that our customers must pay all applicable sales and similar taxes. Nevertheless, customers may be reluctant to pay back taxes and may refuse responsibility for interest or penalties associated with those taxes or we may determine that it would not be feasible to seek reimbursement. If we are required to collect and pay back taxes and the associated interest and penalties and if our customers do not reimburse us for all or a portion of these amounts, we will have incurred unplanned expenses that may be substantial. Moreover, imposition of such taxes on our solutions going forward may effectively increase the cost of such solutions to our customers.
Many states are also pursuing legislative expansion of the scope of goods and services that are subject to sales and similar taxes as well as the circumstances in which a vendor of goods and services must collect such taxes. Furthermore, legislative proposals have been introduced in the U.S. Congress that would provide states with additional authority to impose such taxes. The tax laws of foreign jurisdictions may also change. Accordingly, it is possible that either federal or state legislative changes or foreign tax law changes may require us to collect additional sales and similar taxes from our customers in the future.
Acts of terrorism, acts of war and other unforeseen events may cause damage or disruption to us or our customers, which could materially and adversely affect our business, financial condition and operating results.
Natural disasters, acts of war, terrorist attacks and the escalation of military activity in response to such attacks or otherwise may have negative and significant effects, such as imposition of increased security measures, changes in applicable laws, market disruptions and job losses. Such events may have an adverse effect on the economy in general. Moreover, the potential for future terrorist attacks and the national and international responses to such threats could affect the business in ways that cannot be
18
predicted. The effect of any of these events or threats could have a material adverse effect on our business, financial condition and results of operations.
Risks Related to Our Common Stock
We are an “emerging growth company” within the meaning of the Securities Act, and as such, we will take advantage of certain modified disclosure requirements.
As a public company, we will be subject to the reporting requirements of the Exchange Act, the Sarbanes-Oxley Act, the Dodd-Frank Wall Street Reform and Consumer Protection Act, the listing requirements of The NASDAQ Stock Market and other applicable securities rules and regulations. The Exchange Act requires, among other things, that we file annual, quarterly and current reports with respect to our business and operating results. The Sarbanes-Oxley Act requires, among other things, that we maintain effective disclosure controls and procedures and internal control over financial reporting.
However, we are an “emerging growth company” within the meaning of the rules under the Securities Act. For as long as we remain an emerging growth company, we may take advantage of certain exemptions from various reporting requirements that are applicable to public companies that are not emerging growth companies, including not being required to comply with the independent auditor attestation requirements of Section 404 of the Sarbanes-Oxley Act, reduced disclosure obligations regarding executive compensation in our periodic reports and proxy statements and exemptions from the requirements of holding a nonbinding advisory vote on executive compensation and shareholder approval of any golden parachute payments not previously approved. We intend to take advantage of these reporting exemptions until we are no longer an emerging growth company. We will remain an “emerging growth company” for up to five years, although we would cease to be an “emerging growth company” upon the earliest of (i) the first fiscal year following the fifth anniversary of the IPO, (ii) the first fiscal year after our annual gross revenues are $1 billion or more, (iii) the date on which we have, during the previous three-year period, issued more than $1 billion in non-convertible debt securities, and (iv) the date on which we are deemed to be a “large accelerated filer” as defined in the Exchange Act. See “Management’s Discussion and Analysis of Financial Condition and Results of Operations-Critical Accounting Policies-JOBS Act” in Item 7 of this Annual Report.
We cannot predict if investors will find our common stock less attractive because we may rely on these exemptions. If some investors find our common stock less attractive as a result, there may be a less active trading market for our common stock.
The share price of our common stock is likely to be volatile and could decline.
Prior to the IPO, there had been no public market for our common stock. An active public market for these shares may never develop or be sustained, which could affect your ability to sell your shares and could depress the market price of your shares. The IPO price for the shares of our common stock was determined by negotiations between us and the representatives of the underwriters and has not been indicative of prices that have since prevailed in the trading market. The market price of our common stock, has been, and could continue to be subject to wide fluctuations in response to many risk factors described in this report, and others beyond our control, including:
Actual or anticipated fluctuations in our condition and operating results;
Changes in projected operational and financial results;
Addition or loss of significant customers;
Changes in laws or regulations applicable to our business;
Actual or anticipated changes in our growth rate relative to our competitors;
Announcements of technological innovations or new offerings by us or our competitors;
Additions or departures of key personnel;
Issuance of new or updated research or reports by securities analysts;
Fluctuations in the valuation of companies perceived by investors to be comparable to us;
The expiration of contractual lock-up agreements; and
General economic, legal, regulatory and market conditions unrelated to our performance.
In addition, if the general stock market experiences a loss of investor confidence, the trading price of our common stock could decline for reasons unrelated to our business, financial condition or results of operations.
In the past, companies that have experienced volatility in the market price of their stock have been subject to securities class action litigation. Securities litigation against us could result in substantial costs and divert our management’s attention from other business concerns, which could harm our business.
19
We have a securities class action lawsuit against us that may result in an adverse outcome.
We are currently subject to a securities class action lawsuit. We have reached a settlement with the class action plaintiffs subject to court approval. In the event the court fails to approve the settlement, adverse outcomes in this lawsuit may result in significant monetary damages or injunctive relief that could adversely affect our ability to conduct our business. The litigation and other claims are subject to inherent uncertainties and management’s view of these matters may change in the future. A material adverse impact on our consolidated financial statements could occur for the period in which the effect of an unfavorable final outcome becomes probable and reasonably estimable.
We do not anticipate paying any dividends on our common stock.
We do not anticipate paying any cash dividends on our common stock in the foreseeable future. If we do not pay cash dividends, you could receive a return on your investment in our common stock only if the market price of our common stock has increased when you sell your shares.
If securities or industry analysts do not publish research or reports about our business, or publish inaccurate or unfavorable research reports about our business, our share price and trading volume could decline.
The trading market for our common stock will, to some extent, depend on the research and reports that securities or industry analysts publish about us or our business. We do not have any control over these analysts. If one or more of the analysts who cover us downgrade our shares or change their opinion of our shares, our share price would likely decline. If one or more of these analysts cease coverage of our company or fail to regularly publish reports on us, we could lose visibility in the financial markets, which could cause our share price or trading volume to decline.
Our articles of incorporation and bylaws as well as certain provisions of Michigan law may have an anti-takeover effect.
Provisions of our articles of incorporation and bylaws and Michigan law could make it more difficult for a third party to acquire us, even if doing so would be perceived to be beneficial to shareholders. The combination of these provisions inhibits a non-negotiated acquisition, merger or other business combination involving our company, which, in turn, could adversely affect the market price of our common stock.
ITEM 1B. UNRESOLVED STAFF COMMENTS
None.
ITEM 2. PROPERTIES
We maintain our principal offices at 26533 Evergreen Road, Suite 500, Southfield, Michigan, which is leased through 2026 for 33,786 square feet of space. We have also entered into stand-alone operating lease agreements for office space in Shanghai, China; Frankfurt, Germany; London, England; and San Francisco, California.
ITEM 3. LEGAL PROCEEDINGS
Beginning on May 30, 2014, two putative class actions were filed in the U.S. District Court for the Southern District of New York against us, our directors and former directors, and certain of our officers and former officers alleging violation of securities laws in connection with our IPO and seeking unspecified damages. These lawsuits were consolidated in the action entitled Desrocher v. Covisint Corporation, et al., No. 14-cv-03878 (the “Securities Class Action”). On October 14, 2014, the lead plaintiff filed a consolidated class action complaint (the “Complaint”) alleging violations of Regulation S-K and Sections 11 and 15 of the Securities Act of 1933, as amended (“Securities Act”). The Complaint alleges, among other things that the IPO’s registration statement contained (1) untrue statements and omissions of material facts related to the Company’s projected revenues for fiscal 2014, (2) materially inaccurate statements regarding the Company’s revenue recognition policy, and (3) omissions of known trends, uncertainties, and significant risk factors as required to be disclosed by Regulation S-K.
On May 5, 2016, the parties entered into a stipulation and agreement of settlement to dismiss all claims with prejudice and settle the Securities Class Action (the “Settlement”). The Settlement was reached after the Court denied defendants' motions to dismiss and granted class certification of a class of all persons who purchased the Company's stock in and/or traceable to the Company's IPO on or about September 26, 2013, seeking to pursue remedies under Section 11 and 15 of the Securities Act. The Settlement, which is subject to Court approval, provides for a payment by the defendants of $8.0 million. The Company's uninsured portion of the settlement amount was $0.4 million, which was recorded as a liability as of March 31, 2016.
ITEM 4. MINE SAFETY DISCLOSURES
20
Not Applicable.
PART II
ITEM 5. MARKET FOR REGISTRANT'S COMMON EQUITY, RELATED STOCKHOLDER MATTERS
Our common stock is traded on The NASDAQ Global Select Market (“NASDAQ”) under the symbol COVS. As of May 18, 2016, there were 2,946 shareholders of record and approximately 17,160 beneficial holders of our common stock. The following table sets forth the range of high and low sale prices for our common stock for the periods indicated, all as reported by NASDAQ.
Fiscal Year Ended March 31, 2016 | High | Low | ||||||||
Fourth quarter | $ | 2.50 | $ | 1.75 | ||||||
Third quarter | 2.60 | 2.01 | ||||||||
Second quarter | 3.29 | 2.15 | ||||||||
First quarter | 3.27 | 1.81 | ||||||||
Fiscal Year Ended March 31, 2015 | ||||||||||
Fourth quarter | $ | 2.65 | $ | 1.92 | ||||||
Third quarter | 4.46 | 2.06 | ||||||||
Second quarter | 5.29 | 3.78 | ||||||||
First quarter | 7.39 | 4.31 | ||||||||
Dividends
We have never paid any cash dividends on our common stock and have no current intention to do so.
Unregistered Sales of Equity Securities
None.
Issuer Purchases of Equity Securities
There were no repurchases of common stock for the year ended March 31, 2016.
Stock Performance Graph - Comparison of Cumulative Total Return
The following line graph compares the yearly percentage change in the cumulative total shareholder return on our common stock with the cumulative total return of each of the NASDAQ Market Index and the NASDAQ Computer and Data Processing Index for the period from September 26, 2013, the first day of trading in connection with our IPO, through March 31, 2016. The graph assumes the investment of $100 in our common stock and each of the two NASDAQ indices on September 26, 2013 and the reinvestment of all dividends.
21
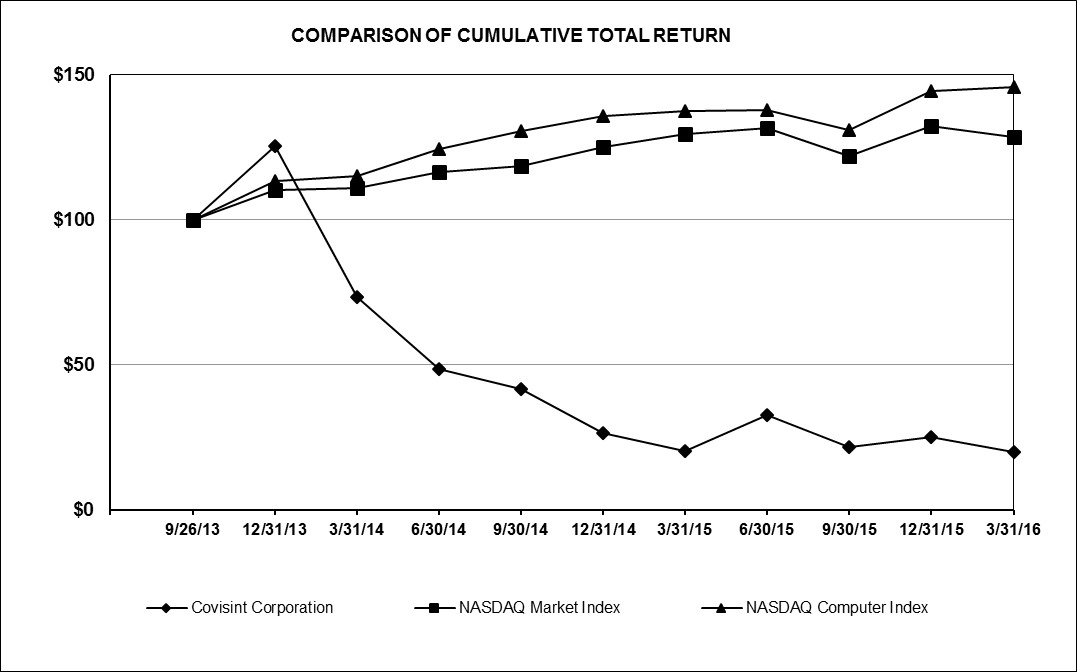
The comparisons in the graph are required by applicable rules promulgated by the SEC. You should be careful about drawing any conclusions from the data contained in the graph, because past results do not necessarily indicate future performance. The information contained in this graph shall not be deemed to be “soliciting material” or “filed” with the SEC or subject to the liabilities of Section 18 of the Exchange Act of 1934, as amended (“Exchange Act”), except to the extent that we specifically incorporate it by reference into a document filed under the Securities Act or the Exchange Act.
ITEM 6. SELECTED FINANCIAL DATA AND NON-U.S. GAAP FINANCIAL MEASURES
The following consolidated financial data (in thousands, except per share data) should be read together with our financial statements and related notes and “Management’s Discussion and Analysis of Financial Condition and Results of Operations” at Item 8 and 7, respectively, of this Annual Report. The historical results presented here are not necessarily indicative of future results.
22
YEAR ENDED MARCH 31, | |||||||||||||||||||||
2016 | 2015 | 2014 | 2013 | 2012 | |||||||||||||||||
REVENUE | $76,024 | $88,534 | $97,135 | $ | 90,732 | $ | 74,675 | ||||||||||||||
COST OF REVENUE (1) | 34,953 | 66,404 | 56,374 | 47,575 | 41,477 | ||||||||||||||||
GROSS PROFIT | 41,071 | 22,130 | 40,761 | 43,157 | 33,198 | ||||||||||||||||
OPERATING EXPENSES: | |||||||||||||||||||||
Research and development | 13,019 | 10,416 | 12,408 | 3,799 | 1,341 | ||||||||||||||||
Sales and marketing (2) | 29,448 | 32,593 | 35,250 | 26,593 | 22,544 | ||||||||||||||||
Administrative and general | 13,286 | 17,640 | 28,676 | 18,315 | 12,583 | ||||||||||||||||
Total operating expenses | 55,753 | 60,649 | 76,334 | 48,707 | 36,468 | ||||||||||||||||
OPERATING LOSS | (14,682 | ) | (38,519 | ) | (35,573 | ) | (5,550 | ) | (3,270 | ) | |||||||||||
Other (expense) income | (23 | ) | 69 | — | — | — | |||||||||||||||
LOSS BEFORE INCOME TAX PROVISION | (14,705 | ) | (38,450 | ) | (35,573 | ) | (5,550 | ) | (3,270 | ) | |||||||||||
INCOME TAX PROVISION | 189 | 112 | 85 | 98 | 57 | ||||||||||||||||
NET LOSS | ($14,894) | ($38,562) | ($35,658) | $ | (5,648 | ) | $ | (3,327 | ) | ||||||||||||
Basic and diluted loss per share | $ | (0.38 | ) | $ | (1.01 | ) | $ | (1.06 | ) | $ | (0.19 | ) | $ | (3.33 | ) | ||||||
(1) | Cost of revenue in FY15 includes an $8.3 million impairment of capitalized software costs. |
(2) | Sales and marketing expense in FY15 includes a $0.5 million impairment of healthcare customer relationships. |
Consolidated Balance Sheet Data
March 31, 2016 | March 31, 2015 | ||||||||
Cash | $39,681 | $50,077 | |||||||
Working Capital | 31,826 | 38,851 | |||||||
Total Assets | 102,045 | 121,842 | |||||||
Total Shareholders' Equity | $71,309 | $81,347 | |||||||
In addition to reporting financial results in accordance with accounting principles generally accepted in the United States (“U.S. GAAP”), we monitor the following other metrics to evaluate our business, measure our performance, identify trends affecting our business, allocate capital and make strategic decisions.
Adjusted Gross Profit and Adjusted Gross Margin
Adjusted gross profit represents gross profit, adjusted for amortization and impairment of capitalized software associated with our research and development expense classified within cost of revenue, as well as adjusted for stock based compensation associated with certain of our professional services and operations employees. Adjusted gross margin is adjusted gross profit as a percentage of revenue.
We believe that adjusted gross margin, when viewed with our results under U.S. GAAP and the accompanying reconciliations, provides additional information that is useful for evaluating our operating performance. Additionally, we believe that adjusted gross margin provides a more meaningful comparison of our operating results against those of other companies in our industry. However, adjusted gross margin is not a measure of financial performance under U.S. GAAP and, accordingly, should not be considered as an alternative to gross margin as an indicator of operating performance.
During fiscal 2015, amortization of capitalized software included $8.3 million related to an impairment of previously capitalized software costs related to software projects associated with our healthcare customer service offering.
23
The table below provides reconciliations between the non-U.S. GAAP financial measures discussed above to the comparable U.S. GAAP measures of gross profit:
YEAR ENDED MARCH 31, | ||||||||||||
2016 | 2015 | 2014 | ||||||||||
Gross profit | $ | 41,071 | $ | 22,130 | $ | 40,761 | ||||||
Gross margin | 54 | % | 25 | % | 42 | % | ||||||
Adjustments: | ||||||||||||
Stock compensation expense—cost of revenue | 71 | 613 | 829 | |||||||||
% of total revenue | — | % | 1 | % | 1 | % | ||||||
Amortization and impairment of capitalized software—cost of revenue | 3,398 | 15,079 | 6,753 | |||||||||
% of total revenue | 4 | % | 17 | % | 7 | % | ||||||
Non-U.S. GAAP gross profit | 44,540 | 37,822 | 48,343 | |||||||||
Non-U.S. GAAP gross margin | 59 | % | 43 | % | 50 | % | ||||||
ITEM 7. MANAGEMENT’S DISCUSSION AND ANALYSIS OF FINANCIAL CONDITION AND RESULTS OF OPERATIONS
The following discussion and analysis of our financial condition and results of operations should be read in conjunction with our financial statements and related notes that appear in Item 8 in this Annual Report. In addition to historical financial information, the information we provide or statements made by our employees contains forward-looking statements that reflect our plans, estimates, assumptions and beliefs. Our actual results could differ materially from those discussed in the forward-looking statements. Factors that could cause or contribute to these differences include those discussed below and Item 1A of this Annual Report under "Risk Factors." Forward-looking statements include information concerning our possible or assumed future results of operations, business strategies and operations, financing plans, potential growth opportunities, potential market opportunities and the effects of competition. Forward-looking statements include all statements that are not historical facts and can be identified by terms such as “anticipates,” “believes,” “could,” “seeks,” “estimates,” “expects,” “intends,” “may,” “plans,” “potential,” “predicts,” “projects,” “should,” “will,” “would” or similar expressions and the negatives of those terms. Given these uncertainties, you should not place undue reliance on these forward-looking statements. Also, forward-looking statements represent our management’s plans, estimates, assumptions and beliefs only as of the date of this report. Except as required by law, we assume no obligation to update these forward-looking statements publicly or to update the reasons actual results could differ materially from those anticipated in these forward-looking statements, even if new information becomes available in the future.
Overview of Fiscal 2016
Covisint provides a cloud Platform for the development of identity-centric and IoT solutions. Our Platform gives our customers a substantial strategic advantage by enabling them to rapidly develop and deploy these applications faster and more cost-effectively than the alternatives, and in so doing, compete more effectively in their markets. Our Platform has been successfully operating globally on an enterprise scale for over 13 years, and it is the technology behind innovative industry solutions such as General Motors’ OnStar, Hyundai’s BlueLink™ and Cisco Systems SXP.
Our Platform provides a complete set of integrated technologies that addresses a rapidly growing available market, particularly in the automotive and manufacturing industries, which span three horizontal use cases - the IoT, cloud identity and access management, and business-to-business collaboration.
For Covisint, fiscal 2016 was a year marked by continued execution on a number of strategic initiatives to enhance our long-term outlook.
First, we continued growing our strategic partnership with Cisco. In April 2015, we enabled Cisco to enter into the prime statement of work with OnStar, a division of GM, to provide the service that we historically provided directly to OnStar. This was the second of two GM Contracts and Cisco Agreements, with the earlier agreement completed in January 2015. Under both of these agreements we will continue to provide our Platform and various services to GM as a subcontractor to Cisco. We were able to extend the terms of these agreements through April 2020 and eliminate GM’s ability to terminate them for convenience. Under these agreements, we receive the annual fees in advance.
24
We continued to invest in the innovation and differentiation of our Platform necessary to lead the market and meet customer needs. We have improved our identity lifecycle management capabilities, specifically enhancing our customers’ ability for dynamic management and governance of relationships among connected entities (users, applications, systems, “things”). Further, our investment in integrating Cloud Foundry into the Platform has created the ability to easily deploy the Platform into new data centers anywhere in the world, as we have done in China and Europe, providing a higher level of flexibility and responsiveness to our global customers.
We have continued to invest in marketing as we transform to a market-led cloud platform company, including the opening of our San Francisco offices, as well as hiring experienced leaders in product marketing and product management. As a result of these investments, we have increased our visibility and favorable perception with key industry analysts, and depth of insight into market needs. To support our growth strategies and capitalize on current technology trends, we have made, and continue to make, a) substantial investments to expand in our installed customer base; b) win new customers in the automotive industry; and c) land new customers via our channel partners and via outbound OEM agreements with independent software vendors and system integrators.
Since we are continuing to actively invest in our business to drive long-term growth, we do not expect to be profitable during fiscal 2017. We experienced net (losses) of ($14.9) million, ($38.6) million, and ($35.7) million during the years ended March 31, 2016, 2015, and 2014, respectively. As presented in the accompanying notes to the consolidated financial statements, our loss in the prior year ended March 31, 2015 was due in part to impairment charges of $8.8 million, and the loss in the year ended March 31, 2014 included stock compensation expense of $17.5 million primarily resultant of our IPO.
Key Factors Affecting Our Performance
New Annualized Subscription Revenue (“ASR”)
Due to the nature of the subscription-based revenue model, a significant portion of the revenue we report in each quarter is generated from customer agreements entered into during previous periods. Therefore, since changes in business momentum are not immediately reflected in our results of operations, we consider additional metrics such as new annualized subscription revenue (“ASR”) that includes recently added or expanded customer subscription revenue to assess progress within our business.
We define ASR as the annualized value of new committed subscription revenue during a given period for new contracts and incremental committed subscription revenue for existing contracts. We calculate ASR for each new contract signed within a given period by dividing the total committed subscription revenue by the number of months under contract and multiplying that figure by the lesser of twelve or the number of months included in the agreement. We then add to this amount any long-term increase in committed subscription revenue under existing contracts renewed during that period.
YEAR ENDED MARCH 31, | |||||||||||
2016 | 2015 | 2014 | |||||||||
(In thousands) | |||||||||||
ASR | $9,320 | $14,374 | $8,149 | ||||||||
ASR growth is principally driven from three sources: 1) strategic partners; 2) incremental revenue from existing customers; and 3) direct sales to new customers. During the fiscal year ended March 31, 2016, we generated ASR from our strategic partner opportunities, as well as from existing customers in the automotive industry. However, we did not meet our expectations for direct sales with new customers, which contributed to the annual decline in ASR for the year ended March 31, 2016 as compared to the year ended March 31, 2015. During the upcoming 2017 fiscal year, we will continue our efforts to generate ASR from all three sources, with our primary focus on the automotive industry where we have a well-established footprint.
Subscription and Support Revenue
Subscription and support revenue includes fees for our customers and their users’ access to our Platform during the fiscal year, in conformity with U.S. GAAP. Total subscription and support revenue reflects the impact of new ASR, as well as our ability to retain and grow our existing customers over time.
25
YEAR ENDED MARCH 31, | |||||||||||
2016 | 2015 | 2014 | |||||||||
(In thousands) | |||||||||||
Subscription and Support Revenue | $63,367 | $66,283 | $66,688 | ||||||||
Subscription and support revenue declined during the fiscal year ended March 31, 2016 as compared to the year ended March 31, 2015. The net decrease was due to the expected decline in our healthcare subscription revenue as a result of our shift out of lower margin healthcare application business that was not offset by sufficient ASR. After adjusting for the planned reduction in our healthcare application business, our subscription revenue grew 6% during the 2016 fiscal year as compared to the 2015 fiscal year.
COMPONENTS OF OUR RESULTS OF OPERATIONS
Revenue
Our revenue is primarily comprised of fees related to subscription and support as well as services performed. Subscription and support revenue includes fees for our customers and their users to access our Platform. Service revenue is generated from fees related to the implementation of our Platform and consulting services for our customers, as well as from other non-subscription sales. Implementation services typically consist of user migration, content migration, solution deployment, configuration, and training to support customer-specific work flows. Our services engagements typically occur in phases and can vary from a few weeks to several months depending on the scope and complexity of the solution. Our customers may choose to do much of this work in-house, through a third party, or with Covisint. We currently subcontract portions of our service engagements to third-party service partners to supplement our staffing needs within this area of the business.
Services contract value varies significantly for each customer agreement and can be impacted by a number of trends, which make the prediction of our future services revenue difficult. These trends include, but are not necessarily limited to, improvements in our Platform that make it easier for our customers to build and launch new business process innovations on the Platform, the implementation of our certified partner program, and a reduction in the effort required to launch the customer.
Our revenue generally fluctuates, and we expect it to continue to fluctuate, between periods due to inconsistent timing of sales, revenue recognition requirements (e.g., acceptance), changes in customer requirements and other factors. As a result, transactions that were expected to be recognized in one period may be recognized in a different period, which may materially affect our financial performance in a reporting period.
Cost of Revenue
Our cost of revenue is primarily comprised of salaries and personnel-related expenses related to our customer support, implementation, solution deployment, on-boarding and data center operations, the cost of professional services provided by third-party contractors, depreciation, amortization and impairment expenses related to capitalized research and development, acquisitions and capital expenditures, third-party hosting fees, third-party software license fees and outside services related to our call center. Where we have established third-party evidence or a best estimate of selling price of the stand-alone value of our services, we recognize expense with the associated revenue recognition as services are delivered. Costs associated with deferred services revenue are recognized ratably, generally over five years, beginning upon customer acceptance of the deliverable consistent with the associated revenue.
We expect our cost of revenue may fluctuate as a percentage of total revenue due to relative changes in our services revenue, changes in the percentage of services recognized using the proportional performance method, the amount and timing of depreciation and amortization, changes in the amount of services performed by our customers or other vendors and the mix of subscription and support revenue relative to services revenue.
Research and Development
Research and development costs are primarily comprised of salaries and personnel-related expenses, services provided by third-party contractors related to software development and testing, software license and hardware fees and depreciation and amortization related to acquisitions and capital expenditures.
We focus our research and development on new and expanded features of our Platform, utilizing an agile delivery methodology for our Platform enhancements. We capitalize a portion of these costs related to our hosted software and application services that have reached the application development stage. Capitalization of such cost begins when the preliminary project stage is complete
26
and ceases at the point in which the project is substantially complete and is ready for its intended purpose. Our capitalized software costs are amortized as a cost of revenue ratably over a period of five years upon completion of the project.
Sales and Marketing
Sales and marketing costs are primarily comprised of salaries and personnel-related expenses, commissions, travel expense, marketing program fees, services provided by third-party contractors related to our marketing campaigns and amortization related to customer relationship agreements acquired as a result of various acquisitions.
General and Administrative
General and administrative costs are primarily comprised of personnel-related expenses associated with our tax, internal audit, accounting, finance, human resources, and legal functions, including salaries, benefits, as well as external legal, accounting, and other professional fees. Effective with the start of the 2015 fiscal year, the Company successfully established our own legal, finance, and human resources functions. Prior to April 1, 2014 general and administrative costs included allocated expenses from our former parent company, Compuware.
Income Taxes
Provision for income taxes is comprised of federal and state taxes in the United States as well as certain foreign tax jurisdictions. Income taxes are accounted for using the asset and liability approach. Deferred income taxes are provided for the differences between the tax bases of assets or liabilities and their reported amounts in our financial statements and net operating loss and tax credit carryforwards.
RESULTS OF OPERATIONS
The following table is a summary of our consolidated statements of loss data (in thousands, except per share data):
YEAR ENDED MARCH 31, | ||||||||||||
2016 | 2015 | 2014 | ||||||||||
Consolidated Statements of Comprehensive Loss Data: | ||||||||||||
Subscription and support | $63,367 | $66,283 | $66,688 | |||||||||
Services | 12,657 | 22,251 | 30,447 | |||||||||
Total revenue | 76,024 | 88,534 | 97,135 | |||||||||
Cost of revenue(1) | 34,953 | 66,404 | 56,374 | |||||||||
Gross profit | $41,071 | $22,130 | $40,761 | |||||||||
Operating expenses: | ||||||||||||
Research and development(1) | 13,019 | 10,416 | 12,408 | |||||||||
Sales and marketing(1) | 29,448 | 32,593 | 35,250 | |||||||||
General and administrative(1) | 13,286 | 17,640 | 28,676 | |||||||||
Total operating expenses | $55,753 | $60,649 | $76,334 | |||||||||
Other (loss) income | (23 | ) | 69 | — | ||||||||
Loss from operations before income tax provision | (14,705 | ) | (38,450 | ) | (35,573 | ) | ||||||
Income tax provision | 189 | 112 | 85 | |||||||||
Net loss | ($14,894 | ) | ($38,562 | ) | ($35,658 | ) | ||||||
Basic and diluted loss per share(2) | ($0.38 | ) | ($1.01 | ) | ($1.06 | ) | ||||||
Weighted-average shares outstanding, Basic and diluted(2) | 39,658 | 38,217 | 33,774 | |||||||||
(1) | The statements and line items above include stock compensation as detailed in the table below. Cost of revenue in fiscal year 15 includes an $8.3 million impairment of capitalized software costs. Sales and marketing in fiscal year 15 includes a $0.5 million impairment of healthcare customer relationships. |
(2) | Please see Note 3 of our consolidated financial statements and related disclosures for an explanation of the method used to calculate the historical net income (loss) per share attributable to common shareholders and the number of shares used in computation of the per share amounts. |
27
YEAR ENDED MARCH 31, | |||||||||||||
2016 | 2015 | 2014 | |||||||||||
Stock awards compensation classified as: | |||||||||||||
Cost of revenue | $71 | $613 | $829 | ||||||||||
Research and development | 78 | 175 | 722 | ||||||||||
Sales and marketing | 502 | 1,570 | 5,594 | ||||||||||
General and administrative | 2,166 | 3,874 | 10,330 | ||||||||||
Total stock awards compensation expense before income taxes | $2,817 | $6,232 | $17,475 | ||||||||||
The following table sets forth a summary of our consolidated statements of comprehensive loss as a percentage of our total revenue:
YEAR ENDED MARCH 31, | |||||||||
2016 | 2015 | 2014 | |||||||
Consolidated Statements of Comprehensive Loss Data: | |||||||||
Subscription and support | 83 | % | 75 | % | 69 | % | |||
Services | 17 | 25 | 31 | ||||||
Total revenue | 100 | % | 100 | % | 100 | % | |||
Cost of revenue(1) | 46 | 75 | 58 | ||||||
Gross profit | 54 | % | 25 | % | 42 | % | |||
Operating expenses: | |||||||||
Research and development(1) | 17 | 12 | 13 | ||||||
Sales and marketing(1) | 39 | 37 | 36 | ||||||
General and administrative(1) | 17 | 20 | 30 | ||||||
Total operating expenses | 73 | % | 69 | % | 79 | % | |||
Loss from operations before for income tax provision | (19 | ) | (43 | ) | (37 | ) | |||
Income tax provision | 0 | 0 | 0 | ||||||
Net loss | (19 | )% | (43 | )% | (37 | )% | |||
________________________________________________
(1) | All future stock compensation is expected to be granted in the form of Covisint stock awards and recorded as a non-cash expense. Refer to the table above for the breakdown of stock compensation included in these line item percentages. |
YEARS ENDED MARCH 31, 2016, 2015, and 2014
Revenue
Revenue derived from our subscription and support and services is presented in the table below:
YEAR ENDED MARCH 31, | 2015 to 2016 | 2014 to 2015 | ||||||||||||||||
2016 | 2015 | 2014 | % | % | ||||||||||||||
(In thousands) | ||||||||||||||||||
Subscription and support | $63,367 | $66,283 | $66,688 | (4 | %) | (1 | %) | |||||||||||
Services | 12,657 | 22,251 | 30,447 | (43 | )% | (27 | )% | |||||||||||
Total revenue | $76,024 | $88,534 | $97,135 | (14 | %) | (9 | %) | |||||||||||
Subscription revenue was $63.4 million for the year ended March 31, 2016 as compared to $66.3 million for the year ended March 31, 2015, representing an annual decrease of 4%. The net decrease in subscription revenue was due to the expected decline in our healthcare subscription revenue as a result of our shift out of lower margin healthcare application business that was not
28
offset by sufficient ASR. After adjusting for the planned reduction in our healthcare application business, our subscription revenue grew 6% during the 2016 fiscal year as compared to the 2015 fiscal year.
Subscription revenue was $66.3 million for the year ended March 31, 2015 as compared to $66.7 million for the year ended March 31, 2014, representing an annual decrease of 1%. Increased subscription revenue from strategic channel partners and other new business was slightly offset by declines in our healthcare subscription revenue.
Our services revenue declined to $12.7 million for the year ended March 31, 2016, as compared to $22.2 million and $30.4 million for the years ended March 31, 2015 and 2014, respectively, representing an annual decline of 43% in fiscal year 2016, and a decrease of 27% in fiscal year 2015, respectively. For the years ended March 31, 2016 and March 31, 2015, the declines in services revenues were attributed to: 1) an improvement in the ease of implementation of our Platform that results in quicker, less costly installations; 2) improvements in our Platform that allow customers to perform portions of the implementations themselves; 3) a reduction in service projects with major subscription customers; and 4) shifting away from the development of applications that require significant amount of services to implement to our service partners. During fiscal 2016, the decline in services revenues was partially offset by a $1.0 million sale of a DocSite perpetual license to a single customer. The Company received the full cash payment for the license during the quarter ended December 31, 2015, and does not expect revenue from perpetual license sales in subsequent quarters.
Our highest concentration of total revenue, including services, comes from the automotive industry which accounted for 54%, 45%, and 47% of our total revenue for the years ended March 31, 2016, 2015, and 2014, respectively. The healthcare industry accounted for 19%, 32%, and 34% of our total revenue in the years ended March 31, 2016, 2015, and 2014, respectively. Our remaining revenue resides in the energy, financial services, travel and other non-automotive and non-healthcare industries.
Our total revenue is also concentrated with two key customers, Cisco and GM. As a result of the strategic partnership with Cisco, we enabled Cisco to serve as the prime contractor and Covisint as the subcontractor for agreements with various divisions of GM, which we historically provided directly to GM. For the twelve months ended March 31, 2016, Cisco accounted for 36% of our total revenue, of which 26% of total revenue is related to the transfer of the GM Contracts and the augmentation of Cisco’s SXP. Our stand-alone business with GM accounted for 6% of our total revenue in the twelve months ended March 31, 2016.
Cost of Revenue
Cost of revenue is presented in the table below:
YEAR ENDED MARCH 31, | 2015 to 2016 | 2014 to 2015 | ||||||||||||||||
2016 | 2015 | 2014 | % | % | ||||||||||||||
(In thousands) | ||||||||||||||||||
Cost of revenue | $34,953 | $66,404 | $56,374 | (47 | %) | 18 | % | |||||||||||
Gross margin | 54 | % | 25 | % | 42 | % | ||||||||||||
Cost of revenue decreased $31.4 million for the year ended March 31, 2016 as compared to the same period in 2015. The decrease is primarily attributable to a sharp decline in personnel and subcontractor expense due to the planned exit from the low margin services business. In addition, the amortization of intangibles decreased due to 2015 fiscal year activity including an $8.3 million impairment of previously capitalized software costs related to software projects associated with our healthcare customer service offering, which we decided to exit in 2015.
Our gross margin increased to 54% for the year ended March 31, 2016, as compared to 25% for the same period in 2015. The improved margins were primarily due to the execution of cost savings initiatives related to the changes in our service business discussed above, as well as our planned shift out of lower margin subscription business. In addition, gross margin improved due to fiscal 2015 activity including the aforementioned $8.3 million impairment.
Cost of revenue increased $10.0 million and gross margins declined for the year ended March 31, 2015 as compared to the same period in 2014, largely as the result of the aforementioned impairments recorded in the 2015 fiscal year.
Research and Development
Research and development costs incurred, expensed and capitalized are presented in the table below:
29
YEAR ENDED MARCH 31, | 2015 to 2016 | 2014 to 2015 | ||||||||||||||||
2016 | 2015 | 2014 | % | % | ||||||||||||||
(In thousands) | ||||||||||||||||||
Research and development costs incurred | $17,257 | $13,925 | $18,104 | 24 | % | (23 | )% | |||||||||||
Capitalized internal software costs | (4,238 | ) | (3,509 | ) | (5,696 | ) | 21 | % | (38 | )% | ||||||||
Research and development costs expensed | $13,019 | $10,416 | $12,408 | 25 | % | (16 | )% | |||||||||||
Percentage of total revenue: | ||||||||||||||||||
Research and development costs incurred | 23 | % | 16 | % | 19 | % | ||||||||||||
Research and development costs expensed | 17 | % | 12 | % | 13 | % | ||||||||||||
Research and development costs incurred were $17.2 million for the year ended March 31, 2016, as compared $13.9 million for the year ended March 31, 2015, representing an annual increase of $3.3 million. The increase was primarily due to greater development costs associated with our Next-Gen and IoT platforms as well as our Covisint “Anywhere” offering. We capitalized $4.2 million and $3.5 million of research and development costs for the years ended March 31, 2016 and 2015, respectively. The increase in capitalized costs was related to the increased spending on IoT and Next-Gen platforms which reached the application development stage during the year ended March 31, 2016.
Research and development costs incurred were $13.9 million for the year ended March 31, 2015, as compared $18.1 million for the year ended March 31, 2014, representing an annual decrease of $4.2 million. The decrease was primarily due to a decrease in development costs as a result of our decision to cease significant investment in our healthcare application business, which required a high level of customized research and development investment. We capitalized $3.5 million and $5.7 million of research and development costs for the years ended March 31, 2015 and 2014, respectively. The decrease in capitalized costs was due to the continued reduction in overall development cycle times which reduced our capitalized costs.
Sales and Marketing
Sales and marketing costs are presented in the table below:
YEAR ENDED MARCH 31, | 2015 to 2016 | 2014 to 2015 | ||||||||||||||||
2016 | 2015 | 2014 | % | % | ||||||||||||||
(In thousands) | ||||||||||||||||||
Sales and marketing | $29,448 | $32,593 | $35,250 | (10 | %) | (8 | )% | |||||||||||
Percentage of total revenue | 39 | % | 37 | % | 36 | % | ||||||||||||
Sales and marketing costs decreased $3.1 million for the year ended March 31, 2016, as compared to the same period in 2015. The decrease was attributable to a decline in commission expense of $1.5 million as a result of the decrease in ASR generated during the period. In addition, the prior period included costs due to restructuring initiatives of the direct sales and marketing organizations associated with our shift away from lower margin healthcare applications. These factors were partially offset by increased cost due to our continued investment in a platform-focused sales and marketing organization supporting our go-to-market strategy.
Sales and marketing costs decreased $2.7 million for the year ended March 31, 2015, as compared to the same period in 2014. The decrease was primarily due to a $4.0 million decrease in stock compensation expense, partially offset by the impairment of customer relationship intangibles related to the DocSite business resulting in an increase to expense of $0.5 million.
General and Administrative
General and administrative costs are presented in the table below:
YEAR ENDED MARCH 31, | 2015 to 2016 | 2014 to 2015 | ||||||||||||||||
2016 | 2015 | 2014 | % | % | ||||||||||||||
(In thousands) | ||||||||||||||||||
General and administrative | $13,286 | $17,640 | $28,676 | (25 | %) | (38 | )% | |||||||||||
Percentage of total revenue | 17 | % | 20 | % | 30 | % | ||||||||||||
30
General and administrative costs decreased by $4.4 million for the year ended March 31, 2016, as compared to the same period in 2015, which was primarily attributable to a decrease in stock compensation expense of $1.7 million, a favorable adjustment related to a non-income tax contingency of $1.1 million, as well as a $1.0 million decrease in incentive compensation. Additionally, our facilities and rental costs declined $0.6 million due to our headquarters relocation, as we continued rationalization of our general and administrative structure. These reductions were partially offset by a $0.6 million increase for expenses related to the class action lawsuit.
General and administrative costs decreased by $11 million for the year ended March 31, 2015, as compared to the same period in 2014. The decrease in expense was primarily attributable to a $6.5 million decrease in stock compensation expense, as well as reduced general administrative costs incurred as a stand-alone company. Effective with the start of the 2015 fiscal year, the Company successfully established our own legal, finance and human resources functions. Prior to April 1, 2014 general and administrative costs included allocated expenses from our former parent company, Compuware.
CRITICAL ACCOUNTING POLICIES
Basis of Presentation
The financial statements included in Item 8 of this Annual Report do not reflect any changes that may occur in our future financing and operations. Our financial statements have been prepared in conformity with U.S. GAAP, which requires us to make estimates and assumptions that affect the reported amounts of assets, liabilities, shareholders' equity and the disclosure of contingencies at the applicable balance sheet date and the results of operations for all periods presented. While we have based our assumptions and estimates on the facts and circumstances existing at March 31, 2016, 2015, and 2014, respectively, final amounts may differ from estimates. Note 1 of the consolidated financial statements included in this Annual Report contains a summary of our significant accounting policies.
Effective January 1, 2013, Compuware contributed substantially all of the assets and liabilities related to the Covisint business to us.
From January 1, 2013 until the IPO, Compuware provided Covisint with short-term, non-interest bearing operating cash advances. The net effect of these intercompany transactions is reflected in the statements of cash flows as financing activity. On October 31, 2014, Covisint ceased being a subsidiary of Compuware as a result of Compuware's distribution of its holdings of Covisint common stock to Compuware shareholders.
During the 2014 fiscal year, our financial statements include an allocation of certain corporate expenses including costs for facilities, information technology, tax, internal audit, accounting, finance, human resources, legal and executive management functions provided by Compuware. These allocations were primarily based on headcount, revenue and space occupied as a proportion of those in all Compuware operating units. We believe the allocations were reasonable. However, the expenses allocated to us for these services are not necessarily indicative of the expense that would have been incurred if we had been a separate, independent entity and had otherwise managed these functions. Corporate expenses charged to the Company are included in the “administrative and general” line item in the statements of comprehensive loss.
In connection with the January 2013 Contribution, we entered into a tax sharing agreement with Compuware which was effective until the October 2014 Distribution. Pursuant to this agreement, the amount of taxes to be paid by us was determined, subject to certain adjustments, as if we and each of our subsidiaries included in Compuware's Consolidated Group or Combined Group filed our own consolidated, combined, unitary or separate tax return.
We reimbursed Compuware, or were reimbursed by Compuware, for intercompany transactions subsequent to January 1, 2013 through the October 2014 Distribution.
JOBS Act
On April 5, 2012, the Jumpstart Our Business Startups ("JOBS") Act was signed into law. The JOBS Act contains provisions that, among other things, reduce certain reporting requirements for an “emerging growth company.” As an “emerging growth company,” we are electing to not take advantage of the extended transition period afforded by the JOBS Act for the implementation of new or revised accounting standards, and, as a result, we will comply with new or revised accounting standards on the relevant dates on which adoption of such standards is required for non-emerging growth companies. Section 107 of the JOBS Act provides that our decision to not take advantage of the extended transition period for complying with new or revised accounting standards is irrevocable. In addition, we are in the process of evaluating the benefits of relying on the other exemptions and reduced reporting requirements provided by the JOBS Act.
31
Subject to certain conditions set forth in the JOBS Act, if as an “emerging growth company” we will rely on such exemptions, we may not be required to, among other things: (1) provide an auditor’s attestation report on our system of internal controls over financial reporting pursuant to Section 404 of the Sarbanes-Oxley Act, (2) provide all of the compensation disclosure that may be required of non-emerging growth public companies under the Dodd-Frank Act, (3) comply with any requirement that may be adopted by the Public Company Accounting Oversight Board ("PCAOB") regarding mandatory audit firm rotation or a supplement to the auditor’s report providing additional information about the audit and our audited financial statements (auditor discussion and analysis) and (4) disclose certain executive compensation-related items such as the correlation between executive compensation and performance and comparisons of the Chief Executive Officer’s compensation to median employee compensation. These exemptions will apply for a period of five years following the completion of our IPO or until we no longer meet the requirements of being an “emerging growth company,” upon the earlier of (i) the first fiscal year after our annual gross revenues are $1 billion or more, (ii) the date on which we have, during the previous three-year period, issued more than $1 billion in non-convertible debt securities, and (iii) the date on which we are deemed to be a “large accelerated filer” as defined in the Exchange Act.
Revenue Recognition
We derive our revenues from the following sources: (i) subscriptions, (ii) professional services (“services”) and (iii) other. Subscription revenues are primarily comprised of subscription fees that give customers access to and support of the Covisint Platform during the subscription term. Our contracts typically do not give the customer the right to take possession of our software. Professional services revenues consist of fees related to implementation of our platform and consulting services for our customers.
Other revenues include the sale of perpetual licenses. In limited circumstances, we grant certain customers the right to deploy our subscription service on the customers’ own servers. These arrangements are subject to software revenue recognition guidance since the customer deploys our software. During the quarter ended December 31, 2015, we completed a $1.0 million sale of a DocSite perpetual license to a single customer. We do not expect revenue from perpetual license sales in subsequent fiscal years. Our software license agreement in this transaction provided the customer with a right to use the DocSite software perpetually, and did not contain any provisions for maintenance, upgrades, or software related services. Accordingly, the full value of the contract was recognized as revenue upon delivery of the license.
We commence revenue recognition for our subscriptions and professional services when all of the following conditions are met:
•There is persuasive evidence of an arrangement;
•The service has been provided to the customer;
•The collection of related fees is reasonably assured; and
•The amount of fees to be paid by the customer is fixed or determinable.
We use signed agreements and binding purchase orders as evidence of an arrangement. For customers where a purchase order is used as evidence of an arrangement, master terms and conditions exist that govern such arrangements. We consider delivery to have occurred on the launch date, which is the point in time that a customer is provided access to use our Platform. Collectibility is assessed based on a number of factors including past collection history with the customer. If we determine that collectibility is not reasonably assured, we defer the revenue until collectibility becomes reasonably assured, generally upon receipt of cash. We assess whether the fee is fixed or determinable based on the payment terms associated with the transaction and whether the sales price is subject to refund or adjustment. Customers typically have the right to terminate their agreement if we fail to perform.
Subscription Revenue
We recognize subscription revenues ratably on a straight-line basis over the contract term. Revenue recognition commences on the later of the start date specified in the subscription arrangement, the launch date of the customers’ access to our Platform and production environment, or when all of the revenue recognition criteria have been met.
Professional Services Revenue
Professional services revenue is recognized as the services are delivered generally using a proportional performance methodology, which is based on estimates of hours incurred and expected hours to complete since these services are primarily performed on a fixed fee basis. Hours or costs incurred represent a reasonable surrogate for output measures of contract performance, including the presentation of deliverables to the client. Therefore, hours or costs incurred are used as the basis for revenue recognition. In instances where final acceptance of the services are required before revenues are recognized, we defer a portion of the professional services revenues and the associated costs until all acceptance criteria have been met. If it is determined that costs will exceed revenue, the expected loss is recorded at the time the loss becomes apparent.
32
Multiple Deliverable Arrangements
For arrangements with multiple deliverables, we evaluate whether the individual deliverables qualify as separate units of accounting. In order to treat deliverables in a multiple deliverable arrangement as separate units of accounting, the deliverables must have standalone value upon delivery. For deliverables that have standalone value upon delivery, we account for each deliverable separately and recognize revenue for the respective deliverables as they are delivered. We currently have multiple element arrangements comprised of subscription fees and professional services, and given we have standalone values, we account for subscriptions and professional services revenue as separate units of accounting.
Subscription contracts have standalone value as we sell the subscriptions separately. We provide access to our subscription service at the beginning of the contract term, and our platform subscription services are fully functional without any additional development or customization.
In determining whether professional services have standalone value and can be accounted for separately from subscription services, we consider the availability of the professional services from other vendors, the nature of our professional services and whether we sell our solutions to new customers without professional services. Our implementation tasks can, and have been performed by third-party vendors. As a result, we have established standalone value for our professional services, including implementation and configuration services. During the 2014 fiscal year, it was determined that certain professional services projects did not have stand-alone value. In those instances, the revenue is deferred and recognized over the longer of the committed term of the subscription agreement (generally one to five years) or the expected period over which the customer will receive benefit (generally five years). For the 2015 and 2016 fiscal years, we determined that we have standalone value for our professional services.
When multiple deliverables included in an arrangement are separable into different units of accounting, the arrangement consideration is allocated to the identified separate units of accounting based on their relative selling price. Our contracts may include a subscription fee for ongoing PaaS operations and project (services) fees. In accordance with Accounting Standards Codification (“ASC”) 605, “Revenue Recognition,” multiple element arrangement consideration is allocated based on relative selling price using the following hierarchy: vendor specific objective evidence (“VSOE”) which represents the price when sold separately if available; third-party evidence (“TPE”) if VSOE is not available; or estimated selling price if neither VSOE nor third-party evidence is available. If neither VSOE nor TPE are available, we determine the best estimate of selling price by evaluating amounts included in a contract, if any, and estimated costs to deliver each element.
Deferred Costs
Deferred costs consist of the incremental direct personnel and outside contractor costs incurred in delivering implementation and solutions deployment services that do not have stand-alone value. Revenue from these services, as described above, is deferred and recognized over the longer of the committed term of the subscription agreement or the expected period over which the customer will receive benefit. Therefore, the costs are recognized over the same period as the associated revenue. In the event a customer contract with deferred cost is terminated in whole, or part, the Company recognizes the remainder of the amount recorded in deferred cost attributable to the terminated component of the contract.
Sales commission costs that directly relate to revenue transactions that are deferred are recorded as “prepaid expenses and other current assets” or non-current “other assets”, as applicable, in the balance sheets and recognized as “sales and marketing” expenses in the statements of comprehensive loss over the revenue recognition period of the related transaction.
Deferred Revenue
Deferred revenue consists of the billed but unearned portion of existing contracts for subscription and services provided and is recognized as services are delivered or over the expected period during which the customer will receive benefit. The Company generally invoices its customers’ subscription fees in annual, quarterly or monthly installments. Contractual time periods often exceed the invoicing period and accordingly, the deferred revenue balance does not represent the total contract value of committed subscription agreements. The portion of deferred revenue that the Company anticipates will be recognized during the succeeding 12-month period is recorded as current deferred revenue and the remaining portion is recorded as non-current deferred revenue. The Company has generally received payment for the services for which the revenue has been deferred. Deferred revenue also includes contracts for which we have a contractually executed agreement and have invoiced the customer under the terms of the executed agreement but have not met all the revenue recognition criteria and/or have concluded that revenue should be recognized on cash basis, as collectibility of the invoiced amounts is not reasonably assured. In the event a customer contract with deferred revenue is terminated in whole, or part, the Company recognizes the remainder of the amount recorded in deferred revenue attributable to the terminated component of the contract.
33
Capitalized Software
Capitalized software includes the costs of internally developed software products capitalized in accordance with ASC 350-40, “Internal Use Software,” and software technology purchased through acquisitions. Capitalized software costs are primarily comprised of salaries and personnel-related expenses, and services provided by third-party contractors related to software development.
Capitalized and purchased software costs are amortized on a straight-line basis over the expected useful life of the software, which is generally five years. Amortization begins when the software technology is ready for its intended use. Refer to Note 3. Goodwill, Capitalized Software and Intangible Assets to the consolidated financial statements included in this Annual Report for further information.
Capitalized software is reviewed for impairment when events and circumstances indicate such asset may be impaired. If estimated future undiscounted cash flows are not sufficient to recover the carrying value of the capitalized software, an impairment charge is recorded in the amount by which the present value of future cash flows is less than the carrying value of these assets.
Research and Development
The Company focuses its research and development on new and expanded features of the Platform and vertical-specific solutions, utilizing an agile delivery methodology for Platform enhancements. A portion of these costs related to our hosted software and application services that have reached the application development stage are capitalized per the guidance set forth in ASC 350-40 which requires companies to capitalize qualifying computer software costs. Capitalization of such cost begins when the preliminary project stage is complete and ceases at the point in which the project is substantially complete and is ready for its intended purpose. Costs related to preliminary project activities and post-implementation activities are expensed as incurred.
Goodwill and Other Intangible Assets
We are required to assess goodwill and other intangible assets with indefinite lives for impairment annually, or more frequently if events or changes in circumstances indicate that the carrying value may exceed the fair value.
The performance test involves a two-step process. Step 1 of the impairment test involves comparing the fair value of the reporting unit with its aggregate carrying value, including goodwill. Application of the goodwill and other intangibles impairment test requires judgment, including the determination of the fair value of the reporting unit. The fair value of the reporting unit is computed using our market capitalization. If the carrying amount of the reporting unit exceeds its fair value, the Company performs Step 2 of the goodwill and other intangibles impairment test to determine the amount of impairment loss by comparing the implied fair value of the reporting unit’s goodwill with the carrying amount of that goodwill. Under such evaluation, if the carrying amount of the reporting unit’s goodwill exceeds the implied fair value of the goodwill, the impairment loss is recognized as an operating expense in an amount equal to that excess.
The estimates used to calculate the fair value of the reporting unit change from year to year based on operating results, market conditions and estimated future cash flows. While we believe that the assumptions and estimates used to determine the estimated fair values of our reporting unit are reasonable, a change in assumptions underlying these estimates could materially affect the determination of fair value and goodwill impairment. The following potential events and / or changes in circumstances could negatively affect the key assumptions in our impairment assessment:
• | A sustained decrease in our stock price which could result in decreased market capitalization |
• | A sustained decrease in publicly traded acquisition premiums which could result in a decreased control premium |
Items that could lead to the above include, but are not limited to:
• | Significant Company under-performance relative to historical or projected future operating results |
• | The Company’s inability to achieve sales productivity and growth in annualized subscription revenues |
• | Industry specific factors such as increased competition and pricing pressure |
• | Future negative changes in the global economy or macro-economic factors |
We have one reporting unit and thus all goodwill is evaluated for impairment at the consolidated Company level. At March 31, 2016, the Company evaluated goodwill and concluded there was no impairment during the year ended March 31, 2016 as fair value computed using our market capitalization exceeded carrying value by approximately 14%.
The Company evaluated goodwill for impairment as of March 31, 2015. The analysis computed fair value using our market capitalization, and also considered comparable premiums paid in controlling interests acquisitions of the equities of public
34
companies operating in the software and service industries. Premiums were reviewed for the three-year period ending as of the testing date, and we concluded that use of the control premium on low end of the median guideline range of 15-35% was reasonable. After considering the minimum effect of the control premium, the fair value exceeded the carrying value by 12%, therefore, the Company concluded there was no impairment of goodwill during the year ended March 31, 2015.
Income Taxes
Income taxes are presented on a separate return basis even though the Company’s results of operations have historically been included in the consolidated, combined, unitary or separate income tax returns of Compuware until the October 2014 Distribution. Following the October 2014 Distribution, Covisint ceased to be a member of the Compuware tax group. Compuware and Covisint made a joint election to treat the October 2014 Distribution as taxable to Compuware and at the same time increase Covisint’s tax basis in its assets to fair market value. Income taxes are presented herein on a separate return basis even though the Company’s results of operations have historically been included in the consolidated, combined, unitary or separate income tax returns of Compuware until the October 2014 Distribution. We are subject to income taxes in both the U.S. and numerous foreign jurisdictions. Significant judgments and estimates are required in determining the consolidated income tax expense.
Deferred income taxes arise from temporary differences between the tax and financial statement recognition of revenue and expense. In evaluating our ability to recover our deferred tax assets, we consider all available positive and negative evidence, including scheduled reversals of deferred tax liabilities, projected future taxable income, tax planning strategies and recent financial operations. In projecting future taxable income, we develop assumptions including the amount of future state, federal and foreign pretax operating income, the reversal of temporary differences, and the implementation of feasible and prudent tax planning strategies. These assumptions require significant judgment about the forecasts of future taxable income and are consistent with the plans and estimates we are using to manage the underlying business. Changes in estimates of projected future operating results or in assumptions regarding our ability to generate future taxable income during the periods in which temporary differences are deductible could result in significant changes to these tax liabilities and, therefore, to our net income.
We recognize tax benefits from an uncertain tax position when it is more likely than not that the position will be sustained upon examination, including resolutions of any related appeals or litigation processes, based on the technical merits.
We recognize tax liabilities in accordance with ASC 740 “Income Taxes” and we adjust these liabilities when our judgment changes as a result of the evaluation of new information not previously available. Due to the complexity of some of these uncertainties, the ultimate resolution may result in a payment that is materially different from our current estimate of such tax liabilities. These differences will be reflected as increases or decreases to income tax expense in the period in which they are determined. The calculation of our tax liabilities involves evaluating uncertainties in the application of complex tax laws and regulations in a variety of jurisdictions across our global operations.
We have assessed the need for a valuation allowance, and as a result of our analysis, it has been determined that it is more likely than not we will not realize the benefits of our deferred tax assets in the U.S., thus reducing the carrying value of the deferred tax assets.
In the event we are able to generate future taxable income in the U.S., as of March 31, 2016 we have $16.3 million of net deferred tax assets available to offset future income tax liabilities. The deferred tax assets in the U.S. consist of net operating losses and other timing differences that would be available to offset approximately $40 million of future pre-tax gross income for income tax purposes. Furthermore, there is an additional $25 million of tax deductible goodwill. Collectively, the net deferred tax assets and the additional goodwill deductions would be available to offset approximately $65 million of future pre-tax gross income for income tax purposes. There can be no assurance, however, regarding our ability to generate future taxable income and shield potential future income tax liabilities.
For additional information regarding these matters, refer to Note 5. Income Taxes to the consolidated financial statements included in this Annual Report.
STOCK-BASED COMPENSATION
Stock award compensation expense is recognized, net of an estimated forfeiture rate, on a straight-line basis over the requisite service period of the award.
Covisint Corporation Stock Compensation
We calculate the fair value of our stock option awards subsequent to the IPO using the Black-Scholes option pricing model, which incorporates various assumptions including volatility, expected term, risk-free interest rates and dividend yields. Because
35
we have limited historical stock price data, the expected volatility assumption is based on an average of the historical volatility of comparable companies, or peer group companies. For peer group companies that have not been publicly traded long enough to have sufficient historical data, the volatility figures included in these companies’ most recent Form 10-Qs or Form 10-Ks were used. The risk-free interest rate assumption is based upon observed interest rates appropriate for the expected life of the stock option awarded. The expected life of the stock option is based on management’s best estimates considering the terms of the options granted. Dividend yields have not been a factor in determining fair value of stock options granted, as we have never issued cash dividends and do not anticipate issuing cash dividends in the future.
Assumptions used subsequent to the IPO in measuring Covisint options granted, and the weighted average fair value of options granted, in fiscal 2016, 2015, and 2014 were:
YEAR ENDED MARCH 31, | |||||
2016 | 2015 | 2014 | |||
Expected volatility | 41.22% | 46.12% | 49.99% | ||
Risk-free interest rate | 1.89% | 2.05% | 1.85% | ||
Expected lives at date of grant (in years) | 6.25 | 6.14 | 6.01 | ||
Weighted average fair value of the options granted | $0.97 | $1.89 | $5.86 | ||
Prior to the IPO, our stock was not traded on a stock exchange, and thus the exercise price for Covisint stock options at the date of grant was determined by calculating the estimated fair market value of our Company divided by the total shares outstanding, including outstanding stock options that had not yet vested. The estimated fair market value of our Company was measured using an equal combination of discounted cash flow and market comparable valuations and was discounted due to a lack of marketability at the grant date. Previous valuation estimates placed a greater emphasis on the discounted cash flow model. The discounted cash flow model uses significant assumptions, including projected future cash flows, a discount rate reflecting the risk inherent in future cash flows and a terminal growth rate. The key assumptions in the market comparable value analysis are the selection of peer group companies and application of these peer group companies’ data to Covisint.
Compuware Corporation Stock Compensation
Under the Amended and Restated Employee Benefits Agreement between the Company and Compuware, Covisint recorded compensation expense for the Compuware stock compensation granted to Covisint employees, including the stock options in Compuware’s common stock. Compuware calculated the fair value of its stock option awards using the Black-Scholes option pricing model, which incorporates various assumptions including volatility, expected term, risk-free interest rates and dividend yields. The expected volatility assumption was based on historical volatility of Compuware’s common stock over the most recent period commensurate with the expected life of the stock option granted. Compuware used historical volatility because its management believed such volatility was representative of prospective trends. The risk-free interest rate assumption was based upon observed interest rates appropriate for the expected life of the stock option awarded.
As of the October 2014 Distribution, all Covisint employees ceased to be members of the Compuware group, thereby triggering the termination provisions of their stock option and restricted stock unit awards.
The following was the average fair value per share of Compuware stock compensation awards estimated on the date of grant and the assumptions used for each option granted to Compuware employees, including those providing services to Covisint, during the year ended March 31, 2014. No options were granted for the years ended March 31, 2016 or March 31, 2015.
YEAR ENDED MARCH 31, | |||
2014 | |||
Expected volatility | 39.11% | ||
Risk-free interest rate | 1.67% | ||
Expected lives at date of grant (in years) | 6.20 | ||
Weighted average fair value of the options granted | $2.63 | ||
Dividend Yield Assumption (1) | 4.46% | ||
36
(1) In January 2013, the Compuware Board of Directors announced its intention to begin paying cash dividends totaling $0.50 per share annually, to be paid quarterly beginning in the first quarter of fiscal 2014. Prior to that, Compuware had never paid a dividend or announced any intentions to pay a dividend.
LIQUIDITY AND CAPITAL RESOURCES
YEAR ENDED MARCH 31, | ||||||||||||
2016 | 2015 | 2014 | ||||||||||
(In thousands) | ||||||||||||
Consolidated Statement of Cash Flows Data: | ||||||||||||
Net cash used in operating activities | ($3,866 | ) | ($4,695 | ) | ($8,336 | ) | ||||||
Net cash used in investing activities | (8,022 | ) | (7,462 | ) | (9,237 | ) | ||||||
Net cash provided by financing activities | 1,463 | 12,985 | 66,111 | |||||||||
Effect of exchange rate | 29 | (287 | ) | 32 | ||||||||
Net change in cash | ($10,396 | ) | $541 | $48,570 | ||||||||
Our principal sources of liquidity are cash generated from operations as well as the proceeds from our initial public offering during the 2014 fiscal year. To date, we have incurred operating losses as reflected in our accumulated deficit, as well as negative operating and investing cash flows as shown in the consolidated statements of cash flows. We do not expect to be profitable and expect negative cash flow during fiscal 2017 as we continue to fund our current operations, implement our growth strategies, and fund capital expenditures. We anticipate our current cash balance as well as cash to be received from current and existing customers will be sufficient to meet our liquidity needs and accommodate our growth for at least the next 12 months.
The consolidated statements of cash flows included in this report compute net cash from operating activities using the indirect cash flow method. Therefore, non-cash adjustments and net changes in assets and liabilities (net of effects from acquisitions and currency fluctuations) are adjusted from net income to derive net cash from operating activities.
Cash Flows from Operating Activities
Net cash used in operating activities was $3.9 million for the year ended March 31, 2016 compared to $4.7 million for the prior year primarily due to our improved cost structure and reduction in cash operating losses.
Net cash used in operating activities was $4.7 million for the year ended March 31, 2015 compared to $8.3 million for the prior year. The decrease in cash used in operating activities was primarily due to positive working capital fluctuations. Working capital fluctuations included the favorable impacts of accounts receivable decreasing $2.7 million and accounts payable increasing $1.3 million period over period, respectively.
In the fourth quarter of fiscal 2015, we received payment for the annual subscription fees for one of our Cisco Agreements for GM, which is also reflected in cash from operating activities for the year ended March 31, 2015. Under this Cisco Agreement as well as for the other Cisco agreement (entered into in early fiscal year 2016), we receive the annual subscription fees in advance, at the commencement of each contract year. Under the Prior GM contracts, Covisint received monthly payments in arrears from GM after revenue had been recognized.
Cash Flows from Investing Activities
Cash used in investing activities typically consists of the purchase of property and equipment associated with our infrastructure and the expenditures on capitalized internal software (research and development) costs related to expanding our cloud-based Platform. For the twelve months ended March 31, 2016, purchases of property and equipment primarily consisted of leasehold improvements associated with relocation of our corporate headquarters to Southfield, Michigan in May 2015.
Net cash used in investing activities was $8.0 million for the year ended March 31, 2016 compared to $7.4 million for the prior year. The increase in cash used in investing activities is principally attributable to $0.7 million increase in cash paid for capitalized internal software costs.
37
For the twelve months ended March 31, 2016, cash used in investing activities less depreciation exceeded the increase in Property and Equipment and Capitalized Software reported on the Consolidated Balance Sheets by approximately $1.4 million. The difference is principally attributable to cash payments made during the twelve months ended March 31, 2016 on purchases appropriately recorded per U.S. GAAP as increases to Property and Equipment and Accounts Payable on the Consolidated Balance Sheets as of March 31, 2015.
Net cash used in investing activities was $7.4 million for the year ended March 31, 2015 compared to $9.2 million for the prior year. The decrease in cash used in investing activities was primarily due to a $2.2 million decrease in cash paid for capitalized internal software costs, as we no longer incur expenditures on healthcare research and development projects. This was partially offset by an increase in capital expenditures of $0.4 million.
Cash Flows from Financing Activities
On October 1, 2013, we completed our IPO resulting in net proceeds of approximately $68.4 million. Of that amount, approximately $10.9 million was used to repay short-term intercompany payables owed to our parent at the time, Compuware, which resulted from Compuware’s contribution of assets and liabilities to us as of January 31, 2013.
Since the January 2013 Contribution up until the October 2014 Distribution, all significant transactions between Compuware and us were included in the consolidated financial statements and were settled in cash. The gross activity of these cash transactions with Compuware is reflected in the consolidated statements of cash flows as a financing activity presented as "Cash payments from/to parent company" through the completion of the spinoff and separation from Compuware in the 2015 fiscal year.
Net cash provided by financing activities was $1.5 million for the year ended March 31, 2016 compared to $13.0 million for the prior year. The decrease in cash provided by financing activities is primarily due to 2015 fiscal year activity including a $10.1 million of net payments from our former parent company, Compuware, related to its use of Covisint's tax net operating losses. Following our separation from Compuware on October 31, 2014, Compuware no longer reimbursed us for our tax losses.
Net cash provided by financing activities was $13.0 million for the year ended March 31, 2015 compared to $66.1 million for the prior year. The decrease in cash provided by financing activities was primarily due to the net proceeds received from the IPO of $68.4 million in fiscal year 2014. This reduction in cash from financing activities in fiscal year 2015 was partially offset by the aforementioned net cash payments received from Compuware related to its use of Covisint's tax net operating losses.
RECENTLY ISSUED ACCOUNTING PRONOUCEMENTS
New accounting guidance that we have recently adopted, as well as accounting guidance that has been recently issued, but not yet adopted by us, is included in Note 1 of the notes to the consolidated financial statements appearing in Item 8 of this Annual Report.
CONTRACTUAL OBLIGATIONS
The Company conducts its business in leased facilities which, based on the lease terms, are considered to be operating leases. The following table outlines the Company’s minimum contractual obligations under the lease and service agreements as of March 31, 2016 (presented in thousands):
Year Ending March 31, | |||||||||||||||||||||||||||
Total | 2017 | 2018 | 2019 | 2020 | 2021 | Thereafter | |||||||||||||||||||||
Leases | $ | 8,914 | $ | 1,167 | $ | 1,173 | $ | 1,203 | $ | 1,235 | $ | 662 | $ | 3,474 | |||||||||||||
38
OFF-BALANCE SHEET ARRANGEMENTS
We currently do not have any off balance sheet or non-consolidated special purpose entity arrangements as defined by the applicable SEC rules.
ITEM 7A. QUANTITATIVE AND QUALITATIVE DISCLOSURES ABOUT MARKET RISK
We are exposed primarily to market risks associated with foreign currency exchange rates. We do not use derivative financial instruments or forward foreign exchange contracts for investment, speculative or trading purposes. We believe our foreign currency risk is minimal as 86% of our revenue was based in U.S. dollars for each of the years ended March 31, 2016, 2015, and 2014, respectively. In addition, we have no long-term assets or liabilities in foreign currencies. We do not have a material exposure to market risk with respect to investments.
39
ITEM 8. FINANCIAL STATEMENTS AND SUPPLEMENTARY DATA
REPORT OF INDEPENDENT REGISTERED PUBLIC ACCOUNTING FIRM
To the Board of Directors and Shareholders of
Covisint Corporation
Southfield, Michigan
We have audited the accompanying consolidated balance sheet of Covisint Corporation (a Michigan corporation) and subsidiaries (the “Company”) as of March 31, 2016, and the related consolidated statements of comprehensive loss, shareholders’ equity, and cash flows for the year then ended. These financial statements are the responsibility of the Company’s management. Our responsibility is to express an opinion on these financial statements based on our audit.
We conducted our audit in accordance with the standards of the Public Company Accounting Oversight Board (United States). Those standards require that we plan and perform the audit to obtain reasonable assurance about whether the financial statements are free of material misstatement. We were not engaged to perform an audit of the Company’s internal control over financial reporting. Our audit included consideration of internal control over financial reporting as a basis for designing audit procedures that are appropriate in the circumstances, but not for the purpose of expressing an opinion on the effectiveness of the Company’s internal control over financial reporting. Accordingly, we express no such opinion. An audit also includes examining, on a test basis, evidence supporting the amounts and disclosures in the financial statements, assessing the accounting principles used and significant estimates made by management, as well as evaluating the overall financial statement presentation. We believe that our audit provides a reasonable basis for our opinion.
In our opinion, the consolidated financial statements referred to above present fairly, in all material respects, the financial position of Covisint Corporation and subsidiaries as of March 31, 2016 and the results of their operations and their cash flows for the year then ended in conformity with accounting principles generally accepted in the United States of America.
/s/ GRANT THORNTON LLP
Southfield, Michigan
June 6, 2016
40
REPORT OF INDEPENDENT REGISTERED PUBLIC ACCOUNTING FIRM
To the Board of Directors and Shareholders of
Covisint Corporation
Southfield, Michigan
We have audited the accompanying consolidated balance sheet of Covisint Corporation and subsidiaries (the "Company") as of March 31, 2015, and the related consolidated statements of comprehensive loss, shareholders’ equity, and cash flows for each of the two years in the period ended March 31, 2015. These financial statements are the responsibility of the Company's management. Our responsibility is to express an opinion on these financial statements based on our audits.
We conducted our audits in accordance with the standards of the Public Company Accounting Oversight Board (United States). Those standards require that we plan and perform the audit to obtain reasonable assurance about whether the financial statements are free of material misstatement. The Company is not required to have, nor were we engaged to perform, an audit of its internal control over financial reporting. Our audits included consideration of internal control over financial reporting as a basis for designing audit procedures that are appropriate in the circumstances, but not for the purpose of expressing an opinion on the effectiveness of the Company's internal control over financial reporting. Accordingly, we express no such opinion. An audit also includes examining, on a test basis, evidence supporting the amounts and disclosures in the financial statements, assessing the accounting principles used and significant estimates made by management, as well as evaluating the overall financial statement presentation. We believe that our audits provide a reasonable basis for our opinion.
In our opinion, such consolidated financial statements present fairly, in all material respects, the financial position of the Company as of March 31, 2015, and the results of their operations and their cash flows for each of the two years in the period ended March 31, 2015, in conformity with accounting principles generally accepted in the United States of America.
/s/ DELOITTE & TOUCHE LLP
Detroit, Michigan
May 26, 2015
41
COVISINT CORPORATION
CONSOLIDATED BALANCE SHEETS
(In Thousands, Except Share Data)
March 31, 2016 | March 31, 2015 | ||||||
ASSETS | |||||||
CURRENT ASSETS: | |||||||
Cash and cash equivalents | $39,681 | $50,077 | |||||
Accounts receivable, net | 12,836 | 15,348 | |||||
Deferred tax asset, net | — | 16 | |||||
Prepaid expenses | 2,167 | 3,160 | |||||
Other current assets | 1,603 | 4,209 | |||||
Total current assets | 56,287 | 72,810 | |||||
PROPERTY AND EQUIPMENT, NET | 7,847 | 8,809 | |||||
CAPITALIZED SOFTWARE AND OTHER INTANGIBLE ASSETS, NET | 11,486 | 10,646 | |||||
OTHER: | |||||||
Goodwill | 25,385 | 25,385 | |||||
Deferred costs | 580 | 1,736 | |||||
Deferred tax asset, net | 171 | 1,528 | |||||
Other assets | 289 | 928 | |||||
Total other assets | 26,425 | 29,577 | |||||
TOTAL ASSETS | $102,045 | $121,842 | |||||
LIABILITIES AND SHAREHOLDERS' EQUITY | |||||||
CURRENT LIABILITIES: | |||||||
Accounts payable | $5,061 | $7,703 | |||||
Accrued commissions | 1,071 | 3,286 | |||||
Deferred revenue | 15,952 | 18,029 | |||||
Accrued expenses | 2,377 | 3,344 | |||||
Deferred tax liability, net | — | 1,597 | |||||
Total current liabilities | 24,461 | 33,959 | |||||
DEFERRED REVENUE | 3,595 | 3,914 | |||||
ACCRUED LIABILITIES | 2,327 | 2,622 | |||||
DEFERRED TAX LIABILITY, NET | 353 | — | |||||
Total liabilities | 30,736 | 40,495 | |||||
COMMITMENTS AND CONTINGENCIES | |||||||
SHAREHOLDERS' EQUITY: | |||||||
Preferred stock, no par value - authorized 5,000,000 shares; none issued and outstanding | — | — | |||||
Common stock, no par value - authorized 50,000,000 shares; issued and outstanding 40,490,928 (39,033,900 issued and outstanding as of March 31, 2015) | — | — | |||||
Additional paid-in capital | 161,997 | 157,004 | |||||
Retained deficit | (90,527 | ) | (75,633 | ) | |||
Accumulated other comprehensive loss | (161 | ) | (24 | ) | |||
Total shareholders' equity | 71,309 | 81,347 | |||||
TOTAL LIABILITIES AND SHAREHOLDERS' EQUITY | $102,045 | $121,842 | |||||
See notes to consolidated financial statements.
42
COVISINT CORPORATION
CONSOLIDATED STATEMENTS OF COMPREHENSIVE LOSS
(In Thousands, Except Per Share Data)
YEAR ENDED MARCH 31, | |||||||||||
2016 | 2015 | 2014 | |||||||||
REVENUE | $76,024 | $88,534 | $97,135 | ||||||||
COST OF REVENUE | 34,953 | 66,404 | 56,374 | ||||||||
GROSS PROFIT | 41,071 | 22,130 | 40,761 | ||||||||
OPERATING EXPENSES: | |||||||||||
Research and development | 13,019 | 10,416 | 12,408 | ||||||||
Sales and marketing | 29,448 | 32,593 | 35,250 | ||||||||
General and administrative | 13,286 | 17,640 | 28,676 | ||||||||
Total operating expenses | 55,753 | 60,649 | 76,334 | ||||||||
OPERATING LOSS | (14,682 | ) | (38,519 | ) | (35,573 | ) | |||||
Other (expense) income | (23 | ) | 69 | — | |||||||
LOSS BEFORE INCOME TAX PROVISION | (14,705 | ) | (38,450 | ) | (35,573 | ) | |||||
INCOME TAX PROVISION | 189 | 112 | 85 | ||||||||
NET LOSS | ($14,894 | ) | ($38,562 | ) | ($35,658 | ) | |||||
Basic and diluted loss per share | ($0.38 | ) | ($1.01 | ) | ($1.06 | ) | |||||
Weighted average shares used to compute net loss per share attributable to common stockholders - basic and diluted | 39,658 | 38,217 | 33,774 | ||||||||
OTHER COMPREHENSIVE LOSS, NET OF TAX | |||||||||||
Foreign currency translation adjustments | (137 | ) | (12 | ) | (9 | ) | |||||
OTHER COMPREHENSIVE LOSS, NET OF TAX | (137 | ) | (12 | ) | (9 | ) | |||||
COMPREHENSIVE LOSS | ($15,031 | ) | ($38,574 | ) | ($35,667 | ) | |||||
See notes to consolidated financial statements.
43
COVISINT CORPORATION
CONSOLIDATED STATEMENTS OF SHAREHOLDERS' EQUITY
YEAR ENDED MARCH 31, 2016, 2015, and 2014
(In Thousands, Except Share Data)
Common Stock | Group Equity | Additional Paid-In Capital | Retained Earnings | Accumulated Other Comprehensive (Loss) | Total Shareholders' Equity | |||||||||||||||||||||
Shares | Amount | |||||||||||||||||||||||||
BALANCE AT MARCH 31, 2013 | 30,003,000 | $46,186 | ($3,289 | ) | ($3 | ) | $42,894 | |||||||||||||||||||
Net loss | (35,658 | ) | (35,658 | ) | ||||||||||||||||||||||
Parent contribution of stock awards and related taxes, net (Note 5) | (1,589 | ) | (1,589 | ) | ||||||||||||||||||||||
Covisint stock option expense (Note 5) | 18,996 | 18,996 | ||||||||||||||||||||||||
Covisint stock option exercise | 127,500 | 332 | 332 | |||||||||||||||||||||||
Income taxes | 10,322 | 10,322 | ||||||||||||||||||||||||
Foreign currency translation | (9 | ) | (9 | ) | ||||||||||||||||||||||
IPO proceeds receivable, net of offering costs | 7,360,000 | 66,322 | 66,322 | |||||||||||||||||||||||
BALANCE AT MARCH 31, 2014 | 37,490,500 | — | — | 140,569 | (38,947 | ) | (12 | ) | 101,610 | |||||||||||||||||
Net loss | (38,562 | ) | (38,562 | ) | ||||||||||||||||||||||
Parent contribution of stock awards and related taxes (Note 7) | 127 | 127 | ||||||||||||||||||||||||
Covisint stock option expense (Note 7) | 6,105 | 6,105 | ||||||||||||||||||||||||
Covisint stock option exercise | 1,543,400 | 2,865 | 2,865 | |||||||||||||||||||||||
Income tax items (Note 5) | 7,338 | 1,876 | 9,214 | |||||||||||||||||||||||
Foreign currency translation | (12 | ) | (12 | ) | ||||||||||||||||||||||
BALANCE AT MARCH 31, 2015 | 39,033,900 | — | — | 157,004 | (75,633 | ) | (24 | ) | 81,347 | |||||||||||||||||
Net loss | (14,894 | ) | (14,894 | ) | ||||||||||||||||||||||
Covisint stock based compensation expense (Note 7) | 2,817 | 2,817 | ||||||||||||||||||||||||
Covisint stock option exercise/RSU vesting (Net) | 1,457,028 | 2,191 | 2,191 | |||||||||||||||||||||||
Income tax items (Note 5) | (15 | ) | (15 | ) | ||||||||||||||||||||||
Foreign currency translation | (137 | ) | (137 | ) | ||||||||||||||||||||||
BALANCE AT MARCH 31, 2016 | 40,490,928 | $— | $— | $161,997 | ($90,527 | ) | ($161 | ) | $71,309 | |||||||||||||||||
See notes to consolidated financial statements.
44
COVISINT CORPORATION
CONSOLIDATED STATEMENTS OF CASH FLOWS
(In Thousands)
YEAR ENDED MARCH 31, | |||||||||||
2016 | 2015 | 2014 | |||||||||
CASH FLOWS PROVIDED BY (USED IN) OPERATING ACTIVITIES: | |||||||||||
Net loss | ($14,894 | ) | ($38,562 | ) | ($35,658 | ) | |||||
Adjustments to reconcile net loss to cash provided by (used in) operations: | |||||||||||
Depreciation and amortization | 6,772 | 9,574 | 8,678 | ||||||||
Capitalized software and other intangible asset impairment | — | 8,751 | — | ||||||||
Deferred income taxes | 148 | 11 | 4 | ||||||||
Stock award compensation | 2,817 | 6,232 | 17,475 | ||||||||
Other | 18 | 307 | — | ||||||||
Net change in assets and liabilities: | |||||||||||
Accounts receivable | 2,474 | 6,377 | 3,618 | ||||||||
Other assets | 5,397 | 3,306 | 3,414 | ||||||||
Accounts payable and accrued expenses (1) | (4,157 | ) | 4,919 | 1,543 | |||||||
Deferred revenue | (2,441 | ) | (5,610 | ) | (7,410 | ) | |||||
Net cash (used in) operating activities | (3,866 | ) | (4,695 | ) | (8,336 | ) | |||||
CASH FLOWS PROVIDED BY (USED IN) INVESTING ACTIVITIES: | |||||||||||
Purchase of: | |||||||||||
Property and equipment (1) | (3,817 | ) | (3,953 | ) | (3,541 | ) | |||||
Capitalized software | (4,238 | ) | (3,509 | ) | (5,696 | ) | |||||
Proceeds from asset disposals | 33 | — | — | ||||||||
Net cash (used in) investing activities | (8,022 | ) | (7,462 | ) | (9,237 | ) | |||||
CASH FLOWS PROVIDED BY (USED IN) FINANCING ACTIVITIES: | |||||||||||
Cash payments from former parent company | — | 23,999 | 65,746 | ||||||||
Cash payments to former parent company | — | (13,879 | ) | (67,003 | ) | ||||||
Proceeds from initial public offering | — | — | 68,448 | ||||||||
Initial public offering costs, net | — | — | (1,412 | ) | |||||||
Vendor financing repayments | (728 | ) | — | — | |||||||
Net proceeds from exercise of stock awards | 2,191 | 2,865 | 332 | ||||||||
Net cash provided by financing activities | 1,463 | 12,985 | 66,111 | ||||||||
EFFECT OF EXCHANGE RATE CHANGES ON CASH | 29 | (287 | ) | 32 | |||||||
NET CHANGE IN CASH | (10,396 | ) | 541 | 48,570 | |||||||
CASH AT BEGINNING OF YEAR | 50,077 | 49,536 | 966 | ||||||||
CASH AT END OF YEAR | $39,681 | $50,077 | $49,536 | ||||||||
(1) | Accounts payable and accrued expenses in the balance sheet as of March 31, 2015 include $3.0 million associated with purchases of property and equipment, which are non-cash acquisitions of fixed assets as of March 31, 2015. |
See notes to consolidated financial statements.
45
COVISINT CORPORATION
NOTES TO CONSOLIDATED FINANCIAL STATEMENTS
1. SUMMARY OF SIGNIFICANT ACCOUNTING POLICIES
Business
Covisint Corporation (the “Company”, “Covisint”, “we”, “our”, and “us”) provides an open, developer friendly, enterprise class cloud platform (“Platform”) enabling organizations to build solutions that quickly and securely identify, authenticate and connect users, devices, applications and information. Our Platform has been successfully operating globally on an enterprise scale for over 13 years, and is the technology behind innovative industry solutions such as General Motors’ OnStar™, Hyundai's Blue LinkTM and Cisco's Service Exchange PlatformTM (“SXP”).
Basis of Presentation
The accompanying consolidated financial statements (“financial statements”) include the accounts of Covisint Corporation, a Michigan corporation.
The financial statements have been prepared in conformity with accounting principles generally accepted in the United States of America (“U.S. GAAP”), which require management to make estimates and assumptions that affect the reported amounts of assets, liabilities, shareholders’ equity and the disclosure of contingencies at March 31, 2016 and 2015 and the results of operations for the years ended March 31, 2016, 2015, and 2014. While management has based their assumptions and estimates on the facts and circumstances existing at March 31, 2016, final amounts may differ from estimates.
The Company has evaluated subsequent events through the date these Financial Statements were issued.
Effective January 1, 2013, our former parent company, Compuware Corporation (“Compuware” or “Parent”) contributed substantially all of the assets and liabilities of its Covisint segment to Covisint Corporation (“January 2013 Contribution”).
In September 2013, the Company completed its initial public offering (“IPO”) in which it issued and sold 7.4 million shares of its common stock at a public offering price of $10.00 per share. The Company received net proceeds of $68.4 million after deducting underwriting discounts and commissions of $5.2 million.
From the January 2013 Contribution to the IPO, Compuware provided Covisint with short-term, non-interest bearing operating cash advances. The net effect of these intercompany transactions is reflected in the consolidated statements of cash flows as financing activity.
On October 31, 2014, Covisint ceased being a subsidiary of Compuware Corporation as a result of Compuware's distribution of its holdings of Covisint common stock to Compuware shareholders (“the October 2014 Distribution”).
During the 2014 fiscal year, the financial statements included an allocation of certain corporate expenses including costs for facilities, information technology, tax, internal audit, accounting, finance, human resources, legal and executive management functions provided to the Company by Compuware. These allocations were primarily based on headcount, revenue and space occupied as a proportion of those in all Compuware operating units. Management believes the allocations are reasonable. However, the expenses allocated to the Company for these services are not necessarily indicative of the expense that would have been incurred if the Company had been a separate, independent entity and had otherwise managed these functions. Corporate expenses charged to the Company by Compuware totaled $0 million, $0 million, and $10.6 million for the years ended March 31, 2016, 2015, and 2014, respectively.
Principles of Consolidation
The consolidated financial statements include the accounts of the Company and its wholly owned subsidiaries. All intercompany accounts and transactions have been eliminated in consolidation.
Revenue Recognition
The Company derives its revenues from the following sources: (i) subscriptions, (ii) professional services and (iii) other. Subscription revenues are primarily comprised of subscription fees that give customers access to and support of the Covisint Platform during the subscription term. Subscription and service contracts typically do not give the customer the right to take
46
possession of our software. Professional services revenues consist of fees related to implementation of the Covisint platform and consulting services. Other revenues include the sale of perpetual licenses. In limited circumstances, the Company grants certain customers the right to deploy our subscription service on the customers’ own servers. These arrangements are subject to software revenue recognition guidance since the customer deploys our software. During the quarter ended December 31, 2015, the Company completed a $1.0 million sale of a DocSite perpetual license to a single customer. The Company does not expect revenue from perpetual license sales in subsequent fiscal years. The software license agreement in this transaction provided the customer with a right to use the DocSite software perpetually, and did not contain any provisions for maintenance, upgrades, or software related services. Accordingly, the full value of the contract was recognized as revenue upon delivery of the license.
The Company commences revenue recognition when the following revenue criteria are met:
•There is persuasive evidence of an arrangement;
•The service has been provided to the customer;
•The collection of related fees is reasonably assured; and
•The amount of fees to be paid by the customer is fixed or determinable.
Customers typically have the right to terminate their agreement if the Company fails to perform.
Subscription Revenue
Subscription revenue is recognized ratably on a straight-line basis over the contract term. Revenue recognition commences on the later of the start date specified in the subscription arrangement, the launch date of the customers’ access to the Platform and production environment, or when all of the revenue recognition criteria have been met.
Professional Services Revenue
Professional services revenue is recognized as the services are delivered generally using a proportional performance methodology. In instances where final acceptance of the service is required before revenues are recognized, a portion of the professional services revenues and the associated costs are deferred until all acceptance criteria have been met. If it is determined that costs will exceed revenue, the expected loss is recorded at the time the loss becomes apparent.
Multiple Deliverable Arrangements
For arrangements with multiple deliverables, the Company evaluates whether the individual deliverables qualify as separate units of accounting. In order to treat deliverables in a multiple deliverable arrangement as separate units of accounting, the deliverables must have standalone value upon delivery. For deliverables that have standalone value upon delivery, each deliverable is accounted for separately and revenue is recognized for the respective deliverables as they are delivered. The Company currently has multiple element arrangements comprised of subscription fees and professional services, and given standalone values have been established, subscriptions and professional services revenue are accounted for as separate units of accounting. During the 2014 fiscal year, it was determined that certain professional services projects did not have stand-alone value. In those instances, the revenue is deferred and recognized over the longer of the committed term of the subscription agreement (generally one to five years) or the expected period over which the customer will receive benefit (generally five years). For the 2015 and 2016 fiscal years, we determined that we have standalone value for our professional services.
When multiple deliverables included in an arrangement are separable into different units of accounting, the arrangement consideration is allocated to the identified separate units of accounting based on their relative selling price. Contracts may include a subscription fee for ongoing PaaS operations and project (services) fees. In accordance with Accounting Standards Codification (“ASC”) 605, “Revenue Recognition,” multiple element arrangement consideration is allocated based on relative selling price using the following hierarchy: vendor specific objective evidence (“VSOE”) which represents the price when sold separately if available; third-party evidence (“TPE”) if VSOE is not available; or estimated selling price if neither VSOE nor TPE is available. If neither VSOE nor TPE are available, the Company determines its best estimate of selling price by evaluating amounts included in a contract, if any, and estimated costs to deliver each element.
Deferred Costs
Deferred costs consist of the incremental direct personnel and outside contractor costs incurred in delivering implementation and solutions deployment services that do not have stand-alone value. Revenue from these services, as described above, is deferred and recognized over the longer of the committed term of the subscription agreement or the expected period over which the customer will receive benefit. Therefore, the costs are recognized over the same period as the associated revenue. In the event a customer contract with deferred cost is terminated, the Company recognizes the remainder of the amount recorded in deferred cost attributable to the terminated contract.
Sales commission costs that directly relate to revenue transactions that are deferred are recorded as “prepaid expenses and other current assets” or non-current “other assets” as applicable in the condensed and consolidated balance sheets and recognized as “sales and marketing” expenses in the financial statements over the revenue recognition period of the related transaction.
47
Deferred Revenue
Deferred revenue consists of the billed but unearned portion of existing contracts for subscription and services provided, and is recognized over the expected period during which the customer will receive benefit or as services are delivered. The Company generally invoices its customers’ subscription fees in annual, quarterly or monthly installments. Contractual time periods often exceed the invoicing period and accordingly, the deferred revenue balance does not represent the total contract value of committed subscription agreements. The portion of deferred revenue that the Company anticipates will be recognized during the succeeding 12-month period is recorded as current deferred revenue and the remaining portion is recorded as non-current deferred revenue. The Company has generally received payment for the services for which the revenue has been deferred. Deferred revenue also includes contracts for which we have a contractually executed agreement and have invoiced the customer under the terms of the executed agreement but have not met all the revenue recognition criteria and/or have concluded that revenue should be recognized on cash basis, as collectibility of the invoiced amounts is not reasonably assured. In the event a customer contract with deferred revenue is terminated, the Company recognizes the remainder of the amount recorded in deferred revenue attributable to the terminated contract.
Collection and Remittance of Taxes
The Company records the collection of taxes from customers and the remittance of these taxes to governmental authorities on a net basis in its financial statements.
Cash and Cash Equivalents
The Company considers all investments with an original maturity of three months or less to be cash equivalents
Fair Value Measurements
The Company applies fair value accounting for all financial assets and liabilities, which defines fair value, establishes a framework for measuring fair value, and prescribes disclosures about fair value measurements. The Company also follows this guidance for non-financial assets and liabilities.
The Company determines fair value based on the fair value hierarchy, which requires an entity to maximize the use of observable inputs and minimize the use of unobservable inputs when measuring fair value. Fair value is defined as the price that would be received to sell an asset or paid to transfer a liability in an orderly transaction between market participants at the measurement date. The fair value assumes that the transaction to sell the asset or transfer the liability occurs in the principal or most advantageous market for the asset or liability and establishes that the fair value of an asset or liability shall be determined based on the assumptions that market participants would use in pricing the asset or liability. The classification of a financial asset or liability within the hierarchy is based upon the lowest level input that is significant to the fair value measurement. The fair value hierarchy prioritizes the inputs into three levels that may be used to measure fair value:
1. | Inputs are unadjusted quoted prices in active markets for identical assets or liabilities. |
2. | Inputs are quoted prices for similar assets and liabilities in active markets or inputs that are observable for the asset or liability, either directly or indirectly through market corroboration, for substantially the full term of the assets or liabilities. |
3. | Inputs are unobservable inputs based on assumptions |
Concentrations of Credit Risk
As of March 31, 2016, the Federal Deposit Insurance Corporation (“FDIC”) provided insurance coverage of up to $250,000 per depositor per bank. The Company has not experienced any losses in such accounts and does not believe that the Company is exposed to significant risks from excess deposits. The Company’s cash balance in excess of FDIC limits totaled $37.5 million at March 31, 2016.
Cost of Revenue
Consists of compensation and related expenses for infrastructure and operations staff, payments to outside service providers, data center costs related to hosting the Company’s software, as well as amortization and impairment of capitalized software.
Allowance for Doubtful Accounts
The Company considers historical loss experience, including the need to adjust for current conditions, the aging of outstanding accounts receivable and information available related to specific customers when estimating the allowance for doubtful accounts. The allowance is reviewed and adjusted based on the Company’s best estimates of collectibility.
48
The following table summarizes the allowance for doubtful accounts and changes to the allowance during the years ended March 31, 2016, 2015, and 2014 (in thousands):
Allowance for Doubtful Accounts: | Balance at Beginning of Period | Charged to Income | Accounts Charged Against the Allowance | Balance at End of Period | |||
Year ended March 31, 2016 | $70 | $226 | $257 | $39 | |||
Year ended March 31, 2015 | $164 | $7 | $101 | $70 | |||
Year ended March 31, 2014 | $58 | $108 | $2 | $164 | |||
Property and Equipment
Property and equipment is stated at cost. Depreciation is recorded using the straight-line method over the estimated useful lives of the related assets, which are generally estimated to be three to five years for furniture and fixtures, computer equipment and software. Leasehold improvements are amortized over the term of the lease.
Impairment of Long-Lived Assets
Long-lived assets, such as property, equipment and software and intangible assets are reviewed for impairment whenever events or changes in circumstances indicate that the carrying amount of an asset or asset group may not be recoverable. If circumstances require that a long-lived asset or asset group be tested for possible impairment, the undiscounted cash flows expected to be generated by that long-lived asset or asset group is compared to its carrying amount. If the carrying amount of the long-lived asset or asset group is not recoverable on an undiscounted cash flow basis, an impairment is recognized to the extent that the carrying amount exceeds its fair value.
Capitalized Software
Capitalized software includes the costs of internally developed software products capitalized in accordance with ASC 350-40, “Internal Use Software,” and software technology purchased through acquisitions. Net purchased software included in capitalized software was $0.0 million and $0.2 million as of March 31, 2016 and 2015, respectively.
Capitalized and purchased software costs are amortized on a straight line basis over the expected useful life of the software, which is generally 5 years. Amortization begins when the software technology is ready for its intended use. Amortization expense for capitalized software, exclusive of impairments, was $3.4 million, $6.8 million, and $6.8 million for the years ended March 31, 2016, 2015, and 2014, respectively. Amortization expenses are included in “cost of revenue” in the financial statements.
The Company focuses its research and development on new and expanded features of the Platform and vertical-specific solutions, utilizing an agile delivery methodology for Platform enhancements. A portion of these costs related to hosted software and application services that have reached the application development stage are capitalized per the guidance set forth in ASC350-40 which requires companies to capitalize qualifying computer software costs. Capitalization of such cost begins when the preliminary project stage is complete and ceases at the point in which the project is substantially complete and is ready for its intended purpose. Costs related to preliminary project activities and post-implementation activities are expensed as incurred. Research and development costs incurred amounted to $17.3 million, $13.9 million, and $18.1 million for the years ended March 31, 2016, 2015, and 2014, respectively, of which $4.2 million, $3.5 million, and $5.7 million respectively was capitalized as internally-developed software technology.
Capitalized software costs are reviewed for impairment when events and circumstances indicate such asset may be impaired. If estimated future undiscounted cash flows are not sufficient to recover the carrying value of the capitalized research and development, an impairment charge is recorded in the amount by which the present value of future cash flows is less than the carrying value of these assets. There were no impairments noted for the year ended March 31, 2016. Cost of revenue expense for the year ended March 31, 2015 included an impairment charge of $8.3 million related to software costs for healthcare specific projects resulting from the Company's decision in fiscal 2015 to exit the healthcare application business (see Note 3 for further information).
Goodwill and Other Intangible Assets
Goodwill and intangible assets with indefinite lives are tested for impairment annually at March 31 or more frequently if management believes indicators of impairment exist. The impairment test involves a two-step process with Step 1 comparing the fair value of the reporting unit with its aggregate carrying value, including goodwill. If the carrying amount of the reporting unit exceeds the reporting unit’s fair value, the Company performs Step 2 of the goodwill impairment test to determine the amount of
49
impairment loss by comparing the implied fair value of the reporting unit’s goodwill with the carrying amount of that goodwill. All operations of the Company are in a single reporting unit that was evaluated in the annual impairment assessment.
The Company's goodwill balance was $25.4 million and $25.4 million as if March 31, 2016 and March 31, 2015, respectively. The Company concluded there was no impairment of goodwill during either year.
Sales and marketing expenses for the year ended March 31, 2015 also included a $0.5 million impairment of customer relationship intangibles related to DocSite, as the intangibles specifically related to healthcare customer relationships.
Income Taxes
The Covisint business was operated as a division of Compuware prior to the January 2013 Contribution. As a member of Compuware’s consolidated group (“Consolidated Group”), the Company’s operations were included in the Consolidated Group for tax periods or portions thereof commencing after the January 2013 Contribution through the October 2014 Distribution.
Income taxes are presented herein on a separate return basis even though the Company’s results of operations have historically been included in the consolidated, combined, unitary or separate income tax returns of Compuware until the October 2014 Distribution. The Company accounts for income taxes under the asset and liability method, which requires the recognition of deferred tax assets and liabilities for the expected future tax consequences of events that have been included in the financial statements. Under this method, deferred tax assets and liabilities are determined based on the differences between the financial statements and tax bases of assets and liabilities and net operating losses and tax credits using enacted tax rates in effect for the year in which the differences are expected to reverse. The effect of a change in tax rates on deferred tax assets and liabilities is recognized in the period that includes the enactment date.
The Company records net deferred tax assets to the extent it believes these assets will more likely than not be realized. These deferred tax assets are subject to periodic assessments as to recoverability. If it is determined that it is more likely than not that the benefits will not be realized, valuation allowances are recorded which would increase the provision for income taxes. In making such determinations, the Company considers all available positive and negative evidence, including future reversals of existing taxable temporary differences, projected future taxable income, tax planning strategies and recent financial operations.
Certain net operating losses (“NOL”) and tax credits generated by the Company prior to the date of our spin-off from Compuware have been utilized by our former parent, Compuware, and are not available to reduce future taxable income of Covisint. Therefore, the deferred tax assets do not include the NOL or tax credits generated by Covisint and utilized by Compuware. In as much as Compuware has paid cash for these NOL and tax credits, the Company has already realized the economic benefit. Covisint has received the economic benefit of these NOL and tax credits which is reported as a cash flow from financing activities in the accompanying cash flow statements. Following the Company's spin-off from Compuware on October 31, 2014, Compuware will no longer receive the tax benefit of these NOLs and tax credits, and, therefore, will no longer compensate the Company for these items.
Interest and penalties related to uncertain tax positions are included in the income tax expense.
Foreign Currency Translation
The Company’s foreign operations use their respective local currency as their functional currency. Assets and liabilities of foreign subsidiaries are minimal and are generally short term in nature. Such assets and liabilities in the financial statements have been translated at the rate of exchange at the respective balance sheet dates, and revenues and expenses have been translated at average exchange rates prevailing during the period the transactions occurred. Translation adjustments have been excluded from the results of operations.
Stock-Based Compensation
Stock award compensation expense is recognized, net of an estimated forfeiture rate, on a straight-line basis over the requisite service period of the award, for awards that vest strictly based on time, and on a straight-line basis over the requisite service period of the individual tranches of the award for awards with performance conditions.
Compuware Corporation Stock Compensation Awards
Certain Covisint employees were granted stock options to purchase Compuware common stock, and under the agreements between the Company and Compuware, Covisint recorded the compensation expense relating to these stock options to purchase Compuware common stock. Compuware calculated the fair value of its stock option awards using the Black-Scholes option pricing
50
model, which incorporates various assumptions including volatility, expected term, risk-free interest rates and dividend yields. The expected volatility assumption was based on historical volatility of Compuware’s common stock over the most recent period commensurate with the expected life of the stock option granted. Compuware used historical volatility because management believed such volatility was representative of prospective trends. The risk-free interest rate assumption was based upon observed interest rates appropriate for the expected life of the stock option awarded.
The following is the average fair value per share of Compuware stock compensation awards estimated on the date of grant and the assumptions used for each option granted to Compuware employees, including those providing services to Covisint, during the year ended March 31, 2014. No grants of Compuware stock compensation were awarded to Covisint employees for the years ended March 31, 2016 or March 31, 2015.
YEAR ENDED MARCH 31, | |||
2014 | |||
Expected volatility | 39.11% | ||
Risk-free interest rate | 1.67% | ||
Expected lives at date of grant (in years) | 6.20 | ||
Weighted average fair value of the options granted | $2.63 | ||
Dividend Yield Assumption (1) | 4.46% | ||
(1) In January 2013, the Compuware Board of Directors announced its intention to begin paying cash dividends totaling $0.50 per share annually, to be paid quarterly beginning in the first quarter of fiscal 2014. Prior to that, Compuware had never paid a dividend or announced any intentions to pay a dividend.
Covisint Corporation Stock Compensation Awards
Covisint calculates the fair value of stock option awards granted using the Black-Scholes option pricing model, which incorporates various assumptions including volatility, expected term, risk-free interest rates and dividend yields. Despite the Company's IPO in September 2013, the Company does not yet have historical stock price data covering a historical period commensurate with the expected life of stock options granted. Therefore, the expected volatility assumption is based on an average of the historical volatility of comparable companies (“peer group companies”). The risk-free interest rate assumption is based upon observed interest rates appropriate for the expected life of the stock option awarded. The expected life of the stock option is based on management’s best estimates considering the terms of the options granted. Dividend yields have not been a factor in determining fair value of stock options granted as Covisint has never issued cash dividends and does not anticipate issuing cash dividends in the future.
Assumptions used subsequent to the IPO in measuring Covisint options granted, and the weighted average fair value of options granted, in fiscal 2016, 2015, and 2014 were:
YEAR ENDED MARCH 31, | |||||
2016 | 2015 | 2014 | |||
Expected volatility | 41.22% | 46.12% | 49.99% | ||
Risk-free interest rate | 1.89% | 2.05% | 1.85% | ||
Expected lives at date of grant (in years) | 6.25 | 6.14 | 6.01 | ||
Weighted average fair value of the options granted | $0.97 | $1.89 | $5.86 | ||
Prior to the IPO, Covisint stock was not traded on a stock exchange and thus the exercise price of Covisint stock options at the date of grant was determined by calculating the estimated fair market value of the Company divided by the total shares outstanding, including outstanding stock options that had not yet vested. The estimated fair market value of the Company was measured using an equal combination of discounted cash flow and market comparable valuations and was discounted due to a lack of marketability at the grant date. Previous valuation estimates placed a greater emphasis on the discounted cash flow model. The discounted cash flow model uses significant assumptions, including projected future cash flows, a discount rate reflecting the risk inherent in future cash flows and a terminal growth rate. The key assumptions in the market comparable value analysis are the selection of peer group companies and application of these peer group companies’ data to Covisint.
51
Business Segments— The Company operates in a single reportable segment. Sales are heavily weighted toward North American automotive companies.
Significant Customers – Our revenue is also concentrated with two key customers, Cisco and various divisions of General Motors Company (collectively, “General Motors” or “GM”). As a result of the strategic partnership with Cisco, the Company enabled Cisco to serve as the prime contractor and Covisint as the subcontractor for agreements (collectively, the “GM Contracts”), with GM which the Company historically provided directly to GM. For the twelve months ended March 31, 2016, Cisco accounted for 36% of our total revenue, of which 26% of total revenue is related to the transfer of the GM Contracts and the augmentation of Cisco’s SXP. Our stand-alone business with GM accounted for 6% of our total revenue in the twelve months ended March 31, 2016. For the twelve months ended March 31, 2015, Cisco accounted for 7% of our total revenue, of which 2% of total revenue is related to the transfer of the GM Contracts and the augmentation of Cisco’s SXP. Our stand-alone business with GM accounted for 28% of our total revenue in the twelve months ended March 31, 2015. For the twelve months ended March 31, 2014, GM accounted for 26% of our total revenue.
Geographical Information— Financial information regarding geographic operations is presented in the table below (in thousands):
YEAR ENDED MARCH 31, | |||||
2016 | 2015 | 2014 | |||
Revenue: | |||||
United States | $65,597 | $75,919 | $83,308 | ||
International operations | 10,427 | 12,615 | 13,827 | ||
Total | $76,024 | $88,534 | $97,135 | ||
YEAR ENDED MARCH 31, | |||
Long-lived assets: | 2016 | 2015 | |
United States | $43,963 | $43,573 | |
International operations | 755 | 909 | |
Total | $44,718 | $44,482 | |
Long-lived assets are comprised of property, plant and equipment, goodwill and capitalized software.
Recently Issued Accounting Pronouncements
In March 2016, the Financial Accounting Standards Board (“FASB”) issued Accounting Standards Update (“ASU”) 2016-09, Improvements to Employee Share-Based Payment Accounting, requiring all income tax effects of awards to be recognized in the income statement when the awards vest or are settled. ASU 2016-09 will also allow an employer to repurchase more of an employee's shares than it can today for tax withholding purposes without triggering liability accounting and to make a policy election to account for forfeitures as they occur. ASU 2016-09 is effective for annual reporting periods beginning after December 15, 2016. Early adoption is permitted. The Company is currently evaluating the effect that the provisions of ASU 2016-09 will have on its consolidated financial statements and related disclosures.
In February 2016, the FASB issued ASU 2016-02, Leases, requiring a lessee to recognize in the statement of financial position a liability to make lease payments and a right-of-use asset representing its right to use the underlying asset for the lease term. ASU 2016-02 is effective for annual reporting periods beginning after December 15, 2018. ASU 2016-02 requires entities to use a modified retrospective approach for leases that exist or are entered into after the beginning of the earliest comparative period in the financial statements. Full retrospective application is prohibited. The Company is currently evaluating the effect that the provisions of ASU 2016-02 will have on its consolidated financial statements and related disclosures.
In November 2015, the FASB issued ASU 2015-17, Income Taxes (Topic 740): Balance Sheet Classification of Deferred Taxes, which requires all deferred income taxes to be classified as noncurrent on the balance sheet. The amendments would be effective for annual periods beginning after December 15, 2016. The Company early adopted this standard prospectively as of March 31, 2016.
52
In May 2014, the FASB issued ASU 2014-09, Revenue from Contracts with Customers (Topic 606), and a subsequent amendment to the standard in March 2016 with ASU 2016-08, a new comprehensive revenue recognition standard that will supersede all existing revenue recognition guidance under U.S. GAAP. The standard's core principle is that revenue should be recognized as goods or services are transferred to a customer in an amount that reflects the consideration to which the company expects to be entitled in exchange for those goods or services. On July 9, 2015, the FASB agreed to delay the effective date by one year. In accordance with the delay, this ASU will now be effective for annual and interim periods beginning on or after December 15, 2017, with early adoption permitted. Entities will have the option of using either a full retrospective approach or a modified approach to adopt the guidance in the ASU. The Company is currently evaluating the impact of adopting this guidance.
2. PROPERTY AND EQUIPMENT
Property and equipment, summarized by major classification, is as follows (in thousands):
MARCH 31, | |||||||
2016 | 2015 | ||||||
Computer equipment and software | $18,923 | $18,877 | |||||
Furniture and fixtures | 821 | 687 | |||||
Leasehold improvements | 2,855 | 1,323 | |||||
$22,599 | $20,887 | ||||||
Less accumulated depreciation and amortization | 14,752 | 12,078 | |||||
Net property and equipment | $7,847 | $8,809 | |||||
Depreciation of property and equipment totaled $3.4 million, $2.7 million and $1.6 million for the years ended March 31, 2016, 2015, and 2014, respectively.
Operating Leases
The Company conducts its business in leased facilities which based on the lease terms are considered to be operating leases. The following table outlines the Company’s future minimum contractual lease obligations under the lease agreements as of March 31, 2016 (presented in thousands):
Year Ending March 31, | |||||||||||||||||||||||||||
Total | 2017 | 2018 | 2019 | 2020 | 2021 | Thereafter | |||||||||||||||||||||
Leases | $ | 8,914 | $ | 1,167 | $ | 1,173 | $ | 1,203 | $ | 1,235 | $ | 662 | $ | 3,474 | |||||||||||||
3. GOODWILL, CAPITALIZED SOFTWARE AND OTHER INTANGIBLE ASSETS
The components of the Company’s intangible assets are as follows (in thousands):
MARCH 31, 2016 | |||||||||||
Gross Carrying Amount | Accumulated Amortization | Net Carrying Amount | |||||||||
Indefinite-lived intangible assets: | |||||||||||
Trademarks(1) | $358 | $358 | |||||||||
Amortizing intangible assets: | |||||||||||
Capitalized software(2) | $38,578 | ($27,450 | ) | $11,128 | |||||||
Customer relationship agreements | 2,585 | (2,585 | ) | — | |||||||
Trademarks | 80 | (80 | ) | — | |||||||
Total amortizing intangible assets | $41,243 | ($30,115 | ) | $11,128 | |||||||
53
MARCH 31, 2015 | |||||||||||
Gross Carrying Amount | Accumulated Amortization | Net Carrying Amount | |||||||||
Indefinite-lived intangible assets: | |||||||||||
Trademarks(1) | $358 | $358 | |||||||||
Amortizing intangible assets: | |||||||||||
Capitalized software(2) | $34,340 | ($24,052 | ) | $10,288 | |||||||
Customer relationship agreements | 2,585 | (2,585 | ) | — | |||||||
Trademarks | 80 | (80 | ) | — | |||||||
Total amortizing intangible assets | $37,005 | ($26,717 | ) | $10,288 | |||||||
_____________________________________________________
(1) | The Covisint trademarks were acquired by Compuware in an acquisition in March 2004 and contributed to Covisint by Compuware effective January 1, 2013. These trademarks are deemed to have an indefinite life and therefore are not being amortized. |
(2) | Amortization of capitalized software is included in “cost of revenue” in the consolidated statements of comprehensive loss. Capitalized software is generally amortized over 5 years. |
Amortization of intangible assets, exclusive of impairments, was $3.4 million, $7.2 million, and $7.1 million for the years ended March 31, 2016, 2015, and 2014, respectively. Estimated future amortization, based on recorded intangible assets at March 31, 2016, is expected to be as follows (in thousands):
AT MARCH 31, 2016 FOR THE YEAR ENDING MARCH 31, | |||||||||||||||||||
2017 | 2018 | 2019 | 2020 | 2021 | |||||||||||||||
Capitalized software | $3,861 | $3,164 | $1,813 | $1,445 | $845 | ||||||||||||||
Impairment Evaluation
The Company evaluated its goodwill and other indefinite-lived intangible assets for impairments as of March 31, 2016 and 2015. There were no impairments noted for the year ended March 31, 2016. For the year ended March 31, 2015 the Company evaluated its capitalized software and other amortized intangibles for impairment and recorded an impairment of $8.3 million related to capitalized software related to healthcare specific projects and $0.5 million of impairment expense related to healthcare customer relationships. Specific to capitalized software and the customer relationships, the Company first evaluated undiscounted cash flows associated with the asset groups, and concluded that the carrying value of the assets was not recoverable from projected future undiscounted cash flows. In measuring the impairment, the Company performed a discounted cash flow analysis, and determined that the fair value of these assets was zero, and, therefore, the assets were fully impaired as of March 31, 2015. The fair value measurements were prepared using level 3 fair value inputs.
4. LOSS PER COMMON SHARE
Basic earnings per common share (“EPS”) is computed by dividing earnings available to common shareholders by the weighted-average number of common shares outstanding for the period. Diluted EPS assumes the issuance of common stock for all potentially dilutive equivalent shares outstanding using the treasury method.
EPS data were computed as follows (in thousands, except for per share data):
54
YEAR ENDED MARCH 31, | |||||||||||
2016 | 2015 | 2014 | |||||||||
Basic loss per share: | |||||||||||
Numerator: Net loss | ($14,894 | ) | ($38,562 | ) | ($35,658 | ) | |||||
Denominator: | |||||||||||
Weighted-average common shares outstanding | 39,658 | 38,217 | 33,774 | ||||||||
Basic loss per share | ($0.38 | ) | ($1.01 | ) | ($1.06 | ) | |||||
Diluted loss per share: | |||||||||||
Numerator: Net loss | ($14,894 | ) | ($38,562 | ) | ($35,658 | ) | |||||
Denominator: | |||||||||||
Weighted-average common shares outstanding | 39,658 | 38,217 | 33,774 | ||||||||
Dilutive effect of stock awards | — | — | — | ||||||||
Total shares | 39,658 | 38,217 | 33,774 | ||||||||
Diluted loss per share | ($0.38 | ) | ($1.01 | ) | ($1.06 | ) | |||||
Stock awards to purchase approximately 4,131,000, 4,774,000, and 4,350,000 shares for the years ended March 31, 2016, 2015, and 2014 respectively, were excluded from the diluted EPS calculation because they were anti-dilutive.
5. INCOME TAXES
Until the January 2013 Contribution, the Covisint business was operated as a division of Compuware. As a member of the Compuware Consolidated Group, the Company’s operations were included in the Consolidated Group for tax periods or portions thereof commencing after the January 2013 Contribution. Following the October 2014 Distribution, Covisint became its own separate group for tax purposes, and began filing separate stand-alone tax returns.
Prior to the October 2014 Distribution, taxable income and/or loss generated by the Company was included in the consolidated, combined, or unitary income tax returns of Compuware. Income taxes prior to the October 2014 Distribution in the accompanying financial statements have been allocated as if the Covisint business were held in a separate corporation which filed separate income tax returns. The Company believes these assumptions underlying its allocation of income taxes on a separate return basis were reasonable. However, the amounts allocated for income taxes prior to the October 2014 Distribution in the accompanying financial statements are not necessarily indicative of the actual amount of income taxes that would have been recorded had Covisint been a separate stand-alone tax paying entity. Following the October 2014 Distribution the Company began filing its own tax returns separate from Compuware.
We are subject to taxation in the United States and various states and foreign jurisdictions. As of March 31, 2016, all tax years presented are subject to examination by the tax authorities.
Income tax provision
(Loss) before income tax provision includes the following (in thousands):
55
YEAR ENDED MARCH 31, | |||||||||||
2016 | 2015 | 2014 | |||||||||
(Loss) before income tax provision: | |||||||||||
U.S. | ($15,289 | ) | ($38,586 | ) | ($35,961 | ) | |||||
Foreign | 584 | 136 | 388 | ||||||||
Total (loss) before income tax provision | ($14,705 | ) | ($38,450 | ) | ($35,573 | ) | |||||
YEAR ENDED MARCH 31, | |||||||||||
2016 | 2015 | 2014 | |||||||||
Income tax provision: | |||||||||||
Current: | |||||||||||
U.S. Federal | $— | $— | $— | ||||||||
Foreign | 64 | 17 | 86 | ||||||||
U.S. State | — | — | — | ||||||||
Total current tax provision | $64 | $17 | $86 | ||||||||
Deferred: | |||||||||||
U.S. Federal | $— | $— | $— | ||||||||
Foreign | 125 | 95 | (1 | ) | |||||||
U.S. State | — | — | — | ||||||||
Total deferred tax provision (benefit) | $125 | $95 | ($1 | ) | |||||||
Total income tax provision | $189 | $112 | $85 | ||||||||
The Company’s income tax provision differed from the amount computed on pre-tax income at the U.S. federal income tax rate of 35 percent for the following reasons (in thousands):
YEAR ENDED MARCH 31, | |||||||||||
2016 | 2015 | 2014 | |||||||||
Federal income tax at statutory rates | ($5,147 | ) | ($13,458 | ) | ($12,451 | ) | |||||
Increase (decrease) in taxes: | |||||||||||
State income taxes, net | (559 | ) | (1,675 | ) | (1,314 | ) | |||||
Foreign tax rate differential | (45 | ) | (24 | ) | (37 | ) | |||||
U.S. Taxes relating to foreign operations | 100 | 102 | 26 | ||||||||
Tax credits | (400 | ) | — | (483 | ) | ||||||
Valuation allowance (1) | 2,223 | 12,958 | 14,355 | ||||||||
Share based compensation | 3,680 | 2,303 | — | ||||||||
Non-deductible expenses, net | 72 | 72 | (11 | ) | |||||||
Other, net | 265 | (166 | ) | — | |||||||
Income tax provision (benefit) | $189 | $112 | $85 | ||||||||
(1) | Prior to the October 2014 Distribution, the valuation allowance represented operating losses and tax credits generated by the Company that were not benefited. These losses and credits are not included in the tabular presentation of deferred tax assets as they have been utilized by Compuware and will not provide future economic benefits to Covisint. |
56
Deferred tax assets and liabilities
Temporary differences and carryforwards which give rise to a significant portion of deferred tax assets and liabilities are as follows (in thousands):
March 31, | |||||||
2016 | 2015 | ||||||
Deferred tax assets: | |||||||
Deferred revenue | $1,650 | $3,455 | |||||
Intangible assets | 1,975 | 9,152 | |||||
Fixed assets | 233 | 69 | |||||
Accrued expenses | 923 | 640 | |||||
Stock-based compensation | 2,684 | 5,914 | |||||
Net operating loss and other tax credit carryforwards | 14,586 | 7,878 | |||||
Other | 171 | 130 | |||||
Total deferred tax assets before valuation allowance | 22,222 | 27,238 | |||||
Less: valuation allowance | 16,303 | 20,470 | |||||
Net deferred tax assets | $5,919 | $6,768 | |||||
Deferred tax liabilities: | |||||||
Capitalized research and development costs | 4,957 | 5,509 | |||||
Fixed Assets | — | — | |||||
Other | 1,144 | 1,312 | |||||
Total deferred tax liabilities | 6,101 | 6,821 | |||||
Net deferred tax (liabilities) | ($182 | ) | ($53 | ) | |||
Current deferred tax assets | $— | $— | |||||
Current deferred tax liabilities | — | (1,581 | ) | ||||
Long-term deferred tax assets | 171 | 1,528 | |||||
Long-term deferred tax liabilities | (353 | ) | — | ||||
Net deferred tax liabilities | ($182 | ) | ($53 | ) | |||
The Company does not permanently reinvest any earnings in its foreign subsidiaries, and recognizes all deferred tax liabilities that arise from outside basis differences in its investments in subsidiaries.
ASC 740, Income Taxes, provides for the recognition of deferred tax assets only when realization is more likely than not. In assessing the valuation allowance, the Company considers all available positive and negative evidence, including historical financial results and forecasted financial results. As a result of the Company’s analysis, it has been determined that it is more likely than not the Company will not realize the benefits of its deferred tax assets in the U.S., and the Company has recorded a full valuation allowance thus reducing the carrying value of the above deferred tax assets. The deferred tax asset “Net operating loss and other tax credit carryforwards” represents only those amounts that have been generated by Covisint following the October 2014 Distribution and are not available to be included in the taxable results of Compuware. The valuation allowance decreased by $4.1 million during the year ended March 31, 2016, primarily attributable to a decrease in net deferred tax assets related to intangible assets, which resulted from a change in assumptions on the Section 336 step up value associated with the October 2014 Distribution.
Prior to the October 2014 Distribution, net operating losses and tax credits generated by the Company were substantially utilized by the Company’s former parent, Compuware, and are not available to reduce future taxable income of Covisint. Therefore, the deferred tax assets presented above do not include the NOL or tax credits generated by Covisint and utilized by Compuware before the October 2014 Distribution. In as much as Compuware has paid cash for these NOL and tax credits prior to October 31, 2014, the Company has already realized the economic benefit. Covisint has received the economic benefit of these pre-distribution NOL and tax credits (for the amount of benefit realized by Compuware) which is reported as cash from financing activities on the accompanying statements of cash flows. For periods following the October 2014 Distribution, any NOL’s and tax credits generated would be available to offset future Covisint taxable income.
57
As a result of the October 2014 Distribution, the spinoff was deemed taxable to Compuware. Through a tax sharing agreement between Compuware and Covisint, Compuware has agreed to bear any tax costs associated with the spinoff. Also, Covisint and Compuware have agreed to make an election under §336(e) of the Internal Revenue Code that results in a step-up in the tax basis of our assets to fair market value. The actual benefit that Covisint will realize depends on multiple things, including generating taxable income over time to fully utilize deductions associated with any increased tax basis from the election. The step up in tax basis is primarily associated with goodwill that will be deducted over the 15 years for income tax purposes.
At March 31, 2016, the Company had NOL’s and tax credit carryforwards for income tax purposes of $14.6 million which expire in the tax years as follows (in thousands):
March 31, 2016 | |||||
Balance | Expiration | ||||
U.S. federal net operating losses | $12,380 | 2035-2036 | |||
U.S. federal tax credit carryforwards | 400 | 2035-2036 | |||
U.S. state net operating losses | 1,801 | 2018-2035 | |||
U.S. state tax credit carryforwards | 5 | 2028-2029 | |||
Total | $14,586 | ||||
Uncertain tax positions
The amount of gross unrecognized tax benefits (“UTBs”) was $0.0 million, $0.0 million, and $0.4 million as of March 31, 2016, 2015 and 2014, respectively, all of which, net of federal benefit, would favorably affect the Company’s effective tax rate if recognized in future periods.
The following is a tabular reconciliation of the total amounts of UTBs for the years ended March 31, 2016, 2015 and 2014 (in thousands):
March 31, | |||||||||||
2016 | 2015 | 2014 | |||||||||
Gross unrecognized tax benefit for beginning of period | $— | $354 | $— | ||||||||
Gross increases to tax positions for prior periods | — | — | — | ||||||||
Gross decreases to tax positions for prior periods | — | (354 | ) | — | |||||||
Gross increases to tax positions for current period | — | — | 354 | ||||||||
Settlements | — | — | — | ||||||||
Gross unrecognized tax benefit for period ended | $— | $— | $354 | ||||||||
The Company recognizes interest and penalties related to UTBs within the income tax expense line in the accompanying consolidated statement of operations. As of March 31, 2016, no interest and penalties were accrued.
Tax Sharing Agreement with Compuware
Effective January 1, 2013, Compuware contributed to Covisint substantially all of the assets and liabilities related to our business. In connection with the January 2013 Contribution, Compuware and the Company entered into a tax sharing agreement which was effective until the October 2014 Distribution. Pursuant to this agreement, the Company and Compuware generally made payments to each other with respect to tax returns for any taxable period in which the Company or any of the Company’s subsidiaries are included in Compuware's Consolidated Group, as well as in certain consolidated, combined, or unitary groups that include Compuware and/or certain of its subsidiaries (“Combined Group”), for taxes other than U.S. federal income taxes.
The amount of taxes paid by the Company was determined, subject to certain adjustments, as if the Company and each of its subsidiaries included in such Consolidated Group or Combined Group filed the Company’s own consolidated, combined, unitary or separate tax return. Each member of a consolidated group during any part of a consolidated return year is severally liable for tax on the consolidated return of such year and for any subsequently determined deficiency thereon. Similarly, in some jurisdictions, each member of a consolidated, combined or unitary group for state, local or foreign tax purposes is jointly and severally liable for the state, local or foreign tax liability of each other member of the consolidated, combined or unitary group. Accordingly, for any period in which it is included in the Consolidated Group or any Combined Group, the Company could be liable in the event that any income or other tax liability was incurred, but not discharged, by any other member of any such group even if the Company is no longer a member of such Consolidated Group or Combined Group. Compuware has paid, through a reduction in the amount
58
due to Compuware, $0.0 million, $7.2 million, and $9.1 million for tax loss and credit benefits provided by the Company to the Consolidated Group for the years ended March 31, 2016, 2015, and 2014, respectively.
Covisint was a member of the Consolidated Group only until the October 2014 Distribution. Following the October 2014 Distribution, the tax sharing agreement benefits provided to the Company ceased.
Cash paid for income taxes
Cash paid by the Company for income taxes was $50,000 and $28,000 for the years ended March 31, 2016 and 2015, respectively.
6. COMMITMENTS AND CONTINGENCIES
Contractual Obligations
The Company conducts its business in various leased facilities which, based on the lease terms, are considered to be operating leases. Please refer to Footnote 2 - Property and Equipment for the Company’s minimum contractual lease obligations under the lease agreements as of March 31, 2016.
Legal Matters
Beginning on May 30, 2014, two putative class actions were filed in the U.S. District Court for the Southern District of New York against us, our directors and former directors, and certain of our officers and former officers alleging violation of securities laws in connection with our IPO and seeking unspecified damages. These lawsuits were consolidated in the action entitled Desrocher v. Covisint Corporation, et al., No. 14-cv-03878 (the “Securities Class Action”). On October 14, 2014, the lead plaintiff filed a consolidated class action complaint (the “Complaint”) alleging violations of Regulation S-K and Sections 11 and 15 of the Securities Act. The Complaint alleges, among other things that the IPO’s registration statement contained (1) untrue statements and omissions of material facts related to the Company’s projected revenues for fiscal 2014, (2) materially inaccurate statements regarding the Company’s revenue recognition policy, and (3) omissions of known trends, uncertainties and significant risk factors as required to be disclosed by Regulation S-K.
On May 5, 2016, the parties entered into a stipulation and agreement of settlement to dismiss all claims with prejudice and settle the Securities Class Action (the “Settlement”). The Settlement was reached after the Court denied defendants' motions to dismiss and granted class certification of a class of all persons who purchased the Company's stock in and/or traceable to the Company's IPO on or about September 26, 2013, seeking to pursue remedies under Section 11 and 15 of the Securities Act. The Settlement, which is subject to Court approval, provides for a payment by the defendants of $8.0 million. The Company's uninsured portion of the settlement amount was $0.4 million, which was recorded as a liability as of March 31, 2016.
7. BENEFIT PLANS
Effective April 8, 2014, the Company effectively transitioned all Covisint employees from the Compuware 401(k) program to a newly established Covisint 401(k) program. All balances were transferred to the new plan. Under the new plan, the Company matches 33 percent of employees’ 401(k) contributions up to 2 percent of eligible earnings. Matching contributions vest 100 percent when an employee reaches one year of service. The Company expensed $0.4 million, $0.5 million, and $0.7 million for the years ended March 31, 2016, March 31, 2015, and March 31, 2014, respectively, for our matching contributions to the plan.
Covisint Stock-Based Compensation Plan
In August 2009, Covisint established a 2009 Long-Term Incentive Plan (“2009 Covisint LTIP”) allowing the Board of Directors of Covisint to grant stock options, stock appreciation rights, restricted stock, restricted stock units ("RSUs"), performance-based cash or RSU awards and annual cash incentive awards to employees and directors of Covisint and its affiliates. The 2009 Covisint LTIP reserved 7.5 million common shares of Covisint for issuance.
As of March 31, 2016, there were 2.9 million stock options outstanding and 0.3 million RSUs outstanding from the 2009 Covisint LTIP. No options issued subsequent to the IPO contain a performance condition. Options granted subsequent to the IPO vest 25% one year from the date the requisite service period begins, and are fully vested after four years. For the years ended March 31, 2016 and 2015, 1.26 million options and 1.54 million options, respectively, were exercised by participants of the 2009 Covisint LTIP.
59
Covisint Stock Option Activity
All options were originally granted at estimated fair market value for those granted prior to IPO, and at fair market value for those granted post IPO. Options expire ten years from the date of grant unless expiration has been otherwise accelerated in accordance with a termination and/or separation agreement.
A summary of option activity under the Company’s stock-based compensation plans as of March 31, 2016, and changes during the year then ended is presented below (shares and intrinsic value in thousands):
YEAR ENDED MARCH 31, 2016 | ||||||||||||
Number of Options | Weighted Average Exercise Price | Weighted Average Remaining Contractual Term in Years | Aggregate Intrinsic Value | |||||||||
Options outstanding as of April 1, 2015 | 4,306 | $3.93 | ||||||||||
Granted | 305 | $2.26 | ||||||||||
Exercised | (1,260 | ) | $1.79 | |||||||||
Forfeited and Expired | (408 | ) | $5.03 | |||||||||
Options outstanding as of March 31, 2016 | 2,943 | $4.52 | 7.48 | $66 | ||||||||
Options vested and expected to vest, net of estimated forfeitures, as of March 31, 2016 | 2,814 | $4.57 | 7.43 | $66 | ||||||||
Options exercisable as of March 31, 2016 | 1,393 | $5.13 | 6.30 | $66 | ||||||||
Aggregate intrinsic value represents the difference between the estimated fair value of our common stock and the exercise price of outstanding, in-the-money options. The total intrinsic value of the options exercised was $0.8 million, $2.5 million and $1.2 million for the years ended March 31, 2016, 2015, and 2014, respectively. The weighted-average grant date fair value per share of options granted was $0.97, $1.89, and $5.86 for the years ended March 31, 2016, 2015, and 2014, respectively.
Covisint Restricted Stock Unit Activity
A summary of RSUs activity as of March 31, 2016, and changes during the year then ended is presented below (shares and intrinsic value in thousands):
YEAR ENDED MARCH 31, 2016 | ||||||||||
Shares | Weighted Average Grant-Date Fair Value | Aggregate Intrinsic Value | ||||||||
RSUs outstanding and non-vested at April 1, 2015 | 338 | $ | 3.91 | |||||||
Granted | 176 | $ | 2.57 | |||||||
Released | (216 | ) | $ | 3.37 | ||||||
Forfeited | — | $ | — | |||||||
RSUs outstanding and non-vested at March 31, 2016 | 298 | $ | 3.51 | $ | 595 | |||||
Aggregate intrinsic value is calculated as the market value at the end of the period. The weighted-average grant date fair value per share of restricted stock units granted was $2.57 and $3.91 for the years ended March 31, 2016 and 2015, respectively. No RSUs were granted in the year ended March 31, 2014. The total fair value of restricted stock units vested was $0.6 million for the year ended March 31, 2016.
Under the 2009 Covisint LTIP, a participant may utilize shares of vesting RSU awards to satisfy the withholding tax requirements. During the year ended March 31, 2016, approximately 19,000 shares were exchanged and used for the payment of withholding taxes.
60
Compuware Stock-Based Compensation Plan
While the Company was a majority-owned subsidiary of Compuware, certain Covisint employees were granted Compuware stock compensation awards. In accordance with the provisions of Staff Accounting Bulletin 1.B.1, Costs Reflected in Historical Financial Statements, the expense for these awards is included within the consolidated statements of comprehensive loss.
Due to the spin-off of Covisint from Compuware in the 2015 fiscal year, all Compuware options held by Covisint employees had to be exercised or they would be terminated 30 days after the completion of the spin-off. All vested options were exercised, and all non-vested Compuware options terminated in the third quarter of fiscal 2015. There were no Compuware stock options outstanding as of March 31, 2015.
Similarly, all non-vested Compuware RSUs terminated on October 31, 2014 due to the spin-off of Covisint from Compuware. There were no Compuware RSUs outstanding as of March 31, 2015.
The total intrinsic value of the Compuware options exercised was $0.6 million and $0.9 million for the years ended March 31, 2015 and 2014 respectively. The total fair value of Compuware restricted stock units vested was $1.5 million and $0.9 million for the year ended March 31, 2015 and 2014, respectively.
Stock Awards Compensation
For the years ended March 31, 2016, 2015 and 2014, respectively, net stock awards compensation expense was recorded as follows (in thousands):
YEAR ENDED MARCH 31, | |||||||||||
2016 | 2015 | 2014 | |||||||||
Stock awards compensation classified as: | |||||||||||
Cost of revenue | $71 | $613 | $829 | ||||||||
Research and development | 78 | 175 | 722 | ||||||||
Sales and marketing | 502 | 1,570 | 5,594 | ||||||||
General and administrative | 2,166 | 3,874 | 10,330 | ||||||||
Total stock awards compensation expense before income taxes | $2,817 | $6,232 | $17,475 | ||||||||
For the years ended March 31, 2016 and 2015, the Company has recognized stock compensation expense of $2.8 million and $6.2 million, respectively. Stock compensation expense decreased for the year ended March 31, 2016 as compared to the same period in 2015 principally due to the completion of the expense recognition period for a large quantity of options during 2015.
For the year ended March 31, 2014, total stock awards compensation expense before income taxes of $17.5 million was primarily comprised of $12.5 million recorded for the cumulative expense of stock options which had a performance condition related to the Company's completion of its IPO in the 2014 fiscal year, the reversal of $2.9 million recorded in conjunction with the cancellation of Compuware PSAs, and $7.9 million of additional stock compensation expense that was recognized since the IPO.
As of March 31, 2016, total unrecognized compensation cost of $2.6 million, net of estimated forfeitures, related to nonvested equity awards granted is expected to be recognized over a weighted-average period of approximately 1.9 years. The following table summarizes the Company’s estimated future recognition of its unrecognized compensation cost related to stock awards as of March 31, 2016 (in thousands).
YEAR ENDING MARCH 31, | |||||||||||||||||||
Covisint Stock-Based Compensation Plan: | Total | 2017 | 2018 | 2019 | 2020 | ||||||||||||||
Stock Based Compensation | $2,645 | $1,631 | $760 | $235 | $19 | ||||||||||||||
61
8. RELATED PARTY TRANSACTIONS
Up until January 31, 2014, when Compuware divested its services business, the Company utilized services staff of Compuware to provide certain services to customers and to provide additional resources for research and development activities. These costs were included in “cost of revenue” and “research and development” as applicable. Compuware provided these services at market rates, and the Company recorded associated expense of $0.0 million, $0.0 million and $1.4 million for the years ended March 31, 2016, 2015 and 2014, respectively.
Prior to October 31, 2014, Covisint was a member of the Compuware Consolidated Group for tax purposes. Compuware Corporation, under a tax sharing agreement, used Covisint's tax losses and paid Covisint in cash for the tax losses utilized by the Compuware Consolidated Group. For fiscal 2015, Covisint was paid by Compuware based upon estimates of the losses utilized, which are subject to a true-up based upon filing actual federal and state income tax returns.
Certain transactions with Compuware were settled in cash prior to Covisint's spin-off from Compuware on October 31, 2014, and were reported in the consolidated statements of cash flows as financing activity. During the year ended March 31, 2015 Compuware made payments of approximately $2.8 million related to the net receivable as of March 31, 2014, and additional payments of approximately $7.6 million related to Compuware’s utilization of the Company’s tax loss and other tax attributes through the October 2014 Distribution. The payments from Compuware were offset by payments from the Company to Compuware of approximately $13.9 million.
On October 31, 2014, Covisint ceased being a subsidiary of Compuware Corporation as a result of October 2014 Distribution.
9. QUARTERLY FINANCIAL INFORMATION (UNAUDITED)
Quarterly financial information for the years ended March 31, 2016 and 2015 was as follows (in thousands, except for per share data):
Fiscal 2016 | |||||||||||||||||||
First Quarter | Second Quarter | Third Quarter | Fourth Quarter | Year | |||||||||||||||
Revenues | $18,482 | $18,393 | $19,162 | $19,987 | $76,024 | ||||||||||||||
Gross profit | 8,705 | 9,924 | 10,340 | 12,102 | 41,071 | ||||||||||||||
Operating loss | (6,521 | ) | (4,116 | ) | (4,023 | ) | (22 | ) | (14,682 | ) | |||||||||
Pre-tax loss | (6,519 | ) | (4,149 | ) | (4,020 | ) | (17 | ) | (14,705 | ) | |||||||||
Net loss | (6,586 | ) | (4,126 | ) | (4,072 | ) | (110 | ) | (14,894 | ) | |||||||||
Basic loss per share (1) | (0.17 | ) | (0.10 | ) | (0.10 | ) | 0.00 | (0.38 | ) | ||||||||||
Diluted loss per share (1) | (0.17 | ) | (0.10 | ) | (0.10 | ) | 0.00 | (0.38 | ) | ||||||||||
_____________________________________________________
(1) | Full year basic and diluted loss per share may not agree to the sum of the four quarters because each quarter is a separate calculation. |
Fiscal 2015 | |||||||||||||||||||
First Quarter | Second Quarter | Third Quarter | Fourth Quarter | Year | |||||||||||||||
Revenues | $21,587 | $21,735 | $21,755 | $23,457 | $88,534 | ||||||||||||||
Gross profit | 6,321 | 7,409 | 7,371 | 1,029 | 22,130 | ||||||||||||||
Operating loss (2) | (12,113 | ) | (7,288 | ) | (6,955 | ) | (12,163 | ) | (38,519 | ) | |||||||||
Pre-tax loss | (12,091 | ) | (7,271 | ) | (6,940 | ) | (12,148 | ) | (38,450 | ) | |||||||||
Net loss | (12,116 | ) | (7,304 | ) | (6,961 | ) | (12,181 | ) | (38,562 | ) | |||||||||
Basic loss per share (1) | (0.32 | ) | (0.19 | ) | (0.18 | ) | (0.32 | ) | (1.01 | ) | |||||||||
Diluted loss per share (1) | (0.32 | ) | (0.19 | ) | (0.18 | ) | (0.32 | ) | (1.01 | ) | |||||||||
_____________________________________________________
(1) | Full year basic and diluted loss per share may not agree to the sum of the four quarters because each quarter is a separate calculation. |
(2) Q4 2015 results include an $8.8 million impairment of capitalized software and customer relationship intangibles.
62
ITEM 9. CHANGES IN AND DISAGREEMENTS WITH ACCOUNTANTS AND FINANCIAL DISCLOSURE
Not Applicable.
ITEM 9A. CONTROLS AND PROCEDURES
Disclosure Controls and Procedures
Our management, with the participation of our Chief Executive Officer and Chief Financial Officer (our principal executive officer and principal financial officer, respectively), evaluated the effectiveness of our disclosure controls and procedures, as defined in Rules 13a-15(e) and 15d-15(e), promulgated under the Exchange Act, as of the end of the period covered by this report. Our disclosure controls and procedures are designed to provide reasonable assurance that information required to be disclosed in our reports that we file or submit under the Exchange Act is recorded, processed, summarized, and reported within the time periods specified in the SEC’s rules and forms, and that such information is accumulated and communicated to our management, including our Chief Executive Officer and Chief Financial Officer, as appropriate, to allow timely decisions regarding required disclosure. In designing and evaluating our disclosure controls and procedures, management recognized that any controls and procedures, no matter how well designed and operated, can provide only reasonable, not absolute, assurance of achieving their objectives. Based upon the evaluation of our disclosure controls and procedures as of March 31, 2016 our Chief Executive Officer and Chief Financial Officer concluded that, as of such date, our disclosure controls and procedures were effective at the reasonable assurance level.
Management’s Report on Internal Controls over Financial Reporting
Our management is responsible for establishing and maintaining adequate internal control over financial reporting, as defined in Rules 13a-15(f) and 15d-15(f) promulgated under the Exchange Act. Our internal control system was designed to provide reasonable assurance regarding the reliability of financial reporting and the preparation of financial statements. All internal control systems, no matter how well designed and operated, have inherent limitations. Therefore, even those internal control systems determined to be effective may not prevent or detect misstatements, and can provide only reasonable assurance with respect to financial statement preparation and presentation.
Under the supervision and with the participation of our management, including our principal executive officer and principal financial officer, we conducted an evaluation of the effectiveness of our internal control over financial reporting as of March 31, 2016 based on the framework described in Internal Control - Integrated Framework (2013) issued by the Committee of Sponsoring Organizations of the Treadway Commission (COSO). Based upon this evaluation, management concluded that our internal control over financial reporting was effective as of March 31, 2016.
Changes in Internal Control over Financial Reporting
No change in our internal control over financial reporting, as defined in Rules 13a-15(f) and 15d-15(f) under the Exchange Act, occurred during the fiscal quarter ended March 31, 2016 that has materially affected, or is reasonably likely to materially affect, our internal control over financial reporting.
ITEM 9B. OTHER INFORMATION
Not Applicable.
PART III
ITEM 10. DIRECTORS, EXECUTIVE OFFICERS AND CORPORATE GOVERNANCE
The information required by this item with respect to our executive officer is included in Item 1, “Business,” of this Annual Report. The remainder of the information required by this Item will be contained in our Proxy Statement under the captions “Corporate Governance” (excluding the Report of the Audit Committee), “Election of Directors” and “Other Matters - Section 16(a) Beneficial Ownership Reporting Compliance” and is incorporated herein by reference.
ITEM 11. EXECUTIVE COMPENSATION
The information required by this Item will be contained in our Proxy Statement under the caption “Compensation of Executive Officers” and “Corporate Governance” and is incorporated herein by reference.
63
ITEM 12. SECURITY OWNERSHIP OF CERTAIN BENEFICIAL OWNERS AND MANAGEMENT RELATED STOCKHOLDER MATTERS
The information required by this Item will be contained in our Proxy Statement under the caption “Security Ownership of Management and Major Shareholders” and is incorporated herein by reference.
ITEM 13. CERTAIN RELATIONSHIPS AND RELATED TRANSACTIONS, AND DIRECTOR INDEPENDENCE
The information required by this Item will be contained in the Proxy Statement under the caption “Other Matters - Related Party Transactions,” “Corporate Governance” and “Compensation of Executive Officers - Compensation Committee Interlocks and Insider Participation” and is incorporated herein by reference.
ITEM 14. PRINCIPAL ACCOUNTANT FEES AND SERVICES
The information required by this Item will be contained in our Proxy Statement under the caption “Item No. 2 - Ratification of Appointment of the Independent Registered Public Accounting Firm” and is incorporated herein by reference.
PART IV
ITEM 15. EXHIBITS AND FINANCIAL STATEMENT SCHEDULES
(a) Documents filed as part of this report.
1. Consolidated Financial Statements
The following consolidated financial statements of the Company and its subsidiaries are filed herewith:
Page | |
Reports of Independent Registered Public Accounting Firm | |
Consolidated Balance Sheets as of March 31, 2016 and 2015 | |
Consolidated Statements of Comprehensive Loss for each of the years ended March 31, 2016, 2015, and 2014 | |
Consolidated Statements of Shareholders’ Equity for each of the years ended March 31, 2016, 2015, and 2014 | |
Consolidated Statements of Cash Flows for each of the years ended March 31, 2016, 2015, and 2014 | |
Notes to Consolidated Financial Statements | |
2. Financial Statement Schedules
All financial statement schedules are omitted as the required information is not applicable or the information is presented in the consolidated financial statements or related notes.
3. | Exhibits |
The exhibits filed in response to Item 601 of Regulation S-K are listed in the Exhibit Index attached to this Annual Report.
64
SIGNATURES
Pursuant to the requirements of Sections 13 or 15(d) of the Securities Exchange Act of 1934, the Registrant has duly caused this Annual Report on Form 10-K to be signed on its behalf by the undersigned, thereunto duly authorized, in the City of Southfield, State of Michigan, on June 6, 2016.
COVISINT CORPORATION | ||
Date: | June 6, 2016 | By: /s/ Samuel M. Inman, III |
Samuel M. Inman, III | ||
Chief Executive Officer | ||
Principal Executive Officer | ||
Pursuant to the requirements of the Securities Exchange Act of 1934, this report has been signed by the following persons in the capacities and on the dates indicated.
Signature | Title | Date |
/s/ Samuel M. Inman, III | President and Chief Executive | June 6, 2016 |
Samuel M. Inman, III | Officer and Director (Principal Executive Officer) | |
/s/ Enrico Digirolamo | Chief Financial Officer | June 6, 2016 |
Enrico Digirolamo | (Principal Financial Officer and Principal Accounting Officer) | |
/s/ Homaira Akbari | Director | June 6, 2016 |
Homaira Akbari | ||
/s/ Bernard M. Goldsmith | Director | June 6, 2016 |
Bernard M. Goldsmith | ||
/s/ William O. Grabe | Director | June 6, 2016 |
William O. Grabe | ||
/s/ Lawrence David Hansen | Director | June 6, 2016 |
Lawrence David Hansen | ||
/s/ Philip F. Lay | Director | June 6, 2016 |
Philip F. Lay | ||
EXHIBIT INDEX
65
Exhibit Number | Description of Document (Subject to Update) | |
3.1 | Amended and Restated Articles of Incorporation (1) | |
3.2 | Amended and Restated Bylaws, dated December 14, 2016 (2) | |
10.1 | Second Amended and Restated Master Separation Agreement (3) | |
10.2 | Termination of Intercompany Agreements (3) | |
10.3 | Second Amended and Restated Tax Sharing Agreement (3) | |
10.4 | Contribution Agreement (1) | |
*10.5 | 2009 Long Term Incentive Plan (1) | |
*10.6 | First Amendment to 2009 Long-Term Incentive Plan (4) | |
*10.7 | Second Amendment to 2009 Long-Term Incentive Plan (5) | |
*10.8 | Form of Option Agreement (1) | |
*10.8 | Amendment No. 1 to Option Agreement (1) | |
*10.10 | Corporate Short-Term Incentive Plan (6) | |
*10.11 | Severance Agreement between Covisint Corporation and Samuel M. Inman, III (7) | |
*10.12 | Stock Option Agreement between Covisint Corporation and Samuel M. Inman, III (7) | |
*10.13 | Restricted Stock Unit Award Agreement between Covisint Corporation and Samuel M. Inman, III (7) | |
*10.14 | Director Compensation (8) | |
*10.15 | Form Restricted Stock Unit Award Agreement for Directors (8) | |
*10.16 | Form Severance Agreement (9) | |
10.17 | Lease - Travelers Tower II, Southfield, Michigan, dated December 18, 2014 (8) | |
10.18 | Standard Multi-Tenant Office Lease, San Francisco, dated February 19, 2015(6) | |
†10.19 | Software License and Hosting Services Agreement dated November 19, 2013 by and between Covisint Corporation and Cisco Systems, Inc. (10) | |
†10.20 | Amendment No. 1 to Software License and Hosting Services Agreement dated December 1, 2014 by and between Covisint Corporation and Cisco Systems, Inc. (10) | |
†10.21 | Statement of Work dated October 1, 2014 by and between Covisint Corporation and Cisco Systems, Inc. (10) | |
†10.22 | Statement of Work dated January 1, 2015 by and between Covisint Corporation and Cisco Systems, Inc. (10) | |
†10.23 | Statement of Work dated February 1, 2015 by and between Covisint Corporation and Cisco Systems, Inc. (10) | |
†10.24 | Statement of Work dated September 29, 2015 by and between Covisint Corporation and Cisco Systems, Inc. (10) | |
†10.25 | Statement of Work dated September 30, 2015 by and between Covisint Corporation and Cisco Systems,Inc. (10) | |
†10.26 | Statement of Work dated November 5, 2015 by and between Covisint Corporation and Cisco Systems, Inc. (10) | |
#10.27 | Letter Severance Agreement between Covisint Corporation and Michael K. Keddington dated May 19, 2016 | |
21.1 | Subsidiaries (1) | |
#23.1 | Consent of Independent Registered Public Accounting Firm - Grant Thornton LLP | |
#23.2 | Consent of Independent Registered Public Accounting Firm - Deloitte & Touche LLP | |
#31.1 | Certification of Chief Executive Officer pursuant to Rule 13a-14(a) of the Securities Exchange Act | |
#31.2 | Certification of Chief Financial Officer pursuant to Rule 13a-14(a) of the Securities Exchange Act | |
#32.1 | Certification pursuant to 18 U.S.C. Section 1350 and Rule 13a-14(b) of the Securities Exchange Act | |
101.INS | XBRL Instance Document | |
101.SCH | XBRL Taxonomy Extension Schema Document | |
101.CAL | XBRL Taxonomy Extension Calculation Linkbase Document | |
101.DEF | XBRL Taxonomy Extension Definition Linkbase Document | |
101.LAB | XBRL Taxonomy Extension Label Linkbase Document | |
101.PRE | XBRL Taxonomy Extension Presentation Linkbase Document | |
66
*A management contract or compensatory plan or arrangement.
# Filed herewith
† Confidential treatment has been granted for certain provisions of this Exhibit pursuant to Rule 24b-2 promulgated under the Securities and Exchange Act of 1934, as amended
(1) Incorporated herein by reference to the Registrant’s Registration Statement on Form S-1, as amended (Registration No. 333-188603).
(2) Incorporated herein by reference to the Registrant’s Current Report on Form 8-K, filed on December 16, 2015.
(3) Incorporated herein by reference to the Registrant’s Quarterly Report on Form 10-Q for the fiscal quarter ended September 30, 2014.
(4) Incorporated herein by reference to the Registrant’s Current Report on Form 8-K, filed on January 6, 2014.
(5) Incorporated herein by reference to the Registrant’s Current Report on Form 8-K, as amended, filed on May 13, 2014.
(6) Incorporated herein by reference to the Registrant’s Annual Report on Form 10-K for the fiscal year ended March 31, 2015.
(7) Incorporated herein by reference to the Registrant’s Current Report on Form 8-K, filed on July 7, 2014.
(8) Incorporated herein by reference to the Registrant’s Quarterly Report on Form 10-Q for the fiscal quarter ended December 31, 2014.
(9) Incorporated herein by reference to the Registrant’s Quarterly Report on Form 10-Q for the fiscal quarter ended June 30, 2015.
(10) Incorporated herein by reference to the Registrant’s Quarterly Report on Form 10-Q for the fiscal quarter ended September 30, 2015.
67