Attached files
| file | filename |
|---|---|
| 8-K - 8-K - STORE CAPITAL Corp | a15-3934_18k.htm |
Exhibit 99.1
|
|
The LEADER in Middle Market Real Estate Capital Solutions S|T|O|R|E CAPITAL |
|
|
S|T|O|R|E Overview The leader in middle market net-lease solutions: management team has a >30-year track record and has originated $12 billion of investments in STORE assets Target a $2 trillion market for single-tenant “profit center” real estate: $5.6 billion pipeline1 of identified acquisition opportunities One of the fastest growing net-lease REITs in the US: $2.5 billion invested since its organization in 2011 High quality portfolio subject to long-term leases: S|T|O|R|E believes that its its average contract risk is equivalent to investment grade corporate risk (avg. internal S|T|O|R|E rating of Baa3/BBB-) Efficient capital structure: Access to A+ rated debt conduit, together with a low dividend payout ratio Scalable platform positioned for growth: Targeting market-leading external growth, together with internal growth S|T|O|R|E is Single Tenant Operational Real Estate S|T|O|R|E CAPITAL Data as of September 30, 2014. 1 See slide7 for more information about S|T|O|R|E’s pipeline, including its composition. S|T|O|R|E may never acquire properties in its pipeline for a variety of reasons. Introduction Core Competencies Portfolio Financial Management Conclusion |
|
|
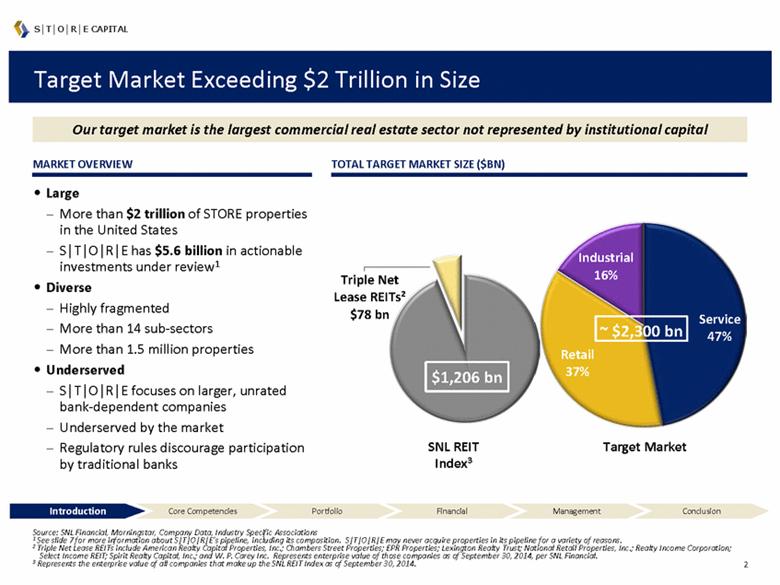
SNL REIT Index3 Target Market Exceeding $2 Trillion in Size Large More than $2 trillion of STORE properties in the United States S|T|O|R|E has $5.6 billion in actionable investments under review1 Diverse Highly fragmented More than 14 sub-sectors More than 1.5 million properties Underserved S|T|O|R|E focuses on larger, unrated bank-dependent companies Underserved by the market Regulatory rules discourage participation by traditional banks Our target market is the largest commercial real estate sector not represented by institutional capital Source: SNL Financial, Morningstar, Company Data, Industry Specific Associations 1 See slide 7 for more information about S|T|O|R|E’s pipeline, including its composition. S|T|O|R|E may never acquire properties in its pipeline for a variety of reasons. 2 Triple Net Lease REITs include American Realty Capital Properties, Inc.; Chambers Street Properties; EPR Properties; Lexington Realty Trust; National Retail Properties, Inc.; Realty Income Corporation; Select Income REIT; Spirit Realty Capital, Inc.; and W. P. Carey Inc. Represents enterprise value of those companies as of September 30, 2014, per SNL Financial. 3 Represents the enterprise value of all companies that make up the SNL REIT Index as of September 30, 2014. S|T|O|R|E CAPITAL TOTAL TARGET MARKET SIZE ($BN) Target Market MARKET OVERVIEW Introduction Core Competencies Portfolio Financial Management Conclusion $1,206 bn Triple Net Lease REITs² $78 bn Industrial 16% Retail 37% Service 47% ~$2,300 bn |
|
|
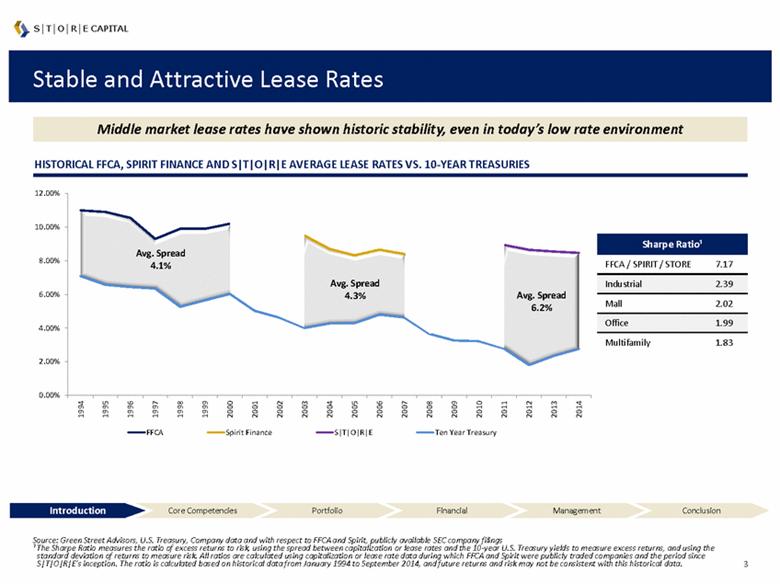
Stable and Attractive Lease Rates Middle market lease rates have shown historic stability, even in today’s low rate environment HISTORICAL FFCA, SPIRIT FINANCE AND S|T|O|R|E AVERAGE LEASE RATES VS. 10-YEAR TREASURIES Source: Green Street Advisors, U.S. Treasury, Company data and with respect to FFCA and Spirit, publicly available SEC company filings ¹ The Sharpe Ratio measures the ratio of excess returns to risk, using the spread between capitalization or lease rates and the 10-year U.S. Treasury yields to measure excess returns, and using the standard deviation of returns to measure risk. All ratios are calculated using capitalization or lease rate data during which FFCA and Spirit were publicly traded companies and the period since S|T|O|R|E’s inception. The ratio is calculated based on historical data from January 1994 to September 2014, and future returns and risk may not be consistent with this historical data. S|T|O|R|E CAPITAL Sharpe Ratio¹ FFCA / SPIRIT / STORE 7.17 Industrial 2.39 Mall 2.02 Office 1.99 Multifamily 1.83 Introduction Core Competencies Portfolio Financial Management Conclusion 0.00% 2.00% 4.00% 6.00% 8.00% 10.00% 12.00% 1994 1995 1996 1997 1998 1999 2000 2001 2002 2003 2004 2005 2006 2007 2008 2009 2010 2011 2012 2013 2014 FFCA Spirit Finance S|T|O|R|E Ten Year Treasury Avg. Spread 4.3% Avg. Spread 6.2% Avg. Spread 4.1% |
|
|
Targeting Investment Value Creation Through Core Competencies 2 4 5 1 S|T|O|R|E CAPITAL Introduction Core Competencies Portfolio Financial Management Conclusion 3 Superior origination Proven investment underwriting processes Superior documentation and contract creation Proactive portfolio manadement approach Flexible, low cost capital markets strategy |
|
|
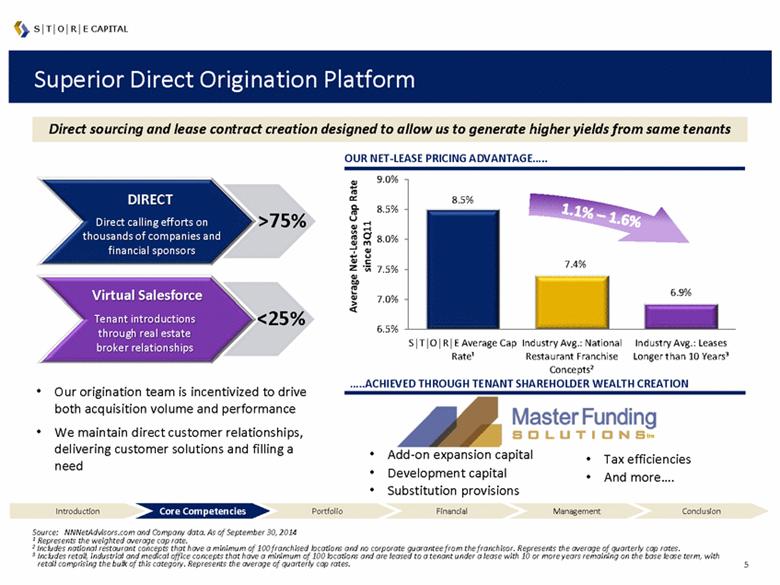
Superior Direct Origination Platform Our origination team is incentivized to drive both acquisition volume and performance We maintain direct customer relationships, delivering customer solutions and filling a need Direct sourcing and lease contract creation designed to allow us to generate higher yields from same tenants Source: NNNetAdvisors.com and Company data. As of September 30, 2014 1 Represents the weighted average cap rate. 2 Includes national restaurant concepts that have a minimum of 100 franchised locations and no corporate guarantee from the franchisor. Represents the average of quarterly cap rates. 3 Includes retail, industrial and medical office concepts that have a minimum of 100 locations and are leased to a tenant under a lease with 10 or more years remaining on the base lease term, with retail comprising the bulk of this category. Represents the average of quarterly cap rates. S|T|O|R|E CAPITAL Direct calling efforts on thousands of companies and financial sponsors DIRECT Tenant introductions through real estate broker relationships Virtual Salesforce >75% <25% tm Introduction Core Competencies Portfolio Financial Management Conclusion OUR NET-LEASE PRICING ADVANTAGE 1.1% – 1.6% Add-on expansion capital Development capital Substitution provisions Tax efficiencies And more..... |
|
|
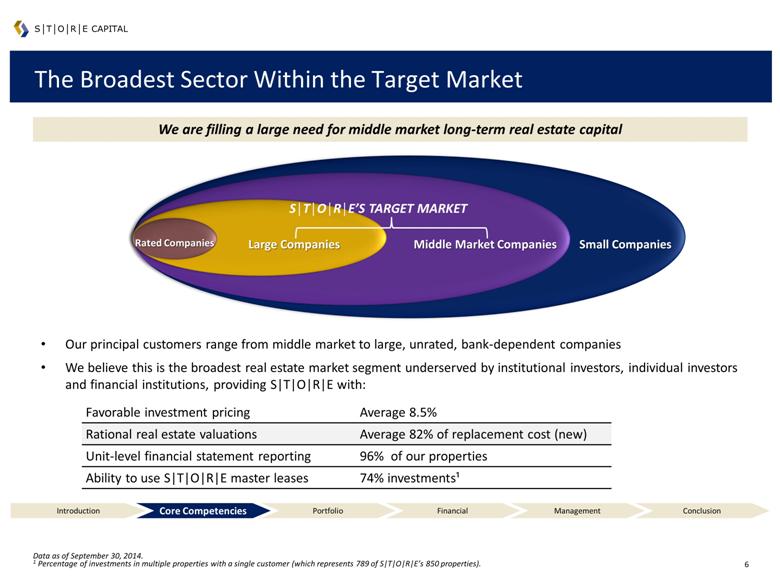
The Broadest Sector Within the Target Market We are filling a large need for middle market long-term real estate capital Middle Market Companies Large Companies Rated Companies Our principal customers range from middle market to large, unrated, bank-dependent companies We believe this is the broadest real estate market segment underserved by institutional investors, individual investors and financial institutions, providing S|T|O|R|E with: S|T|O|R|E CAPITAL S|T|O|R|E’S TARGET MARKET Data as of September 30, 2014. 1 Percentage of investments in multiple properties with a single customer (which represents 789 of S|T|O|R|E’s 850 properties). Favorable investment pricing Average 8.5% Rational real estate valuations Average 82% of replacement cost (new) Unit-level financial statement reporting 96% of our properties Ability to use S|T|O|R|E master leases 74% investments¹ Introduction Core Competencies Portfolio Financial Management Conclusion Small Companies |
|
|
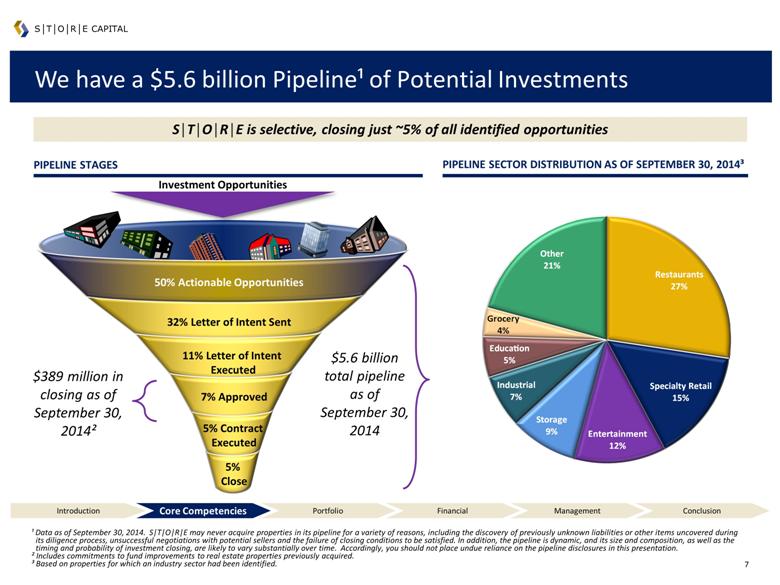
We have a $5.6 billion Pipeline¹ of Potential Investments ¹ Data as of September 30, 2014. S|T|O|R|E may never acquire properties in its pipeline for a variety of reasons, including the discovery of previously unknown liabilities or other items uncovered during its diligence process, unsuccessful negotiations with potential sellers and the failure of closing conditions to be satisfied. In addition, the pipeline is dynamic, and its size and composition, as well as the timing and probability of investment closing, are likely to vary substantially over time. Accordingly, you should not place undue reliance on the pipeline disclosures in this presentation. ² Includes commitments to fund improvements to real estate properties previously acquired. ³ Based on properties for which an industry sector had been identified. PIPELINE STAGES S|T|O|R|E CAPITAL $389 million in closing as of September 30, 2014² $5.6 billion total pipeline as of September 30, 2014 S|T|O|R|E is selective, closing just ~5% of all identified opportunities Investment Opportunities 32% Letter of Intent Sent 11% Letter of Intent Executed 7% Approved 5% Contract Executed 5% Close 50% Actionable Opportunities PIPELINE SECTOR DISTRIBUTION AS OF SEPTEMBER 30, 2014³ Introduction Core Competencies Portfolio Financial Management Conclusion ?Restaurants 27% ?Specialty Retail 15% ?Entertainment 12% ?Storage 9% ?Industrial 7% ?Education 5% ?Grocery 4% ?Other 21% |
|
|
Time-Tested Underwriting Approach S|T|O|R|E’s bottom-up approach to underwriting has remained consistent over the past 30 years Unit-Level Profitability Each asset in which we invest has its own discrete profit and loss statement, which is our primary source of payment Corporate Credit Should the assets we invest in fail to produce profits, then payments are received from cash flows from other corporate assets Underlying Real Estate Value S|T|O|R|E CAPITAL while our focus has become more refined based on several studies of years of empirical data which looked to find the highest predictors of default and recovery Property Sale or Re-let 2000 2012 We use a sophisticated, data-driven underwriting approach Seminal FFCA fixed income research portfolio studies 1997 & Spirit Finance performance Sector research, management evaluation and contract documentation Introduction Core Competencies Portfolio Financial Management Conclusion |
|
|
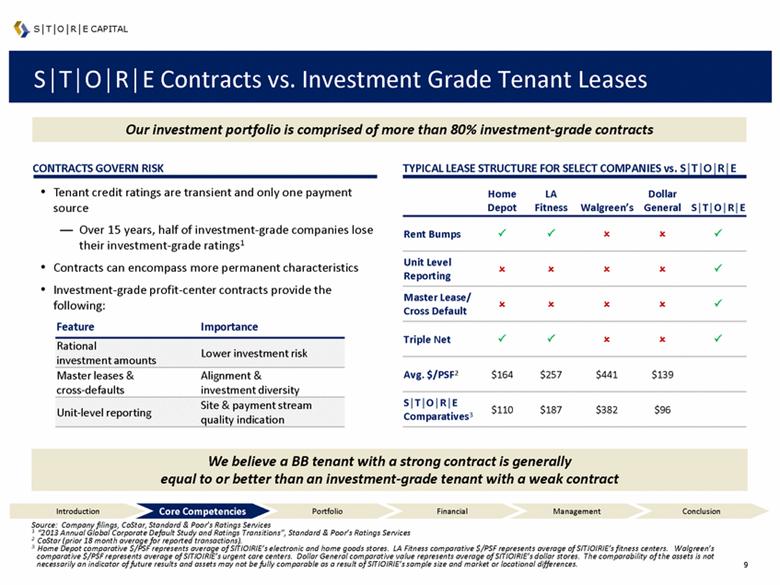
S|T|O|R|E Contracts vs. Investment Grade Tenant Leases S|T|O|R|E CAPITAL TYPICAL LEASE STRUCTURE FOR SELECT COMPANIES vs. S|T|O|R|E Tenant credit ratings are transient and only one payment source Over 15 years, half of investment-grade companies lose their investment-grade ratings1 Contracts can encompass more permanent characteristics Investment-grade profit-center contracts provide the following: CONTRACTS GOVERN RISK Source: Company filings, CoStar, Standard & Poor’s Ratings Services 1 “2013 Annual Global Corporate Default Study and Ratings Transitions”, Standard & Poor’s Ratings Services 2 CoStar (prior 18 month average for reported transactions). 3 Home Depot comparative $/PSF represents average of SITIOIRIE’s electronic and home goods stores. LA Fitness comparative $/PSF represents average of SITIOIRIE’s fitness centers. Walgreen’s comparative $/PSF represents average of SITIOIRIE’s urgent care centers. Dollar General comparative value represents average of SITIOIRIE’s dollar stores. The comparability of the assets is not necessarily an indicator of future results and assets may not be fully comparable as a result of SITIOIRIE’s sample size and market or locational differences. Our investment portfolio is comprised of more than 80% investment-grade contracts We believe a BB tenant with a strong contract is generally equal to or better than an investment-grade tenant with a weak contract Introduction Core Competencies Portfolio Financial Management Conclusion Home Depot LA Fitness Walgreen’s Dollar General S|T|O|R|E Rent Bumps Unit Level Reporting Master Lease/ Cross Default Triple Net Avg. $/PSF2 $164 $257 $441 $139 S|T|O|R|E Comparatives3 $110 $187 $382 $96 Feature Importance Rational investment amounts Lower investment risk Master leases & cross-defaults Alignment & investment diversity Unit-level reporting Site & payment stream quality indication |
|
|
Proprietary and Intensive Credit Monitoring System A fully performing portfolio with an average STORE Score rating of Baa3 EXPECTED DEFAULT FREQUENCY (“EDF”) & STORE SCORE EQUIVALENT RATINGS Data as of September 30, 2014. S|T|O|R|E CAPITAL Introduction Core Competencies Portfolio Financial Management Conclusion Portfolio Weighted Average EDF (Tenant Risk): 1.39% (Ba2/BB) Median EDF Median STORE Score Portfolio Weighted Average STORE Score (Contract Risk): 0.50% (Baa3/BBB-) More than 80% of investments have STORE Score (Baa3/BBB-) |
|
|
Master Funding Unsecured Bond Secured Mortgage Greater Access to Capital at a Lower Cost ü û ü Flexible Asset Management ü ü û Differentiated Investor Base ü û û Ability to Re-Lever ü ü û Portability ü¹ û ü Prudent Leverage Philosophy and Access to A+ Rated Borrowings Source: SEC company filings. Data as of September 30, 2014. 1 Subject to certain conditions being met. 2 Weighted average figures calculated using reported data. Where a range of maturities is reported for a given tranche of debt, calculation uses latest maturity specified for that tranche. Cost of fixed rate debt includes preferred equity. Go long Be judicious Ladder debt maturities Be mindful of mean reversion Use the three means of interest rate risk mitigation Lease escalations Free cash flow levels Secured debt principal paydowns STORE Master Funding is A+ rated and offers more flexibility than unsecured debt OUR COST OF FIXED RATE DEBT VS. KEY PEERS OUR BORROWING SPREAD PHILOSOPHY ADVANTAGES OF OUR MASTER FUNDING PROGRAM S|T|O|R|E CAPITAL OUR OVERALL DEBT MATURITY VS. KEY PEERS Introduction Core Competencies Portfolio Financial Management Conclusion 7.1 Years 6.6 Years 6.8 Years S|T|O|R|E National Retail Properties, Inc.² Realty Income Corporation² national Retail Properties, Inc.2 Realty Income Corporation2 4.9% 5.1% 4.9% |
|
|
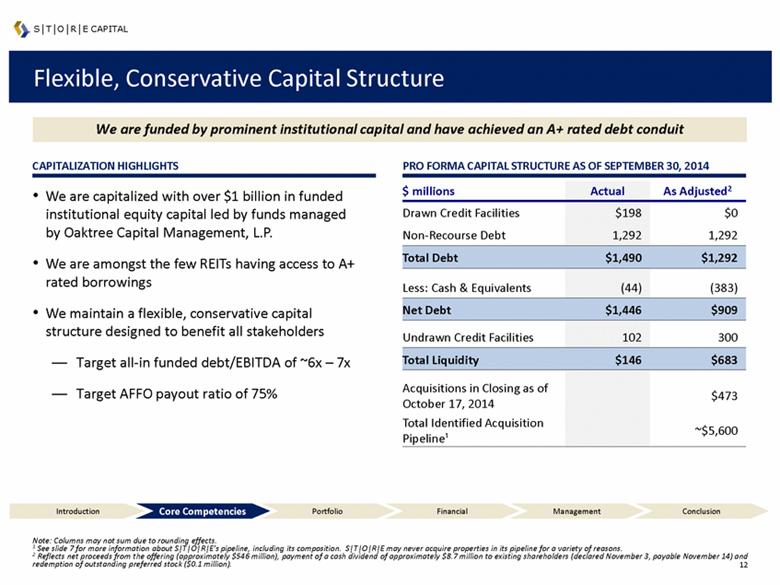
Flexible, Conservative Capital Structure CAPITALIZATION HIGHLIGHTS PRO FORMA CAPITAL STRUCTURE AS OF SEPTEMBER 30, 2014 We are capitalized with over $1 billion in funded institutional equity capital led by funds managed by Oaktree Capital Management, L.P. We are amongst the few REITs having access to A+ rated borrowings We maintain a flexible, conservative capital structure designed to benefit all stakeholders Target all-in funded debt/EBITDA of ~6x – 7x Target AFFO payout ratio of 75% S|T|O|R|E CAPITAL We are funded by prominent institutional capital and have achieved an A+ rated debt conduit Note: Columns may not sum due to rounding effects. 1 See slide 7 for more information about S|T|O|R|E’s pipeline, including its composition. S|T|O|R|E may never acquire properties in its pipeline for a variety of reasons. 2 Reflects net proceeds from the offering (approximately $546 million), payment of a cash dividend of approximately $8.7 million to existing shareholders (declared November 3, payable November 14) and redemption of outstanding preferred stock ($0.1 million). Introduction Core Competencies Portfolio Financial Management Conclusion $ millions Drawn Credit Facilities Non-Recourse Debt Total Debt Less: Cash & Equivalents Net Debt Undrawn Credit Facilities Total Liquidity Acquisitions in Closing as of October 17, 2014 Total Identified Acquisition Pipeline1 Actual $198 1,292 $1,490 (44) $1,446 102 $146 As Adjusted2 $0 1,292 $1,292 (383) $909 300 $683 $473 ~$5,600 |
|
|
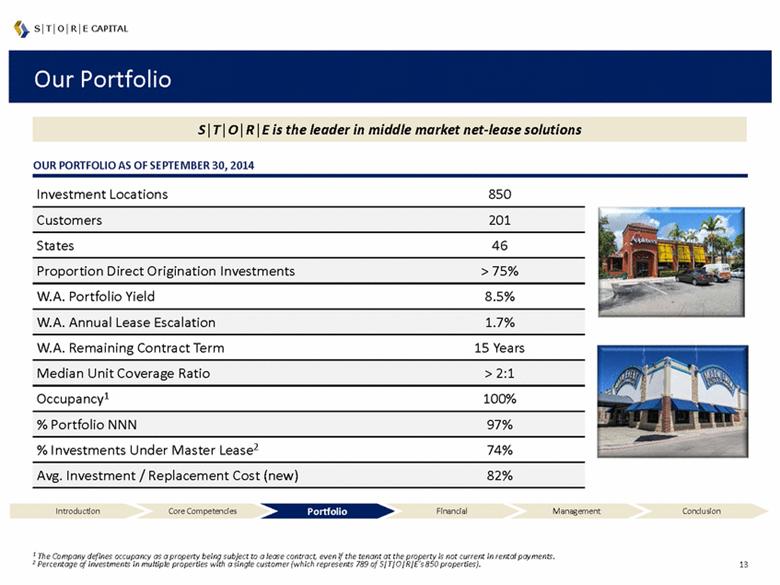
Our Portfolio S|T|O|R|E is the leader in middle market net-lease solutions S|T|O|R|E CAPITAL OUR PORTFOLIO AS OF SEPTEMBER 30, 2014 Investment Locations 850 Customers 201 States 46 Proportion Direct Origination Investments > 75% W.A. Portfolio Yield 8.5% W.A. Annual Lease Escalation 1.7% W.A. Remaining Contract Term 15 Years Median Unit Coverage Ratio > 2:1 Occupancy1 100% % Portfolio NNN 97% % Investments Under Master Lease2 74% Avg. Investment / Replacement Cost (new) 82% 1 The Company defines occupancy as a property being subject to a lease contract, even if the tenant at the property is not current in rental payments. 2 Percentage of investments in multiple properties with a single customer (which represents 789 of S|T|O|R|E’s 850 properties). Introduction Core Competencies Portfolio Financial Management Conclusion |
|
|
High Quality Portfolio MOST DIVERSIFIED TENANT BASE Source: Latest publicly available quarterly financial statements as of November 4, 2014. 1 American Realty Capital Properties, Inc portfolio statistics pro forma for the acquisition of Red Lobster and the sale of its multi-tenant portfolio. 2 Includes: American Realty Capital Properties, Inc.; Chambers Street Properties; EPR Properties; Lexington Realty Trust; Spirit Realty Capital, Inc.; and W. P. Carey Inc. Our portfolio has superior term and diversification over market comparables S|T|O|R|E CAPITAL (weighted average lease term in years) LONGEST LEASE TERM LOWEST NEAR-TERM RENEWAL EXPOSURE (% top 5 tenants, based on current annual rent) (% expirations by period, based on current annual rent) ¹ ¹ Introduction Core Competencies Portfolio Financial Management Conclusion 51% 26% 25% 24% 23% 22% 21% 17% 14% EPR SRC O CSG NNN ARCP WPC LXP STORE 22% 34% 44% 12% 33% 55% 13% 21% 65% 1% 7% 92% 0 – 5 6 – 10 10+ S|T|O|R|E National Retail Properties, Inc. Realty Income Corporation Net Lease Peers² |
|
|
Diversified Across Geographies¹ Now in 46 states, with expected national distribution S|T|O|R|E CAPITAL 1 Shown as of September 30, 2014, by % of annualized base rent and interest. Introduction Core Competencies Portfolio Financial Management Conclusion |
|
|
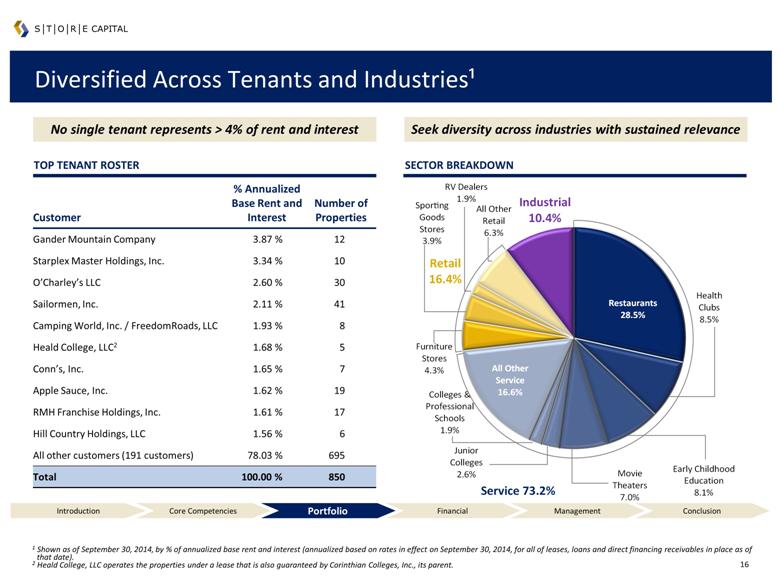
Customer % Annualized Base Rent and Interest Number of Properties Gander Mountain Company 3.87 % 12 Starplex Master Holdings, Inc. 3.34 % 10 O’Charley’s LLC 2.60 % 30 Sailormen, Inc. 2.11 % 41 Camping World, Inc. / FreedomRoads, LLC 1.93 % 8 Heald College, LLC2 1.68 % 5 Conn’s, Inc. 1.65 % 7 Apple Sauce, Inc. 1.62 % 19 RMH Franchise Holdings, Inc. 1.61 % 17 Hill Country Holdings, LLC 1.56 % 6 All other customers (191 customers) 78.03 % 695 Total 100.00 % 850 Diversified Across Tenants and Industries¹ 1 Shown as of September 30, 2014, by % of annualized base rent and interest (annualized based on rates in effect on September 30, 2014, for all of leases, loans and direct financing receivables in place as of that date). 2 Heald College, LLC operates the properties under a lease that is also guaranteed by Corinthian Colleges, Inc., its parent. No single tenant represents > 4% of rent and interest TOP TENANT ROSTER SECTOR BREAKDOWN Seek diversity across industries with sustained relevance S|T|O|R|E CAPITAL Introduction Core Competencies Portfolio Financial Management Conclusion ?Restaurants 28.5% ?Health Clubs 8.5% ?Early Childhood Education 8.1% ?Movie Theaters 7.0% ?Junior Colleges 2.6% ?Colleges & Professional Schools 1.9% ?All Other Service 16.6% ?Furniture Stores 4.3% ?Sporting Goods Stores 3.9% ?RV Dealers 1.9% ?All Other Retail 6.3% ?Industrial 10.4% Service 73.2% Retail 16.4% |
|
|
S|T|O|R|E’s Performance ADJUSTED FUNDS FROM OPERATIONS (AFFO)1 ($MM) PORTFOLIO WEIGHTED AVERAGE RENTAL & LOAN INTEREST RATE NET OPERATING INCOME ($MM) ANNUAL ACQUISITIONS2 ($MM) We have built a rapidly growing REIT with a highly scalable platform S|T|O|R|E CAPITAL 1 Excludes discontinued operations. 2 Represents acquisitions of real estate and investment in loans receivable. Introduction Core Competencies Portfolio Financial Management Conclusion $4 $41 $109 $76 $135 $0 $40 $80 $120 $160 FY11A FY12A FY13A Q1 - Q3 13A Q1 - Q3 14A $278 $681 $837 $551 $847 $0 $200 $400 $600 $800 $1000 FY11A FY12A FY13A Q1 - Q3 13A Q1 - Q3 14A $(0) $22 $62 $43 $76 $(20) $20 $60 $100 FY11A FY12A FY13A Q1 - Q3 13A Q1 - Q3 14A |
|
|
Our Dividend Policy and Growth DIVIDEND POLICY S|T|O|R|E CAPITAL We paid a pro rata 4Q14 dividend that equates to a pro forma, annualized dividend of $1.00 per share Represents a 4.35% yield based on a $23 share price as of February 5, 2015 Target future AFFO payout ratio of 75% EXPECTED SOURCES OF AFFO GROWTH Internal Driven by reinvestment of excess cash flow post dividend payments and debt amortization, lease escalations and operating efficiencies External External growth is expected to be the main driver of AFFO growth Driven by new investment and financing activities We have increased our pipeline1 of investments from approximately $2 billion as of December 2011 to approximately $6 billion today Introduction Core Competencies Portfolio Financial Management Conclusion 1 See slide 7 for more information about S|T|O|R|E’s pipeline, including its composition. S|T|O|R|E may never acquire properties in its pipeline for a variety of reasons. |
|
|
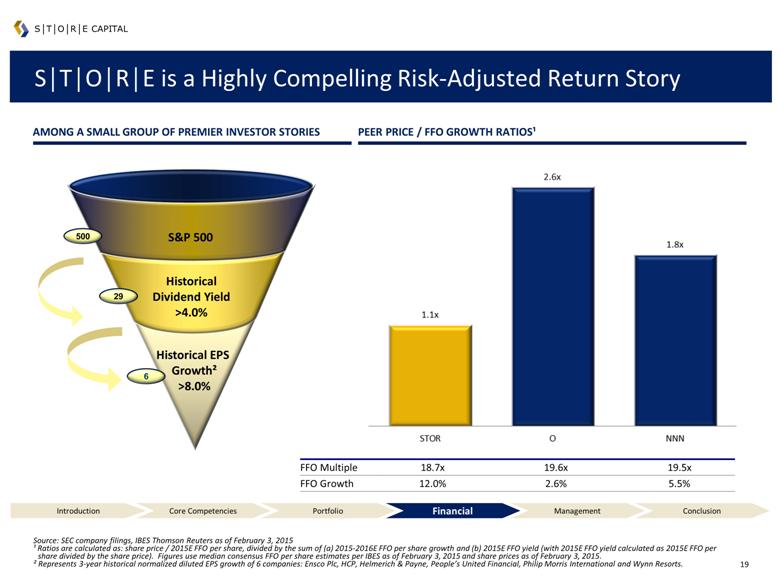
FFO Multiple 18.7x 19.6x 19.5x FFO Growth 12.0% 2.6% 5.5% Historical EPS Growth² >8.0% 6 29 Historical Dividend Yield >4.0% S|T|O|R|E is a Highly Compelling Risk-Adjusted Return Story S|T|O|R|E CAPITAL Source: SEC company filings, IBES Thomson Reuters as of February 3, 2015 ¹ Ratios are calculated as: share price / 2015E FFO per share, divided by the sum of (a) 2015-2016E FFO per share growth and (b) 2015E FFO yield (with 2015E FFO yield calculated as 2015E FFO per share divided by the share price). Figures use median consensus FFO per share estimates per IBES as of February 3, 2015 and share prices as of February 3, 2015. ² Represents 3-year historical normalized diluted EPS growth of 6 companies: Ensco Plc, HCP, Helmerich & Payne, People’s United Financial, Philip Morris International and Wynn Resorts. S&P 500 500 AMONG A SMALL GROUP OF PREMIER INVESTOR STORIES PEER PRICE / FFO GROWTH RATIOS¹ Introduction Core Competencies Portfolio Financial Management Conclusion |
|
|
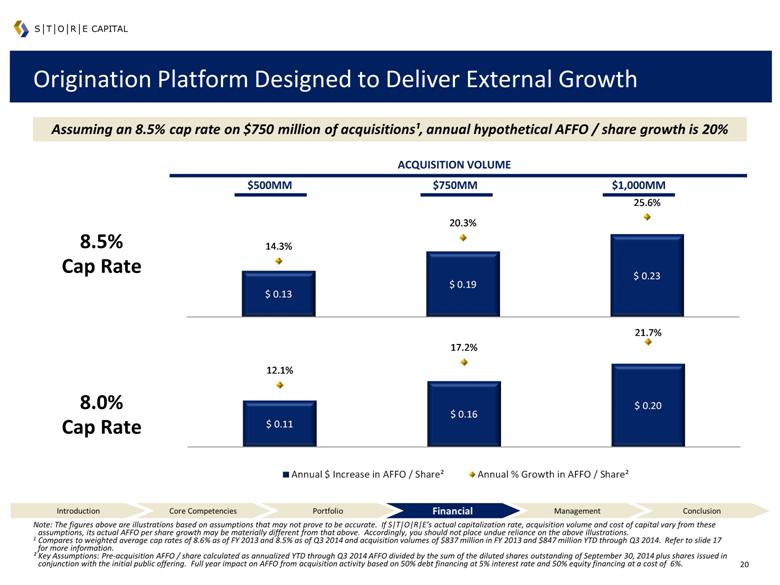
Note: The figures above are illustrations based on assumptions that may not prove to be accurate. If S|T|O|R|E’s actual capitalization rate, acquisition volume and cost of capital vary from these assumptions, its actual AFFO per share growth may be materially different from that above. Accordingly, you should not place undue reliance on the above illustrations. 1 Compares to weighted average cap rates of 8.6% as of FY 2013 and 8.5% as of Q3 2014 and acquisition volumes of $837 million in FY 2013 and $847 million YTD through Q3 2014. Refer to slide 17 for more information. ² Key Assumptions: Pre-acquisition AFFO / share calculated as annualized YTD through Q3 2014 AFFO divided by the sum of the diluted shares outstanding of September 30, 2014 plus shares issued in conjunction with the initial public offering. Full year impact on AFFO from acquisition activity based on 50% debt financing at 5% interest rate and 50% equity financing at a cost of 6%. Origination Platform Designed to Deliver External Growth ACQUISITION VOLUME S|T|O|R|E CAPITAL Assuming an 8.5% cap rate on $750 million of acquisitions¹, annual hypothetical AFFO / share growth is 20% $500MM $750MM $1,000MM 8.5% Cap Rate 8.0% Cap Rate Introduction Core Competencies Portfolio Financial Management Conclusion $ 0.13 $ 0.19 $ 0.23 14.3% 20.3% 25.6% $ 0.11 $ 0.16 $ 0.20 12.1% 17.2% 21.7% |
|
|
Experienced Leadership Team with a Proven Track Record >30 year track record $12 billion invested in 8,000+ STORE assets $4 billion raised in investor capital $6 billion made in investor distributions Investor returns in management’s prior investment vehicles have outperformed benchmarks1 Guided the formation, and ultimate sale, of two successful NYSE-listed REITs: Franchise Finance Corporation of America (“FFCA”)(NYSE: FFA) and Spirit Finance (NYSE: SFC) 1981 – 2014 ANNUAL INVESTMENT ACTIVITY ($MM)1 S|T|O|R|E CAPITAL We believe we have originated more single-tenant operational real estate investments than any other market participant FFCA Spirit Finance 17 Privately Traded Funds (16 SEC Registered) S|T|O|R|E Spirit Finance sold FFCA sold Introduction Core Competencies Portfolio Financial Management Conclusion 1 Prior performance is not necessarily an indicator of future performance, and S|T||O|R|E’s future returns may not exceed industry benchmarks. |
|
|
Experienced Leadership Team with a Proven Track Record ANNUALIZED TOTAL RETURNS OF SPIRIT FINANCE S|T|O|R|E’s leadership team has consistently outperformed ANNUALIZED TOTAL RETURNS OF FFCA S|T|O|R|E CAPITAL Note: Represents the total annualized return of both FFCA and Spirit Finance relative to both the S&P 500 and MSCI US REIT Index over the applicable time periods (from IPO to de-listing period of June 1994 to August 2001 for FFCA and December 2004 to August 2007 for Spirit, and two years prior to-delisting period of August 1999 to August 2001 for FFCA and August 2005 to August 2007 for Spirit. The past performance data presented above is not an indicator of S|T|O|R|E’s future performance, and its performance may be significantly less favorable. Moreover, some of the past performance data covers periods with economic characteristics and cycles and interest rate environments that are significantly different from those S|T|O|R|E faces today and may face in the future. Introduction Core Competencies Portfolio Financial Management Conclusion 12.2 % 11.5 % 16.7 % 17.8 % 16.9 % (4.3)% FFCA MSCI US REIT Index FFCA S&P 500 MSCI US REIT Index S&P 500 Two years prior to sale From IPO to sale |
|
|
Shareholder-Friendly Corporate Governance Structure GOVERNANCE OVERVIEW S|T|O|R|E CAPITAL Non-classified board1 with each director subject to re-election annually Opting out of the Maryland business combination and control share acquisition statutes1 No stockholder rights plan Fully independent audit committee, independent director representation on compensation and nominating and corporate governance committees Independent directors will meet regularly in executive sessions without the presence of corporate officers or non-independent directors 1 S|T|O|R|E’s organizational documents provide that it will not classify its board in future or opt into the Maryland business combination and control share acquisition statutes without shareholder approval. Oaktree has advised S|T|O|R|E that it does not intend to vote in favor of the classification of its board, an opt-in to the Maryland business combination statute or control share acquisition statute or the adoption of a stockholder rights plan. Introduction Core Competencies Portfolio Financial Management Conclusion |
|
|
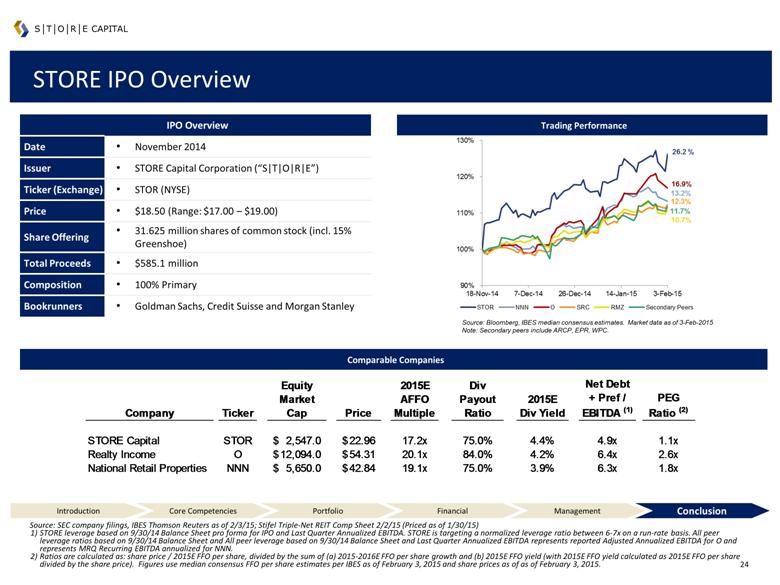
IPO Overview Date November 2014 Issuer STORE Capital Corporation (“S|T|O|R|E”) Ticker (Exchange) STOR (NYSE) Price $18.50 (Range: $17.00 – $19.00) Share Offering 31.625 million shares of common stock (incl. 15% Greenshoe) Total Proceeds $585.1 million Composition 100% Primary Bookrunners Goldman Sachs, Credit Suisse and Morgan Stanley STORE IPO Overview S|T|O|R|E CAPITAL Trading Performance Comparable Companies Source: Bloomberg, IBES median consensus estimates. Market data as of 3-Feb-2015 Note: Secondary peers include ARCP, EPR, WPC. Source: SEC company filings, IBES Thomson Reuters as of 2/3/15; Stifel Triple-Net REIT Comp Sheet 2/2/15 (Priced as of 1/30/15) STORE leverage based on 9/30/14 Balance Sheet pro forma for IPO and Last Quarter Annualized EBITDA. STORE is targeting a normalized leverage ratio between 6-7x on a run-rate basis. All peer leverage ratios based on 9/30/14 Balance Sheet and All peer leverage based on 9/30/14 Balance Sheet and Last Quarter Annualized EBITDA represents reported Adjusted Annualized EBITDA for O and represents MRQ Recurring EBITDA annualized for NNN. Ratios are calculated as: share price / 2015E FFO per share, divided by the sum of (a) 2015-2016E FFO per share growth and (b) 2015E FFO yield (with 2015E FFO yield calculated as 2015E FFO per share divided by the share price). Figures use median consensus FFO per share estimates per IBES as of February 3, 2015 and share prices as of as of February 3, 2015. Introduction Core Competencies Portfolio Financial Management Conclusion Company Ticker Equity Market Cap Price 2015E AFFO Multiple Div Payout Ratio 2015E Div Yield Net Debt + Pref / EBITDA (1) PEG Ratio (2) STORE Capital STOR 2,547.0 $ 22.96 $ 17.2x 75.0% 4.4% 4.9x 1.1x Realty Income O 12,094.0 $ 54.31 $ 20.1x 84.0% 4.2% 6.4x 2.6x National Retail Properties NNN 5,650.0 $ 42.84 $ 19.1x 75.0% 3.9% 6.3x 1.8x |
|
|
Investment Highlights 2 1 S|T|O|R|E CAPITAL 6 4 Our underwriting and management processes are designed to deliver investment-grade contract risk 5 Our differentiated capital markets strategy is designed to achieve an ideal capital structure 3 Introduction Core Competencies Portfolio Financial Management Conclusion 1 Based on annualized total returns earned by management’s prior investment vehicles while operating as a public company, compared to annualized total returns on the MSCI US REIT Index during the same periods. See slide 22. The past performance of these investment vehicles is not an indicator of S|T|O|R|E’s future performance, and S|T|O|R|E’s performance may be significantly less favorable than the past performance data included in this presentation. Moreover, some of the past performance data covers periods with economic characteristics and cycles and interest rate environments that are significantly different from those S|T|O|R|E faces today and may face in the future. We believe we employ a market-leading, direct origination approach in an underserved $2trn market Our business model is positioned to deliver dividends as well as internal and external growth We own a high quality, highly diversified and growing portfolio of STORE properties Our leadership team has a >30 year track record of Out-performance1 |