Attached files
| file | filename |
|---|---|
| 8-K - 8-K - HERITAGE FINANCIAL CORP /WA/ | d868412d8k.htm |
 Investor
Presentation February 2015
Brian Vance
Chief Executive Officer
Jeff Deuel
President and Chief Operating Officer
Don Hinson
Executive Vice President and Chief Financial Officer
Bryan McDonald
Executive Vice President and Chief Lending Officer
Exhibit 99.1 |
 Forward-Looking Statements
2
This presentation contains forward-looking statements that are subject to risks and
uncertainties, including, but not limited to: The expected revenues, cost savings,
synergies and other benefits from the Washington Banking merger and our other merger
and acquisition activities might not be realized within the anticipated time frames or at all, and costs or difficulties
relating to integration matters, including but not limited to, customer and employee retention
might be greater than expected;
The credit and concentration risks of lending activities;
Changes in general economic conditions, either nationally or in our market areas;
Competitive market pricing factors and interest rate risks;
Market interest rate volatility;
Balance sheet (for example, loans) concentrations;
Fluctuations in demand for loans and other financial services in our market areas;
Changes in legislative or regulatory requirements or the results of regulatory
examinations; The ability to recruit and retain key management and staff;
Risks associated with our ability to implement our expansion strategy and merger
integration; Stability of funding sources and continued availability of
borrowings; Adverse changes in the securities markets;
The inability of key third-party providers to perform their obligations to us;
Changes
in
accounting
policies
and
practices
and
the
use
of
estimates
in
determining
fair
value
of
certain
of
our
assets,
which
estimates
may
prove
to
be
incorrect
and
result
in
significant
declines
in
valuation;
and
These and other risks as may be detailed from time to time in our filings with the Securities
and Exchange Commission. The Company cautions readers not to place undue reliance on any
forward-looking statements. Moreover, you should treat these statements as speaking
only as of the date they are made and based only on information then actually known to the Company. The
Company does not undertake and specifically disclaims any obligation to revise any
forward-looking statements to reflect the occurrence of anticipated or
unanticipated events or circumstances after the date of such statements. These risks could cause our
actual results for 2014 and beyond to differ materially from those expressed in any
forward-looking statements by, or on behalf of, us, and could negatively affect the
Company’s operating and stock price performance. |
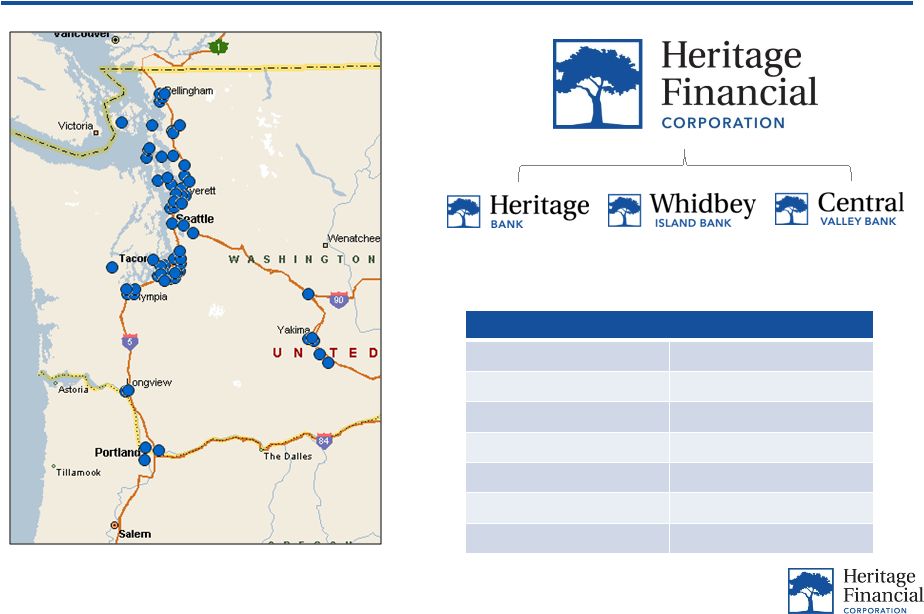 Overview
3
Overview
NASDAQ Symbol
HFWA
Market Capitalization
$481.7 million
Institutional Ownership
75.3%
Total Assets
$3.5 billion
Headquarters
Olympia, WA
# of Branches
66
Year Established
1927
Note: Financial information as of 12/31/2014 and market information as of 2/2/2015
Three banks, one charter |
 Transformational Merger with WBCO in 2014
4
Merger of Heritage Financial Corporation and Washington Banking Company
combined two quality community banks to create a $3.5+ billion franchise
Logical geographic fit
Created significant operational scale and efficiencies
Effective use of capital with improved returns on tangible common equity
Positioned to expand in metro markets
Completed merger on May 1, 2014
Completed system conversion onto Heritage’s core system on October 5, 2014
Achieving targeted merger related cost savings –
full benefit expected to be
recognized in early 2015 |
  Rank
Total
WA -
HQ
Institution (State)
Number of
Branches
Deposits in
Market
Market
Share
1
Bank of America Corp. (NC)
189
25,422,347
$
+3.6%
20.68%
2
Wells Fargo & Co. (CA)
159
14,569,387
$
+7.5%
11.85%
3
U.S. Bancorp (MN)
189
12,940,872
$
+0.8%
10.53%
4
JPMorgan Chase & Co. (NY)
211
12,235,289
$
+10.0%
9.95%
5
KeyCorp (OH)
162
8,935,023
$
+4.4%
7.27%
6
Umpqua Holdings Corp. (OR)
110
5,101,869
$
+13.7%
4.15%
7
1
Washington Federal Inc. (WA)
82
4,916,698
$
-2.5%
4.00%
8
2
Banner Corp. (WA)
99
4,029,793
$
+7.7%
3.28%
9
3
Columbia Banking System Inc. (WA)
78
3,655,191
$
+3.2%
2.97%
10
4
W.T.B. Financial Corp. (WA)
27
3,192,886
$
+4.3%
2.60%
11
Mitsubishi UFJ Finl Grp Inc.
43
3,098,038
$
+0.6%
2.52%
12
5
Heritage Financial Corp. (WA)
65
2,853,726
$
+1.2%
2.32%
13
6
HomeStreet Inc. (WA)
29
1,905,969
$
+9.9%
1.55%
14
7
Yakima FS&LA (WA)
10
1,367,785
$
-2.4%
1.11%
15
8
Peoples Bancorp (WA)
23
1,179,743
$
+5.4%
0.96%
16
9
Cashmere Valley Bank (WA)
11
1,148,312
$
+4.9%
0.93%
17
Opus Bank (CA)
24
1,070,464
$
+10.6%
0.87%
18
East West Bancorp Inc. (CA)
4
1,008,752
$
+9.1%
0.82%
19
10
Olympic Bancorp Inc. (WA)
20
846,053
$
+4.8%
0.69%
20
Zions Bancorp. (UT)
1
727,672
$
+1.0%
0.59%
21
11
Skagit Bancorp Inc. (WA)
11
686,204
$
+2.9%
0.56%
22
12
Riverview Bancorp Inc. (WA)
14
618,304
$
+4.5%
0.50%
23
13
First FS&LA of Port Angeles (WA)
10
602,816
$
+0.7%
0.49%
24
14
Timberland Bancorp Inc. (WA)
22
598,670
$
+0.4%
0.49%
25
15
Pacific Financial Corp. (WA)
16
585,507
$
+4.9%
0.48%
Total For Institutions In Market
1,826
$ 122,930,458
+4.4%
Out of 88 Institutions
Washington - Top 25
Deposit
Growth
(1-Year)
Deposit Market Share
5
Source: SNL Financial, deposit market share data as of 6/30/2014
Note: All dollars in thousands
HFWA
ranked
5
th
for
deposit
market
share in Washington among banks
headquartered in the state |
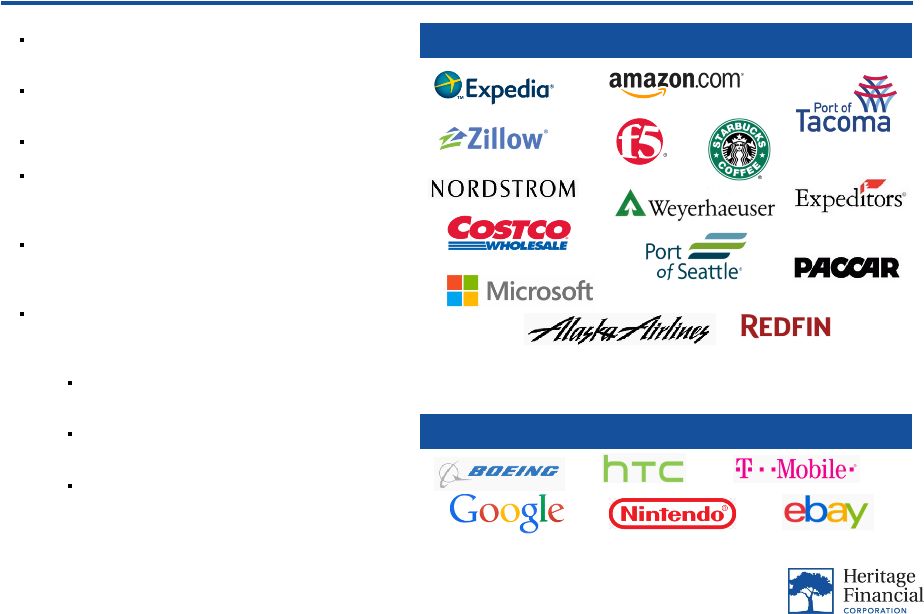 Strong and
Diverse Economic Landscape 6
Headquartered in Western Washington
Major Operations in Western Washington
Thriving local economy with job growth in technology
and aerospace sectors
Seattle
economy
ranks
11
th
largest
in
the
country
by
GDP, which increased 4.1% since 2013
Seattle’s population grew 5.2% from 2010 to 2014
Washington
per
capita
income
in
2013
ranked
13
th
in
the United States at $47,031, 6.3% higher than the
national average
Nine Fortune 500 companies headquartered in
Washington, including Amazon, Costco, Microsoft and
Starbucks
Significant increase in new construction coupled with
improving economic conditions have led to an
improving real estate market
Number of Seattle building permits increased
by 20% year-to-date*
Number of Washington building permits
increased 7% overall year-to-date*
Seattle home prices increased 6% in
September 2014 versus September 2013
Note: Information for Seattle MSA, where available
Source:
U.S.
Department
of
Commerce,
Federal
Reserve
Bank
of
St.
Louis,
Office
of
Financial
Management,
U.S. Census Bureau, City of Seattle, Puget Sound Economic Forecaster, National Association of
Home Builders, S&P Case-Shiller
*Information as of 10/31/2014
Fort Lewis
McChord Air Force Base |
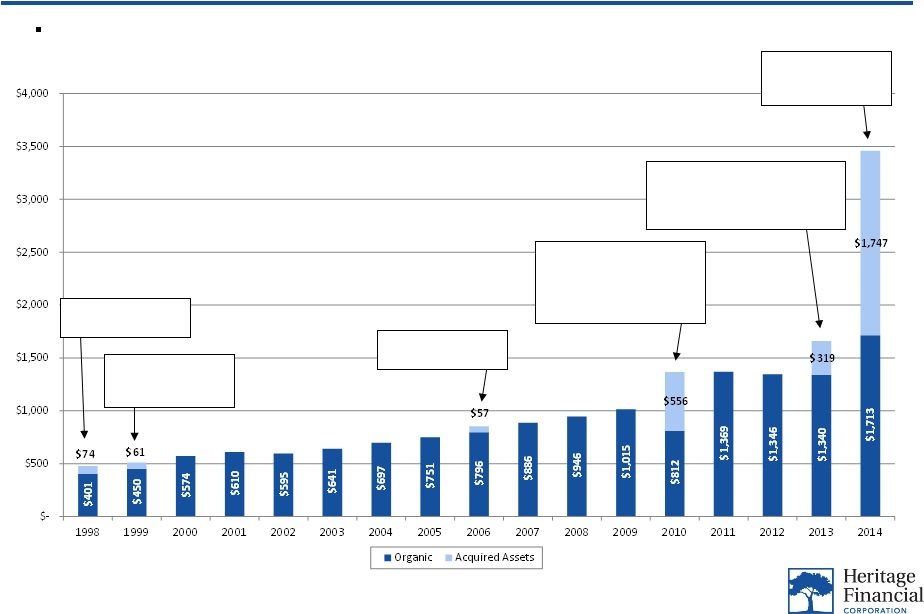 Historical
Growth – Organic and Acquisitive
7
Source: Company financials, as of 12/31/2014
Note: All dollars in millions
Acquired North Pacific
Bancorporation
Acquired Washington
Independent
Bancshares Inc.
Acquired Western
Washington Bancorp
Completed 2 FDIC deals -
Pierce Commercial Bank and
Cowlitz Bank acquiring $211M
and $345M in deposits,
respectively
Acquired Valley Community
Bancshares, Inc. with $254M in
assets and Northwest Commercial
Bank with $65M in assets
Merger with
Washington Banking
Company
In addition to organic growth, HFWA has completed 6 whole bank mergers and 2 FDIC-assisted
transactions since 1998 |
 Financial
Update – Q4 2014
8
Source: Company financials, as of 12/31/2014
Net income of $7.3 million, or $0.24 diluted earnings per share
Return on average assets of 0.83% and return on average tangible
common equity of 8.85%
Net interest margin of 4.74%, which increased by 42 basis points
from prior quarter. Excluding the impact from accretion on
purchased loans, the net interest margin was 3.86% which increased by 3 basis points from
prior quarter Gross loans held for investment increased to $2.125 billion vs. $2.064
billion in prior quarter, or annualized growth of 11.8% Total deposits of $2.9 billion,
which includes noninterest bearing deposits of 24.4% and non-maturity deposits of 81.9% of the total
deposit balance, respectively
Total noninterest bearing demand deposits increased to $709.7 billion vs. $694.4 billion in
prior quarter, or annualized growth of 8.8% Total assets of $4.6 million per FTE
employee vs. $4.4 million from prior quarter Nonperforming noncovered assets decreased
by 38.5%, to $9.7 million at December 31, 2014 vs. $15.8 million in prior quarter
Tangible book value per share of $10.73 vs. $10.62 from prior quarter, an increase of $0.11
per share Dividends per share of $0.25, including a regular dividend of $0.09 and
special dividend of $0.16 |
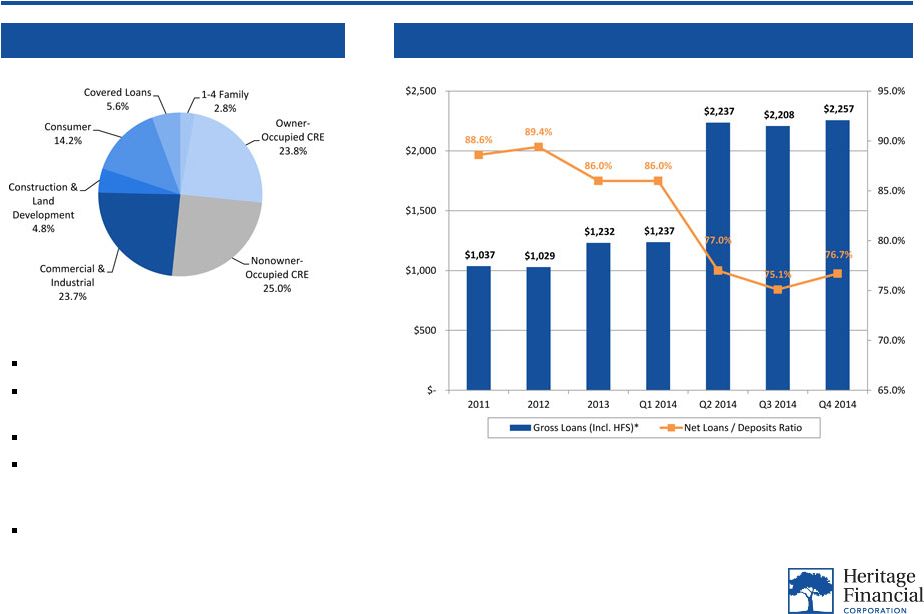 Loan
Portfolio 9
Loan Portfolio Trends
Loan Portfolio Mix -
% of Total*
Source: Company financials, as of 12/31/2014
Note: All dollars in millions
*Includes non-covered and covered loans
**Excludes impact from incremental accretion on purchased loans
Total CRE of 48.8% of total loans
Total C&I and owner-occupied CRE of 47.5% of total
loans
Core yield on loans of 5.03% in Q4 2014**
Total loans of $2.3 billion, including $126.2 million
of covered loans remaining in loan portfolio from
FDIC-assisted acquisitions
$244.9 million of loan originations in Q4 2014 |
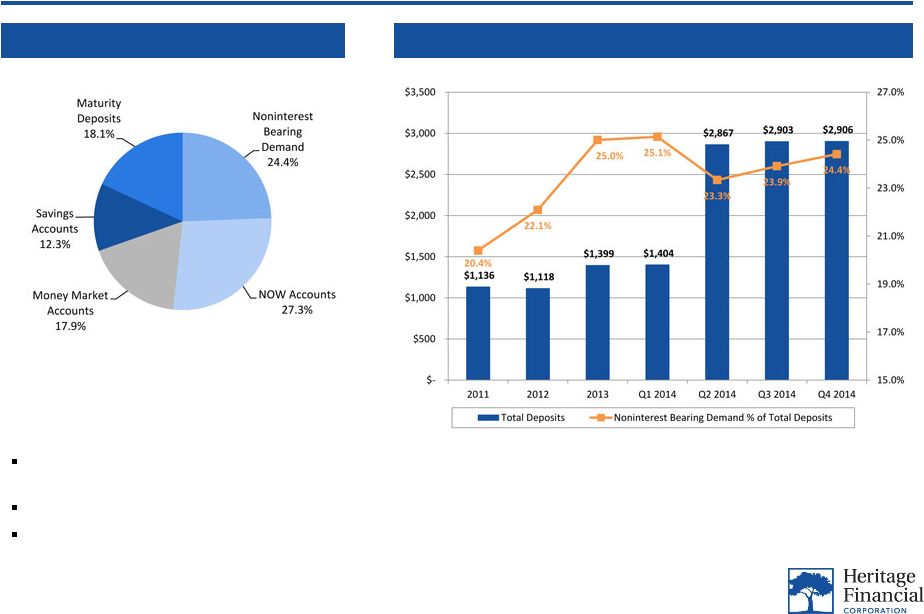 Deposit
Profile 10
Deposit Trends
Deposit Mix -
% of Total
Source: Company financials, as of 12/31/2014
Note: All dollars in millions
Noninterest bearing demand of 24.4% of total
deposits
Non-maturity deposits of 81.9% of total deposits
Cost of total deposits of 0.20% in Q4 2014 |
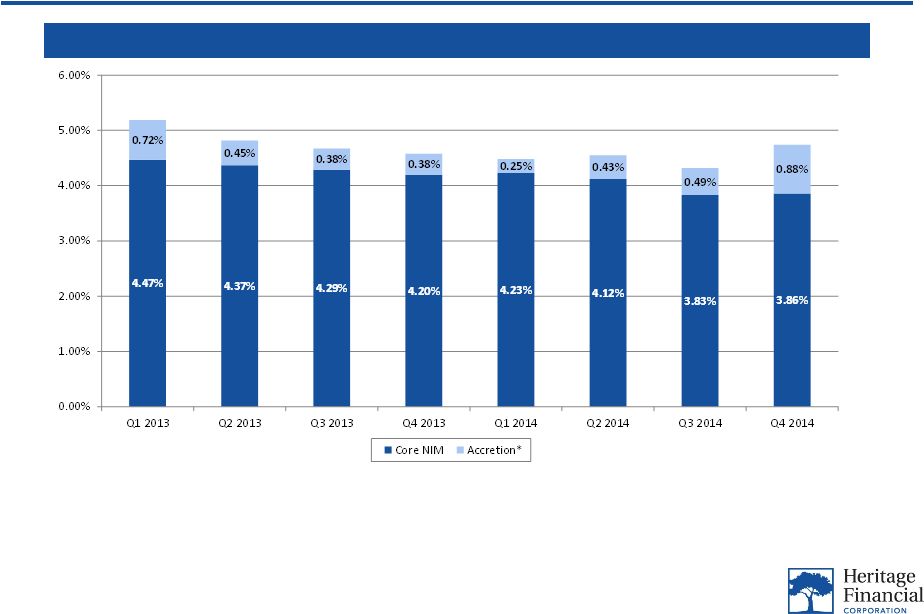 Net Interest
Margin Trends 11
Net Interest Margin (Core vs. Accretion)*
Source: Company financials, as of 12/31/2014
*Impact on net interest margin from incremental accretion on purchased loans
5.19%
4.82%
4.67%
4.58%
4.48%
4.55%
4.32%
4.74% |
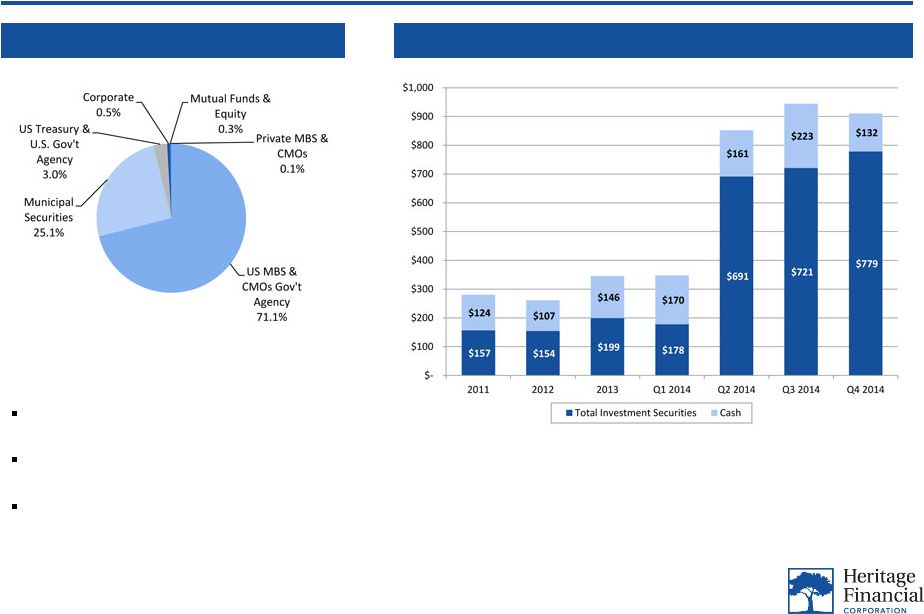 Cash and
Investment Securities Portfolio 12
Cash and Investment Securities
Investment Portfolio Mix
Source: Company financials, as of 12/31/2014
Note: All dollars in millions
Total cash and investment securities of $910 million, or
26.3% of total assets
Average yield on taxable investment securities of
1.94% in Q4 2014
Average yield on non-taxable investment securities of
1.98% in Q4 2014 |
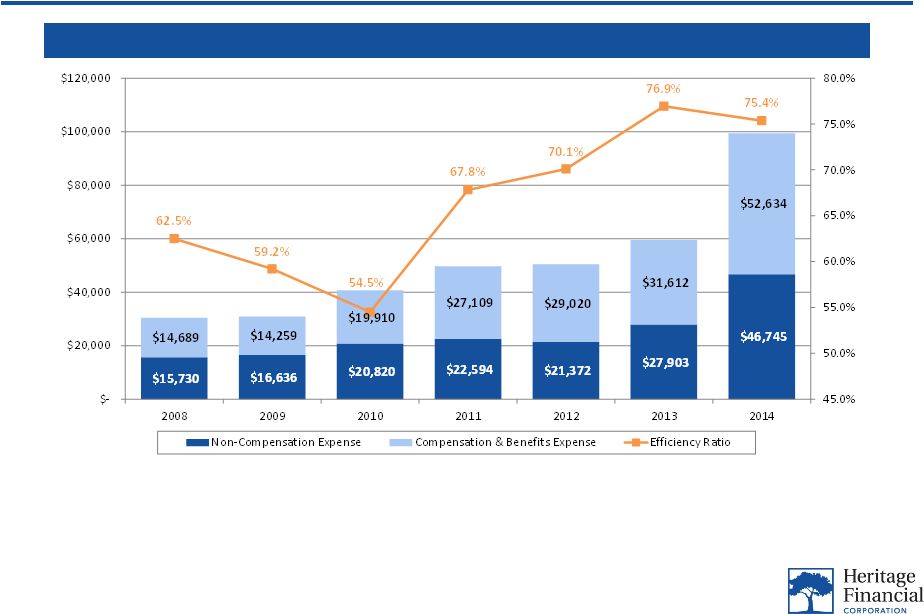 Non-Interest Expense
13
Source: Company financials, as of 12/31/2014
Note: All dollars in thousands
Non-Interest Expense Detail and Efficiency Ratio |
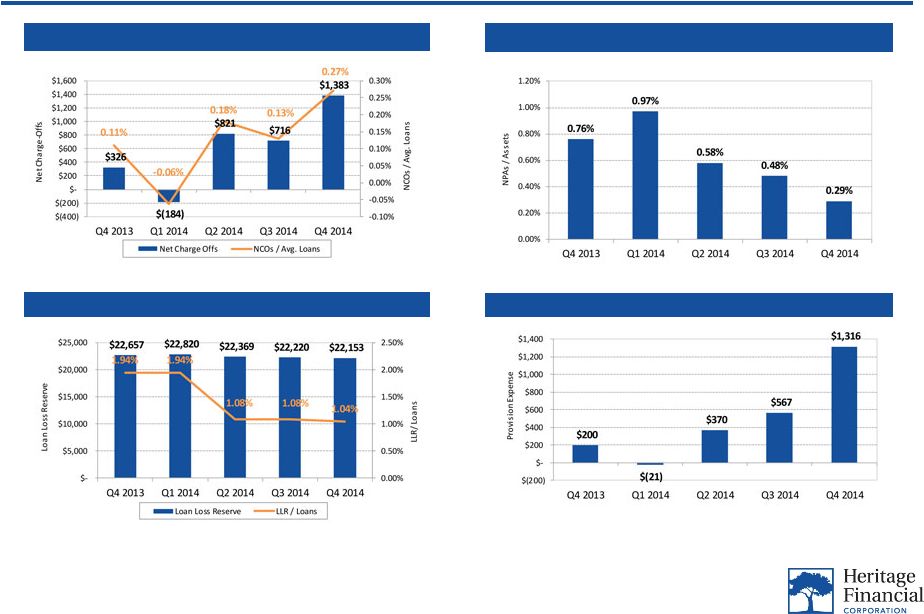 Credit Quality
Trends 14
Source: Company financials, as of 12/31/2014
Note: All dollars in thousands
Note: Excludes purchased covered loans
Loan Loss Reserve and LLR/Loans
Net Charge
Offs and NCOs/Avg. Loans
Provision Expense
NPAs / Assets |
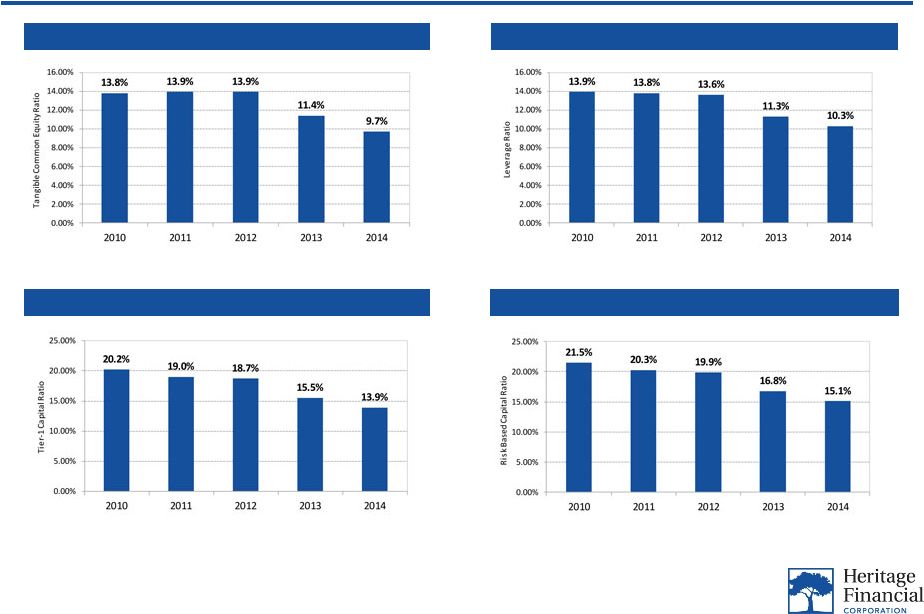 Capital Ratio
Trends 15
Source: Company financials, as of 12/31/2014
Tier -
1 Capital Ratio
Tangible Common Equity Ratio
Risk Based Capital Ratio
Leverage Ratio |
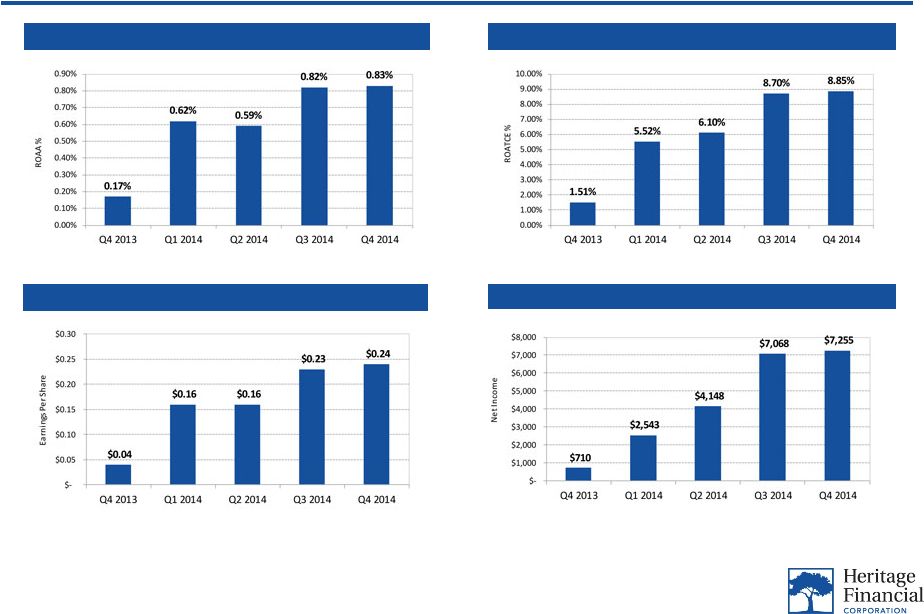 Profitability
Trends 16
Source: Company financials, as of 12/31/2014
Note: All dollars in thousands, except per share
Earnings Per Share
ROAA
ROATCE
Net Income |
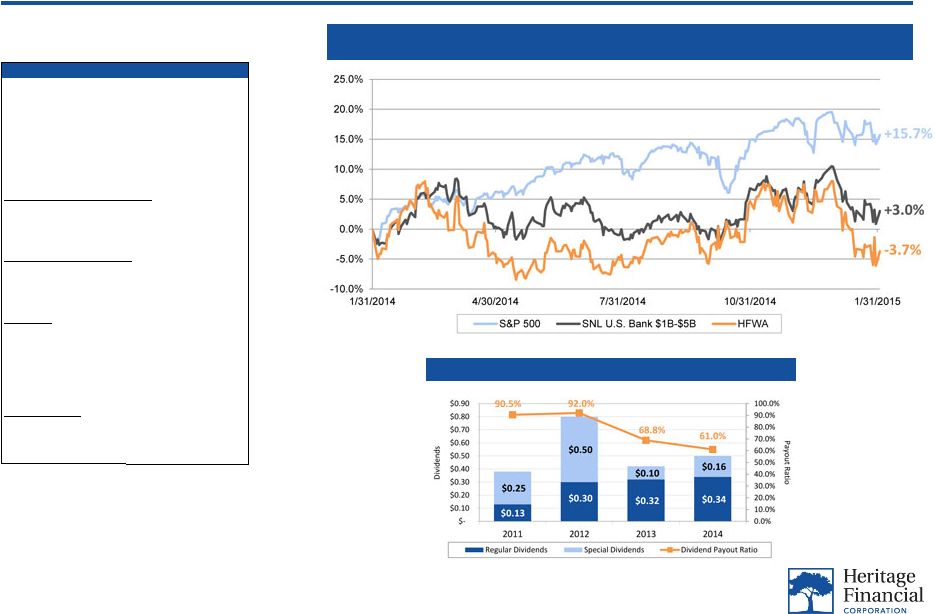 Total
Shareholder Return 17
Total Return* –
Last Twelve Months
Source: SNL Financial, as of 2/2/2015
Note: SNL U.S. Bank $1B-$5B index includes banks nationwide with total assets of
$1.0 billion to $5.0 billion
*Total return includes stock price appreciation and reinvested dividends
**Average Street EPS estimates, per FactSet Research Systems, Inc.
***Dividends based on date declared
Ticker
HFWA
Exchange
NASDAQ
Stock Price
15.92
$
Market Cap. ($MM)
481.7
$
Dividend Yield (Regular Div. Only)
2.51%
Average Daily Volume (3 Mo.)
Avg. Daily Volume (Shares)
71,611
Avg. Daily Volume ($000s)
1,140
$
52-Week High / Low Price
52-Week High (3/05/2014)
18.39
$
52-Week Low (5/16/2014)
15.19
$
Per Share
Tg. Book Value Per Share
10.73
$
EPS -
2015E**
1.24
$
EPS -
2016E**
1.31
$
Number of Research Analysts
4
Valuation Ratios
Price / Tg. Book Value
148.4%
Price / 2015E EPS**
12.8x
Price / 2016E EPS**
12.2x
Dividends Per Share*** |
 HFWA
Investment Thesis 18
Western Washington geographic footprint with vibrant economy and
attractive long-term demographics
Continued focus on growth trends and capital management
Grow organically and continue to evaluate M&A opportunities
Return
capital
to
shareholders
via
dividends
and
stock
buybacks,
as
appropriate
Benefits of merger with Washington Banking Company expected to be
reflected in HFWA’s 2015 results
Attractive valuation |
 19
Appendix
***
***
****
**** |
 Historical
Financial Highlights 20
Source: Company financials, as of 12/31/2014
Note: All dollars in thousands
Note: All credit quality information excludes covered loans
Last 5 Quarters
Q4 2013
Q1 2014
Q2 2014
Q3 2014
Q4 2014
Balance Sheet
Total Assets
1,659,038
$
1,662,473
$
3,391,579
$
3,451,320
$
3,459,916
$
Asset Growth (Anlzd. vs. Prior Period)
-3.7%
0.8%
416.0%
7.0%
1.0%
Gross Loans (Incl. HFS)
1,231,920
$
1,237,037
$
2,236,572
$
2,207,524
$
2,256,659
$
Loan Growth (Anlzd. vs. Prior Period)
-1.6%
1.7%
323.2%
-5.2%
8.9%
Total Deposits
1,399,189
$
1,404,214
$
2,866,542
$
2,903,069
$
2,906,331
$
Deposit Growth (Anlzd. vs. Prior Period)
-7.5%
1.4%
416.6%
5.1%
0.4%
Net Loans / Deposits Ratio
86.0%
86.0%
77.0%
75.1%
76.7%
Cash and Securities / Total Assets
20.8%
20.9%
25.1%
27.4%
26.3%
Noninterest Bearing Deposits (% of Total)
25.0%
25.1%
23.3%
23.7%
24.4%
Non-CDs (% of Total)
77.9%
78.8%
78.3%
80.1%
81.9%
Capital Adequacy
Tangible Common Equity
184,782
$
185,593
$
319,476
$
321,179
$
324,588
$
Tangible Common Equity Ratio
11.3%
11.5%
9.8%
9.7%
9.7%
Leverage Ratio
11.3%
11.5%
12.6%
10.3%
10.3%
Risk Based Capital Ratio
16.8%
16.6%
15.7%
15.9%
15.1%
Credit Quality Ratios
NPAs / Total Assets
0.76%
0.97%
0.58%
0.48%
0.29%
NCOs / Avg. Loans
0.11%
-0.06%
0.18%
0.13%
0.27%
Loan Loss Reserves / Gross Loans
1.94%
1.94%
1.08%
1.08%
1.04%
Income Statement and Performance Ratios
Net Interest Income
17,646
$
16,741
$
28,596
$
33,307
$
36,780
$
Net Income
710
$
2,543
$
4,148
$
7,068
$
7,255
$
ROAA
0.17%
0.62%
0.59%
0.82%
0.83%
Net Interest Margin
4.58%
4.48%
4.55%
4.32%
4.74%
Noninterest Expense / Avg. Assets
4.38%
3.63%
3.85%
3.27%
3.36%
Assets Per Employee
4,448
$
4,644
$
4,192
$
4,352
$
4,626
$
Efficiency Ratio
92.2%
77.6%
80.9%
73.1%
71.9% |
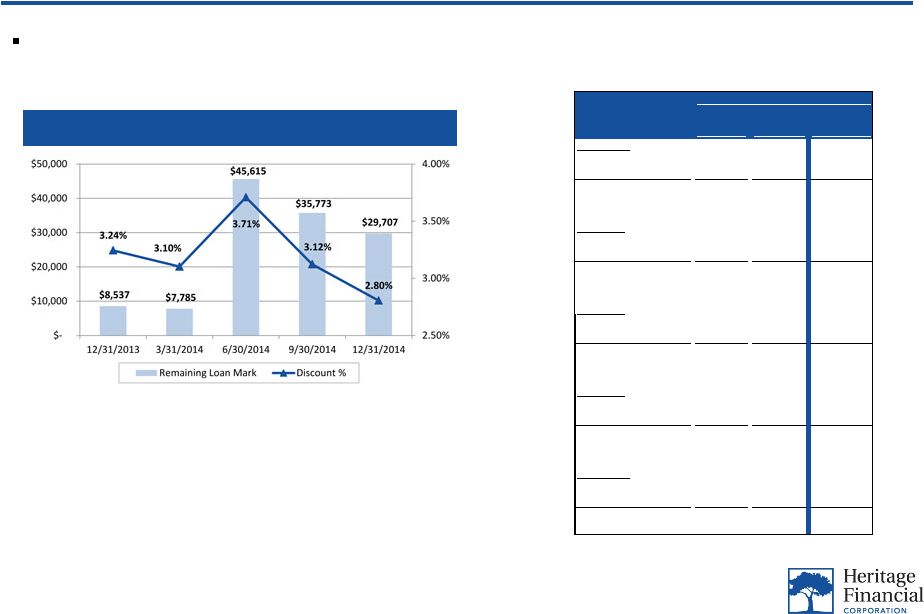 Discounts on
Acquired Loans 21
Total Discount on Acquired Loans
$29.7 million remaining loan discount on acquired loans, including covered and non-covered
portfolios Source: Company information, as of 12/31/2014
Note: All dollars in thousands
Covered
Non-
Covered
Total
12/31/2013
Loan Balance
64,788
$
198,384
$
263,172
$
Remaining Loan Mark
1,034
$
7,503
$
8,537
$
Recorded Investment
63,754
$
190,881
$
254,635
$
Discount %
1.60%
3.78%
3.24%
3/31/2014
Loan Balance
62,450
$
188,461
$
250,911
$
Remaining Loan Mark
976
$
6,809
$
7,785
$
Recorded Investment
61,474
$
181,652
$
243,126
$
Discount %
1.56%
3.61%
3.10%
6/30/2014
Loan Balance
174,187
$
1,055,584
$
1,229,771
$
Remaining Loan Mark
14,519
$
31,096
$
45,615
$
Recorded Investment
159,668
$
1,024,488
$
1,184,156
$
Discount %
8.34%
2.95%
3.71%
9/30/2014
Loan Balance
149,673
$
995,910
$
1,145,583
$
Remaining Loan Mark
10,840
$
24,933
$
35,773
$
Recorded Investment
138,833
$
970,977
$
1,109,810
$
Discount %
7.24%
2.50%
3.12%
12/31/2014
Loan Balance
131,882
$
927,231
$
1,059,113
$
Remaining Loan Mark
5,682
$
24,025
$
29,707
$
Recorded Investment
126,200
$
903,206
$
1,029,406
$
Discount %
4.31%
2.59%
2.80%
Total Acquired Loans |