Attached files
| file | filename |
|---|---|
| 8-K - FORM 8-K - Bristow Group Inc | d864207d8k.htm |
 February 6, 2015
Third quarter FY15 earnings presentation
Bristow Group Inc.
Exhibit 99.1 |
 2
Third quarter FY15 earnings call agenda
Introduction
CEO remarks and safety review
Operational highlights
Current and future financial performance
Closing remarks
Questions and answers
Linda McNeill, Director Investor Relations
Jonathan Baliff, President and CEO
Jeremy Akel, SVP and COO
John Briscoe, SVP and CFO
Jonathan Baliff, President and CEO |
 3
Forward-looking statements
This
presentation
may
contain
“forward-looking
statements”
within
the
meaning
of
the
Private
Securities
Litigation
Reform
Act
of
1995.
Forward-looking
statements
include
statements
about
our
future
business,
operations,
capital
expenditures,
fleet
composition,
capabilities
and
results; modeling
information,
earnings
and
adjusted
earnings
growth
guidance,
expected
contract
revenue,
expected
operating
margins,
cash
flow
stability and
other
financial
projections;
future
dividends,
share
repurchases
and
other
uses
of
excess
cash;
plans,
strategies
and
objectives
of
our
management,
including
our
plans
and
strategies
to
grow
earnings
and
our
business,
our
general
strategy
going
forward,
our
business
model
and
our
operational
excellence
initiative;
expected
actions
by
us
and
by
third
parties,
including
our
customers,
competitors
and
regulators;
impact
of
grounding
and
the
effects
thereof;
the
valuation
of
our
company
and
its
valuation
relative
to
relevant
financial
indices;
assumptions
underlying
or
relating
to
any
of
the
foregoing,
including
assumptions
regarding
factors
impacting
our
business,
financial
results
and
industry
including
oil
prices;
expected
impact
of
our
investment
in
Eastern
Airways
and
our
acquisition
of
an
interest
in
Airnorth;
aircraft
delivery
dates
and
other
matters.
Our
forward-looking
statements
reflect
our
views
and
assumptions
on
the
date
of
this
presentation
regarding
future
events
and
operating
performance.
They
involve
known
and
unknown
risks,
uncertainties
and
other
factors,
many
of
which
may
be
beyond
our
control,
that
may
cause
actual
results
to
differ
materially
from
any
future
results,
performance
or
achievements
expressed
or
implied
by
the
forward-looking
statements.
These
risks,
uncertainties
and
other
factors
include
fluctuations
in
the
demand
for
our
services;
fluctuations
in
worldwide
prices
of
and
supply
and
demand
for
natural
gas
and
oil;
fluctuations
in
levels
of
natural
gas
and
oil
exploration,
development
and
production
activities;
the
impact
of
competition;
actions
by
customers;
the
risk
of
reductions
in
spending
on
aircraft
services
by
governmental
agencies;
changes
in
tax
and
other
laws
and
regulations;
changes
in
foreign
exchange
rates
and
controls;
risks
associated
with
international
operations;
operating
risks
inherent
in
our
business,
including
the
possibility
of
declining
safety
performance;
general
economic
conditions
including
the
capital
and
credit
markets;
our
ability
to
obtain
financing;
the
possibility
that
we
may
lack
sufficient
liquidity
to
continue
to
repurchase
shares
or
pay
a
quarterly
dividend;
the
risk
of
grounding
of
segments
of
our
fleet
for
extended
periods
of
time
or
indefinitely;
our
ability
to
re-deploy
our
aircraft
to
regions
with
greater
demand;
our
ability
to
acquire
additional
aircraft
and
dispose
of
older
aircraft
through
sales
into
the
aftermarket;
the
possibility
that
we
or
our
suppliers
will
be
unable
to
deliver
new
aircraft
on
time
or
on
budget;
the
possibility
that
we
do
not
achieve
the
anticipated
benefit
of
our
fleet
investment
program;
availability
of
employees;
political
instability,
war
or
acts
of
terrorism
in
any
of
the
countries
where
we
operate;
and
those
discussed
under
the
captions
“Risk
Factors”
and
“Management’s
Discussion
and
Analysis
of
Financial
Condition
and
Results
of
Operations”
in
our
Annual
Report
on
Form
10-K
for
the
fiscal
year
ended
March
31,
2014
and
our
Quarterly
Report
on
Form
10-Q
for
the
quarter
ended
December
31,
2014.
We
do
not
undertake
any
obligation,
other
than
as
required
by
law,
to
update
or
revise
any
forward-looking
statements,
whether
as
a
result
of
new
information,
future
events
or
otherwise. |
 CEO
remarks and safety review Jonathan Baliff, President and CEO
|
 5
Operational safety review
1)
AAR includes consolidated commercial operations only
2)
TRIR includes consolidated commercial operations, corporate and Bristow Academy
employees Total
Recordable
Injury
Rate
2
(TRIR)
per
200,000 man hours (cumulative)
Commercial Air Accident Rate
1
(AAR) per 100,000
flight hours (fiscal year) |
 6
HeliOffshore: Safety through collaboration
•
Interest is very strong.
Since its launch in October 2014,
enrollment has grown to more than 20 members, with an
additional 50 in process
•
Global engagement is underway.
Membership interest from
all regions of the world
•
HeliOffshore is producing real results.
Airbus Helicopters
recently issued the industry’s first standardized EC225 Flight
Crew Operating Manual
•
Sharing is the norm.
Member operators are now routinely
exchanging safety events, best practices and lessons learned
under the HeliOffshore umbrella |
 7
Q3 FY15 highlights
Adjusted EPS and adjusted EBITDAR amounts exclude gains and losses on dispositions
of assets and any special items during the period. See reconciliation of these items to GAAP measures in the
appendix hereto and in our earnings release for the quarter ended December 31,
2014 Bristow Value Added (BVA) is calculated by taking gross cash flow less
the product of gross operating assets times a capital charge of 10.5%. Example calculation can be found in the appendix hereto.
Please see our earnings release and slide 24 for more information regarding earnings
guidance range *
**
***
•
Continued operating revenue growth, up 15.2% over Q3 FY14
•
Adjusted EBITDAR increased year-over-year, but adjusted EPS is down due
primarily to unfavorable changes in foreign exchange rates
•
Q3 FY15 BVA** is up $7.6 million year-over-year and down $6.4 million
sequentially, with gross cash flow returns growing due to growth and excellent
capital management •
Strong operating cash flow, up 18.3% over YTD Q3 FY14
•
EPS
guidance
for
the
full
year
FY15
is
being
lowered
to
$4.05
-
$4.45
from
$4.70
-
$5.20***
•
Q3 operating revenue of $430.3M (15.2% increase from Q3 FY14, 2.3% decrease
from Q2 FY15) •
Q3 GAAP EPS loss of $0.03 (105.9% decrease from Q3 FY14, 104.1% decrease from Q2
FY15) •
Q3 adjusted EPS* of $0.70 (17.6% decrease from Q3 FY14, 19.5% decrease from Q2
FY15) •
Q3 adjusted EBITDAR* of $109.1M (8.3% increase from Q3 FY14, 2.7% decrease from Q2
FY15) |
 8
Bristow market perspectives
Overall oil
price
perspective
•
Clients are only at the start of a three phase response in this downturn:
retrenching, recalibration, and (eventually) renewal
•
The strength of the U.S. dollar has impacted Bristow’s current financial
results more than the oil price decline
•
Bristow believes this is not just a supply-oriented decline, but is driven by
weaker global economic growth, especially in China and Europe
•
Because it's supply and demand driven, we believe the current price decline
will last (with a significant volatility) between 12 and 24 months
•
Continued focus on safety with best practice collaboration through
HeliOffshore continuing and expanding
•
Although production-oriented services (like aviation) are doing better than
many in energy services, short-term available capacity is
increasing •
Bristow and clients are proactively working together to find efficiencies and
ways to reduce costs, without compromising physical or financial
safety
•
Bristow is also working with our OEM and lessor partners during this
downturn to find cost and capital efficiencies
Offshore
aviation
market
perspective |
 9
Operational highlights
Jeremy Akel, SVP and COO |
 10
•
Europe contributed 46% of Bristow operating revenue
and 47% of adjusted EBITDAR* in Q3 FY15
•
Operating revenue increased 22.3% to $193.8M in
Q3 FY15 from $158.5M in Q3 FY14 with the net
addition of eleven LACE, the addition of Eastern
Airways and an overall increase in activity over the
comparable quarter
•
Adjusted EBITDAR increased 15% to $64.2M in Q3
FY15 from $56.0M in Q3 FY14 with adjusted
EBITDAR margin of 33.1% in Q3 FY15 vs. 35.3% in
Q3 FY14
Outlook:
Higher demand for newer technology aircraft in the
Southern North Sea from CAP 1145 implementation
has resulted in one LACE contracted for up to five
years
Minor reduction in Norway activity
Clients are increasingly focused on efficiency over
flexibility with no projects canceled to date
Europe (EBU)
* Operating revenue and adjusted EBITDAR percentages exclude corporate and
other FY15 adjusted EBITDAR margin expected to
remain ~ low thirties |
 11
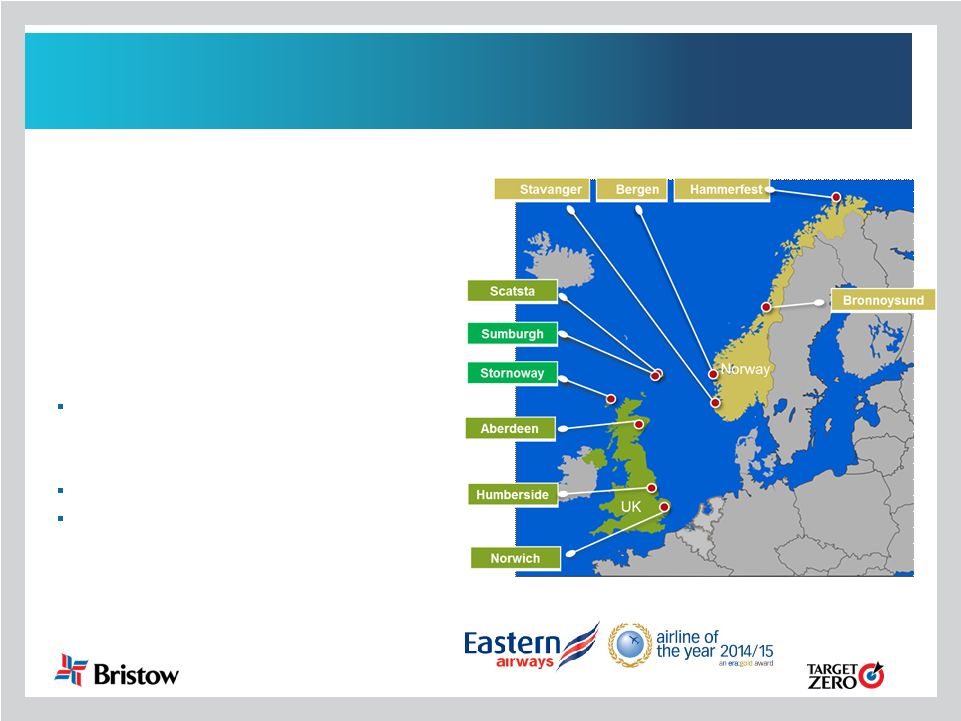
UK SAR update
•
From the start of the GAP SAR contract on June 1, 2013 through December 31, 2014,
we have conducted 519 missions and rescued and/or assisted 520 people
•
Sumburgh and Stornoway bases generated $11.9M of operating revenue in Q3 FY15 and
$76.1M since the beginning of the contract
•
Completed construction of the first two UK SAR bases in Inverness and Humberside;
non-revenue pre-operational activities have commenced
Outlook:
Humberside and Inverness on track for contract start April 2015
Five additional bases are on track for Q2-Q4 FY16 start up
Seven bases
expected to be
operational by
end FY16 |
 12
West Africa (WASBU)
•
West Africa (Nigeria) contributed 19% of Bristow
operating revenue and 20% of adjusted EBITDAR* in
Q3 FY15
•
Operating revenue increased to $80.5M in Q3 FY15
from $79.4M in Q3 FY14 due to increased activity
levels and improved contract terms
•
Adjusted EBITDAR increased to $27.9M in Q3 FY15
from $26.6M in Q3 FY14 and adjusted EBITDAR
margin increased to 34.6% in Q3 FY15 vs. 33.5% in
Q3 FY14 due to increased revenue and
implementation of new cost control measures
Outlook:
Uncertainty around national elections is hindering
sector investment
Despite clients seeking efficiencies, no projects
have been canceled to date
Expansion into point-to-point transportation
services is on track to start in Q4 FY15
FY15 adjusted EBITDAR margin expected to
remain ~ low thirties
* Operating revenue and adjusted EBITDAR percentages exclude corporate and
other |
 13
•
North America contributed 15% of Bristow operating
revenue and 18% of adjusted EBITDAR* in Q3 FY15
•
Operating revenue increased to $62.4M in Q3 FY15
from $54.9M in Q3 FY14 primarily due to an
increase in the number of medium and large aircraft
on contract
•
Adjusted EBITDAR increased to $24.9M in
Q3 FY15 vs. $18.2M in Q3 FY14 while adjusted
EBITDAR margin increased to 40.0% from 33.1% in
Q3 FY14, driven by a change in the contracted fleet
mix and improved utilization
Outlook:
Additional aircraft mobilized to GoM to meet
client demand
GoM market and fleet utilization remain robust
Despite current global market environment we
are not delaying facility improvements
North America (NABU)
* Operating revenue and adjusted EBITDAR percentages exclude corporate and
other FY15 adjusted EBITDAR margin increased
from low-to-mid thirties to ~ mid-to-high
thirties |
 14
Australia (AUSBU)
•
Australia contributed 12% of Bristow operating
revenue and 10% of adjusted EBITDAR* in
Q3 FY15
•
Operating revenue increased by 51.5% to $52.4M
in Q3 FY15 from $34.6M in Q3 FY14
•
Adjusted EBITDAR increased 157.1% to $13.3M
in Q3 FY15 from $5.2M in Q3 FY14 and adjusted
EBITDAR margin increased to 25.4% in Q3 FY15
from 15.0% in Q3 FY14 due to the ramp up of the
INPEX contract
Outlook:
Several client exploration projects being
delayed
Larger client projects are still moving forward
Continue to retire old aircraft creating
operational efficiencies
* Operating revenue and adjusted EBITDAR percentages exclude corporate and
other FY15 adjusted EBITDAR margin expected to
remain ~ low twenties |
 15
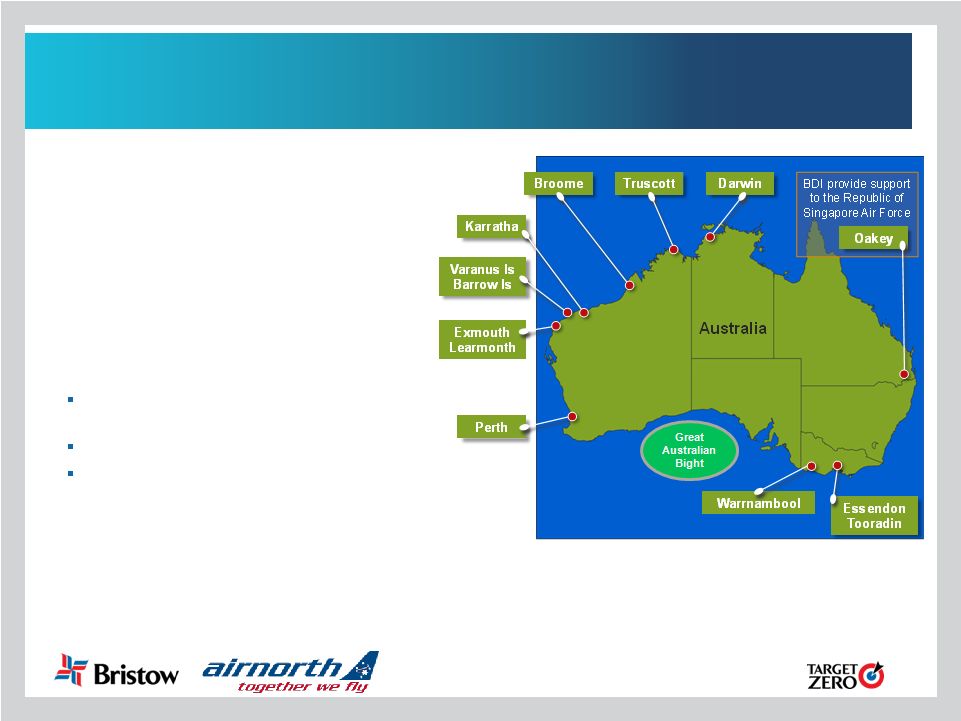
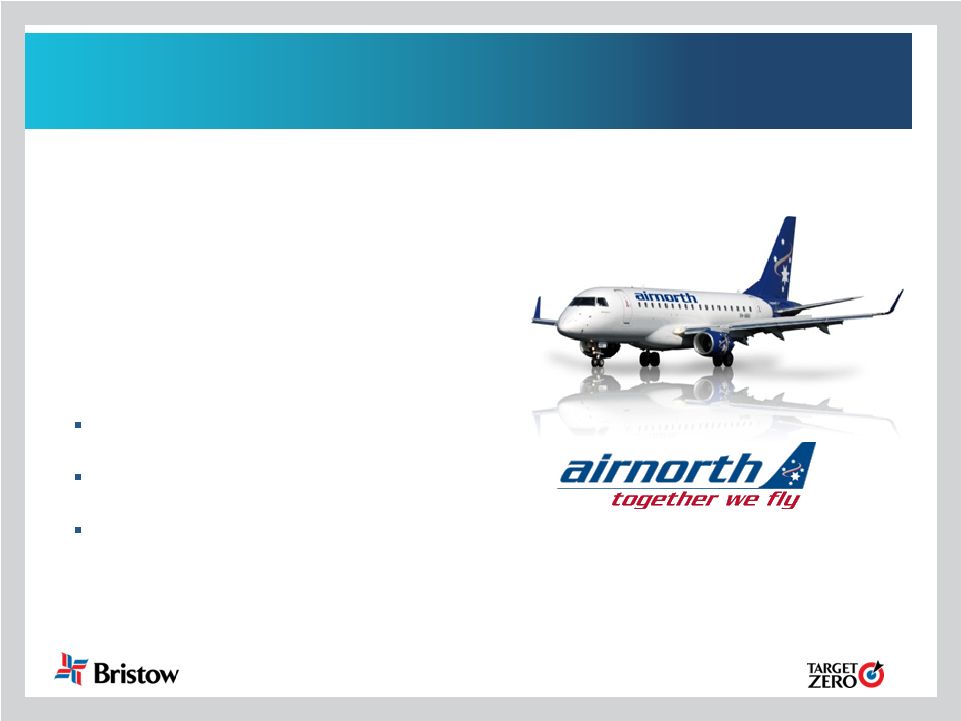
Bristow has acquired Airnorth, Northern Australia’s
largest regional airline
•
Bristow acquired an 85% interest in the privately
owned Airnorth
•
Airnorth is an Australian regional fixed-wing
operator with a balanced portfolio of charter and
scheduled flights servicing oil and gas and mining
clients from its Darwin hub
•
Airnorth is a codeshare partner with Qantas
•
Bristow’s investment is A$30M ($24M USD) with a
possible A$17M ($13.5M USD)
earn out over
~ three years and includes:
13 fixed-wing aircraft to meet demand for fixed
wing/rotor wing tenders from oil and gas clients
Current CEO will retain the remaining 15%,
subject to a Bristow call option
Financial results from Airnorth will be
consolidated within Bristow’s AUSBU |
 16
Airnorth provides scale, stability and positive
financial impact for Bristow
This
investment
solidifies
Bristow’s
ability
to
offer
point-to-point
transportation
services
in
four
of
its
five
business
units
leveraging
an
integrated
rotary
and
fixed
wing
services
model
•
Bristow Helicopters and Airnorth are
culturally aligned
with shared core values of
safety, quality and service
•
Together, Bristow Helicopters and Airnorth
are
positioned
to
facilitate
and
expand
passengers’
transport experience from home to
offshore bases, a market niche underserved by
major airlines
•
Exclusive Darwin hub provides access to
key markets
in which Bristow can introduce
integrated fixed and rotary wing logistics to
existing and potential clients
•
Financially attractive investment
with
expected immediately accretive EBITDAR,
BVA and EPS
See
10-Q
Note
11
“Subsequent
Event”
for
more
information
Combined BRS and Airnorth locations
BRS locations
Airnorth locations
Airnorth regular passenger transport route
Airnorth charter route
Planned LNG plant
Operational LNG plant
Domestic gas plant |
 17
•
Other International contributed 8% of Bristow operating
revenue and 5% of adjusted EBITDAR* in Q3 FY15
•
Operating revenue increased to $32.6M in Q3 FY15 vs.
$30.8M in Q3 FY14 due to addition of a contract in
Tanzania and increased activity in Trinidad
•
Adjusted EBITDAR decreased to $6.8M in Q3 FY15 vs.
$10.2M in Q3 FY14 and adjusted EBITDAR margin
decreased to 20.7% in Q3 FY15 from 33.2% in Q3 FY14
primarily as the result of foreign currency exchange rate
changes
* Operating revenue and adjusted EBITDAR percentages exclude corporate and
other Consolidated in OIBU
Unconsolidated Affiliate
Other International (OIBU)
Outlook:
Despite headwinds from current price environment, several opportunities
continue in Africa, Russia and southeast Asia
BU restructuring to simplify business and reduce operating costs
Currently evaluating opportunities in point-to-point transportation
services FY15 adjusted EBITDAR margin expected to ~ mid thirties
|
 18
Líder update
* Reconciliation of adjusted EBITDAR, leverage and BVA provided in the
appendix Líder adjusted EBITDAR*
•
CY14 adjusted EBITDAR was flat year-over-year
despite unfavorable changes in foreign currency
rates
•
Absolute BVA contribution to Bristow from Líder
was $5.1M* in Q3 FY15 (December 31, 2014)
•
Adjusted debt to TTM adjusted EBITDAR
increased to 2.9x as of December 31, 2014 from
2.8x as of December 31, 2013
Outlook:
Petrobras medium aircraft tender
closed on January 22
Petrobras large aircraft tender
closed on January 29
Despite its current situation, lower
lifting costs position Petrobras to
grow over the long term benefiting
the industry |
 Current and future financial
performance
John Briscoe, SVP and CFO |
 20
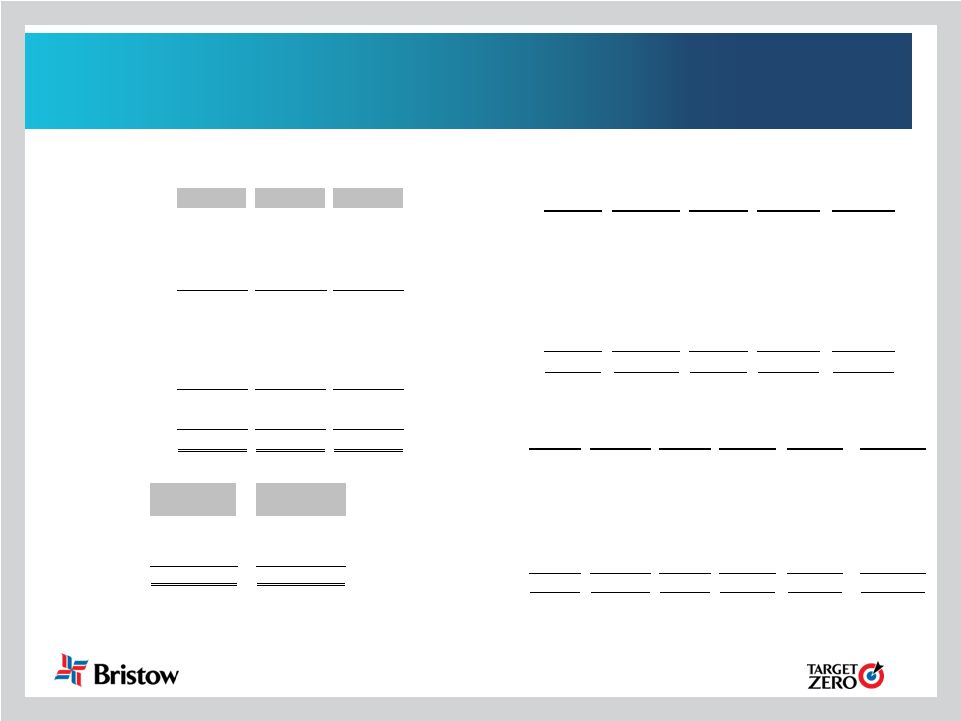
$0.85
$0.70
$0.43
$0.30
$0.28
Q3 FY14
Operations
Corporate and Other
FX Changes
Q3 FY15
Financial highlights:
Adjusted EPS and adjusted EBITDAR summary year-over-year
Q3 FY14 to Q3 FY15 adjusted EPS bridge
$100.7
$109.1
$36.5
$15.7
$12.4
Q3 FY14
Operations
Corporate and Other
FX Changes
Q3 FY15
Q3 FY14 to Q3 FY15 adjusted EBITDAR bridge (in millions)
Note: Adjusted EPS and adjusted EBITDAR amounts exclude gains and losses on
dispositions of assets and any special items during the period. See reconciliation of these items
to GAAP in our earnings release for the quarter ended December 31, 2014.
|
 21
LACE and LACE rate continue to increase led by new
technology aircraft and improved utilization/terms
FY15 average LACE guidance range changed to 165-170 and average LACE rate
guidance
range
changed
to
$9.00
-
$9.50
million
* See appendix hereto for more information on LACE and LACE
rate. Consolidated commercial aircraft, LACE and LACE rate exclude Bristow Academy, affiliate aircraft, fixed
wing aircraft, aircraft held for sale, aircraft construction in progress and
reimbursable revenue. |
 22
Bristow Value Added (BVA) drives improving Gross Cash
Flow (GCF) performance
•
Q3 FY15 absolute BVA is positive $19.7M, a $7.6M or 63% increase from Q3
FY14 •
Year-over-year change in BVA is driven by:
Solid revenue growth
Margin improvement
Capital efficiency efforts
•
EBU and NABU generated key improvements year-over-year
Note: BVA is computed by subtracting a capital charge (10.5%) for the use of gross
invested capital from after tax operating cash flow. GCF Return % is based
on trailing twelve months after tax operating cash flows (Gross Cash Flow) over average quarterly gross invested capital (Gross Operating Assets).
Refer to the appendix for additional details. |
 23
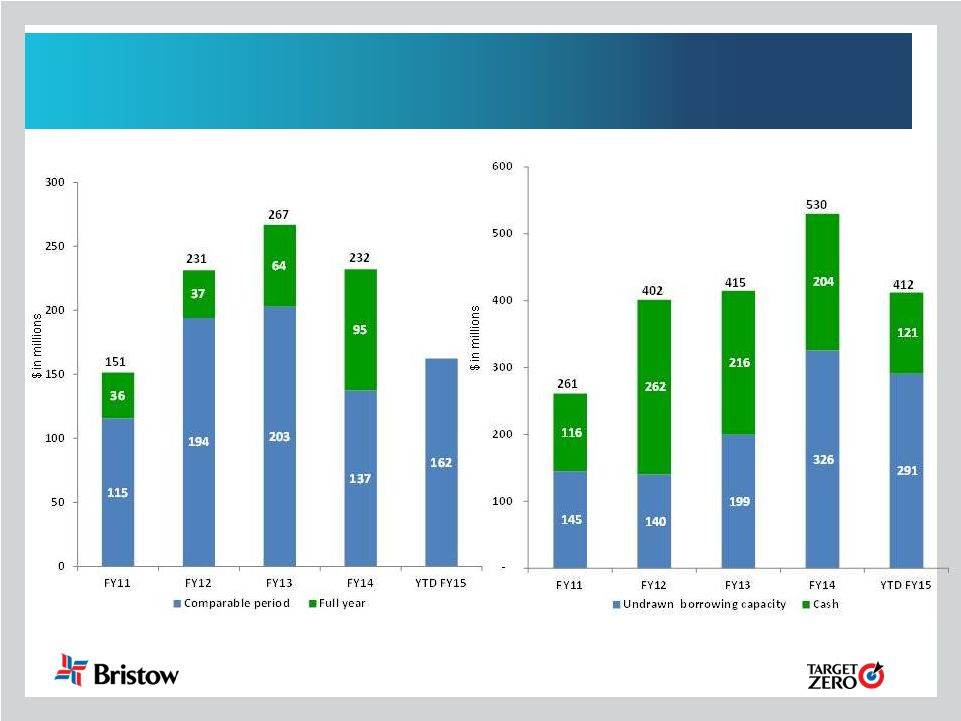
Our progress on BVA yields stronger operating cash flow
for growth, dividends and share repurchases
Net
cash
provided
by
operating
activities
1
Total liquidity
2
1)
See 10-Q for more information on cash flow provided by operating
activities. 2)
At period end |
  24
FY15 guidance updated . . .
•
FY15
adjusted
EPS
guidance
range
is
reduced
to
$4.05
-
$4.45,
excluding special items and aircraft sales. FY15 guidance
includes:
*Assuming
FY15
revenue
earned
in
same
regions
and
same
mix
as
in
FY14.
Highlighted figures have changed since the last earnings release.
Average LACE (Large AirCraft
Equivalent)
~165-170
Interest expense
~ $28 - $32M
Average LACE Rate
~ $9.00 - $9.50M
Rent expense (aircraft only)
~$140 - $145M
G & A expense (all inclusive)
~ $245 - $250M
Tax rate*
~ 20 - 23%
Depreciation expense
~ $100 - $105M
Adj. EPS guidance
$4.05 - $4.45
FY15 guidance as of December 31, 2014 |
 25
. . . as we continue to invest for Bristow’s future
•
Our Q3 FY15 financial performance is similar to our last quarter:
excellent BVA and operating cash flow, with adjusted EPS lower than
expectations
•
Declines in recent oil prices with a strengthening dollar are negatively
impacting our business in the short term
•
The FY16 perspective and beyond remains positive given new
production-oriented contracts and UK SAR
•
We continue to work with clients to identify cost effective logistics
solutions, with our recent Airnorth acquisition as a prime example
•
We expect improving BVA, cash flow, and EPS performance, with a
commitment to cost control, future prudent investment, and a
balanced shareholder return, including doubling of our annual
dividend every three to five years |
 Appendix |
 27
Organizational chart -
as of December 31, 2014
Business Unit
(% of FY15 operating revenue)
Corporate
Region
( # of aircraft / # of locations)
Joint Venture
(# of aircraft)
Key
Operated Aircraft
Bristow owned and/or operated 369
aircraft as of December 31, 2014
Affiliated Aircraft
Bristow affiliates and joint
ventures operated 131 aircraft
as of December 31, 2014
* Includes corporate and other |
 28
Aircraft fleet –
medium and large
as of December 31, 2014
Next Generation Aircraft
Medium capacity 12-15 passengers
Large capacity 16-25 passengers
Mature Aircraft
Fair
market
value
of
our
owned
fleet
is
~$1.9
billion
and
leased
fleet
is
~$1.6
billion
Aircraft
Type
No. of PAX
Engine
Consl
Unconsl
Total
Ordered
Large Helicopters
AS332 L Super Puma
18
Twin Turbine
17
-
17
-
AW189
16
Twin Turbine
2
-
2
15
EC175
16
Twin Turbine
-
-
-
5
EC225
19
Twin Turbine
26
-
26
1
Mil Mi 8
20
Twin Turbine
7
-
7
-
Sikorsky S-61
25
Twin Turbine
2
-
2
-
Sikorsky S-92
19
Twin Turbine
69
9
78
6
123
9
132
27
LACE
111
Medium Helicopters
AW139
12
Twin Turbine
22
2
24
3
Bell 212
12
Twin Turbine
-
14
14
-
Bell 412
13
Twin Turbine
22
19
41
-
EC155
13
Twin Turbine
1
-
1
-
Sikorsky S-76A/A++
12
Twin Turbine
-
5
5
-
Sikorsky S-76C/C++
12
Twin Turbine
51
34
85
-
Sikorsky S-76D
12
Twin Turbine
3
-
3
7
99
74
173
10
LACE
47
|
 29
Aircraft fleet –
small, training and fixed
as of December 31, 2014 (continued)
Mature Aircraft
Small capacity 4-7 passengers
Training capacity 2-6 passengers
* LACE does not include held for sale, training helicopters and fixed wing
Next Generation Aircraft
Aircraft
Type
No. of PAX
Engine
Consl
Unconsl
Total
Ordered
Small Helicopters
AW109
6
Twin Turbine
-
1
1
AS 350BB
4
Turbine
-
2
2
Bell 206B
4
Turbine
1
2
3
-
Bell 206 L Series
6
Turbine
5
6
11
-
Bell 407
6
Turbine
32
-
32
-
BK-117
7
Twin Turbine
2
-
2
-
EC135
6
Twin Turbine
-
3
3
-
40
14
54
-
LACE
10
Training Helicopters
AW109
6
Twin Turbine
2
-
2
-
AS 355
5
Twin turbine
2
-
2
-
Bell 206B
4
Turbine
12
-
12
-
Robinson R22
2
Piston
8
-
8
-
Robinson R44
4
Piston
7
-
7
-
Sikorsky 300CB/CBi
2
Piston
42
-
42
-
Fixed Wing
1
-
1
-
74
-
74
-
Fixed Wing
33
34
67
-
Total
369
131
500
37
TOTAL LACE (Large Aircraft Equivalent)*
168 |
 30
Small
Medium
Large
Total
Leased LACE
Total LACE
% Leased
EBU
-
3
37
40
39
70
55%
WASBU
-
1
1
2
2
20
8%
NABU
1
13
5
19
12
34
35%
AUSBU
2
2
7
11
9
24
36%
OIBU
-
-
-
-
-
22
-
Total
3
19
50
72
60
168
36%
Operating lease strategy: lowering the cost and amount of
capital needed to grow
•
Of the 115 aircraft currently leased in our fleet, 72 are commercial (60 LACE), 30
are training and 13 fixed wing
•
60 LACE aircraft represent approximately 36% of our commercial fleet
•
Our
goal
is
for
commercial
fleet
operating
leases
to
account
for
approximately
30-35% of our LACE
Leased aircraft as of December 31, 2014
* The percentage of LACE leased is calculated by taking the total LACE for leased
aircraft divided by the total LACE for all aircraft we operate, including both owned and leased aircraft.
See
10-Q
Note
5
“Commitments
and
Contingencies”
for
more
information
provided
on
operating
leases.
* |
 31
Consolidated fleet changes and aircraft sales for Q3 FY15
See
10-Q
Note
5
“Commitments
and
Contingencies”
for
more
information
provided
on
operating
leases.
# of aircraft
sold
Cash
received*
Q1 FY15
4
4.7
$
Q2 FY15
7
8.2
$
Q3 FY15
4
2.5
$
Total
15
15.4
$
* Amounts stated in millions
Small
Medium
Large
Training
Fixed wing
Total
EBU
-
3
37
-
13
53
WASBU
-
1
1
-
-
2
NABU
1
13
5
-
-
19
AUSBU
2
2
7
-
-
11
OIBU
-
-
-
-
-
-
Academy
-
-
-
30
-
30
Total
3
19
50
30
13
115
Leased aircraft in consolidated fleet
Q1 FY15
Q2 FY15
Q3 FY15
Fleet Count Beginning
363
363
363
Delivered
Large
6
2
4
Medium
3
-
2
Total Delivered
9
2
6
Removed
Sales
(4)
(7)
(4)
Other*
(5)
5
4
Total Removed
(9)
(2)
-
363
363
369
* Includes writeoffs, lease returns and commencements
Fleet changes
Small
Medium
Large
Training
Total
EBU
-
-
8
-
8
WASBU
-
2
2
-
4
NABU
-
-
-
-
-
AUSBU
-
-
2
-
2
OIBU
-
3
-
-
3
Academy
-
-
-
1
1
Total
-
5
12
1
18
Held for sale aircraft in consolidated fleet |
 32
Operating revenue, LACE and LACE rate by BU
4
1)
$ in millions
2)
LACE rate is annualized
3)
$ in millions per LACE
4)
Excludes Bristow Academy and Eastern Airways
YTD op revenue
1
LACE
LACE Rate
2,3
EBU
$487
70
$9.33
WASBU
241
20
16.04
NABU
176
34
7.00
AUSBU
146
24
8.29
OIBU
104
22
6.44
Total
$1,176
168
$9.33
Operating Revenue, LACE, and LACE Rate by BU
as of December 31, 2014 |
 33
Historical LACE by BU
Q1
Q2
Q3
Q4
Q1
Q2
Q3
Q4
Q1
Q2
Q3
Q4
EBU
45
45
45
42
42
43
48
46
44
46
46
45
WASBU
23
23
24
25
24
24
21
22
23
22
22
22
NABU
39
36
36
36
39
35
34
29
30
29
30
30
AUSBU
20
20
22
22
20
23
24
20
19
20
20
19
OIBU
36
34
34
35
33
33
33
38
39
38
38
34
Consolidated
163
158
161
160
157
158
159
154
154
154
155
149
Q1
Q2
Q3
Q4
Q1
Q2
Q3
Q4
Q1
Q2
Q3
EBU
47
45
51
55
57
59
59
56
61
67
70
WASBU
22
22
20
21
21
21
22
23
23
23
20
NABU
30
31
39
37
37
33
34
34
33
32
34
AUSBU
18
17
17
19
19
19
20
22
23
22
24
OIBU
32
28
27
27
27
28
28
24
25
23
22
Consolidated
147
142
154
158
161
160
162
158
163
166
168
LACE
FY11
FY12
FY10
FY13
FY14
FY15 |
 34
Historical LACE rate by BU
Q1
Q2
Q3
Q4
Q1
Q2
Q3
Q4
Q1
Q2
Q3
Q4
EBU
$8.36
$8.28
$8.40
$8.76
$8.20
$8.50
$7.90
$8.40
$9.80
$9.60
$9.63
$10.09
WASBU
9.08
8.81
8.66
8.34
9.70
9.40
10.70
9.90
9.10
10.30
11.17
11.46
NABU
5.05
5.44
5.26
5.23
5.40
6.10
6.00
6.60
5.80
6.30
5.89
5.79
AUSBU
5.38
5.56
5.59
5.67
6.80
6.00
6.00
7.50
8.60
7.10
6.96
7.78
OIBU
3.66
4.09
4.06
3.78
3.90
4.10
4.40
3.90
3.50
3.70
3.78
4.22
Consolidated
$6.31
$6.52
$6.49
$6.45
$6.70
$6.90
$6.90
$7.10
$7.30
$7.40
$7.43
$7.89
Q1
Q2
Q3
Q4
Q1
Q2
Q3
Q4
Q1
Q2
Q3
EBU
$10.60
$11.03
$9.74
$9.13
$9.63
$9.95
$10.30
$10.84
$10.60
$9.78
$9.33
WASBU
12.35
12.24
13.71
13.28
14.26
14.62
14.17
13.99
14.21
14.23
16.04
NABU
7.05
7.11
5.84
6.12
6.34
7.13
6.75
6.84
7.02
7.04
7.00
AUSBU
8.48
9.29
9.55
8.58
8.04
7.74
7.21
6.76
8.27
8.72
8.29
OIBU
4.22
4.62
4.76
4.94
4.97
4.73
4.58
5.57
5.80
6.20
6.44
Consolidated
$8.55
$8.95
$8.49
$8.35
$8.78
$9.07
$8.97
$9.34
$9.55
$9.43
$9.33
LACE Rate
1,2
FY10
FY11
FY12
FY13
FY14
FY15
1)
$ in millions
2)
LACE rate is annualized |
 35
Order and options book as of December 31, 2014
1)
Five
large
aircraft
on
order
and
seven
large
aircraft
on
option
are
subject
to
the
successful
development
and
certification
of
the
aircraft
2)
SAR configured
#
Helicopter
Class
Delivery Date
2
Large
June-16
3
Medium
June-16
3
Large
September-16
2
Medium
September-16
4
Large
December-16
1
Medium
December-16
2
Large
March-17
1
Medium
March-17
2
Large
June-17
1
Medium
June-17
3
Large
September-17
1
Medium
September-17
4
Large
December-17
3
Medium
December-17
1
Large
March-18
2
Medium
March-18
1
Large
June-18
1
Large
September-18
1
Large
December-18
1
Large
March-19
39
OPTIONS BOOK
#
Helicopter
Class
Delivery Date
Location
Contracted
3
Medium
March-15
IBU
3 of 3
3
Medium
June-15
WASBU
2
Large
September-15
EBU
2
1
Large
September-15
NABU
1 of 1
4
Medium
September-15
WASBU
2
Large
December-15
AUSBU
2
1 of 2
2
Large
December-15
EBU
2
Large
December-15
EBU
2
1
Large
March-16
EBU
1
Large
June-16
EBU
1
Large
June-16
NABU
1
Large
September-16
NABU
2
Large
December-16
NABU
1
Large
March-17
NABU
26
5 of 26
ORDER BOOK
1 |
 36
Order and options book as of December 31, 2014 (continued)
#
Helicopter
Class
Delivery Date
Location
Contracted
5
Large
March-15
EBU
5 of 5
2
Large
June-15
EBU
2 of 2
2
Large
June-15
EBU
2 of 2
2
Large
September-15
EBU
2 of 2
2
Large
December-15
EBU
2 of 2
13
13 of 13
The aircraft that are indicated in grey italic will be leased upon delivery.
UK SAR CONFIGURED ORDER BOOK |
 37
Total net asset FMV with and without leased aircraft FMV
NOTE: The gray shaded area represents the range of FMV with and without the impact
of leased aircraft (upper range includes leased aircraft and related NPV of lease payments; lower
range excludes FMV of leased aircraft as well as the NPV of lease
payments). The
reconciliation
for
net
asset
FMV
per
share
(
)
and
net
asset
FMV
per
share
implied
by
our
UK
SAR
aircraft
(
)
is
provided
on
the
following
pages.
shaded area |
 38
Net asset FMV reconciliation as of December 31, 2014
(in millions)
Including leases
Excluding leases
(+) FMV of aircraft
$1,944
$1,944
(+) FMV of leased aircraft
1,564
-
(+) NBV of PPE without aircraft
576
576
(+) Working capital
259
259
(-) LT debt
(804)
(804)
(-) Leased imputed debt
(650)
-
(-) Pension liability
(62)
(62)
Net asset FMV
$2,828
$1,913
# of common shares
35.1
35.1
Net asset FMV per share
$80.62
$54.55
December 31, 2014 |
 39
UK SAR net asset FMV reconciliation
UK SAR contribution
(in millions)
December 31, 2014
FY16 - FY17
Implied
(+) FMV of aircraft
$1,944
$79
$2,023
(+) FMV of leased aircraft
1,564
172
1,737
(+) NBV of PPE without
aircraft 576
113
689
(+) Working
capital 259
174
433
(-) LT
debt (804)
(88)
(892)
(-) Leased
imputed debt (650)
(95)
(744)
(-) Pension
liability (62)
-
(62)
Net
asset FMV $2,828
$355
$3,183
# of common shares
35.1
35.1
35.1
Net asset FMV per
share $80.62
$10.13
$90.75 |
 40
Adjusted EBITDAR margin* trend
*
Adjusted
EBITDAR
excludes
special
items
and
asset
dispositions
and
margin
is
calculated
by
taking
adjusted
EBITDAR
divided
by
operating
revenue
Q1
Q2
Q3
Q4
Full Year
Q1
Q2
Q3
Q4
Full Year
EBU
33.0%
31.4%
30.7%
36.1%
32.9%
32.2%
34.6%
39.5%
38.3%
36.2%
WASBU
29.5%
35.5%
37.2%
36.6%
35.0%
31.9%
26.5%
35.0%
31.8%
31.5%
NABU
14.3%
20.6%
14.8%
19.4%
17.3%
23.2%
20.7%
29.1%
29.5%
25.7%
AUSBU
20.2%
14.4%
23.5%
35.6%
24.3%
27.0%
28.0%
27.3%
26.0%
27.1%
OIBU
48.1%
19.1%
47.8%
42.9%
39.5%
36.2%
44.2%
55.7%
51.6%
46.6%
Consolidated
23.4%
24.0%
27.6%
31.2%
26.6%
26.3%
26.1%
31.5%
29.4%
28.3%
Q1
Q2
Q3
Q4
Full Year
Q1
Q2
Q3
EBU
30.3%
35.3%
35.3%
37.3%
34.7%
34.1%
33.7%
33.1%
WASBU
31.3%
30.4%
33.5%
33.2%
32.1%
25.6%
31.1%
34.6%
NABU
29.2%
31.0%
33.1%
35.4%
32.1%
39.7%
32.4%
40.0%
AUSBU
17.7%
21.0%
15.0%
24.0%
19.6%
23.7%
22.6%
25.4%
OIBU
67.4%
39.3%
33.2%
53.3%
47.7%
41.4%
18.5%
20.7%
Consolidated
28.5%
28.7%
27.0%
30.4%
28.6%
29.2%
25.4%
25.3%
FY13
FY14
FY12
FY15 |
 41
Adjusted EBITDAR* reconciliation
* Adjusted EBITDAR excludes special items and asset dispositions
($ in millions)
Q1
Q2
Q3
Q4
FY12
Q1
Q2
Q3
Q4
FY13
Net income
$21
$3
$26
$15
$65
$24
$30
$37
$40
$132
Income tax expense
$7
-$2
$7
$2
$14
$6
$8
$8
$13
$35
Interest expense
$9
$9
$10
$10
$38
$9
$9
$15
$10
$42
Gain on disposal of assets
-$1
$2
$3
$29
$32
$5
$1
-$7
-$7
-$8
Depreciation and amortization
$23
$25
$23
$25
$96
$21
$23
$25
$27
$96
Special items
$0
$25
$0
$3
$28
$2
-$2
$15
$2
$16
Adjusted EBITDA Subtotal
$58
$62
$69
$84
$273
$68
$70
$92
$85
$314
Rental expense
$9
$9
$13
$15
$46
$16
$15
$18
$18
$67
Adjusted EBITDAR
$67
$71
$82
$99
$319
$84
$85
$109
$103
$381
($ in millions)
Q1
Q2
Q3
Q4
FY14
Q1
Q2
Q3
Net income
$27
$110
$19
$32
$188
$45
$28
$0
Income tax expense
$8
$41
$3
$6
$57
$12
$6
$1
Interest expense
$20
$9
$7
$8
$45
$7
$8
$7
Gain on disposal of assets
$2
$3
-$4
$0
$1
-$1
$0
$26
Depreciation and amortization
$23
$24
$24
$26
$96
$25
$28
$24
Special items
$0
-$102
$24
$20
-$59
$6
$7
$5
Adjusted EBITDA Subtotal
$79
$85
$72
$92
$328
$95
$77
$63
Rental expense
$23
$23
$28
$31
$106
$33
$35
$46
Adjusted EBITDAR
$102
$109
$101
$123
$434
$128
$112
$109
Fiscal year ended,
3/31/2012
3/31/2013
3/31/2014
3/31/2015
Fiscal year ended, |
 42
Bristow Value Added (BVA)
Sample calculation for Q3 FY15 and Q3 FY14
Bristow Value Added = Gross Cash Flow –
(Gross Operating Assets X Capital Charge)
BVA = GCF –
(GOA x 10.5%**)
Bristow Value Added calculation for Q3 FY15
$19.7 = $118.1* –
($3,751* x 2.625%**)
Bristow Value Added calculation for Q3 FY14
$12.1 = $100.8* –
($3,378* x 2.625%**)
* Reconciliation for these items follows right after this
slide ** Quarterly capital charge of 2.625% is based on annual
capital charge of 10.5% |
 43
Bristow gross cash flow reconciliation
(in millions)
Gross cash flow reconciliation
Q3 FY14
Q3 FY15
Net income
19
(1)
Depreciation and amortization
24
24
Interest expense
7
7
Interest income
(0)
(0)
Rent
28
46
Other income/expense-net
1
1
Gain/loss on asset sale
(4)
26
Special items
4
7
Tax effect from special items
(4)
(7)
Earnings (losses) from unconsolidated affiliates, net
16
1
Non-controlling interests
0
1
Gross cash flow before Líder
$91
$106
Gross cash flow - Líder proportional
10
12
Gross cash flow after Líder
$101
$118 |
 44
Bristow adjusted gross operating assets reconciliation
(in millions)
Adjusted gross operating assets reconciliation
Q3 FY14
Q3 FY15
Total assets
3,277
3,180
Accumulated depreciation
530
495
Capitalized operating leases
419
660
Cash and cash equivalents
(323)
(121)
Investment in unconsolidated entities
(255)
(257)
Goodwill
(30)
(54)
Intangibles
(2)
(16)
Assets held for sale: net
(22)
(26)
Assets held for sale: gross
48
110
Adj. for gains & losses on assets sales
(5)
28
Accounts payable
(60)
(90)
Accrued maintenance and repairs
(17)
(19)
Other accrued taxes
(8)
(8)
Accrued wages, benefits and related taxes
(67)
(77)
Other accrued liabilities
(145)
(110)
Income taxes payable
(20)
(8)
Deferred revenue
(23)
(29)
ST deferred taxes
(2)
(13)
LT deferred taxes
(146)
(163)
Adjusted gross operating assets before Líder
$3,150
3,482
Adjusted gross operating assets -
Líder proportional
228
269
Adjusted gross operating assets after Líder
$3,378
3,751 |
 45
Líder Bristow Value Added (BVA)
Sample calculation for Q3 FY15 and Q3 FY14
Bristow Value Added = Gross Cash Flow –
(Gross Operating Assets X Capital Charge)
BVA = GCF –
(GOA x 10.5%** )
Bristow Value Added calculation for Q3 FY15
$5.1 = $12.2* –
($269* x 2.625%**)
Bristow Value Added calculation for Q3 FY14
$4.2 = $10.2* –
($228* x 2.625%**)
* Reconciliation for these items follows right after this
slide ** Quarterly capital charge of 2.625% is based on annual
capital charge of 10.5% |
 46
Líder gross cash flow reconciliation
($ in millions)
Gross cash flow reconciliation
Q3 FY13
Q3 FY15
Net income (loss)
7.1
$
(6.5)
$
Depreciation and amortization
3.6
3.5
Rent
6.5
7.4
Interest expense
3.7
4.4
Interest income
(1.2)
(1.4)
FX (gains) losses
6.4
15.7
Other income/expense-net
(1.2)
(0.2)
Special Adjustment- remove Lider tax per income stmt.
1.1
5.2
Earnings (losses) from unconsolidated affiliates, net
0.2
-
Non-controlling Interests
(0.4)
0.6
Gross cash flow
25.7
28.8
Special item outside of Líder - add Bristow tax calc.
(1.9)
0.3
Gross cash flow
23.9
29.1
Líder proportional consolidation - GCF
10.0
$
12.2
$ |
 47
Líder adjusted gross operating assets reconciliation
($ in millions)
Adjusted gross operating assets reconciliation
Q3 FY14
Q3 FY15
Total assets
589
$
611
$
Cash and cash equivalents
(100)
(67)
Accumulated depreciation
75
80
Capitalized operating leases
129
148
Investments & escrow deposits
(33)
(46)
Intangibles
(5)
(5)
Intangibles, amortization
4
4
Other, non operating assets
(19)
(19)
Adj. for gains & losses on assets sales
-
-
Accounts payable
(26)
(29)
Other payables
(1)
(0)
Other accrued taxes
-
(6)
Accrued wages, benefits and related taxes
(25)
(20)
Income taxes payable
(5)
(5)
Deferred revenue
(11)
(5)
LT deferred taxes
(34)
-
Adjusted gross operating assets
537
643
Líder proportional consolidation GOA
225
$
269
$
|
 48
Líder's adjusted EBITDAR* reconciliation
* Adjusted EBITDAR excludes special items and asset dispositions
($ in millions)
Q4 CY13
Q1 CY14
Q2 CY14
Q3 CY14
Q4 CY14
Gross revenue
119.3
121.2
113.7
116.4
100.9
(-) Revenue deductions
(7.6)
(5.9)
(7.3)
(7.7)
(6.1)
Net operating revenue
111.3
115.3
106.4
108.7
94.8
(-) Cost of products and services
(87.0)
(90.8)
(79.5)
(82.0)
(72.1)
Gross profit
24.6
24.5
26.9
26.6
22.7
(-) Selling and administrative expenses
(9.6)
(7.0)
(7.5)
(8.8)
(9.0)
(+) Equity income of associates
(0.0)
0.5
0.8
(0.6)
(0.2)
(+) Other operating income/expenses
0.7
0.2
0.2
0.2
11.7
Operating result
15.7
18.3
20.4
17.5
25.2
(+) Depreciation and amortization
3.5
3.4
3.5
3.5
3.3
EBITDA
19.2
21.6
23.9
21.0
28.5
Leasing costs
7.3
7.4
7.3
7.4
6.8
Adjusted EBITDAR
26.4
29.1
31.2
28.4
35.3
|
 49
GAAP reconciliation
1)
See information about special items in 10-Q or earnings release for Q3
FY15 2)
These amounts are presented after applying the appropriate tax effect to each item
and dividing by the weighted average shares outstanding during the related period to calculate the earnings
per share impact
2014
2013
2014
2013
Adjusted operating income
$43,564
$49,056
$161,303
$165,293
Gain (loss) on disposal of assets
(26,331)
3,982
(25,594)
(803)
Special
items
1
(8,317)
(23,536)
(17,537)
(24,934)
Operating income
$8,916
$29,502
$118,172
$139,556
Adjusted EBITDAR
$109,056
$100,677
$347,494
$310,968
Gain (loss) on disposal of assets
(26,331)
3,982
(25,594)
(803)
Special items
1
(5,086)
(23,536)
(16,207)
78,990
Depreciation and amortization
(23,625)
(23,655)
(77,164)
(70,332)
Rent expense
(46,282)
(28,255)
(114,839)
(74,630)
Interest expense
(7,094)
(7,253)
(22,415)
(36,701)
Provision for income taxes
(567)
(2,946)
(18,376)
(51,682)
Net income
$71
$19,014
$72,899
$155,810
Adjusted net income
$24,719
$31,331
$102,159
$113,891
Gain
(loss)
on
disposal
of
assets
2
(21,033)
3,146
(20,441)
(634)
Special
items
1,2
(4,654)
(15,550)
(12,495)
43,162
Net income (loss) attributable to Bristow Group
($968)
$18,927
$69,223
$156,419
Adjusted diluted earnings per share
$0.70
$0.85
$2.87
$3.11
Gain
(loss)
on
disposal
of
assets
2
(0.60)
0.09
(0.57)
(0.02)
Special
items
1,2
(0.13)
(0.42)
(0.35)
1.18
Diluted earnings (loss) per share
($0.03)
$0.51
$1.94
$4.28
Three months ended
December 31,
Nine months ended
December 31,
(In thousands, except per share amounts) |
 50
Bristow leverage reconciliation
*Adjusted EBITDAR excludes gains and losses on dispositions of assets
Debt
Investment
Capital
Leverage
(a)
(b)
(c) = (a) + (b)
(a) / (c)
(in millions)
As of December 31, 2014
818.2
$
1,694.2
$
2,512.4
$
32.6%
Adjust for:
Unfunded Pension Liability
62.1
62.1
NPV of Lease Obligations
649.7
649.7
Letters of credit
2.5
2.5
Adjusted
1,532.5
$
(d)
1,694.2
$
3,226.7
$
47.5%
Calculation of debt to adjusted EBITDAR multiple
TTM Adjusted EBITDAR*:
FY 2015
470.2
$
(e)
= (d) / (e)
3.26:1 |
 51
Líder leverage reconciliation
(in millions)
Dec-13
Dec-14
Total book debt
279
$
310
$
NPV of leases
69
46
Total adjusted debt
348
356
TTM adjusted EBITDAR
123
$
124
$
Adjusted debt / TTM adj. EBITDAR
2.8x
2.9x |
 52
Bristow Group Inc. (NYSE: BRS)
2103 City West Blvd., 4
th
Floor
Houston, Texas 77042
t
713.267.7600
f
713.267.7620
bristowgroup.com
Contact us |