Attached files
| file | filename |
|---|---|
| EX-32.2 - EXHIBIT 32.2 - Bristow Group Inc | brsq210-q09302015ex322.htm |
| EX-31.1 - EXHIBIT 31.1 - Bristow Group Inc | brsq210-q09302015ex311.htm |
| EX-31.2 - EXHIBIT 31.2 - Bristow Group Inc | brsq210-q09302015ex312.htm |
| EX-32.1 - EXHIBIT 32.1 - Bristow Group Inc | brsq210-q09302015ex321.htm |
| EX-15.1 - EXHIBIT 15.1 - Bristow Group Inc | brsq210-q09302015ex151.htm |
UNITED STATES SECURITIES AND EXCHANGE COMMISSION
Washington, D.C. 20549
Form 10-Q | ||||
þ | QUARTERLY REPORT PURSUANT TO SECTION 13 OR 15(d) OF THE SECURITIES EXCHANGE ACT OF 1934 |
For the quarterly period ended September 30, 2015 | |
OR
o | TRANSITION REPORT PURSUANT TO SECTION 13 OR 15(d) OF THE SECURITIES EXCHANGE ACT OF 1934 |
For the transition period from to | |
Commission File Number 001-31617 | ||||
Bristow Group Inc. | ||||
(Exact name of registrant as specified in its charter) | ||||
Delaware | 72-0679819 | |
(State or other jurisdiction of incorporation or organization) | (IRS Employer Identification Number) | |
2103 City West Blvd., 4th Floor Houston, Texas | 77042 (Zip Code) | |
(Address of principal executive offices) | ||
Registrant’s telephone number, including area code:
(713) 267-7600
None | ||||
(Former name, former address and former fiscal year, if changed since last report)
Indicate by check mark whether the registrant: (1) has filed all reports required to be filed by Section 13 or 15(d) of the Securities Exchange Act of 1934 during the preceding 12 months (or for such shorter period that the registrant was required to file such reports), and (2) has been subject to such filing requirements for the past 90 days. Yes þ No ¨
Indicate by check mark whether the registrant has submitted electronically and posted on its corporate Web site, if any, every Interactive Data File required to be submitted and posted pursuant to Rule 405 of Regulation S-T during the preceding 12 months (or for such shorter period that the registrant was required to submit and post such files). Yes þ No ¨
Indicate by check mark whether the registrant is a large accelerated filer, an accelerated filer, a non-accelerated filer, or a smaller reporting company. See definitions of “large accelerated filer,” “accelerated filer” and “smaller reporting company” in Rule 12b-2 of the Exchange Act.
Large accelerated filer þ | Accelerated filer o | Non-accelerated filer o | Smaller reporting company o | |
(Do not check if a smaller reporting company) | ||||
Indicate by check mark whether the registrant is a shell company (as defined in Rule 12b-2 of the Exchange Act). | ||||
o Yes þ No | ||||
Indicate the number shares outstanding of each of the issuer’s classes of Common Stock, as of October 30, 2015.
34,941,839 shares of Common Stock, $.01 par value
BRISTOW GROUP INC.
INDEX — FORM 10-Q
Page | ||
PART I | ||
Item 1. | ||
Item 2. | ||
Item 3. | ||
Item 4. | ||
PART II | ||
Item 1. | ||
Item 1A. | ||
Item 2. | ||
Item 3. | ||
Item 4. | ||
Item 5. | ||
Item 6. | ||
PART I — FINANCIAL INFORMATION
Item 1. Financial Statements.
BRISTOW GROUP INC. AND SUBSIDIARIES
Condensed Consolidated Statements of Operations
Three Months Ended September 30, | Six Months Ended September 30, | |||||||||||||||
2015 | 2014 | 2015 | 2014 | |||||||||||||
(Unaudited) (In thousands, except per share amounts) | ||||||||||||||||
Gross revenue: | ||||||||||||||||
Operating revenue from non-affiliates | $ | 398,010 | $ | 418,169 | $ | 818,023 | $ | 834,074 | ||||||||
Operating revenue from affiliates | 21,001 | 22,289 | 41,099 | 43,719 | ||||||||||||
Reimbursable revenue from non-affiliates | 27,900 | 35,178 | 54,785 | 70,381 | ||||||||||||
446,911 | 475,636 | 913,907 | 948,174 | |||||||||||||
Operating expense: | ||||||||||||||||
Direct cost | 307,564 | 302,195 | 638,243 | 596,058 | ||||||||||||
Reimbursable expense | 26,695 | 33,309 | 52,862 | 65,917 | ||||||||||||
Depreciation and amortization | 37,387 | 28,205 | 74,533 | 53,539 | ||||||||||||
General and administrative | 53,457 | 61,724 | 114,789 | 122,156 | ||||||||||||
425,103 | 425,433 | 880,427 | 837,670 | |||||||||||||
Loss on impairment | (22,274 | ) | (3,362 | ) | (27,713 | ) | (3,362 | ) | ||||||||
Gain (loss) on disposal of assets | (14,007 | ) | 127 | (21,702 | ) | 737 | ||||||||||
Earnings from unconsolidated affiliates, net of losses | (15,360 | ) | (2,904 | ) | (9,064 | ) | 1,377 | |||||||||
Operating income (loss) | (29,833 | ) | 44,064 | (24,999 | ) | 109,256 | ||||||||||
Interest expense, net | (7,179 | ) | (7,572 | ) | (14,848 | ) | (14,699 | ) | ||||||||
Other income (expense), net | (11,424 | ) | (2,681 | ) | (7,585 | ) | (3,920 | ) | ||||||||
Income (loss) before provision for income taxes | (48,436 | ) | 33,811 | (47,432 | ) | 90,637 | ||||||||||
Benefit (provision) for income taxes | 2,756 | (5,986 | ) | 123 | (17,809 | ) | ||||||||||
Net income (loss) | (45,680 | ) | 27,825 | (47,309 | ) | 72,828 | ||||||||||
Net income attributable to noncontrolling interests | (1,452 | ) | (1,743 | ) | (3,080 | ) | (2,637 | ) | ||||||||
Net income (loss) attributable to Bristow Group | (47,132 | ) | 26,082 | (50,389 | ) | 70,191 | ||||||||||
Accretion of redeemable noncontrolling interest | 4,803 | — | (1,498 | ) | — | |||||||||||
Net income (loss) attributable to common stockholders | $ | (42,329 | ) | $ | 26,082 | $ | (51,887 | ) | $ | 70,191 | ||||||
Earnings (loss) per common share: | ||||||||||||||||
Basic | $ | (1.21 | ) | $ | 0.74 | $ | (1.49 | ) | $ | 1.98 | ||||||
Diluted | $ | (1.21 | ) | $ | 0.73 | $ | (1.49 | ) | $ | 1.96 | ||||||
Cash dividends declared per common share | $ | 0.34 | $ | 0.32 | $ | 0.68 | $ | 0.64 | ||||||||
The accompanying notes are an integral part of these condensed consolidated financial statements.
1
BRISTOW GROUP INC. AND SUBSIDIARIES
Condensed Consolidated Statements of Comprehensive Income
Three Months Ended September 30, | Six Months Ended September 30, | |||||||||||||||
2015 | 2014 | 2015 | 2014 | |||||||||||||
(Unaudited) (In thousands) | ||||||||||||||||
Net income (loss) | $ | (45,680 | ) | $ | 27,825 | $ | (47,309 | ) | $ | 72,828 | ||||||
Other comprehensive income: | ||||||||||||||||
Currency translation adjustments | (16,950 | ) | (19,507 | ) | (4,342 | ) | (10,516 | ) | ||||||||
Total comprehensive income (loss) | (62,630 | ) | 8,318 | (51,651 | ) | 62,312 | ||||||||||
Net income attributable to noncontrolling interests | (1,452 | ) | (1,743 | ) | (3,080 | ) | (2,637 | ) | ||||||||
Currency translation adjustments attributable to noncontrolling interests | (1,535 | ) | (183 | ) | 571 | 34 | ||||||||||
Total comprehensive income attributable to noncontrolling interests | (2,987 | ) | (1,926 | ) | (2,509 | ) | (2,603 | ) | ||||||||
Total comprehensive income (loss) attributable to Bristow Group | (65,617 | ) | 6,392 | (54,160 | ) | 59,709 | ||||||||||
Accretion of redeemable noncontrolling interests | 4,803 | — | (1,498 | ) | — | |||||||||||
Total comprehensive income (loss) attributable to common stockholders | $ | (60,814 | ) | $ | 6,392 | $ | (55,658 | ) | $ | 59,709 | ||||||
The accompanying notes are an integral part of these condensed consolidated financial statements.
2
BRISTOW GROUP INC. AND SUBSIDIARIES
Condensed Consolidated Balance Sheets
September 30, 2015 | March 31, 2015 | |||||||
(Unaudited) | ||||||||
(In thousands) | ||||||||
ASSETS | ||||||||
Current assets: | ||||||||
Cash and cash equivalents | $ | 139,341 | $ | 104,146 | ||||
Accounts receivable from non-affiliates | 227,109 | 250,610 | ||||||
Accounts receivable from affiliates | 4,676 | 8,008 | ||||||
Inventories | 145,731 | 147,169 | ||||||
Assets held for sale | 41,242 | 57,827 | ||||||
Prepaid expenses and other current assets | 75,906 | 70,091 | ||||||
Total current assets | 634,005 | 637,851 | ||||||
Investment in unconsolidated affiliates | 196,350 | 216,376 | ||||||
Property and equipment – at cost: | ||||||||
Land and buildings | 237,704 | 171,959 | ||||||
Aircraft and equipment | 2,445,026 | 2,493,869 | ||||||
2,682,730 | 2,665,828 | |||||||
Less – Accumulated depreciation and amortization | (527,140 | ) | (508,727 | ) | ||||
2,155,590 | 2,157,101 | |||||||
Goodwill | 52,404 | 75,628 | ||||||
Other assets | 162,703 | 143,764 | ||||||
Total assets | $ | 3,201,052 | $ | 3,230,720 | ||||
LIABILITIES, REDEEMABLE NONCONTROLLING INTERESTS AND STOCKHOLDERS’ INVESTMENT | ||||||||
Current liabilities: | ||||||||
Accounts payable | $ | 108,678 | $ | 84,193 | ||||
Accrued wages, benefits and related taxes | 59,041 | 81,648 | ||||||
Income taxes payable | 16,357 | 7,926 | ||||||
Other accrued taxes | 12,797 | 13,335 | ||||||
Deferred revenue | 26,889 | 36,784 | ||||||
Accrued maintenance and repairs | 26,393 | 23,316 | ||||||
Accrued interest | 11,858 | 12,831 | ||||||
Other accrued liabilities | 73,967 | 82,605 | ||||||
Deferred taxes | 15,108 | 17,704 | ||||||
Short-term borrowings and current maturities of long-term debt | 30,041 | 18,730 | ||||||
Deferred sale leaseback advance | — | 55,934 | ||||||
Total current liabilities | 381,129 | 435,006 | ||||||
Long-term debt, less current maturities | 973,339 | 845,692 | ||||||
Accrued pension liabilities | 91,908 | 99,576 | ||||||
Other liabilities and deferred credits | 26,942 | 39,782 | ||||||
Deferred taxes | 150,172 | 165,655 | ||||||
Commitments and contingencies (Note 5) | ||||||||
Redeemable noncontrolling interests | 30,527 | 26,223 | ||||||
Stockholders’ investment: | ||||||||
Common stock, $.01 par value, authorized 90,000,000; outstanding: 34,932,143 as of September 30 and 34,838,374 as of March 31 (exclusive of 1,291,441 treasury shares) | 377 | 376 | ||||||
Additional paid-in capital | 788,672 | 781,837 | ||||||
Retained earnings | 1,208,809 | 1,284,442 | ||||||
Accumulated other comprehensive loss | (274,100 | ) | (270,329 | ) | ||||
Treasury shares, at cost (2,756,419 shares) | (184,796 | ) | (184,796 | ) | ||||
Total Bristow Group stockholders’ investment | 1,538,962 | 1,611,530 | ||||||
Noncontrolling interests | 8,073 | 7,256 | ||||||
Total stockholders’ investment | 1,547,035 | 1,618,786 | ||||||
Total liabilities, redeemable noncontrolling interests and stockholders’ investment | $ | 3,201,052 | $ | 3,230,720 | ||||
The accompanying notes are an integral part of these condensed consolidated financial statements.
3
BRISTOW GROUP INC. AND SUBSIDIARIES
Condensed Consolidated Statements of Cash Flows
Six Months Ended September 30, | ||||||||
2015 | 2014 | |||||||
(Unaudited) (In thousands) | ||||||||
Cash flows from operating activities: | ||||||||
Net income (loss) | $ | (47,309 | ) | $ | 72,828 | |||
Adjustments to reconcile net income to net cash provided by operating activities: | ||||||||
Depreciation and amortization | 74,533 | 53,539 | ||||||
Deferred income taxes | (22,545 | ) | (329 | ) | ||||
Write-off of deferred financing fees | — | 437 | ||||||
Discount amortization on long-term debt | 946 | 2,130 | ||||||
(Gain) loss on disposal of assets | 21,702 | (737 | ) | |||||
Loss on impairment | 27,713 | 3,362 | ||||||
Stock-based compensation | 10,380 | 8,407 | ||||||
Equity in earnings from unconsolidated affiliates less than dividends received | 9,876 | 2,362 | ||||||
Tax benefit related to stock-based compensation | (203 | ) | (1,642 | ) | ||||
Increase (decrease) in cash resulting from changes in: | ||||||||
Accounts receivable | 33,490 | (2,587 | ) | |||||
Inventories | (3,061 | ) | (11,865 | ) | ||||
Prepaid expenses and other assets | (21,667 | ) | (2,664 | ) | ||||
Accounts payable | 25,395 | (1,794 | ) | |||||
Accrued liabilities | (41,488 | ) | (10,176 | ) | ||||
Other liabilities and deferred credits | (9,502 | ) | (10,104 | ) | ||||
Net cash provided by operating activities | 58,260 | 101,167 | ||||||
Cash flows from investing activities: | ||||||||
Capital expenditures | (146,989 | ) | (302,119 | ) | ||||
Proceeds from asset dispositions | 16,107 | 397,644 | ||||||
Net cash provided by (used in) investing activities | (130,882 | ) | 95,525 | |||||
Cash flows from financing activities: | ||||||||
Proceeds from borrowings | 461,581 | 219,354 | ||||||
Repayment of debt | (323,569 | ) | (282,838 | ) | ||||
Partial prepayment of put/call obligation | (28 | ) | (30 | ) | ||||
Acquisition of noncontrolling interest | (2,000 | ) | (3,170 | ) | ||||
Payment of contingent consideration | (8,000 | ) | — | |||||
Repurchase of common stock | — | (43,423 | ) | |||||
Common stock dividends paid | (23,746 | ) | (22,689 | ) | ||||
Issuance of common stock | — | 1,398 | ||||||
Tax benefit related to stock-based compensation | 203 | 1,642 | ||||||
Net cash provided by (used in) financing activities | 104,441 | (129,756 | ) | |||||
Effect of exchange rate changes on cash and cash equivalents | 3,376 | (7,367 | ) | |||||
Net increase in cash and cash equivalents | 35,195 | 59,569 | ||||||
Cash and cash equivalents at beginning of period | 104,146 | 204,341 | ||||||
Cash and cash equivalents at end of period | $ | 139,341 | $ | 263,910 | ||||
Cash paid during the period for: | ||||||||
Interest | $ | 19,751 | $ | 14,442 | ||||
Income taxes | $ | 14,245 | $ | 15,322 | ||||
Supplemental disclosure of non-cash investing activities: | ||||||||
Deferred sale leaseback advance | $ | 18,285 | $ | 42,747 | ||||
Completion of deferred sale leaseback | $ | (74,480 | ) | $ | (73,104 | ) | ||
The accompanying notes are an integral part of these condensed consolidated financial statements.
4
BRISTOW GROUP INC. AND SUBSIDIARIES
Condensed Consolidated Statements of Changes in Equity and Redeemable Noncontrolling Interests
(Unaudited)
(In thousands, except share amounts)
Total Bristow Group Stockholders’ Investment | ||||||||||||||||||||||||||||||||||
Redeemable Noncontrolling Interests | Common Stock | Common Stock (Shares) | Additional Paid-in Capital | Retained Earnings | Accumulated Other Comprehensive Income (Loss) | Treasury Stock | Noncontrolling Interests | Total Stockholders’ Investment | ||||||||||||||||||||||||||
March 31, 2015 | $ | 26,223 | $ | 376 | 34,838,374 | $ | 781,837 | $ | 1,284,442 | $ | (270,329 | ) | $ | (184,796 | ) | $ | 7,256 | $ | 1,618,786 | |||||||||||||||
Issuance of common stock | — | 1 | 93,769 | 8,835 | — | — | — | — | 8,836 | |||||||||||||||||||||||||
Acquisition of noncontrolling interests | — | — | — | (2,000 | ) | — | — | — | — | (2,000 | ) | |||||||||||||||||||||||
Distributions paid to noncontrolling interests | — | — | — | — | — | — | — | (28 | ) | (28 | ) | |||||||||||||||||||||||
Common stock dividends ($0.68 per share) | — | — | — | — | (23,746 | ) | — | — | — | (23,746 | ) | |||||||||||||||||||||||
Currency translation adjustments | 102 | — | — | — | — | — | — | 469 | 469 | |||||||||||||||||||||||||
Net income (loss) | 2,704 | — | — | — | (50,389 | ) | — | — | 376 | (50,013 | ) | |||||||||||||||||||||||
Accretion of redeemable noncontrolling interests | 1,498 | — | — | — | (1,498 | ) | — | — | — | (1,498 | ) | |||||||||||||||||||||||
Other comprehensive income | — | — | — | — | — | (3,771 | ) | — | — | (3,771 | ) | |||||||||||||||||||||||
September 30, 2015 | $ | 30,527 | $ | 377 | 34,932,143 | $ | 788,672 | $ | 1,208,809 | $ | (274,100 | ) | $ | (184,796 | ) | $ | 8,073 | $ | 1,547,035 | |||||||||||||||
The accompanying notes are an integral part of these condensed consolidated financial statements.
5
BRISTOW GROUP INC. AND SUBSIDIARIES
NOTES TO CONDENSED CONSOLIDATED FINANCIAL STATEMENTS
(Unaudited)
Note 1 — BASIS OF PRESENTATION, CONSOLIDATION AND SUMMARY OF SIGNIFICANT ACCOUNTING POLICIES
The condensed consolidated financial statements include the accounts of Bristow Group Inc. and its consolidated entities (“Bristow Group”, the “Company”, “we”, “us”, or “our”) after elimination of all significant intercompany accounts and transactions. Our fiscal year ends March 31, and we refer to fiscal years based on the end of such period. Therefore, the fiscal year ending March 31, 2016 is referred to as “fiscal year 2016”. Pursuant to the rules and regulations of the U.S. Securities and Exchange Commission, the information contained in the following notes to condensed consolidated financial statements is condensed from that which would appear in the annual consolidated financial statements; accordingly, the condensed consolidated financial statements included herein should be read in conjunction with the consolidated financial statements and related notes thereto contained in our fiscal year 2015 Annual Report (the “fiscal year 2015 Financial Statements”). Operating results for the interim period presented are not necessarily indicative of the results that may be expected for the entire fiscal year.
The condensed consolidated financial statements included herein are unaudited; however, they include all adjustments of a normal recurring nature which, in the opinion of management, are necessary for a fair presentation of the consolidated balance sheet of the Company as of September 30, 2015, the consolidated statements of operations and comprehensive income for the three and six months ended September 30, 2015 and 2014, and the consolidated cash flows for the six months ended September 30, 2015 and 2014.
Certain reclassifications to prior period information have been made to conform to the presentation of the current period information. These reclassifications had no effect on net income as previously reported.
6
BRISTOW GROUP INC. AND SUBSIDIARIES
NOTES TO CONDENSED CONSOLIDATED FINANCIAL STATEMENTS — (Continued)
(Unaudited)
Foreign Currency
During the three and six months ended September 30, 2015 and 2014, our primary foreign currency exposure was to the British pound sterling, the euro, the Australian dollar, the Norwegian kroner and the Nigerian naira. The value of these currencies has fluctuated relative to the U.S. dollar as indicated in the following table:
Three Months Ended September 30, | Six Months Ended September 30, | |||||||||||||
2015 | 2014 | 2015 | 2014 | |||||||||||
One British pound sterling into U.S. dollars | ||||||||||||||
High | 1.57 | 1.72 | 1.59 | 1.72 | ||||||||||
Average | 1.55 | 1.67 | 1.54 | 1.68 | ||||||||||
Low | 1.51 | 1.61 | 1.46 | 1.61 | ||||||||||
At period-end | 1.51 | 1.62 | 1.51 | 1.62 | ||||||||||
One euro into U.S. dollars | ||||||||||||||
High | 1.16 | 1.37 | 1.16 | 1.39 | ||||||||||
Average | 1.11 | 1.33 | 1.11 | 1.35 | ||||||||||
Low | 1.09 | 1.26 | 1.06 | 1.26 | ||||||||||
At period-end | 1.12 | 1.26 | 1.12 | 1.26 | ||||||||||
One Australian dollar into U.S. dollars | ||||||||||||||
High | 0.77 | 0.95 | 0.81 | 0.95 | ||||||||||
Average | 0.73 | 0.93 | 0.75 | 0.93 | ||||||||||
Low | 0.69 | 0.87 | 0.69 | 0.87 | ||||||||||
At period-end | 0.70 | 0.88 | 0.70 | 0.88 | ||||||||||
One Norwegian kroner into U.S. dollars | ||||||||||||||
High | 0.1272 | 0.1721 | 0.1370 | 0.1753 | ||||||||||
Average | 0.1220 | 0.1670 | 0.1255 | 0.1694 | ||||||||||
Low | 0.1171 | 0.1601 | 0.1171 | 0.1601 | ||||||||||
At period-end | 0.1176 | 0.1671 | 0.1176 | 0.1671 | ||||||||||
One Nigerian naira into U.S. dollars | ||||||||||||||
High | 0.0051 | 0.0062 | 0.0051 | 0.0063 | ||||||||||
Average | 0.0051 | 0.0061 | 0.0051 | 0.0062 | ||||||||||
Low | 0.0050 | 0.0060 | 0.0050 | 0.0060 | ||||||||||
At period-end | 0.0051 | 0.0060 | 0.0051 | 0.0060 | ||||||||||
______
Source: Bank of England and Oanda.com
Other income (expense), net, in our condensed consolidated statements of operations includes foreign currency transaction losses of $11.4 million and $1.7 million for the three months ended September 30, 2015 and 2014, respectively, and foreign currency losses of $7.6 million and $2.1 million for the six months ended September 30, 2015 and 2014, respectively. The losses for the three and six months ended September 30, 2015 were primarily driven by the strengthening of the U.S. dollar against the currencies reflected in the table above.
7
BRISTOW GROUP INC. AND SUBSIDIARIES
NOTES TO CONDENSED CONSOLIDATED FINANCIAL STATEMENTS — (Continued)
(Unaudited)
Our earnings from unconsolidated affiliates, net of losses, are also affected by the impact of changes in foreign currency exchange rates on the reported results of our unconsolidated affiliates. During the three months ended September 30, 2015 and 2014, earnings from unconsolidated affiliates, net of losses, decreased by $19.9 million and $8.7 million, respectively, and during the six months ended September 30, 2015 and 2014, earnings from unconsolidated affiliates, net of losses, decreased by $18.2 million and $8.3 million, respectively, as a result of the impact of changes in foreign currency exchange rates on the earnings of our unconsolidated affiliates, primarily the impact of changes in the Brazilian real to U.S. dollar exchange rate on earnings for our affiliate in Brazil. The value of the Brazilian real has fluctuated relative to the U.S. dollar as indicated in the following table:
Three Months Ended September 30, | Six Months Ended September 30, | |||||||||||||
2015 | 2014 | 2015 | 2014 | |||||||||||
One Brazilian real into U.S. dollars | ||||||||||||||
High | 0.3217 | 0.4534 | 0.3435 | 0.4572 | ||||||||||
Average | 0.2858 | 0.4398 | 0.3057 | 0.4445 | ||||||||||
Low | 0.2406 | 0.4066 | 0.2406 | 0.4066 | ||||||||||
At period-end | 0.2441 | 0.4102 | 0.2441 | 0.4102 | ||||||||||
______
Source: Oanda.com
We estimate that the fluctuation of currencies versus the same period in the prior fiscal year had the following effect on our financial condition and results of operations (in thousands):
Three Months Ended September 30, 2015 | Six Months Ended September 30, 2015 | |||||||||
Revenue | $ | (34,205 | ) | $ | (69,889 | ) | ||||
Operating expense | 40,378 | 70,423 | ||||||||
Earnings from unconsolidated affiliates, net of losses | (11,226 | ) | (9,840 | ) | ||||||
Non-operating expense | (9,711 | ) | (5,456 | ) | ||||||
Income before provision for income taxes | (14,764 | ) | (14,762 | ) | ||||||
Provision for income taxes | 4,031 | 4,030 | ||||||||
Net income | (10,733 | ) | (10,732 | ) | ||||||
Cumulative translation adjustment | (18,485 | ) | (3,771 | ) | ||||||
Total stockholders’ investment | $ | (29,218 | ) | $ | (14,503 | ) | ||||
Revenue Recognition
In general, we recognize revenue when it is both realized or realizable and earned. We consider revenue to be realized or realizable and earned when the following conditions exist: there is persuasive evidence of an arrangement, generally a client contract exists; the services or products have been performed or delivered to the client; the sales price is fixed or determinable; and collection has occurred or is probable. More specifically, revenue from helicopter services is recognized based on contractual rates as the related services are performed. The charges under these contracts are generally based on a two-tier rate structure consisting of a daily or monthly fixed fee plus additional fees for each hour flown. These contracts are for varying periods and generally permit the client to cancel the contract before the end of the term. We also provide services to clients on an “ad hoc” basis, which usually entails a shorter contract notice period and duration. The charges for ad hoc services are based on an hourly rate or a daily or monthly fixed fee plus additional fees for each hour flown. In order to offset potential increases in operating costs, our long-term contracts may provide for periodic increases in the contractual rates charged for our services. We recognize the impact of these rate increases when the criteria outlined above have been met. This generally includes written recognition from our clients that they are in agreement with the amount of the rate escalation. Cost reimbursements from clients are recorded as reimbursable revenue with the related reimbursed costs recorded as reimbursable expense on our condensed consolidated statements of operations.
Bristow Academy, our helicopter training unit, primarily earns revenue from military training, flight training provided to individual students and ground school courses. We recognize revenue from these sources using the same revenue recognition principles described above as services are provided. We consider revenue to be realized or realizable and earned when the following conditions exist: there is persuasive evidence of an arrangement (generally a contract exists); the services have been performed or delivered to the client or student; the sales price is fixed and determinable; and collection has occurred or is probable.
8
BRISTOW GROUP INC. AND SUBSIDIARIES
NOTES TO CONDENSED CONSOLIDATED FINANCIAL STATEMENTS — (Continued)
(Unaudited)
Eastern Airways International Limited (“Eastern Airways”) and Capiteq Limited, operating under the name Airnorth, primarily earn revenue through charter and scheduled airline services and provision of airport services (Eastern Airways only). Both chartered and scheduled revenue is recognized net of passenger taxes and discounts. Revenue is recognized at the earlier of the period in which the service is provided or the period in which the right to travel expires, which is determined by the terms and conditions of the ticket. Ticket sales are recorded within deferred revenue in accordance with the above policy. Airport services revenue is recognized when earned.
Interest Expense, Net
During the three and six months ended September 30, 2015 and 2014, interest expense, net consisted of the following (in thousands):
Three Months Ended September 30, | Six Months Ended September 30, | ||||||||||||||||
2015 | 2014 | 2015 | 2014 | ||||||||||||||
Interest income | $ | 217 | $ | 386 | $ | 438 | $ | 622 | |||||||||
Interest expense | (7,396 | ) | (7,958 | ) | (15,286 | ) | (15,321 | ) | |||||||||
Interest expense, net | $ | (7,179 | ) | $ | (7,572 | ) | $ | (14,848 | ) | $ | (14,699 | ) | |||||
Interest expense for the three and six months ended September 30, 2014, respectively, includes the write-off of deferred financing fees of $0.3 million and $0.4 million related to the repurchase of $20.0 million and $31.2 million principal amount of our 6 ¼% Senior Notes due 2022 (the “6 ¼% Senior Notes”). For further details on the repurchase of the 6 ¼% Senior Notes, see Note 5 to the fiscal year 2015 Financial Statements.
Other Income (Expense), Net
In addition to foreign currency transaction gains (losses) discussed above, other income (expense), net includes expense of $1.0 million and $1.9 million related to premiums paid for the repurchase of a portion of the 6 ¼% Senior Notes during the three and six months ended September 30, 2014, respectively.
Accretion of Redeemable Noncontrolling Interests
Accretion of redeemable noncontrolling interests of $(4.8) million and $1.5 million for the three and six months ended September 30, 2015, respectively, relates to put arrangements whereby the noncontrolling interest holders may require us to redeem the remaining shares of Airnorth and Eastern Airways at a formula-based amount that is not considered fair value (the “redemption amount”). Redeemable noncontrolling interest is adjusted each period for comprehensive income, dividends attributable to the noncontrolling interest and changes in ownership interest, if any, such that the noncontrolling interest represents the proportionate share of Airnorth’s and Eastern Airways’ equity (the “carrying value”) . Additionally, at each period end we are required to compare the redemption amount to the carrying value and the redeemable noncontrolling interest and record the redeemable noncontrolling interest at the higher of the two amounts, with a corresponding charge or credit directly to retained earnings. While this charge does not impact net income (loss), it does result in a reduction of income (loss) available to common shareholders in the calculation of diluted earnings (loss) per share (see Note 8). During the three months ended June 30, 2015, we adjusted the carrying values to the redemption amount for Airnorth and Eastern Airways as the redemption amounts were in excess of the carrying values and recorded adjustments of $1.2 million and $5.1 million, respectively, as an increase in redeemable noncontrolling interest and a decrease in retained earnings. As of September 30, 2015, the redemption amount for Airnorth was above the carrying value and we recorded adjustments of $0.3 million and $1.5 million for the three and six months ended September 30, 2015, respectively, as an increase in redeemable noncontrolling interest and a decrease in retained earnings. As of September 30, 2015, the redemption amount for Eastern Airways was less than the carrying value and we recorded $(5.1) million for the three months ended September 30, 2015, as a decrease in redeemable noncontrolling interest and an increase in retained earnings to bring the amounts back to carrying value.
Accounts Receivable
As of September 30 and March 31, 2015, the allowance for doubtful accounts for non-affiliates was $3.8 million and $0.9 million, respectively. There were no allowances for doubtful accounts related to accounts receivable due from affiliates as of September 30 and March 31, 2015. The increase in the allowance for doubtful accounts for non-affiliates related to $4.1 million due from two clients in Nigeria where we no longer believed collection was probable as of June 30, 2015. During the three months ended September 30, 2015, $1.1 million was received from one of these clients resulting in a reversal of the allowance recorded in the prior quarter.
9
BRISTOW GROUP INC. AND SUBSIDIARIES
NOTES TO CONDENSED CONSOLIDATED FINANCIAL STATEMENTS — (Continued)
(Unaudited)
Inventories
As of September 30 and March 31, 2015, inventories were net of allowances of $42.6 million and $45.4 million, respectively. During the six months ended September 30, 2015, we increased our inventory allowance by $5.4 million as a result of our review of excess inventory on aircraft model types we plan to exit by the end of the fiscal year. During the three and six months ended September 30, 2014, we increased our inventory allowance by $3.4 million related to excess inventory identified for an older large aircraft model we planned to remove from our operational fleet. The inventory allowance is reduced by sales of inventory and adjusted for foreign exchange effects.
Prepaid Expenses and Other Current Assets
As of September 30 and March 31, 2015, prepaid expenses and other current assets included the short-term portion of contract acquisition and pre-operating costs totaling $13.0 million and $8.9 million, respectively, related to the search and rescue (“SAR”) contracts in the U.K. and a client contract in Norway, which are recoverable under the contracts and will be expensed over the terms of the contracts. For the three and six months ended September 30, 2015, we have expensed $2.3 million and $3.8 million, respectively, due to the start-up of some of these contracts.
Other Assets
As of September 30 and March 31, 2015, other assets included the long-term portion of contract acquisition and pre-operating costs totaling $52.8 million and $42.4 million, respectively, related to the SAR contracts in the U.K. and a client contract in Norway, which are recoverable under the contract and will be expensed over the terms of the contracts.
Property and Equipment and Assets Held for Sale
During the three and six months ended September 30, 2015 and 2014, we made capital expenditures as follows:
Three Months Ended September 30, | Six Months Ended September 30, | |||||||||||||||
2015 | 2014 | 2015 | 2014 | |||||||||||||
Number of aircraft delivered: | ||||||||||||||||
Medium | — | — | 1 | 3 | ||||||||||||
Large | 1 | 2 | 2 | 8 | ||||||||||||
Total aircraft | 1 | 2 | 3 | 11 | ||||||||||||
Capital expenditures (in thousands): | ||||||||||||||||
Aircraft and related equipment (1) | $ | 70,691 | $ | 65,386 | $ | 111,153 | $ | 237,484 | ||||||||
Other | 8,521 | 36,286 | 35,836 | 64,635 | ||||||||||||
Total capital expenditures | $ | 79,212 | $ | 101,672 | $ | 146,989 | $ | 302,119 | ||||||||
_____________
(1) | During the three months ended September 30, 2015 and 2014, we spent $36.0 million and $48.0 million, respectively, and during the six months ended September 30, 2015 and 2014, we spent $64.3 million and $211.3 million, respectively, on construction in progress, which primarily represents progress payments on aircraft to be delivered in future periods. |
10
BRISTOW GROUP INC. AND SUBSIDIARIES
NOTES TO CONDENSED CONSOLIDATED FINANCIAL STATEMENTS — (Continued)
(Unaudited)
The following table presents details on the aircraft sold or disposed of and impairments on assets held for sale during the three months ended September 30, 2015 and 2014:
_____________
Three Months Ended September 30, | Six Months Ended September 30, | |||||||||||||||
2015 | 2014 | 2015 | 2014 | |||||||||||||
(In thousands, except for number of aircraft) | ||||||||||||||||
Number of aircraft sold or disposed of (1) | 4 | 21 | 13 | 25 | ||||||||||||
Proceeds from sale or disposal of assets (1) | $ | 6,806 | $ | 391,001 | $ | 16,107 | $ | 397,644 | ||||||||
Gain (loss) from sale or disposal of assets | $ | (1,838 | ) | $ | 685 | $ | 329 | $ | 3,874 | |||||||
Number of aircraft impaired | 10 | 2 | 11 | 6 | ||||||||||||
Impairment charges on aircraft held for sale | $ | 12,169 | $ | 558 | $ | 22,031 | $ | 3,137 | ||||||||
(1) | During the three and six months ended September 30, 2014, 14 of these aircraft were leased back, and we received $380.7 million in proceeds for these aircraft. We did not enter into any sale leaseback transactions during the three and six months ended September 30, 2015. |
During the three and six months ended September 30, 2015, we recorded accelerated depreciation of $10.5 million and $19.3 million, respectively, on 16 medium, four large and one fixed wing aircraft operating in our Americas, Africa and Asia Pacific regions as management made the decision to exit these model types earlier than originally anticipated. In certain instances the salvage values of aircraft were also adjusted to reflect our expectation of sales values in the current market. We expect to record an additional $7.6 million in depreciation expense over the remainder of fiscal year 2016 relating to changes in fleet exit timing and changes in expected salvage values.
Loss on Impairment
Our business consists of one segment: Helicopter Services, with five reporting units within that segment: Europe Caspian region, Africa region, Americas region, Asia Pacific region, and Corporate and other. For the purposes of performing an analysis of goodwill, we evaluate whether there are reporting units below the reporting units we disclose for segment reporting purposes by assessing whether our regional management typically reviews results and whether discrete financial information exists at a lower level. Based on this review, we performed our analysis of goodwill for the following reporting units as of September 30, 2015, with goodwill as reflected below prior to any impairment recorded:
•The Africa region, which included $5.9 million of goodwill;
•Bristow Academy, within Corporate and other, which included $10.2 million of goodwill;
•Bristow Norway, within our Europe Caspian region, which included $12.1 million of goodwill;
• | Eastern Airways, within our Europe Caspian region, which included $24.6 million of goodwill; and |
•Airnorth, within our Asia Pacific region, which included $21.9 million of goodwill.
We test goodwill for impairment on an annual basis or when events or changes in circumstances indicate that a potential impairment exists. During the three months ended September 30, 2015, we noted rapid and significant declines in the market value of our stock and an overall reduction in expected operating results resulting from the downturn in the oil and gas market driven by reduced crude oil prices. The impact on our results is reflected in an increase in the number of idle aircraft and reduction in forecasted results across our global oil and gas helicopter operations, and is reflected in reduced operating revenue for our business for the three months ended September 30, 2015, when excluding growth from the U.K. SAR contract and the addition of Airnorth. The reduction in demand for aircraft in the offshore energy market led to further impairment of older model aircraft as discussed under Property and Equipment and Assets Held for Sale above. Based on these factors, we concluded that the fair value of our goodwill could have fallen below its carrying value and that an interim period analysis of goodwill was required.
We performed the interim impairment test of goodwill across the reporting units discussed above, noting that the estimated fair values of the Eastern Airways and Airnorth exceeded the carrying values. The estimated fair value of our Africa region was approximately 8% more than the carrying value for the Africa region. The estimated fair values of Bristow Academy and Bristow
11
BRISTOW GROUP INC. AND SUBSIDIARIES
NOTES TO CONDENSED CONSOLIDATED FINANCIAL STATEMENTS — (Continued)
(Unaudited)
Norway were below their carrying values, resulting in an impairment of all of the goodwill for those reporting units and a loss of $22.3 million reflected in our results for the three and six months ended September 30, 2015.
We estimated the implied fair value of the reporting units using a variety of valuation methods, including the income and market approaches. The determination of estimated fair value required us to use significant unobservable inputs, representative of a Level 3 fair value measurement, including assumptions related to the future performance of the reporting units, such as projected demand for our services and rates.
The income approach was based on a discounted cash flow model, which utilized present values of cash flows to estimate fair value. The future cash flows were projected based on our estimates of future rates for our services, utilization, operating costs, capital requirements, growth rates and terminal values. Forecasted rates and utilization take into account current market conditions and our anticipated business outlook, both of which have been impacted by the adverse changes in the offshore energy business environment from the current downturn. Operating costs were forecasted using a combination of our historical average operating costs and expected future costs, including ongoing cost reduction initiatives. Capital requirements in the discounted cash flow model were based on management's estimates of future capital costs driven by expected market demand in future periods. The estimated capital requirements included cash outflows for new aircraft, infrastructure and improvements. A terminal period was used to reflect our estimate of stable, perpetual growth. The future cash flows were discounted using a market-participant risk-adjusted weighted average cost of capital (“WACC”) for each of the reporting units and in total. These assumptions were derived from unobservable inputs and reflect management's judgments and assumptions.
The market approach was based upon the application of price-to-earnings multiples to management's estimates of future earnings adjusted for a control premium. Management's earnings estimates were derived from unobservable inputs that require significant estimates, judgments and assumptions as described in the income approach.
For purposes of the goodwill impairment test, we calculated the reporting units’ estimated fair values as the average of the values calculated under the income approach and the market approach.
We evaluated the estimated fair value of our reporting units compared to our market capitalization. The aggregate fair values of our reporting units exceeded our market capitalization, and we believe the resulting implied control premium was reasonable based on recent market transactions within our industry or other relevant benchmark data.
The estimates used to determine the fair value of the reporting units discussed above reflect management's best estimates, and we believe they are reasonable. Future declines in the reporting units’ operating performance or our anticipated business outlook may reduce the estimated fair value of these reporting units and result in additional impairments. Factors that could have a negative impact on the fair value include, but are not limited to:
• | decreases in estimated rates and utilization due to greater-than-expected market pressures, downtime and other risks associated with offshore energy operations; |
•sustained declines in our stock price;
•decreases in revenue due to our inability to attract and retain skilled personnel;
• | changes in worldwide offshore energy transportation supply and demand, competition or technology; |
• | changes in future levels of drilling activity and expenditures, whether as a result of global capital markets and liquidity, prices of oil and natural gas or otherwise, which may cause our clients to further reduce offshore production and drilling activities; |
• | possible cancellation or suspension of contracts as a result of mechanical difficulties, performance or other reasons; |
• | inability to manage cost during the current downturn and in future periods; |
• | increases in the market-participant risk-adjusted WACC; and |
•declines in anticipated growth rates.
Adverse changes in one or more of these factors could result in additional goodwill impairments in future periods.
12
BRISTOW GROUP INC. AND SUBSIDIARIES
NOTES TO CONDENSED CONSOLIDATED FINANCIAL STATEMENTS — (Continued)
(Unaudited)
Additionally, included in loss on impairment are impairment charges for inventory of $5.4 million during the six months of September 30, 2015 and $3.4 million during the three and six months ended September 30, 2014. For further details on inventory impairments, see Inventory discussed above.
Deferred Sale Leaseback Advance
As of March 31, 2015, we had a total deferred sale leaseback advance asset of $55.9 million, which was included in deferred sale leaseback advance on our condensed consolidated balance sheet. During fiscal year 2014, we received payment of approximately $106.1 million for progress payments we had made on seven aircraft under construction, and we assigned any future payments due on these construction agreements to the purchaser. As we had the obligation and intent to lease the aircraft back from the purchaser upon completion, we recorded a liability equal to the cash received and additional payments made by the purchaser totaling $147.4 million, with a corresponding increase to construction in progress. During fiscal year 2015, we took delivery and entered into leases for five of the aircraft and removed a total of $183.7 million and $182.6 million, respectively, from construction in progress and deferred sale leaseback advance on our condensed consolidated balance sheet. During the three months ended June 30, 2015, we took delivery and entered into leases for the remaining two aircraft and removed a total of $75.8 million and $74.3 million, respectively, from construction in progress and deferred sale leaseback advance on our consolidated balance sheet. As of June 30, 2015, the construction in progress and deferred sale leaseback advance liability related to these deferred sale leaseback transactions were removed from our condensed consolidated balance sheet.
Recent Accounting Pronouncements
We consider the applicability and impact of all accounting standard updates (“ASUs”). ASUs not listed below were assessed and determined to be either not applicable or are expected to have minimal impact on our consolidated financial position or results of operations.
In May 2014, the Financial Accounting Standards Board (the “FASB”) issued accounting guidance on revenue recognition for revenue from contracts with customers. This guidance requires an entity to recognize the amount of revenue to which it expects to be entitled for the transfer of promised goods or services to customers and will replace most existing revenue recognition guidance when it becomes effective. This new standard is effective for annual reporting periods beginning after December 15, 2016. However, in July 2015, the FASB approved the deferral of the effective date of the revenue recognition standard permitting public entities to apply the new revenue standard to annual reporting periods beginning after December 15, 2017. Early application is permitted, but not before the original effective date of December 15, 2016. The standard permits the use of either the retrospective or cumulative effect transition method. We are evaluating the effect this standard will have on our financial statements and related disclosures. We have not yet selected a transition method nor have we determined the effect of the standard on our ongoing financial reporting.
In February 2015, the FASB issued accounting guidance which changes the analysis that a reporting entity must perform to determine whether it should consolidate certain types of legal entities. The guidance amends the criteria for determining which entities are considered VIEs and amends the criteria for determining if a service provider possesses a variable interest in a VIE. This pronouncement is effective for annual and interim periods in fiscal years beginning after December 15, 2015. Early adoption is permitted, including adoption in an interim period. A reporting entity may apply the amendments using a modified retrospective approach or a full retrospective application. We have not yet determined the effect, if any, of the standard on our consolidated financial statements.
In April 2015, the FASB issued accounting guidance relating to the presentation of debt issuance costs. The intent is to simplify the presentation of debt issuance costs by requiring entities to record debt issuance costs on the balance sheet as a direct deduction from the carrying amount of the related debt liability, similar to debt discounts or premiums. This pronouncement is effective for fiscal years, and interim periods within those years, beginning after December 15, 2015 and early adoption is permitted. As of September 30, and March 31, 2015, we had debt issuance costs of $12.0 million and $10.0 million, respectively, which are included in other assets on the condensed consolidated balance sheets. We have not yet adopted this accounting guidance but we believe the adoption of this guidance would reduce other assets and long-term debt by such amounts.
13
BRISTOW GROUP INC. AND SUBSIDIARIES
NOTES TO CONDENSED CONSOLIDATED FINANCIAL STATEMENTS — (Continued)
(Unaudited)
Note 2 — VARIABLE INTEREST ENTITIES AND INVESTMENTS IN OTHER SIGNIFICANT AFFILIATES
VIEs
A Variable Interest Entity (“VIE”) is an entity that either (i) has insufficient equity to permit the entity to finance its activities without additional subordinated financial support or (ii) has equity investors who lack the characteristics of a controlling financial interest. A VIE is consolidated by its primary beneficiary. The primary beneficiary has both the power to direct the activities that most significantly impact the entity’s economic performance and the obligation to absorb losses or the right to receive benefits from the entity that could potentially be significant to the VIE. If we determine that we have operating power and the obligation to absorb losses or receive benefits, we consolidate the VIE as the primary beneficiary, and if not, we do not consolidate.
As of September 30, 2015, we had interests in four VIEs of which we were the primary beneficiary, which are described below, and had no interests in VIEs of which we were not the primary beneficiary. See Note 3 to the fiscal year 2015 Financial Statements for a description of other investments in significant affiliates.
Bristow Aviation Holdings Limited — We own 49% of Bristow Aviation Holdings Limited’s (“Bristow Aviation”) common stock and a significant amount of its subordinated debt. Bristow Aviation is incorporated in England and holds all of the outstanding shares in Bristow Helicopters Limited (“Bristow Helicopters”). Bristow Aviation’s subsidiaries provide helicopter services to clients primarily in the U.K, Norway, Australia, Nigeria and Trinidad. Bristow Aviation is organized with three different classes of ordinary shares having disproportionate voting rights. The Company, Caledonia Investments plc (“Caledonia”) and a European Union investor (the “E.U. Investor”) own 49%, 46% and 5%, respectively, of Bristow Aviation’s total outstanding ordinary shares, although Caledonia has voting control over the E.U. Investor’s shares.
In addition to our ownership of 49% of Bristow Aviation’s outstanding ordinary shares, in May 2004, we acquired eight million shares of deferred stock, essentially a subordinated class of stock with no voting rights, from Bristow Aviation for £1 per share ($14.4 million in total). We also have £91.0 million ($137.8 million) principal amount of subordinated unsecured loan stock (debt) of Bristow Aviation bearing interest at an annual rate of 13.5% and payable semi-annually. Payment of interest on such debt has been deferred since its incurrence in 1996. Deferred interest accrues at an annual rate of 13.5% and aggregated $1.6 billion as of September 30, 2015.
The Company, Caledonia, the E.U. Investor and Bristow Aviation have entered into a shareholder agreement respecting, among other things, the composition of the board of directors of Bristow Aviation. On matters coming before Bristow Aviation’s board, Caledonia’s representatives have a total of three votes and the two other directors have one vote each. In addition, Caledonia has the right to nominate two persons to our board of directors and to replace any such directors so nominated.
Caledonia, the Company and the E.U. Investor also have entered into a put/call agreement under which, upon giving specified prior notice, we have the right to buy all the Bristow Aviation shares held by Caledonia and the E.U. Investor, who, in turn, each have the right to require us to purchase such shares. Under current English law, we would be required, in order for Bristow Aviation to retain its operating license, to find a qualified E.U. investor to own any Bristow Aviation shares we have the right to acquire under the put/call agreement. The only restriction under the put/call agreement limiting our ability to exercise the put/call option is a requirement to consult with the Civil Aviation Authority (the “CAA”) in the U.K. regarding the suitability of the new holder of the Bristow Aviation shares. The put/call agreement does not contain any provisions should the CAA not approve the new E.U. investor. However, we would work diligently to find an E.U. investor suitable to the CAA. The amount by which we could purchase the shares of the other investors holding 51.0% of the equity of Bristow Aviation is fixed under the terms of the call option, and we have reflected this amount on our condensed consolidated balance sheets in noncontrolling interest.
14
BRISTOW GROUP INC. AND SUBSIDIARIES
NOTES TO CONDENSED CONSOLIDATED FINANCIAL STATEMENTS — (Continued)
(Unaudited)
Furthermore, the call option provides a mechanism whereby the economic risk for the other investors is limited should the financial condition of Bristow Aviation deteriorate. The call option price is the nominal value of the ordinary shares held by the noncontrolling shareholders (£1.0 million as of September 30, 2015) plus an annual guaranteed rate of return less any prepayments of such call option price and any dividends paid on the shares concerned. We can elect to pre-pay the guaranteed return element of the call option price wholly or in part without exercising the call option. No dividends have been paid by Bristow Aviation. We have accrued the annual return due to the other shareholders at a rate of sterling LIBOR plus 3% (prior to May 2004, the rate was fixed at 12%) by recognizing noncontrolling interest expense on our condensed consolidated statements of operations, with a corresponding increase in noncontrolling interests on our condensed consolidated balance sheets. Prepayments of the guaranteed return element of the call option are reflected as a reduction in noncontrolling interests on our condensed consolidated balance sheets. The other investors have an option to put their shares in Bristow Aviation to us. The put option price is calculated in the same way as the call option price except that the guaranteed rate for the period to April 2004 was 10% per annum. If the put option is exercised, any pre-payments of the call option price are set off against the put option price.
Bristow Aviation and its subsidiaries are exposed to similar operational risks and are therefore monitored and evaluated on a similar basis by management. Accordingly, the financial information reflected on our condensed consolidated balance sheets and statements of operations for Bristow Aviation and subsidiaries is presented in the aggregate, including intercompany amounts with other consolidated entities, as follows (in thousands):
September 30, 2015 | March 31, 2015 | |||||||||
Assets | ||||||||||
Cash and cash equivalents | $ | 109,507 | $ | 91,190 | ||||||
Accounts receivable | 539,509 | 521,989 | ||||||||
Inventories | 102,497 | 100,065 | ||||||||
Prepaid expenses and other current assets | 82,828 | 42,659 | ||||||||
Total current assets | 834,341 | 755,903 | ||||||||
Investment in unconsolidated affiliates | 273 | 64 | ||||||||
Property and equipment, net | 252,819 | 243,357 | ||||||||
Goodwill | 46,460 | 61,242 | ||||||||
Other assets | 89,277 | 78,637 | ||||||||
Total assets | $ | 1,223,170 | $ | 1,139,203 | ||||||
Liabilities | ||||||||||
Accounts payable | $ | 523,943 | $ | 379,357 | ||||||
Accrued liabilities | 145,466 | 154,306 | ||||||||
Accrued interest | 1,592,456 | 1,489,369 | ||||||||
Deferred taxes | — | 1,128 | ||||||||
Current maturities of long-term debt | 9,041 | 9,643 | ||||||||
Total current liabilities | 2,270,906 | 2,033,803 | ||||||||
Long-term debt, less current maturities | 164,234 | 168,245 | ||||||||
Accrued pension liabilities | 91,908 | 99,576 | ||||||||
Other liabilities and deferred credits | 8,114 | 11,948 | ||||||||
Deferred taxes | 13,301 | 14,457 | ||||||||
Temporary equity | 30,527 | 26,223 | ||||||||
Total liabilities | $ | 2,578,990 | $ | 2,354,252 | ||||||
Three Months Ended September 30, | Six Months Ended September 30, | |||||||||||||||||
2015 | 2014 | 2015 | 2014 | |||||||||||||||
Revenue | $ | 377,362 | $ | 391,615 | $ | 764,133 | $ | 775,432 | ||||||||||
Operating income (loss) | (9,829 | ) | 7,018 | (27,573 | ) | 23,718 | ||||||||||||
Net loss | (78,938 | ) | (47,767 | ) | (143,715 | ) | (85,348 | ) | ||||||||||
15
BRISTOW GROUP INC. AND SUBSIDIARIES
NOTES TO CONDENSED CONSOLIDATED FINANCIAL STATEMENTS — (Continued)
(Unaudited)
Bristow Helicopters Nigeria Ltd. — Bristow Helicopters Nigeria Ltd. (“BHNL”) is a joint venture in Nigeria in which Bristow Helicopters owned a 48% interest, a Nigerian company owned 100% by Nigerian employees owned a 50% interest and an employee trust fund owned the remaining 2% interest as of September 30, 2015. BHNL provides helicopter services to clients in Nigeria.
In order to be able to bid competitively for our services in the Nigerian market, we were required to identify local citizens to participate in the ownership of entities domiciled in the region. However, these owners do not have extensive knowledge of the aviation industry and have historically deferred to our expertise in the overall management and day-to-day operation of BHNL (including the establishment of operating and capital budgets and strategic decisions regarding the potential expansion of BHNL’s operations). We have also historically provided subordinated financial support to BHNL and will need to continue to do so unless and until BHNL acquires sufficient equity to permit itself to finance its activities without that additional support from us. As we have the power to direct the most significant activities affecting the economic performance and ongoing success of BHNL and hold a variable interest in the entity in the form of our equity investment and working capital infusions, we consolidate BHNL as the primary beneficiary. The employee-owned Nigerian entity referenced above purchased a 19% interest in BHNL in December 2013 with proceeds from a loan received from BGI Aviation Technical Services Nigeria Limited (“BATS”). In July 2014, the employee-owned Nigerian entity purchased an additional 29% interest with proceeds from a loan received from Bristow Helicopters (International) Limited (“BHIL”). In April 2015, Bristow Helicopters purchased an additional 8% interest in BHNL and the employee-owned Nigerian entity purchased an additional 2% interest with proceeds from a loan received from BHIL. Both BATS and BHIL are wholly-owned subsidiaries of Bristow Aviation. The employee-owned Nigerian entity is also a VIE that we consolidate as the primary beneficiary and we eliminate the loans discussed above in consolidation.
BHNL is an indirect subsidiary of Bristow Aviation; therefore, financial information for this entity is included within the amounts for Bristow Aviation and its subsidiaries presented above.
Pan African Airlines Nigeria Ltd. — Pan African Airlines Nigeria Ltd. (“PAAN”) is a joint venture in Nigeria with local partners, in which we own a 50.17% interest. PAAN provides helicopter services to clients in Nigeria.
The activities that most significantly impact PAAN’s economic performance relate to the day-to-day operation of PAAN, setting the operating and capital budgets, and strategic decisions regarding the potential expansion of PAAN’s operations. Throughout the history of PAAN, our representation on the board and our secondment to PAAN of its managing director has enabled us to direct the key operational decisions of PAAN (without objection from the other board members). We have also historically provided subordinated financial support to PAAN. As we have the power to direct the most significant activities affecting the economic performance and ongoing success of PAAN and hold a variable interest in the form of our equity investment and working capital infusions, we consolidate PAAN as the primary beneficiary. However, as long as we own a majority interest in PAAN, the separate presentation of financial information in a tabular format for PAAN is not required.
Note 3 — DEBT
Debt as of September 30 and March 31, 2015 consisted of the following (in thousands):
September 30, 2015 | March 31, 2015 | |||||||||
6¼% Senior Notes due 2022 | $ | 401,535 | $ | 401,535 | ||||||
Term Loan | 342,611 | 222,179 | ||||||||
Revolving Credit Facility | 223,800 | 83,800 | ||||||||
Airnorth debt | 20,839 | 23,119 | ||||||||
Eastern Airways debt | 14,595 | 19,680 | ||||||||
3% Convertible Senior Notes due 2038, including zero and $0.9 million of unamortized discount, respectively | — | 114,109 | ||||||||
Total debt | 1,003,380 | 864,422 | ||||||||
Less short-term borrowings and current maturities of long-term debt | (30,041 | ) | (18,730 | ) | ||||||
Total long-term debt | $ | 973,339 | $ | 845,692 | ||||||
Term Loan Credit Facility — On November 5, 2015, we entered into a senior secured term loan credit agreement (“Term Loan Credit Agreement”) which provides for $200 million of term loan commitments (the “Term Loan Credit Facility”). Proceeds from the Term Loan Credit Facility were initially used to repay loans outstanding under our $400 million Revolving Credit Facility as discussed below and related fees and expenses and to finance working capital needs. The additional liquidity is for capital expenditures, working capital needs and general corporate purposes. The maturity date of the Term Loan Credit Facility is November 5, 2017 and the interest rate at closing was LIBOR plus a borrowing margin of 2.0%.
16
BRISTOW GROUP INC. AND SUBSIDIARIES
NOTES TO CONDENSED CONSOLIDATED FINANCIAL STATEMENTS — (Continued)
(Unaudited)
The Term Loan Credit Facility is guaranteed by the certain of our U.S. subsidiaries (“Guarantor Subsidiaries”) and secured by the U.S. cash and cash equivalents, accounts receivable, inventories, non-aircraft equipment, prepaid expenses and other current assets, intangible assets and intercompany promissory notes held Bristow Group Inc. and the Guarantor Subsidiaries, and 100% and 65% of the capital stock of certain of our principal domestic and foreign subsidiaries, respectively. In addition, the Term Loan Credit Facility includes customary covenants, including certain financial covenants and restrictions on our ability to enter into certain transactions, including those that could result in the incurrence of additional indebtedness and liens; the making of loans, guarantees or investments; sale of assets; payments of dividends or repurchases of our capital stock; and entering into transactions with affiliates.
3% Convertible Senior Notes due 2038 — During June 2015, we repurchased $113.1 million of the $115.0 million principal amount of our 3% Convertible Senior Notes due 2038 (the “3% Convertible Senior Notes”) from holders that exercised their right to require us to repurchase their notes on the first put date of June 15, 2015. We funded this repurchase using borrowings on our Revolving Credit Facility. On July 13, 2015, we issued a notice to the holders of the remaining $1.9 million principal amount of notes that we were redeeming the remaining notes at a redemption price equal to 100% of the principal amount plus accrued and unpaid interest up to, but excluding, the redemption date of August 14, 2015. The notes were convertible at any time before the close of business on August 13, 2015, the business day immediately preceding the redemption date at a rate of 13.8373 shares per $1,000 principal amount of notes. However, prior to the redemption of the remaining notes that occurred on August 14, 2015, the conversion value of the 3% Convertible Senior Notes did not exceed the principal balance so we satisfied our conversion obligation by delivering cash of $1.9 million.
The balances of the debt and equity components of the 3% Convertible Senior Notes as of each period are as follows (in thousands):
September 30, 2015 | March 31, 2015 | |||||||||
Equity component – net carrying value | $ | 14,905 | $ | 14,905 | ||||||
Debt component: | ||||||||||
Face amount due at maturity | $ | — | $ | 115,000 | ||||||
Unamortized discount | — | (891 | ) | |||||||
Debt component – net carrying value | $ | — | $ | 114,109 | ||||||
The debt discount was amortized into interest expense over the expected remaining life of the 3% Convertible Senior Notes to June 2015 (the first put date) using the effective interest rate. The effective interest rate for the six months ended September 30, 2015 and the three and six months ended September 30, 2014 was 6.9%. Interest expense related to our 3% Convertible Senior Notes for the three and six months ended September 30, 2015 and 2014 was as follows (in thousands):
Three Months Ended September 30, | Six Months Ended September 30, | |||||||||||||||||
2015 | 2014 | 2015 | 2014 | |||||||||||||||
Contractual coupon interest | $ | 7 | $ | 863 | $ | 725 | $ | 1,726 | ||||||||||
Amortization of debt discount | — | 1,048 | 891 | 2,067 | ||||||||||||||
Total interest expense | $ | 7 | $ | 1,911 | $ | 1,616 | $ | 3,793 | ||||||||||
Term Loan and Revolving Credit Facility — On April 17, 2015, we entered into the fifth amendment to the Amended and Restated Revolving Credit and Term Loan Agreement (the “Fifth Amendment”). The Fifth Amendment, among other things (a) increased the commitments under the Revolving Credit Facility from $350 million to $400 million, (b) increased the Term Loan borrowings from approximately $222.6 million to $350.0 million and (c) permitted us to incur additional credit facility debt to refinance the existing 3% Convertible Senior Notes. On September 29, 2015, we entered into the sixth amendment to the Amended and Restated Revolving Credit and Term Loan Agreement (the “Sixth Amendment”). The Sixth Amendment, among other things amended the maximum leverage ratio from 4.00:1.00 for all periods to 4.75:1.00 for the fiscal quarters ending from the date of the Sixth Amendment through December 31, 2016, to 4.50:1.00 for the fiscal quarters ending March 31, 2017 through December 31, 2017, and to 4.25:1.00 for the fiscal quarters ending March 31, 2018 through June 30, 2018, after which period the maximum leverage ratio will revert to 4.00:1.00 through maturity, (b) amended the interest coverage ratio from 2.75:1.00 for all periods to 2.00:1.00 for the fiscal quarters ending from the date of the Sixth Amendment through December 31, 2016, to 2.25:1.00 for the fiscal quarters ending March 31, 2017 through December 31, 2017, and to 2.50:1.00 for the fiscal quarters ending March 31, 2018 through June 30, 2018, after which period the minimum interest coverage ratio will revert to 2.75:1.00 through maturity and (c) increased the applicable margin on loans and the commitment fee on unused amounts of revolving commitments if the leverage ratio is greater than 4.25:1.00. Simultaneously with the closing of the Term Loan Credit Facility, we entered into the
17
BRISTOW GROUP INC. AND SUBSIDIARIES
NOTES TO CONDENSED CONSOLIDATED FINANCIAL STATEMENTS — (Continued)
(Unaudited)
seventh amendment to the Amended and Restated Revolving Credit and Term Loan Agreement (“Seventh Amendment”) which permits, among other things: (i) entry into the Term Loan Credit Facility and the incurrence of indebtedness thereunder and (ii) the granting of liens by the Company and the Guarantor Subsidiaries in favor of the lenders under the Term Loan Credit Facility on a pari passu secured basis with the liens granted in favor of the lenders under the Amended and Restated Revolving Credit and Term Loan Agreement, dated as of November 22, 2010. For further details on the Revolving Credit Facility and Term Loan, see Note 5 to the fiscal year 2015 Financial Statements. During the six months ended September 30, 2015, we had borrowings of $334.2 million and made payments of $194.2 million under the Revolving Credit Facility. Additionally, we paid $7.0 million to reduce our borrowings under the Term Loan. As of September 30, 2015, we had $0.6 million in letters of credit outstanding under the Revolving Credit Facility.
Note 4 — FAIR VALUE DISCLOSURES
Assets and liabilities subject to fair value measurement are categorized into one of three different levels depending on the observability of the inputs employed in the measurement, as follows:
• | Level 1 – observable inputs that reflect quoted prices (unadjusted) for identical assets or liabilities in active markets. |
• | Level 2 – inputs that reflect quoted prices for identical assets or liabilities in markets which are not active; quoted prices for similar assets or liabilities in active markets; inputs other than quoted prices that are observable for the asset or liability; or inputs that are derived principally from or corroborated by observable market data by correlation or other means. |
• | Level 3 – unobservable inputs reflecting the Company’s own assumptions incorporated in valuation techniques used to determine fair value. These assumptions are required to be consistent with market participant assumptions that are reasonably available. |
Non-recurring Fair Value Measurements
The majority of our non-financial assets, which include inventories, property and equipment, assets held for sale, goodwill and other intangible assets, are not required to be carried at fair value on a recurring basis. However, if certain triggering events occur such that a non-financial asset is required to be evaluated for impairment and deemed to be impaired, the impaired non-financial asset is recorded at its fair value.
The following table summarizes the assets as of September 30, 2015, valued at fair value on a non-recurring basis (in thousands):
Quoted Prices in Active Markets for Identical Assets (Level 1) | Significant Other Observable Inputs (Level 2) | Significant Unobservable Inputs (Level 3) | Balance as of September 30, 2015 | Total Loss for the Three Months Ended September 30, 2015 | Total Loss for the Six Months Ended September 30, 2015 | |||||||||||||||||||
Inventories | $ | — | $ | 12,118 | $ | — | $ | 12,118 | $ | — | $ | (5,439 | ) | |||||||||||
Assets held for sale | — | 33,647 | — | 33,647 | (12,169 | ) | (22,031 | ) | ||||||||||||||||
Goodwill | — | — | 52,404 | 52,404 | (22,274 | ) | (22,274 | ) | ||||||||||||||||
Total assets | $ | — | $ | 45,765 | $ | 52,404 | $ | 98,169 | $ | (34,443 | ) | $ | (49,744 | ) | ||||||||||
The following table summarizes the assets as of September 30, 2014, valued at fair value on a non-recurring basis (in thousands):
Quoted Prices in Active Markets for Identical Assets (Level 1) | Significant Other Observable Inputs (Level 2) | Significant Unobservable Inputs (Level 3) | Balance as of September 30, 2014 | Total Loss for the Three Months Ended September 30, 2014 | Total Loss for the Six Months Ended September 30, 2014 | |||||||||||||||||||
Inventories | $ | — | $ | 19,446 | $ | — | $ | 19,446 | $ | (3,362 | ) | $ | (3,362 | ) | ||||||||||
Assets held for sale | — | 4,650 | — | 4,650 | (558 | ) | (3,137 | ) | ||||||||||||||||
Total assets | $ | — | $ | 24,096 | $ | — | $ | 24,096 | $ | (3,920 | ) | $ | (6,499 | ) | ||||||||||
The fair value of inventories using Level 2 inputs is determined by evaluating the current economic conditions for sale and disposal of spare parts, which includes estimates as to the recoverability of the carrying value of the parts based on historical
18
BRISTOW GROUP INC. AND SUBSIDIARIES
NOTES TO CONDENSED CONSOLIDATED FINANCIAL STATEMENTS — (Continued)
(Unaudited)
experience with sales and disposal of similar spare parts, the expected timeframe of sales or disposals, the location of the spare parts to be sold and the condition of the spare parts to be sold or otherwise disposed of.
The fair value of assets held for sale using Level 2 inputs is determined through evaluation of expected sales proceeds for aircraft. This analysis includes estimates based on historical experience with sales, recent transactions involving similar assets, quoted market prices for similar assets and condition and location of aircraft to be sold or otherwise disposed of. The loss for the three and six months ended September 30, 2015 related to 10 and 11 aircraft held for sale, respectively, and the loss for the three and six months ended September 30, 2014 related to two and six aircraft held for sale, respectively.
The fair value of goodwill and other intangible assets is estimated using a variety of valuation methods, including the income and market approaches. These estimates of fair value include unobservable inputs, representative of Level 3 fair value measurement, including assumptions related to future performance, such as projected demand for our services and rates. For further details on our goodwill and other intangible assets, see Note 1.
Recurring Fair Value Measurements
The following table summarizes the financial instruments we had as of September 30, 2015, valued at fair value on a recurring basis (in thousands):
Quoted Prices in Active Markets for Identical Assets (Level 1) | Significant Other Observable Inputs (Level 2) | Significant Unobservable Inputs (Level 3) | Balance as of September 30, 2015 | Balance Sheet Classification | ||||||||||||||
Rabbi Trust investments | $ | 2,219 | $ | — | $ | — | $ | 2,219 | Other assets | |||||||||
Total assets | $ | 2,219 | $ | — | $ | — | $ | 2,219 | ||||||||||
Contingent consideration: (1) | ||||||||||||||||||
Current | $ | — | $ | — | $ | 28,727 | $ | 28,727 | Other accrued liabilities | |||||||||
Long-term | — | — | 2,444 | 2,444 | Other liabilities and deferred credits | |||||||||||||
Total liabilities | $ | — | $ | — | $ | 31,171 | $ | 31,171 | ||||||||||
______________
(1) | Relates to our investment in Cougar Helicopters Inc. (“Cougar”) totaling $25.0 million and the acquisition of Airnorth totaling $6.2 million. For further details on Cougar and Airnorth, see Notes 2 and 3 to the fiscal year 2015 Financial Statements. |
The following table summarizes the financial instruments we had as of March 31, 2015, valued at fair value on a recurring basis (in thousands):
Quoted Prices in Active Markets for Identical Assets (Level 1) | Significant Other Observable Inputs (Level 2) | Significant Unobservable Inputs (Level 3) | Balance as of March 31, 2015 | Balance Sheet Classification | ||||||||||||||
Rabbi Trust investments | $ | 2,379 | $ | — | $ | — | $ | 2,379 | Other assets | |||||||||
Total assets | $ | 2,379 | $ | — | $ | — | $ | 2,379 | ||||||||||
Contingent consideration: (1) | ||||||||||||||||||
Current | $ | — | $ | — | $ | 33,938 | $ | 33,938 | Other accrued liabilities | |||||||||
Long-term | — | — | 4,967 | 4,967 | Other liabilities and deferred credits | |||||||||||||
Total liabilities | $ | — | $ | — | $ | 38,905 | $ | 38,905 | ||||||||||
______________
(1) | Relates to our investment in Cougar totaling $32.5 million and Airnorth totaling $6.4 million. For further details on Cougar and Airnorth, see Notes 2 and 3 to the fiscal year 2015 Financial Statements. |
19
BRISTOW GROUP INC. AND SUBSIDIARIES
NOTES TO CONDENSED CONSOLIDATED FINANCIAL STATEMENTS — (Continued)
(Unaudited)
The rabbi trust investments consist of cash and mutual funds whose fair value are based on quoted prices in active markets for identical assets, and are designated as Level 1 within the valuation hierarchy. The rabbi trust holds investments related to our non-qualified deferred compensation plan for our senior executives.
The following table provides a rollforward of the contingent consideration liability Level 3 fair value measurements during the six months ended September 30, 2015 (in thousands):
Significant Unobservable Inputs (Level 3) | ||||||
Balance as of March 31, 2015 | $ | 38,905 | ||||
Change in fair value of contingent consideration | 266 | |||||
Payment of Cougar second year earn-out | (8,000 | ) | ||||
Balance as of September 30, 2015 | $ | 31,171 | ||||
We assess the estimated fair value of the contractual obligation to pay the contingent consideration on a quarterly basis and any changes in estimated fair value are recorded as accretion expense included in depreciation and amortization on our condensed consolidated statements of operations. Fluctuations in the fair value of contingent consideration are impacted by two unobservable inputs, management’s estimate of the probability of Cougar or Airnorth achieving certain agreed performance targets and the estimated discount rate. As of September 30 and March 31, 2015, the discount rate approximated 4% for the contingent consideration related to Cougar and 2% for the contingent consideration related to Airnorth.
Fair Value of Debt
The fair value of our debt has been estimated in accordance with the accounting standard regarding fair value. The fair value of our fixed rate long-term debt is estimated based on quoted market prices. The carrying and fair value of our long-term debt, including the current portion, are as follows (in thousands):
September 30, 2015 | March 31, 2015 | |||||||||||||||
Carrying Value | Fair Value | Carrying Value | Fair Value | |||||||||||||
6¼% Senior Notes | $ | 401,535 | $ | 345,320 | $ | 401,535 | $ | 381,458 | ||||||||
Term Loan | 342,611 | 342,611 | 222,179 | 222,179 | ||||||||||||
Revolving Credit Facility | 223,800 | 223,800 | 83,800 | 83,800 | ||||||||||||
Airnorth debt | 20,839 | 20,839 | 23,119 | 23,119 | ||||||||||||
Eastern Airways debt | 14,595 | 14,595 | 19,680 | 19,680 | ||||||||||||
3% Convertible Senior Notes | — | — | 114,109 | 115,288 | ||||||||||||
$ | 1,003,380 | $ | 947,165 | $ | 864,422 | $ | 845,524 | |||||||||
Other
The fair values of our cash and cash equivalents, accounts receivable and accounts payable approximate their carrying values due to the short-term nature of these items.
20
BRISTOW GROUP INC. AND SUBSIDIARIES
NOTES TO CONDENSED CONSOLIDATED FINANCIAL STATEMENTS — (Continued)
(Unaudited)
Note 5 — COMMITMENTS AND CONTINGENCIES
Aircraft Purchase Contracts — As shown in the table below, we expect to make additional capital expenditures over the next five fiscal years to purchase additional aircraft. As of September 30, 2015, we had 41 aircraft on order and options to acquire an additional 21 aircraft. Although a similar number of our existing aircraft may be sold during the same period, the additional aircraft on order will provide incremental fleet capacity in terms of revenue and operating income.
Six Months Ending March 31, 2016 | Fiscal Year Ending March 31, | |||||||||||||||||||||||
2017 | 2018 | 2019 | 2020 and thereafter | Total | ||||||||||||||||||||
Commitments as of September 30, 2015: (1) (2) | ||||||||||||||||||||||||
Number of aircraft: | ||||||||||||||||||||||||
Medium | 10 | — | — | — | — | 10 | ||||||||||||||||||
Large (3) | 3 | 4 | 6 | 4 | 3 | 20 | ||||||||||||||||||
U.K. SAR | 6 | 4 | — | — | — | 10 | ||||||||||||||||||
Other SAR | 1 | — | — | — | — | 1 | ||||||||||||||||||
20 | 8 | 6 | 4 | 3 | 41 | |||||||||||||||||||
Related expenditures (in thousands)(4) | ||||||||||||||||||||||||
Medium and large | $ | 116,662 | $ | 77,204 | $ | 78,778 | $ | 58,945 | $ | 31,550 | $ | 363,139 | ||||||||||||
U.K. SAR | 109,052 | 58,428 | — | — | — | 167,480 | ||||||||||||||||||
Other SAR | 26,259 | — | — | — | — | 26,259 | ||||||||||||||||||
$ | 251,973 | $ | 135,632 | $ | 78,778 | $ | 58,945 | $ | 31,550 | $ | 556,878 | |||||||||||||
Options as of September 30, 2015: (3) | ||||||||||||||||||||||||
Number of aircraft: | ||||||||||||||||||||||||
Medium | — | 1 | 7 | — | — | 8 | ||||||||||||||||||
Large | — | 4 | 9 | — | — | 13 | ||||||||||||||||||
— | 5 | 16 | — | — | 21 | |||||||||||||||||||
Related expenditures (in thousands)(4) | $ | 26,291 | $ | 180,100 | $ | 214,008 | $ | — | $ | — | $ | 420,399 | ||||||||||||
______
(1) | Signed client contracts are currently in place that will utilize 11 of these aircraft. |
(2) | We are currently in discussions with our helicopter manufacturers to defer payment on certain ordered aircraft into future fiscal years and take delivery of certain aircraft later than reflected herein. The aim of these discussions is to more closely align the expenditures and delivery of aircraft with the applicable revenue and cash flow associated with the aircraft. We expect to defer approximately $100 million in capital expenditures out of the six months ending March 31, 2016 into future periods and push deliveries into future periods further out resulting in anticipated capital expenditures of approximately $100 million for each of fiscal year 2017 and fiscal year 2018 and $50 million per fiscal year thereafter. |
(3) | Seventeen large aircraft on order expected to enter service between fiscal years 2017 and 2020 are subject to the successful development and certification of the aircraft. |
(4) | Includes progress payments on aircraft scheduled to be delivered in future periods. |
21
BRISTOW GROUP INC. AND SUBSIDIARIES
NOTES TO CONDENSED CONSOLIDATED FINANCIAL STATEMENTS — (Continued)
(Unaudited)
The following chart presents an analysis of our aircraft orders and options during fiscal year 2016:
Three Months Ended | |||||||||||||
September 30, 2015 | June 30, 2015 | ||||||||||||
Orders | Options | Orders | Options | ||||||||||
Beginning of period | 46 | 21 | 45 | 30 | |||||||||
Aircraft delivered | (1 | ) | — | (2 | ) | — | |||||||
Aircraft ordered | — | — | — | — | |||||||||
Exercised options | — | — | 3 | (3 | ) | ||||||||
Expired options | — | (4 | ) | — | (6 | ) | |||||||
Reclassification (1) | (4 | ) | 4 | — | — | ||||||||
End of period | 41 | 21 | 46 | 21 | |||||||||
______
(1) We have determined that several aircraft were previously classified as orders in error.
We periodically purchase aircraft for which we have no orders.
Operating Leases — We have non-cancelable operating leases in connection with the lease of certain equipment, land and facilities, including leases for aircraft. Rental expense incurred under all operating leases was $54.4 million and $35.4 million for the three months ended September 30, 2015 and 2014, respectively, and $108.3 million and $68.6 million for the six months ended September 30, 2015 and 2014, respectively. Rental expense incurred under operating leases for aircraft was $47.3 million and $28.5 million for the three months ended September 30, 2015 and 2014, respectively, and $93.9 million and $54.9 million for the six months ended September 30, 2015 and 2014, respectively.
During the three and six months ended September 30, 2014 we sold 14 aircraft for $380.7 million and entered into 14 separate agreements to lease back these aircraft. We did not enter into any sale leaseback transactions during the three and six months ended September 30, 2015.
The aircraft leases range from base terms of up to 180 months with renewal options of up to 240 months in some cases, include purchase options upon expiration and some include early purchase options. The leases contain terms customary in transactions of this type, including provisions that allow the lessor to repossess the aircraft and require us to pay a stipulated amount if we default on our obligations under the agreements. The following is a summary of the terms related to aircraft leased under operating leases with original or remaining terms in excess of one year as of September 30, 2015:
End of Lease Term | Number of Aircraft | Monthly Lease Payments (in thousands) | ||||||
Six months ending March 31, 2016 to fiscal year 2017 | 9 | $ | 1,070 | |||||
Fiscal year 2018 to fiscal year 2020 | 47 | 9,255 | ||||||
Fiscal year 2021 to fiscal year 2024 | 25 | 2,742 | ||||||
81 | $ | 13,067 | ||||||
Employee Agreements — Approximately 49% of our employees are represented by collective bargaining agreements and/or unions with 6% of these employees being represented by collective bargaining agreements and/or unions that have expired or will expire in one year. These agreements generally include annual escalations of up to 21%. Periodically, certain groups of our employees who are not covered by a collective bargaining agreement consider entering into such an agreement. We also have employment agreements with members of senior management.
22
BRISTOW GROUP INC. AND SUBSIDIARIES
NOTES TO CONDENSED CONSOLIDATED FINANCIAL STATEMENTS — (Continued)
(Unaudited)
Separation Programs — In March 2015, we offered a voluntary separation program (“VSP”) to certain employees as part of our ongoing efforts to improve efficiencies and reduce costs. The VSP was offered to approximately 2,888 employees and 137 employees accepted prior to the expiration of the offers, the date of which varied by region. We will recognize the expense related to their termination benefits over their remaining service period, which we estimate will be $3.5 million through May 2017. During the three months ended September 30, 2015, we recognized $0.9 million in severance expense as a result of the VSP, which is included in direct cost. During the six months ended September 30, 2015, we recognized $7.3 million in severance expense as a result of the VSP, $6.7 million of which is included in direct cost and $0.6 million in general administrative expense. Additionally, beginning in March 2015, we initiated involuntary separation programs (“ISPs”) and other reductions in force in certain regions. During the three months ended September 30, 2015, we recognized $4.8 million in severance expense as a result of the ISPs and other reductions in force, $2.0 million of which is included in direct cost and $2.8 million in general administrative expense. During the six months ended September 30, 2015, we recognized $6.4 million in severance expense as a result of the ISPs and other reductions in force, $2.5 million of which is included in direct cost and $3.9 million in general administrative expense. We expect to incur approximately $5.5 million in severance expense related to this plan over the remainder of fiscal year 2016.
Environmental Contingencies — The U.S. Environmental Protection Agency, also referred to as the EPA, has in the past notified us that we are a potential responsible party, or PRP, at three former waste disposal facilities that are on the National Priorities List of contaminated sites. Under the federal Comprehensive Environmental Response, Compensation and Liability Act, also known as the Superfund law, persons who are identified as PRPs may be subject to strict, joint and several liability for the costs of cleaning up environmental contamination resulting from releases of hazardous substances at National Priorities List sites. Although we have not yet obtained a formal release of liability from the EPA with respect to any of the sites, we believe that our potential liability in connection with the sites is not likely to have a material adverse effect on our business, financial condition or results of operations.
Other Purchase Obligations — As of September 30, 2015, we had $395.7 million of other purchase obligations representing unfilled purchase orders for aircraft parts, commitments associated with upgrading facilities at our bases and non-cancelable power-by-the-hour maintenance commitments.
Other Matters — Although infrequent, aircraft accidents have occurred in the past, and the related losses and liability claims have been covered by insurance subject to deductible, self-insured retention and loss sensitive factors.
On August 12, 2015, a Sikorsky S-76C+ operated by us was involved in an accident in which two of our crew members and four passengers were fatally injured. There were six other passengers on board who suffered injuries in the accident. The Nigerian Accident Investigation Bureau issued its preliminary report related to the accident on September 21, 2015. The cause(s) of the accident remain unknown at this time. We continue to work with authorities in their investigation.
We operate in jurisdictions internationally where we are subject to risks that include government action to obtain additional tax revenue. In a number of these jurisdictions, political unrest, the lack of well-developed legal systems and legislation that is not clear enough in its wording to determine the ultimate application, can make it difficult to determine whether legislation may impact our earnings until such time as a clear court or other ruling exists. We operate in jurisdictions currently where amounts may be due to governmental bodies that we are not currently recording liabilities for as it is unclear how broad or narrow legislation may ultimately be interpreted. We believe that payment of amounts in these instances is not probable at this time, but is reasonably possible.
A loss contingency is reasonably possible if the contingency has a more than remote but less than probable chance of occurring. Although management believes that there is no clear requirement to pay amounts at this time and that positions exist suggesting that no further amounts are currently due, it is reasonably possible that a loss could occur for which we have estimated a maximum loss at September 30, 2015 to be approximately $6 million to $9 million.
We are a defendant in certain claims and litigation arising out of operations in the normal course of business. In the opinion of management, uninsured losses, if any, will not be material to our financial position, results of operations or cash flows.
23
BRISTOW GROUP INC. AND SUBSIDIARIES
NOTES TO CONDENSED CONSOLIDATED FINANCIAL STATEMENTS — (Continued)
(Unaudited)
Note 6 — TAXES
Our effective income tax rates were 5.7% and 17.7% for the three months ended September 30, 2015 and 2014, respectively and 0.3% and 19.6% for the six months ended September 30, 2015 and 2014, respectively. Our effective tax rate was impacted by the permanent reinvestment outside the U.S. of foreign earnings, upon which no U.S. tax has been provided, and by the amount of our foreign source income and our ability to realize foreign tax credits. In the three and six months ended September 30, 2015, our unfavorable permanent differences, such as valuation allowances and non-tax deductible goodwill write-off had the effect of decreasing our income tax benefit.
The relationship between our provision for or benefit from income taxes and our pre-tax book income can vary significantly from period to period considering, among other factors, (a) the overall level of pre-tax book income, (b) changes in the blend of income that is taxed based on gross revenues or at high effective tax rates versus pre-tax book income or at low effective tax rates and (c) our geographical blend of pre-tax book income. Consequently, our income tax expense does not change proportionally with our pre-tax book income. Significant decreases in our pre-tax book income typically result in higher effective tax rates, while significant increases in pre-tax book income can lead to lower effective tax rates, subject to the other factors impacting income tax expense noted above. The increase in our effective tax rate (excluding discrete items) for the six months ended September 30, 2015 as compared to the six months ended September 30, 2014 primarily related to an increase in the blend of income taxed in relatively high taxed jurisdictions versus low taxed jurisdictions. Additionally, we increased our valuation allowance by $1.0 million and $3.0 million for the three and six months ended September 30, 2015, respectively, which adversely impacted our effective tax rate.
As of September 30, 2015, there were $4.7 million of unrecognized tax benefits, all of which would have an impact on our effective tax rate if recognized except for indemnities. The uncertain tax benefits relate to pre-acquisition tax matters for the February 2014 acquisition of a 60% interest in Eastern Airways and are the subject of an indemnity, for which a corresponding indemnity asset has been established in the amount of $3.6 million.
Note 7 — EMPLOYEE BENEFIT PLANS
Pension Plans
The following table provides a detail of the components of net periodic pension cost (in thousands):
Three Months Ended September 30, | Six Months Ended September 30, | |||||||||||||||||
2015 | 2014 | 2015 | 2014 | |||||||||||||||
Service cost for benefits earned during the period | $ | 2,399 | $ | 2,087 | $ | 4,772 | $ | 4,333 | ||||||||||
Interest cost on pension benefit obligation | 5,226 | 6,437 | 10,396 | 13,366 | ||||||||||||||
Expected return on assets | (7,014 | ) | (7,638 | ) | (13,955 | ) | (15,861 | ) | ||||||||||
Amortization of unrecognized losses | 2,153 | 1,641 | 4,285 | 3,409 | ||||||||||||||
Net periodic pension cost | $ | 2,764 | $ | 2,527 | $ | 5,498 | $ | 5,247 | ||||||||||
We pre-funded our contributions of £12.5 million ($18.6 million) to our U.K. Staff pension plan for fiscal year 2016 in quarterly installments during fiscal year 2015. The current estimates of our cash contributions required for fiscal year 2017 to our U.K. pension plans and Norwegian pension plan to be paid in fiscal year 2016 are $18.1 million and $11.7 million, respectively, of which $5.0 million and $2.0 million, respectively, were paid during the six months ended September 30, 2015.
24
BRISTOW GROUP INC. AND SUBSIDIARIES
NOTES TO CONDENSED CONSOLIDATED FINANCIAL STATEMENTS — (Continued)
(Unaudited)
Incentive Compensation
Stock–based awards are currently made under the Bristow Group Inc. 2007 Long-Term Incentive Plan (the “2007 Plan”). A maximum of 5,400,000 shares of common stock, par value $.01 per share (“Common Stock”), are reserved. Awards granted under the 2007 Plan may be in the form of stock options, stock appreciation rights, shares of restricted stock, other stock-based awards (payable in cash or Common Stock) or performance awards, or any combination thereof, and may be made to outside directors, employees or consultants. As of September 30, 2015, 1,438,501 shares remained available for grant under the 2007 Plan.
We have a number of other incentive and stock option plans which are described in Note 9 to our fiscal year 2015 Financial Statements.
Total stock-based compensation expense, which includes stock options and restricted stock, totaled $6.4 million and $4.2 million for the three months ended September 30, 2015 and 2014, respectively, and $10.4 million and $8.4 million for the six months ended September 30, 2015 and 2014, respectively. Stock-based compensation expense has been allocated to our various regions.
During the three and six months ended September 30, 2015, we awarded 22,910 and 213,349 shares of restricted stock, respectively, at an average grant date fair value of $45.01 and $56.76 per share, respectively. Also during the three and six months ended September 30, 2015, 26,406 and 740,718 stock options were granted, respectively. The following table shows the assumptions used to compute the stock-based compensation expense for stock options granted during the six months ended September 30, 2015:
Risk free interest rate | 1.62 | % | ||
Expected life (years) | 6 | |||
Volatility | 28.1 | % | ||
Dividend yield | 3.14 | % | ||
Weighted average exercise price of options granted | $57.52 per option | |||
Weighted average grant-date fair value of options granted | $10.71 per option | |||
Performance cash awards vest and pay out in cash three years after the date of grant at varying levels depending on our performance in Total Shareholder Return against a peer group of companies. These awards were designed to tie a significant portion of total compensation to performance. One of the effects of this type of compensation is that it requires liability accounting which can result in volatility in earnings. The liability recorded for these awards as of September 30 and March 31, 2015 was $13.6 million and $21.0 million, respectively, and represents an accrual based on the fair value of the awards on those dates. The decrease in the liability during the six months ended September 30, 2015 resulted from the payout in June 2015 of the awards granted in June 2012 and the reduction in Total Shareholder Return based on declining stock price, partially offset by the value of the new awards granted in June 2015. Any changes in fair value of the awards in future quarters will increase or decrease the liability and impact results in those periods. The effect, either positive or negative, on future period earnings can vary based on factors including changes in our stock price or the stock prices of the peer group companies, as well as changes in other market and company-specific assumptions that are factored into the calculation of fair value of the performance cash awards.
Compensation related to the performance cash awards was recorded as a benefit of $1.6 million and an expense of $2.5 million during the three months ended September 30, 2015 and 2014, respectively, and an expense of $1.7 million and $4.6 million, during the six months ended September 30, 2015 and 2014, respectively.
25
BRISTOW GROUP INC. AND SUBSIDIARIES
NOTES TO CONDENSED CONSOLIDATED FINANCIAL STATEMENTS — (Continued)
(Unaudited)
Note 8 — DIVIDENDS, SHARE REPURCHASES, EARNINGS PER SHARE AND ACCUMULATED OTHER COMPREHENSIVE INCOME
Dividends
On November 5, 2015, our board of directors approved a dividend of $0.34 per share of Common Stock, payable on December 15, 2015 to shareholders of record on December 1, 2015. See discussion of our dividends in Note 10 to our fiscal year 2015 Financial Statements. The declaration of future dividends is at the discretion of our board of directors and subject to our results of operations, financial condition, cash requirements and other factors and restrictions under applicable law and our debt instruments.
Share Repurchases
During the three and six months ended September 30, 2014, respectively, we spent $23.3 million and $43.4 million to repurchase 324,720 and 595,318 shares of our Common Stock. We did not repurchase any shares during the three and six months ended September 30, 2015. On November 5, 2015, our board of directors extended the date to repurchase shares of our Common Stock through November 4, 2016 with a remaining authorized repurchase amount of $150.0 million. For additional information on our repurchases of Common Stock, see “Share Repurchases” in Note 10 to the fiscal year 2015 Financial Statements. The timing and method of any repurchases under the program will depend on a variety of factors, is subject to our results of operations, financial condition, cash requirements, and other factors and restrictions under applicable law and our debt instruments, and may be suspended or discontinued at any time.
Earnings per Share
Basic earnings per common share is computed by dividing income available to common stockholders by the weighted average number of shares of Common Stock outstanding during the period. Diluted earnings per common share excludes options to purchase shares and restricted stock awards, which were outstanding during the period but were anti-dilutive, as follows:
Three Months Ended September 30, | Six Months Ended September 30, | |||||||||||||||||
2015 | 2014 | 2015 | 2014 | |||||||||||||||
Options: | ||||||||||||||||||
Outstanding | 1,292,639 | 298,333 | 592,067 | 300,686 | ||||||||||||||
Weighted average exercise price | $ | 61.87 | $ | 62.17 | $ | 68.99 | $ | 62.17 | ||||||||||
Restricted stock awards: | ||||||||||||||||||
Outstanding | 348,182 | 2,313 | 296,205 | 1,150 | ||||||||||||||
Weighted average price | $ | 49.79 | $ | 72.98 | $ | 49.22 | $ | 72.98 | ||||||||||
26
BRISTOW GROUP INC. AND SUBSIDIARIES
NOTES TO CONDENSED CONSOLIDATED FINANCIAL STATEMENTS — (Continued)
(Unaudited)
The following table sets forth the computation of basic and diluted earnings per share:
Three Months Ended September 30, | Six Months Ended September 30, | |||||||||||||||
2015 | 2014 | 2015 | 2014 | |||||||||||||
Net income (loss) available to common stockholders (in thousands): | ||||||||||||||||
Income (loss) available to common stockholders – basic | $ | (42,329 | ) | $ | 26,082 | $ | (51,887 | ) | $ | 70,191 | ||||||
Interest expense on assumed conversion of 3% Convertible Senior Notes, net of tax (1) | — | — | — | — | ||||||||||||
Income (loss) available to common stockholders – diluted | $ | (42,329 | ) | $ | 26,082 | $ | (51,887 | ) | $ | 70,191 | ||||||
Shares: | ||||||||||||||||
Weighted average number of common shares outstanding – basic | 34,921,891 | 35,447,094 | 34,876,010 | 35,495,319 | ||||||||||||
Assumed conversion of 3% Convertible Senior Notes outstanding during the period (1) | — | — | — | — | ||||||||||||
Net effect of dilutive stock options and restricted stock awards based on the treasury stock method | — | 234,398 | — | 301,167 | ||||||||||||
Weighted average number of common shares outstanding – diluted | 34,921,891 | 35,681,492 | 34,876,010 | 35,796,486 | ||||||||||||
Basic earnings (loss) per common share | $ | (1.21 | ) | $ | 0.74 | $ | (1.49 | ) | $ | 1.98 | ||||||
Diluted earnings (loss) per common share | $ | (1.21 | ) | $ | 0.73 | $ | (1.49 | ) | $ | 1.96 | ||||||
_____________
(1) | Diluted earnings per common share for the three months ended September 30, 2015 and 2014 excluded a number of potentially dilutive shares determined pursuant to a specified formula initially issuable upon the conversion of our 3% Convertible Senior Notes. The 3% Convertible Senior Notes were convertible, under certain circumstances, using a net share settlement process, into a combination of cash and our Common Stock. As of September 30, 2015, we had repurchased the $115.0 million principal amount of our 3% Convertible Senior Notes. Prior to the purchase, upon conversion of a note, the holder would have received cash equal to the principal amount of the note and Common Stock to the extent of the note’s conversion value in excess of such principal amount. In addition, if at the time of conversion the applicable price of our Common Stock exceeded the base conversion price, holders would have received additional shares of our Common Stock per $1,000 principal amount of notes, as determined pursuant to a specified formula. Such shares did not impact our calculation of diluted earnings per share for the three and six months ended September 30, 2015 and 2014 as our average stock price during these periods did not meet or exceed the conversion requirements. |
Accumulated Other Comprehensive Income
The following table sets forth the changes in the balances of each component of accumulated other comprehensive income:
Currency Translation Adjustments | Pension Liability Adjustments (1) | Total | ||||||||||
Balance as of March 31, 2015 | $ | (39,066 | ) | $ | (231,263 | ) | $ | (270,329 | ) | |||
Other comprehensive income before reclassification | (3,771 | ) | — | (3,771 | ) | |||||||
Reclassified from accumulated other comprehensive income | — | — | — | |||||||||
Net current period other comprehensive income | (3,771 | ) | — | (3,771 | ) | |||||||
Foreign exchange rate impact | 4,074 | (4,074 | ) | — | ||||||||
Balance at September 30, 2015 | $ | (38,763 | ) | $ | (235,337 | ) | $ | (274,100 | ) | |||
_____________
(1) | Reclassification of amounts related to pension liability adjustments are included as a component of net periodic pension cost. |
27
BRISTOW GROUP INC. AND SUBSIDIARIES
NOTES TO CONDENSED CONSOLIDATED FINANCIAL STATEMENTS — (Continued)
(Unaudited)
Note 9 — SEGMENT INFORMATION
We conduct our business in one segment: Helicopter Services. Effective April 1, 2015, we reorganized our Helicopter Services global operations from five business units to four regions as follows: Europe Caspian, Africa, Americas and Asia Pacific. The Europe Caspian region comprises all our operations and affiliates in Europe and Central Asia, including Norway, the U.K. and Turkmenistan. The Africa region comprises all our operations and affiliates on the African continent, including Nigeria, Tanzania and Egypt. The Americas region comprises all our operations and affiliates in North America and South America, including Brazil, Canada, Trinidad and the U.S. Gulf of Mexico. The Asia Pacific region comprises all our operations and affiliates in Australia and Southeast Asia, including Malaysia and Sakhalin. Amounts presented below for the three and six months ended September 30, 2014 and as of March 31, 2015 have been restated to conform to current period presentation. Additionally, we operate a training unit, Bristow Academy, which is included in Corporate and other.
The following shows region information for the three and six months ended September 30, 2015 and 2014 and as of September 30 and March 31, 2015, where applicable, reconciled to consolidated totals, and prepared on the same basis as our condensed consolidated financial statements (in thousands):
Three Months Ended September 30, | Six Months Ended September 30, | |||||||||||||||||
2015 | 2014 | 2015 | 2014 | |||||||||||||||
Region gross revenue from external clients: | ||||||||||||||||||
Europe Caspian | $ | 225,498 | $ | 233,391 | $ | 448,447 | $ | 463,647 | ||||||||||
Africa | 65,299 | 87,666 | 144,214 | 175,136 | ||||||||||||||
Americas | 71,858 | 85,466 | 148,458 | 171,821 | ||||||||||||||
Asia Pacific | 78,691 | 60,875 | 159,079 | 120,431 | ||||||||||||||
Corporate and other | 5,565 | 8,238 | 13,709 | 17,139 | ||||||||||||||
Total region gross revenue | $ | 446,911 | $ | 475,636 | $ | 913,907 | $ | 948,174 | ||||||||||
Intra-region gross revenue: | ||||||||||||||||||
Europe Caspian | $ | 685 | $ | 3,672 | $ | 1,077 | $ | 7,067 | ||||||||||
Africa | 2 | — | 2 | — | ||||||||||||||
Americas | 1,720 | 2,727 | 5,372 | 6,241 | ||||||||||||||
Asia Pacific | 2 | — | 2 | — | ||||||||||||||
Corporate and other | 661 | 743 | 1,444 | 1,386 | ||||||||||||||
Total intra-region gross revenue | $ | 3,070 | $ | 7,142 | $ | 7,897 | $ | 14,694 | ||||||||||
Consolidated gross revenue reconciliation: | ||||||||||||||||||
Europe Caspian | $ | 226,183 | $ | 237,063 | $ | 449,524 | $ | 470,714 | ||||||||||
Africa | 65,301 | 87,666 | 144,216 | 175,136 | ||||||||||||||
Americas | 73,578 | 88,193 | 153,830 | 178,062 | ||||||||||||||
Asia Pacific | 78,693 | 60,875 | 159,081 | 120,431 | ||||||||||||||
Corporate and other | 6,226 | 8,981 | 15,153 | 18,525 | ||||||||||||||
Intra-region eliminations | (3,070 | ) | (7,142 | ) | (7,897 | ) | (14,694 | ) | ||||||||||
Total consolidated gross revenue | $ | 446,911 | $ | 475,636 | $ | 913,907 | $ | 948,174 | ||||||||||
28
BRISTOW GROUP INC. AND SUBSIDIARIES
NOTES TO CONDENSED CONSOLIDATED FINANCIAL STATEMENTS — (Continued)
(Unaudited)
Three Months Ended September 30, | Six Months Ended September 30, | |||||||||||||||||
2015 | 2014 | 2015 | 2014 | |||||||||||||||
Earnings from unconsolidated affiliates, net of losses – equity method investments: | ||||||||||||||||||
Europe Caspian | $ | 153 | $ | 524 | $ | 252 | $ | 897 | ||||||||||
Americas | (15,513 | ) | (3,428 | ) | (9,316 | ) | 480 | |||||||||||
Total earnings from unconsolidated affiliates, net of losses – equity method investments | $ | (15,360 | ) | $ | (2,904 | ) | $ | (9,064 | ) | $ | 1,377 | |||||||
Consolidated operating income (loss) reconciliation: | ||||||||||||||||||
Europe Caspian | $ | 15,060 | $ | 40,627 | $ | 29,257 | $ | 82,822 | ||||||||||
Africa | 7,574 | 19,667 | 20,526 | 37,293 | ||||||||||||||
Americas | (9,046 | ) | 13,566 | 7,486 | 40,224 | |||||||||||||
Asia Pacific | 5,013 | 2,461 | 4,325 | 5,791 | ||||||||||||||
Corporate and other | (34,427 | ) | (32,384 | ) | (64,891 | ) | (57,611 | ) | ||||||||||
Gain (loss) on disposal of assets | (14,007 | ) | 127 | (21,702 | ) | 737 | ||||||||||||
Total consolidated operating income (loss) | $ | (29,833 | ) | $ | 44,064 | $ | (24,999 | ) | $ | 109,256 | ||||||||
Depreciation and amortization: | ||||||||||||||||||
Europe Caspian | $ | 10,195 | $ | 10,609 | $ | 20,977 | $ | 20,356 | ||||||||||
Africa | 9,809 | 3,936 | 15,693 | 7,899 | ||||||||||||||
Americas | 10,570 | 8,953 | 20,726 | 16,142 | ||||||||||||||
Asia Pacific | 4,858 | 4,640 | 13,177 | 8,880 | ||||||||||||||
Corporate and other | 1,955 | 67 | 3,960 | 262 | ||||||||||||||
Total depreciation and amortization (1) | $ | 37,387 | $ | 28,205 | $ | 74,533 | $ | 53,539 | ||||||||||
September 30, 2015 | March 31, 2015 | |||||||||
Identifiable assets: | ||||||||||
Europe Caspian | $ | 1,123,176 | $ | 968,234 | ||||||
Africa | 344,405 | 431,466 | ||||||||
Americas | 878,553 | 926,956 | ||||||||
Asia Pacific | 366,135 | 366,181 | ||||||||
Corporate and other | 488,783 | 537,883 | ||||||||
Total identifiable assets (2) | $ | 3,201,052 | $ | 3,230,720 | ||||||
Investments in unconsolidated affiliates – equity method investments: | ||||||||||
Europe Caspian | $ | 273 | $ | 65 | ||||||
Americas | 189,791 | 210,025 | ||||||||
Total investments in unconsolidated affiliates – equity method investments | $ | 190,064 | $ | 210,090 | ||||||
_____________
(1) | Includes accelerated depreciation expense of $10.5 million during the three months ended September 30, 2015 related to aircraft where management made the decision to exit certain model types earlier than originally anticipated in our Americas, Africa and Asia Pacific regions of $3.2 million, $6.5 million and $0.8 million, respectively. Includes accelerated depreciation expense of $19.3 million during the six months ended September 30, 2015 related to aircraft where management made the decision to exit certain model types earlier than originally anticipated in our Americas, Africa and Asia Pacific regions of $6.1 million, $8.8 million and $4.4 million, respectively. For further details, see Note 1. |
(2) | Includes $262.3 million and $306.0 million of construction in progress within property and equipment on our condensed consolidated balance sheets as of September 30 and March 31, 2015, respectively, which primarily represents progress payments on aircraft to be delivered in future periods. |
29
BRISTOW GROUP INC. AND SUBSIDIARIES
NOTES TO CONDENSED CONSOLIDATED FINANCIAL STATEMENTS — (Continued)
(Unaudited)
Note 10 — SUPPLEMENTAL CONDENSED CONSOLIDATING FINANCIAL INFORMATION
In connection with the issuance of the 6¼% Senior Notes and the 3% Convertible Senior Notes (which we repurchased during the six months ended September 30, 2015), the Guarantor Subsidiaries fully, unconditionally, jointly and severally guaranteed the payment obligations under these notes. The following supplemental financial information sets forth, on a consolidating basis, the balance sheet, statement of operations, comprehensive income and cash flow information for Bristow Group Inc. (“Parent Company Only”), for the Guarantor Subsidiaries and for our other subsidiaries (the “Non-Guarantor Subsidiaries”). We have not presented separate financial statements and other disclosures concerning the Guarantor Subsidiaries because management has determined that such information is not material to investors.
The supplemental condensed consolidating financial information has been prepared pursuant to the rules and regulations for condensed financial information and does not include all disclosures included in annual financial statements, although we believe that the disclosures made are adequate to make the information presented not misleading. The principal eliminating entries eliminate investments in subsidiaries, intercompany balances and intercompany revenue and expense.
The allocation of the consolidated income tax provision was made using the with and without allocation method.
30
BRISTOW GROUP INC. AND SUBSIDIARIES
NOTES TO CONDENSED CONSOLIDATED FINANCIAL STATEMENTS — (Continued)
(Unaudited)
Supplemental Condensed Consolidating Statement of Operations
Three Months Ended September 30, 2015
Parent Company Only | Guarantor Subsidiaries | Non- Guarantor Subsidiaries | Eliminations | Consolidated | ||||||||||||||||
(In thousands) | ||||||||||||||||||||
Revenue: | ||||||||||||||||||||
Gross revenue | $ | — | $ | 58,570 | $ | 388,341 | $ | — | $ | 446,911 | ||||||||||
Intercompany revenue | — | 21,924 | — | (21,924 | ) | — | ||||||||||||||
— | 80,494 | 388,341 | (21,924 | ) | 446,911 | |||||||||||||||
Operating expense: | ||||||||||||||||||||
Direct cost and reimbursable expense | (1,061 | ) | 50,731 | 284,589 | — | 334,259 | ||||||||||||||
Intercompany expenses | — | — | 21,924 | (21,924 | ) | — | ||||||||||||||
Depreciation and amortization | 1,675 | 17,530 | 18,182 | — | 37,387 | |||||||||||||||
General and administrative | 19,764 | 5,961 | 27,732 | — | 53,457 | |||||||||||||||
20,378 | 74,222 | 352,427 | (21,924 | ) | 425,103 | |||||||||||||||
Loss on impairment | — | — | (22,274 | ) | — | (22,274 | ) | |||||||||||||
Loss on disposal of assets | — | (11,901 | ) | (2,106 | ) | — | (14,007 | ) | ||||||||||||
Earnings from unconsolidated affiliates, net of losses | (73,993 | ) | — | (15,360 | ) | 73,993 | (15,360 | ) | ||||||||||||
Operating loss | (94,371 | ) | (5,629 | ) | (3,826 | ) | 73,993 | (29,833 | ) | |||||||||||
Interest expense, net | 30,967 | (1,081 | ) | (37,065 | ) | — | (7,179 | ) | ||||||||||||
Other income (expense), net | 271 | 330 | (12,025 | ) | — | (11,424 | ) | |||||||||||||
Loss before provision for income taxes | (63,133 | ) | (6,380 | ) | (52,916 | ) | 73,993 | (48,436 | ) | |||||||||||
Allocation of consolidated income taxes | 16,015 | (1,273 | ) | (11,986 | ) | — | 2,756 | |||||||||||||
Net loss | (47,118 | ) | (7,653 | ) | (64,902 | ) | 73,993 | (45,680 | ) | |||||||||||
Net income attributable to noncontrolling interests | (14 | ) | — | (1,438 | ) | — | (1,452 | ) | ||||||||||||
Net loss attributable to Bristow Group | (47,132 | ) | (7,653 | ) | (66,340 | ) | 73,993 | (47,132 | ) | |||||||||||
Accretion of redeemable noncontrolling interests | — | — | 4,803 | — | 4,803 | |||||||||||||||
Net loss attributable to common stockholders | $ | (47,132 | ) | $ | (7,653 | ) | $ | (61,537 | ) | $ | 73,993 | $ | (42,329 | ) | ||||||
31
BRISTOW GROUP INC. AND SUBSIDIARIES
NOTES TO CONDENSED CONSOLIDATED FINANCIAL STATEMENTS — (Continued)
(Unaudited)
Supplemental Condensed Consolidating Statement of Operations
Six Months Ended September 30, 2015
Parent Company Only | Guarantor Subsidiaries | Non- Guarantor Subsidiaries | Eliminations | Consolidated | ||||||||||||||||
(In thousands) | ||||||||||||||||||||
Revenue: | ||||||||||||||||||||
Gross revenue | $ | — | $ | 123,426 | $ | 790,481 | $ | — | $ | 913,907 | ||||||||||
Intercompany revenue | — | 46,735 | — | (46,735 | ) | — | ||||||||||||||
— | 170,161 | 790,481 | (46,735 | ) | 913,907 | |||||||||||||||
Operating expense: | ||||||||||||||||||||
Direct cost and reimbursable expense | (917 | ) | 104,957 | 587,065 | — | 691,105 | ||||||||||||||
Intercompany expenses | — | — | 46,735 | (46,735 | ) | — | ||||||||||||||
Depreciation and amortization | 3,284 | 32,115 | 39,134 | — | 74,533 | |||||||||||||||
General and administrative | 40,315 | 12,792 | 61,682 | — | 114,789 | |||||||||||||||
42,682 | 149,864 | 734,616 | (46,735 | ) | 880,427 | |||||||||||||||
Loss on impairment | — | (2,508 | ) | (25,205 | ) | — | (27,713 | ) | ||||||||||||
Loss on disposal of assets | — | (19,638 | ) | (2,064 | ) | — | (21,702 | ) | ||||||||||||
Earnings from unconsolidated affiliates, net of losses | (89,427 | ) | — | (9,064 | ) | 89,427 | (9,064 | ) | ||||||||||||
Operating income (loss) | (132,109 | ) | (1,849 | ) | 19,532 | 89,427 | (24,999 | ) | ||||||||||||
Interest expense, net | 58,451 | (2,346 | ) | (70,953 | ) | — | (14,848 | ) | ||||||||||||
Other income (expense), net | (45 | ) | 84 | (7,624 | ) | — | (7,585 | ) | ||||||||||||
Loss before provision for income taxes | (73,703 | ) | (4,111 | ) | (59,045 | ) | 89,427 | (47,432 | ) | |||||||||||
Allocation of consolidated income taxes | 23,342 | (2,410 | ) | (20,809 | ) | — | 123 | |||||||||||||
Net loss | (50,361 | ) | (6,521 | ) | (79,854 | ) | 89,427 | (47,309 | ) | |||||||||||
Net income attributable to noncontrolling interests | (28 | ) | — | (3,052 | ) | — | (3,080 | ) | ||||||||||||
Net loss attributable to Bristow Group | (50,389 | ) | (6,521 | ) | (82,906 | ) | 89,427 | (50,389 | ) | |||||||||||
Accretion of redeemable noncontrolling interests | — | — | (1,498 | ) | — | (1,498 | ) | |||||||||||||
Net loss attributable to common stockholders | $ | (50,389 | ) | $ | (6,521 | ) | $ | (84,404 | ) | $ | 89,427 | $ | (51,887 | ) | ||||||
32
BRISTOW GROUP INC. AND SUBSIDIARIES
NOTES TO CONDENSED CONSOLIDATED FINANCIAL STATEMENTS — (Continued)
(Unaudited)
Supplemental Condensed Consolidating Statement of Operations
Three Months Ended September 30, 2014
Parent Company Only | Guarantor Subsidiaries | Non- Guarantor Subsidiaries | Eliminations | Consolidated | ||||||||||||||||
(In thousands) | ||||||||||||||||||||
Revenue: | ||||||||||||||||||||
Gross revenue | $ | — | $ | 73,715 | $ | 401,921 | $ | — | $ | 475,636 | ||||||||||
Intercompany revenue | 311 | 25,187 | — | (25,498 | ) | — | ||||||||||||||
311 | 98,902 | 401,921 | (25,498 | ) | 475,636 | |||||||||||||||
Operating expense: | ||||||||||||||||||||
Direct cost and reimbursable expense | — | 56,888 | 278,616 | — | 335,504 | |||||||||||||||
Intercompany expenses | — | — | 25,498 | (25,498 | ) | — | ||||||||||||||
Depreciation and amortization | 1,420 | 11,886 | 14,899 | — | 28,205 | |||||||||||||||
General and administrative | 19,841 | 7,147 | 34,736 | — | 61,724 | |||||||||||||||
21,261 | 75,921 | 353,749 | (25,498 | ) | 425,433 | |||||||||||||||
Loss on impairment | — | — | (3,362 | ) | — | (3,362 | ) | |||||||||||||
Gain (loss) on disposal of assets | — | 1,200 | (1,073 | ) | — | 127 | ||||||||||||||
Earnings from unconsolidated affiliates, net of losses | 15,992 | — | (2,904 | ) | (15,992 | ) | (2,904 | ) | ||||||||||||
Operating income (loss) | (4,958 | ) | 24,181 | 40,833 | (15,992 | ) | 44,064 | |||||||||||||
Interest expense, net | 28,492 | (960 | ) | (35,104 | ) | — | (7,572 | ) | ||||||||||||
Other income (expense), net | (916 | ) | 169 | (1,934 | ) | — | (2,681 | ) | ||||||||||||
Income before provision for income taxes | 22,618 | 23,390 | 3,795 | (15,992 | ) | 33,811 | ||||||||||||||
Allocation of consolidated income taxes | 3,473 | (994 | ) | (8,465 | ) | — | (5,986 | ) | ||||||||||||
Net income (loss) | 26,091 | 22,396 | (4,670 | ) | (15,992 | ) | 27,825 | |||||||||||||
Net income attributable to noncontrolling interests | (9 | ) | — | (1,734 | ) | — | (1,743 | ) | ||||||||||||
Net income (loss) attributable to Bristow Group | $ | 26,082 | $ | 22,396 | $ | (6,404 | ) | $ | (15,992 | ) | $ | 26,082 | ||||||||
33
BRISTOW GROUP INC. AND SUBSIDIARIES
NOTES TO CONDENSED CONSOLIDATED FINANCIAL STATEMENTS — (Continued)
(Unaudited)
Supplemental Condensed Consolidating Statement of Operations
Six Months Ended September 30, 2014
Parent Company Only | Guarantor Subsidiaries | Non- Guarantor Subsidiaries | Eliminations | Consolidated | ||||||||||||||||
(In thousands) | ||||||||||||||||||||
Revenue: | ||||||||||||||||||||
Gross revenue | $ | — | $ | 149,352 | $ | 798,822 | $ | — | $ | 948,174 | ||||||||||
Intercompany revenue | 864 | 50,013 | — | (50,877 | ) | — | ||||||||||||||
864 | 199,365 | 798,822 | (50,877 | ) | 948,174 | |||||||||||||||
Operating expense: | ||||||||||||||||||||
Direct cost and reimbursable expense | — | 109,953 | 552,022 | — | 661,975 | |||||||||||||||
Intercompany expenses | — | — | 50,877 | (50,877 | ) | — | ||||||||||||||
Depreciation and amortization | 1,278 | 22,101 | 30,160 | — | 53,539 | |||||||||||||||
General and administrative | 38,178 | 17,246 | 66,732 | — | 122,156 | |||||||||||||||
39,456 | 149,300 | 699,791 | (50,877 | ) | 837,670 | |||||||||||||||
Loss on impairment | — | — | (3,362 | ) | — | (3,362 | ) | |||||||||||||
Gain (loss) on disposal of assets | — | 2,538 | (1,801 | ) | — | 737 | ||||||||||||||
Earnings from unconsolidated affiliates, net of losses | 52,984 | — | 1,377 | (52,984 | ) | 1,377 | ||||||||||||||
Operating income | 14,392 | 52,603 | 95,245 | (52,984 | ) | 109,256 | ||||||||||||||
Interest expense, net | 56,010 | (1,966 | ) | (68,743 | ) | — | (14,699 | ) | ||||||||||||
Other income (expense), net | (1,844 | ) | 97 | (2,173 | ) | — | (3,920 | ) | ||||||||||||
Income before provision for income taxes | 68,558 | 50,734 | 24,329 | (52,984 | ) | 90,637 | ||||||||||||||
Allocation of consolidated income taxes | 1,660 | (761 | ) | (18,708 | ) | — | (17,809 | ) | ||||||||||||
Net income | 70,218 | 49,973 | 5,621 | (52,984 | ) | 72,828 | ||||||||||||||
Net income attributable to noncontrolling interests | (27 | ) | — | (2,610 | ) | — | (2,637 | ) | ||||||||||||
Net income attributable to Bristow Group | $ | 70,191 | $ | 49,973 | $ | 3,011 | $ | (52,984 | ) | $ | 70,191 | |||||||||
34
BRISTOW GROUP INC. AND SUBSIDIARIES
NOTES TO CONDENSED CONSOLIDATED FINANCIAL STATEMENTS — (Continued)
(Unaudited)
Supplemental Condensed Consolidating Statement of Comprehensive Income
Three Months Ended September 30, 2015
Parent Company Only | Guarantor Subsidiaries | Non- Guarantor Subsidiaries | Eliminations | Consolidated | ||||||||||||||||
(In thousands) | ||||||||||||||||||||
Net loss | $ | (47,118 | ) | $ | (7,653 | ) | $ | (64,902 | ) | $ | 73,993 | $ | (45,680 | ) | ||||||
Other comprehensive income (loss): | ||||||||||||||||||||
Currency translation adjustments | (44,436 | ) | — | 58,709 | (31,223 | ) | (16,950 | ) | ||||||||||||
Total comprehensive income (loss) | (91,554 | ) | (7,653 | ) | (6,193 | ) | 42,770 | (62,630 | ) | |||||||||||
Net income attributable to noncontrolling interests | (14 | ) | — | (1,438 | ) | — | (1,452 | ) | ||||||||||||
Currency translation adjustments attributable to noncontrolling interests | — | — | (1,535 | ) | — | (1,535 | ) | |||||||||||||
Total comprehensive income attributable to noncontrolling interests | (14 | ) | — | (2,973 | ) | — | (2,987 | ) | ||||||||||||
Total comprehensive loss attributable to Bristow Group | (91,568 | ) | (7,653 | ) | (9,166 | ) | 42,770 | (65,617 | ) | |||||||||||
Accretion of redeemable noncontrolling interests | — | — | 4,803 | — | 4,803 | |||||||||||||||
Total comprehensive loss attributable to common stockholders | $ | (91,568 | ) | $ | (7,653 | ) | $ | (4,363 | ) | $ | 42,770 | $ | (60,814 | ) | ||||||
35
BRISTOW GROUP INC. AND SUBSIDIARIES
NOTES TO CONDENSED CONSOLIDATED FINANCIAL STATEMENTS — (Continued)
(Unaudited)
Supplemental Condensed Consolidating Statement of Comprehensive Income
Six Months Ended September 30, 2015
Parent Company Only | Guarantor Subsidiaries | Non- Guarantor Subsidiaries | Eliminations | Consolidated | ||||||||||||||||
(In thousands) | ||||||||||||||||||||
Net loss | $ | (50,361 | ) | $ | (6,521 | ) | $ | (79,854 | ) | $ | 89,427 | $ | (47,309 | ) | ||||||
Other comprehensive income (loss): | ||||||||||||||||||||
Currency translation adjustments | (6,871 | ) | — | 40,303 | (37,774 | ) | (4,342 | ) | ||||||||||||
Total comprehensive income (loss) | (57,232 | ) | (6,521 | ) | (39,551 | ) | 51,653 | (51,651 | ) | |||||||||||
Net income attributable to noncontrolling interests | (28 | ) | — | (3,052 | ) | — | (3,080 | ) | ||||||||||||
Currency translation adjustments attributable to noncontrolling interests | — | — | 571 | — | 571 | |||||||||||||||
Total comprehensive income attributable to noncontrolling interests | (28 | ) | — | (2,481 | ) | — | (2,509 | ) | ||||||||||||
Total comprehensive loss attributable to Bristow Group | (57,260 | ) | (6,521 | ) | (42,032 | ) | 51,653 | (54,160 | ) | |||||||||||
Accretion of redeemable noncontrolling interests | — | — | (1,498 | ) | — | (1,498 | ) | |||||||||||||
Total comprehensive loss attributable to common stockholders | $ | (57,260 | ) | $ | (6,521 | ) | $ | (43,530 | ) | $ | 51,653 | $ | (55,658 | ) | ||||||
36
BRISTOW GROUP INC. AND SUBSIDIARIES
NOTES TO CONDENSED CONSOLIDATED FINANCIAL STATEMENTS — (Continued)
(Unaudited)
Supplemental Condensed Consolidating Statement of Comprehensive Income
Three Months Ended September 30, 2014
Parent Company Only | Guarantor Subsidiaries | Non- Guarantor Subsidiaries | Eliminations | Consolidated | ||||||||||||||||
(In thousands) | ||||||||||||||||||||
Net income (loss) | $ | 26,091 | $ | 22,396 | $ | (4,670 | ) | $ | (15,992 | ) | $ | 27,825 | ||||||||
Other comprehensive income: | ||||||||||||||||||||
Currency translation adjustments | (4,650 | ) | — | 33,613 | (48,470 | ) | (19,507 | ) | ||||||||||||
Total comprehensive income | 21,441 | 22,396 | 28,943 | (64,462 | ) | 8,318 | ||||||||||||||
Net income attributable to noncontrolling interests | (9 | ) | — | (1,734 | ) | — | (1,743 | ) | ||||||||||||
Currency translation adjustments attributable to noncontrolling interests | — | — | (183 | ) | — | (183 | ) | |||||||||||||
Total comprehensive income attributable to noncontrolling interests | (9 | ) | — | (1,917 | ) | — | (1,926 | ) | ||||||||||||
Total comprehensive income attributable to Bristow Group | $ | 21,432 | $ | 22,396 | $ | 27,026 | $ | (64,462 | ) | $ | 6,392 | |||||||||
37
BRISTOW GROUP INC. AND SUBSIDIARIES
NOTES TO CONDENSED CONSOLIDATED FINANCIAL STATEMENTS — (Continued)
(Unaudited)
Supplemental Condensed Consolidating Statement of Comprehensive Income
Six Months Ended September 30, 2014
Parent Company Only | Guarantor Subsidiaries | Non- Guarantor Subsidiaries | Eliminations | Consolidated | ||||||||||||||||
(In thousands) | ||||||||||||||||||||
Net income | $ | 70,218 | $ | 49,973 | $ | 5,621 | $ | (52,984 | ) | $ | 72,828 | |||||||||
Other comprehensive income: | ||||||||||||||||||||
Currency translation adjustments | (11,686 | ) | — | 13,968 | (12,798 | ) | (10,516 | ) | ||||||||||||
Total comprehensive income | 58,532 | 49,973 | 19,589 | (65,782 | ) | 62,312 | ||||||||||||||
Net income attributable to noncontrolling interests | (27 | ) | — | (2,610 | ) | — | (2,637 | ) | ||||||||||||
Currency translation adjustments attributable to noncontrolling interests | — | — | 34 | — | 34 | |||||||||||||||
Total comprehensive income attributable to noncontrolling interests | (27 | ) | — | (2,576 | ) | — | (2,603 | ) | ||||||||||||
Total comprehensive income attributable to Bristow Group | $ | 58,505 | $ | 49,973 | $ | 17,013 | $ | (65,782 | ) | $ | 59,709 | |||||||||
38
BRISTOW GROUP INC. AND SUBSIDIARIES
NOTES TO CONDENSED CONSOLIDATED FINANCIAL STATEMENTS — (Continued)
(Unaudited)
Supplemental Condensed Consolidating Balance Sheet
As of September 30, 2015
Parent Company Only | Guarantor Subsidiaries | Non- Guarantor Subsidiaries | Eliminations | Consolidated | ||||||||||||||||
(In thousands) | ||||||||||||||||||||
ASSETS | ||||||||||||||||||||
Current assets: | ||||||||||||||||||||
Cash and cash equivalents | $ | 20,080 | $ | 1,153 | $ | 118,108 | $ | — | $ | 139,341 | ||||||||||
Accounts receivable | 408,430 | 490,607 | 371,400 | (1,038,652 | ) | 231,785 | ||||||||||||||
Inventories | 8 | 39,943 | 105,780 | — | 145,731 | |||||||||||||||
Assets held for sale | — | 29,896 | 11,346 | — | 41,242 | |||||||||||||||
Prepaid expenses and other current assets | 4,686 | 5,432 | 65,788 | — | 75,906 | |||||||||||||||
Total current assets | 433,204 | 567,031 | 672,422 | (1,038,652 | ) | 634,005 | ||||||||||||||
Intercompany investment | 1,196,923 | 111,379 | 152,990 | (1,461,292 | ) | — | ||||||||||||||
Investment in unconsolidated affiliates | — | — | 196,350 | — | 196,350 | |||||||||||||||
Intercompany notes receivable | 1,279,069 | 13,786 | — | (1,292,855 | ) | — | ||||||||||||||
Property and equipment—at cost: | ||||||||||||||||||||
Land and buildings | 4,539 | 60,858 | 172,307 | — | 237,704 | |||||||||||||||
Aircraft and equipment | 125,427 | 1,065,799 | 1,253,800 | — | 2,445,026 | |||||||||||||||
129,966 | 1,126,657 | 1,426,107 | — | 2,682,730 | ||||||||||||||||
Less: Accumulated depreciation and amortization | (19,708 | ) | (228,681 | ) | (278,751 | ) | — | (527,140 | ) | |||||||||||
110,258 | 897,976 | 1,147,356 | — | 2,155,590 | ||||||||||||||||
Goodwill | — | 4,756 | 47,648 | — | 52,404 | |||||||||||||||
Other assets | 176,270 | 893 | 90,532 | (104,992 | ) | 162,703 | ||||||||||||||
Total assets | $ | 3,195,724 | $ | 1,595,821 | $ | 2,307,298 | $ | (3,897,791 | ) | $ | 3,201,052 | |||||||||
LIABILITIES, REDEEMABLE NONCONTROLLING INTERESTS AND STOCKHOLDERS’ INVESTMENT | ||||||||||||||||||||
Current liabilities: | ||||||||||||||||||||
Accounts payable | $ | 329,595 | $ | 536,606 | $ | 347,618 | $ | (1,105,141 | ) | $ | 108,678 | |||||||||
Accrued liabilities | 20,210 | 37,915 | 1,230,505 | (1,061,328 | ) | 227,302 | ||||||||||||||
Current deferred taxes | 1,986 | 1,922 | 11,200 | — | 15,108 | |||||||||||||||
Short-term borrowings and current maturities of long-term debt | 21,001 | — | 9,040 | — | 30,041 | |||||||||||||||
Total current liabilities | 372,792 | 576,443 | 1,598,363 | (2,166,469 | ) | 381,129 | ||||||||||||||
Long-term debt, less current maturities | 946,946 | — | 26,393 | — | 973,339 | |||||||||||||||
Intercompany notes payable | — | 116,846 | 154,663 | (271,509 | ) | — | ||||||||||||||
Accrued pension liabilities | — | — | 91,908 | — | 91,908 | |||||||||||||||
Other liabilities and deferred credits | 9,710 | 7,443 | 9,789 | — | 26,942 | |||||||||||||||
Deferred taxes | 139,201 | 5,380 | 5,591 | — | 150,172 | |||||||||||||||
Redeemable noncontrolling interests | — | — | 30,527 | — | 30,527 | |||||||||||||||
Stockholders’ investment: | ||||||||||||||||||||
Common stock | 377 | 4,996 | 22,876 | (27,872 | ) | 377 | ||||||||||||||
Additional paid-in-capital | 788,672 | 9,291 | 284,048 | (293,339 | ) | 788,672 | ||||||||||||||
Retained earnings | 1,208,809 | 875,422 | 49,155 | (924,577 | ) | 1,208,809 | ||||||||||||||
Accumulated other comprehensive income (loss) | (87,475 | ) | — | 27,400 | (214,025 | ) | (274,100 | ) | ||||||||||||
Treasury shares | (184,796 | ) | — | — | — | (184,796 | ) | |||||||||||||
Total Bristow Group stockholders’ investment | 1,725,587 | 889,709 | 383,479 | (1,459,813 | ) | 1,538,962 | ||||||||||||||
Noncontrolling interests | 1,488 | — | 6,585 | — | 8,073 | |||||||||||||||
Total stockholders’ investment | 1,727,075 | 889,709 | 390,064 | (1,459,813 | ) | 1,547,035 | ||||||||||||||
Total liabilities, redeemable noncontrolling interests and stockholders’ investment | $ | 3,195,724 | $ | 1,595,821 | $ | 2,307,298 | $ | (3,897,791 | ) | $ | 3,201,052 | |||||||||
39
BRISTOW GROUP INC. AND SUBSIDIARIES
NOTES TO CONDENSED CONSOLIDATED FINANCIAL STATEMENTS — (Continued)
(Unaudited)
Supplemental Condensed Consolidating Balance Sheet
As of March 31, 2015
Parent Company Only | Guarantor Subsidiaries | Non- Guarantor Subsidiaries | Eliminations | Consolidated | ||||||||||||||||
(In thousands) | ||||||||||||||||||||
ASSETS | ||||||||||||||||||||
Current assets: | ||||||||||||||||||||
Cash and cash equivalents | $ | 126 | $ | 884 | $ | 103,136 | $ | — | $ | 104,146 | ||||||||||
Accounts receivable | 377,158 | 342,239 | 447,776 | (908,555 | ) | 258,618 | ||||||||||||||
Inventories | — | 44,285 | 102,884 | — | 147,169 | |||||||||||||||
Assets held for sale | — | 54,695 | 3,132 | — | 57,827 | |||||||||||||||
Prepaid expenses and other current assets | 4,850 | 7,035 | 58,206 | — | 70,091 | |||||||||||||||
Total current assets | 382,134 | 449,138 | 715,134 | (908,555 | ) | 637,851 | ||||||||||||||
Intercompany investment | 1,410,347 | 111,380 | — | (1,521,727 | ) | — | ||||||||||||||
Investment in unconsolidated affiliates | — | — | 216,376 | — | 216,376 | |||||||||||||||
Intercompany notes receivable | 1,184,335 | — | — | (1,184,335 | ) | — | ||||||||||||||
Property and equipment—at cost: | ||||||||||||||||||||
Land and buildings | 2,830 | 50,946 | 118,183 | — | 171,959 | |||||||||||||||
Aircraft and equipment | 108,457 | 1,114,218 | 1,271,194 | — | 2,493,869 | |||||||||||||||
111,287 | 1,165,164 | 1,389,377 | — | 2,665,828 | ||||||||||||||||
Less: Accumulated depreciation and amortization | (16,431 | ) | (223,245 | ) | (269,051 | ) | — | (508,727 | ) | |||||||||||
94,856 | 941,919 | 1,120,326 | — | 2,157,101 | ||||||||||||||||
Goodwill | — | 4,756 | 70,872 | — | 75,628 | |||||||||||||||
Other assets | 43,423 | 988 | 99,353 | — | 143,764 | |||||||||||||||
Total assets | $ | 3,115,095 | $ | 1,508,181 | $ | 2,222,061 | $ | (3,614,617 | ) | $ | 3,230,720 | |||||||||
LIABILITIES, REDEEMABLE NONCONTROLLING INTERESTS AND STOCKHOLDERS’ INVESTMENT | ||||||||||||||||||||
Current liabilities: | ||||||||||||||||||||
Accounts payable | $ | 203,700 | $ | 369,854 | $ | 289,838 | $ | (779,199 | ) | $ | 84,193 | |||||||||
Accrued liabilities | 31,805 | 37,860 | 206,789 | (18,009 | ) | 258,445 | ||||||||||||||
Current deferred taxes | (3,661 | ) | 2,503 | 18,862 | — | 17,704 | ||||||||||||||
Short-term borrowings and current maturities of long-term debt | 9,088 | — | 9,642 | — | 18,730 | |||||||||||||||
Deferred sale leaseback | — | 55,934 | — | — | 55,934 | |||||||||||||||
Total current liabilities | 240,932 | 466,151 | 525,131 | (797,208 | ) | 435,006 | ||||||||||||||
Long-term debt, less current maturities | 812,536 | — | 33,156 | — | 845,692 | |||||||||||||||
Intercompany notes payable | 100,000 | 131,075 | 1,065,918 | (1,296,993 | ) | — | ||||||||||||||
Accrued pension liabilities | — | — | 99,576 | — | 99,576 | |||||||||||||||
Other liabilities and deferred credits | 17,144 | 8,379 | 21,711 | (7,452 | ) | 39,782 | ||||||||||||||
Deferred taxes | 141,771 | 6,346 | 17,538 | — | 165,655 | |||||||||||||||
Redeemable noncontrolling interests | — | — | 26,223 | — | 26,223 | |||||||||||||||
Stockholders’ investment: | ||||||||||||||||||||
Common stock | 376 | 4,996 | 22,876 | (27,872 | ) | 376 | ||||||||||||||
Additional paid-in-capital | 781,837 | 9,291 | 284,048 | (293,339 | ) | 781,837 | ||||||||||||||
Retained earnings | 1,284,442 | 881,943 | 133,559 | (1,015,502 | ) | 1,284,442 | ||||||||||||||
Accumulated other comprehensive loss | (80,604 | ) | — | (13,474 | ) | (176,251 | ) | (270,329 | ) | |||||||||||
Treasury shares | (184,796 | ) | — | — | — | (184,796 | ) | |||||||||||||
Total Bristow Group stockholders’ investment | 1,801,255 | 896,230 | 427,009 | (1,512,964 | ) | 1,611,530 | ||||||||||||||
Noncontrolling interests | 1,457 | — | 5,799 | — | 7,256 | |||||||||||||||
Total stockholders’ investment | 1,802,712 | 896,230 | 432,808 | (1,512,964 | ) | 1,618,786 | ||||||||||||||
Total liabilities, redeemable noncontrolling interests and stockholders’ investment | $ | 3,115,095 | $ | 1,508,181 | $ | 2,222,061 | $ | (3,614,617 | ) | $ | 3,230,720 | |||||||||
40
BRISTOW GROUP INC. AND SUBSIDIARIES
NOTES TO CONDENSED CONSOLIDATED FINANCIAL STATEMENTS — (Continued)
(Unaudited)
Supplemental Condensed Consolidating Statement of Cash Flows
Six Months Ended September 30, 2015
Parent Company Only | Guarantor Subsidiaries | Non- Guarantor Subsidiaries | Eliminations | Consolidated | ||||||||||||||||
(In thousands) | ||||||||||||||||||||
Net cash provided by (used in) operating activities | $ | (80,805 | ) | $ | 96,181 | $ | 42,884 | $ | — | $ | 58,260 | |||||||||
Cash flows from investing activities: | ||||||||||||||||||||
Capital expenditures | (18,679 | ) | (88,872 | ) | (39,438 | ) | — | (146,989 | ) | |||||||||||
Proceeds from asset dispositions | — | 13,937 | 2,170 | — | 16,107 | |||||||||||||||
Net cash used in investing activities | (18,679 | ) | (74,935 | ) | (37,268 | ) | — | (130,882 | ) | |||||||||||
Cash flows from financing activities: | ||||||||||||||||||||
Proceeds from borrowings | 461,575 | — | 6 | — | 461,581 | |||||||||||||||
Repayment of debt | (316,200 | ) | — | (7,369 | ) | — | (323,569 | ) | ||||||||||||
Dividends paid | (23,746 | ) | — | — | — | (23,746 | ) | |||||||||||||
Increases (decreases) in cash related to intercompany advances and debt | (2,366 | ) | (20,977 | ) | 23,343 | — | — | |||||||||||||
Partial prepayment of put/call obligation | (28 | ) | — | — | — | (28 | ) | |||||||||||||
Acquisition of noncontrolling interest | — | — | (2,000 | ) | — | (2,000 | ) | |||||||||||||
Payment of contingent consideration | — | — | (8,000 | ) | — | (8,000 | ) | |||||||||||||
Tax benefit related to stock-based compensation | 203 | — | — | — | 203 | |||||||||||||||
Net cash provided by (used in) financing activities | 119,438 | (20,977 | ) | 5,980 | — | 104,441 | ||||||||||||||
Effect of exchange rate changes on cash and cash equivalents | — | — | 3,376 | — | 3,376 | |||||||||||||||
Net increase in cash and cash equivalents | 19,954 | 269 | 14,972 | — | 35,195 | |||||||||||||||
Cash and cash equivalents at beginning of period | 126 | 884 | 103,136 | — | 104,146 | |||||||||||||||
Cash and cash equivalents at end of period | $ | 20,080 | $ | 1,153 | $ | 118,108 | $ | — | $ | 139,341 | ||||||||||
41
BRISTOW GROUP INC. AND SUBSIDIARIES
NOTES TO CONDENSED CONSOLIDATED FINANCIAL STATEMENTS — (Continued)
(Unaudited)
Supplemental Condensed Consolidating Statement of Cash Flows
Six Months Ended September 30, 2014
Parent Company Only | Guarantor Subsidiaries | Non- Guarantor Subsidiaries | Eliminations | Consolidated | ||||||||||||||||
(In thousands) | ||||||||||||||||||||
Net cash provided by (used in) operating activities | $ | (45,192 | ) | $ | 115,666 | $ | 30,247 | $ | 446 | $ | 101,167 | |||||||||
Cash flows from investing activities: | ||||||||||||||||||||
Capital expenditures | (25,668 | ) | (141,269 | ) | (135,182 | ) | — | (302,119 | ) | |||||||||||
Proceeds from asset dispositions | — | 208,373 | 189,271 | — | 397,644 | |||||||||||||||
Net cash provided by (used in) investing activities | (25,668 | ) | 67,104 | 54,089 | — | 95,525 | ||||||||||||||
Cash flows from financing activities: | ||||||||||||||||||||
Proceeds from borrowings | 218,000 | — | 1,354 | — | 219,354 | |||||||||||||||
Repayment of debt | (275,502 | ) | — | (7,336 | ) | — | (282,838 | ) | ||||||||||||
Dividends paid | (22,689 | ) | — | — | — | (22,689 | ) | |||||||||||||
Increases (decreases) in cash related to intercompany advances and debt | 241,300 | (169,002 | ) | (72,298 | ) | — | — | |||||||||||||
Partial prepayment of put/call obligation | (30 | ) | — | — | — | (30 | ) | |||||||||||||
Acquisition of noncontrolling interest | — | — | (3,170 | ) | — | (3,170 | ) | |||||||||||||
Repurchase of Common Stock | (43,423 | ) | — | — | — | (43,423 | ) | |||||||||||||
Issuance of Common Stock | 1,398 | — | — | — | 1,398 | |||||||||||||||
Tax benefit related to stock-based compensation | 1,642 | — | — | — | 1,642 | |||||||||||||||
Net cash provided by (used in) financing activities | 120,696 | (169,002 | ) | (81,450 | ) | — | (129,756 | ) | ||||||||||||
Effect of exchange rate changes on cash and cash equivalents | — | — | (7,367 | ) | — | (7,367 | ) | |||||||||||||
Net increase (decrease) in cash and cash equivalents | 49,836 | 13,768 | (4,481 | ) | 446 | 59,569 | ||||||||||||||
Cash and cash equivalents at beginning of period | 4,640 | — | 200,147 | (446 | ) | 204,341 | ||||||||||||||
Cash and cash equivalents at end of period | $ | 54,476 | $ | 13,768 | $ | 195,666 | $ | — | $ | 263,910 | ||||||||||
42
Report of Independent Registered Public Accounting Firm
To the Board of Directors and Stockholders
Bristow Group Inc.:
We have reviewed the accompanying condensed consolidated balance sheets of Bristow Group Inc. and subsidiaries as of September 30, 2015, and the related condensed consolidated statements of operations and comprehensive income for the three and six month periods ended September 30, 2015 and 2014, the condensed consolidated statements of cash flows for the six month periods ended September 30, 2015 and 2014, and the condensed consolidated statement of changes in equity and redeemable noncontrolling interests for the six month period ended September 30, 2015. These condensed consolidated financial statements are the responsibility of the Company’s management.
We conducted our reviews in accordance with the standards of the Public Company Accounting Oversight Board (United States). A review of interim financial information consists principally of applying analytical procedures and making inquiries of persons responsible for financial and accounting matters. It is substantially less in scope than an audit conducted in accordance with the standards of the Public Company Accounting Oversight Board (United States), the objective of which is the expression of an opinion regarding the financial statements taken as a whole. Accordingly, we do not express such an opinion.
Based on our reviews, we are not aware of any material modifications that should be made to the condensed consolidated financial statements referred to above for them to be in conformity with U.S. generally accepted accounting principles.
We have previously audited, in accordance with standards of the Public Company Accounting Oversight Board (United States), the consolidated balance sheet of Bristow Group Inc. and subsidiaries as of March 31, 2015, and the related consolidated statements of income, comprehensive income, cash flows and stockholders’ investment for the year then ended (not presented herein); and in our report dated May 20, 2015 we expressed an unqualified opinion on those consolidated financial statements. In our opinion, the information set forth in the accompanying condensed consolidated balance sheet as of March 31, 2015 is fairly stated, in all material respects, in relation to the consolidated balance sheet from which it has been derived.
/s/ KPMG LLP | ||
Houston, Texas
November 5, 2015
43
Item 2. Management’s Discussion and Analysis of Financial Condition and Results of Operations
Management’s Discussion and Analysis of Financial Condition and Results of Operations, or MD&A, should be read in conjunction with the accompanying unaudited condensed consolidated financial statements and the notes thereto as well as our Annual Report on Form 10-K for the fiscal year ended March 31, 2015 (the “fiscal year 2015 Annual Report”) and the MD&A contained therein. In the discussion that follows, the terms “Current Quarter” and “Comparable Quarter” refer to the three months ended September 30, 2015 and 2014, respectively, and the terms “Current Period” and “Comparable Period” refer to the six months ended September 30, 2015 and 2014, respectively. Our fiscal year ends March 31, and we refer to fiscal years based on the end of such period. Therefore, the fiscal year ending March 31, 2016 is referred to as “fiscal year 2016”.
Forward-Looking Statements
This Quarterly Report contains “forward-looking statements” within the meaning of Section 27A of the Securities Act of 1933 and Section 21E of the Securities Exchange Act of 1934 (the “Exchange Act”). Forward-looking statements are statements about our future business, strategy, operations, capabilities and results; financial projections; plans and objectives of our management; expected actions by us and by third parties, including our clients, competitors, vendors and regulators; and other matters. Some of the forward-looking statements can be identified by the use of words such as “believes”, “belief”, “expects”, “plans”, “anticipates”, “intends”, “projects”, “estimates”, “may”, “might”, “would”, “could” or other similar words; however, all statements in this Quarterly Report, other than statements of historical fact or historical financial results, are forward-looking statements.
Our forward-looking statements reflect our views and assumptions on the date we are filing this Quarterly Report regarding future events and operating performance. We believe that they are reasonable, but they involve known and unknown risks, uncertainties and other factors, many of which may be beyond our control, that may cause actual results to differ materially from any future results, performance or achievements expressed or implied by the forward-looking statements. Accordingly, you should not put undue reliance on any forward-looking statements.
You should consider the following key factors when evaluating these forward-looking statements:
•the possibility of political instability, war or acts of terrorism in any of the countries where we operate;
•fluctuations in worldwide prices of and demand for oil and natural gas;
•fluctuations in levels of oil and natural gas production, exploration and development activities;
•fluctuations in the demand for our services;
•the existence of competitors;
• | the existence of operating risks inherent in our business, including the possibility of declining safety performance; |
•the possibility of changes in tax and other laws and regulations;
•the possibility that the major oil companies do not continue to expand internationally and offshore;
•the possibility of significant changes in foreign exchange rates and controls;
•general economic conditions including the capital and credit markets;
•the possibility that we may impair our goodwill or amortizable intangible assets;
• | the possibility that we may be unable to defer payment on certain aircraft into future fiscal years or take delivery of certain aircraft later than initially scheduled; |
• | the possibility that we may be unable to acquire additional aircraft due to limited availability or unable to exercise aircraft purchase options; |
•the possibility that we may be unable to dispose of older aircraft through sales into the aftermarket;
•the possibility that we or our suppliers will be unable to deliver new aircraft on time or on budget;
•the possibility that we may be unable to obtain financing or we may be unable to draw on our credit facilities;
•the possibility that we may lack sufficient liquidity to continue to repurchase shares or pay a quarterly dividend;
44
•the possibility that segments of our fleet may be grounded for extended periods of time or indefinitely;
•the possibility that we may be unable to re-deploy our aircraft to regions with greater demand;
• | the possibility that reductions in spending on helicopter services by governmental agencies could lead to modifications of search and rescue (“SAR”) contract terms or delays in receiving payments; |
• | the possibility that customers may reject our aircraft due to late delivery or unacceptable aircraft design or operability; and |
• | the possibility that we do not achieve the anticipated benefits from the addition of new-technology aircraft to our fleet. |
The above description of risks and uncertainties is by no means all-inclusive, but is designed to highlight what we believe are important factors to consider. For a more detailed description of risk factors, please see the risks and uncertainties described under Item 1A. “Risk Factors” included in the fiscal year 2015 Annual Report and in the Quarterly Report Form 10-Q for the quarter ended June 30, 2015.
All forward-looking statements in this Quarterly Report are qualified by these cautionary statements and are only made as of the date of this Quarterly Report. We do not undertake any obligation, other than as required by law, to update or revise any forward-looking statements, whether as a result of new information, future events or otherwise.
Executive Overview
This Executive Overview only includes what management considers to be the most important information and analysis for evaluating our financial condition and operating performance. It provides the context for the discussion and analysis of the financial information that follows and does not disclose every item impacting our financial condition and operating performance.
General
We are the leading provider of helicopter services to the worldwide offshore energy industry based on the number of aircraft operated and one of two helicopter service providers to the offshore energy industry with global operations. We have a long history in the helicopter services industry through Bristow Helicopters Ltd. (“Bristow Helicopters”) and Offshore Logistics, Inc., having been founded in 1955 and 1969, respectively. We have major transportation operations in the North Sea, Nigeria and the U.S. Gulf of Mexico, and in most of the other major offshore energy producing regions of the world, including Australia, Brazil, Canada, Russia and Trinidad. We provide private sector SAR services in Australia, Canada, Norway, Russia and Trinidad, and we provide public sector SAR services in the U.K. on behalf of the Maritime & Coastguard Agency. In March 2013, we were awarded a contract to provide public sector SAR services for all of the U.K. We are completing the construction of certain facilities, taking delivery of aircraft and training personnel. This contract commenced at two of the bases in April 2015, one base in July 2015, one base in August 2015, one base in October 2015. Operation will commence at two additional bases over the remainder of fiscal year 2016, one additional base in fiscal year 2018 and the last two bases will transition from our existing Gap SAR contract in fiscal year 2018.
We generated 90% of our consolidated operating revenue from operations outside of the U.S. during the Current Period. Adjusted EBITDAR is calculated by taking our net income and adjusting for interest expense, depreciation and amortization, rent expense (included as components of direct cost and general and administrative expense), benefit (provision) for income taxes, gain (loss) on disposal of assets and any special items during the reported periods.
We conduct our business in one segment: Helicopter Services. The Helicopter Services segment operations are conducted primarily through four regions:
• | Europe Caspian, |
• | Africa, |
• | Americas, and |
• | Asia Pacific. |
We primarily provide helicopter services to a broad base of major integrated, national and independent offshore energy companies. Our clients charter our helicopters primarily to transport personnel between onshore bases and offshore production platforms, drilling rigs and other installations. To a lesser extent, our clients also charter our helicopters to transport time-sensitive equipment to these offshore locations. These clients’ operating expenditures in the production sector are the principal source of
45
our revenue, while their exploration and development capital expenditures provide a lesser portion of our revenue. The clients for SAR services include both the oil and gas industry, where our revenue is primarily dependent on our clients’ operating expenditures, and governmental agencies, where our revenue is dependent on a country’s desire to privatize SAR and enter into long-term contracts. In addition to our primary Helicopter Services operations, we also operate a training unit, Bristow Academy. As of September 30, 2015, we operated 359 aircraft (including 227 owned aircraft and 118 leased aircraft; 14 of the owned aircraft are held for sale) and our unconsolidated affiliates operated 129 aircraft in addition to those aircraft leased from us.
The chart below presents (1) the number of helicopters in our fleet and their distribution among the regions of our Helicopter Services segment as of September 30, 2015; (2) the number of helicopters which we had on order or under option as of September 30, 2015; and (3) the percentage of operating revenue which each of our regions provided during the Current Period. For additional information regarding our commitments and options to acquire aircraft, see Note 5 in the “Notes to Condensed Consolidated Financial Statements” included elsewhere in this Quarterly Report.
Percentage of Current Period Operating Revenue | Aircraft in Consolidated Fleet | ||||||||||||||||||||||||||
Helicopters | Fixed Wing (1) | Unconsolidated Affiliates (4) | |||||||||||||||||||||||||
Small | Medium | Large | Training | Total (2)(3) | Total | ||||||||||||||||||||||
Europe Caspian | 48 | % | — | 14 | 69 | — | 28 | 111 | — | 111 | |||||||||||||||||
Africa | 16 | % | 14 | 28 | 4 | — | 5 | 51 | 45 | 96 | |||||||||||||||||
Americas | 18 | % | 19 | 45 | 17 | — | — | 81 | 84 | 165 | |||||||||||||||||
Asia Pacific | 17 | % | 2 | 9 | 24 | — | 13 | 48 | — | 48 | |||||||||||||||||
Corporate and other | 1 | % | — | — | — | 68 | — | 68 | — | 68 | |||||||||||||||||
Total | 100 | % | 35 | 96 | 114 | 68 | 46 | 359 | 129 | 488 | |||||||||||||||||
Aircraft not currently in fleet: (5) | |||||||||||||||||||||||||||
On order | — | 10 | 31 | — | — | 41 | |||||||||||||||||||||
Under option | — | 8 | 13 | — | — | 21 | |||||||||||||||||||||
(1) | Includes 30 fixed wing aircraft operated by Eastern Airways which are included in the Europe Caspian and Africa regions and 13 fixed wing aircraft operated by Airnorth which are included in the Asia Pacific region. |
(2) | Includes 14 aircraft held for sale and 118 leased aircraft as follows: |
Held for Sale Aircraft in Consolidated Fleet | ||||||||||||||||||
Helicopters | ||||||||||||||||||
Small | Medium | Large | Training | Fixed Wing | Total | |||||||||||||
Europe Caspian | — | 1 | — | — | — | 1 | ||||||||||||
Africa | — | 4 | — | — | 1 | 5 | ||||||||||||
Americas | — | 6 | — | — | — | 6 | ||||||||||||
Asia Pacific | — | — | 2 | — | — | 2 | ||||||||||||
Corporate and other | — | — | — | — | — | — | ||||||||||||
Total | — | 11 | 2 | — | 1 | 14 | ||||||||||||
Leased Aircraft in Consolidated Fleet | ||||||||||||||||||
Helicopters | ||||||||||||||||||
Small | Medium | Large | Training | Fixed Wing | Total | |||||||||||||
Europe Caspian | — | 5 | 38 | — | 11 | 54 | ||||||||||||
Africa | — | 1 | 1 | — | 2 | 4 | ||||||||||||
Americas | 1 | 13 | 5 | — | — | 19 | ||||||||||||
Asia Pacific | 2 | 2 | 8 | — | 4 | 16 | ||||||||||||
Corporate and other | — | — | — | 25 | — | 25 | ||||||||||||
Total | 3 | 21 | 52 | 25 | 17 | 118 | ||||||||||||
(3) | The average age of our fleet, excluding fixed wing and training aircraft, was approximately eight years as of September 30, 2015. |
(4) | The 129 aircraft operated by our unconsolidated affiliates do not include those aircraft leased from us. Includes 58 helicopters (primarily medium) and 26 fixed wing aircraft owned and managed by Líder Táxi Aéreo S.A. (“Líder”), our unconsolidated affiliate in Brazil, which is included in the Americas region. |
(5) | This table does not reflect aircraft which our unconsolidated affiliates may have on order or under option. |
46
The commercial aircraft in our consolidated fleet represented in the above chart are our primary source of revenue. To normalize the consolidated operating revenue of our commercial helicopter fleet for the different revenue productivity and cost, we developed a common weighted factor that combines large, medium and small commercial helicopters into a combined standardized number of revenue producing commercial aircraft assets. We call this measure Large AirCraft Equivalent (“LACE”). Our commercial large, medium and small helicopters, including owned and leased helicopters, are weighted as 100%, 50% and 25%, respectively, to arrive at a single LACE number, which excludes Bristow Academy aircraft, fixed wing aircraft, unconsolidated affiliate aircraft, aircraft held for sale and aircraft construction in progress. We divide our operating revenue from commercial contracts relating to LACE aircraft, which excludes operating revenue from affiliates and reimbursable revenue, by LACE to develop a LACE rate, which is a standardized rate. Our current number of LACE is 163 and our historical LACE and LACE rate is as follows:
Current Period (1) | Fiscal Year Ended March 31, | ||||||||||||||||||||||||
2015 | 2014 | 2013 | 2012 | 2011 | |||||||||||||||||||||
LACE | 163 | 166 | 158 | 158 | 149 | 153 | |||||||||||||||||||
LACE Rate (in millions) | $ | 9.06 | $ | 9.33 | $ | 9.34 | $ | 8.35 | $ | 7.89 | $ | 7.15 | |||||||||||||
______
(1) LACE rate is annualized.
The following table presents the distribution of LACE helicopters owned and leased, and the percentage of LACE leased as of September 30, 2015. The percentage of LACE leased is calculated by taking the total LACE for leased helicopters divided by the total LACE for all commercial helicopters we operate, including both owned and leased.
LACE | |||||||||
Owned Aircraft | Leased Aircraft | Percentage of LACE leased | |||||||
Europe Caspian | 35 | 41 | 54 | % | |||||
Africa | 18 | 2 | 8 | % | |||||
Americas | 30 | 12 | 28 | % | |||||
Asia Pacific | 18 | 10 | 35 | % | |||||
Total | 100 | 63 | 39 | % | |||||
47
Our Strategy
Our goal is to strengthen our position as the leading helicopter services provider to the offshore energy industry and a leading helicopter services provider for civilian SAR and to pursue additional business opportunities that leverage our strengths in these markets. We intend to employ the following well defined business/commercial and capital allocation strategies to achieve this goal:
Business/Commercial Strategy
• | Be the preferred provider of helicopter services. We are positioned in the market to be the preferred provider of helicopter services by maintaining strong relationships with our clients and providing a high level of safety and operating reliably. This differentiation is maintained because of our resolute focus on our cornerstone philosophy of “Target Zero Accidents”, “Target Zero Downtime” and “Target Zero Complaints” allowing us to achieve “Operational Excellence”. Operational Excellence means we maintain close relationships with field operations, corporate management and contacts at our oil and gas clients and governmental agencies which we believe help us better anticipate client needs and provide them with a highly reliable service. We provide our clients operational predictability by positioning the right assets in the right place at the right time repeatedly. This in turn allows us to better manage our fleet utilization and capital investment program and drive internal efficiencies. By better understanding and delivering on our clients’ needs, we effectively compete against other helicopter service providers with better aircraft optionality, client service, and reliability, not just on price and safety. In October 2014, we along with four major helicopter operators formally launched HeliOffshore. HeliOffshore is an industry organization whose goal is to enhance the already strong safety record of the offshore helicopter industry by sharing best practices in automation, performance monitoring, operating procedures, and advanced technology to establish common global flight standards. We believe this will make our sector a sustainably reliable and dependable logistics option for the oil and gas industry. |
• | Grow our business while managing our assets. We plan to continue to grow our business globally and increase our revenue and profitability over time, while managing through cyclical downturns in the energy industry or governmental spending reductions or modifications. We conduct flight operations in most major oil and gas producing regions of the world, and through our strong relationships with our existing clients, we are aware of future business opportunities in the markets we currently serve that would allow us to grow through new contracts. Additionally, new opportunities may result in growth through acquisitions, participation with existing unconsolidated affiliates, investing in new companies, or creating partnerships and alliances with existing industry participants or in new sectors of the air transport industry. We are also actively managing our aircraft fleet with the expressed goal of continually renewing the fleet with newer technology aircraft, while also reducing the number of fleet types we operate. We expect that a reduction in the number of fleet types we operate will allow us to realize operating, maintenance, inventory and supply chain efficiencies across a more standardized global fleet of aircraft. |
• | Sustaining Operational Excellence. We continue to invest in operations transformation across our organization, with the goal of developing and sustaining industry differentiation through Operational Excellence. We define our objective of ongoing improvement across four strategic areas: client alignment, operational excellence, exceptional people and profitable growth. We strive for the highest standards in safety performance, mission execution, people management and financial discipline. We have appointed a number of global account and business development executives to support our drive to deliver Operational Excellence to our clients. We are also working to improve operational performance through our global supply chain and fleet management groups. We are in the process of further standardizing, simplifying and integrating our business processes across our global operations so we can better provide more consistent and high quality service delivery. We have invested in two new technology platforms, eFlight and a new ERP platform, to support flight operations and activities such as finance, supply chain and maintenance. The expected benefits of these efforts in addition to a scalable platform for growth include fewer process steps, decreased cost, better maintenance turnaround, minimization of aircraft downtime, faster billing and collections, reduced inventory levels and lower risk exposure, which should lead to improved margins, asset turnover, cash flow and Bristow Value Added (“BVA”). We expect the technology execution portion of Operational Excellence to not only improve our differentiated position with our clients but also reduce risk and reinforce our objective of profitable growth. We have targeted an average long-term growth rate in adjusted earnings per share of 10-15% over a three to five year period, which is dependent upon our ability to sustain Operational Excellence and deliver on operations transformation through unpredictable market conditions. |
48
Capital Allocation Strategy
Our capital allocation strategy is based on three principles as follows:
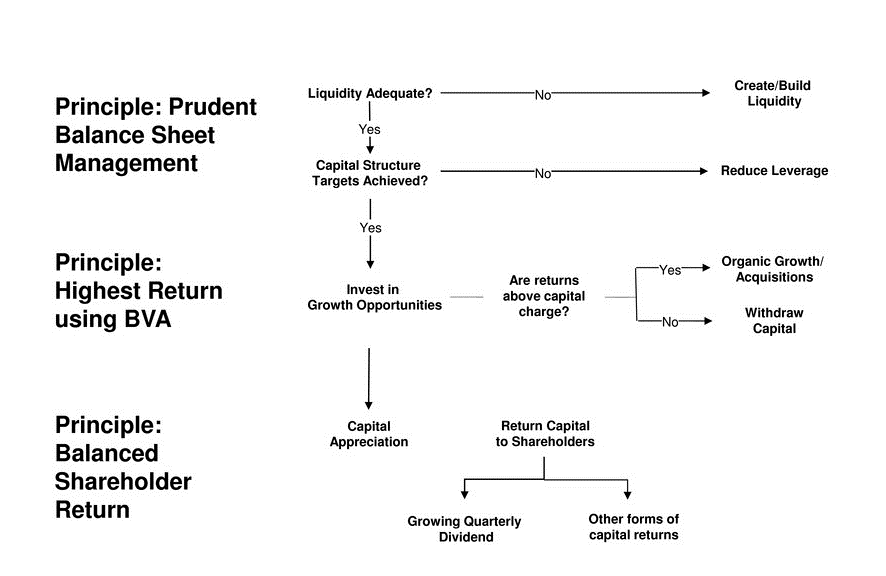
• | Prudent balance sheet management. Throughout our corporate and regional management, we proactively manage our capital allocation plan with a focus on achieving business growth and improving rates of return, within the dictates of prudent balance sheet management. In addition to cash flow generated from operations, we intend to maintain adequate liquidity and manage our capital structure relative to our commitments with external financings when necessary and through the use of operating leases for a target of 35% of our LACE. The target recognizes that we will have variability above or below the target of approximately 5% of our LACE due to timing of leases, purchases, disposals and lease terminations. As of September 30, 2015, aircraft under operating leases accounted for 39% of our LACE. Our adjusted debt to total equity ratio and total liquidity were 111.0% and $315.0 million, respectively, as of September 30, 2015 and 99.7% and $369.9 million, respectively, as of March 31, 2015. As of September 30, 2015 and March 31, 2015, adjusted debt includes balance sheet debt of $1.0 billion and $864.4 million, respectively, the net present value of operating leases totaling $611.1 million and $640.0 million, respectively, letters of credit, bank guarantees and financial guarantees totaling $10.8 million and $10.7 million, respectively, and the unfunded pension liability of $91.9 million and $99.6 million, respectively. On November 5, 2015, we received $200 million in proceeds from a new two-year term loan facility and initially used the proceeds to repay loans outstanding under our $400 million revolving credit facility and related fees and expenses and to finance working capital needs. The additional liquidity is for capital expenditures, working capital needs and general corporate purposes. Additionally, we have been working closely with helicopter manufacturers to defer capital expenditures for certain ordered aircraft into future fiscal years to more closely align the expenditures for those aircraft with the expected timing of revenue and cash flow generated by those assets. Our $200 million financing and capital expenditure deferral efforts, along with sales of idle assets, are intended to provide us with increased liquidity to fulfill our capital needs for new aircraft and infrastructure, including for the U.K. SAR contract, provide additional financial flexibility through the current energy market downturn, and allow us to continue to provide a balanced return to our shareholders as discussed below. |
49
• | Highest return of BVA. Our internal financial management framework, called BVA, focuses on the returns we deliver across our organization. BVA is a financial performance measure that we use to measure gross cash flow less a capital charge, assumed to be 10.5% of the use of gross invested capital employed. Our goal is to achieve strong improvements in BVA over time by (1) improving the cash returns we earn throughout our organization via Operational Excellence initiatives and capital efficiency improvements as well as through better pricing based on the differentiated value we deliver to clients via the Bristow Client Promise program; (2) deploying more capital into commercial opportunities where management believes we can deliver strong returns and when we believe it will benefit us and our shareholders, including making strategic acquisitions or strategic equity investments; and (3) withdrawing capital from areas where returns are deemed inadequate and unable to be sufficiently improved. When appropriate, we may divest parts of the Company. Improvements in BVA are the primary financial measure in our management incentive plan, which is designed to align the interests of management with shareholders and also encourages management actions that increase the long-term value of the Company. |
• | Balanced shareholder return. We continue to proactively manage our liquidity position with cash flows from operations, as well as external financings as discussed above. We believe our current liquidity position will be adequate to finance operating and maintenance expenditures and therefore we continue to match our capital deployment alternatives for the current business environment to deliver a more balanced return to our shareholders. Our board of directors’ has approved a dividend policy with a goal of an annualized quarterly dividend payout ratio of 20-30% of forward adjusted earnings per share; however, actual dividend payments are at the discretion of our board of directors and may not meet or exceed this ratio. On November 5, 2015, our board of directors approved a dividend of $0.34 per common share, our nineteenth consecutive quarterly dividend. Also, our board of directors has authorized expenditures to repurchase shares of common stock, par value $.01 per share (“Common Stock”), since November 2011. As of October 31, 2015, we had repurchased 2,756,419 shares of our Common Stock for a total of $184.8 million since 2011. On November 5, 2015, our board of directors extended the date to repurchase shares of our Common Stock through November 4, 2016 and with a remaining authorized repurchase amount of $150 million. For additional information on our repurchases of Common Stock, see “Share Repurchases” in Note 10 to the financial statements in our fiscal year 2015 Annual Report and Note 8 to the condensed consolidated financial statements included elsewhere in this Quarterly Report. The timing and method of any repurchases under the program will depend on a variety of factors, is subject to our results of operations, financial condition, cash requirements, and other factors and restrictions under applicable law and our debt instruments, and may be suspended or discontinued at any time. |
Market Outlook
Our core business is providing helicopter services to the worldwide oil and gas industry. We also provide public and private sector SAR services and fixed wing services. Our global operations and critical mass of helicopters provide us with geographic and client diversity which helps mitigate risks associated with a single market or client.
The oil and gas business environment experienced a downturn during fiscal year 2015, which has continued into fiscal year 2016. Brent crude oil prices declined from approximately $106 per barrel at July 1, 2014 to $45 per barrel at September 30, 2015, driven by increased global supply and forecasts of reduced demand for crude oil resulting from weaker global economic growth in many regions of the world. The oil price decline has negatively impacted the cash flow of our clients and has resulted in their implementation of measures to reduce operational and capital costs in calendar 2015 compared to 2014 levels, negatively impacting activity during 2015. The current price environment has had an impact on both the offshore production and the offshore exploration activity of our clients, with offshore production activity being impacted to a lesser extent. Although the largest share of our revenue relates to oil and gas production and our largest contract, U.K. SAR, is not directly impacted by declining oil prices, the significant drop in the price of crude oil has resulted in the rescaling, delay or cancellation of planned offshore projects which has negatively impacted our operations and could continue to negatively impact our operations in future periods. We continue to expect this “lower for longer” oil price environment to persist through calendar 2017.
The SAR market is continuing to evolve and we believe further outsourcing of public SAR services to the private sector will continue, although the timing of these opportunities is uncertain. The clients for our SAR services include both the oil and gas industry and governmental agencies. Public SAR service opportunities include previously awarded work involving seven aircraft for the U.K. Gap SAR contract, five aircraft in Ireland, two aircraft in the Dutch Antilles, 18 additional aircraft for the U.K. SAR contract awarded to us and four aircraft for the Falklands. We are also pursuing other public and oil and gas SAR opportunities for multiple aircraft in various jurisdictions around the globe. We are also pursuing other non-SAR government aircraft logistics opportunities.
As discussed above, we continue to seek ways to operate more efficiently and work with our clients to improve the efficiency of their operations within our “Operational Excellence” strategy. We are implementing restructuring measures to lower our costs with approximately 20% of the $150 million of announced cost reductions in fiscal year 2016 having been realized with the
50
remainder underway. We expect improving cash flow generation in fiscal years 2017 and 2018 due to our cost reduction efforts, the U.K. SAR contract being fully operational and a significant decline in capital expenditures relative to the current fiscal year.
Recent Events
Airnorth acquisition — On January 29, 2015, Bristow Helicopters Australia PTY LTD (“Bristow Helicopters Australia”) acquired an 85% interest in Capiteq Limited, operating under the name Airnorth, for cash of A$30.3 million ($24.0 million), with possible earn out consideration of up to A$17 million ($13.0 million) to be paid over four years based on the achievement in part on specified financial performance thresholds and continued employment by the selling shareholders. Airnorth is Northern Australia’s largest regional fixed wing operator based in Darwin, Northern Territory, Australia with both scheduled and charter services which focus primarily on the energy and mining industries in northern and western Australia as well as international service to Dili, Timor-Leste. Airnorth’s fleet consists of thirteen aircraft (nine turboprop and four new technology regional jets) and its customer base includes many energy companies to which Bristow Group already provides helicopter service. We believe this investment will strengthen our ability to provide point to point transportation services for existing Australian based passengers, expand helicopter services in certain areas in Southeast Asian markets and create a more integrated logistics solution for global clients.
The acquisition of Airnorth was accounted for under the purchase method and the results have been consolidated from the date of acquisition in the Asia Pacific region. The purchase price was allocated based on the fair value of assets acquired and liabilities assumed as of the acquisition date.
We expect this acquisition will contribute approximately A$105-A$115 million ($83-$91 million) in operating revenue and A$25-A$30 million ($20-$24 million) of adjusted EBITDAR for fiscal year 2016. Airnorth contributed A$58.1 million ($43.2 million) in operating revenue and A$14.6 million ($10.9 million) of adjusted EBITDAR in the Current Period.
Impact of fleet changes — The management of our global aircraft fleet involves a careful evaluation of the expected demand for helicopter services across global energy markets, including the type of aircraft needed to meet this demand. As offshore oil and gas drilling and production globally moves to deeper water, more medium and large aircraft and newer technology aircraft may be required. As older aircraft models come off of current contracts and are replaced by new aircraft, our management evaluates our future needs for these aircraft models and ultimately the ability to recover our remaining investments in these aircraft through sales into the aftermarket. We depreciate our aircraft over their expected useful life to the expected salvage value to be received for the aircraft at the end of that life. However, depending on the market for aircraft or changes in the expected future use of aircraft within our fleet, we may record gains or losses on aircraft sales, impairment charges for aircraft operating or held for sale, or accelerate or increase depreciation on aircraft used in our operations. In certain instances where a cash return can be made on newer aircraft in excess of the expected return available through the provision of helicopter services, we may sell newer aircraft. The number of aircraft sales and the amount of gains and losses recorded on these sales is unpredictable. While aircraft sales are common in our business and are reflected in our operating results, gains and losses on aircraft sales may result in our operating results not reflecting the ordinary operating performance of our primary business, which is providing aircraft services to our clients. The gains and losses on aircraft sales and any impairment charges are not included in the calculation of adjusted EBITDAR, adjusted earnings per share or gross cash flows for purposes of calculating BVA.
As part of an ongoing process to rationalize and simplify our global fleet of helicopters, during fiscal year 2014 we implemented a plan to reduce the number of aircraft types in our fleet to eight model types in approximately five years and six model types in approximately ten years. During fiscal year 2014, we completed our exit from five model types and in fiscal year 2015 we completed our exit from four model types while adding two model types. As we modernize our fleet, the introduction of new technology aircraft types temporarily slows fleet type reduction.
During fiscal year 2015, we recorded impairment charges totaling $36.1 million related to 27 held for sale aircraft, primarily related to one large aircraft type we are in the process of removing from our fleet. Additionally, as we expected to complete the disposal of the remaining aircraft of this type still operating as of March 31, 2015, we adjusted the salvage value and recorded additional depreciation expense of $6.2 million during fiscal year 2015. During the Current Period, we have seen further deterioration in market sales for aircraft resulting mostly from an increase in idle aircraft and reduced demand across the offshore energy market. While other markets exist for aircraft, including utility, firefighting, government, VIP transportation and tourism, the market for certain model type aircraft has slowed. As a result of these market changes, we recorded impairment charges of $22.0 million related to 11 held for sale aircraft during the Current Period. Additionally, due to changes in estimated salvage values for our fleet of operational aircraft and other changes in the timing of exiting certain aircraft from our operations, we have recorded an additional $19.3 million in depreciation expense during the Current Period.
Goodwill impairment — During the three months ended September 30, 2015, we noted rapid and significant declines in the market value of our stock resulting from the downturn in the oil and gas market driven by reduced crude oil prices. We identified this decline in market value of our stock and an overall reduction in expected operating results resulting from the downturn as
51
indicators that the fair value of our goodwill could have fallen below its carrying amount. As a result, as part of our accounting process for the Current Quarter, we performed a goodwill impairment test as of September 30, 2015 and determined that the goodwill associated with our Bristow Norway reporting unit within our Europe Caspian region and associated with our Bristow Academy reporting unit was impaired. In the Current Quarter, we recognized a loss of $22.3 million associated with the impairment of goodwill.
Selected Regional Perspectives
Brazil continues to represent a significant part of our helicopter growth outlook. The growth expected in the pre-salt deepwater fields in Brazil will necessitate investment in infrastructure and associated services, particularly the addition of more offshore drilling rigs and production platforms which will require additional helicopters for support. Helicopters procured for this market tend to be newer and more sophisticated which is aligned with both our “Operational Excellence” and Líder’s “Decolar” service differentiation programs. Continuing their fleet growth plan, Petrobras released new tenders for multiple medium and large aircraft expected to commence in calendar year 2016. However, subsequent to the tender, certain employees at Petrobras became the subject of ongoing investigations into alleged compliance violations. These investigations, combined with Petrobras’ subsequent public intent to restructure its costs and improve efficiencies have created uncertainty on the status of the above tender and associated bid results. While this represents a contraction in short-term demand, Brazil’s impact on long-term helicopter demand remains substantial. Petrobras represented 60% of Líder’s operating revenue in fiscal year 2015.
Líder also has significant business in the general aviation sector and previously announced that it had secured a position as the exclusive dealer for Bombardier jet aircraft sales in Brazil. Additionally, Líder has recently secured a position as the exclusive dealer for Honda Jet aircraft sales in Brazil which is expected to add to their aircraft sale business.
As expected, Líder’s operations performed better during fiscal years 2014 and 2015 and into fiscal year 2016, as new aircraft began operating; however, currency fluctuations continue to make it difficult to predict the earnings from our Líder investment. These currency fluctuations, which primarily do not impact Líder’s cash flow from operations, had a significant negative impact on Líder’s results in fiscal years 2014 and 2015 and the first half of fiscal year 2016, impacting our earnings from unconsolidated affiliates. Earnings from unconsolidated affiliates, net of losses, on our consolidated statements of operations, is included in calculating adjusted EBITDAR and adjusted net income.
We are subject to competition and the political environment in the countries where we operate. In Nigeria, we have seen an increase in competitive pressure and the application of existing local content regulations that could impact our ability to win future work at levels previously anticipated. In order to properly and fully embrace new regulations, we have made a number of key changes to our operating model in Nigeria, while maintaining safety as our number one priority at all times. The objectives of these changes being (a) enhancing the level of continued compliance by each of Bristow Helicopters Nigeria Ltd. (“BHNL”) and Pan African Airlines Nigeria Ltd. (“PAAN”) with local content regulations, (b) providing technical aviation maintenance services through a wholly-owned Bristow Group entity, BGI Aviation Technical Services Nigeria Limited (“BATS”), and (c) each of BHNL, PAAN and BATS committing to continue to apply and use all key Bristow Group standards and policies, including without limitation our Target Zero safety program, our Code of Business Integrity and our Operations Manuals. As a result of these changes, our ability to continue to consolidate BHNL and PAAN under the current accounting requirements could change.
We conduct business in various foreign countries, and as such, our cash flows and earnings are subject to fluctuations and related risks from changes in foreign currency exchange rates. During the Current Quarter and the Current Period, our primary foreign currency exposure was related to the British pound sterling, the euro, the Australian dollar, the Nigerian naira, the Norwegian kroner and the Brazilian real. For details on this exposure and the related impact on our results of operations, see “Item 3. Quantitative and Qualitative Disclosures about Market Risk” and Note 1 in the “Notes to Condensed Consolidated Financial Statements” included elsewhere in this Quarterly Report.
52
Results of Operations
The following table presents our operating results and other statement of operations information for the applicable periods:
Three Months Ended September 30, | Favorable (Unfavorable) | |||||||||||||||||
2015 | 2014 | |||||||||||||||||
(In thousands, except per share amounts, percentages and flight hours) | ||||||||||||||||||
Gross revenue: | ||||||||||||||||||
Operating revenue | $ | 419,011 | $ | 440,458 | $ | (21,447 | ) | (4.9 | )% | |||||||||
Reimbursable revenue | 27,900 | 35,178 | (7,278 | ) | (20.7 | )% | ||||||||||||
Total gross revenue | 446,911 | 475,636 | (28,725 | ) | (6.0 | )% | ||||||||||||
Operating expense: | ||||||||||||||||||
Direct cost | 307,564 | 302,195 | (5,369 | ) | (1.8 | )% | ||||||||||||
Reimbursable expense | 26,695 | 33,309 | 6,614 | 19.9 | % | |||||||||||||
Depreciation and amortization | 37,387 | 28,205 | (9,182 | ) | (32.6 | )% | ||||||||||||
General and administrative | 53,457 | 61,724 | 8,267 | 13.4 | % | |||||||||||||
Total operating expense | 425,103 | 425,433 | 330 | 0.1 | % | |||||||||||||
Loss on impairment | (22,274 | ) | (3,362 | ) | (18,912 | ) | (562.5 | )% | ||||||||||
Gain (loss) on disposal of assets | (14,007 | ) | 127 | (14,134 | ) | * | ||||||||||||
Earnings from unconsolidated affiliates, net of losses | (15,360 | ) | (2,904 | ) | (12,456 | ) | (428.9 | )% | ||||||||||
Operating income (loss) | (29,833 | ) | 44,064 | (73,897 | ) | (167.7 | )% | |||||||||||
Interest expense, net | (7,179 | ) | (7,572 | ) | 393 | 5.2 | % | |||||||||||
Other income (expense), net | (11,424 | ) | (2,681 | ) | (8,743 | ) | (326.1 | )% | ||||||||||
Income (loss) before benefits (provision) for income taxes | (48,436 | ) | 33,811 | (82,247 | ) | (243.3 | )% | |||||||||||
Benefit (provision) for income taxes | 2,756 | (5,986 | ) | 8,742 | 146.0 | % | ||||||||||||
Net income (loss) | (45,680 | ) | 27,825 | (73,505 | ) | (264.2 | )% | |||||||||||
Net income attributable to noncontrolling interests | (1,452 | ) | (1,743 | ) | 291 | 16.7 | % | |||||||||||
Net income (loss) attributable to Bristow Group | (47,132 | ) | 26,082 | (73,214 | ) | (280.7 | )% | |||||||||||
Accretion of redeemable noncontrolling interests | 4,803 | — | 4,803 | * | ||||||||||||||
Net income (loss) attributable to common stockholders | $ | (42,329 | ) | $ | 26,082 | $ | (68,411 | ) | (262.3 | )% | ||||||||
Diluted earnings (loss) per common share | $ | (1.21 | ) | $ | 0.73 | $ | (1.94 | ) | (265.8 | )% | ||||||||
Operating margin (1) | (7.1 | )% | 10.0 | % | (17.1 | )% | (171.0 | )% | ||||||||||
Flight hours (2) | 50,824 | 52,307 | (1,483 | ) | (2.8 | )% | ||||||||||||
Non-GAAP financial measures: (3) | ||||||||||||||||||
Adjusted operating income | $ | 22,684 | $ | 49,689 | $ | (27,005 | ) | (54.3 | )% | |||||||||
Adjusted operating margin (1) | 5.4 | % | 11.3 | % | (5.9 | )% | (52.2 | )% | ||||||||||
Adjusted EBITDAR | $ | 92,764 | $ | 112,069 | $ | (19,305 | ) | (17.2 | )% | |||||||||
Adjusted EBITDAR margin (1) | 22.1 | % | 25.4 | % | (3.3 | )% | (13.0 | )% | ||||||||||
Adjusted net income | $ | 1,271 | $ | 31,062 | $ | (29,791 | ) | (95.9 | )% | |||||||||
Adjusted diluted earnings per share | $ | 0.04 | $ | 0.87 | $ | (0.83 | ) | (95.4 | )% | |||||||||
53
Six Months Ended September 30, | Favorable (Unfavorable) | |||||||||||||||||
2015 | 2014 | |||||||||||||||||
(In thousands, except per share amounts, percentages and flight hours) | ||||||||||||||||||
Gross revenue: | ||||||||||||||||||
Operating revenue | $ | 859,122 | $ | 877,793 | $ | (18,671 | ) | (2.1 | )% | |||||||||
Reimbursable revenue | 54,785 | 70,381 | (15,596 | ) | (22.2 | )% | ||||||||||||
Total gross revenue | 913,907 | 948,174 | (34,267 | ) | (3.6 | )% | ||||||||||||
Operating expense: | ||||||||||||||||||
Direct cost | 638,243 | 596,058 | (42,185 | ) | (7.1 | )% | ||||||||||||
Reimbursable expense | 52,862 | 65,917 | 13,055 | 19.8 | % | |||||||||||||
Depreciation and amortization | 74,533 | 53,539 | (20,994 | ) | (39.2 | )% | ||||||||||||
General and administrative | 114,789 | 122,156 | 7,367 | 6.0 | % | |||||||||||||
Total operating expense | 880,427 | 837,670 | (42,757 | ) | (5.1 | )% | ||||||||||||
Loss on impairment | (27,713 | ) | (3,362 | ) | (24,351 | ) | (724.3 | )% | ||||||||||
Gain (loss) on disposal of assets | (21,702 | ) | 737 | (22,439 | ) | * | ||||||||||||
Earnings from unconsolidated affiliates, net of losses | (9,064 | ) | 1,377 | (10,441 | ) | (758.2 | )% | |||||||||||
Operating income (loss) | (24,999 | ) | 109,256 | (134,255 | ) | (122.9 | )% | |||||||||||
Interest expense, net | (14,848 | ) | (14,699 | ) | (149 | ) | (1.0 | )% | ||||||||||
Other income (expense), net | (7,585 | ) | (3,920 | ) | (3,665 | ) | (93.5 | )% | ||||||||||
Income (loss) before benefits (provision) for income taxes | (47,432 | ) | 90,637 | (138,069 | ) | (152.3 | )% | |||||||||||
Benefit (provision) for income taxes | 123 | (17,809 | ) | 17,932 | 100.7 | % | ||||||||||||
Net income (loss) | (47,309 | ) | 72,828 | (120,137 | ) | (165.0 | )% | |||||||||||
Net income attributable to noncontrolling interests | (3,080 | ) | (2,637 | ) | (443 | ) | (16.8 | )% | ||||||||||
Net income (loss) attributable to Bristow Group | (50,389 | ) | 70,191 | (120,580 | ) | (171.8 | )% | |||||||||||
Accretion of redeemable noncontrolling interests | (1,498 | ) | — | (1,498 | ) | * | ||||||||||||
Net income (loss) attributable to common stockholders | $ | (51,887 | ) | $ | 70,191 | $ | (122,078 | ) | (173.9 | )% | ||||||||
Diluted earnings per common share | $ | (1.49 | ) | $ | 1.96 | $ | (3.45 | ) | (176.0 | )% | ||||||||
Operating margin (1) | (2.9 | )% | 12.4 | % | (15.3 | )% | (123.4 | )% | ||||||||||
Flight hours (2) | 103,618 | 105,485 | (1,867 | ) | (1.8 | )% | ||||||||||||
Non-GAAP financial measures: (3) | ||||||||||||||||||
Adjusted operating income | $ | 57,357 | $ | 118,993 | $ | (61,636 | ) | (51.8 | )% | |||||||||
Adjusted operating margin (1) | 6.7 | % | 13.6 | % | (6.9 | )% | (50.7 | )% | ||||||||||
Adjusted EBITDAR | $ | 213,811 | $ | 239,692 | $ | (25,881 | ) | (10.8 | )% | |||||||||
Adjusted EBITDAR margin (1) | 24.9 | % | 27.3 | % | (2.4 | )% | (8.8 | )% | ||||||||||
Adjusted net income | $ | 19,876 | $ | 78,431 | $ | (58,555 | ) | (74.7 | )% | |||||||||
Adjusted diluted earnings per share | $ | 0.56 | $ | 2.19 | $ | (1.63 | ) | (74.4 | )% | |||||||||
* percentage change not meaningful
(1) | Operating margin is calculated as operating income divided by operating revenue. Adjusted operating margin is calculated as adjusted operating income divided by operating revenue. Adjusted EBITDAR margin is calculated as adjusted EBITDAR divided by operating revenue. |
(2) | Excludes flight hours from Bristow Academy and unconsolidated affiliates. Includes flight hours from Eastern Airways and Airnorth fixed wing operations in the U.K., Nigeria and Australia totaling 10,842 and 7,214 for the three months ended September 30, 2015 and 2014, respectively, and 21,647 and 14,619 for the six months ended September 30, 2015 and 2014, respectively. |
54
(3) | These financial measures have not been prepared in accordance with generally accepted accounting principles (“GAAP”) and have not been audited or reviewed by our independent registered public accounting firm. These financial measures are therefore considered non-GAAP financial measures. Adjusted EBITDAR is calculated by taking our net income and adjusting for interest expense, depreciation and amortization, rent expense (included as a component of direct cost and general and administrative expense), provision for income taxes, gain (loss) on disposal of assets and any special items during the reported periods. See further discussion of our use of the adjusted EBITDAR metric below. Adjusted operating income, adjusted net income (loss) and adjusted diluted earnings (loss) per share are each adjusted for gain (loss) on disposal of assets and any special items during the reported periods. As discussed below, management believes these non-GAAP financial measures provide meaningful supplemental information regarding our results of operations. A description of the adjustments to and reconciliations of these non-GAAP financial measures to the most comparable GAAP financial measures is as follows: |
Three Months Ended September 30, | Six Months Ended September 30, | |||||||||||||||||
2015 | 2014 | 2015 | 2014 | |||||||||||||||
(In thousands, except per share amounts) | ||||||||||||||||||
Adjusted operating income | $ | 22,684 | $ | 49,689 | $ | 57,357 | $ | 118,993 | ||||||||||
Gain (loss) on disposal of assets | (14,007 | ) | 127 | (21,702 | ) | 737 | ||||||||||||
Special items (i) | (38,510 | ) | (5,752 | ) | (60,654 | ) | (10,474 | ) | ||||||||||
Operating income (loss) | $ | (29,833 | ) | $ | 44,064 | $ | (24,999 | ) | $ | 109,256 | ||||||||
Adjusted EBITDAR | $ | 92,764 | $ | 112,069 | $ | 213,811 | $ | 239,692 | ||||||||||
Gain (loss) on disposal of assets | (14,007 | ) | 127 | (21,702 | ) | 737 | ||||||||||||
Special items (i) | (27,974 | ) | (6,781 | ) | (41,404 | ) | (12,375 | ) | ||||||||||
Depreciation and amortization | (37,387 | ) | (28,205 | ) | (74,533 | ) | (53,539 | ) | ||||||||||
Rent expense | (54,436 | ) | (35,441 | ) | (108,318 | ) | (68,557 | ) | ||||||||||
Interest expense | (7,396 | ) | (7,958 | ) | (15,286 | ) | (15,321 | ) | ||||||||||
Provision for income taxes | 2,756 | (5,986 | ) | 123 | (17,809 | ) | ||||||||||||
Net income (loss) | $ | (45,680 | ) | $ | 27,825 | $ | (47,309 | ) | $ | 72,828 | ||||||||
Adjusted net income | $ | 1,271 | $ | 31,062 | $ | 19,876 | $ | 78,431 | ||||||||||
Gain (loss) on disposal of assets (ii) | (10,786 | ) | 109 | (16,711 | ) | 592 | ||||||||||||
Special items (i) (ii) | (37,617 | ) | (5,089 | ) | (53,554 | ) | (8,832 | ) | ||||||||||
Net income (loss) attributable to Bristow Group | $ | (47,132 | ) | $ | 26,082 | $ | (50,389 | ) | $ | 70,191 | ||||||||
Adjusted diluted earnings per share (iii) | $ | 0.04 | $ | 0.87 | $ | 0.56 | $ | 2.19 | ||||||||||
Gain (loss) on disposal of assets (ii) | (0.31 | ) | — | (0.47 | ) | 0.02 | ||||||||||||
Special items (i) (ii) | (0.93 | ) | (0.14 | ) | (1.56 | ) | (0.25 | ) | ||||||||||
Diluted earnings (loss) per share | (1.21 | ) | 0.73 | (1.49 | ) | 1.96 | ||||||||||||
____________
(i) | See information about special items during the Current Quarter and Comparable Quarter under “Current Quarter Compared to Comparable Quarter” and Current Period and Comparable Period under “Current Period Compared to Comparable Period” below. |
(ii) | These amounts are presented after applying the appropriate tax effect to each item and dividing by the weighted average shares outstanding during the related period to calculate the earnings per share impact. |
(iii) | Adjusted diluted earnings per share is calculated using the diluted weighted average number of common shares outstanding of 35,198,043 and 35,278,144 for the Current Quarter and Current Period, respectively. |
Management believes that adjusted operating income, adjusted EBITDAR, adjusted net income (loss) and adjusted diluted earnings (loss) per share (collectively, the “Non-GAAP measures”) provide relevant and useful information, which is widely used by analysts, investors and competitors in our industry as well as by our management in assessing both consolidated and regional performance.
Adjusted operating income provides us with an understanding of the results from the primary operations of our business by excluding asset disposition effects and special items that do not reflect the ordinary earnings of our operations. We believe that this measure is a useful supplemental measure because operating income includes asset disposition effects and special items, and inclusion of these items does not reflect the ongoing operational earnings of our business.
55
Adjusted EBITDAR provides us with an understanding of one aspect of earnings before the impact of investing and financing transactions and income taxes. Additionally, we believe that adjusted EBITDAR provides us with a useful supplemental measure of our operational performance by excluding the financing decisions we make regarding aircraft purchases or leasing. Adjusted EBITDAR should not be considered a measure of discretionary cash available to us for investing in the growth of our business.
Adjusted net income and adjusted diluted earnings per share present our consolidated results excluding asset dispositions and special items that do not reflect the ordinary earnings of our operations. We believe that these measures are useful supplemental measures because net income and diluted earnings per share include asset disposition effects and special items, and inclusion of these items does not reflect the ongoing operational earnings of our business.
The Non-GAAP measures are not calculated or presented in accordance with GAAP and other companies in our industry may calculate these measures differently than we do. As a result, these financial measures have limitations as analytical and comparative tools and you should not consider these measures in isolation, or as a substitute for analysis of our results as reported under GAAP. In calculating these financial measures, we make certain adjustments that are based on assumptions and estimates that may prove to be inaccurate. In addition, in evaluating these financial measures, you should be aware that in the future we may incur expenses similar to those eliminated in this presentation. Our presentation of the Non-GAAP measures should not be construed as an inference that our future results will be unaffected by unusual or special items.
Some of the additional limitations of adjusted EBITDAR are:
• | Adjusted EBITDAR does not reflect our current or future cash requirements for capital expenditures; |
• | Adjusted EBITDAR does not reflect changes in, or cash requirements for, our working capital needs; |
• | Adjusted EBITDAR does not reflect the significant interest expense or the cash requirements necessary to service interest or principal payments on our debts; |
• | Adjusted EBITDAR does not reflect the significant rent expense or the cash requirements necessary to make lease payments on our operating leases; and |
• | Although depreciation and amortization are non-cash charges, the assets being depreciated and amortized will often have to be replaced in the future, and adjusted EBITDAR does not reflect any cash requirements for such replacements. |
The following tables present region adjusted EBITDAR and adjusted EBITDAR margin discussed in “Region Operating Results,” and consolidated adjusted EBITDAR and adjusted EBITDAR margin for the three and six months ended September 30, 2015 and 2014:
Three Months Ended September 30, | Six Months Ended September 30, | ||||||||||||||||||||
2015 | 2014 | 2015 | 2014 | ||||||||||||||||||
(In thousands, except percentages) | |||||||||||||||||||||
Europe Caspian | $ | 67,373 | $ | 70,707 | $ | 132,559 | $ | 141,250 | |||||||||||||
Africa | 19,901 | 26,023 | 42,715 | 47,895 | |||||||||||||||||
Americas | 7,295 | 27,799 | 40,737 | 67,880 | |||||||||||||||||
Asia Pacific | 16,323 | 12,508 | 33,395 | 25,328 | |||||||||||||||||
Corporate and other | (18,128 | ) | (24,968 | ) | (35,595 | ) | (42,661 | ) | |||||||||||||
Consolidated adjusted EBITDAR | $ | 92,764 | $ | 112,069 | $ | 213,811 | $ | 239,692 | |||||||||||||
Europe Caspian | 32.5 | % | 33.5 | % | 32.3 | % | 33.8 | % | |||||||||||||
Africa | 31.3 | % | 30.7 | % | 30.3 | % | 28.3 | % | |||||||||||||
Americas | 10.0 | % | 31.6 | % | 26.6 | % | 38.2 | % | |||||||||||||
Asia Pacific | 22.7 | % | 22.7 | % | 22.8 | % | 23.1 | % | |||||||||||||
Consolidated adjusted EBITDAR margin | 22.1 | % | 25.4 | % | 24.9 | % | 27.3 | % | |||||||||||||
56
Current Quarter Compared to Comparable Quarter
For the Current Quarter, we reported an operating loss of $29.8 million, net loss of $47.1 million and diluted loss per share of $1.21 compared to operating income of $44.1 million, net income of $26.1 million and diluted earnings per share of $0.73 for the Comparable Quarter. Our results for the Current Quarter were significantly impacted by changes in foreign currency exchange rates during the Current Quarter, which lowered net income and diluted earnings per share by $21.8 million and $0.62, respectively. Our results for the Comparable Quarter were also significantly impacted by changes in foreign currency exchange rates during the Comparable Quarter which lowered net income and diluted earnings per share by $9.5 million and $0.27, respectively. These impacts were primarily reflected in a $19.9 million and an $8.7 million pre-tax reduction in our earnings from unconsolidated affiliates, net of losses, as results from of our unconsolidated affiliate in Brazil, Líder, were impacted by a 23.3% and 9.3% devaluation in the Brazilian real versus the U.S. dollar for the Current Quarter and Comparable Quarter, respectively. Our results for the Current Quarter were also impacted by a $1.0 million, or $0.03 per share, non-cash adjustment related to the valuation of deferred tax assets.
In addition to the foreign currency losses and tax charges, our results for the Current Quarter were also significantly impacted by the following items:
• | Severance expense of $5.7 million related to separation programs across our global organization designed to increase efficiency and cut cost, |
• | A loss on disposal of assets of $14.0 million (primarily consisting of impairment charges on aircraft of $12.2 million) and accelerated depreciation expense of $10.5 million related to a softening aircraft sales aftermarket and changes in the planned timing of exits from aircraft model types in our fleet, and |
• | An impairment of goodwill of $22.3 million (included in loss on impairment) related to our Bristow Norway reporting unit within our Europe Caspian region ($12.1 million) and Bristow Academy reporting unit within Corporate and other ($10.2 million). |
Additionally, diluted loss per share benefited from adjustments in the accretion amount of redeemable noncontrolling interests in Eastern Airways and Airnorth.
Excluding these items, adjusted operating income, adjusted net income and adjusted diluted earnings per share were $22.7 million, $1.3 million and $0.04, respectively, for the Current Quarter. These adjusted results compare to adjusted operating income, adjusted net income and adjusted diluted earnings per share of $49.7 million, $31.1 million and $0.87, respectively, for the Comparable Quarter.
Adjusted net income and adjusted diluted earnings per share declined from the Comparable Quarter primarily as a result of the foreign currency losses and tax charges discussed above. Additionally, our financial results were significantly impacted by a decline in oil and gas activity, especially in our North Sea operations within our Europe Caspian region, while our Asia Pacific, Africa and Americas regions were impacted to a lesser degree, and by a $19.0 million increase in rent expense primarily related to an increase in the number of aircraft leased compared to the Comparable Quarter, including those for the U.K. SAR contract.
The decline in our results was partially offset by the positive impact from the addition of Airnorth in Australia, the startup of new contracts across all regions, including the U.K. SAR contract in our Europe Caspian region, and cost management efforts across our global organization.
We expect results over the remainder of fiscal year 2016 to continue to be impacted by the industry conditions affecting our clients. However, we also expect operating results to improve as the benefits of our diversification strategy into SAR and fixed wing logistics, and cost reduction initiatives take full effect. We cannot predict what impact any further changes in foreign currency exchange rates could have on our results over the remainder of fiscal year 2016.
Adjusted EBITDAR, which is adjusted for the same items discussed above and excludes the impact of changes in rent expense and tax charges, was $92.8 million in the Current Quarter compared to $112.1 million in the Comparable Quarter. Adjusted EBITDAR decreased primarily as a result of the impact of changes in foreign currency exchange rates, which also decreased adjusted EBITDAR margin to 22.1% in the Current Quarter from 25.4% in the Comparable Quarter. Excluding the foreign currency impact in the Current Quarter and the Comparable Quarter, adjusted EBITDAR would have been $122.7 million and $123.7 million, respectively, and adjusted EBITDAR margin would have been 28.9% and 27.7%, respectively. This improvement year-over-year was driven by the start-up of the U.K. SAR contract in April 2015, the addition of Airnorth, and cost management activities across the organization, despite a decline in activity and revenue from our oil and gas clients.
Gross revenue decreased 6.0%, or $28.7 million, to $446.9 million for the Current Quarter from $475.6 million for the Comparable Quarter. Changes in foreign currency exchange rates resulted in a $34.2 million decrease in gross revenue year-over-
57
year. This decrease was more than offset by positive contribution from the acquisition of Airnorth in our Asia Pacific region in January 2015, contributing $21.6 million of operating revenue in the Current Quarter, and the addition of the U.K. SAR contract and a new oil and gas contract in our Europe Caspian region, contributing $26.0 million and $13.5 million, respectively, in operating revenue in the Current Quarter. Excluding these new contributors to revenue, the overall oil and gas activity associated with the market downturn declined and drove our overall flight hours down globally.
Direct costs increased 1.8%, or $5.4 million, to $307.6 million for the Current Quarter from $302.2 million for the Comparable Quarter primarily due to an $18.8 million increase in rent expense related to additional leased aircraft, which was mostly offset by an $11.6 million decrease in maintenance expense primarily due to a high level of maintenance activity in the Comparable Quarter, lower activity and decrease in insurance incidents, partially offset by additional maintenance expense due to the acquisition of Airnorth.
Reimbursable expense decreased 19.9%, or $6.6 million, to $26.7 million in the Current Quarter from $33.3 million in the Comparable Quarter primarily due a decline in activity and a contract amendment in our Europe Caspian region.
Depreciation and amortization increased 32.6% or $9.2 million, to $37.4 million for the Current Quarter from $28.2 million for the Comparable Quarter. This increase in depreciation and amortization expense is primarily due to additional depreciation of $10.5 million as a result of fleet changes for older aircraft.
General and administrative expense decreased 13.4%, or $8.3 million, to $53.5 million for the Current Quarter from $61.7 million for the Comparable Quarter primarily due to a decrease in compensation expense of $8.2 million driven by a decline in stock price during the Current Quarter resulting in a reduction in the accrual for the performance cash plan and management’s decision to not award short-term bonuses for fiscal year 2016.
Loss on impairment for the Current Quarter includes $22.3 million of goodwill impairment related to our Bristow Norway reporting unit within our Europe Caspian region ($12.1 million) and Bristow Academy reporting unit within our Corporate and other region ($10.2 million). For further details, see “Executive Overview – Market Outlook – Recent Events – Goodwill Impairment.” Loss on impairment for the Comparable Quarter includes $3.4 million of inventory impairments.
Gain (loss) on disposal of assets decreased $14.1 million, to a loss of $14.0 million for the Current Quarter from a gain of $0.1 million for the Comparable Quarter. The loss on disposal of assets in the Current Quarter included impairment charges totaling $12.2 million related to ten held for sale aircraft and a loss of $1.8 million from the sale or disposal of other equipment. During the Comparable Quarter, the gain on disposal of assets included a gain of $0.7 million from the sale of seven aircraft and other equipment partially offset by impairment charges totaling $0.6 million related to two held for sale aircraft.
Earnings from unconsolidated affiliates, net of losses, decreased $12.5 million to a loss of $15.4 million for the Current Quarter from a loss of $2.9 million in the Comparable Quarter. The increase in the loss from earnings from unconsolidated affiliates, net of losses, primarily resulted from an $11.9 million increase in losses from Líder as a result of unfavorable foreign currency rate changes as discussed above.
Interest expense, net, decreased 5.2%, or $0.4 million, to $7.2 million in the Current Quarter from $7.6 million in the Comparable Quarter primarily due to lower interest expense and amortization of debt discount partially offset by less capitalized interest resulting from a decrease in construction in progress in the Current Quarter. Additionally, we wrote-off $0.3 million of unamortized deferred financing fees related to the 6 ¼% Senior Notes, which was included in interest expense on our condensed consolidated statements of operations in the Comparable Quarter.
Other income (expense), net decreased $8.7 million to a loss of $11.4 million in the Current Quarter from a loss of $2.7 million in the Comparable Quarter primarily due to unfavorable changes in foreign currency exchange rates. During the Comparable Quarter, we incurred $1.0 million in premium and fees for the repurchase of a portion of our 6 ¼% Senior Notes, which is included in other income (expense), net on our condensed consolidated statements of operations.
58
The impact of the severance costs, goodwill impairment and additional depreciation expense related to fleet changes and the adjustments to accretion for redeemable noncontrolling interests discussed above have been identified as special items for the Current Quarter. In the Comparable Quarter, the impact of the costs associated with the North America restructuring, CEO succession costs, the inventory allowances and the repurchase of a portion of our 6¼% Senior Notes (the repurchase premium and write-off of deferred financing fees) were identified as special items. These items in the Current Quarter and Comparable Quarter have been identified as special items as they are not considered by management to be part of our ongoing operations when assessing and measuring the operational and financial performance of the organization. The impact of these items on our adjusted operating income, adjusted EBITDAR, adjusted net income and adjusted diluted earnings per share is as follows:
Three Months Ended September 30, 2015 | |||||||||||||||
Adjusted Operating Income | Adjusted EBITDAR | Adjusted Net Loss | Adjusted Diluted Loss Per Share | ||||||||||||
(In thousands, except per share amounts) | |||||||||||||||
Severance costs | $ | (5,700 | ) | $ | (5,700 | ) | $ | (4,167 | ) | $ | (0.12 | ) | |||
Additional depreciation expense resulting from fleet changes | (10,536 | ) | — | (7,885 | ) | (0.22 | ) | ||||||||
Goodwill impairment | (22,274 | ) | (22,274 | ) | (25,565 | ) | (0.73 | ) | |||||||
Accretion of redeemable noncontrolling interests | — | — | — | 0.14 | |||||||||||
Total special items | $ | (38,510 | ) | $ | (27,974 | ) | $ | (37,617 | ) | (0.93 | ) | ||||
Three Months Ended September 30, 2014 | |||||||||||||||
Adjusted Operating Income | Adjusted EBITDAR | Adjusted Net Income | Adjusted Diluted Earnings Per Share | ||||||||||||
(In thousands, except per share amounts) | |||||||||||||||
North America restructuring | $ | (578 | ) | $ | (578 | ) | $ | (376 | ) | $ | (0.01 | ) | |||
CEO succession | (1,812 | ) | (1,812 | ) | (1,178 | ) | (0.03 | ) | |||||||
Impairment of inventories | (3,362 | ) | (3,362 | ) | (2,689 | ) | (0.08 | ) | |||||||
Repurchase of 6 ¼% Senior Notes | — | (1,029 | ) | (846 | ) | (0.02 | ) | ||||||||
Total special items | $ | (5,752 | ) | $ | (6,781 | ) | $ | (5,089 | ) | (0.14 | ) | ||||
Current Period Compared to Comparable Period
For the Current Period, we reported operating loss of $25.0 million, net loss of $50.4 million and diluted loss per share of $1.49 compared to operating income of $109.3 million, net income of $70.2 million and diluted earnings per share of $1.96 for the Comparable Period. Similar to the Current Quarter, our results for the Current Period were significantly impacted by changes in foreign currency exchange rates, which lowered net income and diluted earnings per share by $20.6 million and $0.59, respectively. Our results for the Comparable Period were also significantly impacted by changes in foreign currency exchange rates during the Comparable Period, which lowered net income and diluted earnings per share by $8.9 million and $0.25, respectively. These impacts were primarily reflected in an $18.2 million and an $8.3 million pre-tax reduction in our earnings from unconsolidated affiliates, net of losses, as results related to Líder were impacted by a 20.7% and 7.1% devaluation in the Brazilian real versus the U.S. dollar for the Current Period and Comparable Period, respectively. Our results for the Current Period were also impacted by a $3.0 million, or $0.09 per share, non-cash adjustment related to the valuation of deferred tax assets.
In addition to the foreign currency losses and tax charges, our results for the Current Period were also significantly impacted by the following items:
• | Severance expense of $13.7 million related to separation programs across our global organization designed to increase efficiency and cut cost, |
• | A loss on disposal of assets of $21.7 million (primarily consisting of impairment charges on aircraft of $22.0 million) and accelerated depreciation expense related to a softening aircraft sales aftermarket and changes in the planned timing of exits from aircraft model types in our fleet of $19.3 million and $5.4 million of impairment charges on inventory, and |
• | An impairment of goodwill of $22.3 million (included in loss on impairment) related to our Bristow Norway reporting unit within our Europe Caspian region ($12.1 million) and Bristow Academy reporting unit within Corporate and other ($10.2 million). |
59
Additionally, diluted loss per share was further decreased by adjustments in the accretion amount of redeemable noncontrolling interests in Eastern Airways and Airnorth.
Excluding these items, adjusted operating income, adjusted net income and adjusted diluted earnings per share were $57.4 million, $19.9 million and $0.56, respectively, for the Current Period. The adjusted results compare to adjusted operating income, adjusted net income and adjusted diluted earnings per share of $119.0 million, $78.4 million and $2.19, respectively, for the Comparable Period.
In addition to foreign currency losses and tax charges discussed above, our results for the Current Period were impacted by a decline in oil and gas activity, especially in the North Sea operations within our Europe Caspian region, and a $39.8 million increase in rent expense primarily related to an increase in the number of aircraft leased compared to the Comparable Period, including those for the U.K. SAR contract. The Comparable Period also benefited from the recovery of $12.6 million from our original equipment manufacturers provided in the form of maintenance credits, compared with $4.5 million in similar credits in the Current Period.
The decline in our results was partially offset by the positive impact from the addition of Airnorth in Australia, the startup of new contracts across all regions, including the U.K. SAR contract in our Europe Caspian region and cost management efforts across our global organization.
Adjusted EBITDAR, which is adjusted for the same items discussed above and excludes the impact of changes in rent expense and tax charges, was $213.8 million in the Current Period compared to $239.7 million in the Comparable Period. Adjusted EBITDAR decreased primarily as a result of the impact of changes in foreign currency exchange rates, which also decreased adjusted EBITDAR margin to 24.9% in the Current Period from 27.3% in the Comparable Period. Excluding the foreign currency impact in the Current Period and the Comparable Period, adjusted EBITDAR would have been $242.1 million and $250.7 million, respectively, and adjusted EBITDAR margin would have been 28.3% and 28.5%, respectively. This decrease in adjusted EBITDAR reflects the decline in oil and gas activity and revenue, partially offset by the start-up of U.K. SAR, the addition of Airnorth, and cost management efforts (mostly concentrated in the Current Quarter).
Gross revenue decreased 3.6%, or $34.3 million, to $913.9 million for the Current Period from $948.2 million for the Comparable Period. Changes in foreign currency exchange rates resulted in a $69.9 million decrease in gross revenue year-over-year. This decrease was more than offset by positive contribution from the acquisition of Airnorth in our Asia Pacific region in January 2015, contributing $43.2 million of operating revenue in the Current Period, and the addition of the U.K. SAR contract and a new oil and gas contract in our Europe Caspian region, contributing $41.5 million and $28.1 million, respectively, in operating revenue in the Current Period. Excluding these new contributors to revenue, the overall oil and gas activity associated with the market downturn declined and drove our overall flight hours down globally.
Direct costs increased 7.1%, or $42.2 million, to $638.2 million for the Current Period from $596.1 million for the Comparable Period primarily due to a $39.0 million increase in rent expense primarily related to additional leased aircraft.
Reimbursable expense declined 19.8%, or $13.1 million, to $52.9 million in the Current Period from $65.9 million in the Comparable Period primarily due a decline in activity and a contract amendment in our Europe Caspian region.
Depreciation and amortization increased 39.2%, or $21.0 million, to $74.5 million for the Current Period from $53.5 million for the Comparable Period. This increase in depreciation and amortization expense is primarily due to additional depreciation of $19.3 million as a result of fleet changes for older aircraft.
General and administrative expense decreased 6.0%, or $7.4 million, to $114.8 million for the Current Period from $122.2 million for the Comparable Period primarily due to a decrease in compensation expense driven by a decline in stock price during the Current Period resulting in a reduction in the accrual for the performance cash plan and management’s decision to not award short-term bonuses for fiscal year 2016. Additionally, during the Comparable Period we recorded $5.5 million in expense related to CEO succession.
Loss on impairment for the Current Period includes $22.3 million of goodwill impairment related to our Bristow Norway reporting unit within our Europe Caspian region ($12.1 million) and Bristow Academy reporting unit within our Corporate and other region ($10.2 million) and $5.4 million of inventory impairments. For further details, see “Executive Overview – Market Outlook – Recent Events – Goodwill Impairment.” Loss on impairment for the Comparable Period includes $3.4 million of inventory impairments.
60
Gain (loss) on disposal of assets decreased $22.4 million to a loss of $21.7 million for the Current Period from a gain of $0.7 million for the Comparable Period. The loss on disposal of assets in the Current Period included impairment charges totaling $22.0 million related to 11 held for sale aircraft partially offset by a gain of $0.3 million from the sale of aircraft and other equipment. During the Comparable Period, the gain on disposal of assets included a gain of $3.9 million from the sale of 11 aircraft and other equipment and impairment charges totaling $3.1 million related to six held for sale aircraft.
Earnings from unconsolidated affiliates, net of losses, decreased $10.4 million to a loss of $9.1 million for the Current Period from earnings of $1.4 million in the Comparable Period. The decrease in earnings from unconsolidated affiliates, net of losses, primarily resulted from a decline from our investment in Líder in Brazil to $8.7 million of losses in the Current Period from $1.1 million in earnings in the Comparable Period. Our earnings from Líder in the Current Period and Comparable Period were reduced by the unfavorable impact of foreign currency exchange rates changes of $18.2 million and $8.3 million, respectively.
Interest expense, net, increased 1.0%, or $0.1 million, to $14.8 million in the Current Period from $14.7 million in the Comparable Period primarily due a decrease in capitalized interest resulting from a decrease in construction in progress. Additionally, we wrote-off $0.4 million of unamortized deferred financing fees related to the 6 ¼% Senior Notes, which was included in interest expense on our condensed consolidated statements of operations in the Comparable Period.
Other income (expense), net decreased $3.7 million to a loss of $7.6 million in the Current Period from a loss of $3.9 million in the Comparable Period primarily due to unfavorable changes in foreign currency exchange rates. During the Comparable Period, we incurred $1.9 million in premium and fees for the repurchase of a portion of our 6 ¼% Senior Notes, which is included in other income (expense), net on our condensed consolidated statements of operations.
The impact of the severance costs, additional depreciation expense related to fleet changes, impairment of inventories, impairment of goodwill and the adjustments to accretion of redeemable noncontrolling interests have been identified as special items for the Current Period. In the Comparable Period, the impact of the costs associated with the North America restructuring, CEO succession costs, the inventory allowances and the repurchase of a portion of our 6¼% Senior Notes (the repurchase premium and write-off of deferred financing fees) were identified as special items. These items in the Current Period and Comparable Period have been identified as special items as they are not considered by management to be part of our ongoing operations when assessing and measuring the operational and financial performance of the organization. The impact of these items on our adjusted operating income, adjusted EBITDAR, adjusted net income and adjusted diluted earnings per share is as follows:
Six Months Ended September 30, 2015 | |||||||||||||||
Adjusted Operating Income | Adjusted EBITDAR | Adjusted Net Income | Adjusted Diluted Earnings Per Share | ||||||||||||
(In thousands, except per share amounts) | |||||||||||||||
Severance costs | $ | (13,691 | ) | $ | (13,691 | ) | $ | (10,904 | ) | $ | (0.31 | ) | |||
Additional depreciation expense resulting from fleet changes | (19,250 | ) | — | (13,321 | ) | (0.38 | ) | ||||||||
Impairment of inventories | (5,439 | ) | (5,439 | ) | (3,764 | ) | (0.11 | ) | |||||||
Goodwill impairment | (22,274 | ) | (22,274 | ) | (25,565 | ) | (0.72 | ) | |||||||
Accretion of redeemable noncontrolling interests | — | — | — | (0.04 | ) | ||||||||||
Total special items | $ | (60,654 | ) | $ | (41,404 | ) | $ | (53,554 | ) | (1.56 | ) | ||||
Six Months Ended September 30, 2014 | |||||||||||||||
Adjusted Operating Income | Adjusted EBITDAR | Adjusted Net Income | Adjusted Diluted Earnings Per Share | ||||||||||||
(In thousands, except per share amounts) | |||||||||||||||
North America restructuring | $ | (1,611 | ) | $ | (1,611 | ) | $ | (1,047 | ) | $ | (0.03 | ) | |||
CEO succession | (5,501 | ) | (5,501 | ) | (3,576 | ) | (0.10 | ) | |||||||
Impairment of inventories | (3,362 | ) | (3,362 | ) | (2,689 | ) | (0.08 | ) | |||||||
Repurchase of 6 ¼% Senior Notes | — | (1,901 | ) | (1,520 | ) | (0.04 | ) | ||||||||
Total special items | $ | (10,474 | ) | $ | (12,375 | ) | $ | (8,832 | ) | (0.25 | ) | ||||
61
Region Operating Results
The following tables set forth certain operating information for the regions comprising our Helicopter Services segment. Intercompany lease revenue and expense are eliminated from our segment reporting, and depreciation expense of aircraft is presented in the region that operates the aircraft.
Current Quarter Compared to Comparable Quarter
Set forth below is a discussion of the operations of our regions. Our consolidated results are discussed under “Results of Operations” above.
Europe Caspian
Three Months Ended September 30, | Favorable (Unfavorable) | ||||||||||||||||
2015 | 2014 | ||||||||||||||||
(In thousands, except percentages) | |||||||||||||||||
Operating revenue | $ | 207,072 | $ | 210,835 | $ | (3,763 | ) | (1.8 | )% | ||||||||
Earnings from unconsolidated affiliates, net of losses | $ | 153 | $ | 524 | $ | (371 | ) | (70.8 | )% | ||||||||
Operating income | $ | 15,060 | $ | 40,627 | $ | (25,567 | ) | (62.9 | )% | ||||||||
Operating margin | 7.3 | % | 19.3 | % | (12.0 | )% | (62.2 | )% | |||||||||
Adjusted EBITDAR | $ | 67,373 | $ | 70,707 | $ | (3,334 | ) | (4.7 | )% | ||||||||
Adjusted EBITDAR margin | 32.5 | % | 33.5 | % | (1.0 | )% | (3.0 | )% | |||||||||
The Europe Caspian region comprises all of our operations and affiliates in Europe and Central Asia, including Norway, the U.K. and Turkmenistan.
A substantial portion of our operations in the Europe Caspian region are contracted in British pound sterling and Norwegian kroner, both of which weakened significantly against the U.S. dollar since the Comparable Quarter. Foreign currency exchange rate changes resulted in a $21.4 million reduction in revenue for our Europe Caspian region year-over-year. Additionally, operating revenue for the Current Quarter reflects an impact from the downturn in the oil and gas industry, which has resulted in decreased activity levels with our oil and gas clients. Partially offsetting the year-over-year decrease in operating revenue was the startup of two U.K. SAR bases in April 2015, one base in July 2015 and one base in August 2015, which contributed $26.0 million in additional operating revenue, and the addition of a new oil and gas contract that commenced operations in late fiscal year 2015 and contributed $13.5 million in operating revenue in the Current Quarter.
Operating income and operating margin were significantly impacted by an impairment of goodwill related to our operations in Norway totaling $12.1 million during the Current Quarter, which resulted from reduced operating results. For additional details on the impairment of goodwill, see Note 1 in the “Notes to Condensed Consolidated Financial Statements” included elsewhere in this Quarterly Report. Additionally, since the Comparable Quarter we have added five leased aircraft in our Europe Caspian region primarily in support of the U.K. SAR contract, which resulted in a $14.2 million increase in rent expense. The increase in rent expense and the goodwill impairment were the primary drivers of the year-over-year decrease in operating income and operating margin.
Adjusted EBITDAR was mostly flat when compared to the Comparable Quarter, with a negative impact from changes in foreign currency exchange rates of $2.7 million compared to the Comparable Quarter. Given the impact on revenue in addition to adjusted EBITDAR, the changes in foreign currency exchange rates had minimal impact on adjusted EBITDAR margin. Adjusted EBITDAR margin, which excludes rent expense and goodwill impairment, was mostly flat year-over-year with the impact from the downturn in the offshore energy market being offset by the start-up of U.K. SAR bases and cost management activities.
Eastern Airways contributed $32.9 million and $39.5 million in operating revenue and $7.8 million and $9.6 million in adjusted EBITDAR for the Current Quarter and Comparable Quarter, respectively.
In July 2015, we took further action in response to weak market conditions by initiating an involuntary separation program in this region. We expect to incur approximately $3 million in severance expense related to this plan over the remainder of fiscal year 2016. This program, combined with a prior voluntary separation program, resulted in $1.8 million in severance expense during the Current Quarter, which is also excluded from adjusted EBITDAR and adjusted EBITDAR margin. We expect the offshore energy market in this region to continue to be challenging; however, we recently won a new tender and contract extension, and are awaiting results of other tenders in this market. Additionally, one base commenced operations under the U.K. SAR contract in October 2015 with an additional two bases expected to commence operations under the U.K. SAR contract over the remainder of fiscal year 2016.
62
Africa
Three Months Ended September 30, | Favorable (Unfavorable) | ||||||||||||||||
2015 | 2014 | ||||||||||||||||
(In thousands, except percentages) | |||||||||||||||||
Operating revenue | $ | 63,618 | $ | 84,763 | $ | (21,145 | ) | (24.9 | )% | ||||||||
Operating income | $ | 7,574 | $ | 19,667 | $ | (12,093 | ) | (61.5 | )% | ||||||||
Operating margin | 11.9 | % | 23.2 | % | (11.3 | )% | (48.7 | )% | |||||||||
Adjusted EBITDAR | $ | 19,901 | $ | 26,023 | $ | (6,122 | ) | (23.5 | )% | ||||||||
Adjusted EBITDAR margin | 31.3 | % | 30.7 | % | 0.6 | % | 2.0 | % | |||||||||
The Africa region comprises all of our operations and affiliates on the African continent, including Nigeria, Tanzania, and Egypt.
Operating revenue for Africa decreased due to an overall decrease in activity compared to the Comparable Quarter. Activity declined with certain customers and certain contracts ended, reducing revenue by $22.5 million, which was only partially offset by a $1.4 million increase in activity from other contracts.
Operating income and operating margin decreased in the Current Quarter primarily due to the decrease in activity discussed above and an increase in depreciation and amortization expense of $5.9 million as a result of management's decision to exit certain older aircraft fleet types operating in this market sooner than originally anticipated. Despite the decrease in operating revenue and adjusted EBITDAR, adjusted EBITDAR margin increased in the Current Quarter primarily due to a decrease in salaries and benefits expense of $7.6 million, decrease in maintenance expense of $2.3 million, decrease in travel and meals of $1.0 million and reversal of bad debt expense of $1.1 million. Additionally, during the Current Quarter we recorded $0.5 million in severance expense resulting from voluntary and involuntary separation programs. Depreciation and amortization, including the $6.5 million in additional depreciation, and $0.5 million in severance expense are excluded from adjusted EBITDAR and adjusted EBITDAR margin. Adjusted EBITDAR declined primarily due to the decrease in activity discussed above, partially offset by the reversal of $1.1 million of bad debt expense in the Current Quarter. The improvement in adjusted EBITDAR margin is driven by the reduction in costs discussed above as a result of cost management activities and reversal of $1.1 million of bad debt expense in the Current Quarter.
As previously discussed, we have seen recent changes in the Africa market as a result of new competitors entering this market. Additionally, changing regulations and the changing political environment have made and are expected to continue to make our operating results from Nigeria unpredictable. Market uncertainty related to the oil and gas downturn has continued in this region putting smaller clients under pressure as activity declines. We implemented cost management measures in advance of the activity reduction and expect additional efficiencies in the future.
Americas
Three Months Ended September 30, | Favorable (Unfavorable) | ||||||||||||||||
2015 | 2014 | ||||||||||||||||
(In thousands, except percentages) | |||||||||||||||||
Operating revenue | $ | 73,193 | $ | 88,110 | $ | (14,917 | ) | (16.9 | )% | ||||||||
Earnings from unconsolidated affiliates, net of losses | $ | (15,513 | ) | $ | (3,428 | ) | $ | (12,085 | ) | (352.5 | )% | ||||||
Operating income | $ | (9,046 | ) | $ | 13,566 | $ | (22,612 | ) | (166.7 | )% | |||||||
Operating margin | (12.4 | )% | 15.4 | % | (27.8 | )% | (180.5 | )% | |||||||||
Adjusted EBITDAR | $ | 7,295 | $ | 27,799 | $ | (20,504 | ) | (73.8 | )% | ||||||||
Adjusted EBITDAR margin | 10.0 | % | 31.6 | % | (21.6 | )% | (68.4 | )% | |||||||||
The Americas region comprises all our operations and affiliates in North America and South America, including Brazil, Canada, Trinidad and the U.S. Gulf of Mexico.
Operating revenue in the Current Quarter decreased primarily due to a decline in the number of small and medium aircraft on contract and reduction in flight hours for large aircraft in the U.S. Gulf of Mexico, which reduced operating revenue by $12.1 million, a decrease of $2.6 million in Trinidad primarily due to the end of a contract, a decrease of $2.3 million in Brazil due to fewer aircraft leased to Líder and a decrease in fuel revenue of $2.1 million. These decreases were partially offset by new contracts in Suriname and Guyana which increased operating revenue by $4.9 million.
63
Operating income, operating margin, adjusted EBITDAR and adjusted EBITDAR margin in the Current Quarter were negatively impacted by an increase of $11.9 million in losses from our investment in Líder in Brazil. Earnings from our investment in Líder were reduced by $19.9 million and $8.7 million in the Current Quarter and Comparable Quarter, respectively, as a result of unfavorable foreign currency exchange rate changes. Excluding this impact, our earnings from our investment in Líder would have been $4.7 million and $5.3 million, respectively, and our adjusted EBITDAR for the Americas region would have been $27.2 million (37.1% adjusted EBITDAR margin) and $36.5 million (41.4% adjusted EBITDAR margin), respectively, in the Current Quarter and Comparable Quarter. This year-over-year decrease primarily resulted from the reduction in operating revenue discussed above. See further discussion about our investment in Líder and the Brazil market in “Executive Overview – Market Outlook” and “– Current Quarter Compared to Comparable Quarter” included elsewhere in this Quarterly Report.
In addition to the decrease from our investment in Líder, operating income, operating margin, adjusted EBITDAR and adjusted EBITDAR margin were impacted by the decrease in activity in the U.S. Gulf of Mexico and an increase in depreciation and amortization of $1.6 million in the Current Quarter, partially offset by a decrease in salaries and benefits of $5.2 million and a decrease in maintenance expense of $2.1 million. We recorded accelerated depreciation expense on aircraft exiting our fleet in the Current Period of $3.2 million, which is reflected in the increase in depreciation and amortization. We also recorded severance expense, included in salaries and benefits in the Current Quarter, of $0.3 million. Depreciation and amortization, as well as the severance expense recorded during the Current Quarter, are excluded from adjusted EBITDAR and adjusted EBITDAR margin.
Asia Pacific
Three Months Ended September 30, | Favorable (Unfavorable) | ||||||||||||||||
2015 | 2014 | ||||||||||||||||
(In thousands, except percentages) | |||||||||||||||||
Operating revenue | $ | 72,038 | $ | 55,033 | $ | 17,005 | 30.9 | % | |||||||||
Operating income | $ | 5,013 | $ | 2,461 | $ | 2,552 | 103.7 | % | |||||||||
Operating margin | 7.0 | % | 4.5 | % | 2.5 | % | 55.6 | % | |||||||||
Adjusted EBITDAR | $ | 16,323 | $ | 12,508 | $ | 3,815 | 30.5 | % | |||||||||
Adjusted EBITDAR margin | 22.7 | % | 22.7 | % | — | % | — | % | |||||||||
The Asia Pacific region comprises all our operations and affiliates in Australia and Southeast Asia, including Malaysia and Sakhalin.
In January 2015, Bristow Australia acquired an 85% interest in Airnorth, which contributed $21.6 million in operating revenue and $4.9 million in adjusted EBITDAR for the Current Quarter. Operating revenue also increased by $21.0 million from new contracts in Australia, including an increase of the number of aircraft on the INPEX contract, offset by $16.0 million due to the ending of short-term contracts in Australia and a $3.3 million decline in Russia. A substantial portion of our operations in the Asia Pacific region are contracted in the Australian dollar, which has weakened significantly against the U.S. dollar since the Comparable Quarter. Foreign currency exchange rate changes resulted in a reduction in revenue for our Asia Pacific region of $9.4 million year-over-year.
Operating income, operating margin and adjusted EBITDAR increased primarily due to the acquisition of Airnorth. Adjusted EBITDAR and adjusted EBITDAR margin were negatively impacted by changes in foreign currency exchange rates, which reduced adjusted EBITDAR by $2.5 million compared to the Comparable Quarter. Excluding the impact of the foreign currency rate changes, adjusted EBITDAR margin would have been 23.1% in the Current Quarter, an improvement from the Comparable Quarter.
During the Current Quarter, we recorded additional depreciation expense of $0.8 million for two large aircraft operating in this region due to management's decision to exit these fleet types earlier than originally anticipated and $0.4 million in severance expense. Depreciation and amortization, including the $0.8 million of additional depreciation expense, and $0.4 million in severance expense were not included in adjusted EBITDAR or adjusted EBITDAR margin for the Current Quarter.
64
Corporate and Other
Three Months Ended September 30, | Favorable (Unfavorable) | ||||||||||||||||
2015 | 2014 | ||||||||||||||||
(In thousands, except percentages) | |||||||||||||||||
Operating revenue | $ | 6,160 | $ | 8,859 | $ | (2,699 | ) | (30.5 | )% | ||||||||
Operating loss | $ | (34,427 | ) | $ | (32,384 | ) | $ | (2,043 | ) | (6.3 | )% | ||||||
Adjusted EBITDAR | $ | (18,128 | ) | $ | (24,968 | ) | $ | 6,840 | 27.4 | % | |||||||
Corporate and other includes our Bristow Academy operations, supply chain management and corporate costs that have not been allocated out to other regions.
Operating revenue decreased primarily due to a decrease in Bristow Academy revenue of $2.7 million.
Corporate operating expense primarily represents costs associated with our corporate office and other general and administrative costs not allocated to our regions. Operating loss during the Current Quarter included the impairment of goodwill for Bristow Academy totaling $10.2 million, which resulted from reduced operating results for this operation. For additional details on the impairment of goodwill, see Note 1 in the “Notes to Condensed Consolidated Financial Statements” included elsewhere in this Quarterly Report. Operating loss for the Comparable Quarter included impairment of inventories totaling $3.4 million. We recognized a benefit in both operating loss and adjusted EBITDAR from a reversal of accruals for annual cash bonuses as part of our cost management activities and for our performance cash plan resulting from recent stock price performance. Compared with amounts accrued in the Comparable Quarter, the reversal of these accruals benefited our Corporate results by $7.4 million.
During the Current Quarter we recorded severance expense of $2.7 million related to voluntary and involuntary separation plans and during Comparable Quarter we recorded $1.8 million of expense related to CEO succession, both of which are excluded from adjusted EBITDAR.
Interest Expense, Net
Three Months Ended September 30, | Favorable (Unfavorable) | ||||||||||||||||
2015 | 2014 | ||||||||||||||||
(In thousands, except percentages) | |||||||||||||||||
Interest income | $ | 217 | $ | 386 | $ | (169 | ) | (43.8 | )% | ||||||||
Interest expense | (9,554 | ) | (10,257 | ) | 703 | 6.9 | % | ||||||||||
Amortization of debt discount | (28 | ) | (1,048 | ) | 1,020 | 97.3 | % | ||||||||||
Amortization of debt fees | (459 | ) | (786 | ) | 327 | 41.6 | % | ||||||||||
Capitalized interest | 2,645 | 4,133 | (1,488 | ) | (36.0 | )% | |||||||||||
Interest expense, net | $ | (7,179 | ) | $ | (7,572 | ) | $ | 393 | 5.2 | % | |||||||
The decrease in interest expense, net in the Current Quarter is primarily due to a lower interest expense and amortization of debt discount partially offset by less capitalized interest resulting from lower construction in progress. Additionally, we wrote-off deferred financing fees of $0.3 million related to the repurchase of $20.0 million of our 6¼% Senior Notes in the Comparable Quarter.
Other Income (Expense), Net
Three Months Ended September 30, | Favorable (Unfavorable) | ||||||||||||||||
2015 | 2014 | ||||||||||||||||
(In thousands, except percentages) | |||||||||||||||||
Foreign currency losses | $ | (11,430 | ) | $ | (1,718 | ) | $ | (9,712 | ) | (565.3 | )% | ||||||
Other | 6 | (963 | ) | 969 | 100.6 | % | |||||||||||
Other income (expense), net | $ | (11,424 | ) | $ | (2,681 | ) | $ | (8,743 | ) | (326.1 | )% | ||||||
______
* percentage change not meaningful
Other income (expense), net increased primarily due to the favorable impact of changes in foreign currency exchange rates. Additionally, other income (expense), net in the Comparable Quarter included $1.0 million in premiums and fees as a result of the repurchase of $20.0 million of our 6 ¼% Senior Notes. The foreign currency losses within other income (expense), net are
65
reflected within adjusted EBITDAR of the regions discussed above, with the $11.4 million loss in the Current Quarter being reflected primarily within the Europe Caspian region ($6.8 million), Asia Pacific region ($3.2 million) and Corporate and other ($1.3 million).
Taxes
Three Months Ended September 30, | Favorable (Unfavorable) | |||||||||||||||
2015 | 2014 | |||||||||||||||
(In thousands, except percentages) | ||||||||||||||||
Effective tax rate | 5.7 | % | 17.7 | % | 12.0 | % | 67.8 | % | ||||||||
Net foreign tax on non-U.S. earnings | $ | 7,568 | $ | 5,199 | $ | (2,369 | ) | (45.6 | )% | |||||||
Benefit of foreign earnings indefinitely reinvested abroad | $ | (3,575 | ) | $ | (14,589 | ) | $ | (11,014 | ) | (75.5 | )% | |||||
Impact of goodwill impairment | $ | 3,290 | $ | — | $ | (3,290 | ) | * | ||||||||
Utilization of foreign tax credits | $ | (2,751 | ) | $ | (1,838 | ) | $ | 913 | 49.7 | % | ||||||
Change in valuation allowance | $ | 969 | $ | 545 | $ | (424 | ) | (77.8 | )% | |||||||
______
* percentage change not meaningful
In accordance with GAAP, we estimate the full-year effective tax rate from continuing operations and apply this rate to our year-to-date income from continuing operations. In addition, we separately calculate the tax impact of unusual or infrequent items, if any. The tax impacts of such unusual or infrequent items are treated discretely in the quarter in which they occur.
The relationship between our provision for or benefit from income taxes and our pre-tax book income can vary significantly from period to period considering, among other factors, (a) the overall level of pre-tax book income, (b) changes in the blend of income that is taxed based on gross revenues or at high effective tax rates versus pre-tax book income or at low effective tax rates and (c) our geographical blend of pre-tax book income. Consequently, our income tax expense does not change proportionally with our pre-tax book income. Significant decreases in our pre-tax book income typically result in higher effective tax rates, while significant increases in pre-tax book income can lead to lower effective tax rates, subject to the other factors impacting income tax expense noted above. In the Current Quarter, our unfavorable permanent differences, such as valuation allowances and non-tax deductible goodwill write-off had the effect of decreasing our income tax benefit. Additionally during the Current Quarter, we increased our valuation allowance by $1.0 million which also impacted our effective tax rate.
Current Period Compared to Comparable Period
Set forth below is a discussion of the operations of our regions. Our consolidated results are discussed under “Results of Operations” above.
Europe Caspian
Six Months Ended September 30, | Favorable (Unfavorable) | ||||||||||||||||
2015 | 2014 | ||||||||||||||||
(In thousands, except percentages) | |||||||||||||||||
Operating revenue | $ | 410,997 | $ | 417,599 | $ | (6,602 | ) | (1.6 | )% | ||||||||
Earnings from unconsolidated affiliates, net of losses | $ | 252 | $ | 897 | $ | (645 | ) | (71.9 | )% | ||||||||
Operating income | $ | 29,257 | $ | 82,822 | $ | (53,565 | ) | (64.7 | )% | ||||||||
Operating margin | 7.1 | % | 19.8 | % | (12.7 | )% | (64.1 | )% | |||||||||
Adjusted EBITDAR | $ | 132,559 | $ | 141,250 | $ | (8,691 | ) | (6.2 | )% | ||||||||
Adjusted EBITDAR margin | 32.3 | % | 33.8 | % | (1.5 | )% | (4.4 | )% | |||||||||
A substantial portion of our operations in the Europe Caspian region are contracted in British pound sterling and Norwegian kroner, both of which weakened significantly against the U.S. dollar since the Comparable Period. Foreign currency exchange rate changes resulted in a $46.3 million reduction in revenue for our Europe Caspian region year-over-year. Additionally, operating revenue for the Current Period reflects an impact from the downturn in the oil and gas industry, which has resulted in decreased activity levels with our oil and gas clients. Partially offsetting the year-over-year decrease in operating revenue was the startup of two U.K. SAR bases in April 2015, one base in July 2015 and one base in August 2015, which contributed $41.5 million in additional operating revenue, and the addition of a new oil and gas contract that commenced operations in late fiscal year 2015 and contributed $28.1 million in operating revenue in the Current Period.
66
Operating income and operating margin were significantly impacted by an impairment of goodwill for operations in Norway totaling $12.1 million during the Current Period, which resulted from reduced operating results. For additional details on the impairment of goodwill, see Note 1 in the “Notes to Condensed Consolidated Financial Statements” included elsewhere in this Quarterly Report. Additionally, since the Comparable Period we have added five leased aircraft in our Europe Caspian region primarily in support of the U.K. SAR contract, which resulted in a $30.0 million increase in rent expense. The increase in rent expense and the goodwill impairment were the primary drivers of the year-over-year decrease in operating income and operating margin. Operating income, operating margin, adjusted EBITDAR and adjusted EBITDAR margin were negatively impacted by changes in foreign currency exchange rates, which reduced operating income by $5.3 million and adjusted EBITDAR by $7.3 million compared to the Comparable Period. Given the impact on revenue in addition to operating income and adjusted EBITDAR, the changes in foreign currency exchange rate had minimal impact on operating margin and adjusted EBITDAR margin. Adjusted EBITDAR margin declined slightly compared to the Comparable Period with the impact from the downturn in the offshore energy market being partially offset by the start-up of U.K. SAR bases and cost management activities. The involuntary separation program initiated in July 2015, combined with a prior voluntary separation program, resulted in $4.3 million in severance expense during the Current Period, which is excluded from adjusted EBITDAR and adjusted EBITDAR margin.
Additionally, operating income, operating margin, adjusted EBITDAR and adjusted EBITDAR margin in the Current Period and Comparable Period benefited from the recovery of $4.5 million and $8.7 million, respectively, in credits for maintenance expense from an original equipment manufacturer resulting from settlement for aircraft performance and transportation costs.
Eastern Airways contributed $67.0 million and $79.3 million in operating revenue and $15.3 million and $19.0 million in adjusted EBITDAR for the Current Period and Comparable Period, respectively.
For further discussion of additional matters related to operations in Europe Caspian, see “– Current Quarter Compared to Comparable Quarter – Europe Caspian” included elsewhere in this Quarterly Report.
Africa
Six Months Ended September 30, | Favorable (Unfavorable) | ||||||||||||||||
2015 | 2014 | ||||||||||||||||
(In thousands, except percentages) | |||||||||||||||||
Operating revenue | $ | 141,099 | $ | 169,335 | $ | (28,236 | ) | (16.7 | )% | ||||||||
Operating income | $ | 20,526 | $ | 37,293 | $ | (16,767 | ) | (45.0 | )% | ||||||||
Operating margin | 14.5 | % | 22.0 | % | (7.5 | )% | (34.1 | )% | |||||||||
Adjusted EBITDAR | $ | 42,715 | $ | 47,895 | $ | (5,180 | ) | (10.8 | )% | ||||||||
Adjusted EBITDAR margin | 30.3 | % | 28.3 | % | 2.0 | % | 7.1 | % | |||||||||
Operating revenue for Africa decreased due to an overall decrease in activity compared to the Comparable Period. Activity declined with certain customers and certain contracts ended, reducing revenue by $30.0 million, which was only partially offset by a $1.8 million increase in activity in other contracts.
Operating income and operating margin decreased in the Current Period primarily due to $3.0 million of bad debt expense recorded in the Current Period and an increase in depreciation and amortization expense of $7.8 million primarily as a result of management's decision to exit certain aircraft fleet types operating in this market sooner than originally anticipated. Adjusted EBITDAR margin increased in the Current Period primarily due to a decrease in salaries and benefits expense of $8.9 million, decrease in maintenance expense of $4.4 million, decrease in travel and meals $1.1 million and decrease in local taxes of $1.5 million, partially offset by $3.0 million of bad debt expense recorded in the Current Period. Additionally, during the Current Period we recorded $3.7 million in severance expense resulting from voluntary and involuntary separation programs. Depreciation and amortization, including the $8.8 million in additional depreciation, and $3.7 million in severance expense are excluded from adjusted EBITDAR and adjusted EBITDAR margin. The improvement in adjusted EBITDAR margin was driven by the reduction in costs discussed above as a result of cost management activities, partially offset by the $3.0 million of bad debt expense recorded in the Current Period.
For further discussion of additional matters related to operations in Africa, see “– Current Quarter Compared to Comparable Quarter – Africa” included elsewhere in this Quarterly Report.
67
Americas
Six Months Ended September 30, | Favorable (Unfavorable) | ||||||||||||||||
2015 | 2014 | ||||||||||||||||
(In thousands, except percentages) | |||||||||||||||||
Operating revenue | $ | 153,215 | $ | 177,851 | $ | (24,636 | ) | (13.9 | )% | ||||||||
Earnings from unconsolidated affiliates, net of losses | $ | (9,316 | ) | $ | 480 | $ | (9,796 | ) | * | ||||||||
Operating income | $ | 7,486 | $ | 40,224 | $ | (32,738 | ) | (81.4 | )% | ||||||||
Operating margin | 4.9 | % | 22.6 | % | (17.7 | )% | (78.3 | )% | |||||||||
Adjusted EBITDAR | $ | 40,737 | $ | 67,880 | $ | (27,143 | ) | (40.0 | )% | ||||||||
Adjusted EBITDAR margin | 26.6 | % | 38.2 | % | (11.6 | )% | (30.4 | )% | |||||||||
______
* percentage change not meaningful
Operating revenue decreased primarily due to a decrease in the number of small and medium aircraft on contract in the U.S. Gulf of Mexico, which reduced operating revenue by $19.1 million in the Current Period, a decrease of $4.0 million in Trinidad primarily due to the end of a contract, a decrease of $4.2 million in Brazil due to fewer aircraft leased to Líder and a decrease in fuel revenue of $3.5 million. These decreases were partially offset by new contracts in Suriname and Guyana which increased operating revenue by $7.0 million.
Operating income, operating margin, adjusted EBITDAR and adjusted EBITDAR margin were negatively impacted by a decrease of $9.8 million in earnings from our investment in Líder in Brazil. Earnings from our investment in Líder were reduced by $18.2 million and $8.3 million in the Current Period and Comparable Period, respectively, as a result of unfavorable foreign currency exchange rate changes. Excluding this impact, our earnings from our investment in Líder would have been $9.4 million and $9.4 million, respectively, and our adjusted EBITDAR for the Americas region would have been $58.9 million (38.4 % adjusted EBITDAR margin) and $76.2 million (42.8% adjusted EBITDAR margin), respectively, in the Current Period and Comparable Period. This year-over-year decrease primarily resulted from the reduction in operating revenue discussed above. See further discussion about our investment in Líder and the Brazil market in “Executive Overview – Market Outlook” and “– Current Quarter Compared to Comparable Quarter” included elsewhere in this Quarterly Report.
In addition to the decrease from our investment in Líder, operating income, operating margin, adjusted EBITDAR and adjusted EBITDAR margin were impacted by a decrease in activity in the U.S. Gulf of Mexico and operating income and operating margin were impacted by an increase in depreciation and amortization of $4.6 million in the Current Period. These increases were partially offset by a decrease in salaries and benefits of $10.5 million and a decrease in maintenance expense of $3.0 million. We recorded accelerated depreciation expense on aircraft exiting our fleet in the Current Period of $6.1 million, which is reflected in the increase in depreciation and amortization. We also recorded severance expense, included in salaries and benefits in the Current Period, of $1.4 million. Depreciation and amortization, including the accelerated depreciation, and the severance expense recorded during the Current Period are excluded from adjusted EBITDAR and adjusted EBITDAR margin.
During the Comparable Period, we reversed $4.4 million of bad debt expense in the Americas region related to a client that had previously filed for bankruptcy for which we have subsequently settled and collected funds and we recorded $1.6 million in costs associated with the restructuring of this region and planned closure of our Alaska operations which related primarily to employee severance and retention costs. The $1.6 million in restructuring costs in the Comparable Period are excluded from adjusted EBITDAR and adjusted EBITDAR margin.
Asia Pacific
Six Months Ended September 30, | Favorable (Unfavorable) | ||||||||||||||||
2015 | 2014 | ||||||||||||||||
(In thousands, except percentages) | |||||||||||||||||
Operating revenue | $ | 146,775 | $ | 109,502 | $ | 37,273 | 34.0 | % | |||||||||
Operating income | $ | 4,325 | $ | 5,791 | $ | (1,466 | ) | (25.3 | )% | ||||||||
Operating margin | 2.9 | % | 5.3 | % | (2.4 | )% | (45.3 | )% | |||||||||
Adjusted EBITDAR | $ | 33,395 | $ | 25,328 | $ | 8,067 | 31.9 | % | |||||||||
Adjusted EBITDAR margin | 22.8 | % | 23.1 | % | (0.3 | )% | (1.3 | )% | |||||||||
In January 2015, Bristow Australia acquired an 85% interest in Airnorth, which contributed $43.2 million in operating revenue and $10.9 million in adjusted EBITDAR for the Current Period. Operating revenue also increased by $49.9 million from
68
new contracts in Australia, including the INPEX contract which started late in the June 2014 quarter, offset by $38.5 million due to the ending of short-term contracts in Australia and a $4.0 million decrease in Russia. A substantial portion of our operations in the Asia Pacific region are contracted in the Australian dollar, which has weakened significantly against the U.S. dollar since the Comparable Period. Foreign currency exchange rate changes resulted in a reduction in on our revenue for our Asia Pacific region of $16.6 million year-over-year.
Operating income and operating margin decreased primarily due to an increase in costs of helicopter operations in this region, including depreciation and amortization expense of $2.0 million, maintenance expense of $5.1 million and rent expense of $4.3 million, partially offset by contribution from the addition of Airnorth. Adjusted EBITDAR improved primarily due to the addition of Airnorth and new contract start-ups since the Comparable Period. Adjusted EBITDAR and adjusted EBITDAR margin exclude the impact of increased rent expense from the additional aircraft on lease in the Current Period. During the Current Period, we recorded additional depreciation expense of $4.4 million for four large aircraft operating in this region due to management's decision to exit these fleet types earlier than originally anticipated and $1.3 million in severance expense. Depreciation and amortization, including the $4.4 million of additional depreciation expense, and $1.3 million in severance expense were not included in adjusted EBITDAR or adjusted EBITDAR margin for the Current Period. Adjusted EBITDAR and adjusted EBITDAR margin were negatively impacted by changes in foreign currency exchange rates, which reduced adjusted EBITDAR by $3.7 million compared to the Comparable Period. Excluding the impact of these foreign currency rate changes, adjusted EBITDAR margin would have been 22.7% in the Current Period, slightly lower than the Comparable Period. This margin decrease relates to the inclusion of $4.0 million in credits for maintenance expense from our original equipment manufacturer recorded during the Comparable Period as settlements for aircraft performance and transportation costs. Before the benefit of the maintenance credits utilized during the Comparable Period, adjusted EBITDAR margin was 19.5%.
Corporate and Other
Six Months Ended September 30, | Favorable (Unfavorable) | ||||||||||||||||
2015 | 2014 | ||||||||||||||||
(In thousands, except percentages) | |||||||||||||||||
Operating revenue | $ | 14,933 | $ | 18,200 | $ | (3,267 | ) | (18.0 | )% | ||||||||
Operating loss | $ | (64,891 | ) | $ | (57,611 | ) | $ | (7,280 | ) | (12.6 | )% | ||||||
Adjusted EBITDAR | $ | (35,595 | ) | $ | (42,661 | ) | $ | 7,066 | 16.6 | % | |||||||
Operating revenue decreased primarily due to a decline in Bristow Academy revenue of $4.6 million, partially offset by an increase in third party part sales of $1.1 million.
Operating loss during the Current Period included the impairment of goodwill for Bristow Academy totaling $10.2 million, which resulted from reduced operating results for this operation, and impairment of inventories totaling $5.4 million. For additional details on the impairment of goodwill, see Note 1 in the “Notes to Condensed Consolidated Financial Statements” included elsewhere in this Quarterly Report. Operating loss for the Comparable Period also included impairment of inventories totaling $3.4 million. Adjusted EBITDAR improved primarily due to a favorable impact from changes in foreign currency exchange rates on our Corporate results of $1.3 million during the Current Period. We recognized a benefit in both operating loss and adjusted EBITDAR from a reversal of accruals for annual cash bonuses as part of our cost management activities and for our performance cash plan resulting from recent stock price performance. Compared with amounts accrued in the Comparable Period, the reversal of these accruals benefited our Corporate results by $5.7 million.
During the Current Period we recorded severance expense of $3.0 million related to voluntary and involuntary separation plans and during Comparable Period we recorded $5.5 million of expense related to CEO succession, both of which are excluded from adjusted EBITDAR.
69
Interest Expense, Net
Six Months Ended September 30, | Favorable (Unfavorable) | ||||||||||||||||
2015 | 2014 | ||||||||||||||||
(In thousands, except percentages) | |||||||||||||||||
Interest income | $ | 438 | $ | 622 | $ | (184 | ) | (29.6 | )% | ||||||||
Interest expense | (19,285 | ) | (20,144 | ) | 859 | 4.3 | % | ||||||||||
Amortization of debt discount | (946 | ) | (2,067 | ) | 1,121 | 54.2 | % | ||||||||||
Amortization of debt fees | (1,071 | ) | (1,459 | ) | 388 | 26.6 | % | ||||||||||
Capitalized interest | 6,016 | 8,349 | (2,333 | ) | (27.9 | )% | |||||||||||
Interest expense, net | $ | (14,848 | ) | $ | (14,699 | ) | $ | (149 | ) | (1.0 | )% | ||||||
The increase in interest expense, net in the Current Period is primarily due to a decrease in capitalized interest resulting from lower construction in progress, partially offset by a write-off of deferred financing fees of $0.4 million related to the repurchase of $31.2 million of our 6¼% Senior Notes in the Comparable Period.
Other Income (Expense), Net
Six Months Ended September 30, | Favorable (Unfavorable) | ||||||||||||||||
2015 | 2014 | ||||||||||||||||
(In thousands, except percentages) | |||||||||||||||||
Foreign currency losses | $ | (7,570 | ) | $ | (2,114 | ) | $ | (5,456 | ) | (258.1 | )% | ||||||
Other | (15 | ) | (1,806 | ) | 1,791 | 99.2 | % | ||||||||||
Other income (expense), net | $ | (7,585 | ) | $ | (3,920 | ) | $ | (3,665 | ) | (93.5 | )% | ||||||
______
* percentage change not meaningful
Other income (expense), net decreased primarily due to the favorable impact of changes in foreign currency exchange rates. Additionally, other income (expense), net in the Comparable Period included $1.9 million in premium and fees as a result of the repurchase of $31.2 million of our 6¼% Senior Notes. The foreign currency losses within other income (expense), net are reflected within adjusted EBITDAR of the regions discussed above, with the $7.6 million loss in the Current Period being reflected primarily within the Europe Caspian region ($3.9 million) and Asia Pacific region ($4.1 million), partially offset by a gain in Corporate and other ($1.3 million).
Taxes
Six Months Ended September 30, | Favorable (Unfavorable) | |||||||||||||||
2015 | 2014 | |||||||||||||||
(In thousands, except percentages) | ||||||||||||||||
Effective tax rate | 0.3 | % | 19.6 | % | 19.3 | % | 98.5 | % | ||||||||
Net foreign tax on non-U.S. earnings | $ | 12,730 | $ | 12,388 | $ | (342 | ) | (2.8 | )% | |||||||
Benefit of foreign earnings indefinitely reinvested abroad | $ | (11,393 | ) | $ | (28,589 | ) | $ | (17,196 | ) | (60.1 | )% | |||||
Impact of goodwill impairment | $ | 3,290 | $ | — | $ | (3,290 | ) | * | ||||||||
Utilization of foreign tax credits | $ | (4,103 | ) | $ | (4,897 | ) | $ | (794 | ) | (16.2 | )% | |||||
Change in valuation allowance | $ | 3,015 | $ | 772 | $ | (2,243 | ) | (290.5 | )% | |||||||
______
* percentage change not meaningful
In accordance with GAAP, we estimate the full-year effective tax rate from continuing operations and apply this rate to our year-to-date income from continuing operations. In addition, we separately calculate the tax impact of unusual or infrequent items, if any. The tax impacts of such unusual or infrequent items are treated discretely in the quarter in which they occur.
70
The relationship between our provision for or benefit from income taxes and our pre-tax book income can vary significantly from period to period considering, among other factors, (a) the overall level of pre-tax book income, (b) changes in the blend of income that is taxed based on gross revenues or at high effective tax rates versus pre-tax book income or at low effective tax rates and (c) our geographical blend of pre-tax book income. Consequently, our income tax expense does not change proportionally with our pre-tax book income. Significant decreases in our pre-tax book income typically result in higher effective tax rates, while significant increases in pre-tax book income can lead to lower effective tax rates, subject to the other factors impacting income tax expense noted above. In the Current Period, our unfavorable permanent differences, such as valuation allowances and non-tax deductible goodwill write-off had the effect of decreasing our income tax benefit. Additionally during the Current Period, we increased our valuation allowance by $3.0 million which also impacted our effective tax rate.
Liquidity and Capital Resources
Cash Flows
Operating Activities
Net cash flows provided by operating activities totaled $58.3 million during the Current Period compared to $101.2 million during the Comparable Period. Changes in non-cash working capital used $7.3 million and $29.1 million in cash flows from operating activities for the Current Period and Comparable Period, respectively. The decrease in net cash flows provided by operating activities is primarily due to the decline in earnings.
Investing Activities
Cash flows used in investing activities totaled $130.9 million during the Current Period compared to cash flows provided by investing activities of $95.5 million during the Comparable Period. Cash was used for capital expenditures as follows:
Six Months Ended September 30, | |||||||||
2015 | 2014 | ||||||||
Number of aircraft delivered: | |||||||||
Medium | 1 | 3 | |||||||
Large | 2 | 8 | |||||||
Total aircraft | 3 | 11 | |||||||
Capital expenditures (in thousands): | |||||||||
Aircraft and related equipment | $ | 111,153 | $ | 237,484 | |||||
Other | 35,836 | 64,635 | |||||||
Total capital expenditures | $ | 146,989 | $ | 302,119 | |||||
In addition to these capital expenditures, investing cash flows were impacted by aircraft sales. During the Current Period, we received proceeds of $16.1 million primarily from the sale or disposal of four aircraft and certain other equipment. During the Comparable Period, we received proceeds of $16.9 million primarily from the sale or disposal of 11 aircraft and certain other equipment and received $380.7 million for the sale of 14 aircraft which we subsequently leased back.
Financing Activities
Cash flows provided by financing activities totaled $104.4 million during the Current Period compared to cash used of $129.8 million during the Comparable Period. During the Current Period, we received $334.2 million from borrowings on our Revolving Credit Facility and $127.4 million from borrowings on our $350 million Term Loan. During the Current Period, cash was used for the repayment of debt totaling $323.6 million (including $115.0 million for the repurchase of our 3% Convertible Senior Notes) and payment of dividends on our Common Stock totaling $23.7 million. During the Comparable Period, we received $218.0 million from borrowings on our Revolving Credit Facility and $1.4 million in proceeds from the issuance of Common Stock upon exercise of stock options. During the Comparable Period, cash was used for the repayment of debt totaling $282.8 million, payment of dividends on our Common Stock totaling $22.7 million and repurchases of our common stock totaling $43.4 million.
Future Cash Requirements
Contractual Obligations, Commercial Commitments and Off Balance Sheet Arrangements
We have various contractual obligations that are recorded as liabilities on our condensed consolidated balance sheet. Other items, such as certain purchase commitments, interest payments and other executory contracts are not recognized as liabilities on our condensed consolidated balance sheet but are included in the table below. For example, we are contractually committed to make certain minimum lease payments for the use of property and equipment under operating lease agreements.
71
The following table summarizes our significant contractual obligations and other commercial commitments on an undiscounted basis as of September 30, 2015 and the future periods in which such obligations are expected to be settled in cash. In addition, the table reflects the timing of principal and interest payments on outstanding borrowings as of September 30, 2015. Additional details regarding these obligations are provided in Notes 5, 6, 7 and 9 in the “Notes to Consolidated Financial Statements” included in the fiscal year 2015 Annual Report and in Notes 3, 4, 5 and 7 in the “Notes to Condensed Consolidated Financial Statements” included elsewhere in this Quarterly Report.
Payments Due by Period | ||||||||||||||||||||
Six Months Ending March 31, 2016 | Fiscal Year Ending March 31, | |||||||||||||||||||
Total | 2017— 2018 | 2019— 2020 | 2021 and beyond | |||||||||||||||||
(In thousands) | ||||||||||||||||||||
Contractual obligations: | ||||||||||||||||||||
Long-term debt and short-term borrowings: | ||||||||||||||||||||
Principal (1) | $ | 1,003,769 | $ | 11,333 | $ | 78,457 | $ | 504,133 | $ | 409,846 | ||||||||||
Interest (2) | 228,395 | 18,790 | 72,996 | 60,859 | 75,750 | |||||||||||||||
Aircraft operating leases (3) | 549,121 | 71,225 | 266,838 | 168,770 | 42,288 | |||||||||||||||
Other operating leases (4) | 163,117 | 14,210 | 59,651 | 46,568 | 42,688 | |||||||||||||||
Pension obligations (5) | 206,091 | 22,818 | 61,937 | 46,388 | 74,948 | |||||||||||||||
Aircraft purchase obligations (6) | 556,878 | 251,973 | 214,410 | 90,495 | — | |||||||||||||||
Other purchase obligations (7) | 395,741 | 126,228 | 57,017 | 60,157 | 152,339 | |||||||||||||||
Total contractual cash obligations | $ | 3,103,112 | $ | 516,577 | $ | 811,306 | $ | 977,370 | $ | 797,859 | ||||||||||
Other commercial commitments: | ||||||||||||||||||||
Letters of credit | $ | 10,760 | $ | 9,352 | $ | 1,408 | $ | — | $ | — | ||||||||||
Contingent consideration (8) | 55,026 | 7,463 | 44,754 | 2,809 | — | |||||||||||||||
Total commercial commitments | $ | 65,786 | $ | 16,815 | $ | 46,162 | $ | 2,809 | $ | — | ||||||||||
______
(1) | Excludes unamortized discount of $0.4 million on the Term Loan. |
(2) | Interest payments for variable interest debt are based on interest rates as of September 30, 2015. |
(3) | Represents separate operating leases for aircraft. During the Current Period, we entered into two new aircraft operating leases. |
(4) | Represents minimum rental payments required under non-operating leases that have initial or remaining non-cancelable lease terms in excess of one year. |
(5) | Represents expected funding for pension benefits in future periods. These amounts are undiscounted and are based on the expectation that both the U.K. and Norway pensions will be fully funded in approximately three years. As of September 30, 2015, we had recorded on our balance sheet a $91.9 million pension liability associated with these obligations. The timing of the funding is dependent on actuarial valuations and resulting negotiations with the plan trustees. |
(6) | We are currently in discussions with our helicopter manufacturers to defer payment on certain ordered aircraft into future fiscal years and take delivery of certain aircraft later than reflected herein. The aim of these discussions is to more closely align the expenditures and delivery of aircraft with the applicable revenue and cash flow associated with the aircraft. We expect to defer approximately $100 million in capital expenditures out of the six months ending March 31, 2016 into future periods and push deliveries into future periods further out resulting in anticipated capital expenditures of approximately $100 million for each of fiscal year 2017 and fiscal year 2018 and $50 million per fiscal year thereafter. |
(7) | Other purchase obligations primarily represent unfilled purchase orders for aircraft parts, commitments associated with upgrading facilities at our bases and non-cancelable power-by-the-hour maintenance commitments. |
(8) | The Cougar purchase agreement includes a potential earn-out of $40 million payable over three years based on Cougar achieving certain agreed performance targets. During fiscal year 2014, the first year earn-out payment of $6.0 million was paid as Cougar achieved agreed performance targets. The second year earn-out payment of $8.0 million was paid in April 2015 as Cougar achieved agreed performance targets. The fair value of the earn-out is $25.0 million as of September 30, 2015 and is included in other accrued liabilities on our condensed consolidated balance sheet. The Eastern Airways purchase agreement includes a potential earn-out of £6 million ($9.1 million) over a three year period, which is contingent upon both the achievement of agreed performance targets and the continued employment of the selling shareholders. The first year earn-out payment was not achieved. The Airnorth purchase agreement includes a potential earn-out of A$17 million ($13.1 million) to be paid over four years. The fair value of a portion of the Airnorth earn-out, which is contingent upon the achievement of agreed performance targets, is A$8.8 million ($6.2 million) as of September 30, 2015 and is included in other accrued liabilities and other liabilities and deferred credits on our consolidated balance sheet. The remaining A$7 million ($4.9 million) of the Airnorth earn-out, which is contingent upon both the achievement of agreed performance targets and the continued |
72
employment of the selling shareholders, will be included as general and administrative expense in our consolidated statements of operations as earned. The earn-outs for Cougar and Airnorth will be remeasured to fair value at each reporting date until the contingency is resolved and any changes in estimated fair value will be recorded as accretion expense included in depreciation and amortization on our consolidated statements of operations.
Capital Commitments and Other Uses of Cash
We have commitments and options to make capital expenditures over the next five fiscal years to purchase additional aircraft, including aircraft associated with the commitments reflected in the table above. Although a similar number of our existing aircraft may be sold during the same period, the additional aircraft on order are expected to provide incremental fleet capacity in terms of revenue, operating margin and adjusted EBITDAR margin. See Note 5 in the “Notes to Condensed Consolidated Financial Statements” included elsewhere in this Quarterly Report for a detail of the number of aircraft under commitments and options expected to be delivered in the current and subsequent five fiscal years by aircraft size along with the related expenditures and for a rollforward of aircraft commitments and options through September 30, 2015. We are currently working closely with helicopter manufacturers to defer capital expenditures for certain ordered aircraft into future fiscal years to more closely align the expenditures for those aircraft with the expected timing of revenue and cash flow generated by those assets. During fiscal year 2016, we expect to invest approximately $125 million in various infrastructure enhancements, including aircraft facilities, training centers and technology. Through September 30, 2015, we had incurred approximately $35.8 million towards these projects.
As discussed under “— Executive Overview — Our Strategy — Capital Allocation Strategy”, cash may also be used for dividend payments and repurchases of Common Stock. Additionally, cash may be used in future periods to repurchase or otherwise retire debt, including our 6 ¼% Senior Notes, or for any acquisition opportunities we believe are aligned with our long-term strategy.
Financial Condition and Sources of Liquidity
We actively manage our liquidity through generation of cash from operations while assessing our funding needs on an ongoing basis. While we have generated significant cash from operations, financing cash flows have also been a significant source of liquidity over the past several years. The significant factors that affect our overall liquidity include capital expenditure commitments, pension funding, operating leases, adequacy of bank lines of credit and our ability to attract long-term capital on satisfactory terms.
Substantially all of our cash balances are held outside the U.S. and are generally used to meet the liquidity needs of our non-U.S. operations. Most of our cash held outside the U.S. could be repatriated to the U.S., but under current law, any such repatriation would be subject to U.S. federal income tax, as adjusted for applicable foreign tax credits. We have provided for U.S. federal income taxes on undistributed foreign earnings where we have determined that such earnings are not indefinitely reinvested. We expect to meet the continuing funding requirements of our U.S. operations with cash generated by such U.S. operations, cash from earnings generated by non-U.S. operations that are not indefinitely reinvested and our existing Revolving Credit Facility. If cash held by non-U.S. operations is required for funding operations in the U.S., and if U.S. tax has not previously been provided on the earnings of such operations, we would make a provision for additional U.S. tax in connection with repatriating this cash, which may be material to our cash flows and results of operations.
On November 5, 2015, we received $200 million in proceeds from a new two-year term loan facility and initially used the proceeds to repay loans outstanding under our $400 million revolving credit facility and related fees and expenses and to finance working capital needs. The additional liquidity is for capital expenditures, working capital needs and general corporate purposes. Additionally, as discussed above, we have been working closely with helicopter manufacturers to defer capital expenditures for certain ordered aircraft into future fiscal years.
We expect that our cash on deposit as of September 30, 2015 of $139.3 million, cash flow from operations, proceeds from aircraft sales and from the sale and leaseback of owned aircraft, available borrowing capacity under our Revolving Credit Facility, as well as any future financings (including the $200 million in proceeds received on November 5, 2015) will be sufficient to satisfy our capital commitments, including our aircraft purchase commitments to service our oil and gas clients and remaining anticipated capital requirements in connection with our U.K. SAR contract of approximately $766.4 million as of September 30, 2015. The available borrowing capacity under our Revolving Credit Facility was $175.0 million as of September 30, 2015. While we plan to continue to be disciplined concerning future capital commitments, we also intend to continue managing our capital structure and liquidity position with additional external financings, as needed. Our strategy will involve funding our short-term liquidity requirements with borrowings under our Revolving Credit Facility and funding our long-term financing needs, while maintaining a prudent capital structure, among the following alternatives: operating leases, bank debt, private and public debt, and equity offerings.
73
We believe we have substantial advantages to enhance our competitiveness in an extended downturn, including:
• | A modern fleet that allows for deferral of new aircraft deliveries, reducing capital expenditure needs without compromising safety or client service, |
• | A strong balance sheet that gives us full access to capital markets to capitalize on organic and merger and acquisition opportunities, and |
• | A mostly owned fleet of aircraft that gives us critical optionality to sell aircraft or decline renewal options and return leased aircraft. |
Critical Accounting Policies and Estimates
See Item 7. “Management’s Discussion and Analysis of Financial Condition and Results of Operations — Critical Accounting Policies and Estimates” in the fiscal year 2015 Annual Report for a discussion of our critical accounting policies. There have been no material changes to our critical accounting policies and estimates provided in the fiscal year 2015 Annual Report.
Recent Accounting Pronouncements
See Note 1 in the “Notes to Condensed Consolidated Financial Statements” included elsewhere in this Quarterly Report for a discussion of recent accounting pronouncements.
Item 3. Quantitative and Qualitative Disclosures about Market Risk.
We are subject to certain market risks arising from the use of financial instruments in the ordinary course of business. This risk arises primarily as a result of potential changes in the fair market value of financial instruments that would result from adverse fluctuations in foreign currency exchange rates, credit risk, and interest rates as discussed in “Item 7A. Quantitative and Qualitative Disclosures About Market Risk” in the fiscal year 2015 Annual Report and Note 1 in the “Notes to Condensed Consolidated Financial Statements” included elsewhere in this Quarterly Report.
Item 4. Controls and Procedures.
Evaluation of Disclosure Controls and Procedures
We carried out an evaluation, under the supervision of and with the participation of our management, including Jonathan E. Baliff, our President and Chief Executive Officer (“CEO”), and L. Don Miller, our Senior Vice President and Chief Financial Officer (“CFO”), of the effectiveness of the Company’s disclosure controls and procedures (as defined in Rule 13a-15(e) of the Exchange Act) as of September 30, 2015. Based on that evaluation, our CEO and CFO concluded that such disclosure controls and procedures were effective to ensure that information required to be disclosed in our periodic reports filed under the Exchange Act is recorded, processed, summarized and reported within the time periods specified by the Securities and Exchange Commission’s rules and forms and such information is accumulated and communicated to our management as appropriate to allow for timely decisions regarding required disclosure under the Exchange Act.
Changes in Internal Control Over Financial Reporting
There have been no changes in our internal control over financial reporting during the quarter ended September 30, 2015 that have materially affected or are reasonably likely to materially affect our internal control over financial reporting.
74
PART II — OTHER INFORMATION
Item 1. Legal Proceedings.
We have certain actions or claims pending that have been discussed and previously reported in Part I. Item 3. “Legal Proceedings” in the fiscal year 2015 Annual Report. Developments in these previously reported matters, if any, are described in Note 5 in the “Notes to Condensed Consolidated Financial Statements” included elsewhere in this Quarterly Report.
Item 1A. Risk Factors.
There have been no material changes during the three months ended September 30, 2015 in our “Risk Factors” as discussed in the fiscal year 2015 Annual Report and our Quarterly Report Form 10-Q for the quarter ended June 30, 2015.
Item 2. Unregistered Sales of Equity Securities and Use of Proceeds and Issuer Repurchases of Equity Securities
Period | Total Number of Shares Purchased | Average Price Paid Per Share | Total Number of Shares Purchased as Part of Publicly Announced Program (1) | Maximum Number (or Approximate Dollar Value) of Shares That May Yet Be Purchased Under the Plans or Programs (1) | ||||||||||
July 1, 2015 - September 30, 2015 | — | $ | — | — | $ | 125,000,047 | ||||||||
______________
(1) | On November 6, 2014, we announced that our board of directors had extended the date to repurchase shares of our Common Stock through November 5, 2015 and increased the authorized repurchase amount to $150 million. As of October 30, 2015, we had $125.0 million of repurchase authority remaining from the $150.0 million that was authorized for share repurchases between November 6, 2014 and November 5, 2015. On November 5, 2015, our board of directors extended the date to repurchase shares of our Common Stock through November 4, 2016 with a remaining authorized repurchase amount of $150.0 million. The timing and method of any repurchases under the program will depend on a variety of factors, is subject to our results of operations, financial condition, cash requirements, and other factors and restrictions under applicable law and our debt agreements, and may be suspended or discontinued at any time. |
Item 3. Defaults Upon Senior Securities
Not applicable.
Item 4. Mine Safety Disclosures
Not applicable.
Item 5. Other Information
None.
75
Item 6. Exhibits
The following exhibits are filed as part of this Quarterly Report:
Exhibit Number | Description of Exhibit | |
10.1 | Sixth Amendment to Amended and Restated Revolving Credit and Term Loan Agreement, dated September 29, 2015. | |
15.1* | Letter from KPMG LLP dated November 5, 2015, regarding unaudited interim information. | |
31.1** | Rule 13a-14(a) Certification by Chief Executive Officer of Registrant. | |
31.2** | Rule 13a-14(a) Certification by Chief Financial Officer of Registrant | |
32.1** | Certification of Chief Executive Officer of Registrant pursuant to 18 U.S.C. Section 1350, as adopted pursuant to Section 906 of the Sarbanes-Oxley Act of 2002. | |
32.2** | Certification of Chief Financial Officer of Registrant pursuant to 18 U.S.C. Section 1350, as adopted pursuant to Section 906 of the Sarbanes-Oxley Act of 2002. | |
101.INS | XBRL Instance Document. | |
101.SCH | XBRL Taxonomy Extension Schema Document. | |
101.CAL | XBRL Taxonomy Extension Calculation Linkbase Document. | |
101.DEF | XBRL Taxonomy Extension Definition Linkbase Document. | |
101.LAB | XBRL Taxonomy Extension Labels Linkbase Document. | |
101.PRE | XBRL Taxonomy Extension Presentation Linkbase Document. | |
* | Filed herewith. | |
** | Furnished herewith. | |
76
SIGNATURES
Pursuant to the requirements of the Securities Exchange Act of 1934, the registrant has duly caused this report to be signed on its behalf by the undersigned thereunto duly authorized.
BRISTOW GROUP INC. | ||
By: | /s/ L. Don Miller | |
L. Don Miller Senior Vice President and Chief Financial Officer | ||
By: | /s/ Brian J. Allman | |
Brian J. Allman Vice President, Chief Accounting Officer | ||
November 5, 2015
77