Attached files
| file | filename |
|---|---|
| EX-10.18 - EXHIBIT 10.18 - SIRIUS XM HOLDINGS INC. | siri-20141231xex1018.htm |
| EXCEL - IDEA: XBRL DOCUMENT - SIRIUS XM HOLDINGS INC. | Financial_Report.xls |
| EX-31.1 - EXHIBIT 31.1 - SIRIUS XM HOLDINGS INC. | siri-20141231xex311.htm |
| EX-32.2 - EXHIBIT 32.2 - SIRIUS XM HOLDINGS INC. | siri-20141231xex322.htm |
| EX-32.1 - EXHIBIT 32.1 - SIRIUS XM HOLDINGS INC. | siri-20141231xex321.htm |
| EX-23.1 - EXHIBIT 23.1 - SIRIUS XM HOLDINGS INC. | siri-20141231xex231.htm |
| EX-31.2 - EXHIBIT 31.2 - SIRIUS XM HOLDINGS INC. | siri-20141231xex312.htm |
| EX-10.20 - EXHIBIT 10.20 - SIRIUS XM HOLDINGS INC. | siri-20141231xex1020.htm |
| EX-21.1 - EXHIBIT 21.1 - SIRIUS XM HOLDINGS INC. | siri-20141231xex211.htm |
UNITED STATES
SECURITIES AND EXCHANGE COMMISSION
WASHINGTON, D.C. 20549
FORM 10-K
þ | ANNUAL REPORT PURSUANT TO SECTION 13 OR 15(d) OF THE SECURITIES EXCHANGE ACT OF 1934 | |
FOR THE FISCAL YEAR ENDED DECEMBER 31, 2014 | ||
OR
o | TRANSITION REPORT PURSUANT TO SECTION 13 OR 15(d) OF THE SECURITIES EXCHANGE ACT OF 1934 | |
FOR THE TRANSITION PERIOD FROM __________ TO ________ | ||
COMMISSION FILE NUMBER 001-34295
SIRIUS XM HOLDINGS INC.
(Exact name of registrant as specified in its charter)
Delaware | 38-3916511 | |
(State or other jurisdiction of incorporation or organization) | (I.R.S. Employer Identification Number) | |
1221 Avenue of the Americas, 36th Floor | ||
New York, New York | 10020 | |
(Address of principal executive offices) | (Zip Code) | |
Securities registered pursuant to Section 12(b) of the Act:
Title of Each Class: | Name of Each Exchange on Which Registered: | |
Common Stock, par value $0.001 per share | The Nasdaq Global Select Market | |
Securities registered pursuant to Section 12(g) of the Act:
None
(Title of class)
Indicate by check mark if the registrant is a well-known seasoned issuer, as defined in Rule 405 of the Securities Act. Yes þ No o
Indicate by check mark if the registrant is not required to file reports pursuant to Section 13 or 15(d) of the Act. Yes o No þ
Indicate by check mark whether the registrant (1) has filed all reports required to be filed by Section 13 or 15(d) of the Securities Exchange Act of 1934 during the preceding 12 months (or for such shorter period that the registrant was required to file such reports) and (2) has been subject to such filing requirements for the past 90 days. Yes þ No o
Indicate by check mark whether the registrant has submitted electronically and posted on its corporate Web site, if any, every Interactive Data File required to be submitted and posted pursuant to Rule 405 of Regulation S-T during the preceding 12 months (or for such shorter period that the registrant was required to submit and post such files). Yes þ No o
Indicate by check mark if disclosure of delinquent filers pursuant to Item 405 of Regulation S-K is not contained herein, and will not be contained, to the best of the registrant's knowledge, in definitive proxy or information statements incorporated by reference in Part III of this Form 10-K or any amendment to this Form 10-K. þ
Indicate by check mark whether the registrant is a large accelerated filer, an accelerated filer, a non-accelerated filer, or a smaller reporting company. See the definitions of “large accelerated filer,” “accelerated filer” and “smaller reporting company” in Rule 12b-2 of the Exchange Act.
Large accelerated filer þ | Accelerated filer o | Non-accelerated filer o | Smaller reporting company o | |||
(Do not check if a smaller reporting company) | ||||||
Indicate by check mark whether the registrant is a shell company (as defined in Rule 12b-2 of the Act). Yes o No þ
The aggregate market value of the registrant’s common stock held by non-affiliates as of June 30, 2014 was $8,827,437,630. All executive officers and directors of the registrant have been deemed, solely for the purpose of the foregoing calculation, to be “affiliates” of the registrant.
The number of shares of the registrant’s common stock outstanding as of February 3, 2015 was 5,581,438,748.
DOCUMENTS INCORPORATED BY REFERENCE
Information included in our definitive proxy statement for our 2015 annual meeting of stockholders scheduled to be held on Tuesday, May 19, 2015 is incorporated by reference in Items 10, 11, 12, 13 and 14 of Part III of this report.
SIRIUS XM HOLDINGS INC. AND SUBSIDIARIES
2014 FORM 10-K ANNUAL REPORT
TABLE OF CONTENTS
Item No. | Description | ||
PART I
ITEM 1. BUSINESS
This Annual Report on Form 10-K presents information for Sirius XM Holdings Inc. (“Holdings”). The terms “we,” “us,” “our,” and “our company” as used herein and unless otherwise stated or indicated by context, refer to Sirius XM Radio Inc. (“Sirius XM”) and its subsidiaries prior to the corporate reorganization described below and to Holdings and its subsidiaries after such corporate reorganization.
Sirius XM Holdings Inc.
Effective November 15, 2013, we completed a corporate reorganization. As part of the reorganization, Holdings replaced Sirius XM as our publicly held corporation and Sirius XM became a wholly-owned subsidiary of Holdings. Holdings was incorporated in the State of Delaware on May 21, 2013. Holdings has no operations independent of its subsidiary Sirius XM.
Relationship with Liberty Media
Liberty Media Corporation ("Liberty Media") beneficially owns, directly and indirectly, over 50% of the outstanding shares of our common stock. Liberty Media owns interests in a range of media, communications and entertainment businesses.
Sirius XM Radio Inc.
We broadcast music, sports, entertainment, comedy, talk, news, traffic and weather channels, as well as infotainment services, in the United States on a subscription fee basis through our two proprietary satellite radio systems. Subscribers can also receive music and other channels, plus features such as SiriusXM On Demand and MySXM, over our Internet radio service, including through applications for mobile devices.
As of December 31, 2014, we had 27,311,087 subscribers. Our subscribers include:
• | subscribers under our regular and discounted pricing plans; |
• | subscribers that have prepaid, including payments made or due from automakers for subscriptions included in the sale or lease price of a vehicle; |
• | subscribers to our Internet services who do not also have satellite radio subscriptions; and |
• | certain subscribers to our weather, traffic, data and Backseat TV services who do not also have satellite radio subscriptions. |
Our primary source of revenue is subscription fees, with most of our customers subscribing on an annual, semi-annual, quarterly or monthly basis. We offer discounts for prepaid and longer term subscription plans as well as discounts for multiple subscriptions. We also derive revenue from activation and other fees, the sale of advertising on select non-music channels, the direct sale of satellite radios and accessories, and other ancillary services, such as our weather, traffic, data and Backseat TV services.
Our satellite radios are primarily distributed through automakers; retail stores nationwide; and through our website. We have agreements with every major automaker to offer satellite radios in their vehicles. Satellite radio services are also offered to customers of certain rental car companies.
We are also a leader in providing connected vehicle applications and services. Our connected vehicle services are designed to enhance the safety, security and driving experience for vehicle operators while providing marketing and operational benefits to automakers and their dealers. Subscribers to our connected vehicle services are not included in our subscriber count or subscriber-based operating metrics.
1
Programming
We offer a dynamic programming lineup of commercial-free music plus sports, entertainment, comedy, talk, news, traffic and weather, including:
• | an extensive selection of music genres, ranging from rock, pop and hip-hop to country, dance, jazz, Latin and classical; |
• | live play-by-play sports from major leagues and colleges; |
• | a multitude of talk and entertainment channels for a variety of audiences; |
• | a wide range of national, international and financial news; and |
• | local traffic and weather reports for 21 metropolitan markets throughout the United States. |
Our diverse spectrum of programming, including our lineup of exclusive material, is a significant differentiator from terrestrial radio and other audio entertainment providers. We make changes to our programming lineup from time to time as we strive to attract new subscribers and offer content which appeals to a broad range of audiences and to our existing subscribers. The channel line-ups for our services are available at siriusxm.com.
Internet Radio Service
We stream select music and non-music channels over the Internet. Our Internet radio service also includes channels and features that are not available on our satellite radio service. Access to our Internet radio service is offered to subscribers for a fee. We also offer applications to allow consumers to access our Internet radio service on smartphones and tablet computers.
We offer two innovative Internet-based products, SiriusXM On Demand and MySXM. SiriusXM On Demand offers our Internet radio subscribers listening on our online media player and on smartphones the ability to choose their favorite episodes from a catalog of content to listen to whenever they want. MySXM permits subscribers listening on our Internet radio service to personalize our existing commercial-free music and comedy channels to create a more tailored listening experience. Channel-specific sliders allow users to create over 100 variations of each of more than 50 channels by adjusting characteristics like library depth, familiarity, music style, tempo, region, and multiple other channel-specific attributes. SiriusXM On Demand and MySXM are offered to our Internet radio subscribers at no extra charge.
We are re-engineering and redesigning our Internet radio streaming platform. The new SiriusXM Internet Radio will offer listeners enhanced programming discovery and the ability to connect with content currently playing across our commercial-free music, sports, comedy, news, talk and entertainment channels or available through SiriusXM On Demand. The new platform is expected to be progressively rolled out starting in the first quarter of 2015.
Distribution of Radios
Automakers
We distribute satellite radios through the sale and lease of new vehicles. We have agreements with every major automaker to offer satellite radios in their vehicles. Satellite radios are available as a factory or dealer-installed option in substantially all vehicle makes sold in the United States.
Most automakers include a subscription to our radio service in the sale or lease of their new vehicles. In certain cases, we receive subscription payments from automakers in advance of the activation of our service. We share with certain automakers a portion of the revenues we derive from subscribers using vehicles equipped to receive our service. We also reimburse various automakers for certain costs associated with the satellite radios installed in new vehicles, including in certain cases hardware costs, engineering expenses and promotional and advertising expenses.
Previously Owned Vehicles
We acquire subscribers through the sale and lease of previously owned vehicles with factory-installed satellite radios. We have entered into agreements with many automakers to market subscriptions to purchasers and lessees of vehicles which include satellite radios sold through their certified pre-owned programs. We also work directly with franchise and independent dealers on programs for non-certified vehicles.
We have developed systems and methods to identify purchasers and lessees of previously owned vehicles which include satellite radios and have established marketing plans to promote our services to these potential subscribers.
2
Retail
We sell satellite and Internet radios directly to consumers through our website. Satellite and Internet radios are also marketed and distributed through national and regional retailers.
Our Satellite Radio Systems
Our satellite radio systems are designed to provide clear reception in most areas despite variations in terrain, buildings and other obstructions. We continually monitor our infrastructure and regularly evaluate improvements in technology.
Our satellite radio systems have three principal components:
• | satellites, terrestrial repeaters and other satellite facilities; |
• | studios; and |
• | radios. |
Satellites, Terrestrial Repeaters and Other Satellite Facilities
Satellites. We own a fleet of nine orbiting satellites, five in the Sirius system, FM-1, FM-2, FM-3, FM-5 and FM-6, and four in the XM system, XM-1, XM-3, XM-4 and XM-5. Two of these satellites, FM-6 and XM-5, are currently used as spares. In 2014, we de-orbited a satellite, XM-2, that reached the end of its operational life. In 2015, we will de-orbit XM-1, a satellite that has also reached the end of its operational life.
Satellite Insurance. We hold in-orbit insurance for our XM-5 satellite which will expire in 2015. We do not intend to renew this in-orbit insurance policy when it expires, as we consider the premium costs to be uneconomical relative to the risk of satellite failure. The policy provides coverage for a total, constructive total or partial loss of the satellite that occurs prior to its expiration in October 2015. The insurance does not cover the full cost of constructing, launching and insuring a new satellite, nor will it protect us from any adverse effect on business operations due to the loss of the satellite. The policy contains standard commercial satellite insurance provisions, including coverage exclusions. In-orbit insurance for our FM-5 and FM-6 satellites expired in 2014.
Terrestrial Repeaters. In some areas with high concentrations of tall buildings, such as urban centers, signals from our satellites may be blocked and reception of satellite signals can be adversely affected. In many of these areas, we have deployed terrestrial repeaters to supplement satellite coverage. We operate over 700 terrestrial repeaters as part of our systems across the United States.
Other Satellite Facilities. We control and communicate with our satellites from facilities in North America and maintain earth stations in Panama and Ecuador to control and communicate with several of our Sirius satellites. Our satellites are monitored, tracked and controlled by a third party satellite operator.
Studios
Our programming originates from studios in New York City and Washington D.C. and, to a lesser extent, from smaller studios in Los Angeles, Nashville and a variety of smaller venues across the country. Our corporate headquarters is based in our New York City office. Both our New York City and Washington D.C. offices house facilities for programming origination, programming personnel and facilities to transmit programming.
Radios
Radios are manufactured in three principal configurations - as in-dash radios, dock & play radios and commercial units.
We do not manufacture radios. We have authorized manufacturers and distributors to produce and distribute radios, and have licensed our technology to various electronics manufacturers to develop, manufacture and distribute radios under certain brands. We do manage various aspects of the production of satellite and Internet radios. To facilitate the sale of radios, we may subsidize a portion of the radio manufacturing costs to reduce the hardware price to consumers.
Connected Vehicle Services
We are a leader in providing connected vehicle services. Our connected vehicle services are designed to enhance the safety, security and driving experience for vehicle operators while providing marketing and operational benefits to automakers and their dealers. We offer a portfolio of location-based services through two-way wireless connectivity, including safety,
3
security, convenience, maintenance and data services, remote vehicles diagnostics, stolen or parked vehicle locator services, and monitoring of vehicle emission systems. Our connected vehicle business provides services to several automakers, including Acura, BMW, Honda, Hyundai, Infiniti, Lexus, Nissan and Toyota.
Subscribers to our connected vehicle services are not included in our subscriber count or subscriber-based operating metrics.
Canada
We own approximately 37% of the equity of Sirius XM Canada Holdings Inc. ("Sirius XM Canada"), the satellite radio provider in Canada. Subscribers to the services offered by Sirius XM Canada are not included in our subscriber count.
Other Services
Commercial Accounts. Our programming is available for commercial establishments. Commercial subscription accounts are available through providers of in-store entertainment solutions and directly from us. Certain commercial subscribers are included in our subscriber count.
Satellite Television Service. Certain of our music channels are offered as part of certain programming packages on the DISH Network satellite television service. Subscribers to the DISH Network satellite television service are not included in our subscriber count.
Subscribers to the following services are not included in our subscriber count, unless the applicable service is purchased by the subscriber separately and not as part of a radio subscription to our services:
Travel Link. We offer Travel Link, a suite of data services that includes graphical weather, fuel prices, sports schedules and scores and movie listings.
Real-Time Traffic Services. We offer services that provide graphic information as to road closings, traffic flow and incident data to consumers with compatible in-vehicle navigation systems.
Real-Time Weather Services. We offer several real-time weather services designed for improving situational awareness in vehicle, marine and/or aviation use.
Backseat TV. We offer Backseat TV, a service offering television content designed primarily for children, in the backseat of vehicles. We intend to discontinue this service by the end of 2015.
Competition
Satellite Radio
We face significant competition for both listeners and advertisers in our satellite radio business, including providers of radio or other audio services. Our digital competitors are making in-roads into vehicles, where we are currently the prominent alternative to traditional AM/FM radio.
Traditional AM/FM Radio. Our services compete with traditional AM/FM radio. Several traditional radio companies are substantial entities owning large numbers of radio stations or other media properties. The radio broadcasting industry is highly competitive.
Traditional AM/FM radio has a well-established demand for its services and offers free broadcasts paid for by commercial advertising rather than by subscription fees. Many radio stations offer information programming of a local nature, such as local news and sports. The availability of traditional free AM/FM radio reduces the likelihood that customers would be willing to pay for our subscription services and, by offering free broadcasts, it may impose limits on what we can charge for our services.
HD Radio. Many radio stations broadcast digital signals, which have clarity similar to our signals. These stations do not charge a subscription fee for their digital signals but generally do carry advertising. Traditional AM/FM broadcasters are also complementing their HD Radio efforts by aggressively pursuing Internet radio, wireless Internet-based distribution arrangements and data services.
4
Internet Radio and Internet-Enabled Smartphones. Internet radio services often have no geographic limitations and provide listeners with radio programming from across the country and around the world. Major media companies and online providers, including Beats Music, Google Play, Pandora and iHeartRadio, make high fidelity digital streams available through the Internet for free or, in some cases, for a fraction of the cost of a satellite radio subscription. These services compete directly with our services, at home, in vehicles, and wherever audio entertainment is consumed.
Smartphones, most of which have the capability of interfacing with vehicles, can play recorded or cached content and access Internet radio via dedicated applications or browsers. These applications are often free to the user and offer music and talk content. Leading audio smartphone radio applications include Pandora, Spotify, iTunes Radio and iHeartRadio. Certain of these applications also include advanced functionality, such as personalization, and allow the user to access large libraries of content. These services are increasingly becoming integrated into vehicles.
Advanced In-Dash Infotainment Systems. Nearly all automakers have deployed or are planning to deploy integrated multimedia systems in dashboards, such as Ford's SYNC, Toyota's Entune, and BMW/Mini's Connected. These systems combine control of audio entertainment from a variety of sources, including AM/FM/HD radio broadcasts, satellite radio, Internet radio, smartphone applications and stored audio, with navigation and other advanced applications such as restaurant bookings, movie show times and financial information. Internet radio and other data are typically connected to the system via a bluetooth link to an Internet-enabled smartphone, and the entire system may be controlled by touchscreen or voice recognition. These systems enhance the attractiveness of Internet-based competitors by making such applications more prominent, easier to access, and safer to use in the car. Similar systems are also available in the aftermarket and sold through retailers.
Direct Broadcast Satellite and Cable Audio. A number of providers offer specialized audio services through either direct broadcast satellite or cable audio systems. These services are targeted to fixed locations, mostly in-home. The radio service offered by direct broadcast satellite and cable audio is often included as part of a package of digital services with video service, and video customers generally do not pay an additional monthly charge for the audio service.
Other Digital Media Services. The audio entertainment marketplace continues to evolve rapidly, with a steady emergence of new media platforms and portable devices that compete with our services now or that could compete with those services in the future.
Traffic News Services
A number of providers compete with our traffic news services. In-dash navigation is also being threatened by increasingly capable smartphones that provide data services through a direct vehicle interface. Most of these smartphones offer GPS mapping, often with turn-by-turn navigation.
Connected Vehicle Services
Our connected vehicle services business operates in a highly competitive environment and competes with several providers, including Verizon Telematics. OnStar, a division of General Motors, also offers connected vehicle services in GM vehicles. We also compete with wireless devices such as mobile phones, carriers of mobile communications and, to a lesser extent, with systems developed internally by automakers. We compete against other connected vehicle service providers for automaker arrangements on the basis of service quality and reliability, technical capabilities and systems customization, scope of service, industry experience, past performance and price.
Government Regulation
As operators of a privately-owned satellite system, we are regulated by the FCC under the Communications Act of 1934, principally with respect to:
• | the licensing of our satellite systems; |
• | preventing interference with or to other users of radio frequencies; and |
• | compliance with FCC rules established specifically for U.S. satellites and satellite radio services. |
Any assignment or transfer of control of our FCC licenses must be approved by the FCC. The FCC's order approving the merger of our wholly-owned subsidiary, Vernon Merger Corporation, with and into XM Satellite Radio Holdings Inc. in July 2008 (the “Merger”) requires us to comply with certain voluntary commitments we made as part of the FCC Merger proceeding. We believe we comply with those commitments.
In 1997, we were the winning bidders for FCC licenses to operate a satellite digital audio radio service and provide other ancillary services. Our FCC licenses for our Sirius satellites expire in 2017 and 2022. Our FCC licenses for our XM
5
satellites expire in 2018, 2021 and 2022. XM-1 is operating under Special Temporary Authority from the FCC and we plan to de-orbit the satellite in 2015. We anticipate that, absent significant misconduct on our part, the FCC will renew our licenses to permit operation of our satellites for their useful lives, and grant licenses for any replacement satellites.
In some areas with high concentrations of tall buildings, such as urban centers, signals from our satellites may be blocked and reception can be adversely affected. In many of these areas, we have installed terrestrial repeaters to supplement our satellite signal coverage. The FCC has established rules governing terrestrial repeaters and has granted us a license through 2027 to operate our repeater network.
In many cases, we obtain FCC certifications for satellite radios, including satellite radios that include FM modulators. We believe our radios that are in production comply with all applicable FCC rules.
We are required to obtain export licenses from the United States government to export certain ground control equipment, satellite communications/control services and technical data related to our satellites and their operations. The delivery of such equipment, services and technical data to destinations outside the United States and to foreign persons is subject to strict export control and prior approval requirements from the United States government (including prohibitions on the sharing of certain satellite-related goods and services with China).
Changes in law or regulations relating to communications policy or to matters affecting our services could adversely affect our ability to retain our FCC licenses or the manner in which we operate.
Copyrights to Programming
In connection with our satellite radio music programming, we must negotiate and enter into royalty arrangements with two sets of rights holders: Holders of copyrights in musical works (that is, the music and lyrics) and holders of copyrights in sound recordings (that is, the actual recording of a work).
Musical works rights holders, generally songwriters and music publishers, have been traditionally represented by performing rights organizations such as the American Society of Composers, Authors and Publishers (“ASCAP”), Broadcast Music, Inc. (“BMI”) and SESAC, Inc. (“SESAC”). These organizations negotiate fees with copyright users, collect royalties and distribute them to the rights holders. We have arrangements with all of these organizations.
Sound recording rights holders, typically large record companies, are primarily represented by SoundExchange, an organization which negotiates licenses, and collects and distributes royalties on behalf of record companies and performing artists. Under the Digital Performance Right in Sound Recordings Act of 1995 and the Digital Millennium Copyright Act of 1998, we may negotiate royalty arrangements with the owners of sound recordings fixed after February 15, 1972, or if negotiation is unsuccessful, the royalty rate is established by the Copyright Royalty Board (the “CRB”) of the Library of Congress.
The CRB has issued its determination regarding the royalty rate payable by us under the statutory license covering the performance of sound recordings fixed after February 15, 1972 over our satellite digital audio radio service, and the making of ephemeral (server) copies in support of such performances, for the five-year period ending on December 31, 2017. Under the terms of the CRB's decision, we will pay a royalty based on gross revenues, subject to certain exclusions, of 10.0% for 2015, 10.5% for 2016, and 11% for 2017. The rate for 2014 was 9.5%.
The revenue subject to royalty includes subscription revenue from our U.S. satellite digital audio radio subscribers and advertising revenue from channels other than those channels that make only incidental performances of sound recordings. Exclusions from revenue subject to the statutory license fee include, among other things, revenue from channels, programming and products or other services offered for a separate charge where such channels make only incidental performances of sound recordings; revenue from equipment sales; revenue from current and future data services (including video and connected vehicle services) offered for a separate charge; intellectual property royalties received by us; credit card, invoice and fulfillment service fees; and bad debt expense. The regulations also allow us to further reduce our monthly royalty fee in proportion to the percentage of our performances that feature pre-1972 recordings (which are not subject to federal copyright protection) as well as those that are licensed directly from the copyright holder, rather than through the statutory license.
To secure the rights to stream music content over the Internet, including to mobile devices, we also must obtain licenses from, and pay royalties to, copyright owners of musical compositions and, in certain cases, sound recordings. We have arrangements with ASCAP, SESAC and BMI to license the musical compositions we stream over the Internet. The licensing of certain sound recordings fixed after February 15, 1972 for use on the Internet is also subject to the Digital Performance Right in Sound Recordings Act of 1995 and the Digital Millennium Copyright Act of 1998 on terms established by the CRB. In 2014, we paid a per performance rate for the streaming of certain sound recordings on the Internet of $0.00220 per play, which rate
6
changed to $0.00240 in 2015. We are participating in proceedings to establish rates for the streaming of certain sound recordings fixed after February 15, 1972 on the Internet after 2015, known as the Web IV proceeding.
Our rights to perform certain copyrighted sound recordings (that is, the actual recording of a work) that were fixed after February 15, 1972 are governed by United States federal law, the Copyright Act. In contrast, our rights to perform certain copyrighted sound recordings that were fixed before February 15, 1972 are governed by various state statutes and common law principles and are subject to litigation in three States. See "Item 3. Legal Proceedings" below.
Trademarks
We have registered, and intend to maintain, the trademarks “Sirius”, “XM”, “SiriusXM” and “SXM” with the United States Patent and Trademark Office in connection with the services we offer. We are not aware of any material claims of infringement or other challenges to our right to use the “Sirius”, “XM”, “SiriusXM” or "SXM” trademarks in the United States. We also have registered, and intend to maintain, trademarks for the names of certain of our channels. We have also registered the trademarks “Sirius”, “XM” and "SiriusXM" in Canada. We have granted a license to use certain of our trademarks in Canada to Sirius XM Canada.
Personnel
As of December 31, 2014, we had 2,327 full-time employees. In addition, we rely upon a number of part-time employees, consultants, other advisors and outsourced relationships. None of our employees are represented by a labor union, and we believe that our employee relations are good.
Corporate Information and Available Information
Our executive offices are located at 1221 Avenue of the Americas, 36th floor, New York, New York 10020 and our telephone number is (212) 584-5100. Our internet address is www.siriusxm.com. Our annual, quarterly and current reports, and any amendments to those reports, filed or furnished pursuant to Section 13(a) or 15(d) of the Securities Exchange Act of 1934, as amended (the "Exchange Act"), may be accessed free of charge through our website after we have electronically filed or furnished such material with the SEC. Siriusxm.com (including any other reference to such address in this Annual Report) is an inactive textual reference only, meaning that the information contained on or accessible from the website is not part of this Annual Report on Form 10-K and is not incorporated in this report by reference.
Executive Officers of the Registrant
Certain information regarding our executive officers as of February 3, 2015 is provided below:
Name | Age | Position |
James E. Meyer | 60 | Chief Executive Officer |
Scott A. Greenstein | 55 | President and Chief Content Officer |
Dara F. Altman | 56 | Executive Vice President and Chief Administrative Officer |
Stephen Cook | 59 | Executive Vice President, Sales and Automotive |
Patrick L. Donnelly | 53 | Executive Vice President, General Counsel and Secretary |
David J. Frear | 58 | Executive Vice President and Chief Financial Officer |
Enrique Rodriguez | 52 | Executive Vice President, Operations and Products |
Katherine Kohler Thomson | 48 | Executive Vice President, Chief Marketing Officer |
James E. Meyer has served as our Chief Executive Officer since December 2012. From May 2004 to December 2012, Mr. Meyer was our President, Operations and Sales. Prior to May 2004, Mr. Meyer was President of Aegis Ventures Incorporated, a consulting firm that provides general management services. From December 2001 until 2002, Mr. Meyer served as special advisor to the Chairman of Thomson S.A., a leading consumer electronics company. From January 1997 until December 2001, Mr. Meyer served as the Senior Executive Vice President for Thomson as well as a member of the executive committee. From 1992 until 1996, Mr. Meyer served as Thomson's Senior Vice President of Product Management. Mr. Meyer is a director of ROVI Corporation.
Scott A. Greenstein has served as our President and Chief Content Officer since May 2004. Prior to May 2004, Mr. Greenstein was Chief Executive Officer of The Greenstein Group, a media and entertainment consulting firm. From 1999 until 2002, he was Chairman of USA Films, a motion picture production, marketing and distribution company. From 1997 until 1999, Mr. Greenstein was Co-President of October Films, a motion picture production, marketing and distribution company.
7
Prior to joining October Films, Mr. Greenstein was Senior Vice President of Motion Pictures, Music, New Media and Publishing at Miramax Films, and held senior positions at Viacom Inc.
Dara F. Altman has served as our Executive Vice President and Chief Administrative Officer since September 2008. From January 2006 until September 2008, Ms. Altman served as Executive Vice President, Business and Legal Affairs, of XM. Ms. Altman was Executive Vice President of Business Affairs for Discovery Communications from 1997 to 2005. From 1993 to 1997, Ms. Altman served as Senior Vice President and General Counsel of Reiss Media Enterprises, which owned Request TV, a national pay-per-view service. Before Request TV, Ms. Altman served as counsel for Home Box Office. Ms. Altman started her career as an attorney at the law firm of Willkie Farr & Gallagher LLP.
Stephen Cook has served as our Executive Vice President, Sales and Automotive, since January 2013. Mr. Cook served as our Group Vice President and General Manager, Automotive Division, from July 2008 until January 2013. Mr. Cook served as Executive Vice President, Automotive, of XM from July 2006 to July 2008. He also served as XM's Executive Vice President, Sales and Marketing, from January 2002 until July 2006, and as XM's Senior Vice President, Sales and Marketing, from February 1999 until January 2002. Prior to joining XM, Mr. Cook was Chief Operating Officer for Conxus Communications. From 1990 to 1997, Mr. Cook held management positions with GTE's cellular operations. Prior to that time, Mr. Cook worked in brand management for Procter & Gamble.
Patrick L. Donnelly has served as our Executive Vice President, General Counsel and Secretary, since May 1998. From June 1997 to May 1998, he was Vice President and Deputy General Counsel of ITT Corporation, a hotel, gaming and entertainment company that was acquired by Starwood Hotels & Resorts Worldwide, Inc. in February 1998. From October 1995 to June 1997, he was assistant general counsel of ITT Corporation. Prior to October 1995, Mr. Donnelly was an attorney at the law firm of Simpson Thacher & Bartlett LLP.
David J. Frear has served as our Executive Vice President and Chief Financial Officer since June 2003. From 1999 to 2003, Mr. Frear was Executive Vice President and Chief Financial Officer of Savvis Communications Corporation, a global managed service provider, delivering internet protocol applications for business customers. Mr. Frear also served as a director of Savvis. From 1993 to 1998, Mr. Frear was Senior Vice President and Chief Financial Officer of Orion Network Systems Inc., an international satellite communications company that was acquired by Loral Space & Communications Ltd. in 1998. From 1990 to 1993, Mr. Frear was Chief Financial Officer of Millicom Incorporated, a cellular, paging and cable television company. Prior to joining Millicom, he was an investment banker at Bear, Stearns & Co., Inc. and Credit Suisse.
Enrique Rodriguez has served as our Executive Vice President, Operations and Products, since January 2013. He served as our Group Vice President from October 2012 until January 2013. Mr. Rodriguez was the Senior Vice President and General Manager of Cisco System Inc.'s Service Provider Video Technology Group from May 2010 until December 2011. Mr. Rodriguez served as Corporate Vice President for the TV Division of Microsoft Corp. from June 2006 until April 2010. Prior to heading Microsoft's TV Division, Mr. Rodriguez served as Vice President of Xbox Partnerships for Microsoft. Before joining Microsoft in 2003, Rodriguez spent over 20 years at Thomson/RCA in a variety of engineering and executive roles.
Katherine Kohler Thomson has served as our Executive Vice President, Chief Marketing Officer, since December 2013. Ms. Thomson was the President and Chief Operating Officer of the Los Angeles Times Media Group from May 2011 until November 2013. She was also the Chief Operating Officer of Tribune Publishing Company, Inc. from April 2013 until November 2013. Ms. Thomson served as Vice President, Business Operations of FLO TV, a division of Qualcomm Incorporated that delivered live television to mobile devices, from September 2009 until May 2011. From September 2008 through September 2009, she was Executive Vice President and Chief of Staff at the Los Angeles Times Media Group. She joined the Los Angeles Times Media Group from Energy Innovations, an affordable solar energy provider, where she was Chief Operating Officer from August 2007 until September 2008. Prior to that time, she spent fourteen years in a variety of positions at DIRECTV, culminating in the role of Senior Vice President, Sales and Marketing Operations.
8
ITEM 1A. | RISK FACTORS |
In addition to the other information in this Annual Report on Form 10-K, including the information under the caption Item 1. Business “Competition,” the following risk factors should be considered carefully in evaluating us and our business. This Annual Report on Form 10-K contains forward-looking statements within the meaning of the Private Securities Litigation Reform Act of 1995. Actual results and the timing of events could differ materially from those projected in forward-looking statements due to a number of factors, including those set forth below and elsewhere in this Annual Report on Form 10-K. See “Special Note Regarding Forward-Looking Statements” following this Item 1A. Risk Factors.
We face substantial competition and that competition is likely to increase over time.
We face substantial competition from other providers of radio and other audio services. Our ability to retain and attract subscribers depends on our success in creating and providing popular or unique music, entertainment, news and sports programming. Our subscribers can obtain certain similar content for free through terrestrial radio stations or Internet radio services. Audio content delivered via the Internet, including through mobile devices in vehicles, is increasingly competitive with our services. A summary of various services that compete with us is contained in the section entitled “Item 1. Business-Competition” of this Annual Report on Form 10-K.
Competition could result in lower subscription, advertising or other revenue or an increase in our marketing, promotion or other expenses and, consequently, lower our earnings and free cash flow. We cannot assure you we will be able to compete successfully with our existing or future competitors or that competition will not have a material adverse effect on our business, financial condition or results of operations.
Our ability to attract and retain subscribers in the future is uncertain.
Our ability to retain our subscribers, or increase the number of subscribers to our service, is uncertain and subject to many factors, including:
• | the production and sale or lease of new vehicles in the United States; |
• | the price of our service; |
• | the health of the economy; |
• | the rate at which existing self-pay subscribers buy and sell new and used vehicles in the United States; |
• | our ability to convince owners and lessees of new and previously owned vehicles that include satellite radios to purchase subscriptions to our service; |
• | the effectiveness of our marketing programs; |
• | the entertainment value of our programming; and |
• | actions by our competitors, such as terrestrial radio and other audio entertainment and information providers. |
As part of our business, we experience, and expect to experience in the future, subscriber turnover (i.e., churn). Some elements of our business strategy may result in churn increasing. For example, our efforts to increase the penetration of satellite radios in new, lower priced vehicle lines may result in the growth of economy-minded subscribers; our work to acquire subscribers purchasing or leasing pre-owned vehicles may attract subscribers of more limited economic means; and our product and marketing efforts may attract more price sensitive subscribers.
If we are unable to retain current subscribers at expected rates, or the costs of retaining subscribers are higher than expected, our financial performance and operating results could be adversely affected. We cannot predict how successful we will be at retaining customers who purchase or lease vehicles that include a subscription to our satellite radio service. We spend substantial amounts on advertising and marketing and in transactions with automakers, retailers and others to obtain and attract subscribers.
Average monthly revenue per subscriber, which we refer to as ARPU, is a key metric we use to analyze our business. Over the past several years, we have focused substantial attention and efforts on balancing ARPU and subscriber additions. Our ability to increase or maintain ARPU over time is uncertain and depends upon various factors, including:
• | the value consumers perceive in our service; |
• | our ability to add and retain compelling programming; |
• | the increasing competition we experience from terrestrial and Internet radio and other audio entertainment and information providers; |
9
• | our ability to increase prices; and |
• | discounted offers we may make to attract new subscribers and retain existing subscribers. |
Our profitability could be adversely affected if we are unable to consistently attract new subscribers and retain our current subscribers at prices and margins consistent with our past performance.
Our business depends in large part upon the auto industry.
A substantial portion of our subscription growth has come from purchasers and lessees of new and previously owned automobiles in the United States. The sale and lease of vehicles with satellite radios is an important source of subscribers for our satellite radio service. We have agreements with every major automaker to include satellite radios in new vehicles, although these agreements do not require automakers to install specific or minimum quantities of radios in any given period.
Automotive production and sales are dependent on many factors, including the availability of consumer credit, general economic conditions, consumer confidence and fuel costs. To the extent vehicle sales by automakers decline, or the penetration of factory-installed satellite radios in those vehicles is reduced, subscriber growth for our satellite radio services may be adversely impacted.
Sales of previously owned vehicles represent a significant source of new subscribers for us. We have agreements with various auto dealers and companies operating in the used vehicle market to provide us with data on sales of previously owned satellite radio enabled vehicles. The continuing availability of this information is important to our future growth.
General economic conditions can affect our business.
The purchase of a satellite radio subscription is discretionary, and our business and our financial condition can be negatively affected by general economic conditions. Poor general economic conditions could adversely affect subscriber churn, conversion rates and vehicle sales.
Consumer protection laws and their enforcement could damage our business.
We engage in extensive marketing efforts to attract and retain subscribers to our services. We employ a wide variety of communications tools as part of our marketing campaigns, including telemarketing efforts; print, television, radio and online advertising; direct mail; and email solicitations.
Consumer protection laws, rules and regulations are extensive and have developed rapidly, particularly at the state level. Consumer protection laws in certain jurisdictions cover nearly all aspects of our marketing efforts, including the content of our advertising, the terms of consumer offers and the manner in which we communicate with subscribers and prospective subscribers. We are engaged in considerable efforts to ensure that all our activities comply with federal and state laws, rules and regulations relating to consumer protection, including laws relating to telemarketing activities and privacy. From time to time we are subject to certain claims under the Telephone Consumer Protection Act relating to telephone calls our vendors make to subscribers and trial subscribers, including calls to consumers' mobile phones. Modifications to federal and state laws, rules and regulations concerning consumer protection, including decisions by federal and state courts and agencies interpreting these laws, could have an adverse impact on our ability to attract and retain subscribers to our services. While we monitor the changes in and interpretations of these laws in consumer-related settlements and decisions, and while we believe that we are in material compliance with applicable laws, there can be no assurance that new laws or regulations will not be enacted or adopted, preexisting laws or regulations will not be more strictly enforced or that our varied operations will continue to comply with all applicable laws, which might adversely affect our operations.
10
If we fail to protect the security of personal information about our customers, we could be subject to costly government enforcement actions and private litigation and our reputation could suffer.
The nature of our business involves the receipt and storage of personal information about our subscribers including, in many cases, credit and debit card information. If we fail to protect the security of personal information about our customers or if we experience a data security breach, we could be exposed to costly government enforcement actions and private litigation and our reputation could suffer. In addition, our subscribers and potential customers could lose confidence in our ability to protect their personal information, which could cause them to discontinue usage of our services. Such events could lead to lost future sales and adversely affect our results of operations.
Other existing or future government laws and regulations could harm our business.
We are subject to many other federal, state and local laws. These laws and regulations cover issues such as user privacy, behavioral advertising, automatic renewal of agreements, pricing, fraud, electronic waste, mobile and electronic device communications, quality of products and services, taxation, advertising, intellectual property rights and information security. The expansion of these laws, both in terms of their number and their applicability, could harm our business. Similarly, new disclosure and reporting requirements, established under existing or new state or federal laws could increase the cost of doing business, adversely affecting our results of operations.
Failure of our satellites would significantly damage our business.
The lives of our satellites will vary depending on a number of factors, including:
• | degradation and durability of solar panels; |
• | quality of construction; |
• | random failure of satellite components, which could result in significant damage to or loss of a satellite; |
• | amount of fuel the satellite consumes; and |
• | damage or destruction by electrostatic storms, collisions with other objects in space or other events, such as nuclear detonations, occurring in space. |
In the ordinary course of operation, satellites experience failures of component parts and operational and performance anomalies. Components on our in-orbit satellites have failed; and from time to time we have experienced anomalies in the operation and performance of these satellites. These failures and anomalies are expected to continue in the ordinary course, and we cannot predict if any of these possible future events will have a material adverse effect on our operations or the life of our existing in-orbit satellites. Any material failure of our satellites could cause us to lose customers and could materially harm our reputation and our operating results. We hold no in-orbit insurance for our satellites other than our XM-5 satellite, which will expire in 2015. Additional information regarding our fleet of satellites is contained in the section entitled “Item 1. Business - Satellites, Terrestrial Repeaters and Other Satellite Facilities” of this Annual Report on Form 10-K.
In addition, our Sirius network of terrestrial repeaters communicates with a single third-party satellite. Our XM network of terrestrial repeaters communicates with a single XM satellite. If the satellites communicating with the applicable repeater network fail unexpectedly, the services would be disrupted for several hours or longer.
Interruption or failure of our information technology and communications systems could negatively impact our results and our brand.
We operate a complex and growing business. We offer a wide variety of subscription packages at different price points. Our business is dependent on the operation and availability of our information technology and communication systems and those of certain third party service providers. Any degradation in the quality, or any failure, of our systems could reduce our revenues, cause us to lose customers and damage our brand. Although we have implemented practices designed to maintain the availability of our information technology systems and mitigate the harm of any unplanned interruptions, we cannot anticipate all eventualities. We occasionally experience unplanned outages or technical difficulties. We could also experience loss of data or processing capabilities, which could cause us to lose customers and could materially harm our reputation and our operating results.
We rely on internal systems and external systems maintained by manufacturers, distributors and service providers to take, fulfill and handle customer service requests and host certain online activities. Any interruption or failure of our internal or external systems could prevent us from servicing customers or cause data to be unintentionally disclosed.
11
Our data centers and our information technology and communications systems are vulnerable to damage or interruption from natural disasters, malicious attacks, fire, power loss, telecommunications failures, computer viruses or other attempts to harm our systems.
If hackers were able to circumvent our security measures, we could lose proprietary information or personal information or experience significant disruptions. If our systems become unavailable or suffer a security breach, we may be required to expend significant resources to address these problems, including notification under various federal and state data privacy regulations, and our reputation and operating results could suffer.
Royalties for music rights have increased, there can be no assurance they will not continue to increase, and the market for music rights is changing and is subject to significant uncertainties.
We must maintain music programming royalty arrangements with, and pay license fees to, BMI, ASCAP and SESAC. These organizations traditionally negotiate with copyright users, collect royalties and distribute them to songwriters and music publishers. We have agreements with ASCAP, BMI and SESAC through 2016. There can be no assurance that the royalties we pay to ASCAP, SESAC, BMI and other songwriters and music publishers will not increase upon expiration of these arrangements.
The market for acquiring rights from songwriters and music publishers is changing. BMI and ASCAP are subject to Consent Decrees with the United States. The Unites States Department of Justice is reviewing these Consent Decrees and may agree to changes to those arrangements. In addition, certain songwriters and music publishers have purportedly withdrawn from two of the traditional performing rights organizations, ASCAP and BMI, and third parties have contacted us regarding the need to separately license works. The change to, and fragmentation of, the traditional market for licensing musical works could increase our licensing costs and/or cause us in certain cases to reduce the number of works we perform.
Under the Digital Performance Right in Sound Recordings Act of 1995 and the Digital Millennium Copyright Act of 1998, we also must pay royalties to copyright owners of sound recordings fixed after February 15, 1972. Those royalty rates may be established through negotiation or, if negotiation is unsuccessful, by the CRB. Owners of copyrights in sound recordings have created SoundExchange, a collective organization, to collect and distribute royalties. SoundExchange is exempt by statute from certain U.S. antitrust laws and exercises significant market power in the licensing of sound recordings. Under the terms of the CRB's decision governing sound recording royalties for the five-year period ending on December 31, 2017, we will pay a royalty based on gross revenues, subject to certain exclusions, of 10.0% for 2015, 10.5% for 2016, and 11% for 2017.
The right to perform certain copyrighted sound recordings that were fixed before February 15, 1972 is governed by state common law principles and, in certain instances, may be subject to state statutes. We are a defendant in litigation in three States regarding the alleged distribution, duplication and performance of certain copyrighted sound recordings that were fixed before February 15, 1972. If courts ultimately hold that a performance right exists under state copyright laws, we may be required to pay additional royalties to perform copyrighted sound recordings that were fixed before February 15, 1972 or remove those works from our service.
The unfavorable outcome of pending or future litigation could have a material adverse effect.
We are parties to several legal proceedings arising out of various aspects of our business, including patent infringement suits, class action and individual suits seeking compensation for our use of sound recordings fixed prior to February 15, 1972 and class actions seeking damages for purported violations of the telephone consumer protection act. We are defending all claims against us. The outcome of these proceedings may not be favorable, and an unfavorable outcome could have a material adverse effect on our business or financial results. See "Item 3. Legal Proceedings" below.
We may not realize the benefits of acquisitions or other strategic initiatives.
Our business strategy may include selective acquisitions or other strategic initiatives that allow us to expand our business. The success of any acquisition depends upon effective integration of acquired businesses and assets into our operations, which is subject to risks and uncertainties, including realization of any anticipated synergies and cost savings, the ability to retain and attract personnel, the diversion of management’s attention for other business concerns, and undisclosed or potential legal liabilities of the acquired business or assets.
12
Rapid technological and industry changes could adversely impact our services.
The audio entertainment industry is characterized by rapid technological change, frequent product innovations, changes in customer requirements and expectations, and evolving standards. If we are unable to keep pace with these changes, our business may not succeed. Products using new technologies, or emerging industry standards, could make our technologies less competitive in the marketplace.
Failure of third parties to perform could adversely affect our business.
Our business depends, in part, on various third parties, including:
• | manufacturers that build and distribute satellite radios; |
• | companies that manufacture and sell integrated circuits for satellite radios; |
• | programming providers and on-air talent; |
• | vendors that operate our call centers; |
• | retailers that market and sell satellite radios and promote subscriptions to our services; and |
• | vendors that have designed or built, and vendors that support or operate, other important elements of our systems. |
If one or more of these third parties do not perform in a satisfactory or timely manner, our business could be adversely affected. In addition, a number of third parties on which we depend have experienced, and may in the future experience, financial difficulties or file for bankruptcy protection. Such third parties may not be able to perform their obligations to us in a timely manner, if at all, as a result of their financial condition or may be relieved of their obligations to us as part of seeking bankruptcy protection.
We design, establish specifications, source or specify parts and components, and manage various aspects of the logistics of the production of satellite radios. As a result of these activities, we may be exposed to liabilities associated with the design, manufacture and distribution of radios that the providers of an entertainment service would not customarily be subject to, such as liabilities for design defects, patent infringement and compliance with applicable laws, as well as the costs of returned product.
Failure to comply with FCC requirements could damage our business.
We hold FCC licenses and authorizations to operate commercial satellite radio services in the United States, including authorizations for satellites and terrestrial repeaters, and related authorizations. The FCC generally grants licenses and authorizations for a fixed term. Although we expect our licenses and authorizations to be renewed in the ordinary course upon their expiration, there can be no assurance that this will be the case. Any assignment or transfer of control of any of our FCC licenses or authorizations must be approved in advance by the FCC.
The operation of our satellite radio systems is subject to significant regulation by the FCC under authority granted through the Communications Act of 1934 and related federal law. We are required, among other things, to operate only within specified frequencies; to meet certain conditions regarding the interoperability of our satellite radios with those of other licensed satellite radio systems; to coordinate our satellite radio services with radio systems operating in the same range of frequencies in neighboring countries; and to coordinate our communications links to our satellites with other systems that operate in the same frequency band. Noncompliance by us with these requirements or other conditions or with other applicable FCC rules and regulations could result in fines, additional license conditions, license revocation or other detrimental FCC actions. There is no guarantee that Congress will not modify the statutory framework governing our services, or that the FCC will not modify its rules and regulations in a manner that would have a material impact on our operations.
We also rely on the FCC to assist us in preventing harmful interference to our service. The development of new applications and services in spectrum adjacent to the frequencies licensed to us for satellite radio and ancillary services, as well as the possible distortion caused by the combination of signals in other frequencies, could cause harmful interference to our satellite radio service. Certain operations or combination of operations permitted by the FCC in spectrum, other than our licensed frequencies, could result in distortion to our service and the reception of our satellite radio service could be adversely affected in certain areas.
The terms of our licenses and the order of the FCC approving the Merger requires us to meet certain conditions. Non-compliance with these conditions could result in fines, additional license conditions, license revocation or other detrimental FCC actions.
13
We may from time to time modify our business plan, and these changes could adversely affect us and our financial condition.
We regularly evaluate our plans and strategy. These evaluations often result in changes to our plans and strategy, some of which may be material. These changes in our plans or strategy may include: the acquisition or termination of unique or compelling programming; the introduction of new features or services; significant new or enhanced distribution arrangements; investments in infrastructure, such as satellites, equipment or radio spectrum; and acquisitions of other businesses, including acquisitions that are not directly related to our satellite radio business.
We have a significant amount of indebtedness, and our revolving credit facility contains certain covenants that restrict our current and future operations.
As of December 31, 2014, we had an aggregate principal amount of approximately $4.5 billion of indebtedness, $380 million of which was outstanding under a $1.25 billion Senior Secured Revolving Credit Facility.
Our indebtedness has important consequences. For example, it increases our vulnerability to general adverse economic and industry conditions; requires us to dedicate a portion of our cash flow from operations to payments on indebtedness, reducing the availability of cash flow to fund capital expenditures, marketing and other general corporate activities; limits our ability to borrow additional funds; limits our flexibility in planning for, or reacting to, changes in our business and the audio entertainment industry; and may place us at a competitive disadvantage compared to other competitors. Our Revolving Credit Agreement contains covenants that, among other things, place certain limitations on our ability to incur more debt, exceed a specified leverage ratio, pay dividends, make distributions, make investments, repurchase stock, create liens, enter into transactions with affiliates, enter into sale lease-back transactions, merge or consolidate, and transfer or sell assets. Failure to comply with these covenants could result in an event of default, which, if not cured or waived, could cause us to seek the protection of the bankruptcy laws, discontinue operations or seek a purchaser for our business or assets.
Our broadcast studios, terrestrial repeater networks, satellite uplink facilities or other ground facilities could be damaged by natural catastrophes or terrorist activities.
An earthquake, hurricane, tornado, flood, terrorist attack or other catastrophic event could damage our broadcast studios, terrestrial repeater networks or satellite uplink facilities, interrupt our service and harm our business.
Any damage to the satellites that transmit to our terrestrial repeater networks would likely result in degradation of the affected service for some subscribers and could result in complete loss of service in certain or all areas. Damage to our satellite uplink facilities could result in a complete loss of our services until we could transfer operations to suitable back-up facilities.
Our principal stockholder has significant influence over our management and over actions requiring general stockholder approval and its interests may differ from the interests of other holders of our common stock.
Liberty Media beneficially owns over 50% of Holdings’ common stock. Two Liberty Media executives and one other member of the board of directors of Liberty Media are members of our board of directors. Gregory B. Maffei, the President and Chief Executive Officer of Liberty Media, is the Chairman of Holdings’ board of directors.
Liberty Media has the ability to indirectly control our affairs, policies and operations, such as the appointment of management, future issuances of common stock or other securities, the payment of dividends, if any, the incurrence of debt, amendments to our certificate of incorporation and bylaws and the entering into of extraordinary transactions, and their interests may not in all cases be aligned with the interests of other stockholders of Holdings. In addition, Liberty Media will be able to determine the outcome of all matters requiring general stockholder approval and will be able to cause or prevent a change of control of Holdings or a change in the composition of Holdings’ board of directors and could preclude any unsolicited acquisition of our company. The concentration of ownership could deprive our stockholders of an opportunity to receive a premium for their common stock as part of a sale of our company and might ultimately affect the market price of our common stock.
We are a “controlled company” within the meaning of the NASDAQ listing rules and, as a result, qualify for, and rely on, exemptions from certain corporate governance requirements.
We are a “controlled company” for the purposes of the NASDAQ Stock Market listing rules. As such, we have elected not to comply with certain NASDAQ corporate governance requirements. A majority of our board of directors consists of independent directors. We do not have a compensation committee and nominating and corporate governance committee that consist entirely of independent directors.
14
Our business may be impaired by third-party intellectual property rights.
Development of our systems has depended upon the intellectual property that we have developed, as well as intellectual property licensed from third parties. If the intellectual property that we have developed or use is not adequately protected, others will be permitted to and may duplicate portions of our systems or services without liability. In addition, others may challenge, invalidate, render unenforceable or circumvent our intellectual property rights, patents or existing licenses or we may face significant legal costs in connection with defending and enforcing those intellectual property rights. Some of the know-how and technology we have developed, and plan to develop, is not now, nor will it be, covered by U.S. patents or trade secret protections. Trade secret protection and contractual agreements may not provide adequate protection if there is any unauthorized use or disclosure. The loss of necessary technologies could require us to substitute technologies of lower quality performance standards, at greater cost or on a delayed basis, which could harm us.
Other parties may have patents or pending patent applications, which will later mature into patents or inventions that may block or put limits on our ability to operate our system or license technologies. We may have to resort to litigation to enforce our rights under license agreements or to determine the scope and validity of other parties’ proprietary rights in the subject matter of those licenses. This may be expensive and we may not succeed in any such litigation.
Third parties may assert claims or bring suit against us for patent, trademark or copyright infringement, or for other infringement or misappropriation of intellectual property rights. Any such litigation could result in substantial cost, and diversion of effort and adverse findings in any proceeding could subject us to significant liabilities to third parties; require us to seek licenses from third parties; block our ability to operate our systems or license our technology; or otherwise adversely affect our ability to successfully develop and market our satellite radio systems.
Special Note About Forward-Looking Statements
We have made various statements in this Annual Report on Form 10-K that may constitute “forward-looking statements” within the meaning of the Private Securities Litigation Reform Act of 1995. Forward-looking statements may also be made in our other reports filed with or furnished to the SEC, in our press releases and in other documents. In addition, from time to time, we, through our management, may make oral forward-looking statements. Forward-looking statements are subject to risks and uncertainties, including those identified above, which could cause actual results to differ materially from such statements. The words “will likely result,” “are expected to,” “will continue,” “is anticipated,” “estimated,” “believe,” “intend,” “plan,” “may,” “should,” “could,” “would,” “likely,” “projection,” “outlook” and similar expressions are intended to identify forward-looking statements. We caution you that the risk factors described above are not exclusive. There may also be other risks that we are unable to predict at this time that may cause actual results to differ materially from those in forward-looking statements. New factors emerge from time to time, and it is not possible for us to predict which will arise or to assess with any precision the impact of each factor on our business or the extent to which any factor, or combination of factors, may cause actual results to differ materially from those contained in any forward-looking statements. Readers are cautioned not to place undue reliance on these forward-looking statements, which speak only as of the date on which they are made. We undertake no obligation to update publicly or revise any forward-looking statements, except as required by law.
ITEM 1B. UNRESOLVED STAFF COMMENTS
None.
15
ITEM 2. PROPERTIES
Below is a list of the principal properties that we own or lease:
Location | Purpose | Own/Lease |
New York, NY | Corporate headquarters and studio/production facilities | Lease |
New York, NY | Office facilities | Lease |
Washington, DC | Office and studio/production facilities | Own |
Washington, DC | Office facilities and data center | Own |
Lawrenceville, NJ | Office and technical/engineering facilities | Lease |
Deerfield Beach, FL | Office and technical/engineering facilities | Lease |
Farmington Hills, MI | Office and technical/engineering facilities | Lease |
Nashville, TN | Studio/production facilities | Lease |
Vernon, NJ | Technical/engineering facilities | Own |
Ellenwood, GA | Technical/engineering facilities | Lease |
Los Angeles, CA | Studio/production facilities | Lease |
Irving, TX | Office and engineering facilities/call center | Lease |
We also own or lease other small facilities that we use as offices for our advertising sales personnel, studios and warehouse and maintenance space. These facilities are not material to our business or operations. We also lease properties in Panama and Ecuador that we use as earth stations to command and control satellites.
In addition, we lease or license space at approximately 640 locations for use in connection with the terrestrial repeater networks that support our satellite radio services. In general, these leases and licenses are for space on building rooftops and communications towers. None of these individual arrangements are material to our business or operations.
ITEM 3. LEGAL PROCEEDINGS
In the ordinary course of business, we are a defendant or party to various claims and lawsuits, including those discussed below. These claims are at various stages of arbitration or adjudication.
We record a liability when we believe that it is both probable that a liability will be incurred, and the amount of loss can be reasonably estimated. We evaluate developments in legal matters that could affect the amount of liability that has been previously accrued and make adjustments as appropriate. Significant judgment is required to determine both probability and the estimated amount of a loss or potential loss. We may be unable to reasonably estimate the reasonably possible loss or range of loss for a particular legal contingency for various reasons, including, among others, because: (i) the damages sought are indeterminate; (ii) the proceedings are in the relative early stages; (iii) there is uncertainty as to the outcome of pending proceedings (including motions and appeals); (iv) there is uncertainty as to the likelihood of settlement and the outcome of any negotiations with respect thereto; (v) there remain significant factual issues to be determined or resolved; (vi) the relevant law is unsettled; or (vii) the proceedings involve novel or untested legal theories. In such instances, there may be considerable uncertainty regarding the ultimate resolution of such matters, including a possible eventual loss, if any.
State Consumer Investigations. In December 2014, we entered into agreements with 46 States and the District of Columbia to settle a multistate investigation into certain of our consumer practices. The investigation focused on practices relating to the cancellation of subscriptions; automatic renewal of subscriptions; charging, billing, collecting, and refunding or crediting of payments from consumers; and soliciting customers. As part of the settlement agreements, we agreed to certain changes in our consumer practices relating to: the sale and cancellation of self-pay subscriptions, the contents of advertising for our products and services, refunds we provide to consumers, and consumer complaints. All of the changes contemplated by these settlement agreements have been implemented. We also agreed to provide, upon the request of the States, certain additional information about our consumer practices, to participate in a process designed to address any previously unresolved consumer complaints, and to make an aggregate payment to the States of approximately $4 million.
A separate investigation into our consumer practices is being conducted by the Attorney General of the State of New York. We are cooperating with this investigation and believe our consumer practices comply with all applicable federal and New York State laws and regulations. In our view, the result of this investigation, including a possible settlement, will not have a material adverse effect on our business, financial condition or results of operations.
16
Pre-1972 Sound Recording Matters. We are a defendant in three class action suits and one additional suit, which were commenced in August and September 2013 and challenge our use and public performance via satellite radio and the Internet of sound recordings fixed prior to February 15, 1972 under California, New York and/or Florida law. The plaintiffs in each of these suits purport to seek in excess of $100 million in compensatory damages along with unspecified punitive damages and injunctive relief. Accordingly, at this point we cannot estimate the reasonably possible loss, or range of loss, which could be incurred if the plaintiffs were to prevail in the allegations, but we believe we have substantial defenses to the claims asserted. We intend to defend these actions vigorously.
In September 2014, the United States District Court for the Central District of California ruled that the grant of “exclusive ownership” to the owner of a sound recording under California’s copyright statute included the exclusive right to control public performances of the sound recording. The court further found that the unauthorized public performance of sound recordings violated California laws on unfair competition, misappropriation and conversion. In October 2014, the Superior Court of the State of California for the County of Los Angeles adopted the Central District Court's interpretation of "exclusive ownership" under California's copyright statute. That Court did not find that the unauthorized public performance of sound recordings violated California laws on unfair competition, misappropriation and conversion. In November 2014, the United States District Court for the Southern District of New York ruled that sound recordings fixed before February 15, 1972 were entitled under various theories of New York common law to the benefits of a public performances right. We intend to appeal these decisions.
These cases are titled Flo & Eddie Inc. v. Sirius XM Radio Inc. et al., No. 2:13-cv-5693-PSG-RZ (C.D. Cal.), Flo & Eddie, Inc. v. Sirius XM Radio Inc., et al., No. 1:13-cv-23182-DPG (S.D. Fla.), Flo & Eddie, Inc. v. Sirius XM Radio Inc. et al., No. 1:13-cv-5784-CM (S.D.N.Y.), and Capitol Records LLC et al. v. Sirius XM Radio Inc., No. BC-520981 (Super. Ct. L.A. County). Additional information concerning each of these actions is publicly available in court filings under their docket numbers.
In addition, in August 2013, SoundExchange, Inc. filed a complaint in the United States District Court for the District of Columbia alleging that we underpaid royalties for statutory licenses during the 2007-2012 rate period in violation of the regulations established by the Copyright Royalty Board for that period. SoundExchange principally alleges that we improperly reduced our calculation of gross revenues, on which the royalty payments are based, by deducting non-recognized revenue attributable to pre-1972 recordings and Premier package revenue that is not “separately charged” as required by the regulations. SoundExchange is seeking compensatory damages of not less than $50 million and up to $100 million or more, payment of late fees and interest, and attorneys’ fees and costs.
In August 2014, the United States District Court for the District of Columbia granted our motion to dismiss the complaint without prejudice on the grounds that the case properly should be pursued before the Copyright Royalty Board rather than the district court. In December 2014, SoundExchange filed a petition with the Copyright Royalty Board requesting an order interpreting the applicable regulations. The Copyright Royalty Board has requested that the parties submit briefs regarding whether the agency properly has jurisdiction to interpret the regulations and adjudicate this matter under the applicable statute. At this point we cannot estimate the reasonably possible loss, or range of loss, which could be incurred if the plaintiffs were to prevail in the allegations, but we believe we have substantial defenses to the claims asserted. We intend to defend these actions vigorously.
This matter is titled SoundExchange, Inc. v. Sirius XM Radio, Inc.. No.13-cv-1290-RJL (D.D.C.), and Determination of Rates and Terms for Preexisting Subscription Services and Satellite Digital Audio Radio Services, United States Copyright Royalty Board, No. 2006-1 CRB DSTRA. Additional information concerning each of these actions is publicly available in filings under their docket numbers.
Telephone Consumer Protection Act Suits. We are a defendant in three purported class action suits, which were commenced in February 2012, January 2013 and January 2015, in the United States District Court for the Eastern District of Virginia, Newport News Division, and the United States District Court for the Southern District of California that allege that we, or certain call center vendors acting on our behalf, made numerous calls which violate provisions of the Telephone Consumer Protection Act of 1991 (the “TCPA”). The plaintiffs in these actions allege, among other things, that we called mobile phones using an automatic telephone dialing system without the consumer’s prior consent or, alternatively, after the consumer revoked their prior consent and, in one of the actions, that we violated the TCPA’s call time restrictions. The plaintiffs in these suits are seeking various forms of relief, including statutory damages of $500 for each violation of the TCPA or, in the alternative, treble damages of up to $1,500 for each knowing and willful violation of the TCPA, as well as payment of in
17
terest, attorneys’ fees and costs, and certain injunctive relief prohibiting violations of the TCPA in the future. We believe we have substantial defenses to the claims asserted in these actions, and we intend to defend them vigorously.
We have notified certain of our call center vendors of these actions and requested that they defend and indemnify us against these claims pursuant to the provisions of their existing or former agreements with us. We believe we have valid contractual claims against certain call center vendors in connection with these claims and intend to preserve and pursue our rights to recover from these entities.
These cases are titled Erik Knutson v. Sirius XM Radio Inc., No. 12-cv-0418-AJB-NLS (S.D. Cal.), Francis W. Hooker v. Sirius XM Radio, Inc., No. 4:13-cv-3 (E.D. Va.) and Brian Trenz v. Sirius XM Holdings, Inc. and Toyota Motor Sales, U.S.A., Inc., No. 15-cv-0044L-BLM (S.D. Cal). Additional information concerning each of these actions is publicly available in court filings under their docket numbers.
With respect to the matters described above under the captions “Pre-1972 Sound Recording Matters” and “Telephone Consumer Protection Act Suits”, we have determined, based on our current knowledge, that the amount of loss or range of loss, that is reasonably possible is not reasonably estimable. However, these matters are inherently unpredictable and subject to significant uncertainties, many of which are beyond our control. As such, there can be no assurance that the final outcome of these matters will not materially and adversely affect our business, financial condition, results of operations, or cash flows.
Other Matters. In the ordinary course of business, we are a defendant in various other lawsuits and arbitration proceedings, including derivative actions; actions filed by subscribers, both on behalf of themselves and on a class action basis; former employees; parties to contracts or leases; and owners of patents, trademarks, copyrights or other intellectual property. None of these matters, in our opinion, is likely to have a material adverse effect on our business, financial condition or results of operations.
ITEM 4. MINE SAFETY DISCLOSURES
Not applicable.
PART II
ITEM 5. MARKET FOR REGISTRANT'S COMMON EQUITY, RELATED STOCKHOLDER MATTERS AND ISSUER PURCHASES OF EQUITY SECURITIES
Our common stock is traded on the NASDAQ Global Select Market under the symbol “SIRI.” The following table sets forth the high and low per share sales price for our common stock, as reported by NASDAQ, for the periods indicated below:
High | Low | |||
Year Ended December 31, 2013 | ||||
First Quarter | $3.25 | $2.95 | ||
Second Quarter | $3.63 | $2.95 | ||
Third Quarter | $3.99 | $3.30 | ||
Fourth Quarter | $4.18 | $3.32 | ||
Year Ended December 31, 2014 | ||||
First Quarter | $3.89 | $3.09 | ||
Second Quarter | $3.49 | $2.98 | ||
Third Quarter | $3.65 | $3.28 | ||
Fourth Quarter | $3.63 | $3.14 | ||
On February 3, 2015, the closing sales price of our common stock on the NASDAQ Global Select Market was $3.64 per share. On February 3, 2015, there were approximately 9,777 record holders of our common stock.
18
Dividends
On December 28, 2012, we paid a special cash dividend in the amount of $0.05 per share of common stock. This was the first cash dividend ever paid by us. The holders of our former Series B-1 Preferred Stock participated in this cash dividend on an as-converted basis in accordance with its terms. The total amount of this dividend was approximately $327 million. Our ability to pay dividends is currently limited by covenants under our revolving credit facility. Our board of directors has not made any determination whether similar special cash dividends will be paid in the future.
Issuer Purchases of Equity Securities
Since December 2012, our board of directors has approved for repurchase an aggregate of $6.0 billion of our common stock. Our board of directors did not establish an end date for this stock repurchase program. Shares of common stock may be purchased from time to time on the open market, pursuant to pre-set trading plans meeting the requirements of Rule 10b5-1 under the Exchange Act, in privately negotiated transactions, including transactions with Liberty Media and its affiliates, or otherwise. As of December 31, 2014, our cumulative repurchases since December 2012 under our stock repurchase program totaled 1.3 billion shares for $4.3 billion, and $1.7 billion remained available under our stock repurchase program. The size and timing of our repurchases will be based on a number of factors, including price and business and market conditions.
The following table provides information about our purchases of equity securities registered pursuant to Section 12 of the Exchange Act during the quarter ended December 31, 2014:
Period | Total Number of Shares Purchased | Average Price Paid Per Share (a) | Total Number of Shares Purchased as Part of Publicly Announced Plans or Programs | Approximate Dollar Value of Shares that May Yet Be Purchased Under the Plans or Programs (a) | ||||||||||
October 1, 2014 - October 31, 2014 | 55,907,961 | (b) | 55,907,961 | $ | 2,110,339,265 | |||||||||
November 1, 2014 - November 30, 2014 | 49,014,354 | $ | 3.52 | 49,014,354 | $ | 1,938,003,842 | ||||||||
December 1, 2014 - December 31, 2014 | 64,039,114 | $ | 3.49 | 64,039,114 | $ | 1,714,807,515 | ||||||||
Total | 168,961,429 | (b) | 168,961,429 | |||||||||||
(a) | These amounts include fees and commissions associated with shares repurchased. All of these repurchases were made pursuant to our share repurchase program. |
(b) | In August 2014, we prepaid $250 million under an accelerated share repurchase agreement which settled on October 1, 2014 at which time we received 19.4 million shares of our common stock. In addition, during October 2014, we purchased 36.5 million shares of our common stock on the open market at an average price of $3.33 per share. See Note 15 to the consolidated financial statements included in this Annual Report on Form 10-K. |
COMPARISON OF CUMULATIVE TOTAL RETURNS
Set forth below is a graph comparing the cumulative performance of our common stock with the Standard & Poor's Composite-500 Stock Index, or the S&P 500, and the NASDAQ Telecommunications Index from December 31, 2009 to December 31, 2014. The graph assumes that $100 was invested on December 31, 2009 in each of our common stock, the S&P 500 and the NASDAQ Telecommunications Index. A dividend with respect to our common stock was declared in 2012 only.
19
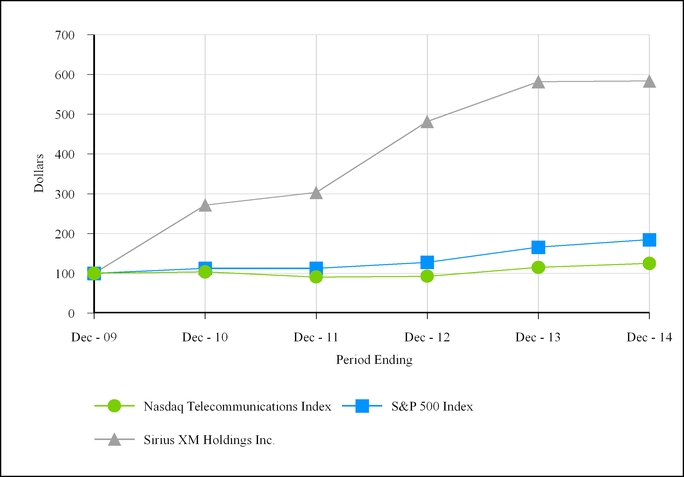
Stockholder Return Performance Table
NASDAQ Telecommunications Index | S&P 500 Index | Sirius XM Holdings Inc. | ||||
December 31, 2009 | $100.00 | $100.00 | $100.00 | |||
December 31, 2010 | $103.92 | $112.78 | $271.67 | |||
December 31, 2011 | $90.81 | $112.78 | $303.33 | |||
December 31, 2012 | $92.63 | $127.90 | $481.67 | |||
December 31, 2013 | $114.88 | $165.76 | $581.67 | |||
December 31, 2014 | $125.11 | $184.64 | $583.33 | |||
20
ITEM 6. SELECTED FINANCIAL DATA
The operating and balance sheet data included in the following selected financial data for 2014 and 2013 have been derived from our audited consolidated financial statements. Historical operating and balance sheet data included within the following selected financial data from 2010 through 2012 is derived from the audited Consolidated Financial Statements of Sirius XM. This selected financial data should be read in conjunction with the audited Consolidated Financial Statements and related notes thereto included in Item 8 of this Annual Report on Form 10-K and “Management's Discussion and Analysis of Financial Condition and Results of Operations” included in Item 7 of this Annual Report on Form 10-K.
As of and for the Years Ended December 31, | |||||||||||||||||||
2014 | 2013 (1) | 2012 (2) | 2011 | 2010 | |||||||||||||||
(in thousands, except per share data) | |||||||||||||||||||
Statements of Comprehensive Income Data: | |||||||||||||||||||
Total revenue | $ | 4,181,095 | $ | 3,799,095 | $ | 3,402,040 | $ | 3,014,524 | $ | 2,816,992 | |||||||||
Net income | $ | 493,241 | $ | 377,215 | $ | 3,472,702 | $ | 426,961 | $ | 43,055 | |||||||||
Net income per share – basic | $ | 0.09 | $ | 0.06 | $ | 0.55 | $ | 0.07 | $ | 0.01 | |||||||||
Net income per share – diluted | $ | 0.08 | $ | 0.06 | $ | 0.51 | $ | 0.07 | $ | 0.01 | |||||||||
Weighted average common shares outstanding – basic | 5,788,944 | 6,227,646 | 4,209,073 | 3,744,606 | 3,693,259 | ||||||||||||||
Weighted average common shares outstanding – diluted | 5,862,020 | 6,384,791 | 6,873,786 | 6,500,822 | 6,391,071 | ||||||||||||||
Cash dividends per share | $ | — | $ | — | $ | 0.05 | $ | — | $ | — | |||||||||
Balance Sheet Data: | |||||||||||||||||||
Cash and cash equivalents | $ | 147,724 | $ | 134,805 | $ | 520,945 | $ | 773,990 | $ | 586,691 | |||||||||
Restricted investments | $ | 5,922 | $ | 5,718 | $ | 3,999 | $ | 3,973 | $ | 3,396 | |||||||||
Total assets | $ | 8,375,509 | $ | 8,844,780 | $ | 9,054,843 | $ | 7,495,996 | $ | 7,383,086 | |||||||||
Long-term debt, net of current portion | $ | 4,493,863 | $ | 3,093,821 | $ | 2,430,986 | $ | 3,012,351 | $ | 3,021,763 | |||||||||
Stockholders' equity | $ | 1,309,837 | $ | 2,745,742 | $ | 4,039,565 | $ | 704,145 | $ | 207,636 | |||||||||
——————
(1) | The selected financial data for 2013 includes the balances and approximately two months of activity related to the acquisition of the connected vehicle business of Agero, Inc. in November 2013. |
(2) | For the year ended December 31, 2012, we had an income tax benefit of $2,998,234 due to the release of our valuation allowance. A special cash dividend was paid during 2012. |
21
ITEM 7. MANAGEMENT’S DISCUSSION AND ANALYSIS OF FINANCIAL CONDITION AND RESULTS OF OPERATIONS
This Annual Report on Form 10-K contains forward-looking statements within the meaning of the Private Securities Litigation Reform Act of 1995. Actual results and the timing of events could differ materially from those projected in forward-looking statements due to a number of factors, including those described under “Item 1A - Risk Factors” and elsewhere in this Annual Report on Form 10-K. See “Special Note Regarding Forward-Looking Statements.”
(All dollar amounts referenced in this Item 7 are in thousands, unless otherwise stated)
The following discussion and analysis of our financial condition and results of operations should be read in conjunction with our audited consolidated financial statements and related notes included elsewhere in this Annual Report on Form 10-K for the year ended December 31, 2014.
Executive Summary
We broadcast music, sports, entertainment, comedy, talk, news, traffic and weather channels, as well as infotainment services, in the United States on a subscription fee basis through our two proprietary satellite radio systems. Subscribers can also receive music and other channels, plus features such as SiriusXM On Demand and MySXM, over our Internet radio service, including through applications for mobile devices. We are also a leader in providing connected vehicle services. Our connected vehicle services are designed to enhance the safety, security and driving experience for vehicle operators while providing marketing and operational benefits to automakers and their dealers. Subscribers to our connected vehicle services are not included in our subscriber count or subscriber-based operating metrics.
We have agreements with every major automaker (“OEMs”) to offer satellite radios in their vehicles from which we acquire a majority of our subscribers. We also acquire subscribers through marketing to owners of factory-installed satellite radios that are not currently subscribing to our services. Additionally, we distribute our satellite radios through retail locations nationwide and through our website. Satellite radio services are also offered to customers of certain daily rental car companies.
As of December 31, 2014, we had 27,311,087 subscribers of which 22,522,638 were self-pay subscribers and 4,788,449 were paid promotional subscribers. Our subscriber totals include subscribers under our regular pricing plans; discounted pricing plans; subscribers that have prepaid, including payments either made or due from automakers for subscriptions included in the sale or lease price of a vehicle; subscribers to our Internet services who do not also have satellite radio subscriptions; and certain subscribers to our weather, traffic, data and Backseat TV services who do not also have satellite radio subscriptions.
Our primary source of revenue is subscription fees, with most of our customers subscribing on an annual, semi-annual, quarterly or monthly basis. We offer discounts for prepaid and longer term subscription plans as well as discounts for multiple subscriptions. We also derive revenue from activation and other fees, the sale of advertising on select non-music channels, the direct sale of satellite radios and accessories, and other ancillary services, such as our weather, traffic, data and Backseat TV services.
In certain cases, automakers and dealers include a subscription to our radio services in the sale or lease price of new vehicles or previously owned vehicles. The length of these trial subscriptions varies but is typically three to twelve months. We receive subscription payments for these trials from certain automakers. We also reimburse various automakers for certain costs associated with satellite radios installed in new vehicles.
Liberty Media beneficially owns, directly and indirectly, over 50% of the outstanding shares of our common stock. As a result, we are a "controlled company" for the purposes of the NASDAQ corporate governance requirements. Liberty Media owns interests in a range of media, communications and entertainment businesses.
We also have a 37% equity interest in Sirius XM Canada which offers satellite radio services in Canada. Subscribers to the Sirius XM Canada service are not included in our subscriber count.
22
Results of Operations
Set forth below are our results of operations for the year ended December 31, 2014 compared with the year ended December 31, 2013 and the year ended December 31, 2013 compared with the year ended December 31, 2012.
For the Years Ended December 31, | 2014 vs 2013 Change | 2013 vs 2012 Change | |||||||||||||||||||||||
(in thousands) | 2014 | 2013 | 2012 | Amount | % | Amount | % | ||||||||||||||||||
Revenue: | |||||||||||||||||||||||||
Subscriber revenue | $ | 3,554,302 | $ | 3,284,660 | $ | 2,962,665 | $ | 269,642 | 8 | % | $ | 321,995 | 11 | % | |||||||||||
Advertising revenue | 100,982 | 89,288 | 82,320 | 11,694 | 13 | % | 6,968 | 8 | % | ||||||||||||||||
Equipment revenue | 104,661 | 80,573 | 73,456 | 24,088 | 30 | % | 7,117 | 10 | % | ||||||||||||||||
Other revenue | 421,150 | 344,574 | 283,599 | 76,576 | 22 | % | 60,975 | 22 | % | ||||||||||||||||
Total revenue | 4,181,095 | 3,799,095 | 3,402,040 | 382,000 | 10 | % | 397,055 | 12 | % | ||||||||||||||||
Operating expenses: | |||||||||||||||||||||||||
Cost of services: | |||||||||||||||||||||||||
Revenue share and royalties | 810,028 | 677,642 | 551,012 | 132,386 | 20 | % | 126,630 | 23 | % | ||||||||||||||||
Programming and content | 297,313 | 290,323 | 278,997 | 6,990 | 2 | % | 11,326 | 4 | % | ||||||||||||||||
Customer service and billing | 370,585 | 320,755 | 294,980 | 49,830 | 16 | % | 25,775 | 9 | % | ||||||||||||||||
Satellite and transmission | 86,013 | 79,292 | 72,615 | 6,721 | 8 | % | 6,677 | 9 | % | ||||||||||||||||
Cost of equipment | 44,397 | 26,478 | 31,766 | 17,919 | 68 | % | (5,288 | ) | (17 | )% | |||||||||||||||
Subscriber acquisition costs | 493,464 | 495,610 | 474,697 | (2,146 | ) | — | % | 20,913 | 4 | % | |||||||||||||||
Sales and marketing | 336,480 | 291,024 | 248,905 | 45,456 | 16 | % | 42,119 | 17 | % | ||||||||||||||||
Engineering, design and development | 62,784 | 57,969 | 48,843 | 4,815 | 8 | % | 9,126 | 19 | % | ||||||||||||||||
General and administrative | 293,938 | 262,135 | 261,905 | 31,803 | 12 | % | 230 | — | % | ||||||||||||||||
Depreciation and amortization | 266,423 | 253,314 | 266,295 | 13,109 | 5 | % | (12,981 | ) | (5 | )% | |||||||||||||||
Total operating expenses | 3,061,425 | 2,754,542 | 2,530,015 | 306,883 | 11 | % | 224,527 | 9 | % | ||||||||||||||||
Income from operations | 1,119,670 | 1,044,553 | 872,025 | 75,117 | 7 | % | 172,528 | 20 | % | ||||||||||||||||
Other income (expense): | |||||||||||||||||||||||||
Interest expense, net of amounts capitalized | (269,010 | ) | (204,671 | ) | (265,321 | ) | (64,339 | ) | (31 | )% | 60,650 | 23 | % | ||||||||||||
Loss on extinguishment of debt and credit facilities, net | — | (190,577 | ) | (132,726 | ) | 190,577 | 100 | % | (57,851 | ) | (44 | )% | |||||||||||||
Interest and investment income | 15,498 | 6,976 | 716 | 8,522 | 122 | % | 6,260 | 874 | % | ||||||||||||||||
Loss on change in value of derivatives | (34,485 | ) | (20,393 | ) | — | (14,092 | ) | (69 | )% | (20,393 | ) | nm | |||||||||||||
Other (loss) income | (887 | ) | 1,204 | (226 | ) | (2,091 | ) | (174 | )% | 1,430 | 633 | % | |||||||||||||
Total other expense | (288,884 | ) | (407,461 | ) | (397,557 | ) | 118,577 | 29 | % | (9,904 | ) | (2 | )% | ||||||||||||
Income before income taxes | 830,786 | 637,092 | 474,468 | 193,694 | 30 | % | 162,624 | 34 | % | ||||||||||||||||
Income tax (expense) benefit | (337,545 | ) | (259,877 | ) | 2,998,234 | (77,668 | ) | (30 | )% | (3,258,111 | ) | (109 | )% | ||||||||||||
Net income | $ | 493,241 | $ | 377,215 | $ | 3,472,702 | $ | 116,026 | 31 | % | $ | (3,095,487 | ) | (89 | )% | ||||||||||
nm - not meaningful
23
Our results of operations discussed below include the impact of purchase price accounting adjustments associated with the July 2008 merger between our wholly owned subsidiary, Vernon Merger Corporation, and XM Satellite Radio Holdings Inc. (the "Merger"). The purchase price accounting adjustments related to the Merger, include the: (i) elimination of deferred revenue associated with the investment in XM Canada, (ii) recognition of deferred subscriber revenues not recognized in purchase price accounting, and (iii) elimination of the benefit of deferred credits on executory contracts, which are primarily attributable to third party arrangements with an OEM and programming providers. The deferred credits on executory contracts attributable to third party arrangements with an OEM included in revenue share and royalties, subscriber acquisition costs, and sales and marketing concluded with the expiration of the acquired contract during 2013. The impact of these purchase price accounting adjustments is detailed in our Adjusted Revenues and Operating Expenses tables on pages 40 through 42 of our glossary.
Total Revenue
Subscriber Revenue includes subscription, activation and other fees.
• | 2014 vs. 2013: For the years ended December 31, 2014 and 2013, subscriber revenue was $3,554,302 and $3,284,660, respectively, an increase of 8%, or $269,642. The increase was primarily attributable to a 6% increase in the daily weighted average number of subscribers, the inclusion of a full year of subscription revenue generated by our connected vehicle business and the increase in certain of our subscription rates beginning in January 2014. These increases were partially offset by subscription discounts and limited channel line-up plans offered through customer acquisition and retention programs, a change in an agreement with an automaker and a rental car company, and an increasing number of lifetime subscription plans that have reached full revenue recognition. |
• | 2013 vs. 2012: For the years ended December 31, 2013 and 2012, subscriber revenue was $3,284,660 and $2,962,665, respectively, an increase of 11%, or $321,995. The increase was primarily attributable to a 9% increase in the daily weighted average number of subscribers, the impact of the increase in certain of our subscription rates beginning in January 2012 as more subscribers migrated to the higher rates, and an increase in subscriptions to premium services, premier channels and Internet streaming, as well as the inclusion of connected vehicle subscription revenue in 2013. These increases were partially offset by subscription discounts offered through customer acquisition and retention programs, and an increasing number of lifetime subscription plans that have reached full revenue recognition. |
We expect subscriber revenues to increase based on the growth of our subscriber base, including connected vehicle subscribers, changes in our subscription rates and the sale of additional services to subscribers.
Advertising Revenue includes the sale of advertising on certain non-music channels.
• | 2014 vs. 2013: For the years ended December 31, 2014 and 2013, advertising revenue was $100,982 and $89,288, respectively, an increase of 13%, or $11,694. The increase was primarily due to a greater number of advertising spots sold and broadcast, as well as increases in rates charged per spot. |
• | 2013 vs. 2012: For the years ended December 31, 2013 and 2012, advertising revenue was $89,288 and $82,320, respectively, an increase of 8%, or $6,968. The increase was primarily due to a greater number of advertising spots sold and broadcast, as well as increases in rates charged per spot. |
We expect our advertising revenue to grow as more advertisers are attracted to our national platform and growing subscriber base and as we launch additional non-music channels.
Equipment Revenue includes revenue and royalties from the sale of satellite radios, components and accessories.
• | 2014 vs. 2013: For the years ended December 31, 2014 and 2013, equipment revenue was $104,661 and $80,573, respectively, an increase of 30%, or $24,088. The increase was driven by higher sales to distributors and royalties from OEM production, partially offset by lower per unit revenue on direct to consumer sales. |
• | 2013 vs. 2012: For the years ended December 31, 2013 and 2012, equipment revenue was $80,573 and $73,456, respectively, an increase of 10%, or $7,117. The increase was driven by royalties from higher OEM production, the mix of royalty eligible radios and, to a lesser extent, improved aftermarket subsidies. |
We expect equipment revenue to fluctuate based on OEM production for which we receive royalty payments for our technology and, to a lesser extent, on the volume of equipment sales in our aftermarket and direct to consumer business.
24
Other Revenue includes amounts earned from subscribers for the U.S. Music Royalty Fee, revenue from our Canadian affiliate and ancillary revenues.
• | 2014 vs. 2013: For the years ended December 31, 2014 and 2013, other revenue was $421,150 and $344,574, respectively, an increase of 22%, or $76,576. The increase was driven by revenues from the U.S. Music Royalty Fee as the number of subscribers subject to the 12.5% rate increased along with an overall increase in subscribers, by a change in an agreement with a rental car company and the inclusion of a full year of other revenue generated by our connected vehicle business. |
• | 2013 vs. 2012: For the years ended December 31, 2013 and 2012, other revenue was $344,574 and $283,599, respectively, an increase of 22%, or $60,975. The increase was driven by revenues from the U.S. Music Royalty Fee as the number of subscribers increased and subscribers on the 12.5% rate increased, and higher royalty revenue from Sirius XM Canada. |
We expect other revenue to increase as our growing subscriber base drives higher U.S. Music Royalty Fees.
Operating Expenses
Revenue Share and Royalties include distribution and content provider revenue share, royalties for broadcasting performance content and web streaming, and advertising revenue share.
• | 2014 vs. 2013: For the years ended December 31, 2014 and 2013, revenue share and royalties were $810,028 and $677,642, respectively, an increase of 20%, or $132,386, and increased as a percentage of total revenue. The increase was primarily attributable to the elimination of the benefit to earnings from the amortization of deferred credits on executory contracts initially recognized in purchase price accounting associated with the Merger, greater revenues subject to royalty and/or revenue sharing arrangements, and a 5.6% increase in the statutory royalty rate for the performance of sound recordings. For the year ended December 31, 2013, revenue share and royalties was positively impacted by a benefit of $122,534 to earnings from the amortization of deferred credits on executory contracts associated with the Merger. |
• | 2013 vs. 2012: For the years ended December 31, 2013 and 2012, revenue share and royalties were $677,642 and $551,012, respectively, an increase of 23%, or $126,630, and increased as a percentage of total revenue. The increase was primarily attributable to greater revenues subject to royalty and/or revenue sharing arrangements and a 12.5% increase in the statutory royalty rate for the performance of sound recordings as well as a decrease in the benefit to earnings from the amortization of deferred credits on executory contracts initially recognized in purchase price accounting associated with the Merger. |
We expect our revenue share and royalty costs to increase as our revenues grow and our royalty rates increase. As determined by the Copyright Royalty Board's decision, we paid royalties of 9.5%, 9.0% and 8.0% of gross revenues, subject to certain exclusions, for the years ended December 31, 2014, 2013 and 2012, respectively, and will pay 10.0% in 2015.
Programming and Content includes costs to acquire, create, promote and produce content. We have entered into various agreements with third parties for music and non-music programming that require us to pay license fees and other amounts.
• | 2014 vs. 2013: For the years ended December 31, 2014 and 2013, programming and content expenses were $297,313 and $290,323, respectively, an increase of 2%, or $6,990, but decreased as a percentage of total revenue. The increase was primarily due to higher personnel costs, the reduction in the benefit to earnings from the purchase price accounting adjustments associated with the Merger and the early termination of certain agreements, partially offset by the renewal of certain licensing agreements at more cost effective terms. |
• | 2013 vs. 2012: For the years ended December 31, 2013 and 2012, programming and content expenses were $290,323 and $278,997, respectively, an increase of 4%, or $11,326, but decreased as a percentage of total revenue. The increase was primarily due to reductions in the benefit to earnings from purchase price accounting adjustments associated with the Merger attributable to the amortization of the deferred credit on acquired programming executory contracts and increased personnel costs. |
We expect our programming and content expenses to fluctuate as we offer additional programming, and renew or replace expiring agreements.
25
Customer Service and Billing includes costs associated with the operation and management of internal and third party customer service centers, and our subscriber management systems as well as billing and collection costs, transaction fees and bad debt expense.
• | 2014 vs. 2013: For the years ended December 31, 2014 and 2013, customer service and billing expenses were $370,585 and $320,755, respectively, an increase of 16%, or $49,830, and increased as a percentage of total revenue. The increase was primarily due to the inclusion of a full year of costs associated with our connected vehicle services business, higher subscriber volume driving increased subscriber contacts and increased bad debt expense. |
• | 2013 vs. 2012: For the years ended December 31, 2013 and 2012, customer service and billing expenses were $320,755 and $294,980, respectively, an increase of 9%, or $25,775, but remained flat as a percentage of total revenue. The increase was primarily due to efforts to improve our customer service experience, resulting in higher spend on customer service agents, staffing and training, higher subscriber volume driving increased subscriber contacts, increased bad debt expense and higher technology costs. |
We expect our customer service and billing expenses to increase as our subscriber base grows.
Satellite and Transmission consists of costs associated with the operation and maintenance of our terrestrial repeater networks; satellites; satellite telemetry, tracking and control systems; satellite uplink facilities; broadcast studios; and delivery of our Internet streaming service.
• | 2014 vs. 2013: For the years ended December 31, 2014 and 2013, satellite and transmission expenses were $86,013 and $79,292, respectively, an increase of 8%, or $6,721, but remained flat as a percentage of total revenue. The increase was primarily due to increased personnel costs, costs associated with our Internet streaming operations, satellite insurance expense, and terrestrial repeater network costs. |
• | 2013 vs. 2012: For the years ended December 31, 2013 and 2012, satellite and transmission expenses were $79,292 and $72,615, respectively, an increase of 9%, or $6,677, but remained flat as a percentage of total revenue. The increase was primarily due to increased costs associated with our Internet streaming operations. |
We expect satellite and transmission expenses to increase slightly as higher Internet streaming and terrestrial repeater network costs are partially offset by decreases in satellite insurance costs.
Cost of Equipment includes costs from the sale of satellite radios, components and accessories and provisions for inventory allowance attributable to products purchased for resale in our direct to consumer distribution channels.
• | 2014 vs. 2013: For the years ended December 31, 2014 and 2013, cost of equipment was $44,397 and $26,478, respectively, an increase of 68%, or $17,919, and increased as a percentage of equipment revenue. The increase was primarily due to higher sales to distributors, partially offset by lower costs per unit on direct to consumer sales. |
• | 2013 vs. 2012: For the years ended December 31, 2013 and 2012, cost of equipment was $26,478 and $31,766, respectively, a decrease of 17%, or $5,288, and decreased as a percentage of equipment revenue. The decrease was primarily due to lower average cost per product sold and lower inventory reserves, partially offset by higher direct to consumer volume compared to prior year periods. |
We expect cost of equipment to fluctuate with changes in sales and inventory valuations.
26
Subscriber Acquisition Costs include hardware subsidies paid to radio manufacturers, distributors and automakers; subsidies paid for chipsets and certain other components used in manufacturing radios; device royalties for certain radios and chipsets; commissions paid to automakers and retailers; product warranty obligations; freight; and provisions for inventory allowances attributable to inventory consumed in our OEM and retail distribution channels. The majority of subscriber acquisition costs are incurred and expensed in advance of, or concurrent with, acquiring a subscriber. Subscriber acquisition costs do not include advertising costs, marketing, loyalty payments to distributors and dealers of satellite radios or revenue share payments to automakers and retailers of satellite radios.
• | 2014 vs. 2013: For the years ended December 31, 2014 and 2013, subscriber acquisition costs were $493,464 and $495,610, respectively, a decrease of $2,146, and decreased as a percentage of total revenue. Improved OEM subsidy rates per vehicle and a change in a contract with an automaker decreased subscriber acquisition costs. The decrease was partially offset by the elimination of the benefit to earnings in 2014 from the amortization of deferred credits on executory contracts initially recognized in purchase price accounting associated with the Merger and increased subsidy costs related to a larger number of satellite radio installations in new vehicles. For the year ended December 31, 2013, the benefit to earnings from amortization of deferred credits was $64,365. |
• | 2013 vs. 2012: For the years ended December 31, 2013 and 2012, subscriber acquisition costs were $495,610 and $474,697, respectively, an increase of 4%, or $20,913, but decreased as a percentage of total revenue. The increase was primarily a result of higher subsidies related to increased OEM installations and lower benefit to earnings from the amortization of the deferred credit for acquired executory contracts recognized in purchase price accounting associated with the Merger, partially offset by improved OEM subsidy rates per vehicle. |
We expect subscriber acquisition costs to fluctuate with OEM installations and aftermarket volume; however, the cost of subsidized radio components is expected to decline. We intend to continue to offer subsidies, commissions and other incentives to acquire subscribers.
Sales and Marketing includes costs for marketing, advertising, media and production, including promotional events and sponsorships; cooperative marketing; and personnel. Marketing costs include expenses related to direct mail, outbound telemarketing and email communications.
• | 2014 vs. 2013: For the years ended December 31, 2014 and 2013, sales and marketing expenses were $336,480 and $291,024, respectively, an increase of 16%, or $45,456, and increased as a percentage of total revenue. The increase was primarily due to additional subscriber communications and retention programs associated with a greater number of subscribers and promotional trials, the inclusion of a full year of costs associated with our connected vehicle services business, increased personnel costs, and the elimination of the benefit to earnings in 2014 from the amortization of the deferred credit for acquired executory contracts recognized in purchase price accounting associated with the Merger; partially offset by lower loyalty costs due a change in a contract with an automaker. The benefit to earnings from the amortization of the deferred credit for acquired executory contracts for the year ended December 31, 2013 was $12,922. |
• | 2013 vs. 2012: For the years ended December 31, 2013 and 2012, sales and marketing expenses were $291,024 and $248,905, respectively, an increase of 17%, or $42,119, and increased as a percentage of total revenue. The increase was primarily due to additional subscriber communications and retention programs associated with a greater number of subscribers and promotional trials. |
We anticipate that sales and marketing expenses will increase as we expand programs to retain our existing subscribers, win back former subscribers, and attract new subscribers.
Engineering, Design and Development consists primarily of compensation and related costs to develop chipsets and new products and services, research and development for broadcast information systems and costs associated with the incorporation of our radios into new vehicles manufactured by automakers.
• | 2014 vs. 2013: For the years ended December 31, 2014 and 2013, engineering, design and development expenses were $62,784 and $57,969, respectively, an increase of 8%, or $4,815, but remained flat as a percentage of total revenue. The increase was driven primarily by the inclusion of a full year of costs associated with our connected vehicle services business and higher personnel costs. |
27
• | 2013 vs. 2012: For the years ended December 31, 2013 and 2012, engineering, design and development expenses were $57,969 and $48,843, respectively, an increase of 19%, or $9,126, but remained flat as a percentage of total revenue. The increase was driven primarily by higher product development costs, costs related to enhanced subscriber features and functionality for our service, and by the reversal of certain non-recurring engineering charges that were recorded in the second quarter of 2012. |
We expect engineering, design and development expenses to increase in future periods as we continue to develop our products and services.
General and Administrative primarily consists of compensation and related costs for personnel and facilities, and include costs related to our finance, legal, human resources and information technologies departments.
• | 2014 vs. 2013: For the years ended December 31, 2014 and 2013, general and administrative expenses were $293,938 and $262,135, respectively, an increase of 12%, or $31,803, and remained flat as a percentage of total revenue. The increase was primarily driven by the inclusion of a full year of costs associated with our connected vehicle services business, as well as higher legal, personnel and facilities costs. |
• | 2013 vs. 2012: For the years ended December 31, 2013 and 2012, general and administrative expenses were $262,135 and $261,905, respectively, an increase of less than 1%, or $230, but decreased as a percentage of total revenue. The increase was primarily due to higher information technology costs, offset by lower legal costs. |
We expect our general and administrative expenses to increase in future periods as a result of, among other things, enhanced information technology, on-going legal costs and personnel costs to support the growth of our business.
Depreciation and Amortization represents the recognition in earnings of the acquisition cost of assets used in operations, including our satellite constellations, property, equipment and intangible assets, over their estimated service lives.
• | 2014 vs. 2013: For the years ended December 31, 2014 and 2013, depreciation and amortization expense was $266,423 and $253,314, respectively, an increase of 5%, or $13,109, but decreased as a percentage of total revenue. Depreciation and amortization expense increased as a result of the inclusion of costs associated with our connected vehicle services business and additional assets placed in-service, including our FM-6 satellite which was placed in-service in late 2013. The increase was offset by a reduction of amortization associated with the stepped-up basis in assets acquired in the Merger (including intangible assets, satellites, property and equipment) through the end of their estimated useful lives and certain satellites reaching the end of their estimated useful lives. |
• | 2013 vs. 2012: For the years ended December 31, 2013 and 2012, depreciation and amortization expense was $253,314 and $266,295, respectively, a decrease of 5%, or $12,981, and decreased as a percentage of total revenue. The decrease was driven by certain satellites reaching the end of their estimated useful lives, partially offset by additional assets placed in-service. |
Other Income (Expense)
Interest Expense, Net of Amounts Capitalized, includes interest on outstanding debt, reduced by interest capitalized in connection with the construction of satellites and related launch vehicles.
• | 2014 vs. 2013: For the years ended December 31, 2014 and 2013, interest expense was $269,010 and $204,671, respectively, an increase of 31%, or $64,339. The increase was primarily due to higher average debt and a reduction in interest capitalized following the launch of our FM-6 satellite. The increase was partially offset by lower average interest rates resulting from the redemption or repayment of higher interest rate debt throughout 2013. |
• | 2013 vs. 2012: For the years ended December 31, 2013 and 2012, interest expense was $204,671 and $265,321, respectively, a decrease of 23%, or $60,650. The decrease was primarily due to lower average interest rates resulting from the redemption or repayment of $2,535,500 of higher interest rate debt throughout 2012 and 2013, which was replaced with $2,650,000 of lower interest rate debt. |
We expect interest expense to increase in future periods to the extent our total debt outstanding increases.
28
Loss on Extinguishment of Debt and Credit Facilities, Net, includes losses incurred as a result of the conversion and retirement of certain debt.
• | 2014 vs. 2013: For the years ended December 31, 2014 and 2013, loss on extinguishment of debt and credit facilities, net, was $0 and $190,577, respectively. During the year ended December 31, 2013, a loss was recorded on the extinguishment of our then outstanding 7.625% Senior Notes due 2018 and 8.75% Senior Notes due 2015. |
• | 2013 vs. 2012: For the year ended December 31, 2013, loss on extinguishment of debt and credit facilities, net, was $190,577. The loss in 2013 was recorded on the extinguishment of our 7.625% Senior Notes due 2018 and our 8.75% Senior Notes due 2015. During the year ended December 31, 2012, a $132,726 loss was recorded on the extinguishment of our 13% Senior Notes due 2013 and our 9.75% Senior Secured Notes due 2015. |
Interest and Investment Income includes realized gains and losses, interest income, and our share of the income or loss of Sirius XM Canada.
• | 2014 vs. 2013: For the years ended December 31, 2014 and 2013, interest and investment income was $15,498 and $6,976, respectively. The income for the year ended December 31, 2014 was driven by the dividends received from Sirius XM Canada, our share of Sirius XM Canada's net income and income from the conversion of certain debentures into shares of Sirius XM Canada, partially offset by the amortization expense related to our equity method intangible assets. The interest and investment income for 2013 was primarily due to the inclusion of our share of Sirius XM Canada's net income, partially offset by the amortization expense related to our equity method intangible assets. |
• | 2013 vs. 2012: For the year ended December 31, 2013, interest and investment income was $6,976 compared to $716 in 2012. The interest and investment income for 2013 and 2012 was primarily due to our share of Sirius XM Canada's net income, partially offset by the amortization expense related to our equity method intangible assets. |
Loss on Change In Value of Derivatives represents the change in fair value of the commitments under the share repurchase agreement with Liberty Media, which are accounted for as a derivative.
• | 2014 vs. 2013: For the years ended December 31, 2014 and 2013, the loss on change in value of derivatives was $34,485 and $20,393, respectively. The loss resulted from a change in the market value of our common stock to be purchased under the share repurchase agreement with Liberty Media. On April 25, 2014, we completed the final purchase installment under this share repurchase agreement and repurchased $340,000 of our shares of common stock from Liberty Media at a price of $3.66 per share. |
• | 2013 vs. 2012: For the year ended December 31, 2013, net loss on change in value of derivatives was $20,393 which resulted from the change in value of the shares to be repurchased under the share repurchase agreement with Liberty Media. |
29
Income Taxes
Income Tax (Expense) Benefit includes the change in our deferred tax assets, foreign withholding taxes and current federal and state tax expenses.
• | 2014 vs. 2013: For the years ended December 31, 2014 and 2013, income tax expense was $337,545 and $259,877, respectively. Our annual effective tax rate for the year ended December 31, 2014 was 41%. The primary driver for the increase over the statutory rate is related to the $34,485 loss on the change in fair value of the derivative related to the share repurchase agreement with Liberty Media. |
• | 2013 vs. 2012: For the year ended December 31, 2013, income tax expense was $259,877 compared to an income tax benefit of $2,998,234 for 2012. Our annual effective tax rate for the year ending December 31, 2013 was 41%. The primary driver for the increase over the statutory rate is a result of $9,545 of non-deductible expenses, primarily related to the loss on change in value of derivatives. For the year ended December 31, 2012, we released $3,195,651 of valuation allowance due to the cumulative positive evidence that it is more likely than not that our deferred tax assets will be realized. |
We account for the effect of tax law changes in the quarter in which they are enacted. Certain proposed tax legislation would reduce significantly our deferred tax asset related to net operating loss carryforwards for the District of Columbia. The final tax legislation may result in the establishment of a valuation allowance and may adversely impact the tax rate in the quarter the change occurs.
Key Operating Metrics
In this section, we present certain financial and operating performance measures that are not calculated and presented in accordance with generally accepted accounting principles in the United States (“Non-GAAP”). These metrics include: average monthly revenue per subscriber, or ARPU; customer service and billing expenses, per average subscriber; subscriber acquisition cost, or SAC, per installation; free cash flow; and adjusted EBITDA. These measures exclude the impact of share-based payment expense and certain purchase price accounting adjustments related to the Merger, which include the: (i) elimination of deferred revenue associated with the investment in XM Canada, (ii) recognition of deferred subscriber revenues not recognized in purchase price accounting, and (iii) elimination of the benefit of deferred credits on executory contracts, which are primarily attributable to third party arrangements with an OEM and programming providers. We use these Non-GAAP financial measures to manage our business, to set operational goals and as a basis for determining performance-based compensation for our employees.
Free cash flow is a metric that our management and board of directors use to evaluate the cash generated by our operations, net of capital expenditures and other investment activity. In a capital intensive business, with significant investments in satellites, we look at our operating cash flow, net of these investing cash outflows, to determine cash available for future subscriber acquisition and capital expenditures, to repurchase or retire debt, to acquire other companies and to evaluate our ability to return capital to stockholders. We believe free cash flow is an indicator of the long-term financial stability of our business. Free cash flow, which is reconciled to “Net cash provided by operating activities,” is a Non-GAAP financial measure. This measure can be calculated by deducting amounts under the captions "Additions to property and equipment" and deducting or adding Restricted and other investment activity from "Net cash provided by operating activities" from the audited consolidated statements of cash flows. Free cash flow should be used in conjunction with other GAAP financial performance measures and may not be comparable to free cash flow measures presented by other companies. Free cash flow should be viewed as a supplemental measure rather than an alternative measure of cash flows from operating activities, as determined in accordance with GAAP. Free cash flow is limited and does not represent remaining cash flows available for discretionary expenditures due to the fact that the measure does not deduct the payments required for debt maturities. We believe free cash flow provides useful supplemental information to investors regarding our current and projected cash flow, along with other GAAP measures (such as cash flows from operating and investing activities), to determine our financial condition, and to compare our operating performance to other communications, entertainment and media companies.
We believe these Non-GAAP financial measures provide useful information to investors regarding our financial condition and results of operations. We believe investors find these Non-GAAP financial performance measures useful in evaluating our core trends because it provides a direct view of our underlying contractual costs. We believe investors use our current and projected adjusted EBITDA to estimate our current or prospective enterprise value and to make investment decisions. By providing these Non-GAAP financial measures, together with the reconciliations to the most directly comparable GAAP measure, we believe we are enhancing investors' understanding of our business and our results of operations.
30
These Non-GAAP financial measures should be viewed in addition to, and not as an alternative for or superior to, our reported results prepared in accordance with GAAP. In addition, these Non-GAAP financial measures may not be comparable to similarly-titled measures by other companies. Please refer to the glossary (pages 38 through 44) for a further discussion of such Non-GAAP financial measures and reconciliations to the most directly comparable GAAP measure. The following table contains our key operating metrics based on our adjusted results of operations for the years ended December 31, 2014, 2013 and 2012. Subscribers to our connected vehicle services are not included in our subscriber count or subscriber-based operating metrics:
Unaudited | ||||||||||||
For the Years Ended December 31, | ||||||||||||
(in thousands, except for subscriber, per subscriber and per installation amounts) | 2014 | 2013 | 2012 | |||||||||
Self-pay subscribers | 22,522,638 | 21,081,817 | 19,570,274 | |||||||||
Paid promotional subscribers | 4,788,449 | 4,477,493 | 4,330,062 | |||||||||
Ending subscribers | 27,311,087 | 25,559,310 | 23,900,336 | |||||||||
Self-pay subscribers | 1,440,821 | 1,511,543 | 1,661,532 | |||||||||
Paid promotional subscribers | 310,956 | 147,431 | 345,980 | |||||||||
Net additions | 1,751,777 | 1,658,974 | 2,007,512 | |||||||||
Daily weighted average number of subscribers | 26,283,785 | 24,886,300 | 22,794,170 | |||||||||
Average self-pay monthly churn | 1.9 | % | 1.8 | % | 1.9 | % | ||||||
New vehicle consumer conversion rate | 41 | % | 44 | % | 45 | % | ||||||
ARPU (1) | $ | 12.38 | $ | 12.23 | $ | 12.00 | ||||||
SAC, per installation (1) | $ | 34 | $ | 43 | $ | 47 | ||||||
Customer service and billing expenses, per average subscriber (1) | $ | 1.07 | $ | 1.06 | $ | 1.07 | ||||||
Free cash flow (1) | $ | 1,155,776 | $ | 927,496 | $ | 709,446 | ||||||
Adjusted EBITDA (1) | $ | 1,467,775 | $ | 1,166,140 | $ | 920,343 | ||||||
(1) See pages 38 through 44 for glossary and a reconciliation to the most directly comparable GAAP measure. | ||||||||||||
Subscribers. At December 31, 2014, we had 27,311,087 subscribers, an increase of 1,751,777 subscribers, or 7%, from the 25,559,310 subscribers as of December 31, 2013.
• | 2014 vs. 2013: For the years ended December 31, 2014 and 2013, net additions were 1,751,777 and 1,658,974, respectively, an increase of 6%, or 92,803. An increase in paid promotional subscribers in 2014 compared to 2013 was partially offset by a slight decline in self-pay net additions for the same period. The increase in paid promotional net additions was due to a growth in sales by automakers offering paid trial subscriptions. Self-pay net additions declined slightly in 2014 compared to 2013 as record new and used car conversions were offset by an increase in churn associated with our larger subscriber base. The increase in churn was primarily attributed to an increase in existing self-pay subscribers migrating to unpaid trials. |
• | 2013 vs. 2012: For the years ended December 31, 2013 and 2012, net additions were 1,658,974 and 2,007,512, respectively, a decrease of 17%, or 348,538. Self-pay net additions declined in 2013 compared to 2012 primarily due to higher vehicle turnover rates. Paid promotional net additions declined, in part, as a result of a change from a paid trial to an unpaid trial in the fourth quarter of 2013 pursuant to an agreement with an OEM, resulting in a substantial volume of paid promotional trial deactivations without the corresponding paid trial starts in the same period. |
Average Self-pay Monthly Churn is derived by dividing the monthly average of self-pay deactivations for the period by the average number of self-pay subscribers for the period. (See accompanying glossary on pages 38 through 44 for more details.)
• | 2014 vs. 2013: For the years ended December 31, 2014 and 2013, our average self-pay monthly churn rate was 1.9% and 1.8%, respectively. The increase was due to increased vehicle related churn associated with existing self-pay subscribers migrating to unpaid trials, offset by improvements in voluntary churn. |
31
• | 2013 vs. 2012: For the years ended December 31, 2013 and 2012, our average self-pay monthly churn rate was 1.8% and 1.9%, respectively. The decrease was due to a higher mix of existing subscribers migrating to paid trials in new vehicles which are not included in average self-pay churn. |
New Vehicle Consumer Conversion Rate is the percentage of owners and lessees of new vehicles that receive our service and convert to become self-paying subscribers after an initial promotional period. The metric excludes rental and fleet vehicles. (See accompanying glossary on pages 38 through 44 for more details).
• | 2014 vs. 2013: For the years ended December 31, 2014 and 2013, the new vehicle consumer conversion rate was 41% and 44%, respectively. The decrease in the new vehicle consumer conversion rate was primarily due to an increased penetration rate and lower conversion of first-time satellite enabled car buyers and lessees. |
• | 2013 vs. 2012: For the years ended December 31, 2013 and 2012, the new vehicle consumer conversion rate was 44% and 45%, respectively. The decrease in the new vehicle consumer conversion rate was primarily due to the mix of sales by OEMs. |
ARPU is derived from total earned subscriber revenue (excluding revenue derived from our connected vehicle services business), net advertising revenue and other subscription-related revenue, net of purchase price accounting adjustments, divided by the number of months in the period, divided by the daily weighted average number of subscribers for the period. (For a reconciliation to GAAP see the accompanying glossary on pages 38 through 44 for more details.)
• | 2014 vs. 2013: For the years ended December 31, 2014 and 2013, ARPU was $12.38 and $12.23, respectively. The increase was driven primarily by the contribution of the U.S. Music Royalty Fee, and the impact of the increase in certain of our subscription rates beginning in January 2014. The positive result was partially offset by growth in subscription discounts and limited channel line-up plans offered through our customer acquisition and retention programs, lifetime subscription plans that have reached full revenue recognition and changes in contracts with an automaker and a rental car company. |
• | 2013 vs. 2012: For the years ended December 31, 2013 and 2012, ARPU was $12.23 and $12.00, respectively. The increase was driven primarily by the contribution of the U.S. Music Royalty Fee, the impact of the increase in certain of our subscription rates beginning in January 2012, and an increase in subscriptions to premium services, partially offset by subscription discounts offered through customer acquisition and retention programs, and lifetime subscription plans that have reached full revenue recognition. |
SAC, Per Installation, is derived from subscriber acquisition costs and margins from the sale of radios, components and accessories, excluding purchase price accounting adjustments, divided by the number of satellite radio installations in new vehicles and shipments of aftermarket radios for the period. (For a reconciliation to GAAP see the accompanying glossary on pages 38 through 44 for more details.)
• | 2014 vs. 2013: For the years ended December 31, 2014 and 2013, SAC, per installation, was $34 and $43, respectively. The decrease was primarily due to improvements in contractual OEM rates. |
• | 2013 vs. 2012: For the years ended December 31, 2013 and 2012, SAC, per installation, was $43 and $47, respectively. The decrease was primarily due to lower subsidies per vehicle. |
Customer Service and Billing Expenses, Per Average Subscriber, is derived from total customer service and billing expenses, excluding connected vehicle customer service and billing expenses and share-based payment expense, divided by the number of months in the period, divided by the daily weighted average number of subscribers for the period. (For a reconciliation to GAAP see the accompanying glossary on pages 38 through 44 for more details.)
• | 2014 vs. 2013: For the years ended December 31, 2014 and 2013, customer service and billing expenses, per average subscriber, were $1.07 and $1.06, respectively. The increase was primarily driven by increased bad debt expense. |
• | 2013 vs. 2012: For the years ended December 31, 2013 and 2012, customer service and billing expenses, per average subscriber, were $1.06 and $1.07, respectively. The decrease was primarily driven by higher subscriber growth compared to spend for agent staffing and training. |
32
Free Cash Flow includes the net cash provided by operations, additions to property and equipment, and restricted and other investment activity. (For a reconciliation to GAAP see the accompanying glossary on pages 38 through 44 for more details.)
• | 2014 vs. 2013: For the years ended December 31, 2014 and 2013, free cash flow was $1,155,776 and $927,496, respectively, an increase of $228,280. The increase was primarily driven by higher net cash provided by operating activities from improved performance, collections from subscribers and distributors, the absence of satellite construction related payments and dividends received from Sirius XM Canada, partially offset by payments related to improvements to our terrestrial repeater network. |
• | 2013 vs. 2012: For the years ended December 31, 2013 and 2012, free cash flow was $927,496 and $709,446, respectively, an increase of $218,050. The increase was primarily driven by higher net cash provided by operating activities from improved operating performance, lower interest payments, and higher collections from subscribers and distributors, partially offset by payments related to the launch of our FM-6 satellite and the purchase of certain long-lead parts for a future satellite. |
Adjusted EBITDA. EBITDA is defined as net income before interest and investment income (loss); interest expense, net of amounts capitalized; income tax (expense) benefit and depreciation and amortization. Adjusted EBITDA excludes the impact of other income and expense, losses on extinguishment of debt, loss on change in value of derivatives as well as certain other non-cash charges, such as certain purchase price accounting adjustments and share-based payment expense. (For a reconciliation to GAAP see the accompanying glossary on pages 38 through 44 for more details.)
• | 2014 vs. 2013: For the years ended December 31, 2014 and 2013, adjusted EBITDA was $1,467,775 and $1,166,140, respectively, an increase of 26%, or $301,635. The increase was due to growth in adjusted revenues primarily as a result of the increase in our subscriber base and certain of our subscription rates, improved revenue share and OEM subsidy rates per vehicle, and the renewal of certain programming agreements at more cost effective terms; partially offset by higher legal expenses and costs associated with the growth in our revenues and subscriber base. |
• | 2013 vs. 2012: For the years ended December 31, 2013 and 2012, adjusted EBITDA was $1,166,140 and $920,343, respectively, an increase of 27%, or $245,797. The increase was primarily due to increases in adjusted revenues, partially offset by increases in expenses included in adjusted EBITDA. The increase in adjusted revenues was primarily due to the increase in our subscriber base and certain of our subscription rates. The increase in expenses was primarily driven by higher revenue share and royalties expenses associated with growth in revenues, sales and marketing costs related to subscriber communications and retention marketing, customer service and billing costs related to increased agent training and staffing as well as subscriber volume and subscriber acquisition costs. |
Liquidity and Capital Resources
Cash Flows for the year ended December 31, 2014 compared with the year ended December 31, 2013 and the year ended December 31, 2013 compared with the year ended December 31, 2012.
As of December 31, 2014 and December 31, 2013, we had $147,724 and $134,805, respectively, of cash and cash equivalents. The following table presents a summary of our cash flow activity for the periods set forth below:
For the Years Ended December 31, | |||||||||||||||||||
(in thousands) | 2014 | 2013 | 2012 | 2014 vs. 2013 | 2013 vs. 2012 | ||||||||||||||
Net cash provided by operating activities | $ | 1,253,244 | $ | 1,102,832 | $ | 806,765 | $ | 150,412 | $ | 296,067 | |||||||||
Net cash used in investing activities | (96,324 | ) | (700,688 | ) | (97,319 | ) | 604,364 | (603,369 | ) | ||||||||||
Net cash used in financing activities | (1,144,001 | ) | (788,284 | ) | (962,491 | ) | (355,717 | ) | 174,207 | ||||||||||
Net increase (decrease) in cash and cash equivalents | 12,919 | (386,140 | ) | (253,045 | ) | 399,059 | (133,095 | ) | |||||||||||
Cash and cash equivalents at beginning of period | 134,805 | 520,945 | 773,990 | (386,140 | ) | (253,045 | ) | ||||||||||||
Cash and cash equivalents at end of period | $ | 147,724 | $ | 134,805 | $ | 520,945 | $ | 12,919 | $ | (386,140 | ) | ||||||||
33
Cash Flows Provided by Operating Activities
Cash flows provided by operating activities increased by $150,412 to $1,253,244 for the year ended December 31, 2014 from $1,102,832 for the year ended December 31, 2013. Cash flows provided by operating activities increased by $296,067 to $1,102,832 for the year ended December 31, 2013 from $806,765 for the year ended December 31, 2012.
Our largest source of cash provided by operating activities is generated by subscription and subscription-related revenues. We also generate cash from the sale of advertising on certain non-music channels and the sale of satellite radios, components and accessories. Our primary uses of cash from operating activities include revenue share and royalty payments to distributors and content providers, and payments to radio manufacturers, distributors and automakers. In addition, uses of cash from operating activities include payments to vendors to service, maintain and acquire subscribers, general corporate expenditures, and compensation and related costs.
Cash Flows Used in Investing Activities
Cash flows used in investing activities are primarily due to additional spending to improve our terrestrial repeater network and for capitalized software, partially offset by the special one-time dividend received from Sirius XM Canada of $24,178. We expect to continue to incur significant costs to improve our terrestrial repeater network and broadcast and administrative infrastructure. In 2013, our cash flows used in investing activities included $525,352 related to our acquisition of the connected vehicle business of Agero, Inc. In 2012, our cash flows used in investing activities primarily related to capital expenditures for property and equipment.
Cash Flows Used in Financing Activities
Cash flows used in financing activities consists of the issuance and repayment of long-term debt, cash used in our stock option program and the purchase of common stock under our share repurchase program. Proceeds from long-term debt, related party debt and equity issuances have been used to fund our operations, acquire the connected vehicle business of Agero, Inc., construct and launch new satellites and invest in other infrastructure improvements.
Cash flows used in financing activities in 2014 were primarily due to the purchase of shares of our common stock under our repurchase program for $2,496,799 and repayments under the Credit Facility. In 2014, we issued $1,500,000 aggregate principal amount of 6.00% Senior Notes due 2024. Cash flows used in financing activities in 2013 were primarily due to the purchase of shares of our common stock under our share repurchase program for $1,762,360, and the extinguishment of $800,000 of our then outstanding 8.75% Senior Notes due 2015 and $700,000 of our then outstanding 7.625% Senior Notes due 2018. In 2013, we issued $650,000 aggregate principal amount of 5.875% Senior Notes due 2020, $600,000 aggregate principal amount of 5.75% Senior Notes due 2021, $500,000 aggregate principal amount of 4.25% Senior Notes due 2020 and $500,000 aggregate principal amount of 4.625% Senior Notes due 2023. Cash flows used in financing activities in 2012 were primarily due to the repayment of the remaining balance of our then outstanding 13% Senior Notes due 2013 and our then outstanding 9.75% Senior Secured Notes due 2015, partially offset by the issuance of our 5.25% Senior Notes due 2022 and the exercise of options.
Future Liquidity and Capital Resource Requirements
Based upon our current business plans, we expect to fund operating expenses, capital expenditures, working capital requirements, interest payments, taxes and scheduled maturities of our debt with existing cash, cash flow from operations and borrowings under our Credit Facility. We believe that we have sufficient cash and cash equivalents as well as debt capacity to cover our estimated short-term and long-term funding needs, stock repurchases and strategic opportunities.
Our ability to meet our debt and other obligations depends on our future operating performance and on economic, financial, competitive and other factors. We continually review our operations for opportunities to adjust the timing of expenditures to ensure that sufficient resources are maintained.
We regularly evaluate our business plans and strategy. These evaluations often result in changes to our business plans and strategy, some of which may be material and significantly change our cash requirements. These changes in our business plans or strategy may include: the acquisition of unique or compelling programming; the introduction of new features or services; significant new or enhanced distribution arrangements; investments in infrastructure, such as satellites, equipment or radio spectrum; and acquisitions, including acquisitions that are not directly related to our satellite radio business.
34
Stock Repurchase Program
Since December 2012, our board of directors has approved for repurchase an aggregate of $6,000,000 of our common stock. Our board of directors did not establish an end date for this stock repurchase program. Shares of common stock may be purchased from time to time on the open market, pursuant to pre-set trading plans meeting the requirements of Rule 10b5-1 under the Exchange Act, in privately negotiated transactions, including transactions with Liberty Media and its affiliates, or otherwise.
As of December 31, 2014, our cumulative repurchases since December 2012 under our stock repurchase program totaled 1,259,274,498 shares for $4,285,192, and $1,714,808 remained available under our stock repurchase program. We expect to fund future repurchases through a combination of cash on hand, cash generated by operations and future borrowings.
Debt Covenants
The indentures governing Sirius XM's senior notes, and the agreement governing Sirius XM's Credit Facility include restrictive covenants. As of December 31, 2014, we were in compliance with such covenants. For a discussion of our “Debt Covenants,” refer to Note 14 to our consolidated financial statements in Item 8 of this Annual Report on Form 10-K.
Off-Balance Sheet Arrangements
We do not have any significant off-balance sheet arrangements other than those disclosed in Note 17 to our consolidated financial statements in Item 8 of this Annual Report on Form 10-K that are reasonably likely to have a material effect on our financial condition, results of operations, liquidity, capital expenditures or capital resources.
Contractual Cash Commitments
For a discussion of our “Contractual Cash Commitments,” refer to Note 17 to our consolidated financial statements in Item 8 of this Annual Report on Form 10-K.
Related Party Transactions
For a discussion of “Related Party Transactions,” refer to Note 12 to our consolidated financial statements in Item 8 of this Annual Report on Form 10-K.
Critical Accounting Policies and Estimates
Our consolidated financial statements are prepared in accordance with GAAP, which requires management to make estimates and assumptions that affect the reported amounts of assets and liabilities at the date of the financial statements and the reported amounts of revenues and expenses during the periods. Accounting estimates require the use of significant management assumptions and judgments as to future events, and the effect of those events cannot be predicted with certainty. The accounting estimates will change as new events occur, more experience is acquired and more information is obtained. We evaluate and update our assumptions and estimates on an ongoing basis and use outside experts to assist in that evaluation when we deem necessary. We have identified all significant accounting policies in Note 3 to our consolidated financial statements in Item 8 of this Annual Report on Form 10-K.
Goodwill. Goodwill represents the excess of the purchase price over the estimated fair value of net tangible and identifiable intangible assets acquired in business combinations. Our annual impairment assessment of our single reporting unit is performed as of the fourth quarter of each year. Assessments are performed at other times if events or circumstances indicate it is more likely than not that the asset is impaired. Step one of the impairment assessment compares the fair value of the entity to its carrying value and if the fair value exceeds its carrying value, goodwill is not impaired. If the carrying value exceeds the fair value, the implied fair value of goodwill is compared to the carrying value of goodwill; an impairment loss will be recorded for the amount the carrying value exceeds the implied fair value. Our quantitative assessment is based on our enterprise fair value. At the date of our annual assessment for 2014, the fair value of our single reporting unit substantially exceeded its carrying value and therefore was not at risk of failing step one of ASC 350-20, Goodwill. Subsequent to our annual evaluation of the carrying value of goodwill, there were no events or circumstances that triggered the need for an interim evaluation for impairment. As a result, there were no impairment charges to our goodwill during the years ended December 31, 2014 or 2013.
Long-Lived and Indefinite-Lived Assets. We carry our long-lived assets at cost less accumulated amortization and depreciation. We review our long-lived assets for impairment whenever events or changes in circumstances indicate that the
35
carrying amount of an asset is not recoverable. At the time an impairment in the value of a long-lived asset is identified, the impairment is measured as the amount by which the carrying amount of a long-lived asset exceeds its fair value.
Our annual impairment assessment of indefinite-lived assets, our FCC licenses and XM trademark, is performed as of the fourth quarter of each year and an assessment is made at other times if events or changes in circumstances indicate that it is more likely than not that the asset is impaired. ASU 2012-02, Testing Indefinite-Lived Intangible Assets for Impairment, establishes an option to first perform a qualitative assessment to determine whether it is more likely than not that an asset is impaired. If the qualitative assessment supports that it is more likely than not that the fair value of the asset exceeds its carrying value, a company is not required to perform a quantitative impairment test. If the qualitative assessment does not support the fair value of the asset, then a quantitative assessment is performed. During the fourth quarter of 2014, a qualitative impairment analysis was performed and we determined that the fair value of our FCC licenses and trademark substantially exceeded the carrying value and therefore was not at risk of impairment. Our qualitative assessment includes the consideration of our long-term financial projections, current and historical weighted average cost of capital and liquidity factors, legal and regulatory issues and industry and market pressures. Subsequent to our annual evaluation of the carrying value of our long-lived assets, there were no events or circumstances that triggered the need for an impairment evaluation.
There were no changes in the carrying value of our indefinite life intangible assets during the years ended December 31, 2014 or 2013.
Useful Life of Broadcast/Transmission System. Our satellite system includes the costs of our satellite construction, launch vehicles, launch insurance, capitalized interest, spare satellites, terrestrial repeater network and satellite uplink facilities. We monitor our satellites for impairment whenever events or changes in circumstances indicate that the carrying amount of the asset is not recoverable.
We operate five in-orbit Sirius satellites, FM-1, FM-2, FM-3, FM-5 and FM-6. Our FM-1 and FM-2 satellites were launched in 2000 and reached the end of their depreciable lives in 2013, but are still in operation. We estimate that our FM-3 and FM-5 satellites launched in 2000 and 2009, respectively, will operate effectively through the end of their depreciable lives in 2015 and 2024, respectively. Our FM-6 satellite that was launched in 2013 is currently used as an in-orbit spare that is planned to start full-time operation in 2015 and is expected to operate effectively through the end of its depreciable life in 2028.
We operate four in-orbit XM satellites, XM-1, XM-3, XM-4 and XM-5. Our XM-1 satellite reached the end of its depreciable life in 2013 and will be de-orbited in 2015. We estimate that our XM-3 and XM-4 satellites launched in 2005 and 2006, respectively, will reach the end of their depreciable lives in 2020 and 2021, respectively. Our XM-5 satellite was launched in 2010, is used as an in-orbit spare and is expected to reach the end of its depreciable life in 2025.
Our satellites have been designed to last fifteen-years, which is consistent with our satellite performance incentives. Our in-orbit satellites may experience component failures which could adversely affect their useful life. We monitor the operating condition of our in-orbit satellites and if events or circumstances indicate that the depreciable lives of our in-orbit satellites have changed, we will modify the depreciable life accordingly. If we were to revise our estimates, our depreciation expense would change.
Income Taxes. Deferred income taxes are recognized for the tax consequences related to temporary differences between the carrying amount of assets and liabilities for financial reporting purposes and the amounts used for tax purposes, based on enacted tax laws and statutory tax rates applicable to the periods in which the differences are expected to affect taxable income. In determining the period in which related tax benefits are realized for book purposes, excess share-based compensation deductions included in net operating losses are realized after regular net operating losses are exhausted; excess tax compensation benefits are recorded off-balance sheet as a memo entry until the period the excess tax benefit is realized through a reduction of taxes payable. Income tax expense is the sum of current income tax plus the change in deferred tax assets and liabilities.
We assess the recoverability of deferred tax assets at each reporting date and where applicable a valuation allowance is recognized when, based on the weight of all available evidence, it is considered more likely than not that all, or some portion, of the deferred tax assets will not be realized. Our assessment includes an analysis of whether deferred tax assets will be realized in the ordinary course of operations based on the available positive and negative evidence, including the scheduling of deferred tax liabilities and forecasted income from operations. The underlying assumptions we use in forecasting future taxable income require significant judgment. In the event that actual income from operations differs from forecasted amounts, or if we change our estimates of forecasted income from operations, we could record additional charges or reduce allowances in order
36
to adjust the carrying value of deferred tax assets to their realizable amount. Such adjustments could be material to our consolidated financial statements.
As of December 31, 2014, we had a valuation allowance of $4,995 relating to deferred tax assets that are not likely to be realized due to certain state net operating loss limitations.
37
Glossary
Adjusted EBITDA - EBITDA is defined as net income before interest and investment income (loss); interest expense, net of amounts capitalized; income tax expense and depreciation and amortization. We adjust EBITDA to exclude the impact of other income and expense, loss on extinguishment of debt, loss on change in value of derivatives as well as certain other charges discussed below. This measure is one of the primary Non-GAAP financial measures on which we (i) evaluate the performance of our businesses, (ii) base our internal budgets and (iii) compensate management. Adjusted EBITDA is a Non-GAAP financial performance measure that excludes (if applicable): (i) certain adjustments as a result of the purchase price accounting for the Merger, (ii) depreciation and amortization and (iii) share-based payment expense. The purchase price accounting adjustments include: (i) the elimination of deferred revenue associated with the investment in XM Canada, (ii) recognition of deferred subscriber revenues not recognized in purchase price accounting, and (iii) elimination of the benefit of deferred credits on executory contracts, which are primarily attributable to third party arrangements with an OEM and programming providers. We believe adjusted EBITDA is a useful measure of the underlying trend of our operating performance, which provides useful information about our business apart from the costs associated with our physical plant, capital structure and purchase price accounting. We believe investors find this Non-GAAP financial measure useful when analyzing our results and comparing our operating performance to the performance of other communications, entertainment and media companies. We believe investors use current and projected adjusted EBITDA to estimate our current and prospective enterprise value and to make investment decisions. Because we fund and build-out our satellite radio system through the periodic raising and expenditure of large amounts of capital, our results of operations reflect significant charges for depreciation expense. The exclusion of depreciation and amortization expense is useful given significant variation in depreciation and amortization expense that can result from the potential variations in estimated useful lives, all of which can vary widely across different industries or among companies within the same industry. We also believe the exclusion of share-based payment expense is useful given share-based payment expense is not directly related to the operational conditions of our business.
Adjusted EBITDA has certain limitations in that it does not take into account the impact to our statements of comprehensive income of certain expenses, including share-based payment expense and certain purchase price accounting for the Merger. We endeavor to compensate for the limitations of the Non-GAAP measure presented by also providing the comparable GAAP measure with equal or greater prominence and descriptions of the reconciling items, including quantifying such items, to derive the Non-GAAP measure. Investors that wish to compare and evaluate our operating results after giving effect for these costs, should refer to net income as disclosed in our consolidated statements of comprehensive income. Since adjusted EBITDA is a Non-GAAP financial performance measure, our calculation of adjusted EBITDA may be susceptible to varying calculations; may not be comparable to other similarly titled measures of other companies; and should not be considered in isolation, as a substitute for, or superior to measures of financial performance prepared in accordance with GAAP. The reconciliation of net income to the adjusted EBITDA is calculated as follows (in thousands):
38
Unaudited | |||||||||||
For the Years Ended December 31, | |||||||||||
2014 | 2013 | 2012 | |||||||||
Net income (GAAP): | $ | 493,241 | $ | 377,215 | $ | 3,472,702 | |||||
Add back items excluded from Adjusted EBITDA: | |||||||||||
Purchase price accounting adjustments: | |||||||||||
Revenues (see pages 40-42) | 7,251 | 7,251 | 7,479 | ||||||||
Operating expenses (see pages 40-42) | (3,781 | ) | (207,854 | ) | (289,278 | ) | |||||
Share-based payment expense (GAAP) | 78,212 | 68,876 | 63,822 | ||||||||
Depreciation and amortization (GAAP) | 266,423 | 253,314 | 266,295 | ||||||||
Interest expense, net of amounts capitalized (GAAP) | 269,010 | 204,671 | 265,321 | ||||||||
Loss on extinguishment of debt and credit facilities, net (GAAP) | — | 190,577 | 132,726 | ||||||||
Interest and investment income (GAAP) | (15,498 | ) | (6,976 | ) | (716 | ) | |||||
Loss on change in value of derivatives (GAAP) | 34,485 | 20,393 | — | ||||||||
Other loss (income) (GAAP) | 887 | (1,204 | ) | 226 | |||||||
Income tax expense (benefit) (GAAP) | 337,545 | 259,877 | (2,998,234 | ) | |||||||
Adjusted EBITDA | $ | 1,467,775 | $ | 1,166,140 | $ | 920,343 | |||||
Adjusted Revenues and Operating Expenses - We define this Non-GAAP financial measure as our actual revenues and operating expenses adjusted to exclude the impact of certain purchase price accounting adjustments from the Merger and share-based payment expense. We use this Non-GAAP financial measure to manage our business, to set operational goals and as a basis for determining performance-based compensation for our employees. The following tables reconcile our actual revenues and operating expenses to our adjusted revenues and operating expenses for the years ended December 31, 2014, 2013 and 2012:
39
Unaudited For the Year Ended December 31, 2014 | |||||||||||||||
(in thousands) | As Reported | Purchase Price Accounting Adjustments | Allocation of Share-based Payment Expense | Adjusted | |||||||||||
Revenue: | |||||||||||||||
Subscriber revenue | $ | 3,554,302 | $ | — | $ | — | $ | 3,554,302 | |||||||
Advertising revenue | 100,982 | — | — | 100,982 | |||||||||||
Equipment revenue | 104,661 | — | — | 104,661 | |||||||||||
Other revenue | 421,150 | 7,251 | — | 428,401 | |||||||||||
Total revenue | $ | 4,181,095 | $ | 7,251 | $ | — | $ | 4,188,346 | |||||||
Operating expenses | |||||||||||||||
Cost of services: | |||||||||||||||
Revenue share and royalties | $ | 810,028 | $ | — | $ | — | $ | 810,028 | |||||||
Programming and content | 297,313 | 3,781 | (9,180 | ) | 291,914 | ||||||||||
Customer service and billing | 370,585 | — | (2,780 | ) | 367,805 | ||||||||||
Satellite and transmission | 86,013 | — | (4,091 | ) | 81,922 | ||||||||||
Cost of equipment | 44,397 | — | — | 44,397 | |||||||||||
Subscriber acquisition costs | 493,464 | — | — | 493,464 | |||||||||||
Sales and marketing | 336,480 | — | (15,454 | ) | 321,026 | ||||||||||
Engineering, design and development | 62,784 | — | (8,675 | ) | 54,109 | ||||||||||
General and administrative | 293,938 | — | (38,032 | ) | 255,906 | ||||||||||
Depreciation and amortization (a) | 266,423 | — | — | 266,423 | |||||||||||
Share-based payment expense | — | — | 78,212 | 78,212 | |||||||||||
Total operating expenses | $ | 3,061,425 | $ | 3,781 | $ | — | $ | 3,065,206 | |||||||
(a) Purchase price accounting adjustments included above exclude the incremental depreciation and amortization associated with the $785,000 stepped up basis in property, equipment and intangible assets as a result of the Merger. The increased depreciation and amortization for the year ended December 31, 2014 was $39,000. | |||||||||||||||
40
Unaudited For the Year Ended December 31, 2013 | |||||||||||||||
(in thousands) | As Reported | Purchase Price Accounting Adjustments | Allocation of Share-based Payment Expense | Adjusted | |||||||||||
Revenue: | |||||||||||||||
Subscriber revenue | $ | 3,284,660 | $ | — | $ | — | $ | 3,284,660 | |||||||
Advertising revenue | 89,288 | — | — | 89,288 | |||||||||||
Equipment revenue | 80,573 | — | — | 80,573 | |||||||||||
Other revenue | 344,574 | 7,251 | — | 351,825 | |||||||||||
Total revenue | $ | 3,799,095 | $ | 7,251 | $ | — | $ | 3,806,346 | |||||||
Operating expenses | |||||||||||||||
Cost of services: | |||||||||||||||
Revenue share and royalties | $ | 677,642 | $ | 122,534 | $ | — | $ | 800,176 | |||||||
Programming and content | 290,323 | 8,033 | (7,584 | ) | 290,772 | ||||||||||
Customer service and billing | 320,755 | — | (2,219 | ) | 318,536 | ||||||||||
Satellite and transmission | 79,292 | — | (3,714 | ) | 75,578 | ||||||||||
Cost of equipment | 26,478 | — | — | 26,478 | |||||||||||
Subscriber acquisition costs | 495,610 | 64,365 | — | 559,975 | |||||||||||
Sales and marketing | 291,024 | 12,922 | (14,792 | ) | 289,154 | ||||||||||
Engineering, design and development | 57,969 | — | (7,405 | ) | 50,564 | ||||||||||
General and administrative | 262,135 | — | (33,162 | ) | 228,973 | ||||||||||
Depreciation and amortization (a) | 253,314 | — | — | 253,314 | |||||||||||
Share-based payment expense | — | — | 68,876 | 68,876 | |||||||||||
Total operating expenses | $ | 2,754,542 | $ | 207,854 | $ | — | $ | 2,962,396 | |||||||
(a) Purchase price accounting adjustments included above exclude the incremental depreciation and amortization associated with the $785,000 stepped up basis in property, equipment and intangible assets as a result of the Merger. The increased depreciation and amortization for the year ended December 31, 2013 was $47,000. | |||||||||||||||
41
Unaudited For the Year Ended December 31, 2012 | |||||||||||||||
(in thousands) | As Reported | Purchase Price Accounting Adjustments | Allocation of Share-based Payment Expense | Adjusted | |||||||||||
Revenue: | |||||||||||||||
Subscriber revenue | $ | 2,962,665 | $ | 228 | $ | — | $ | 2,962,893 | |||||||
Advertising revenue | 82,320 | — | — | 82,320 | |||||||||||
Equipment revenue | 73,456 | — | — | 73,456 | |||||||||||
Other revenue | 283,599 | 7,251 | — | 290,850 | |||||||||||
Total revenue | $ | 3,402,040 | $ | 7,479 | $ | — | $ | 3,409,519 | |||||||
Operating expenses | |||||||||||||||
Cost of services: | |||||||||||||||
Revenue share and royalties | $ | 551,012 | $ | 146,601 | $ | — | $ | 697,613 | |||||||
Programming and content | 278,997 | 37,346 | (6,120 | ) | 310,223 | ||||||||||
Customer service and billing | 294,980 | — | (1,847 | ) | 293,133 | ||||||||||
Satellite and transmission | 72,615 | — | (3,329 | ) | 69,286 | ||||||||||
Cost of equipment | 31,766 | — | — | 31,766 | |||||||||||
Subscriber acquisition costs | 474,697 | 90,503 | — | 565,200 | |||||||||||
Sales and marketing | 248,905 | 14,828 | (10,310 | ) | 253,423 | ||||||||||
Engineering, design and development | 48,843 | — | (6,238 | ) | 42,605 | ||||||||||
General and administrative | 261,905 | — | (35,978 | ) | 225,927 | ||||||||||
Depreciation and amortization (a) | 266,295 | — | — | 266,295 | |||||||||||
Share-based payment expense | — | — | 63,822 | 63,822 | |||||||||||
Total operating expenses | $ | 2,530,015 | $ | 289,278 | $ | — | $ | 2,819,293 | |||||||
(a) Purchase price accounting adjustments included above exclude the incremental depreciation and amortization associated with the $785,000 stepped up basis in property, equipment and intangible assets as a result of the Merger. The increased depreciation and amortization for the year ended December 31, 2012 was $53,000. | |||||||||||||||
ARPU - is derived from total earned subscriber revenue, advertising revenue and other subscription-related revenue, excluding revenue associated with our connected vehicle business, net of purchase price accounting adjustments, divided by the number of months in the period, divided by the daily weighted average number of subscribers for the period. Other subscription-related revenue includes the U.S. Music Royalty Fee. ARPU is calculated as follows (in thousands, except for subscriber and per subscriber amounts):
Unaudited | |||||||||||
For the Years Ended December 31, | |||||||||||
2014 | 2013 | 2012 | |||||||||
Subscriber revenue, excluding connected vehicle (GAAP) | $ | 3,466,050 | $ | 3,272,718 | $ | 2,962,665 | |||||
Add: advertising revenue (GAAP) | 100,982 | 89,288 | 82,320 | ||||||||
Add: other subscription-related revenue (GAAP) | 336,408 | 290,895 | 237,868 | ||||||||
Add: purchase price accounting adjustments | — | — | 228 | ||||||||
$ | 3,903,440 | $ | 3,652,901 | $ | 3,283,081 | ||||||
Daily weighted average number of subscribers | 26,283,785 | 24,886,300 | 22,794,170 | ||||||||
ARPU | $ | 12.38 | $ | 12.23 | $ | 12.00 | |||||
Average self-pay monthly churn - is defined as the monthly average of self-pay deactivations for the period divided by the average number of self-pay subscribers for the period.
42
Customer service and billing expenses, per average subscriber - is derived from total customer service and billing expenses, excluding connected vehicle customer service and billing expenses and share-based payment expense, divided by the number of months in the period, divided by the daily weighted average number of subscribers for the period. We believe the exclusion of share-based payment expense in our calculation of customer service and billing expenses, per average subscriber, is useful as share-based payment expense is not directly related to the operational conditions that give rise to variations in the components of our customer service and billing expenses. Customer service and billing expenses, per average subscriber, is calculated as follows (in thousands, except for subscriber and per subscriber amounts):
Unaudited | |||||||||||
For the Years Ended December 31, | |||||||||||
2014 | 2013 | 2012 | |||||||||
Customer service and billing expenses, excluding connected vehicle (GAAP) | $ | 340,094 | $ | 317,832 | $ | 294,980 | |||||
Less: share-based payment expense (GAAP) | (2,780 | ) | (2,219 | ) | (1,847 | ) | |||||
$ | 337,314 | $ | 315,613 | $ | 293,133 | ||||||
Daily weighted average number of subscribers | 26,283,785 | 24,886,300 | 22,794,170 | ||||||||
Customer service and billing expenses, per average subscriber | $ | 1.07 | $ | 1.06 | $ | 1.07 | |||||
Free cash flow - is derived from cash flow provided by operating activities, capital expenditures and restricted and other investment activity. Free cash flow is calculated as follows (in thousands):
Unaudited | |||||||||||
For the Years Ended December 31, | |||||||||||
2014 | 2013 | 2012 | |||||||||
Cash Flow information | |||||||||||
Net cash provided by operating activities | $ | 1,253,244 | $ | 1,102,832 | $ | 806,765 | |||||
Net cash used in investing activities | $ | (96,324 | ) | $ | (700,688 | ) | $ | (97,319 | ) | ||
Net cash used in financing activities | $ | (1,144,001 | ) | $ | (788,284 | ) | $ | (962,491 | ) | ||
Free Cash Flow | |||||||||||
Net cash provided by operating activities | $ | 1,253,244 | $ | 1,102,832 | $ | 806,765 | |||||
Additions to property and equipment | (121,646 | ) | (173,617 | ) | (97,293 | ) | |||||
Purchases of restricted and other investments | — | (1,719 | ) | (26 | ) | ||||||
Return of capital from investment in unconsolidated entity | 24,178 | — | — | ||||||||
Free cash flow | $ | 1,155,776 | $ | 927,496 | $ | 709,446 | |||||
New vehicle consumer conversion rate - is defined as the percentage of owners and lessees of new vehicles that receive our satellite radio service and convert to become self-paying subscribers after the initial promotion period. At the time satellite radio enabled vehicles are sold or leased, the owners or lessees generally receive trial subscriptions ranging from three to twelve months. We measure conversion rate three months after the period in which the trial service ends. The metric excludes rental and fleet vehicles.
Subscriber acquisition cost, per installation - or SAC, per installation, is derived from subscriber acquisition costs and margins from the sale of radios and accessories, excluding purchase price accounting adjustments, divided by the number of satellite radio installations in new vehicles and shipments of aftermarket radios for the period. Purchase price accounting adjustments associated with the Merger include the elimination of the benefit of amortization of deferred credits on executory contracts recognized at the Merger date attributable to an OEM. SAC, per installation, is calculated as follows (in thousands, except for installation amounts):
43
Unaudited | |||||||||||
For the Years Ended December 31, | |||||||||||
2014 | 2013 | 2012 | |||||||||
Subscriber acquisition costs (GAAP) | $ | 493,464 | $ | 495,610 | $ | 474,697 | |||||
Less: margin from direct sales of radios and accessories (GAAP) | (60,264 | ) | (54,095 | ) | (41,690 | ) | |||||
Add: purchase price accounting adjustments | — | 64,365 | 90,503 | ||||||||
$ | 433,200 | $ | 505,880 | $ | 523,510 | ||||||
Installations | 12,787,537 | 11,765,078 | 11,061,304 | ||||||||
SAC, per installation | $ | 34 | $ | 43 | $ | 47 | |||||
ITEM 7A. QUANTITATIVE AND QUALITATIVE DISCLOSURE ABOUT MARKET RISK
As of December 31, 2014, we did not hold or issue any free-standing derivatives. We hold investments in marketable securities consisting of money market funds, certificates of deposit and investments in debt and equity securities of other entities. We classify our investments in marketable securities as available-for-sale. These securities are consistent with the objectives contained within our investment policy. The basic objectives of our investment policy are the preservation of capital, maintaining sufficient liquidity to meet operating requirements and maximizing yield.
Our debt includes fixed rate instruments and the fair market value of our debt is sensitive to changes in interest rates. Sirius XM's borrowings under the Credit Facility carry a variable interest rate based on LIBOR plus an applicable rate based on its debt to operating cash flow ratio. Currently, we do not use interest rate derivative instruments to manage our exposure to interest rate fluctuations.
ITEM 8. FINANCIAL STATEMENTS AND SUPPLEMENTARY DATA
See Index to Consolidated Financial Statements contained in Item 15 herein.
ITEM 9. CHANGES IN AND DISAGREEMENTS WITH ACCOUNTANTS ON ACCOUNTING AND FINANCIAL DISCLOSURE
None.
ITEM 9A. CONTROLS AND PROCEDURES
Controls and Procedures
We maintain disclosure controls and procedures that are designed to ensure that information required to be disclosed in our reports under the Exchange Act is recorded, processed, summarized and reported within the time periods specified in the Securities and Exchange Commission’s rules and forms, and that such information is accumulated and communicated to our management, including our principal executive officer and principal financial officer, as appropriate, to allow timely decisions regarding required disclosures. Any controls and procedures, no matter how well designed and operated, can provide only reasonable assurance of achieving the desired control objectives. An evaluation was performed under the supervision and with the participation of our management, including James E. Meyer, our Chief Executive Officer, and David J. Frear, our Executive Vice President and Chief Financial Officer, of the effectiveness of the design and operation of our disclosure controls and procedures (as that term is defined in Rule 13a-15(e) and 15d-15(e) under the Exchange Act) as of December 31, 2014. Based on that evaluation, our management, including our Chief Executive Officer and our Chief Financial Officer, concluded that our disclosure controls and procedures were effective as of December 31, 2014. There has been no change in our internal control over financial reporting (as that term is defined in Rule 13a-15(f) and 15d-15(f) under the Exchange Act) during the quarter ended December 31, 2014 that has materially affected, or is reasonably likely to materially affect, our internal control over financial reporting.
44
Management's Report on Internal Control over Financial Reporting
Our management is responsible for establishing and maintaining adequate internal control over financial reporting as defined in Rule 13a-15(f) and 15d-15(f) under the Exchange Act. We have performed an evaluation under the supervision and with the participation of our management, including our Chief Executive Officer and our Chief Financial Officer, of the effectiveness of our internal control over financial reporting. Our management used the updated Internal Control-Integrated Framework (2013) issued by the Committee of Sponsoring Organizations of the Treadway Commission to perform this evaluation. Based on that evaluation, our management, including our Chief Executive Officer and Chief Financial Officer, concluded that our internal control over financial reporting was effective as of December 31, 2014.
KPMG LLP, an independent registered public accounting firm, which has audited and reported on the consolidated financial statements contained in this Annual Report on Form 10-K, has issued its report on the effectiveness of our internal control over financial reporting which follows this report.
Audit Report of the Independent Registered Public Accounting Firm
The effectiveness of our internal control over financial reporting as of December 31, 2014 has been audited by KPMG LLP, an independent registered public accounting firm, as stated in their audit report appearing on page F-2 of this Annual Report on Form 10-K.
ITEM 9B. OTHER INFORMATION
None.
PART III
ITEM 10. DIRECTORS, EXECUTIVE OFFICERS AND CORPORATE GOVERNANCE
Information about our executive officers is contained in the discussion entitled “Executive Officers of the Registrant” in Part I of this Annual Report on Form 10-K.
The additional information required by this Item 10 is incorporated in this report by reference to the applicable information in our definitive proxy statement for the 2015 annual meeting of stockholders set forth under the captions Stock Ownership, Governance of the Company, Item 1. Election of Directors and Item 3. Ratification of Independent Registered Public Accountants, which we expect to file with the Securities and Exchange Commission prior to April 30, 2015.
Code of Ethics
We have adopted a code of ethics that applies to all employees, including executive officers, and to directors. The Code of Ethics is available on the Corporate Governance page of our website at www.siriusxm.com. If we ever were to amend or waive any provision of our Code of Ethics that applies to our principal executive officer, principal financial officer, principal accounting officer or any person performing similar functions, we intend to satisfy our disclosure obligations with respect to any such waiver or amendment by posting such information on our internet website set forth above rather than filing a Form 8-K.
ITEM 11. EXECUTIVE COMPENSATION
The information required by this Item 11 is incorporated in this report by reference to the applicable information in our definitive proxy statement for the 2015 annual meeting of stockholders set forth under the captions Item 1. Election of Directors and, Executive Compensation, which we expect to file with the Securities and Exchange Commission prior to April 30, 2015.
ITEM 12. SECURITY OWNERSHIP OF CERTAIN BENEFICIAL OWNERS AND MANAGEMENT AND RELATED STOCKHOLDER MATTERS
Certain information required by this item is set forth under the heading “Equity Compensation Plan Information” in Part II, Item 5, of this report.
45
The additional information required by this Item 12 is incorporated in this report by reference to the applicable information in our definitive proxy statement for the 2015 annual meeting of stockholders set forth under the caption Stock Ownership, which we expect to file with the Securities and Exchange Commission prior to April 30, 2015.
ITEM 13. CERTAIN RELATIONSHIPS AND RELATED TRANSACTIONS AND DIRECTOR INDEPENDENCE
The information required by this Item 13 is incorporated in this report by reference to the applicable information in our definitive proxy statement for the 2015 annual meeting of stockholders set forth under the captions Governance of the Company and Item 1. Election of Directors, which we expect to file with the Securities and Exchange Commission prior to April 30, 2015.
ITEM 14. PRINCIPAL ACCOUNTANT FEES AND SERVICES
The information required by this Item 14 is incorporated in this report by reference to the applicable information in our definitive proxy statement for the 2015 annual meeting of stockholders set forth under the caption Item 2. Ratification of Independent Registered Public Accountants - Principal Accountant Fees and Services, which we expect to file with the Securities and Exchange Commission prior to April 30, 2015.
PART IV
ITEM 15. EXHIBITS AND FINANCIAL STATEMENT SCHEDULES
Documents filed as part of this report:
(1) Financial Statements. See Index to Consolidated Financial Statements appearing on page F-1.
(2) Financial Statement Schedules. See Index to Consolidated Financial Statements appearing on page F-1.
(3) Exhibits. See Exhibit Index following this report, which is incorporated herein by reference.
46
SIGNATURES
Pursuant to the requirements of Section 13 or 15(d) of the Securities Exchange Act of 1934, the registrant has duly caused this report to be signed on its behalf by the undersigned, thereunto duly authorized on this 5th day of February 2015.
SIRIUS XM HOLDINGS INC. | |
By: | /s/ DAVID J. FREAR |
David J. Frear | |
Executive Vice President and | |
Chief Financial Officer | |
(Principal Financial Officer) | |
47
Pursuant to the requirements of the Securities Exchange Act of 1934, this report has been signed below by the following persons on behalf of the registrant and in the capacities and on the dates indicated.
Signature | Title | Date | |
/s/ GREGORY B. MAFFEI | Chairman of the Board of Directors and Director | February 5, 2015 | |
(Gregory B. Maffei) | |||
/s/ JAMES E. MEYER | Chief Executive Officer and Director (Principal Executive Officer) | February 5, 2015 | |
(James E. Meyer) | |||
/s/ DAVID J. FREAR | Executive Vice President and Chief Financial Officer (Principal Financial Officer) | February 5, 2015 | |
(David J. Frear) | |||
/s/ THOMAS D. BARRY | Senior Vice President and Controller (Principal Accounting Officer) | February 5, 2015 | |
(Thomas D. Barry) | |||
/s/ JOAN L. AMBLE | Director | February 5, 2015 | |
(Joan L. Amble) | |||
/s/ ANTHONY J. BATES | Director | February 5, 2015 | |
(Anthony J. Bates) | |||
/s/ GEORGE W. BODENHEIMER | Director | February 5, 2015 | |
(George W. Bodenheimer) | |||
/s/ MARK D. CARLETON | Director | February 5, 2015 | |
(Mark D. Carleton) | |||
/s/ EDDY W. HARTENSTEIN | Director | February 5, 2015 | |
(Eddy W. Hartenstein) | |||
/s/ JAMES P. HOLDEN | Director | February 5, 2015 | |
(James P. Holden) | |||
/s/ EVAN D. MALONE | Director | February 5, 2015 | |
(Evan D. Malone) | |||
/s/ JAMES F. MOONEY | Director | February 5, 2015 | |
(James F. Mooney) | |||
/s/ CARL E. VOGEL | Director | February 5, 2015 | |
(Carl E. Vogel) | |||
/s/ VANESSA A. WITTMAN | Director | February 5, 2015 | |
(Vanessa A. Wittman) | |||
/s/ DAVID M. ZASLAV | Director | February 5, 2015 | |
(David M. Zaslav) | |||
48
SIRIUS XM HOLDINGS INC. AND SUBSIDIARIES
INDEX TO CONSOLIDATED FINANCIAL STATEMENTS
F-1
Report of Independent Registered Public Accounting Firm
The Board of Directors and Stockholders
Sirius XM Holdings Inc. and subsidiaries:
We have audited the accompanying consolidated balance sheets of Sirius XM Holdings Inc. and subsidiaries as of December 31, 2014 and 2013, and the related consolidated statements of comprehensive income, stockholders’ equity, and cash flows for each of the years in the three‑year period ended December 31, 2014. In connection with our audits of the consolidated financial statements, we also have audited the financial statement schedule listed in Item 15(2). These consolidated financial statements and the financial statement schedule are the responsibility of the Company’s management. Our responsibility is to express an opinion on these consolidated financial statements and the financial statement schedule based on our audits.
We conducted our audits in accordance with the standards of the Public Company Accounting Oversight Board (United States). Those standards require that we plan and perform the audit to obtain reasonable assurance about whether the financial statements are free of material misstatement. An audit includes examining, on a test basis, evidence supporting the amounts and disclosures in the financial statements. An audit also includes assessing the accounting principles used and significant estimates made by management, as well as evaluating the overall financial statement presentation. We believe that our audits provide a reasonable basis for our opinion.
In our opinion, the consolidated financial statements referred to above present fairly, in all material respects, the financial position of Sirius XM Holdings Inc. and subsidiaries as of December 31, 2014 and 2013, and the results of their operations and their cash flows for each of the years in the three-year period ended December 31, 2014, in conformity with U.S. generally accepted accounting principles. Also in our opinion, the related financial statement schedule, when considered in relation to the basic consolidated financial statements taken as a whole, present fairly, in all material respects, the information set forth therein.
We also have audited, in accordance with the standards of the Public Company Accounting Oversight Board (United States), Sirius XM Holdings Inc. and subsidiaries’ internal control over financial reporting as of December 31, 2014, based on criteria established in Internal Control - Integrated Framework (2013) issued by the Committee of Sponsoring Organizations of the Treadway Commission (COSO), and our report dated February 5, 2015 expressed an unqualified opinion on the effectiveness of the Company’s internal control over financial reporting.
/s/ KPMG LLP |
New York, New York
February 5, 2015
F-2
Report of Independent Registered Public Accounting Firm
The Board of Directors and Stockholders
Sirius XM Holdings Inc. and subsidiaries:
We have audited Sirius XM Holdings Inc. and subsidiaries’ internal control over financial reporting as of December 31, 2014, based on criteria established in Internal Control - Integrated Framework (2013) issued by the Committee of Sponsoring Organizations of the Treadway Commission (COSO). Sirius XM Holdings Inc. and subsidiaries’ management is responsible for maintaining effective internal control over financial reporting and for its assessment of the effectiveness of internal control over financial reporting, included in the accompanying Management’s Report on Internal Control over Financial Reporting. Our responsibility is to express an opinion on the Company’s internal control over financial reporting based on our audit.
We conducted our audit in accordance with the standards of the Public Company Accounting Oversight Board (United States). Those standards require that we plan and perform the audit to obtain reasonable assurance about whether effective internal control over financial reporting was maintained in all material respects. Our audit included obtaining an understanding of internal control over financial reporting, assessing the risk that a material weakness exists, and testing and evaluating the design and operating effectiveness of internal control based on the assessed risk. Our audit also included performing such other procedures as we considered necessary in the circumstances. We believe that our audit provides a reasonable basis for our opinion.
A company’s internal control over financial reporting is a process designed to provide reasonable assurance regarding the reliability of financial reporting and the preparation of financial statements for external purposes in accordance with generally accepted accounting principles. A company’s internal control over financial reporting includes those policies and procedures that (1) pertain to the maintenance of records that, in reasonable detail, accurately and fairly reflect the transactions and dispositions of the assets of the company; (2) provide reasonable assurance that transactions are recorded as necessary to permit preparation of financial statements in accordance with generally accepted accounting principles, and that receipts and expenditures of the company are being made only in accordance with authorizations of management and directors of the company; and (3) provide reasonable assurance regarding prevention or timely detection of unauthorized acquisition, use, or disposition of the company’s assets that could have a material effect on the financial statements.
Because of its inherent limitations, internal control over financial reporting may not prevent or detect misstatements. Also, projections of any evaluation of effectiveness to future periods are subject to the risk that controls may become inadequate because of changes in conditions, or that the degree of compliance with the policies or procedures may deteriorate.
In our opinion, Sirius XM Holdings Inc. and subsidiaries maintained, in all material respects, effective internal control over financial reporting as of December 31, 2014, based on criteria established in Internal Control - Integrated Framework (2013) issued by the Committee of Sponsoring Organizations of the Treadway Commission (COSO).
We also have audited, in accordance with the standards of the Public Company Accounting Oversight Board (United States), the consolidated balance sheets of Sirius XM Holdings Inc. and subsidiaries as of December 31, 2014 and 2013, and the related consolidated statements of comprehensive income, stockholders’ equity, and cash flows for each of the years in the three-year period ended December 31, 2014, and our report dated February 5, 2015 expressed an unqualified opinion on those consolidated financial statements.
/s/ KPMG LLP |
New York, New York
February 5, 2015
F-3
SIRIUS XM HOLDINGS INC. AND SUBSIDIARIES
CONSOLIDATED STATEMENTS OF COMPREHENSIVE INCOME
For the Years Ended December 31, | |||||||||||
(in thousands, except per share data) | 2014 | 2013 | 2012 | ||||||||
Revenue: | |||||||||||
Subscriber revenue | $ | 3,554,302 | $ | 3,284,660 | $ | 2,962,665 | |||||
Advertising revenue | 100,982 | 89,288 | 82,320 | ||||||||
Equipment revenue | 104,661 | 80,573 | 73,456 | ||||||||
Other revenue | 421,150 | 344,574 | 283,599 | ||||||||
Total revenue | 4,181,095 | 3,799,095 | 3,402,040 | ||||||||
Operating expenses: | |||||||||||
Cost of services: | |||||||||||
Revenue share and royalties | 810,028 | 677,642 | 551,012 | ||||||||
Programming and content | 297,313 | 290,323 | 278,997 | ||||||||
Customer service and billing | 370,585 | 320,755 | 294,980 | ||||||||
Satellite and transmission | 86,013 | 79,292 | 72,615 | ||||||||
Cost of equipment | 44,397 | 26,478 | 31,766 | ||||||||
Subscriber acquisition costs | 493,464 | 495,610 | 474,697 | ||||||||
Sales and marketing | 336,480 | 291,024 | 248,905 | ||||||||
Engineering, design and development | 62,784 | 57,969 | 48,843 | ||||||||
General and administrative | 293,938 | 262,135 | 261,905 | ||||||||
Depreciation and amortization | 266,423 | 253,314 | 266,295 | ||||||||
Total operating expenses | 3,061,425 | 2,754,542 | 2,530,015 | ||||||||
Income from operations | 1,119,670 | 1,044,553 | 872,025 | ||||||||
Other income (expense): | |||||||||||
Interest expense, net of amounts capitalized | (269,010 | ) | (204,671 | ) | (265,321 | ) | |||||
Loss on extinguishment of debt and credit facilities, net | — | (190,577 | ) | (132,726 | ) | ||||||
Interest and investment income | 15,498 | 6,976 | 716 | ||||||||
Loss on change in value of derivatives | (34,485 | ) | (20,393 | ) | — | ||||||
Other (loss) income | (887 | ) | 1,204 | (226 | ) | ||||||
Total other expense | (288,884 | ) | (407,461 | ) | (397,557 | ) | |||||
Income before income taxes | 830,786 | 637,092 | 474,468 | ||||||||
Income tax (expense) benefit | (337,545 | ) | (259,877 | ) | 2,998,234 | ||||||
Net income | $ | 493,241 | $ | 377,215 | $ | 3,472,702 | |||||
Foreign currency translation adjustment, net of tax | (94 | ) | (428 | ) | 49 | ||||||
Total comprehensive income | $ | 493,147 | $ | 376,787 | $ | 3,472,751 | |||||
Net income per common share: | |||||||||||
Basic | $ | 0.09 | $ | 0.06 | $ | 0.55 | |||||
Diluted | $ | 0.08 | $ | 0.06 | $ | 0.51 | |||||
Weighted average common shares outstanding: | |||||||||||
Basic | 5,788,944 | 6,227,646 | 4,209,073 | ||||||||
Diluted | 5,862,020 | 6,384,791 | 6,873,786 | ||||||||
See accompanying notes to the consolidated financial statements.
F-4
As of December 31, | |||||||
(in thousands, except share and per share data) | 2014 | 2013 | |||||
ASSETS | |||||||
Current assets: | |||||||
Cash and cash equivalents | $ | 147,724 | $ | 134,805 | |||
Receivables, net | 220,579 | 192,912 | |||||
Inventory, net | 19,397 | 13,863 | |||||
Prepaid expenses | 116,336 | 110,530 | |||||
Related party current assets | 4,344 | 9,145 | |||||
Deferred tax asset | 1,038,603 | 937,598 | |||||
Other current assets | 2,763 | 20,160 | |||||
Total current assets | 1,549,746 | 1,419,013 | |||||
Property and equipment, net | 1,510,112 | 1,594,574 | |||||
Long-term restricted investments | 5,922 | 5,718 | |||||
Deferred financing fees, net | 12,021 | 12,604 | |||||
Intangible assets, net | 2,645,046 | 2,700,062 | |||||
Goodwill | 2,205,107 | 2,204,553 | |||||
Related party long-term assets | 3,000 | 30,164 | |||||
Long-term deferred tax asset | 437,736 | 868,057 | |||||
Other long-term assets | 6,819 | 10,035 | |||||
Total assets | $ | 8,375,509 | $ | 8,844,780 | |||
LIABILITIES AND STOCKHOLDERS’ EQUITY | |||||||
Current liabilities: | |||||||
Accounts payable and accrued expenses | $ | 587,755 | $ | 578,333 | |||
Accrued interest | 80,440 | 42,085 | |||||
Current portion of deferred revenue | 1,632,381 | 1,586,611 | |||||
Current portion of deferred credit on executory contracts | 1,394 | 3,781 | |||||
Current maturities of long-term debt | 7,482 | 496,815 | |||||
Current maturities of long-term related party debt | — | 10,959 | |||||
Related party current liabilities | 4,340 | 20,320 | |||||
Total current liabilities | 2,313,792 | 2,738,904 | |||||
Deferred revenue | 151,901 | 149,026 | |||||
Deferred credit on executory contracts | — | 1,394 | |||||
Long-term debt | 4,493,863 | 3,093,821 | |||||
Related party long-term liabilities | 13,635 | 16,337 | |||||
Other long-term liabilities | 92,481 | 99,556 | |||||
Total liabilities | 7,065,672 | 6,099,038 | |||||
Commitments and contingencies (Note 17) | |||||||
Stockholders’ equity: | |||||||
Preferred stock, undesignated, par value $0.001 (liquidation preference of $0.001 per share); 50,000,000 shares authorized and 0 shares issued and outstanding at December 31, 2014 and December 31, 2013 | — | — | |||||
Common stock, par value $0.001; 9,000,000,000 shares authorized; 5,653,529,403 and 6,096,220,526 shares issued; 5,646,119,122 and 6,096,220,526 outstanding at December 31, 2014 and December 31, 2013, respectively | 5,653 | 6,096 | |||||
Accumulated other comprehensive loss, net of tax | (402 | ) | (308 | ) | |||
Additional paid-in capital | 6,771,554 | 8,674,129 | |||||
Treasury stock, at cost; 7,410,281 and 0 shares of common stock at December 31, 2014 and December 31, 2013, respectively | (26,034 | ) | — | ||||
Accumulated deficit | (5,440,934 | ) | (5,934,175 | ) | |||
Total stockholders’ equity | 1,309,837 | 2,745,742 | |||||
Total liabilities and stockholders’ equity | $ | 8,375,509 | $ | 8,844,780 | |||
See accompanying notes to the consolidated financial statements.
F-5
SIRIUS XM HOLDINGS INC. AND SUBSIDIARIES
CONSOLIDATED STATEMENT OF STOCKHOLDERS’ EQUITY
Convertible Perpetual Preferred Stock, Series B-1 | Common Stock | Treasury Stock | |||||||||||||||||||||||||||||||||||
(in thousands, except share data) | Shares | Amount | Shares | Amount | Accumulated Other Comprehensive Income (Loss) | Additional Paid-in Capital | Shares | Amount | Accumulated Deficit | Total Stockholders’ Equity | |||||||||||||||||||||||||||
Balance at January 1, 2012 | 12,500,000 | $ | 13 | 3,753,201,929 | $ | 3,753 | $ | 71 | $ | 10,484,400 | — | $ | — | $ | (9,784,092 | ) | $ | 704,145 | |||||||||||||||||||
Comprehensive income, net of tax | — | — | — | — | 49 | — | — | — | 3,472,702 | 3,472,751 | |||||||||||||||||||||||||||
Issuance of common stock to employees and employee benefit plans, net of forfeitures | — | — | 1,571,175 | — | 2 | — | 3,521 | — | — | — | 3,523 | ||||||||||||||||||||||||||
Share-based payment expense | — | — | — | — | — | 60,299 | — | — | — | 60,299 | |||||||||||||||||||||||||||
Exercise of options | — | — | 214,199,297 | 214 | — | 125,695 | — | — | — | 125,909 | |||||||||||||||||||||||||||
Cash dividends paid on common shares ($0.05) | — | — | — | — | — | (262,387 | ) | — | — | — | (262,387 | ) | |||||||||||||||||||||||||
Cash dividends paid on preferred shares on as-converted basis | — | — | — | — | — | (64,675 | ) | — | — | — | (64,675 | ) | |||||||||||||||||||||||||
Conversion of preferred stock to common stock | (6,249,900 | ) | (7 | ) | 1,293,467,684 | 1,294 | — | (1,287 | ) | — | — | — | — | ||||||||||||||||||||||||
Balance at December 31, 2012 | 6,250,100 | $ | 6 | 5,262,440,085 | $ | 5,263 | $ | 120 | $ | 10,345,566 | — | $ | — | $ | (6,311,390 | ) | $ | 4,039,565 | |||||||||||||||||||
Comprehensive income, net of tax | — | — | — | — | (428 | ) | — | — | — | 377,215 | 376,787 | ||||||||||||||||||||||||||
Share-based payment expense | — | — | — | — | — | 68,876 | — | — | — | 68,876 | |||||||||||||||||||||||||||
Exercise of options and vesting of restricted stock units | — | — | 32,841,381 | 32 | — | 19,396 | — | — | — | 19,428 | |||||||||||||||||||||||||||
Minimum withholding taxes on net share settlement of stock-based compensation | — | — | — | — | — | (46,342 | ) | — | — | — | (46,342 | ) | |||||||||||||||||||||||||
Conversion of preferred stock to common stock | (6,250,100 | ) | (6 | ) | 1,293,509,076 | 1,293 | — | (1,287 | ) | — | — | — | — | ||||||||||||||||||||||||
Conversion of Exchangeable Notes to common stock | — | — | 27,687,850 | 28 | — | 45,069 | — | — | — | 45,097 | |||||||||||||||||||||||||||
Common stock repurchased | — | — | — | — | — | — | 520,257,866 | (1,764,969 | ) | — | (1,764,969 | ) | |||||||||||||||||||||||||
Common stock retired | — | — | (520,257,866 | ) | (520 | ) | — | (1,764,449 | ) | (520,257,866 | ) | 1,764,969 | — | — | |||||||||||||||||||||||
Initial fair value of forward contract | — | — | — | — | — | 7,300 | — | — | — | 7,300 | |||||||||||||||||||||||||||
Balance at December 31, 2013 | — | $ | — | 6,096,220,526 | $ | 6,096 | $ | (308 | ) | $ | 8,674,129 | — | $ | — | $ | (5,934,175 | ) | $ | 2,745,742 | ||||||||||||||||||
Comprehensive income, net of tax | — | — | — | — | (94 | ) | — | — | — | 493,241 | 493,147 | ||||||||||||||||||||||||||
Share-based payment expense | — | — | — | — | — | 78,212 | — | — | — | 78,212 | |||||||||||||||||||||||||||
Exercise of options and vesting of restricted stock units | — | — | 15,960,020 | 16 | — | 315 | — | — | — | 331 | |||||||||||||||||||||||||||
Minimum withholding taxes on net share settlement of stock-based compensation | — | — | — | — | — | (37,320 | ) | — | — | — | (37,320 | ) | |||||||||||||||||||||||||
Conversion of Exchangeable Notes to common stock | — | — | 272,855,859 | 273 | — | 502,097 | — | — | — | 502,370 | |||||||||||||||||||||||||||
Issuance of common stock upon exercise of warrants | — | — | 99,349 | — | — | — | — | — | — | — | |||||||||||||||||||||||||||
Common stock repurchased | — | — | — | — | — | — | 739,016,632 | (2,472,645 | ) | — | (2,472,645 | ) | |||||||||||||||||||||||||
Common stock retired | — | — | (731,606,351 | ) | (732 | ) | — | (2,445,879 | ) | (731,606,351 | ) | 2,446,611 | — | — | |||||||||||||||||||||||
Balance at December 31, 2014 | — | $ | — | 5,653,529,403 | $ | 5,653 | $ | (402 | ) | $ | 6,771,554 | 7,410,281 | $ | (26,034 | ) | $ | (5,440,934 | ) | $ | 1,309,837 | |||||||||||||||||
See accompanying notes to the consolidated financial statements.
F-6
For the Years Ended December 31, | |||||||||||
(in thousands) | 2014 | 2013 | 2012 | ||||||||
Cash flows from operating activities: | |||||||||||
Net income | $ | 493,241 | $ | 377,215 | $ | 3,472,702 | |||||
Adjustments to reconcile net income to net cash provided by operating activities: | |||||||||||
Depreciation and amortization | 266,423 | 253,314 | 266,295 | ||||||||
Non-cash interest expense, net of amortization of premium | 21,039 | 21,698 | 35,924 | ||||||||
Provision for doubtful accounts | 44,961 | 39,016 | 34,548 | ||||||||
Amortization of deferred income related to equity method investment | (2,776 | ) | (2,776 | ) | (2,776 | ) | |||||
Loss on extinguishment of debt and credit facilities, net | — | 190,577 | 132,726 | ||||||||
(Gain) loss on unconsolidated entity investments, net | (5,547 | ) | (5,865 | ) | 420 | ||||||
Dividend received from unconsolidated entity investment | 17,019 | 22,065 | 1,185 | ||||||||
Loss on disposal of assets | 220 | 351 | 657 | ||||||||
Loss on change in value of derivatives | 34,485 | 20,393 | — | ||||||||
Share-based payment expense | 78,212 | 68,876 | 63,822 | ||||||||
Deferred income taxes | 327,461 | 259,787 | (3,001,818 | ) | |||||||
Other non-cash purchase price adjustments | (3,781 | ) | (207,854 | ) | (289,050 | ) | |||||
Changes in operating assets and liabilities: | |||||||||||
Receivables | (72,628 | ) | (15,245 | ) | (58,593 | ) | |||||
Inventory | (5,534 | ) | 11,474 | 11,374 | |||||||
Related party assets | (4,097 | ) | 2,031 | 9,523 | |||||||
Prepaid expenses and other current assets | (1,195 | ) | 16,788 | 647 | |||||||
Other long-term assets | 3,173 | 2,973 | 22,779 | ||||||||
Accounts payable and accrued expenses | (17,191 | ) | (44,009 | ) | 46,043 | ||||||
Accrued interest | 38,355 | 8,131 | (36,451 | ) | |||||||
Deferred revenue | 48,645 | 73,593 | 101,311 | ||||||||
Related party liabilities | (206 | ) | (1,991 | ) | (7,545 | ) | |||||
Other long-term liabilities | (7,035 | ) | 12,290 | 3,042 | |||||||
Net cash provided by operating activities | 1,253,244 | 1,102,832 | 806,765 | ||||||||
Cash flows from investing activities: | |||||||||||
Additions to property and equipment | (121,646 | ) | (173,617 | ) | (97,293 | ) | |||||
Purchases of restricted and other investments | — | (1,719 | ) | (26 | ) | ||||||
Acquisition of business, net of cash acquired | 1,144 | (525,352 | ) | — | |||||||
Return of capital from investment in unconsolidated entity | 24,178 | — | — | ||||||||
Net cash used in investing activities | (96,324 | ) | (700,688 | ) | (97,319 | ) | |||||
Cash flows from financing activities: | |||||||||||
Proceeds from exercise of stock options | 331 | 21,968 | 123,369 | ||||||||
Taxes paid in lieu of shares issued for stock-based compensation | (37,318 | ) | (46,342 | ) | — | ||||||
Proceeds from long-term borrowings and revolving credit facility, net of costs | 2,406,205 | 3,156,063 | 383,641 | ||||||||
Payment of premiums on redemption of debt | — | (175,453 | ) | (100,615 | ) | ||||||
Repayment of long-term borrowings and revolving credit facility | (1,016,420 | ) | (1,782,160 | ) | (915,824 | ) | |||||
Repayment of related party long-term borrowings | — | (200,000 | ) | (126,000 | ) | ||||||
Common stock repurchased and retired | (2,496,799 | ) | (1,762,360 | ) | — | ||||||
Dividends paid | — | — | (327,062 | ) | |||||||
Net cash used in financing activities | (1,144,001 | ) | (788,284 | ) | (962,491 | ) | |||||
Net increase (decrease) in cash and cash equivalents | 12,919 | (386,140 | ) | (253,045 | ) | ||||||
Cash and cash equivalents at beginning of period | 134,805 | 520,945 | 773,990 | ||||||||
Cash and cash equivalents at end of period | $ | 147,724 | $ | 134,805 | $ | 520,945 | |||||
See accompanying notes to the consolidated financial statements.
F-7
SIRIUS XM HOLDINGS INC. AND SUBSIDIARIES
CONSOLIDATED STATEMENTS OF CASH FLOWS - (Continued)
For the Years Ended December 31, | |||||||||||
(in thousands) | 2014 | 2013 | 2012 | ||||||||
Supplemental Disclosure of Cash and Non-Cash Flow Information | |||||||||||
Cash paid during the period for: | |||||||||||
Interest, net of amounts capitalized | $ | 199,424 | $ | 169,781 | $ | 262,039 | |||||
Income taxes paid | $ | 8,713 | $ | 2,783 | $ | 4,935 | |||||
Acquisition related costs | $ | — | $ | 2,902 | $ | — | |||||
Non-cash investing and financing activities: | |||||||||||
Capital lease obligations incurred to acquire assets | $ | 719 | $ | 11,966 | $ | 12,781 | |||||
Conversion of Series B preferred stock to common stock | $ | — | $ | 1,293 | $ | 1,294 | |||||
Treasury stock not yet settled | $ | 26,034 | $ | — | $ | — | |||||
Conversion of 7% Exchangeable Notes to common stock, net of debt issuance and deferred financing costs | $ | 502,097 | $ | 45,097 | $ | — | |||||
Performance incentive payments | $ | — | $ | 16,900 | $ | — | |||||
Goodwill reduced for the exercise and vesting of certain stock awards | $ | — | $ | 274 | $ | 19,491 | |||||
Purchase price accounting adjustments to goodwill | $ | 1,698 | $ | — | $ | — | |||||
See accompanying notes to the consolidated financial statements.
F-8
SIRIUS XM HOLDINGS INC. AND SUBSIDIARIES
NOTES TO CONSOLIDATED FINANCIAL STATEMENTS
(Dollar amounts in thousands, unless otherwise stated)
(1) | Business & Basis of Presentation |
Business
We broadcast music, sports, entertainment, comedy, talk, news, traffic and weather channels, as well as infotainment services, in the United States on a subscription fee basis through our two proprietary satellite radio systems. Subscribers can also receive music and other channels, plus features such as SiriusXM On Demand and MySXM, over our Internet radio service, including through applications for mobile devices. We are also a leader in providing connected vehicle services. Our connected vehicle services are designed to enhance the safety, security and driving experience for vehicle operators while providing marketing and operational benefits to automakers and their dealers. Subscribers to our connected vehicle services are not included in our subscriber count or subscriber-based operating metrics.
We have agreements with every major automaker (“OEMs”) to offer satellite radios in their vehicles from which we acquire a majority of our subscribers. We also acquire subscribers through marketing to owners and lessees of vehicles that include factory-installed satellite radios that are not currently subscribing to our services. Additionally, we distribute our satellite radios through retail locations nationwide and through our website. Satellite radio services are also offered to customers of certain daily rental car companies.
Our primary source of revenue is subscription fees, with most of our customers subscribing on an annual, semi-annual, quarterly or monthly basis. We offer discounts for prepaid and longer term subscription plans as well as discounts for multiple subscriptions. We also derive revenue from activation and other fees, the sale of advertising on select non-music channels, the direct sale of satellite radios and accessories, and other ancillary services, such as our weather, traffic, data and Backseat TV services.
In certain cases, automakers and dealers include a subscription to our radio services in the sale or lease price of new or previously owned vehicles. The length of these trial subscriptions varies but is typically three to twelve months. We receive subscription payments for these trials from certain automakers. We also reimburse various automakers for certain costs associated with satellite radios installed in new vehicles.
Liberty Media Corporation ("Liberty Media") beneficially owns, directly and indirectly, over 50% of the outstanding shares of our common stock. As a result, we are a "controlled company" for the purposes of the NASDAQ corporate governance requirements. Liberty Media owns interests in a range of media, communications and entertainment businesses.
Basis of Presentation
This Annual Report on Form 10-K presents information for Sirius XM Holdings Inc. (“Holdings”). Holdings has no operations independent of its wholly-owned subsidiary Sirius XM Radio Inc. ("Sirius XM").
Our financial statements have been prepared in accordance with U.S. generally accepted accounting principles (“GAAP”). All significant intercompany transactions have been eliminated in consolidation. Certain numbers in our prior period consolidated financial statements have been reclassified or consolidated to conform to our current period presentation.
Public companies are required to disclose certain information about their reportable operating segments. Operating segments are defined as significant components of an enterprise for which separate financial information is available and is evaluated on a regular basis by the chief operating decision makers in deciding how to allocate resources to an individual segment and in assessing performance of the segment. We have determined that we have one reportable segment as our chief operating decision maker, the Chief Executive Officer, assesses performance and allocates resources based on the consolidated results of operations of our business.
We have evaluated events subsequent to the balance sheet date and prior to the filing of this Annual Report on Form 10-K for the year ended December 31, 2014 and have determined that no events have occurred that would require adjustment to our consolidated financial statements. For a discussion of subsequent events that do not require adjustment to our consolidated financial statements refer to Note 19.
F-9
SIRIUS XM HOLDINGS INC. AND SUBSIDIARIES
NOTES TO CONSOLIDATED FINANCIAL STATEMENTS - Continued
(Dollar amounts in thousands, unless otherwise stated)
Use of Estimates
The preparation of financial statements in conformity with U.S. GAAP requires management to make certain estimates, judgments and assumptions that affect the amounts reported in the financial statements and footnotes. Estimates, by their nature, are based on judgments and available information. Actual results could differ materially from those estimates. Significant estimates inherent in the preparation of the accompanying consolidated financial statements include asset impairment, depreciable lives of our satellites, share-based payment expense, and income taxes.
(2) | Acquisitions |
On November 4, 2013, we purchased all of the outstanding shares of the capital stock of the connected vehicle business of Agero, Inc. ("Agero"). The transaction was accounted for using the acquisition method of accounting. During the year ended December 31, 2014, the purchase price allocation associated with the connected vehicle business of Agero was finalized resulting in a net increase to Goodwill of $554, of which $1,144 related to the finalization of the working capital calculation.
As of December 31, 2014, our Goodwill balance associated with this acquisition was $390,016. No other assets or liabilities have been adjusted as a result of the final working capital calculation and adjusted purchase price allocation.
(3) | Summary of Significant Accounting Policies |
In addition to the significant accounting policies discussed in this Note 3, the following table includes our significant accounting policies that are described in other notes to our consolidated financial statements, including the number and page of the note:
Cash and Cash Equivalents
Our cash and cash equivalents consist of cash on hand, money market funds, certificates of deposit, in-transit credit card receipts and highly liquid investments purchased with an original maturity of three months or less.
Revenue Recognition
We derive revenue primarily from subscribers, advertising and direct sales of merchandise.
Revenue from subscribers consists primarily of subscription fees, and to a lesser extent, daily rental fleet revenue and non-refundable activation and other fees. Revenue is recognized as it is realized or realizable and earned. We recognize subscription fees as our services are provided. At the time of sale, vehicle owners purchasing or leasing a vehicle with a subscription to our service typically receive between a three and twelve month prepaid subscription. Prepaid subscription fees received from certain automakers are recorded as deferred revenue and amortized to revenue ratably over the service period which commences upon retail sale and activation.
We recognize revenue from the sale of advertising as the advertising is broadcast. Agency fees are calculated based on a stated percentage applied to gross billing revenue for our advertising inventory and are reported as a reduction of advertising revenue. We pay certain third parties a percentage of advertising revenue. Advertising revenue is recorded gross of such
F-10
SIRIUS XM HOLDINGS INC. AND SUBSIDIARIES
NOTES TO CONSOLIDATED FINANCIAL STATEMENTS - Continued
(Dollar amounts in thousands, unless otherwise stated)
revenue share payments as we are the primary obligor in the transaction. Advertising revenue share payments are recorded to Revenue share and royalties during the period in which the advertising is broadcast.
Equipment revenue and royalties from the sale of satellite radios, components and accessories are recognized upon shipment, net of discounts and rebates. Shipping and handling costs billed to customers are recorded as revenue. Shipping and handling costs associated with shipping goods to customers are reported as a component of Cost of equipment.
Other revenue primarily includes U.S. Music Royalty Fees which are recorded as revenue and as a component of Revenue share and royalties expense. Fees received from subscribers for the U.S. Music Royalty Fee are recorded as deferred revenue and amortized to revenue ratably over the service period which coincides with the recognition of the subscriber's subscription revenue.
We report revenues net of any tax assessed by a governmental authority that is both imposed on, and concurrent with, a specific revenue-producing transaction between a seller and a customer in our consolidated statements of comprehensive income.
ASC 605, Revenue Recognition, provides guidance on how and when to recognize revenues for arrangements that may involve the delivery or performance of multiple products, services and/or rights to use assets, such as in our bundled subscription plans. Revenue arrangements with multiple deliverables are required to be divided into separate units of accounting if the deliverables in the arrangement meet certain criteria. Consideration must be allocated at the inception of the arrangement to all deliverables based on their relative selling price, which has been determined using vendor specific objective evidence of the selling price to self-pay customers.
Revenue Share
We share a portion of our subscription revenues earned from subscribers with certain automakers. The terms of the revenue share agreements vary with each automaker, but are typically based upon the earned audio revenue as reported or gross billed audio revenue. Revenue share is recorded as an expense in our consolidated statements of comprehensive income and not as a reduction to revenue.
Programming Costs
Programming costs which are for a specified number of events are amortized on an event-by-event basis; programming costs which are for a specified season or period are amortized over the season or period on a straight-line basis. We allocate a portion of certain programming costs which are related to sponsorship and marketing activities to Sales and marketing expense on a straight-line basis over the term of the agreement.
Advertising Costs
Media is expensed when aired and advertising production costs are expensed as incurred. Advertising production costs include expenses related to marketing and retention activities, including expenses related to direct mail, outbound telemarketing and email communications. We also incur advertising production costs related to cooperative marketing and promotional events and sponsorships. During the years ended December 31, 2014, 2013 and 2012, we recorded advertising costs of $222,962, $178,364 and $139,830, respectively. These costs are reflected in Sales and marketing expense in our consolidated statements of comprehensive income.
Subscriber Acquisition Costs
Subscriber acquisition costs consist of costs incurred to acquire new subscribers which include hardware subsidies paid to radio manufacturers, distributors and automakers, including subsidies paid to automakers who include a satellite radio and a prepaid subscription to our service in the sale or lease price of a new vehicle; subsidies paid for chipsets and certain other components used in manufacturing radios; device royalties for certain radios and chipsets; commissions paid to retailers and automakers as incentives to purchase, install and activate radios; product warranty obligations; freight; and provisions for inventory allowance attributable to inventory consumed in our OEM and retail distribution channels. Subscriber acquisition costs do not include advertising costs, loyalty payments to distributors and dealers of radios and revenue share payments to automakers and retailers of radios.
F-11
SIRIUS XM HOLDINGS INC. AND SUBSIDIARIES
NOTES TO CONSOLIDATED FINANCIAL STATEMENTS - Continued
(Dollar amounts in thousands, unless otherwise stated)
Subsidies paid to radio manufacturers and automakers are expensed upon installation, shipment, receipt of product or activation and are included in Subscriber acquisition costs because we are responsible for providing the service to the customers. Commissions paid to retailers and automakers are expensed upon either the sale or activation of radios. Chipsets that are shipped to radio manufacturers and held on consignment are recorded as inventory and expensed as Subscriber acquisition costs when placed into production by radio manufacturers. Costs for chipsets not held on consignment are expensed as Subscriber acquisition costs when the automaker confirms receipt.
Research & Development Costs
Research and development costs are expensed as incurred and primarily include the cost of new product development, chipset design, software development and engineering. During the years ended December 31, 2014, 2013 and 2012, we recorded research and development costs of $54,109, $50,564 and $42,605, respectively. These costs are reported as a component of Engineering, design and development expense in our consolidated statements of comprehensive income.
Accumulated Other Comprehensive Loss
Accumulated other comprehensive loss of $402 at December 31, 2014 was primarily comprised of the cumulative foreign currency translation adjustments related to our interest in Sirius XM Canada. During the years ended December 31, 2014, 2013 and 2012, we recorded other comprehensive (loss) income related to foreign currency translation adjustments, of $(94), $(428) and $49, respectively. In addition, during the year ended December 31, 2014, upon the redemption and conversion of the 8% convertible unsecured subordinated debentures issued by Sirius XM Canada, we reclassified $223, net of tax, of previously recognized foreign currency translation losses out of Accumulated other comprehensive loss and into Interest and investment income.
Recent Accounting Pronouncements
In May 2014, the Financial Accounting Standards Board ("FASB") issued Accounting Standards Update ("ASU") 2014-09, Revenue from Contracts with Customers (Topic 606). This ASU is a comprehensive new revenue recognition model that requires a company to recognize revenue to depict the transfer of goods or services to a customer at an amount that reflects the consideration it expects to receive in exchange for those goods or services. The ASU also requires additional disclosure about the nature, amount, timing and uncertainty of revenue and cash flows arising from customer contracts, including significant judgments and changes in judgments and assets recognized from costs incurred to obtain or fulfill a contract. This ASU is effective for annual reporting periods beginning after December 15, 2016 and early adoption is not permitted. Accordingly, we will adopt this ASU on January 1, 2017. Companies may use either a full retrospective or a modified retrospective approach to adopt this ASU and we are currently evaluating which transition approach to use. We are currently evaluating the impact of the adoption of this ASU on our consolidated financial statements.
(4) | Fair Value Measurements |
The fair value of a financial instrument is the amount at which the instrument could be exchanged in an orderly transaction between market participants. As of December 31, 2014 and 2013, the carrying amounts of cash and cash equivalents, accounts and other receivables, and accounts payable approximated fair value due to the short-term nature of these instruments. ASC 820, Fair Value Measurements and Disclosures, establishes a fair value hierarchy for input into valuation techniques as follows:
i. | Level 1 input: unadjusted quoted prices in active markets for identical instrument; |
ii. | Level 2 input: observable market data for the same or similar instrument but not Level 1, including quoted prices for identical or similar assets or liabilities in markets that are not active or other inputs that are observable or can be corroborated by observable market data for substantially the full term of the assets or liabilities; and |
iii. | Level 3 input: unobservable inputs developed using management's assumptions about the inputs used for pricing the asset or liability. |
Investments are periodically reviewed for impairment and an impairment is recorded whenever declines in fair value below carrying value are determined to be other than temporary. In making this determination, we consider, among other factors, the severity and duration of the decline as well as the likelihood of a recovery within a reasonable timeframe.
F-12
SIRIUS XM HOLDINGS INC. AND SUBSIDIARIES
NOTES TO CONSOLIDATED FINANCIAL STATEMENTS - Continued
(Dollar amounts in thousands, unless otherwise stated)
Our assets and liabilities measured at fair value were as follows:
December 31, 2014 | December 31, 2013 | ||||||||||||||||||||||||||
Level 1 | Level 2 | Level 3 | Total Fair Value | Level 1 | Level 2 | Level 3 | Total Fair Value | ||||||||||||||||||||
Assets: | |||||||||||||||||||||||||||
Sirius XM Canada Holdings Inc. ("Sirius XM Canada") - investment (a) | $ | 246,500 | — | — | $ | 246,500 | $ | 432,200 | — | — | $ | 432,200 | |||||||||||||||
Sirius XM Canada - fair value of host contract of debenture (b) | $ | — | — | — | $ | — | $ | — | — | 3,641 | $ | 3,641 | |||||||||||||||
Sirius XM Canada - fair value of embedded derivative of debenture (b) | $ | — | — | — | $ | — | $ | — | — | 57 | $ | 57 | |||||||||||||||
Liabilities: | |||||||||||||||||||||||||||
Debt (c) | $ | — | 4,613,044 | — | $ | 4,613,044 | $ | — | 4,066,755 | — | $ | 4,066,755 | |||||||||||||||
Share Repurchase Agreement (d) | $ | — | — | — | $ | — | $ | — | 15,702 | — | $ | 15,702 | |||||||||||||||
(a) | This amount approximates fair value. The carrying value of our investment in Sirius XM Canada was $2,654 and $26,972 as of December 31, 2014 and 2013, respectively. |
(b) | As of December 31, 2013, we held an investment in CAD $4,000 face value of 8% convertible unsecured subordinated debentures issued by Sirius XM Canada for which the embedded conversion feature was bifurcated from the host contract. Sirius XM Canada redeemed and converted the debentures during the year ended December 31, 2014. |
(c) | The fair value for non-publicly traded instruments is based upon estimates from a market maker and brokerage firm. Refer to Note 14 for information related to the carrying value of our debt as of December 31, 2014 and December 31, 2013. |
(d) | The final installment under the share repurchase agreement with Liberty Media was settled on April 25, 2014. The fair value of the derivative associated with the share repurchase agreement was determined using observable inputs, including the U.S. spot LIBOR curve and other available market data and was recorded in our consolidated balance sheets in Related party current liabilities, with changes in fair value recorded to our statements of comprehensive income. |
(5) | Earnings per Share |
Basic net income per common share is calculated by dividing the income available to common stockholders by the weighted average common shares outstanding during each reporting period. Diluted net income per common share adjusts the weighted average number of common shares outstanding for the potential dilution that could occur if common stock equivalents (convertible debt, preferred stock, warrants, stock options and restricted stock units) were exercised or converted into common stock, calculated using the treasury stock method. In 2013 and 2012, we utilized the two-class method in calculating basic net income per common share, as our Series B Preferred Stock was considered to be participating securities through January 18, 2013. On January 18, 2013, Liberty Media converted its remaining 6,250,100 outstanding shares of our Series B Preferred Stock into 1,293,509,076 shares of common stock. We had no participating securities during the year ended December 31, 2014.
Common stock equivalents of approximately 132,162,000, 365,177,000 and 147,125,000 for the years ended December 31, 2014, 2013 and 2012, respectively, were excluded from the calculation of diluted net income per common share as the effect would have been anti-dilutive.
F-13
SIRIUS XM HOLDINGS INC. AND SUBSIDIARIES
NOTES TO CONSOLIDATED FINANCIAL STATEMENTS - Continued
(Dollar amounts in thousands, unless otherwise stated)
For the Years Ended December 31, | |||||||||||
(in thousands, except per share data) | 2014 | 2013 | 2012 | ||||||||
Numerator: | |||||||||||
Net income | $ | 493,241 | $ | 377,215 | $ | 3,472,702 | |||||
Less: | |||||||||||
Allocation of undistributed income to Series B Preferred Stock | — | (3,825 | ) | (1,084,895 | ) | ||||||
Dividends paid to preferred stockholders | — | — | (64,675 | ) | |||||||
Net income available to common stockholders for basic net income per common share | $ | 493,241 | $ | 373,390 | $ | 2,323,132 | |||||
Add back: | |||||||||||
Allocation of undistributed income to Series B Preferred Stock | — | 3,825 | 1,084,895 | ||||||||
Dividends paid to preferred stockholders | — | — | 64,675 | ||||||||
Effect of interest on assumed conversions of convertible debt | — | — | 38,500 | ||||||||
Net income available to common stockholders for diluted net income per common share | $ | 493,241 | $ | 377,215 | $ | 3,511,202 | |||||
Denominator: | |||||||||||
Weighted average common shares outstanding for basic net income per common share (a) | 5,788,944 | 6,227,646 | 4,209,073 | ||||||||
Weighted average impact of assumed Series B Preferred Stock conversion | — | 63,789 | 2,215,900 | ||||||||
Weighted average impact of assumed convertible debt (b) | — | — | 298,725 | ||||||||
Weighted average impact of other dilutive equity instruments | 73,076 | 93,356 | 150,088 | ||||||||
Weighted average shares for diluted net income per common share | 5,862,020 | 6,384,791 | 6,873,786 | ||||||||
Net income per common share: | |||||||||||
Basic | $ | 0.09 | $ | 0.06 | $ | 0.55 | |||||
Diluted | $ | 0.08 | $ | 0.06 | $ | 0.51 | |||||
(a) | For the year ended December 31, 2014, the weighted-average common shares outstanding for basic net income per common share includes approximately 31,078,000 shares of the 272,855,859 shares related to the conversion of the 7% Exchangeable Senior Subordinated Notes due 2014, due to the weighted-average in calculating earnings per share. |
(b) | During the years ended December 31, 2013 and 2012, the common stock reserved for conversion in connection with the 7% Exchangeable Senior Subordinated Notes due 2014 were considered to be anti-dilutive and dilutive, respectively, in our calculation of diluted net income per share. |
(6) | Receivables, net |
Receivables, net includes customer accounts receivable, receivables from distributors and other receivables.
Customer accounts receivable, net, includes receivables from our subscribers and advertising customers and is stated at amounts due net of an allowance for doubtful accounts. Our allowance for doubtful accounts is based upon our assessment of various factors. We consider historical experience, the age of the receivable balances, current economic conditions and other factors that may affect the counterparty’s ability to pay. Bad debt expense is included in Customer service and billing expense in our consolidated statements of comprehensive income.
Receivables from distributors primarily include billed and unbilled amounts due from OEMs for services included in the sale or lease price of vehicles, as well as billed amounts due from wholesale distributors of our satellite radios. Other receivables primarily include amounts due from manufacturers of our radios, modules and chipsets where we are entitled to a subsidy based on the number of units produced. We have not established an allowance for doubtful accounts for our receivables from distributors or other receivables as we have historically not experienced any significant collection issues with OEMs or other third parties.
F-14
SIRIUS XM HOLDINGS INC. AND SUBSIDIARIES
NOTES TO CONSOLIDATED FINANCIAL STATEMENTS - Continued
(Dollar amounts in thousands, unless otherwise stated)
Receivables, net consists of the following:
December 31, 2014 | December 31, 2013 | ||||||
Gross customer accounts receivable | $ | 101,634 | $ | 95,562 | |||
Allowance for doubtful accounts | (7,815 | ) | (9,078 | ) | |||
Customer accounts receivable, net | $ | 93,819 | $ | 86,484 | |||
Receivables from distributors | 105,731 | 88,975 | |||||
Other receivables | 21,029 | 17,453 | |||||
Total Receivables, net | $ | 220,579 | $ | 192,912 | |||
(7) | Inventory, net |
Inventory consists of finished goods, refurbished goods, chipsets and other raw material components used in manufacturing radios. Inventory is stated at the lower of cost or market. We record an estimated allowance for inventory that is considered slow moving or obsolete or whose carrying value is in excess of net realizable value. The provision related to products purchased for resale in our direct to consumer distribution channel and components held for resale by us is reported as a component of Cost of equipment in our consolidated statements of comprehensive income. The provision related to inventory consumed in our OEM and retail distribution channel is reported as a component of Subscriber acquisition costs in our consolidated statements of comprehensive income.
Inventory, net, consists of the following:
December 31, 2014 | December 31, 2013 | ||||||
Raw materials | $ | 12,150 | $ | 12,358 | |||
Finished goods | 17,971 | 15,723 | |||||
Allowance for obsolescence | (10,724 | ) | (14,218 | ) | |||
Total inventory, net | $ | 19,397 | $ | 13,863 | |||
(8) | Goodwill |
Goodwill represents the excess of the purchase price over the estimated fair value of the net tangible and identifiable intangible assets acquired in business combinations. Our annual impairment assessment of our single reporting unit is performed as of the fourth quarter of each year, and an assessment is performed at other times if an event occurs or circumstances change that would more likely than not reduce the fair value of the asset below its carrying value. Step one of the impairment assessment compares the fair value to its carrying value and if the fair value exceeds its carrying value, goodwill is not impaired. If the carrying value exceeds the fair value, the implied fair value of goodwill is compared to the carrying value of goodwill. If the implied fair value exceeds the carrying value then goodwill is not impaired; otherwise, an impairment loss will be recorded by the amount the carrying value exceeds the implied fair value. At the date of our annual assessment for 2014 and 2013, the fair value of our single reporting unit substantially exceeded its carrying value and therefore was not at risk of failing step one of ASC 350-20, Goodwill.
As of December 31, 2014, there were no indicators of impairment and no impairment loss was recorded for goodwill during the years ended December 31, 2014, 2013 and 2012. During the year ended December 31, 2014, the purchase price allocation and working capital calculation associated with the connected vehicle business we purchased from Agero were adjusted. These adjustments resulted in a net increase to Goodwill of $554. As of December 31, 2014, the cumulative balance of goodwill impairments recorded since the July 2008 merger (the "Merger") between our wholly owned subsidiary, Vernon Merger Corporation, and XM Satellite Radio Holdings Inc. ("XM"), was $4,766,190, which was recognized during the year ended December 31, 2008.
F-15
SIRIUS XM HOLDINGS INC. AND SUBSIDIARIES
NOTES TO CONSOLIDATED FINANCIAL STATEMENTS - Continued
(Dollar amounts in thousands, unless otherwise stated)
During the years ended December 31, 2014 and 2013, we reduced goodwill by $0 and $274, respectively. The goodwill reduction during the year ended December 31, 2013, related to the subsequent exercise of certain stock options and vesting of certain restricted stock units that were recorded at fair value in connection with the Merger.
(9) | Intangible Assets |
We recorded intangible assets at fair value related to the Merger that were formerly held by XM. In November 2013, we recorded intangible assets at fair value as a result of the acquisition of the connected vehicle business of Agero. Our intangible assets include the following:
December 31, 2014 | December 31, 2013 | ||||||||||||||||||||||||
Weighted Average Useful Lives | Gross Carrying Value | Accumulated Amortization | Net Carrying Value | Gross Carrying Value | Accumulated Amortization | Net Carrying Value | |||||||||||||||||||
Due to the Merger: | |||||||||||||||||||||||||
Indefinite life intangible assets: | |||||||||||||||||||||||||
FCC licenses | Indefinite | $ | 2,083,654 | $ | — | $ | 2,083,654 | $ | 2,083,654 | $ | — | $ | 2,083,654 | ||||||||||||
Trademark | Indefinite | 250,000 | — | 250,000 | 250,000 | — | 250,000 | ||||||||||||||||||
Definite life intangible assets: | |||||||||||||||||||||||||
Subscriber relationships | 9 years | 380,000 | (305,755 | ) | 74,245 | 380,000 | (271,372 | ) | 108,628 | ||||||||||||||||
Licensing agreements | 9.1 years | 45,289 | (23,290 | ) | 21,999 | 45,289 | (19,604 | ) | 25,685 | ||||||||||||||||
Proprietary software | 6 years | 16,552 | (13,973 | ) | 2,579 | 16,552 | (13,384 | ) | 3,168 | ||||||||||||||||
Developed technology | 10 years | 2,000 | (1,283 | ) | 717 | 2,000 | (1,083 | ) | 917 | ||||||||||||||||
Leasehold interests | 7.4 years | 132 | (114 | ) | 18 | 132 | (96 | ) | 36 | ||||||||||||||||
Due to the acquisition of the connected vehicle business of Agero: | |||||||||||||||||||||||||
Definite life intangible assets: | |||||||||||||||||||||||||
OEM relationships | 15 years | 220,000 | (17,111 | ) | 202,889 | 220,000 | (2,444 | ) | 217,556 | ||||||||||||||||
Proprietary software | 10 years | 10,663 | (1,718 | ) | 8,945 | 10,663 | (245 | ) | 10,418 | ||||||||||||||||
Total intangible assets | $ | 3,008,290 | $ | (363,244 | ) | $ | 2,645,046 | $ | 3,008,290 | $ | (308,228 | ) | $ | 2,700,062 | |||||||||||
Indefinite Life Intangible Assets
We have identified our FCC licenses and the XM trademark as indefinite life intangible assets after considering the expected use of the assets, the regulatory and economic environment within which they are used and the effects of obsolescence on their use.
We hold FCC licenses to operate our satellite digital audio radio service and provide ancillary services. The following table outlines the years in which each of our satellite licenses expires:
FCC satellite licenses | Expiration year | |
SIRIUS FM-1 | 2017 | |
SIRIUS FM-2 | 2017 | |
SIRIUS FM-3 | 2017 | |
SIRIUS FM-5 | 2017 | |
SIRIUS FM-6 | 2022 | |
XM-1 (1) | ||
XM-3 | 2021 | |
XM-4 | 2022 | |
XM-5 | 2018 | |
(1) | The FCC license for this satellite has expired. The FCC has granted us special temporary authority to operate this satellite and prepare it for deorbiting maneuvers. |
F-16
SIRIUS XM HOLDINGS INC. AND SUBSIDIARIES
NOTES TO CONSOLIDATED FINANCIAL STATEMENTS - Continued
(Dollar amounts in thousands, unless otherwise stated)
Prior to expiration, we are required to apply for a renewal of our FCC licenses. The renewal and extension of our licenses, including temporary licenses, is reasonably certain at minimal cost, which is expensed as incurred. Each of the FCC licenses authorizes us to use the broadcast spectrum, which is a renewable, reusable resource that does not deplete or exhaust over time.
ASU 2012-02, Testing Indefinite-Lived Intangible Assets for Impairment, established an option to first perform a qualitative assessment to determine whether it is more likely than not that an asset is impaired. If the qualitative assessment supports that it is more likely than not that the fair value of the asset exceeds its carrying value, a quantitative impairment test is not required. If the qualitative assessment does not support the fair value of the asset, then a quantitative assessment is performed. Our annual impairment assessment of our indefinite intangible assets is performed as of the fourth quarter of each year. An assessment is performed at other times if an event occurs or circumstances change that would more likely than not reduce the fair value of the asset below its carrying value. If the carrying value of the intangible assets exceeds its fair value, an impairment loss is recognized in an amount equal to that excess.
We completed qualitative assessments of our FCC licenses and XM trademark during the fourth quarter of 2014, 2013 and 2012. As of the date of our annual assessment for 2014, 2013 and 2012, our qualitative impairment assessment of the fair value of our indefinite intangible assets indicated that such assets substantially exceeded their carrying value and therefore was not at risk of impairment. No impairments were recorded for intangible assets with indefinite lives during the years ended December 31, 2014, 2013 and 2012.
Definite Life Intangible Assets
Definite-lived intangible assets are amortized over their respective estimated useful lives to their estimated residual values and reviewed for impairment under the provisions of ASC 360-10-35, Property, Plant and Equipment/Overall/Subsequent Measurement. We review intangible assets subject to amortization for impairment whenever events or circumstances indicate that the carrying amount of an asset may not be recoverable. If the sum of the expected cash flows, undiscounted and without interest, is less than the carrying amount of the asset, an impairment loss is recognized as the amount by which the carrying amount of the asset exceeds its fair value. No impairment was recorded to our intangible assets with definite lives in 2014, 2013 or 2012.
Subscriber relationships are amortized on an accelerated basis over 9 years, which reflects the estimated pattern in which the economic benefits will be consumed. Other definite life intangible assets include certain licensing agreements, which are amortized over a weighted average useful life of 9.1 years on a straight-line basis. The fair value of the OEM relationships and proprietary software acquired from the acquisition of the connected vehicle business of Agero are being amortized over their estimated weighted average useful lives of 15 and 10 years, respectively.
Amortization expense for all definite life intangible assets was $55,016, $50,011 and $53,620 for the years ended December 31, 2014, 2013 and 2012, respectively. Expected amortization expense for each of the fiscal years 2015 through 2019 and for periods thereafter is as follows:
Years ending December 31, | Amount | |||
2015 | $ | 51,700 | ||
2016 | 48,545 | |||
2017 | 34,882 | |||
2018 | 19,463 | |||
2019 | 19,026 | |||
Thereafter | 137,776 | |||
Total definite life intangible assets, net | $ | 311,392 | ||
F-17
SIRIUS XM HOLDINGS INC. AND SUBSIDIARIES
NOTES TO CONSOLIDATED FINANCIAL STATEMENTS - Continued
(Dollar amounts in thousands, unless otherwise stated)
(10) | Interest Costs |
We capitalized a portion of the interest on funds borrowed as part of the cost of constructing our satellites and related launch vehicles. We primarily capitalized interest associated with our FM-6 satellite and related launch vehicle for the years ended December 31, 2013 and 2012. We also incurred interest costs on our debt instruments and on our satellite incentive agreements. The following is a summary of our interest costs:
For the Years Ended December 31, | |||||||||||
2014 | 2013 | 2012 | |||||||||
Interest costs charged to expense | $ | 269,010 | $ | 204,671 | $ | 265,321 | |||||
Interest costs capitalized | 480 | 26,445 | 31,982 | ||||||||
Total interest costs incurred | $ | 269,490 | $ | 231,116 | $ | 297,303 | |||||
Included in interest costs incurred is non-cash interest expense, consisting of amortization related to original issue discounts, premiums and deferred financing fees, of $21,039, $21,698 and $35,924 for the years ended December 31, 2014, 2013 and 2012, respectively.
(11) | Property and Equipment |
Property and equipment, including satellites, are stated at cost, less accumulated depreciation. Equipment under capital leases is stated at the present value of minimum lease payments. Depreciation is calculated using the straight-line method over the following estimated useful life of the asset:
Satellite system | 2 - 15 years |
Terrestrial repeater network | 5 - 15 years |
Broadcast studio equipment | 3 - 15 years |
Capitalized software and hardware | 3 - 7 years |
Satellite telemetry, tracking and control facilities | 3 - 15 years |
Furniture, fixtures, equipment and other | 2 - 7 years |
Building | 20 or 30 years |
Leasehold improvements | Lesser of useful life or remaining lease term |
We review long-lived assets, such as property and equipment, for impairment whenever events or changes in circumstances indicate the carrying amount may not be recoverable. Recoverability of assets to be held and used is measured by a comparison of the carrying amount of an asset to estimated undiscounted future cash flows expected to be generated by the asset. If the carrying amount of an asset exceeds the estimated future cash flows, an impairment charge is recognized for the amount by which the carrying amount exceeds the fair value of the asset. We did not record any impairments in 2014, 2013 or 2012.
F-18
SIRIUS XM HOLDINGS INC. AND SUBSIDIARIES
NOTES TO CONSOLIDATED FINANCIAL STATEMENTS - Continued
(Dollar amounts in thousands, unless otherwise stated)
Property and equipment, net, consists of the following:
December 31, 2014 | December 31, 2013 | ||||||
Satellite system | $ | 2,397,611 | $ | 2,407,423 | |||
Terrestrial repeater network | 108,341 | 109,367 | |||||
Leasehold improvements | 48,677 | 46,173 | |||||
Broadcast studio equipment | 61,306 | 59,020 | |||||
Capitalized software and hardware | 340,738 | 298,267 | |||||
Satellite telemetry, tracking and control facilities | 71,268 | 63,944 | |||||
Furniture, fixtures, equipment and other | 78,237 | 67,275 | |||||
Land | 38,411 | 38,411 | |||||
Building | 59,373 | 58,662 | |||||
Construction in progress | 155,716 | 103,148 | |||||
Total property and equipment | 3,359,678 | 3,251,690 | |||||
Accumulated depreciation and amortization | (1,849,566 | ) | (1,657,116 | ) | |||
Property and equipment, net | $ | 1,510,112 | $ | 1,594,574 | |||
Construction in progress consists of the following:
December 31, 2014 | December 31, 2013 | ||||||
Satellite system | $ | 12,912 | $ | 11,879 | |||
Terrestrial repeater network | 48,406 | 30,078 | |||||
Capitalized software | 77,755 | 39,924 | |||||
Other | 16,643 | 21,267 | |||||
Construction in progress | $ | 155,716 | $ | 103,148 | |||
Depreciation expense on property and equipment was $211,407, $203,303 and $212,675 for the years ended December 31, 2014, 2013 and 2012, respectively. During the years ended December 31, 2014, 2013 and 2012, we retired property and equipment of $19,398, $16,039 and $5,251, respectively, which included the retirement of our XM-2 satellite in 2014, and recognized a loss on disposal of assets of $220, $351 and $657, respectively.
F-19
SIRIUS XM HOLDINGS INC. AND SUBSIDIARIES
NOTES TO CONSOLIDATED FINANCIAL STATEMENTS - Continued
(Dollar amounts in thousands, unless otherwise stated)
Satellites
We currently own a fleet of nine operating satellites. The chart below provides certain information on these satellites:
Satellite Designation | Year Delivered | Estimated End of Depreciable Life | ||
FM-1* | 2000 | 2013 | ||
FM-2* | 2000 | 2013 | ||
FM-3 | 2000 | 2015 | ||
FM-5 | 2009 | 2024 | ||
FM-6 | 2013 | 2028 | ||
XM-1* | 2001 | 2013 | ||
XM-3 | 2005 | 2020 | ||
XM-4 | 2006 | 2021 | ||
XM-5 | 2010 | 2025 | ||
* Satellite was fully depreciated as of December 31, 2014 but is still in operation.
(12) | Related Party Transactions |
In the normal course of business, we enter into transactions with related parties. We had the following related party balances at December 31, 2014 and 2013:
Related party current assets | Related party long-term assets | Related party current liabilities | Related party current debt | Related party long-term liabilities | |||||||||||||||||||||||||||||||||||
2014 | 2013 | 2014 | 2013 | 2014 | 2013 | 2014 | 2013 | 2014 | 2013 | ||||||||||||||||||||||||||||||
Liberty Media | $ | — | $ | 278 | $ | — | $ | — | $ | — | $ | 15,766 | $ | — | $ | 10,959 | $ | — | $ | — | |||||||||||||||||||
Sirius XM Canada | 4,344 | 8,867 | 3,000 | 27,619 | 4,340 | 4,554 | — | — | 13,635 | 16,337 | |||||||||||||||||||||||||||||
M-Way | — | — | — | 2,545 | — | — | — | — | — | — | |||||||||||||||||||||||||||||
Total | $ | 4,344 | $ | 9,145 | $ | 3,000 | $ | 30,164 | $ | 4,340 | $ | 20,320 | $ | — | $ | 10,959 | $ | 13,635 | $ | 16,337 | |||||||||||||||||||
Liberty Media
Liberty Media has beneficially owned over 50% of our outstanding common stock since January 2013 and has two executives and one director on our board of directors. Gregory B. Maffei, the President and Chief Executive Officer of Liberty Media, is the Chairman of our board of directors.
On October 9, 2013, we entered into an agreement with Liberty Media to repurchase $500,000 of our common stock from Liberty Media. Pursuant to that agreement, we repurchased $160,000 of our common stock from Liberty Media in 2013. As of December 31, 2013, $15,702 was recorded to Related party current liabilities for the fair value of the derivative associated with the share repurchase agreement with Liberty Media as there were certain terms in the forward purchase contract that could cause the obligation to not be fulfilled. As a result, the instrument was a liability and was marked to fair value with any gain or loss recorded to our consolidated statements of comprehensive income. On April 25, 2014, we completed the final purchase installment under this share repurchase agreement and repurchased $340,000 of our shares of common stock from Liberty Media at a price of $3.66 per share. We recognized $34,485 and $20,393 to Loss on change in value of derivatives in our consolidated statements of comprehensive income related to this agreement during the years ended December 31, 2014 and December 31, 2013, respectively.
We understand that Liberty Media held $11,000 in principal amount of our 7% Exchangeable Senior Subordinated Notes due 2014 at December 31, 2013, which were converted upon maturity in December 2014 into 5,974,510 shares of our common stock.
F-20
SIRIUS XM HOLDINGS INC. AND SUBSIDIARIES
NOTES TO CONSOLIDATED FINANCIAL STATEMENTS - Continued
(Dollar amounts in thousands, unless otherwise stated)
Sirius XM Canada
We hold an equity method investment in Sirius XM Canada. We own approximately 47,300,000 shares of Sirius XM Canada, representing a 37.0% equity interest and a 25.0% voting interest. We primarily provide programming and content services to Sirius XM Canada.
Investments in which we have the ability to exercise significant influence but not control are accounted for pursuant to the equity method of accounting. We recognize our proportionate share of earnings or losses of Sirius XM Canada as they occur as a component of Interest and investment income in our consolidated statements of comprehensive income on a one month lag.
The difference between our investment and our share of the fair value of the underlying net assets of Sirius XM Canada is first allocated to either finite-lived intangibles or indefinite-lived intangibles and the balance is attributed to goodwill. We follow ASC 350, Intangibles - Goodwill and Other, which requires that equity method finite-lived intangibles be amortized over their estimated useful life while indefinite-lived intangibles and goodwill are not amortized. The amortization of equity method finite-lived intangible assets is recorded in Interest and investment income in our consolidated statements of comprehensive income. We periodically evaluate our equity method investments to determine if there has been an other-than-temporary decline below carrying value. Equity method finite-lived intangibles, indefinite-lived intangibles and goodwill are included in the carrying amount of the investment.
Our related party current asset balances primarily consist of programming and chipset costs that we are reimbursed for. Our related party long-term asset balances primarily include our investment balance in Sirius XM Canada. As of December 31, 2014, $2,654 of our investment balance in Sirius XM Canada related to equity method goodwill and as of December 31, 2013, $26,161 of our investment balance related to equity method goodwill and intangible assets. Our related party liabilities as of December 31, 2014 and December 31, 2013 included $2,776 for the current portion of deferred revenue and $13,415 and $16,190, respectively, for the long-term portion of deferred revenue recorded as of the Merger date related to agreements with XM Canada, now Sirius XM Canada. The estimated fair value of deferred revenue from XM Canada as of the Merger date was approximately $34,000, which is amortized on a straight-line basis through 2020, the end of the expected term of the current existing agreements.
We recorded the following revenue and expenses associated with Sirius XM Canada and Liberty Media which were recorded in our consolidated statements of comprehensive income:
For the Years Ended December 31, | |||||||||||
2014 | 2013 | 2012 | |||||||||
Sirius XM Canada: | |||||||||||
Revenue (a) | $ | 49,691 | $ | 48,935 | $ | 39,477 | |||||
Share of net earnings (losses) (b) | $ | 15,517 | $ | 5,865 | $ | (420 | ) | ||||
Liberty Media: | |||||||||||
Expenses (c) | $ | (1,025 | ) | $ | (13,514 | ) | $ | (30,931 | ) | ||
(a) | Under our agreements with Sirius XM Canada, we receive a percentage-based royalty for certain types of subscription revenue earned by Sirius XM Canada for the distribution of Sirius and XM channels, royalties for activation fees and reimbursements for other charges. We record revenue from Sirius XM Canada as Other revenue in our consolidated statements of comprehensive income. |
(b) | During the year ended December 31, 2014, our share of Sirius XM Canada’s net earnings included a gain of $1,251 related to the fair value received in excess of the carrying value associated with the redemption of our investment in Sirius XM Canada’s 8% convertible unsecured subordinated debentures in February 2014. Sirius XM Canada declared dividends to us of $43,492, $16,796 and $7,749 during the years ended December 31, 2014, 2013 and 2012, respectively. These dividends are first recorded as a reduction to our investment balance in Sirius XM Canada to the extent a balance exists and then as Interest and investment income for the remaining portion. This amount includes amortization related to the equity method intangible assets of $363, $1,454 and $974 for the years ended December 31, 2014, 2013 and 2012, respectively. |
(c) | We recognized Interest expense associated with the portion of the 7% Exchangeable Senior Subordinated Notes due 2014, the portion of the 7.625% Senior Notes due 2018, and the portion of the 8.75% Senior Notes due 2015 held by Liberty Media through December 2014, October 2013 and August 2013, respectively. |
F-21
SIRIUS XM HOLDINGS INC. AND SUBSIDIARIES
NOTES TO CONSOLIDATED FINANCIAL STATEMENTS - Continued
(Dollar amounts in thousands, unless otherwise stated)
M-Way
During the year ended December 31, 2014, we evaluated our investment in M-Way Solutions GmbH ("M-Way") and determined that there was an other than temporary decline in its fair value. As a result, we reduced our investment balance to zero and recognized a loss of $2,342 in Other (loss) income in our consolidated statements of comprehensive income during the year ended December 31, 2014. In November 2014, we sold our investment in M-Way and recognized a loss of $353 in Engineering, design and development in connection with this transaction in our consolidated statements of comprehensive income during the year ended December 31, 2014.
(13) | Investments |
Long Term Restricted Investments
Restricted investments relate to reimbursement obligations under letters of credit issued for the benefit of lessors of our office space. As of December 31, 2014 and 2013 our Long-term restricted investments were $5,922 and $5,718, respectively.
(14)Debt
Our debt as of December 31, 2014 and 2013 consisted of the following:
Carrying value at | ||||||||||||||||||||
Issuer / Borrower | Issued | Debt | Maturity Date | Interest Payable | Principal Amount | December 31, 2014 | December 31, 2013 | |||||||||||||
Sirius XM (a) | August 2008 | 7% Exchangeable Senior Subordinated Notes (the "Exchangeable Notes") | December 1, 2014 | semi-annually on June 1 and December 1 | $ | — | $ | — | $ | 500,481 | ||||||||||
Sirius XM (a)(b) | May 2013 | 4.25% Senior Notes (the "4.25% Notes") | May 15, 2020 | semi-annually on May 15 and November 15 | 500,000 | 495,529 | 494,809 | |||||||||||||
Sirius XM (a)(b) | September 2013 | 5.875% Senior Notes (the "5.875% Notes") | October 1, 2020 | semi-annually on April 1 and October 1 | 650,000 | 643,790 | 642,914 | |||||||||||||
Sirius XM (a)(b) | August 2013 | 5.75% Senior Notes (the "5.75% Notes") | August 1, 2021 | semi-annually on February 1 and August 1 | 600,000 | 595,091 | 594,499 | |||||||||||||
Sirius XM (a)(b) | May 2013 | 4.625% Senior Notes (the "4.625% Notes") | May 15, 2023 | semi-annually on May 15 and November 15 | 500,000 | 495,116 | 494,653 | |||||||||||||
Sirius XM (a)(b)(c) | May 2014 | 6.00% Senior Notes (the "6.00% Notes") | July 15, 2024 | semi-annually on January 15 and July 15 | 1,500,000 | 1,483,918 | — | |||||||||||||
Sirius XM (a)(b)(d) | August 2012 | 5.25% Senior Secured Notes (the "5.25% Notes") | August 15, 2022 | semi-annually on February 15 and August 15 | 400,000 | 395,147 | 394,648 | |||||||||||||
Sirius XM (e) | December 2012 | Senior Secured Revolving Credit Facility (the "Credit Facility") | December 5, 2017 | variable fee paid quarterly | 1,250,000 | 380,000 | 460,000 | |||||||||||||
Sirius XM | Various | Capital leases | Various | n/a | n/a | 12,754 | 19,591 | |||||||||||||
Total Debt | 4,501,345 | 3,601,595 | ||||||||||||||||||
Less: total current maturities non-related party | 7,482 | 496,815 | ||||||||||||||||||
Less: total current maturities related party | — | 10,959 | ||||||||||||||||||
Total long-term debt | $ | 4,493,863 | $ | 3,093,821 | ||||||||||||||||
(a) | The carrying value of the notes are net of the remaining unamortized original issue discount. |
(b) | Substantially all of our domestic wholly-owned subsidiaries have guaranteed these notes. |
(c) | In May 2014, Sirius XM issued $1,500,000 aggregate principal amount of 6.00% Senior Notes due 2024, with an original issuance discount of $16,875. |
(d) | In April 2014, we entered into a supplemental indenture to the indenture governing the 5.25% Notes pursuant to which we granted a first priority lien on substantially all of the assets of Sirius XM and the guarantors to the holders of the 5.25% Notes. The liens securing the 5.25% Notes are equal and ratable to the liens granted to secure the Credit Facility. |
(e) | In December 2012, Sirius XM entered into a five-year Credit Facility with a syndicate of financial institutions for $1,250,000. Sirius XM's obligations under the Credit Facility are guaranteed by certain of its material domestic subsidiaries and are secured by a lien on substantially all of Sirius XM's assets and the assets of its material domestic subsidiaries. Borrowings under the Credit Facility are used for working capital and other general corporate purposes, including dividends, financing of acquisitions and share |
F-22
SIRIUS XM HOLDINGS INC. AND SUBSIDIARIES
NOTES TO CONSOLIDATED FINANCIAL STATEMENTS - Continued
(Dollar amounts in thousands, unless otherwise stated)
repurchases. Interest on borrowings is payable on a monthly basis and accrues at a rate based on LIBOR plus an applicable rate. Sirius XM is also required to pay a variable fee on the average daily unused portion of the Credit Facility and is payable on a quarterly basis. The variable rate for the unused portion of the Credit Facility was 0.35% per annum as of December 31, 2014. As of December 31, 2014, $870,000 was available for future borrowing under the Credit Facility. Sirius XM's outstanding borrowings under the Credit Facility are classified as Long-term debt within our consolidated balance sheets due to the long-term maturity of this debt.
Retired and Converted Debt
The Exchangeable Notes were exchangeable at anytime at the option of the holder into shares of our common stock at an exchange rate of 543.1372 shares of common stock per 1,000 dollars of principal amount of the notes, which is equivalent to an approximate exchange price of $1.841 per share of common stock. All holders of the Exchangeable Notes converted prior to the Exchangeable Notes' maturity on December 1, 2014. During the year ended December 31, 2014, $502,370 in principal amount of the Exchangeable Notes were converted, resulting in the issuance of 272,855,859 shares of our common stock. No loss was recognized as a result of this conversion.
During the year ended December 31, 2013, we purchased $800,000 of our then outstanding 8.75% Senior Notes due 2015, for an aggregate purchase price, including premium and interest, of $927,860. We recognized $104,818 to Loss on extinguishment of debt and credit facilities, net, consisting primarily of unamortized discount, deferred financing fees and repayment premium, as a result of this transaction.
During the year ended December 31, 2013, we also purchased $700,000 of our then outstanding 7.625% Senior Notes due 2018, for an aggregate purchase price, including premium and interest, of $797,830. We recognized $85,759 to Loss on extinguishment of debt and credit facilities, net, consisting primarily of unamortized discount, deferred financing fees and repayment premium, as a result of this transaction.
Covenants and Restrictions
Under the Credit Facility, Sirius XM, our wholly-owned subsidiary, must comply with a debt maintenance covenant that it not exceed a total leverage ratio, calculated as total consolidated debt to consolidated operating cash flow, of 5.0 to 1.0. The Credit Facility generally requires compliance with certain covenants that restrict Sirius XM's ability to, among other things, (i) incur additional indebtedness, (ii) incur liens, (iii) pay dividends or make certain other restricted payments, investments or acquisitions, (iv) enter into certain transactions with affiliates, (v) merge or consolidate with another person, (vi) sell, assign, lease or otherwise dispose of all or substantially all of Sirius XM's assets, and (vii) make voluntary prepayments of certain debt, in each case subject to exceptions.
The indentures governing Sirius XM's notes restrict Sirius XM's non-guarantor subsidiaries' ability to create, assume, incur or guarantee additional indebtedness without such non-guarantor subsidiary guaranteeing each such series of notes on a pari passu basis. The indentures governing the notes also contain covenants that, among other things, limit Sirius XM's ability and the ability of its subsidiaries to create certain liens; enter into sale/leaseback transactions; and merge or consolidate.
Under Sirius XM's debt agreements, the following generally constitute an event of default: (i) a default in the payment of interest; (ii) a default in the payment of principal; (iii) failure to comply with covenants; (iv) failure to pay other indebtedness after final maturity or acceleration of other indebtedness exceeding a specified amount; (v) certain events of bankruptcy; (vi) a judgment for payment of money exceeding a specified aggregate amount; and (vii) voidance of subsidiary guarantees, subject to grace periods where applicable. If an event of default occurs and is continuing, our debt could become immediately due and payable.
At December 31, 2014 and 2013, we were in compliance with our debt covenants.
F-23
SIRIUS XM HOLDINGS INC. AND SUBSIDIARIES
NOTES TO CONSOLIDATED FINANCIAL STATEMENTS - Continued
(Dollar amounts in thousands, unless otherwise stated)
(15) | Stockholders’ Equity |
Common Stock, par value $0.001 per share
We were authorized to issue up to 9,000,000,000 shares of common stock as of December 31, 2014 and 2013. There were 5,653,529,403 and 6,096,220,526 shares of common stock issued and 5,646,119,122 and 6,096,220,526 shares outstanding on December 31, 2014 and 2013, respectively.
As of December 31, 2014, approximately 296,096,000 shares of common stock were reserved for issuance in connection with outstanding warrants, incentive stock based awards and common stock to be granted to third parties upon satisfaction of performance targets.
Stock Repurchase Program
Since December 2012, our board of directors has approved for repurchase an aggregate of $6,000,000 our common stock. Our board of directors did not establish an end date for this stock repurchase program. Shares of common stock may be purchased from time to time on the open market, pursuant to pre-set trading plans meeting the requirements of Rule 10b5-1 under the Exchange Act, in privately negotiated transactions, including transactions with Liberty Media and its affiliates, or otherwise. As of December 31, 2014, our cumulative repurchases since December 2012 under our stock repurchase program totaled 1,259,274,498 shares for $4,285,192, and $1,714,808 remained available under our stock repurchase program.
The following table summarizes our share repurchase activity for the years ended:
December 31, 2014 | December 31, 2013 | ||||||||||||
Share Repurchase Type | Shares | Amount | Shares | Amount | |||||||||
Open Market and Privately Negotiated Repurchases (a) | 422,965,443 | $ | 1,426,428 | 476,545,601 | $ | 1,602,360 | |||||||
Liberty Media (b) | 92,888,561 | 340,000 | 43,712,265 | 160,000 | |||||||||
May 2014 ASR Agreement (c) | 151,846,125 | 506,404 | — | — | |||||||||
August 2014 ASR Agreement (d) | 71,316,503 | 250,000 | — | — | |||||||||
Total Repurchases | 739,016,632 | $ | 2,522,832 | 520,257,866 | $ | 1,762,360 | |||||||
(a) | As of December 31, 2014 and 2013, $26,034 and $0, respectively, of common stock repurchases had not settled, nor been retired, and were recorded as Treasury stock within our consolidated balance sheets and consolidated statements of stockholders' equity. |
(b) | On October 9, 2013, we entered into an agreement to repurchase $500,000 of our common stock from Liberty Media. Pursuant to this agreement, we repurchased 43,712,265 shares of our common stock for $160,000 from Liberty Media in 2013. On April 25, 2014, we completed the final purchase installment and repurchased 92,888,561 shares of our common stock for $340,000 from Liberty Media at a price of $3.66 per share. As there were certain terms in the forward purchase contract with Liberty Media that could have caused the obligation not to be fulfilled, the instrument was classified as a liability and was marked to fair value with any gain or loss recorded to our consolidated statements of comprehensive income. We recognized $34,485 and $20,393 to Loss on change in value of derivatives in our consolidated statements of comprehensive income during the years ended December 31, 2014 and 2013, respectively. |
(c) | In May 2014, we entered into an accelerated share repurchase agreement (the "May ASR Agreement") under which we prepaid $600,000 to a third-party financial institution to repurchase our common stock. Under the May ASR Agreement, we received 151,846,125 shares of our common stock that were retired upon receipt and the counter party returned to us $93,596 for the unused portion of the original prepayment. |
(d) | In August 2014, we entered into a second accelerated share repurchase agreement (the "August ASR Agreement") under which we prepaid $250,000 to a third-party financial institution to repurchase our common stock. Under the August ASR Agreement, we received an aggregate of 71,316,503 shares of our common stock that were retired upon receipt. |
Share Lending Arrangements
To facilitate the offering of the Exchangeable Notes, we entered into share lending agreements with Morgan Stanley Capital Services Inc. and UBS AG London Branch in July 2008. All loaned shares were returned to us as of October 2011, and the share lending agreements were terminated.
We recorded interest expense related to the amortization of the costs associated with the share lending arrangement and other issuance costs for our Exchangeable Notes of $12,701, $12,745 and $12,402 for the years ended December 31, 2014,
F-24
SIRIUS XM HOLDINGS INC. AND SUBSIDIARIES
NOTES TO CONSOLIDATED FINANCIAL STATEMENTS - Continued
(Dollar amounts in thousands, unless otherwise stated)
2013 and 2012, respectively. As of December 31, 2013, the unamortized balance of the debt issuance costs was $12,701, with $12,423 recorded in Other current assets, and $278 recorded in Related party current assets. These costs were fully amortized as of December 31, 2014 as the Exchangeable Notes matured on December 1, 2014.
Preferred Stock, par value $0.001 per share
We were authorized to issue up to 50,000,000 shares of undesignated preferred stock as of December 31, 2014 and 2013. In January 2013, Liberty Media converted its remaining shares of the Series B Preferred Stock into 1,293,509,076 shares of our common stock. There were no shares of preferred stock issued or outstanding as of December 31, 2014 and 2013.
Warrants
We have issued warrants to purchase shares of our common stock in connection with distribution and programming agreements. The outstanding warrants expire in the first quarter of 2015.
During the year ended December 31, 2014, 1,788,000 warrants were exercised to purchase shares of common stock on a net settlement basis, resulting in the issuance of 99,349 shares of our common stock. Approximately 16,667,000 and 18,455,000 warrants to acquire an equal number of shares of common stock were outstanding and fully vested as of December 31, 2014 and December 31, 2013, respectively. Warrants were included in our calculation of diluted net income per common share as the effect was dilutive for the years ended December 31, 2014 and 2013. At December 31, 2014 and December 31, 2013, the weighted average exercise price of outstanding warrants was $2.50 and $2.55 per share, respectively. We did not incur warrant related expenses during the years ended December 31, 2014, 2013 and 2012.
(16) | Benefit Plans |
We recognized share-based payment expense of $78,212, $68,876 and $63,822 for the years ended December 31, 2014, 2013 and 2012, respectively.
We account for equity instruments granted to employees in accordance with ASC 718, Compensation - Stock Compensation. ASC 718 requires all share-based compensation payments to be recognized in the financial statements based on fair value. ASC 718 requires forfeitures to be estimated at the time of grant and revised in subsequent periods if actual forfeitures differ from initial estimates. We use the Black-Scholes-Merton option-pricing model to value stock option awards and have elected to treat awards with graded vesting as a single award. Share-based compensation expense is recognized ratably over the requisite service period, which is generally the vesting period, net of forfeitures. We measure restricted stock awards and units using the fair market value of the restricted shares of common stock on the day the award is granted.
Fair value as determined using the Black-Scholes-Merton model varies based on assumptions used for the expected life, expected stock price volatility and risk-free interest rates. In 2014, 2013 and 2012, we estimated the fair value of awards granted using the hybrid approach for volatility, which weights observable historical volatility and implied volatility of qualifying actively traded options on our common stock. The expected life assumption represents the weighted-average period stock-based awards are expected to remain outstanding. These expected life assumptions are established through a review of historical exercise behavior of stock-based award grants with similar vesting periods. Where historical patterns do not exist, contractual terms are used. The risk-free interest rate represents the daily treasury yield curve rate at the grant date based on the closing market bid yields on actively traded U.S. treasury securities in the over-the-counter market for the expected term. Our assumptions may change in future periods.
Stock-based awards granted to employees, non-employees and members of our board of directors include warrants, stock options, and restricted stock units.
2009 Long-Term Stock Incentive Plan
In May 2009, our stockholders approved the Sirius XM Radio Inc. 2009 Long-Term Stock Incentive Plan (the “2009 Plan”). Employees, consultants and members of our board of directors are eligible to receive awards under the 2009 Plan. The 2009 Plan provides for the grant of stock options, restricted stock awards, restricted stock units and other stock-based awards that the compensation committee of our board of directors may deem appropriate. Vesting and other terms of stock-based awards are set forth in the agreements with the individuals receiving the awards. Stock-based awards granted under the 2009 Plan are generally subject to a vesting requirement. Stock-based awards generally expire ten years from the date of grant. Each
F-25
SIRIUS XM HOLDINGS INC. AND SUBSIDIARIES
NOTES TO CONSOLIDATED FINANCIAL STATEMENTS - Continued
(Dollar amounts in thousands, unless otherwise stated)
restricted stock unit entitles the holder to receive one share of common stock upon vesting. As of December 31, 2014, approximately 19,950,000 shares of common stock were available for future grants under the 2009 Plan.
Other Plans
We maintain four other share-based benefit plans — the XM 2007 Stock Incentive Plan, the Amended and Restated Sirius Satellite Radio 2003 Long-Term Stock Incentive Plan, the XM 1998 Shares Award Plan and the XM Talent Option Plan. No further awards may be made under these plans, and all outstanding awards are fully vested.
The following table summarizes the weighted-average assumptions used to compute the fair value of options granted to employees and members of our board of directors:
For the Years Ended December 31, | |||||
2014 | 2013 | 2012 | |||
Risk-free interest rate | 1.6% | 1.4% | 0.8% | ||
Expected life of options — years | 4.72 | 4.73 | 5.06 | ||
Expected stock price volatility | 33% | 47% | 49% | ||
Expected dividend yield | 0% | 0% | 0% | ||
There were no options granted to third parties during the years ended December 31, 2014, 2013 and 2012. We do not intend to pay regular dividends on our common stock. Accordingly, the dividend yield percentage used in the Black-Scholes-Merton option value was zero for all periods.
The following table summarizes stock option activity under our share-based plans for the years ended December 31, 2014, 2013 and 2012 (options in thousands):
Options | Weighted- Average Exercise Price (1) | Weighted-Average Remaining Contractual Term (Years) | Aggregate Intrinsic Value | |||||||||
Outstanding at the beginning of January 1, 2012 | 439,580 | $ | 1.25 | |||||||||
Granted | 58,626 | $ | 2.53 | |||||||||
Exercised | (214,199 | ) | $ | 0.59 | ||||||||
Forfeited, cancelled or expired | (9,495 | ) | $ | 3.09 | ||||||||
Outstanding as of December 31, 2012 | 274,512 | $ | 1.92 | |||||||||
Granted | 57,228 | $ | 3.59 | |||||||||
Exercised | (61,056 | ) | $ | 1.31 | ||||||||
Forfeited, cancelled or expired | (6,445 | ) | $ | 2.02 | ||||||||
Outstanding as of December 31, 2013 | 264,239 | $ | 2.42 | |||||||||
Granted | 61,852 | $ | 3.39 | |||||||||
Exercised | (46,943 | ) | $ | 1.63 | ||||||||
Forfeited, cancelled or expired | (11,294 | ) | $ | 4.08 | ||||||||
Outstanding as of December 31, 2014 | 267,854 | $ | 2.72 | 7.09 | $ | 246,067 | ||||||
Exercisable as of December 31, 2014 | 121,272 | $ | 2.27 | 5.28 | $ | 179,913 | ||||||
(1) | The weighted-average exercise price for options outstanding as of December 31, 2012 in the table above has been adjusted to reflect the reduction to the exercise prices related to the December 28, 2012 special cash dividend. |
The weighted average grant date fair value of options granted during the years ended December 31, 2014, 2013 and 2012 was $1.05, $1.48 and $1.09, respectively. The total intrinsic value of stock options exercised during the years ended December 31, 2014, 2013 and 2012 was $89,428, $142,491 and $399,794, respectively. During the years ended December 31, 2014 and 2013, the number of shares which were issued as a result of stock option exercises were 15,228,394 and 32,649,857, respectively, due to the net settlement method that began in 2013.
F-26
SIRIUS XM HOLDINGS INC. AND SUBSIDIARIES
NOTES TO CONSOLIDATED FINANCIAL STATEMENTS - Continued
(Dollar amounts in thousands, unless otherwise stated)
We recognized share-based payment expense associated with stock options of $69,754, $66,231 and $60,299 for the years ended December 31, 2014, 2013 and 2012, respectively.
The following table summarizes the nonvested restricted stock unit activity under our share-based plans for the years ended December 31, 2014, 2013 and 2012 (shares in thousands):
Shares | Grant Date Fair Value | |||||
Nonvested as of January 1, 2012 | 421 | $ | 1.46 | |||
Granted | 8 | $ | — | |||
Vested | — | $ | — | |||
Forfeited | — | $ | — | |||
Nonvested as of December 31, 2012 | 429 | $ | 3.25 | |||
Granted | 6,873 | $ | 3.59 | |||
Vested | (192 | ) | $ | 3.27 | ||
Forfeited | (126 | ) | $ | 3.61 | ||
Nonvested as of December 31, 2013 | 6,984 | $ | 3.58 | |||
Granted | 6,108 | $ | 3.38 | |||
Vested | (1,138 | ) | $ | 3.62 | ||
Forfeited | (379 | ) | $ | 3.52 | ||
Nonvested as of December 31, 2014 | 11,575 | $ | 3.47 | |||
The weighted average grant date fair value of restricted stock units granted during the years ended December 31, 2014 and 2013 was $3.38 and $3.59, respectively. The total intrinsic value of restricted stock units that vested during the years ended December 31, 2014, 2013 and 2012 was $4,044, $605 and $0, respectively. In connection with the special cash dividend paid in December 2012, we granted 8,000 incremental restricted stock units to prevent the economic dilution of the holders of our restricted stock units. This grant did not result in any additional incremental share-based payment expense being recognized in 2012.
We recognized share-based payment expense associated with restricted stock units of $8,458, $2,645 and $0 during the years ended December 31, 2014, 2013 and 2012, respectively. During the years ended December 31, 2014 and 2013, the number of shares which were issued as a result of restricted stock units that vested were 731,626 and 191,524, respectively.
Total unrecognized compensation costs related to unvested share-based payment awards for stock options and restricted stock units granted to employees and members of our board of directors at December 31, 2014 and 2013, net of estimated forfeitures, were $162,985 and $164,292, respectively. The total unrecognized compensation costs at December 31, 2014 are expected to be recognized over a weighted-average period of 3 years.
F-27
SIRIUS XM HOLDINGS INC. AND SUBSIDIARIES
NOTES TO CONSOLIDATED FINANCIAL STATEMENTS - Continued
(Dollar amounts in thousands, unless otherwise stated)
401(k) Savings Plan
Sirius XM sponsors the Sirius XM Radio Inc. 401(k) Savings Plan (the “Sirius XM Plan”) for eligible employees. The Sirius XM Plan allows eligible employees to voluntarily contribute from 1% to 50% of their pre-tax eligible earnings, subject to certain defined limits. We match 50% of an employee’s voluntary contributions per pay period on the first 6% of an employee’s pre-tax salary up to a maximum of 3% of eligible compensation. Employer matching contributions under the Sirius XM Plan vest at a rate of 33.33% for each year of employment and are fully vested after three years of employment for all current and future contributions. Beginning in January 2014, our cash employer matching contributions were no longer used to purchase shares of our common stock on the open market, unless the employee elects our common stock as their investment option for this contribution. Prior to January 2014, the cash from employer matching contributions was used to purchase shares of our common stock on the open market. We contributed $5,385 and $4,181 during the years ended December 31, 2014 and 2013, respectively, to the Sirius XM Plan in fulfillment of our matching obligation. During the year ended December 31, 2012, employer matching contributions were made in the form of shares of our common stock, resulting in share-based payment expense of $3,523.
(17) | Commitments and Contingencies |
The following table summarizes our expected contractual cash commitments as of December 31, 2014:
2015 | 2016 | 2017 | 2018 | 2019 | Thereafter | Total | |||||||||||||||||||||
Debt obligations | $ | 7,482 | $ | 4,266 | $ | 380,928 | $ | 78 | $ | — | $ | 4,150,000 | $ | 4,542,754 | |||||||||||||
Cash interest payments | 240,874 | 240,551 | 240,803 | 228,063 | 228,063 | 711,750 | 1,890,104 | ||||||||||||||||||||
Satellite and transmission | 15,364 | 4,594 | 3,643 | 4,170 | 4,187 | 12,719 | 44,677 | ||||||||||||||||||||
Programming and content | 231,272 | 109,903 | 74,816 | 60,150 | 48,333 | 60,000 | 584,474 | ||||||||||||||||||||
Marketing and distribution | 31,645 | 13,114 | 9,185 | 8,298 | 6,218 | 1,538 | 69,998 | ||||||||||||||||||||
Satellite incentive payments | 11,511 | 12,367 | 13,296 | 14,302 | 10,652 | 43,527 | 105,655 | ||||||||||||||||||||
Operating lease obligations | 49,408 | 43,634 | 36,636 | 34,036 | 29,224 | 200,884 | 393,822 | ||||||||||||||||||||
Other | 66,462 | 13,829 | 2,479 | 895 | 150 | 50 | 83,865 | ||||||||||||||||||||
Total (1) | $ | 654,018 | $ | 442,258 | $ | 761,786 | $ | 349,992 | $ | 326,827 | $ | 5,180,468 | $ | 7,715,349 | |||||||||||||
(1) | The table does not include our reserve for uncertain tax positions, which at December 31, 2014 totaled $1,432, as the specific timing of any cash payments cannot be projected with reasonable certainty. |
Debt obligations. Debt obligations include principal payments on outstanding debt and capital lease obligations.
Cash interest payments. Cash interest payments include interest due on outstanding debt and capital lease payments through maturity.
Satellite and transmission. We have entered into agreements with third parties to operate and maintain the off-site satellite telemetry, tracking and control facilities and certain components of our terrestrial repeater networks.
Programming and content. We have entered into various programming agreements. Under the terms of these agreements, our obligations include fixed payments, advertising commitments and revenue sharing arrangements. Our future revenue sharing costs are dependent upon many factors and are difficult to estimate; therefore, they are not included in our minimum contractual cash commitments.
Marketing and distribution. We have entered into various marketing, sponsorship and distribution agreements to promote our brand and are obligated to make payments to sponsors, retailers, automakers and radio manufacturers under these agreements. Certain programming and content agreements also require us to purchase advertising on properties owned or controlled by the licensors. We also reimburse automakers for certain engineering and development costs associated with the incorporation of satellite radios into new vehicles they manufacture. In addition, in the event certain new products are not shipped by a distributor to its customers within 90 days of the distributor’s receipt of goods, we have agreed to purchase and take title to the product.
F-28
SIRIUS XM HOLDINGS INC. AND SUBSIDIARIES
NOTES TO CONSOLIDATED FINANCIAL STATEMENTS - Continued
(Dollar amounts in thousands, unless otherwise stated)
Satellite incentive payments. Boeing Satellite Systems International, Inc., the manufacturer of certain of our in-orbit satellites, may be entitled to future in-orbit performance payments with respect to XM-3 and XM-4 based on the expected operating performance meeting their fifteen-year design life. Boeing may also be entitled to additional incentive payments up to $10,000 if our XM-4 satellite continues to operate above baseline specifications during the five years beyond the satellite’s fifteen-year design life.
Space Systems/Loral, the manufacturer of certain of our in-orbit satellites, may be entitled to future in-orbit performance payments with respect to XM-5, FM-5 and FM-6 based on their expected operating performance meeting their fifteen-year design life.
Operating lease obligations. We have entered into both cancelable and non-cancelable operating leases for office space, equipment and terrestrial repeaters. These leases provide for minimum lease payments, additional operating expense charges, leasehold improvements and rent escalations that have initial terms ranging from one to fifteen years, and certain leases have options to renew. The effect of the rent holidays and rent concessions are recognized on a straight-line basis over the lease term, including reasonably assured renewal periods. Total rent recognized in connection with leases for the years ended December 31, 2014, 2013 and 2012 was $45,107, $39,228 and $37,474, respectively.
Other. We have entered into various agreements with third parties for general operating purposes. In addition to the minimum contractual cash commitments described above, we have entered into agreements with other variable cost arrangements. These future costs are dependent upon many factors, including subscriber growth, and are difficult to anticipate; however, these costs may be substantial. We may enter into additional programming, distribution, marketing and other agreements that contain similar variable cost provisions. The cost of our stock acquired from a third-party financial institution but not paid for as of December 31, 2014 is included in this category.
We do not have any other significant off-balance sheet financing arrangements that are reasonably likely to have a material effect on our financial condition, results of operations, liquidity, capital expenditures or capital resources.
Legal Proceedings
In the ordinary course of business, we are a defendant or party to various claims and lawsuits, including those discussed below. These claims are at various stages of arbitration or adjudication.
We record a liability when we believe that it is both probable that a liability will be incurred, and the amount of loss can be reasonably estimated. We evaluate developments in legal matters that could affect the amount of liability that has been previously accrued and make adjustments as appropriate. Significant judgment is required to determine both probability and the estimated amount of a loss or potential loss. We may be unable to reasonably estimate the reasonably possible loss or range of loss for a particular legal contingency for various reasons, including, among others, because: (i) the damages sought are indeterminate; (ii) the proceedings are in the relative early stages; (iii) there is uncertainty as to the outcome of pending proceedings (including motions and appeals); (iv) there is uncertainty as to the likelihood of settlement and the outcome of any negotiations with respect thereto; (v) there remain significant factual issues to be determined or resolved; (vi) the relevant law is unsettled; or (vii) the proceedings involve novel or untested legal theories. In such instances, there may be considerable uncertainty regarding the ultimate resolution of such matters, including a possible eventual loss, if any.
State Consumer Investigations. In December 2014, we entered into agreements with 46 States and the District of Columbia to settle a multistate investigation into certain of our consumer practices. The investigation focused on practices relating to the cancellation of subscriptions; automatic renewal of subscriptions; charging, billing, collecting, and refunding or crediting of payments from consumers; and soliciting customers. As part of the settlement agreements, we agreed to certain changes in our consumer practices relating to: the sale and cancellation of self-pay subscriptions, the contents of advertising for our products and services, refunds we provide to consumers, and consumer complaints. All of the changes contemplated by these settlement agreements have been implemented. We also agreed to provide, upon the request of the States, certain additional information about our consumer practices, to participate in a process designed to address any previously unresolved consumer complaints, and to make an aggregate payment to the States of approximately $4,000.
A separate investigation into our consumer practices is being conducted by the Attorney General of the State of New York. We are cooperating with this investigation and believe our consumer practices comply with all applicable federal and
F-29
SIRIUS XM HOLDINGS INC. AND SUBSIDIARIES
NOTES TO CONSOLIDATED FINANCIAL STATEMENTS - Continued
(Dollar amounts in thousands, unless otherwise stated)
New York State laws and regulations. In our view, the result of this investigation, including a possible settlement, will not have a material adverse effect on our business, financial condition or results of operations.
Pre-1972 Sound Recording Matters. We are a defendant in three class action suits and one additional suit, which were commenced in August and September 2013 and challenge our use and public performance via satellite radio and the Internet of sound recordings fixed prior to February 15, 1972 under California, New York and/or Florida law. The plaintiffs in each of these suits purport to seek in excess of $100,000 in compensatory damages along with unspecified punitive damages and injunctive relief. Accordingly, at this point we cannot estimate the reasonably possible loss, or range of loss, which could be incurred if the plaintiffs were to prevail in the allegations, but we believe we have substantial defenses to the claims asserted. We intend to defend these actions vigorously.
In September 2014, the United States District Court for the Central District of California ruled that the grant of “exclusive ownership” to the owner of a sound recording under California’s copyright statute included the exclusive right to control public performances of the sound recording. The court further found that the unauthorized public performance of sound recordings violated California laws on unfair competition, misappropriation and conversion. In October 2014, the Superior Court of the State of California for the County of Los Angeles adopted the Central District Court's interpretation of "exclusive ownership" under California's copyright statute. That Court did not find that the unauthorized public performance of sound recordings violated California laws on unfair competition, misappropriation and conversion. In November 2014, the United States District Court for the Southern District of New York ruled that sound recordings fixed before February 15, 1972 were entitled under various theories of New York common law to the benefits of a public performances right. We intend to appeal these decisions.
These cases are titled Flo & Eddie Inc. v. Sirius XM Radio Inc. et al., No. 2:13-cv-5693-PSG-RZ (C.D. Cal.), Flo & Eddie, Inc. v. Sirius XM Radio Inc., et al., No. 1:13-cv-23182-DPG (S.D. Fla.), Flo & Eddie, Inc. v. Sirius XM Radio Inc. et al., No. 1:13-cv-5784-CM (S.D.N.Y.), and Capitol Records LLC et al. v. Sirius XM Radio Inc., No. BC-520981 (Super. Ct. L.A. County). Additional information concerning each of these actions is publicly available in court filings under their docket numbers.
In addition, in August 2013, SoundExchange, Inc. filed a complaint in the United States District Court for the District of Columbia alleging that we underpaid royalties for statutory licenses during the 2007-2012 rate period in violation of the regulations established by the Copyright Royalty Board for that period. SoundExchange principally alleges that we improperly reduced our calculation of gross revenues, on which the royalty payments are based, by deducting non-recognized revenue attributable to pre-1972 recordings and Premier package revenue that is not “separately charged” as required by the regulations. SoundExchange is seeking compensatory damages of not less than $50,000 and up to $100,000 or more, payment of late fees and interest, and attorneys’ fees and costs.
In August 2014, the United States District Court for the District of Columbia granted our motion to dismiss the complaint without prejudice on the grounds that the case properly should be pursued before the Copyright Royalty Board rather than the district court. In December 2014, SoundExchange filed a petition with the Copyright Royalty Board requesting an order interpreting the applicable regulations. The Copyright Royalty Board has requested that the parties submit briefs regarding whether the agency properly has jurisdiction to interpret the regulations and adjudicate this matter under the applicable statute. At this point we cannot estimate the reasonably possible loss, or range of loss, which could be incurred if the plaintiffs were to prevail in the allegations, but we believe we have substantial defenses to the claims asserted. We intend to defend these actions vigorously.
This matter is titled SoundExchange, Inc. v. Sirius XM Radio, Inc.. No.13-cv-1290-RJL (D.D.C.), and Determination of Rates and Terms for Preexisting Subscription Services and Satellite Digital Audio Radio Services, United States Copyright Royalty Board, No. 2006-1 CRB DSTRA. Additional information concerning each of these actions is publicly available in filings under their docket numbers.
Telephone Consumer Protection Act Suits. We are a defendant in three purported class action suits, which were commenced in February 2012, January 2013 and January 2015, in the United States District Court for the Eastern District of Virginia, Newport News Division, and the United States District Court for the Southern District of California that allege that we, or certain call center vendors acting on our behalf, made numerous calls which violate provisions of the Telephone Consumer Protection Act of 1991 (the “TCPA”). The plaintiffs in these actions allege, among other things, that we called
F-30
SIRIUS XM HOLDINGS INC. AND SUBSIDIARIES
NOTES TO CONSOLIDATED FINANCIAL STATEMENTS - Continued
(Dollar amounts in thousands, unless otherwise stated)
mobile phones using an automatic telephone dialing system without the consumer’s prior consent or, alternatively, after the consumer revoked their prior consent and, in one of the actions, that we violated the TCPA’s call time restrictions. The plaintiffs in these suits are seeking various forms of relief, including statutory damages of 500 dollars for each violation of the TCPA or, in the alternative, treble damages of up to 1,500 dollars for each knowing and willful violation of the TCPA, as well as payment of interest, attorneys’ fees and costs, and certain injunctive relief prohibiting violations of the TCPA in the future. We believe we have substantial defenses to the claims asserted in these actions, and we intend to defend them vigorously.
We have notified certain of our call center vendors of these actions and requested that they defend and indemnify us against these claims pursuant to the provisions of their existing or former agreements with us. We believe we have valid contractual claims against certain call center vendors in connection with these claims and intend to preserve and pursue our rights to recover from these entities.
These cases are titled Erik Knutson v. Sirius XM Radio Inc., No. 12-cv-0418-AJB-NLS (S.D. Cal.), Francis W. Hooker v. Sirius XM Radio, Inc., No. 4:13-cv-3 (E.D. Va.) and Brian Trenz v. Sirius XM Holdings, Inc. and Toyota Motor Sales, U.S.A., Inc., No. 15-cv-0044L-BLM (S.D. Cal). Additional information concerning each of these actions is publicly available in court filings under their docket numbers.
With respect to the matters described above under the captions “Pre-1972 Sound Recording Matters” and “Telephone Consumer Protection Act Suits”, we have determined, based on our current knowledge, that the amount of loss or range of loss, that is reasonably possible is not reasonably estimable. However, these matters are inherently unpredictable and subject to significant uncertainties, many of which are beyond our control. As such, there can be no assurance that the final outcome of these matters will not materially and adversely affect our business, financial condition, results of operations, or cash flows.
Other Matters. In the ordinary course of business, we are a defendant in various other lawsuits and arbitration proceedings, including derivative actions; actions filed by subscribers, both on behalf of themselves and on a class action basis; former employees; parties to contracts or leases; and owners of patents, trademarks, copyrights or other intellectual property. None of these matters, in our opinion, is likely to have a material adverse effect on our business, financial condition or results of operations.
(18) | Income Taxes |
There is no current U.S. federal income tax provision, as all federal taxable income was offset by utilizing U.S. federal net operating loss carryforwards. The current state income tax provision is primarily related to taxable income in certain states that have suspended the ability to use net operating loss carryforwards or where net operating losses have been fully utilized. The current foreign income tax provision is primarily related to foreign withholding taxes on dividend distributions between us and our Canadian affiliate. For the year ended December 31, 2013, the current foreign income tax provision related to reimbursement of foreign withholding taxes. Income tax expense is the sum of current income tax plus the change in deferred tax assets and liabilities.
F-31
SIRIUS XM HOLDINGS INC. AND SUBSIDIARIES
NOTES TO CONSOLIDATED FINANCIAL STATEMENTS - Continued
(Dollar amounts in thousands, unless otherwise stated)
We file a consolidated federal income tax return with our wholly-owned subsidiaries. Income tax (expense) benefit consisted of the following:
For the Years Ended December 31, | |||||||||||
2014 | 2013 | 2012 | |||||||||
Current taxes: | |||||||||||
Federal | $ | — | $ | — | $ | — | |||||
State | (7,743 | ) | (5,359 | ) | (1,319 | ) | |||||
Foreign | (2,341 | ) | 5,269 | (2,265 | ) | ||||||
Total current taxes | (10,084 | ) | (90 | ) | (3,584 | ) | |||||
Deferred taxes: | |||||||||||
Federal | (302,350 | ) | (211,044 | ) | 2,729,823 | ||||||
State | (25,111 | ) | (48,743 | ) | 271,995 | ||||||
Total deferred taxes | (327,461 | ) | (259,787 | ) | 3,001,818 | ||||||
Total income tax (expense) benefit | $ | (337,545 | ) | $ | (259,877 | ) | $ | 2,998,234 | |||
The following table indicates the significant elements contributing to the difference between the federal tax (expense) benefit at the statutory rate and at our effective rate:
For the Years Ended December 31, | |||||||||||
2014 | 2013 | 2012 | |||||||||
Federal tax expense, at statutory rate | $ | (290,775 | ) | $ | (222,982 | ) | $ | (166,064 | ) | ||
State income tax expense, net of federal benefit | (32,067 | ) | (19,031 | ) | (16,606 | ) | |||||
State income rate changes | 5,334 | (8,666 | ) | (2,251 | ) | ||||||
Non-deductible expenses | (13,914 | ) | (9,545 | ) | (477 | ) | |||||
Change in valuation allowance | 2,836 | 4,228 | 3,195,651 | ||||||||
Other, net | (8,959 | ) | (3,881 | ) | (12,019 | ) | |||||
Income tax (expense) benefit | $ | (337,545 | ) | $ | (259,877 | ) | $ | 2,998,234 | |||
Deferred income taxes are recognized for the tax consequences related to temporary differences between the carrying amount of assets and liabilities for financial reporting purposes and the amounts used for tax purposes at each year-end, based on enacted tax laws and statutory tax rates applicable to the periods in which the differences are expected to affect taxable income. In determining the period in which related tax benefits are realized for book purposes, excess share-based compensation deductions included in net operating losses are realized after regular net operating losses are exhausted; excess tax compensation benefits are recorded off balance-sheet as a memo entry until the period the excess tax benefit is realized through a reduction of taxes payable. A valuation allowance is recognized when, based on the weight of all available evidence, it is considered more likely than not that all, or some portion, of the deferred tax assets will not be realized.
F-32
SIRIUS XM HOLDINGS INC. AND SUBSIDIARIES
NOTES TO CONSOLIDATED FINANCIAL STATEMENTS - Continued
(Dollar amounts in thousands, unless otherwise stated)
The tax effects of temporary differences that give rise to significant portions of the deferred tax assets and deferred tax liabilities are presented below:
For the Years Ended December 31, | |||||||
2014 | 2013 | ||||||
Deferred tax assets: | |||||||
Net operating loss carryforwards | $ | 1,818,719 | $ | 2,207,583 | |||
GM payments and liabilities | 539 | 1,984 | |||||
Deferred revenue | 691,323 | 606,430 | |||||
Severance accrual | 271 | 388 | |||||
Accrued bonus | 28,170 | 25,830 | |||||
Expensed costs capitalized for tax | 19,624 | 22,679 | |||||
Deferred financing costs | 958 | 664 | |||||
Investments | 46,751 | 45,078 | |||||
Stock based compensation | 79,296 | 71,794 | |||||
Other | 36,597 | 31,735 | |||||
Total deferred tax assets | 2,722,248 | 3,014,165 | |||||
Deferred tax liabilities: | |||||||
Depreciation of property and equipment | (237,971 | ) | (188,675 | ) | |||
FCC license | (789,857 | ) | (778,152 | ) | |||
Other intangible assets | (213,086 | ) | (233,983 | ) | |||
Total deferred tax liabilities | (1,240,914 | ) | (1,200,810 | ) | |||
Net deferred tax assets before valuation allowance | 1,481,334 | 1,813,355 | |||||
Valuation allowance | (4,995 | ) | (7,831 | ) | |||
Total net deferred tax asset | $ | 1,476,339 | $ | 1,805,524 | |||
The ultimate realization of deferred tax assets is dependent upon the generation of future taxable income during the periods in which those temporary differences can be carried forward under tax law. Management's evaluation of the realizability of deferred tax assets considers both positive and negative evidence, including historical financial performance, scheduled reversal of deferred tax assets and liabilities, projected taxable income and tax planning strategies in making this assessment. The weight given to the potential effects of positive and negative evidence is based on the extent to which it can be objectively verified. The net deferred tax assets are primarily related to gross net operating loss carryforwards of approximately $4,794,924. In addition to the gross book net operating loss carryforwards, we have $753,218 of excess share-based compensation deductions that will not be realized until we utilize the $4,794,924 of net operating losses, resulting in an approximate gross operating loss carryforward on our tax return of $5,548,142.
For the year ended December 31, 2012, our deferred tax asset valuation allowance decreased by $3,350,905 in response to cumulative positive evidence in 2012 which outweighed the historical negative evidence from our emergence from cumulative losses in recent years and updated assessments regarding that it was more likely than not that our deferred tax assets will be realized. As of December 31, 2014 and 2013, the deferred tax asset valuation allowance of $4,995 and $7,831, respectively, related to deferred tax assets that are not likely to be realized due to certain state net operating loss limitations we are not more likely than not going to utilize. These net operating loss carryforwards expire on various dates beginning in 2017 and ending in 2028.
ASC 740 requires a company to first determine whether it is more likely than not that a tax position will be sustained based on its technical merits as of the reporting date, assuming that taxing authorities will examine the position and have full knowledge of all relevant information. A tax position that meets this more likely than not threshold is then measured and recognized at the largest amount of benefit that is greater than fifty percent likely to be realized upon effective settlement with a taxing authority. Changes in recognition or measurement are reflected in the period in which the change in judgment occurs.
F-33
SIRIUS XM HOLDINGS INC. AND SUBSIDIARIES
NOTES TO CONSOLIDATED FINANCIAL STATEMENTS - Continued
(Dollar amounts in thousands, unless otherwise stated)
We record interest and penalties related to uncertain tax positions in Income tax (expense) benefit in our consolidated statements of comprehensive income.
As of December 31, 2014 and 2013, the gross liability for income taxes associated with uncertain state tax positions was $1,432. If recognized, $1,432 of unrecognized tax benefits would affect our effective tax rate. This liability is recorded in Other long-term liabilities. No penalties have been accrued for. We do not currently anticipate that our existing reserves related to uncertain tax positions as of December 31, 2014 will significantly increase or decrease during the twelve-month period ending December 31, 2015; however, various events could cause our current expectations to change in the future. Should our position with respect to the majority of these uncertain tax positions be upheld, the effect would be recorded in our consolidated statements of comprehensive income as part of the income tax provision. Our policy is to recognize interest and penalties accrued on uncertain tax positions as part of income tax expense. We recorded interest expense of $55 and $40 for the years ended December 31, 2014 and 2013, respectively, related to our unrecognized tax benefits presented below.
Changes in our uncertain income tax positions, from January 1 through December 31 are presented below:
2014 | 2013 | ||||||
Balance, beginning of year | $ | 1,432 | $ | 1,432 | |||
Additions for tax positions from prior years | — | — | |||||
Balance, end of year | $ | 1,432 | $ | 1,432 | |||
We have federal and certain state income tax audits pending. We do not expect the ultimate disposition of these audits to have a material adverse effect on our financial position or results of operations.
(19) | Subsequent Events |
Stock Repurchase Program
For the period from January 1, 2015 to February 3, 2015, we repurchased 65,425,873 shares of our common stock for an aggregate purchase price of $231,026, including fees and commissions, on the open market.
F-34
SIRIUS XM HOLDINGS INC. AND SUBSIDIARIES
NOTES TO CONSOLIDATED FINANCIAL STATEMENTS - Continued
(Dollar amounts in thousands, unless otherwise stated)
(20) Quarterly Financial Data--Unaudited
Our quarterly results of operations are summarized below:
For the Three Months Ended | |||||||||||||||
March 31 | June 30 | September 30 | December 31 | ||||||||||||
2014 | |||||||||||||||
Total revenue | $ | 997,711 | $ | 1,035,345 | $ | 1,057,087 | $ | 1,090,952 | |||||||
Cost of services | $ | (390,534 | ) | $ | (393,185 | ) | $ | (403,519 | ) | $ | (421,098 | ) | |||
Income from operations | $ | 247,407 | $ | 284,578 | $ | 294,028 | $ | 293,657 | |||||||
Net income | $ | 93,988 | $ | 119,961 | $ | 136,170 | $ | 143,122 | |||||||
Net income per common share--basic | $ | 0.02 | $ | 0.02 | $ | 0.02 | $ | 0.03 | |||||||
Net income per common share--diluted (1) | $ | 0.02 | $ | 0.02 | $ | 0.02 | $ | 0.03 | |||||||
2013 | |||||||||||||||
Total revenue | $ | 897,398 | $ | 940,110 | $ | 961,509 | $ | 1,000,078 | |||||||
Cost of services | $ | (330,257 | ) | $ | (331,465 | ) | $ | (336,464 | ) | $ | (396,304 | ) | |||
Income from operations | $ | 246,931 | $ | 267,736 | $ | 284,529 | $ | 245,357 | |||||||
Net income | $ | 123,602 | $ | 125,522 | $ | 62,894 | $ | 65,197 | |||||||
Net income per common share--basic | $ | 0.02 | $ | 0.02 | $ | 0.01 | $ | 0.01 | |||||||
Net income per common share--diluted | $ | 0.02 | $ | 0.02 | $ | 0.01 | $ | 0.01 | |||||||
(1) | The sum of quarterly net income per share applicable to common stockholders (diluted) does not necessarily agree to the net income per share for the year due to the timing of common stock issuances. |
F-35
SIRIUS XM HOLDINGS INC. AND SUBSIDIARIES
Schedule II - Schedule of Valuation and Qualifying Accounts
(in thousands) | Balance January 1, | Charged to Expenses (Benefit) | Write-offs/ Payments/ Other | Balance December 31, | |||||||||
Description | |||||||||||||
2014 | |||||||||||||
Allowance for doubtful accounts | $ | 9,078 | 44,961 | (46,224 | ) | $ | 7,815 | ||||||
Deferred tax assets—valuation allowance | $ | 7,831 | (2,836 | ) | — | $ | 4,995 | ||||||
Allowance for obsolescence | $ | 14,218 | (335 | ) | (3,159 | ) | $ | 10,724 | |||||
2013 | |||||||||||||
Allowance for doubtful accounts | $ | 11,711 | 39,016 | (41,649 | ) | $ | 9,078 | ||||||
Deferred tax assets—valuation allowance | $ | 9,835 | (4,228 | ) | 2,224 | $ | 7,831 | ||||||
Allowance for obsolescence | $ | 16,159 | (773 | ) | (1,168 | ) | $ | 14,218 | |||||
2012 | |||||||||||||
Allowance for doubtful accounts | $ | 9,932 | 34,548 | (32,769 | ) | $ | 11,711 | ||||||
Deferred tax assets—valuation allowance | $ | 3,360,740 | (3,195,651 | ) | (155,254 | ) | $ | 9,835 | |||||
Allowance for obsolescence | $ | 15,430 | 4,430 | (3,701 | ) | $ | 16,159 | ||||||
F-36
EXHIBIT INDEX
Exhibit | Description | ||||
2.1 | Certificate of Ownership and Merger, dated as of January 12, 2011, merging XM Satellite Radio Inc. with and into Sirius XM Radio Inc. (incorporated by reference to Exhibit 3.1 to Sirius XM Radio Inc.’s Current Report on Form 8-K filed on January 12, 2011). | ||||
2.2 | Agreement and Plan of Merger, dated as of November 14, 2013, by and among Sirius XM Radio Inc., Sirius XM Holdings Inc. and Sirius XM Merger Sub Inc. (incorporated by reference to Exhibit 2.1 to Sirius XM Holdings Inc.’s Current Report on Form 8-K filed on November 15, 2013). | ||||
3.1 | Amended and Restated Certificate of Incorporation of Sirius XM Holdings Inc. (incorporated by reference to Exhibit 3.1 to Sirius XM Holdings Inc.’s Current Report on Form 8-K filed on November 15, 2013). | ||||
3.2 | Amended and Restated By-Laws of Sirius XM Holdings Inc. (incorporated by reference to Exhibit 3.2 to Sirius XM Holdings Inc.'s Current Report on Form 8-K filed on November 15, 2013). | ||||
4.1 | Form of certificate for shares of Sirius XM Holdings Inc.’s common stock (incorporated by reference to Exhibit 4.1 to Sirius XM Holdings Inc.'s Annual Report on Form 10-K for the year ended December 31, 2013). | ||||
4.2 | Indenture, dated as of August 13, 2012, among Sirius XM Radio Inc., the guarantors thereto and U.S. Bank National Association, as trustee, relating to Sirius XM Radio Inc.’s 5.25% Senior Secured Notes due 2022 (incorporated by reference to Sirius XM Radio Inc.’s Current Report on Form 8-K filed on August 14, 2012). | ||||
4.3 | Supplemental Indenture, dated as of April 10, 2014, among Sirius XM Radio Inc., the guarantors named therein and U.S. Bank National Association, as trustee, relating to the 5.25% Senior Secured Notes due 2022 (incorporated by reference to Exhibit 4.1 to Sirius XM Holdings Inc.’s Current Report on Form 8-K filed on April 10, 2014). | ||||
4.4 | Indenture, dated as of May 16, 2013, among Sirius XM Radio Inc., the guarantors named therein and U.S. Bank National Association, as trustee, relating to the 4.25% Senior Notes due 2020 (incorporated by reference to Exhibit 4.1 to Sirius XM Radio Inc.’s Current Report on Form 8-K filed on May 20, 2013). | ||||
4.5 | Indenture, dated as of May 16, 2013, among Sirius XM Radio Inc., the guarantors named therein and U.S. Bank National Association, as trustee, relating to the 4.625% Senior Notes due 2023 (incorporated by reference to Exhibit 4.2 to Sirius XM Radio Inc.’s Current Report on Form 8-K filed on May 20, 2013). | ||||
4.6 | Indenture, dated as of August 1, 2013, among Sirius XM Radio Inc., the guarantors named therein and U.S. Bank National Association, as trustee, relating to the 5.75% Senior Notes due 2021 (incorporated by reference to Exhibit 4.1 to Sirius XM Radio Inc.’s Current Report on Form 8-K filed on August 1, 2013). | ||||
4.7 | Indenture, dated as of September 24, 2013, among Sirius XM Radio Inc., the guarantors named therein and U.S. Bank National Association, as trustee, relating to the 5.875% Senior Notes due 2020 (incorporated by reference to Exhibit 4.1 to Sirius XM Radio Inc.’s Current Report on Form 8-K filed on September 25, 2013). | ||||
4.8 | Indenture, dated as of May 6, 2014, among Sirius XM Radio Inc., the guarantors named therein and U.S. Bank National Association, as trustee, relating to the 6.00% Senior Notes due 2024 (incorporated by reference to Exhibit 4.1 to Sirius XM Holdings Inc.’s Current Report on Form 8-K filed on May 7, 2014). | ||||
4.9 | Form of Common Stock Purchase Warrant, dated as of January 27, 2009, issued by Sirius XM Radio Inc. to NFL Enterprises LLC (incorporated by reference to Exhibit 4.48 to Sirius XM Radio Inc.’s Annual Report on Form 10-K for the year ended December 31, 2008). | ||||
4.10 | Sirius XM Holdings Inc.’s Assumption of NFL Enterprises LLC Warrant, dated as of November 15, 2013 (incorporated by reference to Exhibit 4.13 to Sirius XM Holdings Inc.'s Annual Report on Form 10-K for the year ended December 31, 2013). | ||||
4.11 | Investment Agreement, dated as of February 17, 2009, between Sirius XM Radio Inc. and Liberty Radio LLC (incorporated by reference to Exhibit 4.55 to Sirius XM Radio Inc.’s Annual Report on Form 10-K for the year ended December 31, 2008). | ||||
4.12 | Assignment and Assumption of Investment Agreement among Sirius XM Radio Inc., Sirius XM Holdings Inc. and Liberty Radio LLC, dated as of November 15, 2013 (incorporated by reference to Exhibit 4.15 to Sirius XM Holdings Inc.'s Annual Report on Form 10-K for the year ended December 31, 2013). | ||||
E-1
Exhibit | Description | ||||
10.1 | Credit Agreement, dated as of December 5, 2012, among Sirius XM Radio Inc., JPMorgan Chase Bank, N.A. as administrative agent, and the other agents and lenders party thereto (incorporated by reference to Sirius XM Radio Inc.’s Current Report on Form 8-K filed on December 10, 2012). | ||||
10.2 | Amendment No. 1, dated as of April 22, 2014, to the Credit Agreement, dated as of December 5, 2012, among Sirius XM Radio Inc., the Lenders party thereto and JPMorgan Chase Bank, N.A. as administrative agent for the Lenders, as collateral agent for the Secured Parties and as an Issuing Bank (incorporated by reference to Exhibit 10.1 to Sirius XM Holdings Inc.’s Current Report on Form 8-K filed on April 22, 2014). | ||||
**10.3 | Technology Licensing Agreement among XM Satellite Radio Inc., XM Satellite Radio Holdings Inc., WorldSpace Management Corporation and American Mobile Satellite Corporation, dated as of January 1, 1998, amended by Amendment No. 1 to Technology Licensing Agreement (incorporated by reference to Exhibit 10.3 to XM Satellite Radio Holdings Inc.’s Annual Report on Form 10-K for the year ended December 31, 2007). | ||||
**10.4 | Third Amended and Restated Distribution and Credit Agreement, dated as of February 6, 2008, among General Motors Corporation, XM Satellite Radio Holdings Inc. and XM Satellite Radio Inc. (incorporated by reference to Exhibit 10.63 to XM Satellite Radio Holdings Inc.’s Annual Report on Form 10-K for the year ended December 31, 2007). | ||||
**10.5 | Third Amended and Restated Satellite Purchase Contract for In-Orbit Delivery, dated as of May 15, 2001, between XM Satellite Radio Inc. and Boeing Satellite Systems International, Inc. (incorporated by reference to Exhibit 10.36 to Amendment No. 1 to XM Satellite Radio Holdings Inc.’s Registration Statement on Form S-3 (File No. 333-89132)). | ||||
**10.6 | Amended and Restated Amendment to the Satellite Purchase Contract for In-Orbit Delivery, dated May 22, 2003, among XM Satellite Radio Inc., XM Satellite Radio Holdings Inc. and Boeing Satellite Systems International, Inc. (incorporated by reference to Exhibit 10.53 to XM Satellite Radio Holdings Inc.’s Quarterly Report on Form 10-Q for the quarter ended June 30, 2003). | ||||
**10.7 | Amendment to the Satellite Purchase Contract for In-Orbit Delivery, dated July 31, 2003, among XM Satellite Radio Inc., XM Satellite Radio Holdings Inc. and Boeing Satellite Systems International, Inc. (incorporated by reference to Exhibit 10.54 to XM Satellite Radio Holdings Inc.’s Quarterly Report on Form 10-Q for the quarter ended June 30, 2003). | ||||
**10.8 | Amendment to the Satellite Purchase Contract for In-Orbit Delivery, dated December 19, 2003, among XM Satellite Radio Inc., XM Satellite Radio Holdings Inc. and Boeing Satellite Systems International, Inc. (incorporated by reference to Exhibit 10.57 to XM Satellite Radio Holdings Inc.’s Annual Report on Form 10-K for the year ended December 31, 2003). | ||||
*10.9 | Amended and Restated Sirius Satellite Radio 2003 Long-Term Stock Incentive Plan (incorporated by reference to Exhibit 10.10 to Sirius XM Radio Inc.’s Quarterly Report on Form 10-Q for the quarter ended June 30, 2004). | ||||
*10.10 | Form of Stock Option Agreement between CD Radio Inc. and each Optionee (incorporated by reference to Exhibit 10.16.2 to Sirius XM Radio Inc.’s Quarterly Report on Form 10-Q for the quarter ended June 30, 1998). | ||||
*10.11 | CD Radio Inc. 401(k) Savings Plan (incorporated by reference to Exhibit 4.4 to CD Radio Inc.’s Registration Statement on Form S-8 (File No. 333-65473)). | ||||
*10.12 | XM Satellite Radio Holdings Inc. 2007 Stock Incentive Plan (incorporated by reference to Exhibit 10.5 to XM Satellite Radio Holdings Inc.’s Quarterly Report on Form 10-Q for the quarter ended June 30, 2007). | ||||
*10.13 | Form of Non-Qualified Stock Option Agreement pursuant to the XM Satellite Radio Holdings Inc. 2007 Stock Incentive Plan (incorporated by reference to Exhibit 10.2 to XM Satellite Radio Holdings Inc.’s Current Report on Form 8-K filed June 1, 2007). | ||||
*10.14 | Form of Restricted Stock Agreement pursuant to the XM Satellite Radio Holdings Inc. 2007 Stock Incentive Plan (incorporated by reference to Exhibit 10.3 to XM Satellite Radio Holdings Inc.’s Current Report on Form 8-K filed June 1, 2007). | ||||
*10.15 | Sirius XM Radio 401(k) Savings Plan, January 1, 2009 Restatement (incorporated by reference to Exhibit 10.30 to Sirius XM Radio Inc.’s Annual Report on Form 10-K for the year ended December 31, 2009). | ||||
*10.16 | Sirius XM Radio Inc. 2009 Long-Term Stock Incentive Plan (incorporated by reference to Exhibit 4.9 to Sirius XM Radio Inc.’s Registration Statement on Form S-8 (File No. 333- 160386)). | ||||
E-2
Exhibit | Description | ||||
*10.17 | Form of Director Non-Qualified Stock Option Agreement pursuant to the Sirius XM Radio Inc. 2009 Long-Term Stock Incentive Plan (incorporated by reference to Exhibit 10.34 to Sirius XM Radio Inc.’s Annual Report on Form 10-K for the year ended December 31, 2011). | ||||
*10.18 | Form of Director Non-Qualified Stock Option Agreement pursuant to the Sirius XM Holdings Inc. 2009 Long-Term Stock Incentive Plan (filed herewith). | ||||
*10.19 | Form of Non-Qualified Stock Option Agreement pursuant to the Sirius XM Radio Inc. 2009 Long-Term Stock Incentive Plan (incorporated by reference to Exhibit 10.35 to Sirius XM Radio Inc.’s Annual Report on Form 10-K for the year ended December 31, 2011). | ||||
*10.20 | Form of Non-Qualified Stock Option Agreement pursuant to the Sirius XM Holdings Inc. 2009 Long-Term Stock Incentive Plan (filed herewith). | ||||
*10.21 | Employment Agreement, dated as of July 21, 2011, between Sirius XM Radio Inc. and David J. Frear (incorporated by reference to Exhibit 10.1 to Sirius XM Radio Inc.’s Current Report on Form 8-K filed on July 22, 2011). | ||||
*10.22 | Form of Option Award Agreement between Sirius XM Radio Inc. and James E. Meyer (incorporated by reference to Exhibit 10.1 to Sirius XM Radio Inc.’s Current Report on Form 8-K filed October 16, 2009). | ||||
*10.23 | Employment Agreement, dated as of April 29, 2013, between Sirius XM Radio Inc. and James E. Meyer (incorporated by reference to Exhibit 10.1 to Sirius XM Radio Inc.’s Current Report on Form 8-K dated April 30, 2013). | ||||
*10.24 | Employment Agreement, dated as of July 22, 2013, between Sirius XM Radio Inc. and Scott A. Greenstein (incorporated by reference to Exhibit 10.1 to Sirius XM Radio Inc.’s Current Report on Form 8-K dated July 23, 2013). | ||||
*10.25 | Form of Option Award Agreement between Sirius XM Radio Inc. and Patrick L. Donnelly (incorporated by reference to Exhibit 10.1 to Sirius XM Radio Inc.’s Current Report on Form 8-K filed January 15, 2010). | ||||
*10.26 | Employment Agreement, dated as of January 10, 2014, between Sirius XM Radio Inc. and Patrick L. Donnelly (incorporated by reference to Exhibit 10.1 to Sirius XM Holdings Inc.’s Current Report on Form 8-K filed on January 14, 2014). | ||||
*10.27 | Assignment and Assumption Agreement, dated as of November 15, 2013, among Sirius XM Holdings Inc. and Sirius XM Radio Inc. (incorporated by reference to Exhibit 10.1 to Sirius XM Holdings Inc.’s Current Report on Form 8-K filed on November 15, 2013). | ||||
*10.28 | Omnibus Amendment, dated November 15, 2013, to the XM Satellite Radio Holdings Inc. Talent Option Plan, the XM Satellite Radio Holdings Inc. 1998 Shares Award Plan, as amended, the Amended and Restated Sirius Satellite Radio 2003 Long-Term Stock Incentive Plan, the XM Satellite Radio Holdings Inc. 2007 Stock Incentive Plan and the Sirius XM Radio Inc. 2009 Long-Term Stock Incentive Plan and their Related Stock Option Agreements, Restricted Stock Agreements and Restricted Stock Unit Agreements (incorporated by reference to Exhibit 10.2 to Sirius XM Holdings Inc.’s Current Report on Form 8-K filed on November 15, 2013). | ||||
21.1 | List of Subsidiaries (filed herewith). | ||||
23.1 | Consent of KPMG LLP (filed herewith). | ||||
31.1 | Certificate of James E. Meyer, Chief Executive Officer, pursuant to Section 302 of the Sarbanes-Oxley Act of 2002 (filed herewith). | ||||
31.2 | Certificate of David J. Frear, Executive Vice President and Chief Financial Officer, pursuant to Section 302 of the Sarbanes-Oxley Act of 2002 (filed herewith). | ||||
32.1 | Certificate of James E. Meyer, Chief Executive Officer, pursuant to 18 U.S.C. Section 1350, as adopted pursuant to Section 906 of the Sarbanes-Oxley Act of 2002 (filed herewith). | ||||
32.2 | Certificate of David J. Frear, Executive Vice President and Chief Financial Officer, pursuant to 18 U.S.C. Section 1350, as adopted pursuant to Section 906 of the Sarbanes-Oxley Act of 2002 (filed herewith). | ||||
99.1 | Amended and Restated Certificate of Incorporation of Sirius XM Radio Inc., as amended (incorporated by reference to Exhibit 3.3 to Sirius XM Holdings Inc.'s Annual Report on Form 10-K for the year ended December 31, 2013). | ||||
E-3
Exhibit | Description | ||||
99.2 | Amended and Restated By-Laws of Sirius XM Radio Inc., as amended (incorporated by reference to Exhibit 3.4 to Sirius XM Holdings Inc.'s Annual Report on Form 10-K for the year ended December 31, 2013). | ||||
101.1 | The following financial information from our Annual Report on Form 10-K for the year ended December 31, 2014 formatted in eXtensible Business Reporting Language (XBRL): (i) Consolidated Statements of Comprehensive Income for the years ended December 31, 2014, 2013 and 2012; (ii) Consolidated Balance Sheets as of December 31, 2014 and 2013; (iii) Consolidated Statements of Stockholders’ Equity for the years ended December 31, 2014, 2013 and 2012; (iv) Consolidated Statements of Cash Flows for the years ended December 31, 2014, 2013 and 2012; and (v) Combined Notes to Consolidated Financial Statements. | ||||
____________________
* | This document has been identified as a management contract or compensatory plan or arrangement. |
** | Pursuant to the Commission’s Orders Granting Confidential Treatment under Rule 406 of the Securities Act of 1933 or Rule 24(b)-2 under the Securities Exchange Act of 1934, certain confidential portions of this Exhibit were omitted by means of redacting a portion of the text. |
The agreements and other documents filed as exhibits to this report are not intended to provide factual information or other disclosure other than with respect to the terms of the agreements or other documents themselves, and you should not rely on them for that purpose. In particular, any representations and warranties made by us in these agreements or other documents were made solely within the specific context of the relevant agreement or document and may not describe the actual state of affairs as of the date they were made or at any other time.
E-4