Attached files
| file | filename |
|---|---|
| 8-K - FORM 8-K - BRINKS CO | form_8-k.htm |
| EX-99.1 - EXHIBIT 99.1 - BRINKS CO | exhibit_99-1.htm |

The Brink’s Company Fourth Quarter 2014 Earnings Call NYSE: BCO February 5, 2015 Exhibit 99.2

Forward-Looking Statements and Non-GAAP Results These materials contain forward-looking statements. Actual results could differ materially from projected or estimated results. Information regarding factors that could cause such differences is available in today's release and in The Brink’s Company’s most recent SEC filings. Information discussed today is representative as of today only and Brink's assumes no obligation to update any forward-looking statements. These materials are copyrighted and may not be used without written permission from Brink's. Today’s presentation is focused primarily on non-GAAP results. Detailed reconciliations of non-GAAP to GAAP results are provided in the appendix beginning on page 30 and on pages 15 – 20 of today’s release and in our SEC filings. *

CEO Overview 2014 Results New Reporting Format 2015 & 2016 Outlook Fourth Quarter 2014 Earnings Call February 5, 2015
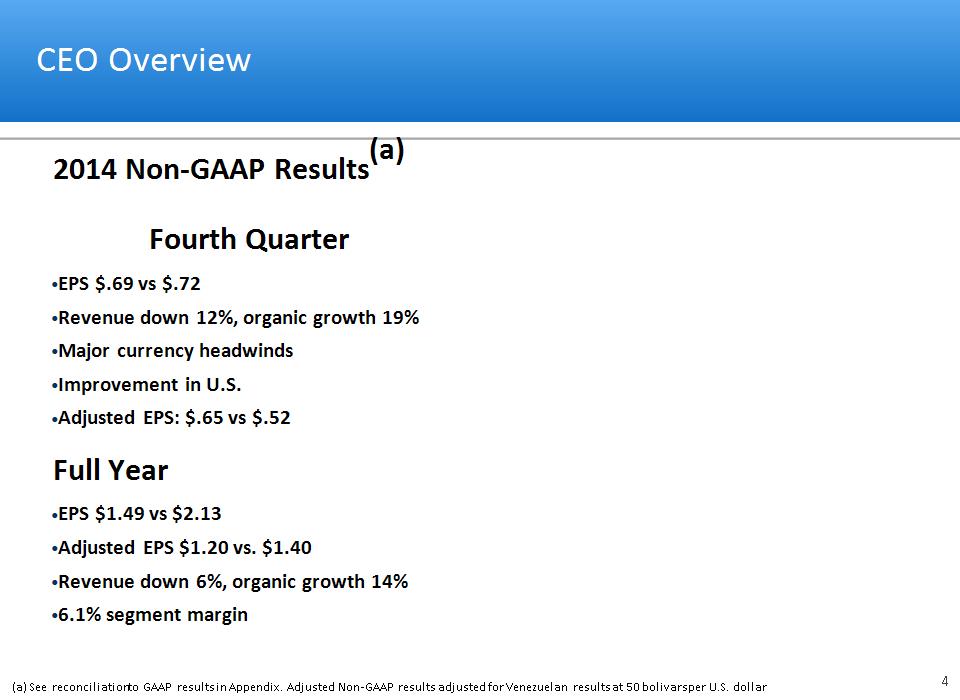
CEO Overview * 2014 Non-GAAP Results(a) Fourth Quarter EPS $.69 vs $.72 Revenue down 12%, organic growth 19% Major currency headwinds Improvement in U.S. Adjusted EPS: $.65 vs $.52 Full Year EPS $1.49 vs $2.13 Adjusted EPS $1.20 vs. $1.40 Revenue down 6%, organic growth 14% 6.1% segment margin (a) See reconciliation to GAAP results in Appendix. Adjusted Non-GAAP results adjusted for Venezuelan results at 50 bolivars per U.S. dollar

* CEO Overview (a) See reconciliation to GAAP results in Appendix 2015 and 2016 Outlook 2015 revenue: $3.4 billion Reduced $400 million due to currency decline and dispositions Margin guidance reaffirmed Non-GAAP EPS Guidance(a) $1.55 − $1.75 in 2015 $2.00 − $2.40 in 2016

* Recent Actions Reorganization Largest 5 Markets – U.S., France, Mexico, Brazil and Canada Global Markets – 36 countries Centralized support functions - IT, HR, finance, legal, procurement, security and project management Expected 2015 savings: $15 million Restructuring Global workforce reductions Expected 2015 savings: $30 – $35 million

Summary * Strong finish in 2014 Largest 5 markets = profit growth opportunity Focus on U.S. and Mexico Positioned for strong earnings growth

2014 Results

* 4Q14 Non-GAAP Results(a) ($ millions, except EPS) (b) Adjusted Non-GAAP results adjusted for Venezuelan results at 50 bolivars per U.S. dollar Revenue Segment Operating Profit EPS Adjusted Non-GAAP (b) $874 $65 $0.52 $0.65 (a) See reconciliation to GAAP results in Appendix $881 $76

* Non-GAAP EPS: 4Q13 Versus 4Q14(a) Segment Operating Profit Non-Segment Expense Non-Controlling Interest Tax Rate/Diluted Shares 4Q13 $(0.12) Venezuela 4Q14 $0.25 Other countries (excl. Venezuela and fx) $(0.24) Venezuela (incl. fx) $(0.14) Other foreign currency Net Interest $0.72 $0.69 $(0.13) $0.01 $0.03 $0.13 $(0.07) $0.11 Venezuela (a) See reconciliation to GAAP results in Appendix

* 2014 Full-Year Non-GAAP Results(a) ($ millions, except EPS) Revenue Segment Operating Profit EPS Adjusted Non-GAAP (b) $3,387 $201 $1.40 $3,449 $187 $1.20 (b) Adjusted Non-GAAP results adjusted for Venezuelan results at 50 bolivars per U.S. dollar (a) See reconciliation to GAAP results in Appendix
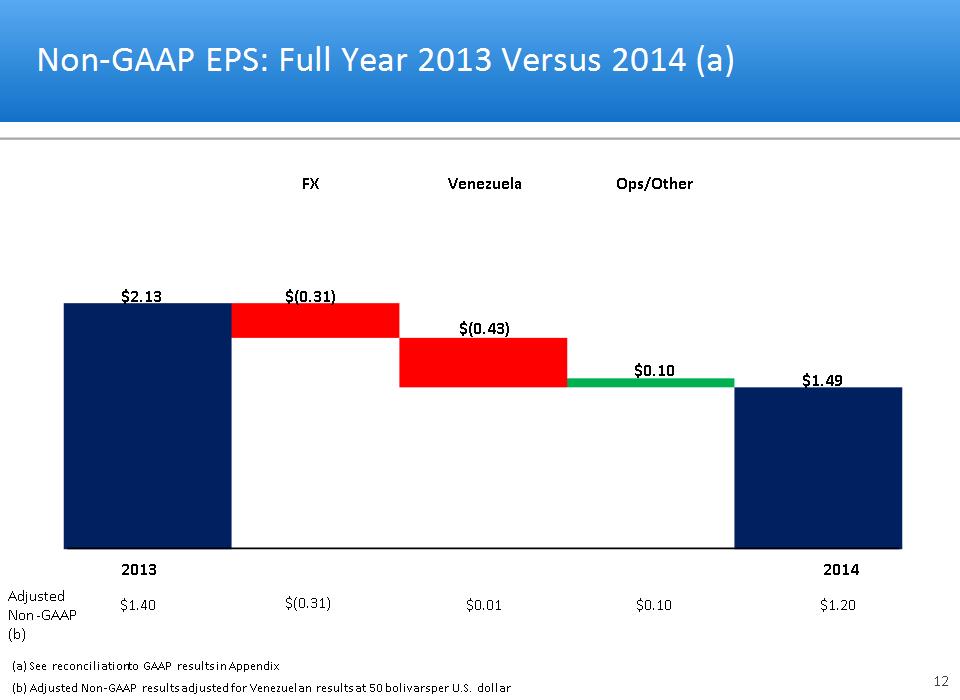
* Non-GAAP EPS: Full Year 2013 Versus 2014 (a) FX Ops/Other Venezuela $2.13 $1.49 $(0.31) $0.10 $(0.43) 2013 2014 Adjusted Non-GAAP (b) $1.40 $0.01 $1.20 $(0.31) $0.10 (b) Adjusted Non-GAAP results adjusted for Venezuelan results at 50 bolivars per U.S. dollar (a) See reconciliation to GAAP results in Appendix
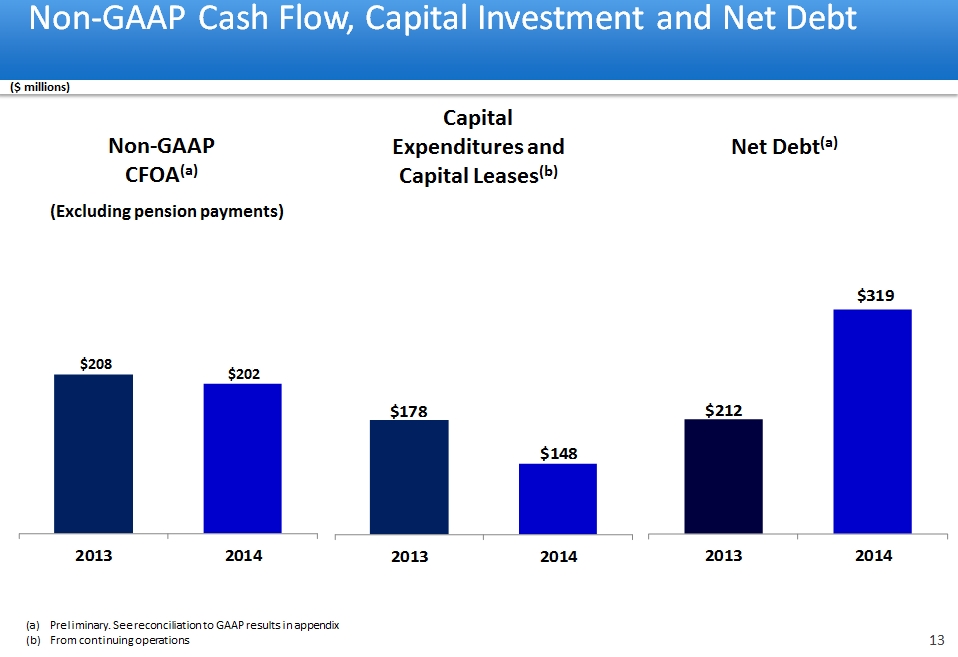
* Non-GAAP Cash Flow, Capital Investment and Net Debt ($ millions) Preliminary. See reconciliation to GAAP results in appendix From continuing operations Capital Expenditures and Capital Leases(b) Net Debt(a) Non-GAAP CFOA(a) Excluding pension payments: 208 202
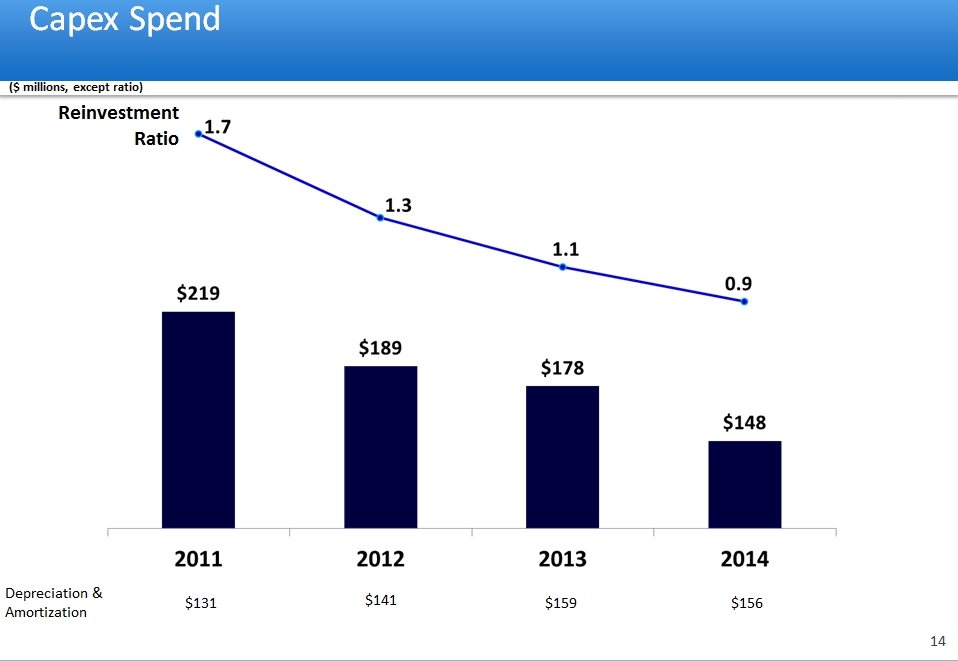
Reinvestment Ratio ($ millions, except ratio) * Capex Spend Depreciation & Amortization $131 $159 $141 $156

Legacy Liabilities – Underfunding – at December 31, 2014 * ($ millions)

Prepaid 2015 and 2016 pension payments in 3Q14 Accelerates de-risking of invested asset allocation Reduces PBGC premiums (current borrowing costs are lower than PBGC premiums) No future cash payments expected based on current actuarial assumptions Lump-sum pension payments made to eligible former employees in 4Q14 $56 million non-cash GAAP settlement loss recognized in 4Q14 Reduced plan assets by $150 million & liability reduced slightly more No cash payments to UMWA expected until 2032 * Estimated Cash Payments: $0 to Primary U.S. Pension $0 to UMWA until 2032 Payments to Primary U.S. Pension Payments to UMWA through ($ millions) (and beyond)

New Reporting Format Increases Transparency

New Reporting Format Increases Transparency * ($ millions) Revenue Operating Profit(a) North America $ 908 $ 22 Latin America 1,440 98 EMEA 1,074 77 Asia 139 19 3,562 216 Non-Segment -- (47) Total $3,562 $169 Segment Margin(a) 6.1% Operating Profit Margin(a) Operating Profit Margin(a) 4.7% 2014 Old Reporting Format Revenue Operating Profit(a) United States $ 728 $ 23 France 517 39 Mexico 388 10 Brazil 364 34 Canada 180 13 Largest 5 Markets 2,177 119 Latin America 592 91 EMEA 556 53 Asia 140 23 Global Markets 1,289 166 Payment Services 97 (5) Corporate Items -- (111) Total $3,562 $ 169 Operating Profit Margin(a) Operating Profit Margin(a) 4.7% 2014 New Reporting Format (a) See reconciliation to GAAP results in Appendix

* Global Markets: Delivering Consistent Profits Revenue ($ millions) Organic growth driven by Venezuela, Argentina and Global Services (BGS) Venezuela decline both in 2014 and 2015 from currency devaluation 2015 organic growth offset in other countries by unfavorable currency Strong margin rates across all regions: EMEA, Latin America and Asia Other countries (excluding Venezuela) 2015 margin improvement from restructuring & cost actions Operating Profit(a) Organic Growth 18% 10% 18% 28% Venezuela Other Countries $1,287 ~$1,200 $1,289 $1,529 $1,373 Venezuela Other Countries $176 $166 $204 $150 Margin %(a) Target Target 13.7% 10.9% 13.4% 12.9% (a) See reconciliation to GAAP results in Appendix
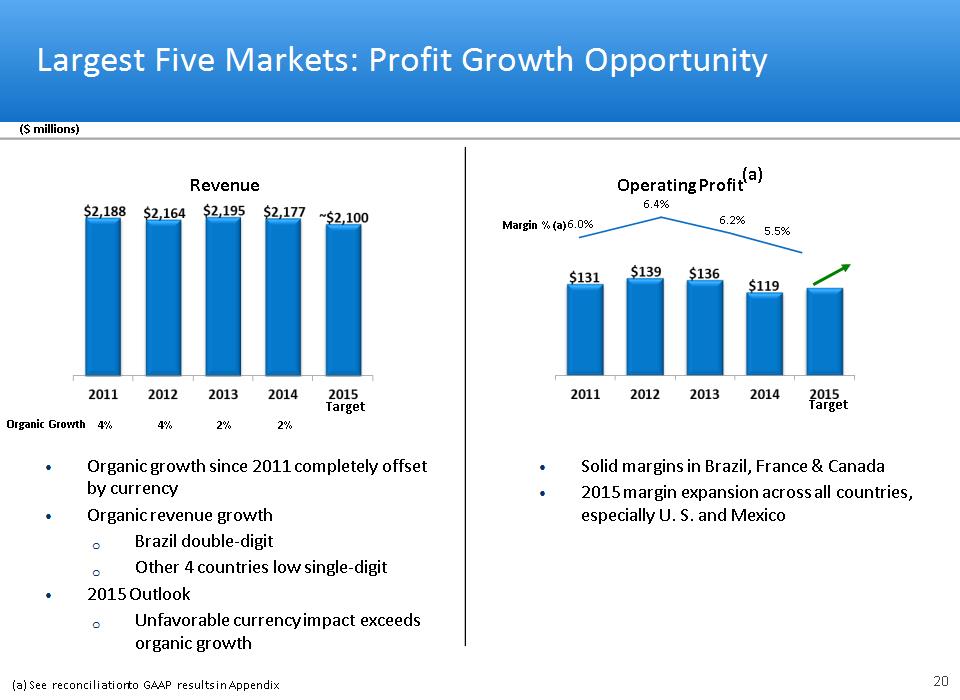
* Largest Five Markets: Profit Growth Opportunity Revenue ($ millions) Organic growth since 2011 completely offset by currency Organic revenue growth Brazil double-digit Other 4 countries low single-digit 2015 Outlook Unfavorable currency impact exceeds organic growth Solid margins in Brazil, France & Canada 2015 margin expansion across all countries, especially U. S. and Mexico Operating Profit(a) Organic Growth 4% 4% 2% 2% Margin % (a) Target Target 6.0% 6.4% 6.2% 5.5% (a) See reconciliation to GAAP results in Appendix

2014 Revenue % of Total Organic Growth vs. 2013 2014 Operating Profit(a) Margin %(a) United States $ 728 20 % - United States $ 23 3.1 % France 517 15 - France 39 7.6 Mexico 388 11 Mexico 10 2.5 Brazil 364 10 Brazil 34 9.4 Canada 180 5 - Canada 13 7.1 Latin America 592 17 Latin America 91 15.3 EMEA 556 16 EMEA 53 9.4 Asia 140 4 Asia 23 16.5 Payment Services 97 3 Payment Services (5) (5.1) Corporate Items Corporate Items (111) Total $ 3,562 100 % Total $ 169 4.7 % Fixing U.S. & Mexico To Drive Profit Growth * ($ millions) (a) See reconciliation to GAAP results in Appendix

2015 & 2016 Outlook Revenue Reduced by Currency Margin Rate Reaffirmed
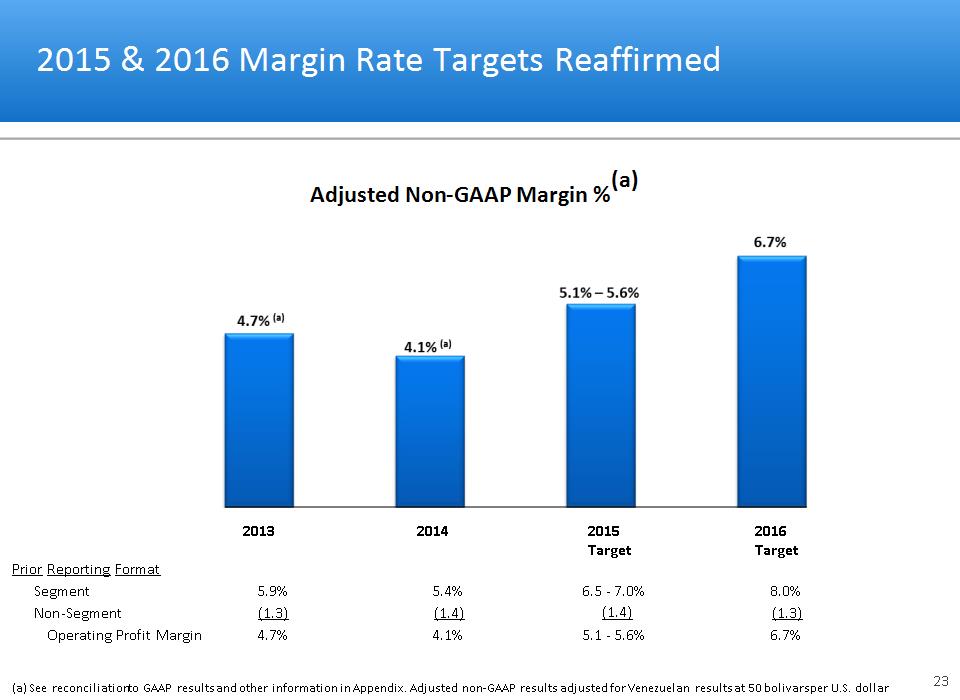
* 2015 & 2016 Margin Rate Targets Reaffirmed Prior Reporting Format Segment Non-Segment Operating Profit Margin 5.9% (1.3) 4.7% 5.4% (1.4) 4.1% 6.5 – 7.0% (1.4) 5.1 – 5.6% 8.0% (1.3) 6.7% Adjusted Non-GAAP Margin %(a) (a) See reconciliation to GAAP results and other information in Appendix. Adjusted non-GAAP results adjusted for Venezuelan results at 50 bolivars per U.S. dollar
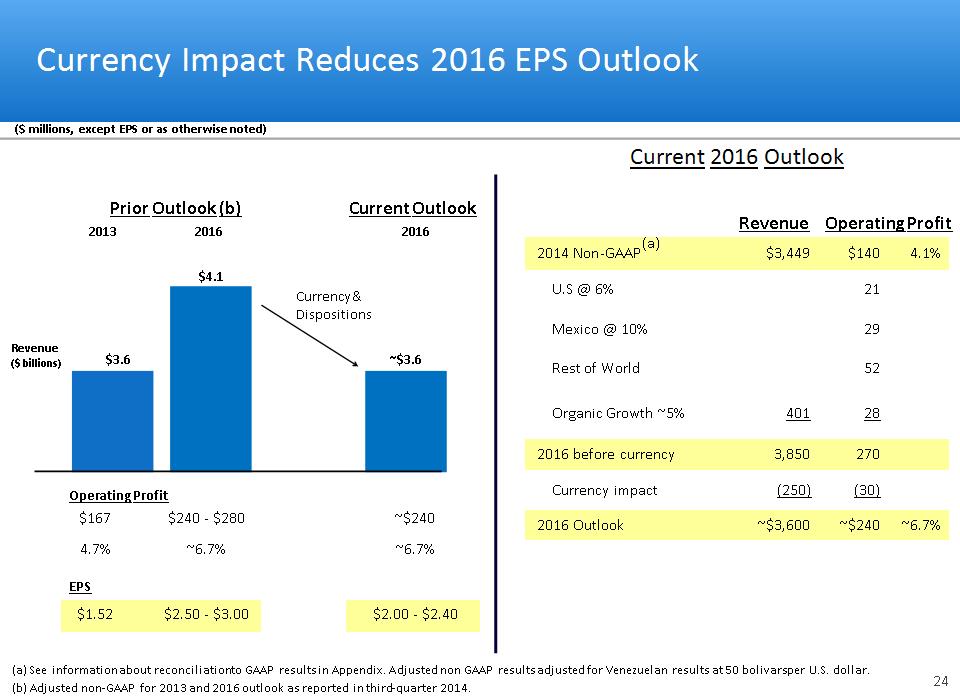
Currency Impact Reduces 2016 EPS Outlook * $3.6 ~$3.6 ($ millions, except EPS or as otherwise noted) (b) Adjusted non-GAAP for 2013 and 2016 outlook as reported in third-quarter 2014. (a) See information about reconciliation to GAAP results in Appendix. Adjusted non GAAP results adjusted for Venezuelan results at 50 bolivars per U.S. dollar. $167 $240 - $280 ~$240 4.7% ~6.7% ~6.7% $1.52 $2.50 - $3.00 $2.00 – $2.40 2014 Non-GAAP(a) $3,449 $140 4.1% U.S @ 6% 21 Mexico @ 10% 29 Rest of World 52 Organic Growth ~5% 401 28 2016 before currency 3,850 270 Currency impact (250) (30) 2016 Outlook ~$3,600 ~$240 ~6.7% Current 2016 Outlook Operating Profit 2013 2016 Operating Profit $4.1 Revenue ($ billions) Currency & Dispositions Revenue Prior Outlook (b) Current Outlook 2016 EPS

2015 Outlook and 2014 Adjusted Non-GAAP Results(a)(b) * Unfavorable currency in Europe, Brazil, Colombia, Argentina, and Mexico Operating margin improvement driven by global cost actions and Mexico, Brazil, Argentina & U.S. EPS Outlook $1.20 $(0.35) $0.74-$0.94 $(0.04) 2014 Currency Op Profit Growth Interest & Non-controlling Interest & Tax 2015 Outlook $1.55-$1.75 2015 Outlook 2014 2015 Outlook Revenue $3,449 $3,400 Op Profit 140 173 - 190 Interest/Other Income (22) (21) Taxes (50) (64 - 71) Noncontrolling interests (10) (11) Income from continuing ops (b) 59 77 - 87 EPS Range $1.20 $1.55 – 1.75 Key Metrics Revenue Change Organic $200 6% Currency (250) (7) Total $(50) (1)% Op Profit Margin 4.1% 5.1% - 5.6% Tax Rate 42% 42% ($ millions, except EPS) Operating Profit Outlook $(30) $63 - $80 _ $173 - $190 $140 (b) Attributable to Brink’s (a) See reconciliation to GAAP results in Appendix. Adjusted non GAAP results adjusted for Venezuelan results at 50 bolivars per U.S. dollar.
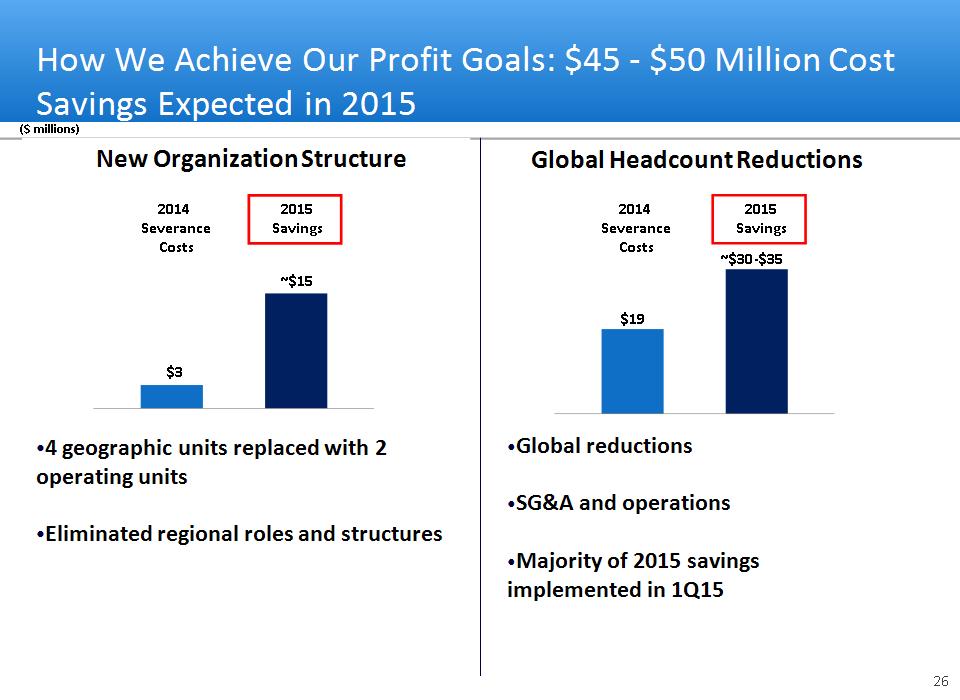
New Organization Structure 4 geographic units replaced with 2 operating units Eliminated regional roles and structures * How We Achieve Our Profit Goals: $45 - $50 Million Cost Savings Expected in 2015 ($ millions) Global Headcount Reductions Global reductions SG&A and operations Majority of 2015 savings implemented in 1Q15 2014 Severance Costs 2015 Savings ~$15 $3 2014 Severance Costs 2015 Savings ~$30-$35 $19

* How We Achieve Our Profit Goals: Fix the U.S. U.S. Operating Profit Margin Field Force Automation (% implemented) Deposit Imaging (% implemented) Route Logistics (% implemented) Centralized Billing (% implemented) Key Projects/Actions Route logistics Field force automation Centralized billing Headcount/SG&A reductions Deposit imaging in money processing One-person vehicle Overtime management Target Target Target Target Target Target Target Target YE15 Target 1H15 Target 1H16 Target
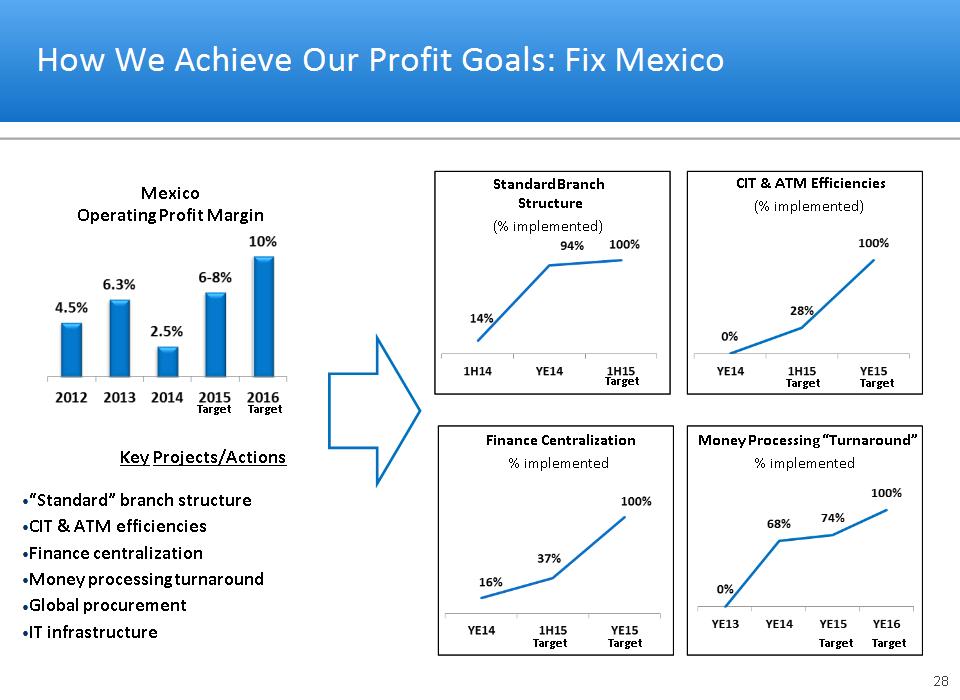
Standard Branch Structure (% implemented) * How We Achieve Our Profit Goals: Fix Mexico Mexico Operating Profit Margin CIT & ATM Efficiencies (% implemented) Finance Centralization % implemented Key Projects/Actions “Standard” branch structure CIT & ATM efficiencies Finance centralization Money processing turnaround Global procurement IT infrastructure Money Processing “Turnaround” % implemented Target Target Target Target Target Target Target Target Target
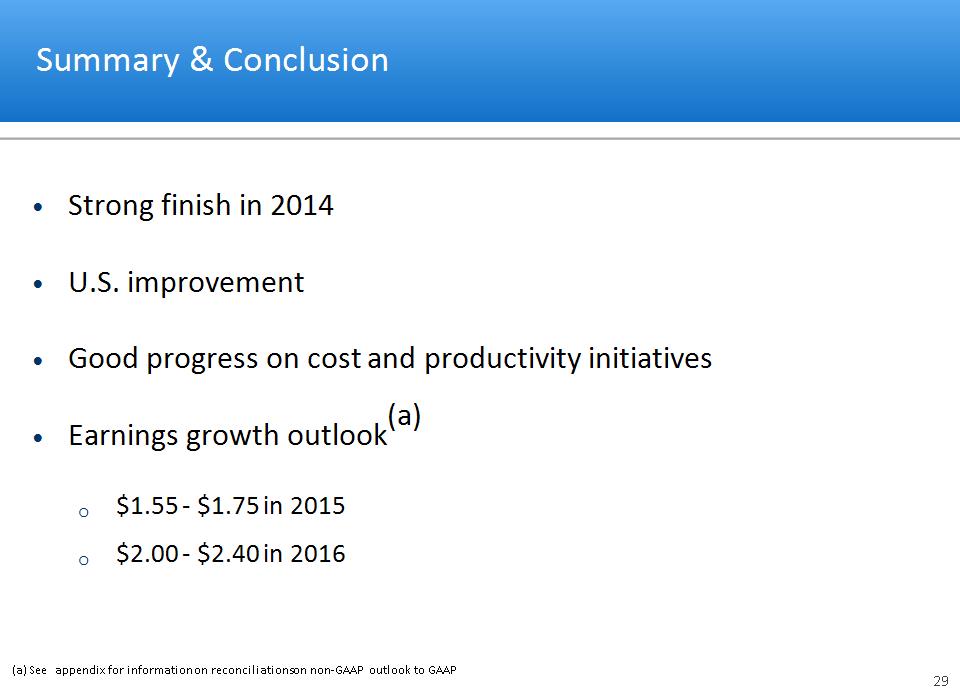
Summary & Conclusion * Strong finish in 2014 U.S. improvement Good progress on cost and productivity initiatives Earnings growth outlook(a) $1.55 - $1.75 in 2015 $2.00 - $2.40 in 2016 (a) See appendix for information on reconciliations on non-GAAP outlook to GAAP

Appendix

* Non-GAAP EPS: Full Year 2013 Versus 2014(a) Segment Operating Profit Non-Segment Expense Non-Controlling Interest Tax Rate/Diluted Shares Net Interest $2.13 $1.49 $(0.67) $(0.06) $0.03 $0.24 $(0.18) 2013 2014 ($0.46) Venezuela (incl. fx) ($0.31) Other foreign currency $0.10 Other countries (excl. Venezuela & fx) $0.19 Venezuela $(0.16) Venezuela (a) See reconciliation to GAAP results in Appendix

* Other Items Not Allocated to Segments FX devaluation in Venezuela The rate we use to remeasure operations in Venezuela declined 16% in February 2013 (from 5.3 to 6.3 bolivars to the U.S. dollar) and 88% in March 2014 (from 6.3 to 50 bolivars to the U.S. dollar). Expenses related to remeasured net monetary assets were $13.4 million in the first quarter of 2013 and $121.6 million in 2014. In addition, nonmonetary assets were not remeasured to a lower basis when the currency devalued. Instead, under highly inflationary accounting rules, these assets retained their higher historical bases, which excess is recognized in earnings as the asset is consumed resulting in incremental expense until the excess bases is depleted. Higher expenses related to nonmonetary assets were $0.5 million in the first quarter of 2013, $0.2 million in the second quarter of 2013, $0.2 million in the third quarter of 2013, $0.3 million in the fourth quarter of 2013, $1.4 million in the first quarter of 2014, $9.5 million in the second quarter of 2014, $5.4 million in the third quarter of 2014, and $4.8 million in the fourth quarter of 2014. Expenses related to these Venezuelan devaluations have not been allocated to segment results. 2014 Reorganization and Restructuring Brink’s reorganized and restructured its business in December 2014, eliminating management positions in its former Latin America and EMEA regions and is beginning to implement a plan to reduce the cost structure of various country operations by eliminating approximately 1,700 positions. Severance costs of $21.8 million associated with these actions were recognized in the fourth quarter of 2014. These amounts have not been allocated to segment results. 2013 2013 2013 2013 2013 2013 2013 2013 2013 2014 2014 2014 2014 2014 2014 2014 2014 2014 (In millions) (In millions) (In millions) (In millions) 1Q 2Q 3Q 4Q Full Year 1Q 2Q 3Q 4Q Full Year FX devaluation in Venezuela FX devaluation in Venezuela FX devaluation in Venezuela $ (13.9) (0.2) (0.2) (0.3) (14.6) $ (123.3) (9.8) (4.8) (4.8) (142.7) 2014 Reorganization and Restructuring 2014 Reorganization and Restructuring 2014 Reorganization and Restructuring - - - - - - - - (21.8) (21.8) Acquisitions and dispositions Acquisitions and dispositions Acquisitions and dispositions 2.7 1.3 2.4 (0.6) 5.8 1.2 1.3 46.9 - 49.4 Mexican settlement losses Mexican settlement losses Mexican settlement losses (0.2) (0.5) (0.8) (0.9) (2.4) (0.8) (0.9) (2.3) (1.9) (5.9) U.S. retirement plans U.S. retirement plans U.S. retirement plans (13.4) (13.1) (13.2) (13.2) (52.9) (6.0) (3.6) (3.7) (59.8) (73.1) Share-based compensation adj. Share-based compensation adj. Share-based compensation adj. - - - - - - (4.2) 1.8 - (2.4) Other items Other items $ (24.8) (12.5) (11.8) (15.0) (64.1) $ (128.9) (17.2) 37.9 (88.3) (196.5)

* Other Items Not Allocated to Segments Acquisitions and dispositions Gains and losses related to acquisitions and dispositions that have not been allocated to segment results are described below: Brink’s sold an equity investment in a CIT business in Peru and recognized a $44.3 million gain in the fourth quarter of 2014. Other divestiture gains were $0.6 million. Both the gains and the equity earnings related to our former investment in Peru recognized in prior periods are not allocated to segment results. Adjustments to the 2010 business acquisition gain for Mexico are not allocated to segment results ($1.1 million favorable adjustment in the first quarter of 2013, $2.2 million unfavorable adjustment in the fourth quarter of 2013 and $0.7 million favorable adjustment in the third quarter of 2014). Adjustments to the purchase price of the January 2013 acquisition of Rede Trel in Brazil are not allocated to segment results ($1.7 million of favorable adjustments in the third and fourth quarters of 2013). The $0.9 million fourth quarter 2013 impairment of an intangible asset acquired in the 2009 India acquisition is not allocated to segment results. A $2.6 million unfavorable tax adjustment in fourth quarter 2013 related to the 2010 Belgium disposition is not allocated to segment results. Mexican settlement losses Employee benefit settlement losses in Mexico have not been allocated to segment results. U.S. retirement plans Brink’s retirement plan benefits in the U.S. are frozen and the related expenses have not been allocated to segment results. Brink’s primary U.S. pension plan settled a portion of its obligation in the fourth quarter of 2014 under a lump sum buy-out offer. Approximately 4,300 terminated participants were paid about $150 million of plan assets under this offer in lieu of receiving their pension benefit. A $56 million settlement loss was recognized as a result of the settlement. Share-based compensation adjustment Accounting adjustments related to share-based compensation have not been allocated to segment results ($4.2 million expense in the second quarter of 2014 and a $1.8 million benefit in the third quarter of 2014). The accounting adjustments revise the accounting for share-based compensation from fixed to variable fair value accounting as defined in ASC Topic 718, Stock Compensation.

* Adjusted Non-GAAP and Non-GAAP Reconciled to GAAP Amounts may not add due to rounding. See slide 38 for footnote explanations. 2013 2013 2013 2013 2013 2013 2013 2013 2013 2014 2014 2014 2014 2014 2014 2014 2014 2014 (In millions) (In millions) (In millions) (In millions) 1Q 2Q 3Q 4Q Full Year 1Q 2Q 3Q 4Q Full Year Revenues: Revenues: Revenues: Revenues: Adjusted non-GAAP Adjusted non-GAAP Adjusted non-GAAP Adjusted non-GAAP $ 825.8 845.1 842.0 874.2 3,387.1 $ 836.5 859.0 872.5 881.2 3,449.2 Effect of Ven. at 50 VEF/USD(b) Effect of Ven. at 50 VEF/USD(b) Effect of Ven. at 50 VEF/USD(b) 84.5 83.9 100.1 123.0 391.5 113.1 - - - 113.1 Non-GAAP and GAAP Non-GAAP and GAAP Non-GAAP and GAAP Non-GAAP and GAAP $ 910.3 929.0 942.1 997.2 3,778.6 $ 949.6 859.0 872.5 881.2 3,562.3 Operating profit (loss): Operating profit (loss): Operating profit (loss): Operating profit (loss): Adjusted non-GAAP Adjusted non-GAAP Adjusted non-GAAP Adjusted non-GAAP $ 22.0 35.6 48.0 52.8 158.4 $ 26.3 25.9 23.3 64.6 140.1 Effect of Ven. at 50 VEF/USD(b) Effect of Ven. at 50 VEF/USD(b) Effect of Ven. at 50 VEF/USD(b) 18.0 8.6 20.7 21.6 68.9 28.9 - - - 28.9 Non-GAAP Non-GAAP Non-GAAP Non-GAAP 40.0 44.2 68.7 74.4 227.3 55.2 25.9 23.3 64.6 169.0 Other items not allocated to segments(c) Other items not allocated to segments(c) Other items not allocated to segments(c) (24.8) (12.5) (11.8) (15.0) (64.1) (128.9) (17.2) 37.9 (88.3) (196.5) GAAP GAAP GAAP GAAP $ 15.2 31.7 56.9 59.4 163.2 $ (73.7) 8.7 61.2 (23.7) (27.5) Taxes: Taxes: Taxes: Taxes: Adjusted non-GAAP Adjusted non-GAAP Adjusted non-GAAP Adjusted non-GAAP $ 7.0 12.6 17.6 19.6 56.8 $ 8.6 8.7 7.2 25.4 49.9 Effect of Ven. at 50 VEF/USD(b) Effect of Ven. at 50 VEF/USD(b) Effect of Ven. at 50 VEF/USD(b) 4.8 0.6 3.8 3.7 12.7 10.4 (0.8) (0.6) (2.2) 6.8 Non-GAAP Non-GAAP Non-GAAP Non-GAAP 11.8 13.2 21.4 23.3 69.7 19.0 7.9 6.6 23.2 56.7 Other items not allocated to segments(c) Other items not allocated to segments(c) Other items not allocated to segments(c) (5.6) (5.5) (5.7) (3.6) (20.4) (10.2) (2.0) 20.7 (28.5) (20.0) Income tax rate adjustment(d) Income tax rate adjustment(d) Income tax rate adjustment(d) (1.7) 2.9 (1.4) 0.2 - (0.1) (1.8) (0.5) 2.4 - GAAP GAAP GAAP GAAP $ 4.5 10.6 14.3 19.9 49.3 $ 8.7 4.1 26.8 (2.9) 36.7 Noncontrolling interests: Noncontrolling interests: Noncontrolling interests: Noncontrolling interests: Adjusted non-GAAP Adjusted non-GAAP Adjusted non-GAAP Adjusted non-GAAP $ 2.3 2.6 3.5 1.8 10.2 $ 2.1 2.2 2.5 3.2 10.0 Effect of Ven. at 50 VEF/USD(b) Effect of Ven. at 50 VEF/USD(b) Effect of Ven. at 50 VEF/USD(b) 4.5 1.9 5.3 7.6 19.3 7.6 - - - 7.6 Non-GAAP Non-GAAP Non-GAAP Non-GAAP Non-GAAP 6.8 4.5 8.8 9.4 29.5 9.7 2.2 2.5 3.2 17.6 Other items not allocated to segments(c) Other items not allocated to segments(c) Other items not allocated to segments(c) (4.9) (0.1) (0.1) (0.1) (5.2) (40.2) (3.8) (1.9) (2.6) (48.5) Income tax rate adjustment(d) Income tax rate adjustment(d) Income tax rate adjustment(d) 1.8 (1.1) (0.5) (0.2) - 1.3 - (1.2) (0.1) . - GAAP GAAP GAAP GAAP $ 3.7 3.3 8.2 9.1 24.3 $ (29.2) (1.6) (0.6) 0.5 (30.9)

* Adjusted Non-GAAP and Non-GAAP Reconciled to GAAP 2013 2013 2013 2013 2013 2013 2013 2013 2013 2014 2014 2014 2014 2014 2014 2014 2014 2014 2014 (In millions, except for percentages and per share amounts) (In millions, except for percentages and per share amounts) (In millions, except for percentages and per share amounts) (In millions, except for percentages and per share amounts) 1Q 2Q 3Q 4Q Full Year 1Q 2Q 3Q 4Q Full Year Full Year Income from continuing operations attributable to Brink's: Income from continuing operations attributable to Brink's: Income from continuing operations attributable to Brink's: Income from continuing operations attributable to Brink's: Income from continuing operations attributable to Brink's: Income from continuing operations attributable to Brink's: Income from continuing operations attributable to Brink's: Income from continuing operations attributable to Brink's: Income from continuing operations attributable to Brink's: Adjusted non-GAAP Adjusted non-GAAP Adjusted non-GAAP Adjusted non-GAAP $ 7.3 14.9 20.8 25.3 68.3 $ 9.8 9.7 7.4 31.8 58.7 Effect of Ven. at 50 VEF/USD(b) Effect of Ven. at 50 VEF/USD(b) Effect of Ven. at 50 VEF/USD(b) 8.7 5.9 11.7 9.9 36.2 10.9 0.8 0.6 2.2 14.5 Non-GAAP Non-GAAP Non-GAAP Non-GAAP 16.0 20.8 32.5 35.2 104.5 20.7 10.5 8.0 34.0 73.2 Other items not allocated to segments(c) Other items not allocated to segments(c) Other items not allocated to segments(c) (14.3) (6.9) (6.0) (11.3) (38.5) (78.5) (11.4) 19.1 (57.2) (128.0) Income tax rate adjustment(d) Income tax rate adjustment(d) Income tax rate adjustment(d) (0.1) (1.8) 1.9 - - (1.2) 1.8 1.7 (2.3) - GAAP GAAP GAAP GAAP $ 1.6 12.1 28.4 23.9 66.0 $ (59.0) 0.9 28.8 (25.5) (54.8) EPS: EPS: EPS: EPS: Adjusted non-GAAP Adjusted non-GAAP Adjusted non-GAAP Adjusted non-GAAP $ 0.15 0.30 0.43 0.52 1.40 $ 0.20 0.20 0.15 0.65 1.20 Effect of Ven. at 50 VEF/USD(b) Effect of Ven. at 50 VEF/USD(b) Effect of Ven. at 50 VEF/USD(b) 0.18 0.12 0.24 0.20 0.74 0.22 0.02 0.01 0.04 0.30 Non-GAAP Non-GAAP Non-GAAP Non-GAAP 0.33 0.42 0.66 0.72 2.13 0.42 0.21 0.16 0.69 1.49 Other items not allocated to segments(c) Other items not allocated to segments(c) Other items not allocated to segments(c) (0.30) (0.14) (0.12) (0.23) (0.78) (1.61) (0.23) 0.38 (1.17) (2.61) Income tax rate adjustment(d) Income tax rate adjustment(d) Income tax rate adjustment(d) - (0.04) 0.04 - - (0.02) 0.04 0.03 (0.05) - GAAP GAAP GAAP GAAP $ 0.03 0.25 0.58 0.49 1.35 $ (1.21) 0.02 0.58 (0.52) (1.12) Adjusted non-GAAP margin Adjusted non-GAAP margin Adjusted non-GAAP margin Adjusted non-GAAP margin 2.7% 4.2% 5.7% 6.0% 4.7% 3.1% 3.0% 2.7% 7.3% 4.1% Amounts may not add due to rounding. See slide 38 for footnote explanations.

* Adjusted Non-GAAP and Non-GAAP Reconciled to GAAP Amounts may not add due to rounding. From continuing operations. Effective March 24, 2014, Brink’s began remeasuring its Venezuelan operating results using currency exchange rates reported under a newly established currency exchange process in Venezuela (the “SICAD II process”). The rate published for this process has averaged approximately 50 since opening. For non-GAAP operating profit, non-GAAP income from continuing operations and for non-GAAP EPS, we include an adjustment to reflect lower revenues and operating profit as a result of a hypothetical remeasurement of Brink’s Venezuela’s 2013 and first quarter 2014 revenue and operating results using a rate of 50 bolivars to the U.S. dollar, which approximates the rate observed in the SICAD II process in March 2014. See “Other Items Not Allocated To Segments” on slides 34 - 35 for pre-tax amounts and details. Other Items Not Allocated To Segments for noncontrolling interests, income from continuing operations attributable to Brink's and EPS are the effects of the same items at their respective line items of the consolidated statements of income (loss). Non-GAAP income from continuing operations and non-GAAP EPS have been adjusted to reflect an effective income tax rate in each interim period equal to the full-year non-GAAP effective income tax rate. The full-year non-GAAP effective tax rate was 38.5% for 2014 and 34.2% for 2013. 2013 2013 2013 2013 2013 2014 2014 2014 2014 2014 Pre-tax Tax Effective tax rate Pre-tax Tax Effective tax rate Effective Income Tax Rate(a) Effective Income Tax Rate(a) Effective Income Tax Rate(a) Adjusted Non-GAAP Adjusted Non-GAAP Adjusted Non-GAAP $ 135.3 56.8 42.0% $ 118.6 49.9 42.1% Effect of Ven. at 50 VEF/USD(b) Effect of Ven. at 50 VEF/USD(b) 68.4 12.9 (7.8%) 28.9 6.8 (3.6%) Non-GAAP Non-GAAP Non-GAAP 203.7 69.7 34.2% 147.5 56.7 38.5% Other items not allocated to segments(c) Other items not allocated to segments(c) (64.1) (20.4) 1.1% (196.5) (20.0) (113.4%) GAAP GAAP GAAP $ 139.6 49.3 35.3% $ (49.0) 36.7 (74.9%)

* 2014 Non-GAAP Results Reconciled to GAAP under Previous Segmentation Additional explanations provided on slides 34-35. Latin North Asia Total Segment Non-Segment Total Operating (In millions) America EMEA America Pacific Profit (Loss) Non-Segment Profit (Loss) Fourth Quarter 2014 Fourth Quarter 2014 GAAP GAAP $ 16.6 18.4 (15.2) 5.4 25.2 (48.9) (23.7) FX devaluation in Venezuela 4.8 - - - 4.8 - 4.8 2014 Reorganization and Restructuring 13.2 4.5 4.1 - 21.8 - 21.8 Mexican settlement losses 1.9 - - - 1.9 - 1.9 U.S. retirement plans - - 22.4 - 22.4 37.4 59.8 Non-GAAP Non-GAAP $ 36.5 22.9 11.3 5.4 76.1 (11.5) 64.6 Full Year 2014 Full Year 2014 GAAP GAAP $ (59.7) 72.1 (7.3) 19.2 24.3 (51.8) (27.5) FX devaluation in Venezuela 142.7 - - - 142.7 - 142.7 2014 Reorganization and Restructuring 13.2 4.5 4.1 - 21.8 - 21.8 Acquisitions and dispositions (4.5) - - - (4.5) (44.9) (49.4) Mexican settlement losses 5.9 - - - 5.9 - 5.9 U.S. retirement plans - - 25.2 - 25.2 47.9 73.1 Share-based compensation adj. 0.3 0.3 0.2 0.1 0.9 1.5 2.4 Non-GAAP Non-GAAP 97.9 76.9 22.2 19.3 216.3 (47.3) 169.0 Less effect of Venezuela at 50 VEF/USD (28.9) - - - (28.9) - (28.9) Adjusted Non-GAAP Adjusted Non-GAAP $ 69.0 76.9 22.2 19.3 187.4 (47.3) 140.1 Amounts may not add due to rounding.
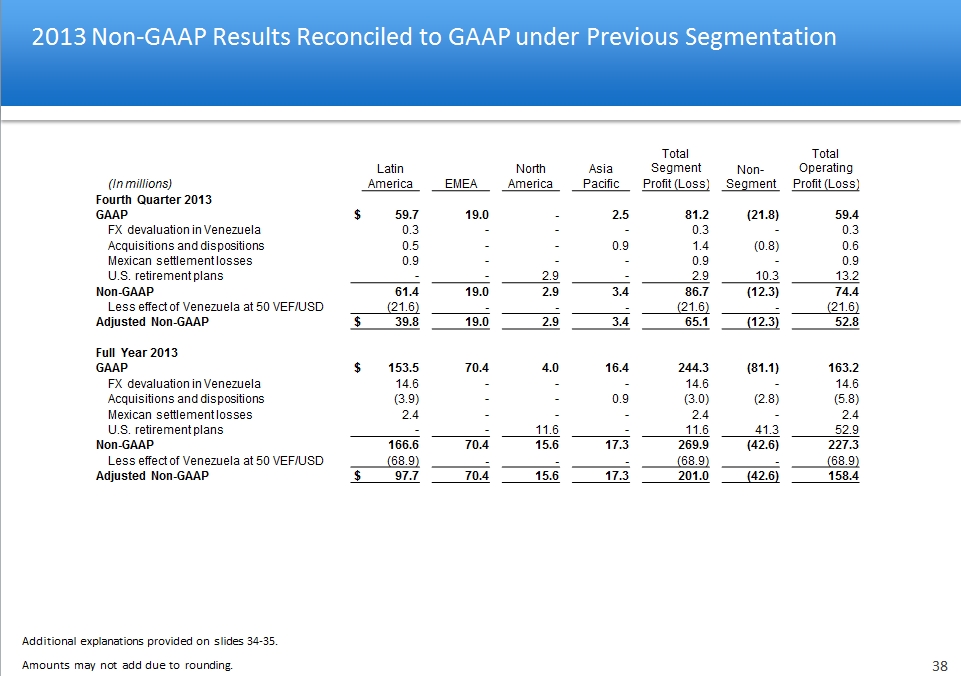
* Additional explanations provided on slides 34-35. Amounts may not add due to rounding. Latin North Asia Total Segment Non-Segment Total Operating (In millions) America EMEA America Pacific Profit (Loss) Non-Segment Profit (Loss) Fourth Quarter 2013 Fourth Quarter 2013 GAAP GAAP $ 59.7 19.0 - 2.5 81.2 (21.8) 59.4 FX devaluation in Venezuela 0.3 - - - 0.3 - 0.3 Acquisitions and dispositions 0.5 - - 0.9 1.4 (0.8) 0.6 Mexican settlement losses 0.9 - - - 0.9 - 0.9 U.S. retirement plans - - 2.9 - 2.9 10.3 13.2 Non-GAAP Non-GAAP 61.4 19.0 2.9 3.4 86.7 (12.3) 74.4 Less effect of Venezuela at 50 VEF/USD (21.6) - - - (21.6) - (21.6) Adjusted Non-GAAP Adjusted Non-GAAP $ 39.8 19.0 2.9 3.4 65.1 (12.3) 52.8 Full Year 2013 Full Year 2013 GAAP GAAP $ 153.5 70.4 4.0 16.4 244.3 (81.1) 163.2 FX devaluation in Venezuela 14.6 - - - 14.6 - 14.6 Acquisitions and dispositions (3.9) - - 0.9 (3.0) (2.8) (5.8) Mexican settlement losses 2.4 - - - 2.4 - 2.4 U.S. retirement plans - - 11.6 - 11.6 41.3 52.9 Non-GAAP Non-GAAP 166.6 70.4 15.6 17.3 269.9 (42.6) 227.3 Less effect of Venezuela at 50 VEF/USD (68.9) - - - (68.9) - (68.9) Adjusted Non-GAAP Adjusted Non-GAAP $ 97.7 70.4 15.6 17.3 201.0 (42.6) 158.4 2013 Non-GAAP Results Reconciled to GAAP under Previous Segmentation

* Non-GAAP Reconciliations – Cash Flows To eliminate the change in the balance of customer obligations related to cash received and processed in certain of our secure cash logistics operations. The title to this cash transfers to us for a short period of time. The cash is generally credited to customers’ accounts the following day and we do not consider it as available for general corporate purposes in the management of our liquidity and capital resources. Both measures of “Non-GAAP cash flows from operating activities” (before and after U.S. pension contributions) are supplemental financial measures that are not required by, or presented in accordance with GAAP. The purpose of the Non-GAAP measures is to report financial information excluding the impact of cash received and processed in certain of our Cash Management Service operations without cash flows from discontinued operations and with and without cash flows related to primary U.S pension plan. We believe these measures are helpful in assessing cash flows from operations, enable period-to-period comparability and are useful in predicting future operating cash flows. These Non-GAAP measures should not be considered as an alternative to cash flows from operating activities determined in accordance with GAAP and should be read in conjunction with our consolidated statements of cash flows. NON-GAAP CASH FLOWS FROM OPERATING ACTIVITIES – RECONCILED TO U.S. GAAP NON-GAAP CASH FLOWS FROM OPERATING ACTIVITIES – RECONCILED TO U.S. GAAP NON-GAAP CASH FLOWS FROM OPERATING ACTIVITIES – RECONCILED TO U.S. GAAP NON-GAAP CASH FLOWS FROM OPERATING ACTIVITIES – RECONCILED TO U.S. GAAP NON-GAAP CASH FLOWS FROM OPERATING ACTIVITIES – RECONCILED TO U.S. GAAP NON-GAAP CASH FLOWS FROM OPERATING ACTIVITIES – RECONCILED TO U.S. GAAP NON-GAAP CASH FLOWS FROM OPERATING ACTIVITIES – RECONCILED TO U.S. GAAP (In millions) 2014 2013 Cash flows from operating activities – GAAP Cash flows from operating activities – GAAP $ 135.0 $ 201.5 Decrease (increase) in certain customer obligations(a) Decrease (increase) in certain customer obligations(a) (15.4) 5.8 Cash outflows (inflows) related to discontinued operations Cash outflows (inflows) related to discontinued operations (5.0) (12.5) Cash flows from operating activities – Non-GAAP (reduced by pension contributions) 114.6 194.8 Contributions to primary U.S. pension plan Contributions to primary U.S. pension plan 87.2 13.0 Cash flows from operating activities – Non-GAAP (before pension contributions) $ 201.8 $ 207.8 ($ millions)

* Title to cash received and processed in certain of our secure Cash Management Services operations transfers to us for a short period of time. The cash is generally credited to customers’ accounts the following day and we do not consider it as available for general corporate purposes in the management of our liquidity and capital resources and in our computation of Net Debt. Net Debt is a supplemental Non-GAAP financial measure that is not required by, or presented in accordance with GAAP. We use Net Debt as a measure of our financial leverage. We believe that investors also may find Net Debt to be helpful in evaluating our financial leverage. Net Debt should not be considered as an alternative to Debt determined in accordance with GAAP and should be reviewed in conjunction with our consolidated balance sheets. Set forth above is a reconciliation of Net Debt, a Non-GAAP financial measure, to Debt, which is the most directly comparable financial measure calculated and reported in accordance with GAAP. Net Debt excluding cash and debt in Venezuelan operations was $332 million at December 31, 2014, and $306 million at December 31, 2013. Non-GAAP Reconciliations – Net Debt December 31, December 31, (In millions) (In millions) (In millions) 2014 2013 Debt: Debt: Debt: Short-term Short-term $ 59.4 80.9 Long-term Long-term 407.4 355.1 Total Debt 466.8 436.0 Less: Less: Less: Cash and cash equivalents Cash and cash equivalents 176.2 255.5 Amounts held by Cash Management Services operations(a) Amounts held by Cash Management Services operations(a) (28.0) (31.3) Cash and cash equivalents available for general corporate purposes 148.2 224.2 Net Debt $ 318.6 211.8