Attached files
| file | filename |
|---|---|
| 8-K - 8-K - AMERICAN SCIENCE & ENGINEERING, INC. | a15-3850_18k.htm |
| EX-99.1 - EX-99.1 - AMERICAN SCIENCE & ENGINEERING, INC. | a15-3850_1ex99d1.htm |
Exhibit 99.2
|
|
February 5, 2015 American Science and Engineering, Inc. Q3 Fiscal Year 2015 Earnings Call Presentation |
|
|
Safe Harbor Statement 2 ©2015 American Science and Engineering, Inc. Safe Harbor Statement: The foregoing press release contains statements concerning AS&E’s financial performance, markets and business operations that may be considered “forward-looking” under applicable securities laws. AS&E wishes to caution readers of this press release that actual results might differ materially from those projected in any forward-looking statements. Factors which might cause actual results to differ materially from those projected in the forward-looking statements contained herein include the following: significant reductions, delays or cancellations (in full or in part) in procurements of the Company’s systems by the United States and other governments; disruption in the supply of any source component incorporated into AS&E's products; litigation seeking to restrict the use of intellectual property used by the Company; limitations under certain laws on the Company’s ability to protect its own intellectual property; potential product liability claims against the Company; global political trends and events which affect public perception of the threat presented by drugs, explosives and other contraband; global economic developments and the ability of governments and private organizations to fund purchases of the Company’s products to address such threats; the potential insufficiency of Company resources, including human resources, capital, plant and equipment and management systems, to accommodate any future growth; technical problems and other delays that could impact new product development and the Company’s ability to adapt to changes in technology and customer requirements; competitive pressures; lengthy sales cycles both in United States government procurement and procurement abroad; future delays in federal funding, the market price of the company's stock prevailing from time to time, the nature of other investment opportunities presented to the company from time to time, the company's cash flows from operations and market and general economic conditions. These and certain other factors which might cause actual results to differ materially from those projected are detailed from time to time in AS&E’s periodic reports and registration statements filed with the Securities and Exchange Commission, which important factors are incorporated herein by reference. AS&E undertakes no obligation to update forward looking statements to reflect changed assumptions, the occurrence of unanticipated events, or changes in future operating results, financial condition or business over time. Readers are further advised to review the “Risk Factors” set forth in the Company’s most recent Form 10-Q and Form 10-K, which further detail and supplement the factors described in this Safe Harbor Statement. Among other disclosures, the Risk Factors disclose risks pertaining to that portion of the Company’s business that is dependent on United States government contracting as well as international customers. |
|
|
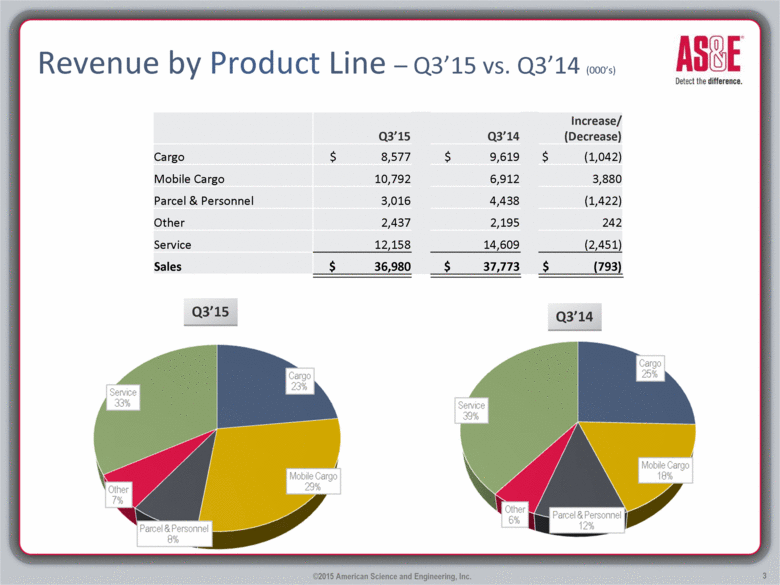
Revenue by Product Line – Q3’15 vs. Q3’14 (000’s) 3 ©2015 American Science and Engineering, Inc. Q3’15 Q3’14 Increase/ (Decrease) Cargo $ 8,577 $ 9,619 $ (1,042) Mobile Cargo 10,792 6,912 3,880 Parcel & Personnel 3,016 4,438 (1,422) Other 2,437 2,195 242 Service 12,158 14,609 (2,451) Sales $ 36,980 $ 37,773 $ (793) Q3’15 Q3’14 |
|
|
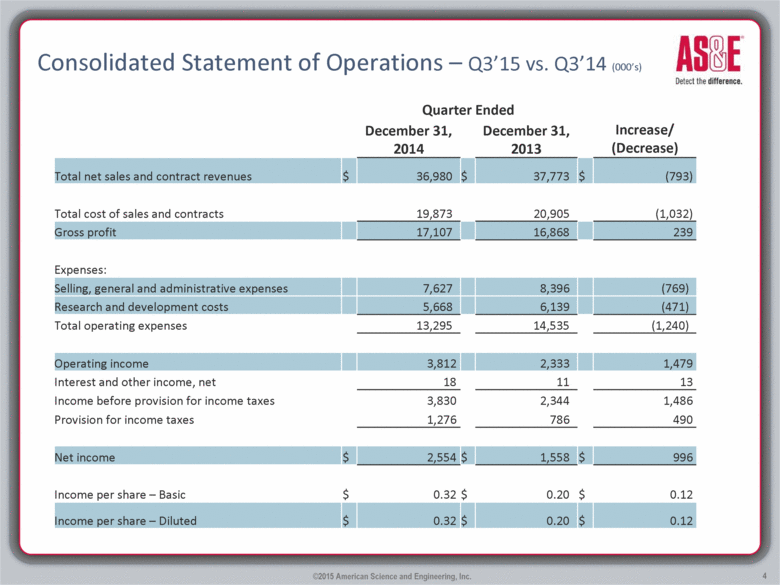
Consolidated Statement of Operations – Q3’15 vs. Q3’14 (000’s) 4 ©2015 American Science and Engineering, Inc. Quarter Ended December 31, 2014 December 31, 2013 Increase/ (Decrease) Total net sales and contract revenues $ 36,980 $ 37,773 $ (793) Total cost of sales and contracts 19,873 20,905 (1,032) Gross profit 17,107 16,868 239 Expenses: Selling, general and administrative expenses 7,627 8,396 (769) Research and development costs 5,668 6,139 (471) Total operating expenses 13,295 14,535 (1,240) Operating income 3,812 2,333 1,479 Interest and other income, net 18 11 13 Income before provision for income taxes 3,830 2,344 1,486 Provision for income taxes 1,276 786 490 Net income $ 2,554 $ 1,558 $ 996 Income per share – Basic $ 0.32 $ 0.20 $ 0.12 Income per share – Diluted $ 0.32 $ 0.20 $ 0.12 |
|
|
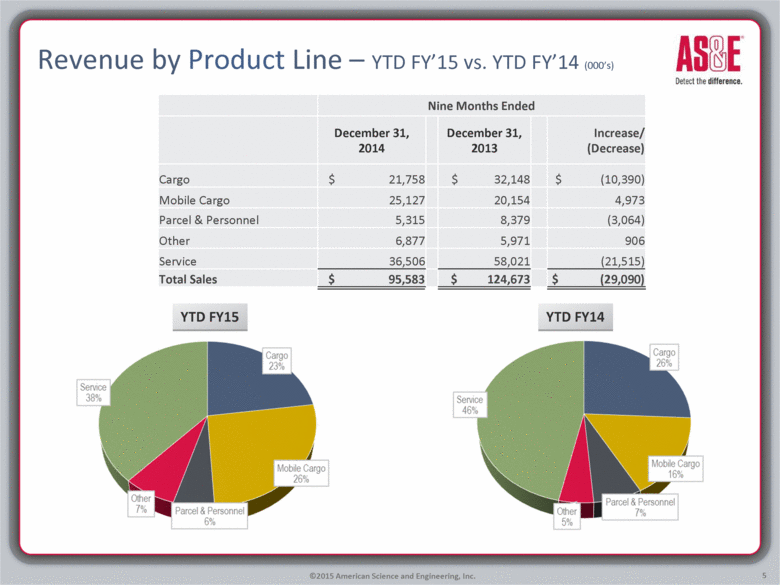
Revenue by Product Line – YTD FY’15 vs. YTD FY’14 (000’s) 5 ©2015 American Science and Engineering, Inc. YTD FY15 YTD FY14 Nine Months Ended December 31, 2014 December 31, 2013 Increase/ (Decrease) Cargo $ 21,758 $ 32,148 $ (10,390) Mobile Cargo 25,127 20,154 4,973 Parcel & Personnel 5,315 8,379 (3,064) Other 6,877 5,971 906 Service 36,506 58,021 (21,515) Total Sales $ 95,583 $ 124,673 $ (29,090) |
|
|
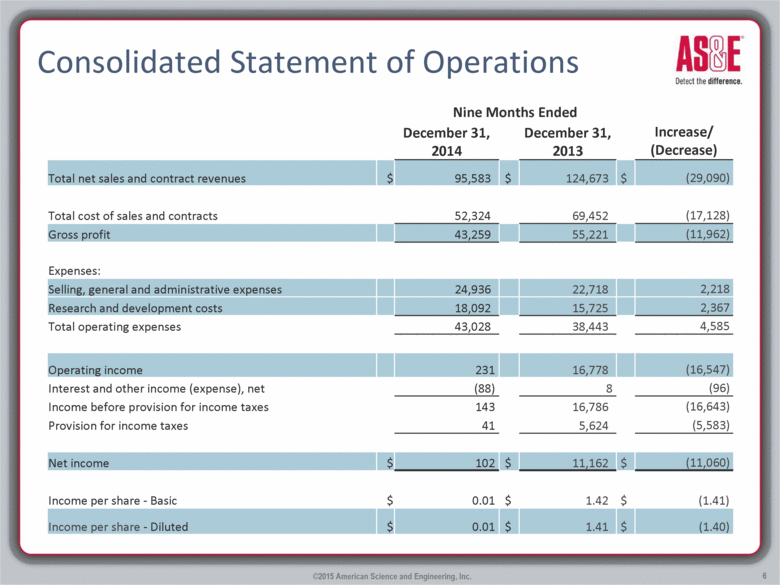
Consolidated Statement of Operations 6 ©2015 American Science and Engineering, Inc. Nine Months Ended December 31, 2014 December 31, 2013 Increase/ (Decrease) Total net sales and contract revenues $ 95,583 $ 124,673 $ (29,090) Total cost of sales and contracts 52,324 69,452 (17,128) Gross profit 43,259 55,221 (11,962) Expenses: Selling, general and administrative expenses 24,936 22,718 2,218 Research and development costs 18,092 15,725 2,367 Total operating expenses 43,028 38,443 4,585 Operating income 231 16,778 (16,547) Interest and other income (expense), net (88) 8 (96) Income before provision for income taxes 143 16,786 (16,643) Provision for income taxes 41 5,624 (5,583) Net income $ 102 $ 11,162 $ (11,060) Income per share - Basic $ 0.01 $ 1.42 $ (1.41) Income per share - Diluted $ 0.01 $ 1.41 $ (1.40) |
|
|
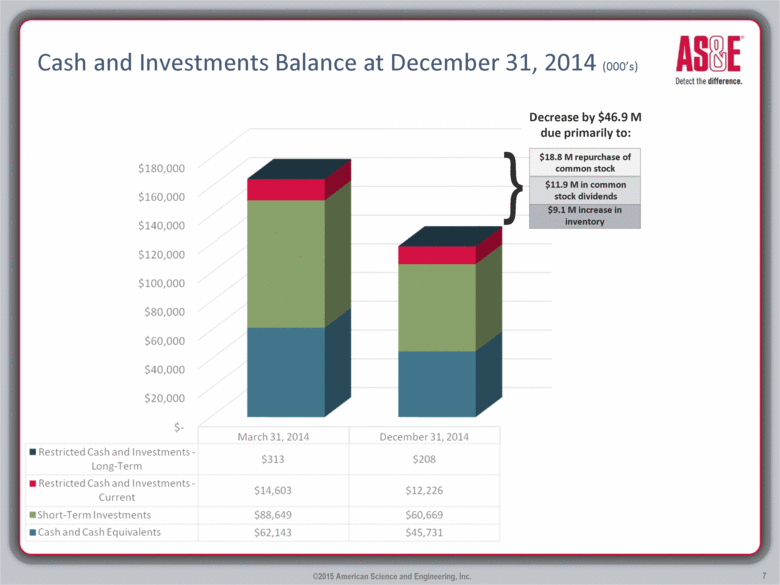
Cash and Investments Balance at December 31, 2014 (000’s) 7 ©2015 American Science and Engineering, Inc. $9.1 M increase in inventory $11.9 M in common stock dividends $18.8 M repurchase of common stock Decrease by $46.9 M due primarily to: } |
|
|
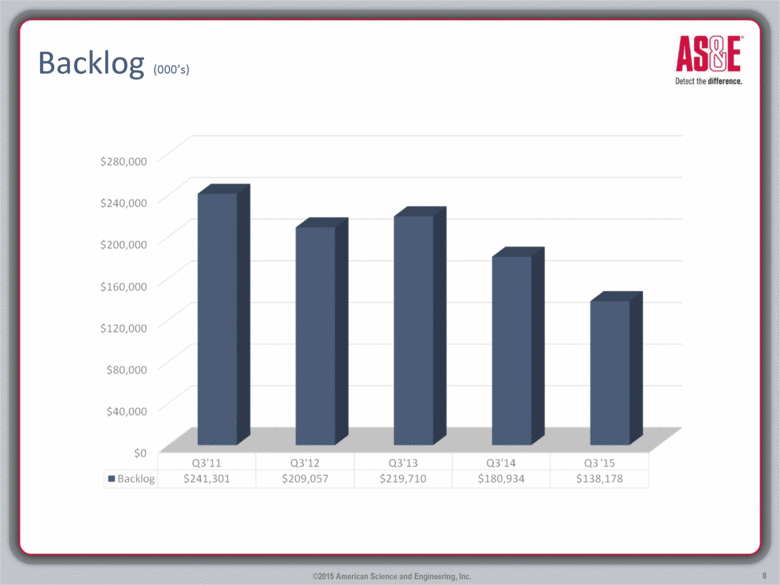
Backlog (000’s) 8 ©2015 American Science and Engineering, Inc. |
|
|
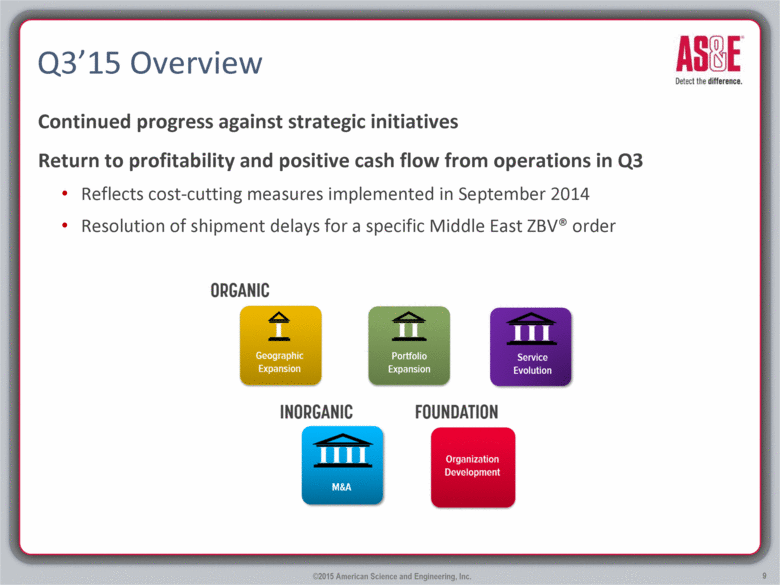
Q3’15 Overview Continued progress against strategic initiatives Return to profitability and positive cash flow from operations in Q3 Reflects cost-cutting measures implemented in September 2014 Resolution of shipment delays for a specific Middle East ZBV® order 9 ©2015 American Science and Engineering, Inc. |
|
|
Q3’15 Overview Con’t Delays in awards for large cargo tenders in the MEA and reduced U.S. government spending affected bookings However, we remain confident in our opportunity pipeline and increased global opportunities Opportunity pipeline remains robust with increased proposal and quoting activity in key markets such as Middle East/Africa and CALA Current global political situation and increased terror threat will be a catalyst for our offerings in the long-term 10 ©2015 American Science and Engineering, Inc. |
|
|
Geographic Expansion Upgrading global agent and distributor network to strengthen market reach. 100% of “Tier One” countries are covered. Added direct resources for sales and service in the Middle East, APAC, CALA Piloting sales model for U.S. Public Safety market “Localize our technology” to reach state and local public safety customers Seeding the market with MINI Z demos To-date we have had 4 seizures of currency and drugs Rolling our same sales model internationally Received 1st stocking orders in APAC and in the U.S. 11 ©2015 American Science and Engineering, Inc. |
|
|
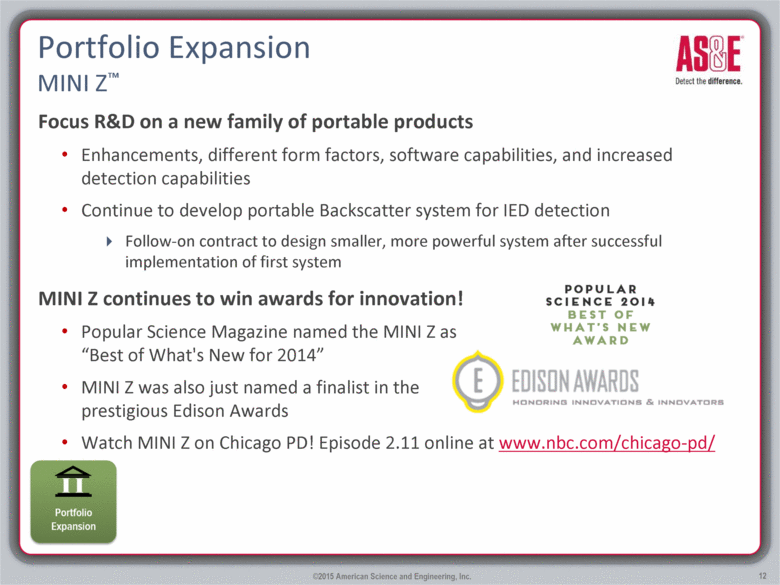
Portfolio Expansion MINI Z™ Focus R&D on a new family of portable products Enhancements, different form factors, software capabilities, and increased detection capabilities Continue to develop portable Backscatter system for IED detection Follow-on contract to design smaller, more powerful system after successful implementation of first system MINI Z continues to win awards for innovation! Popular Science Magazine named the MINI Z as “Best of What's New for 2014” MINI Z was also just named a finalist in the prestigious Edison Awards Watch MINI Z on Chicago PD! Episode 2.11 online at www.nbc.com/chicago-pd/ 12 ©2015 American Science and Engineering, Inc. |
|
|
Services Evolution Service continues to perform in a very challenging environment Stable run rate of the business for the last 4 quarters Success selling with installed base and “winning back” customers without service coverage – increasing service bookings in the year by over 10% International pipeline is strong; working hard to close these near term opportunities Managed Services Opportunities are moving forward through long sales cycles 13 ©2015 American Science and Engineering, Inc. Managed Services Systems Integration Multi-Vendor Service Expanding Service Offering Install Base |
|
|
Enhancing Shareholder Value On December 1, 2014, the Company approved an expansion of the stock repurchase authorization from $35.0 million to $50.0 million In Q3 the Company repurchased 383,500 shares of common stock for $18.8 million at an average cost of $49.02 per share. We are continuing the dividend of $.50 per share, payable on March 3, 2015. 14 ©2015 American Science and Engineering, Inc. We have returned $249M of Capital to our shareholders since starting the dividend and repurchase program in Q1’08. |
|
|
Q & A Learn more about AS&E products and technologies at www.as-e.com and follow us on Twitter @ase_detects 15 ©2015 American Science and Engineering, Inc. |

