Attached files
| file | filename |
|---|---|
| 8-K - FORM 8-K - BRYN MAWR BANK CORP | d865395d8k.htm |
 Fourth Quarter 2014 Update
Bryn Mawr Bank Corporation
NASDAQ: BMTC
DECEMBER 31, 2014
(JANUARY 23, 2015)
Exhibit 99.1 |
 Safe
Harbor This presentation contains statements which, to the extent that they are not recitations of
historical fact may constitute forward-looking statements for purposes of the
Securities Act of 1933, as amended, and the Securities Exchange Act of 1934, as
amended. Please see the section titled Safe Harbor beginning on slide 38 for more information
regarding these types of statements.
The
information
contained
in
this
presentation
is
correct
only
as
of
January
23,
2015.
Our
business, financial condition, results of operations and prospects may have changed since
that date, and we do not undertake to update such information.
1 |
 Bryn
Mawr Bank Corporation Profile •
Founded in 1889 –
126 history
•
A
unique
business
model
with
a
traditional
commercial
bank
($2.9
billion)
and
a
wealth
management company ($7.7 billion) under one roof as of January 1, 2014 (bank assets
include Continental Bank Holdings, Inc. “CBH”
acquisition)
•
Consistent record of profitability and growth
•
Largest community bank in Philadelphia’s affluent western suburbs
•
Three wealth acquisitions, three bank acquisitions and one insurance brokerage
acquisition completed since 2008
•
Acquisition of CBH with approximately $700 million in assets closed on January 1, 2015
•
Smooth CEO transition completed
2 |
 Southeast PA / DE Branch Footprint
•
29 Full-Service Branch
Locations
•
7 Limited-Hour Retirement
Community Branch
Locations
Includes CBH acquisition closed on January 1, 2015
3 |
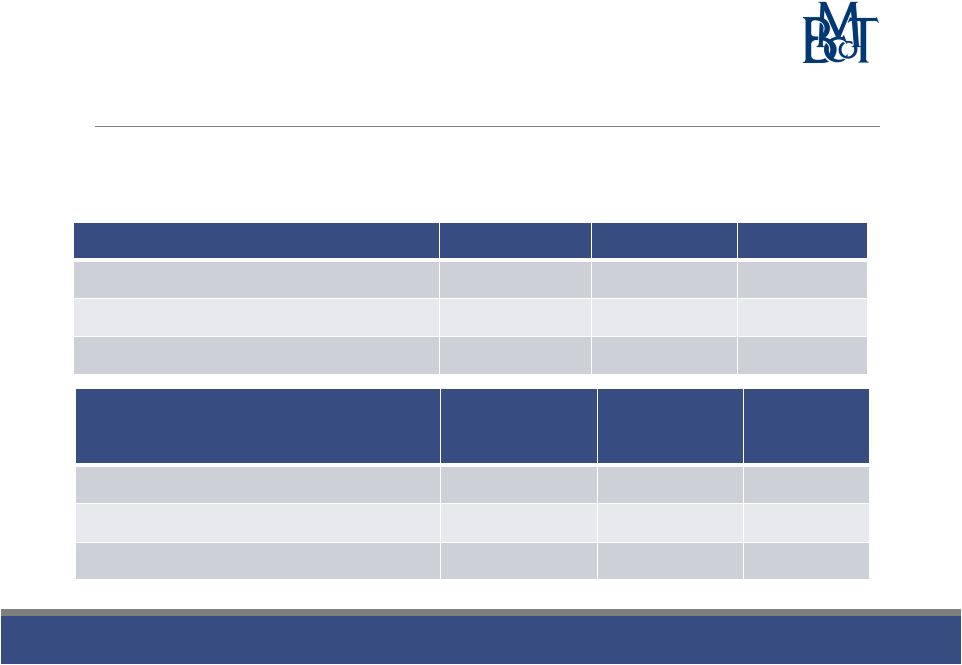 Investment Considerations
Quarterly dividend of $0.19 per share (increased 5.6% from $0.18
per share on
July 24, 2014)
Profitability Ratios
Full Year 2013
Full Year 2014
4 Qtr 2014
Return on average assets (“ROAA”)
1.23%
1.32%
1.28%
Return on average equity (“ROAE”)
11.53%
11.56%
11.23%
Return on average tangible equity (“ROATE”)
15.43%
14.85%
14.71%
Profitability Ratios excluding tax-effected
due diligence and merger-related expenses
(Non GAAP Measures)*
Full Year 2013
Full Year 2014
4 Qtr 2014
ROAA*
1.29%
1.39%
1.39%
ROAE*
12.11%
12.20%
12.22%
ROATE*
16.20%
15.67%
16.01%
* See Non-GAAP Measures disclosure beginning on slide 39
4
th
th |
 Net
Income and Diluted Earnings Per Share (EPS) (for the
quarter ended) ($ in thousands)
5 |
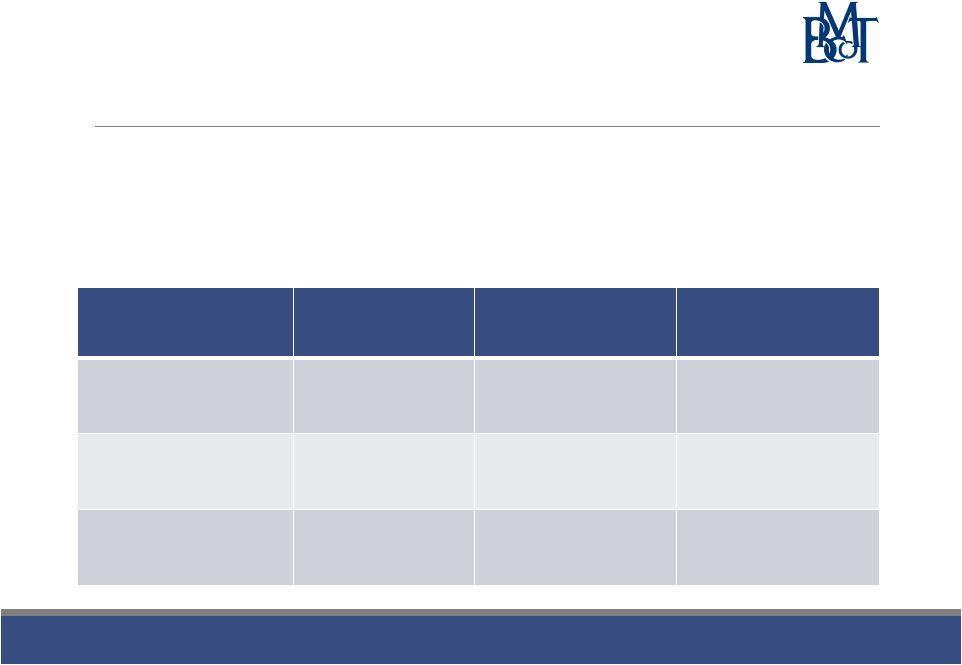 Full
Year 2014 BMTC Stock Performance Closing price on December 31, 2013:
$30.18
Closing price on December 31, 2014:
$31.30
Dividends declared per share –
Full Year 2014:
$0.74
Security or Index
2014
Total Return
3 Year
Total Return**
Trailing 12-Month
Dividend Yield
BMTC*
6.39%
74.46%
2.36%
NASDAQ Bank Index*
4.92%
76.48%
1.95%
KBW Regional Bank
Index*
2.43%
70.34%
2.20%
*Source: Bloomberg
** 3 Year Total Return -12/31/2011 to 12/31/2014
6 |
 Consistent BMTC Annual Dividend
Year
Diluted
Earnings Per
Share
Annual
Dividend
Dividend Yield
Year-End
Dividend
Payout Ratio
2010
$0.85
$0.56
3.21%
65.9%
2011
$1.54
$0.60
3.08%
39.0%
2012
$1.60
$0.64
2.87%
40.0%
2013
$1.80
$0.69
2.29%
38.3%
2014
$2.01
$0.74
2.36%
36.8%
7 |
 Strategic Plan
8 |
 Growth Strategies
1.
Invest in foundational strength to support growth
2.
Leverage the strength of our brand
3.
Build out the core franchise and target high potential markets
4.
High performance relationship based sales
5.
Concentrate on core product solutions and broaden the scope
6.
Strategic acquisitions and lift outs of high performing teams
7.
Human resources as a strategic advantage
9 |
 1.
Invest in Foundational Strength to Support Growth
10
Superior Risk Management
Discipline
Operational
Excellence
Efficient Technology Enabled Infrastructure
Growth Strategies |
 2.
Leverage the Strength of Our Brand 11
Growth Strategies |
 3.
Build Out the Core Franchise and Target High Potential Markets
Southeastern Pennsylvania, Delaware and New Jersey
12
Expansion
Markets
Continue to Build
Share
TARGET
SEGMENTS
Small Business
Middle Market
Entrepreneurs
Professionals
Non Profits
Affluent
Wealthy
Individuals
Wealth Families
Growth Strategies |
 3.
Build Out the Core Franchise and Target High Potential Markets
(continued) 13
TARGET
SEGMENTS
Small Business
Middle Market
Entrepreneurs
Professionals
Non Profits
Affluent
Wealthy Individuals
Wealth Families
Leverage our Hershey presence
Build out to Harrisburg
East to Lehigh Valley
Growth Strategies |
 4.
High Performance Relationship Based Sales
Relationship based vs.
transactional
Private Banking as the gateway to
cross selling and servicing
Share of wallet
Overlapping needs across
segments
Common base of products and
services
14
Private
Banking
Wealth
Clients
Consumers
Business
Clients
Growth Strategies |
 4.
High Performance Relationship Based Sales
Primary Relationships Manager
defined by primary need
Surround clients with teams of
subject matter experts
Serviced by a multi channel
distributions system
15
Growth Strategies |
 5.
Concentrate on Core Product Solutions and Broaden the Scope
Core Solutions
Core Product
Expansion
Products
Core Segments
Expansion
Segments
Transaction service
Deposit and
transaction services
Internet Banking
Mobility
Cash Management
Commercial
Business
Consumers
Small Business
Wealth
Private Banking
Lending services
CRE
C & I
Mortgage
Small Business
Commercial
Wealth
Consumers
Small Business
Wealth Services
Investment
Management
Trust and Estates
DE Advantage
Family Office
Non Profit
Financial Planning
Wealthy Individuals
Private Banking
Commercial Clients
Foundations
Wealthy Families
Leverage our dominant product strengths in banking and wealth
Expand core product penetration across client segments
Broaden into synergistic product lines to include high potential
offerings
Leverage the distribution system as a point of sale
16
Growth Strategies |
 6.
Strategic Acquisitions and Lift Out of High Performing Teams
17
•
Expand
geography
•
Broaden the
product line
•
Expand our
client base
•
Open new
markets
•
Grow share
•
Expand our
client base
Organic
Growth
Small to Mid
Size Banks
Wealth
Management
Companies
Advisory and
Planning
Services
Insurance
Firms
Growth Strategies |
 7.
Human Resources as a Strategic Advantage
18
Growth Strategies |
 Systems
Upgrades
and CBH
Update
19 |
 Systems Upgrades and CBH Update
•System
Upgrades o
Internet and Mobile Applications
o
Platform automation
o
Portfolio management and loan processing
o
Enterprise imaging, workflow and content management
•Conversion of CBH core
systems scheduled for September 2015 •Cost savings for CBH will not be fully realized until the 1 quarter 2016
•Rebalancing of the
combined BMTC and CBH balance sheet in process
20
st |
 Financial
Review
21 |
 Financial Highlights
12/31/13
3/31/14
6/30/14
9/30/14
12/31/14
Total assets
($ in billions)
$2.06
$2.06
$2.13
$2.12
$2.25
Portfolio loans & leases
($ in billions)
$1.55
$1.57
$1.62
$1.65
$1.65
Total deposits
($ in billions)
$1.59
$1.58
$1.62
$1.61
$1.69
Market capitalization
($ in millions)
$412
$392
$400
$389
$431*
Tangible book value per
share, end of quarter
$13.02
$13.47
$14.03
$14.37
$13.58
*Market capitalization @ 01/01/2015 approximately $550 million including CBH
transaction 22 |
 Quarterly Net Interest Margin
(On a tax-equivalent basis)
23 |
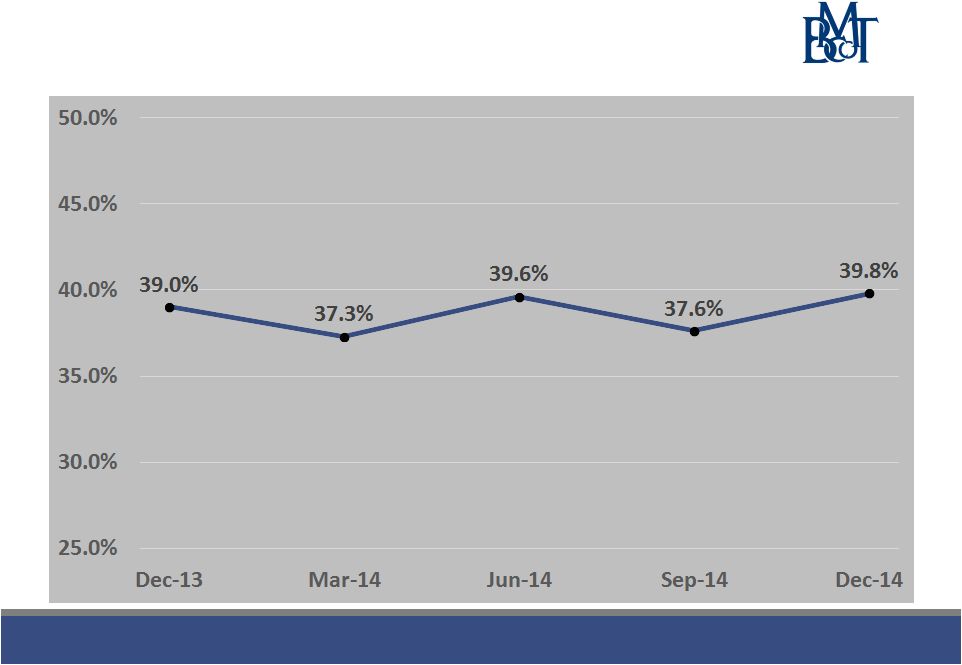 Quarterly Non-Interest Income
(As a % of Total Revenue)
24 |
 Capital Position -
Bryn Mawr Bank Corporation*
3/31/2014
6/30/2014
9/30/2014
12/31/2014
Tier I
11.71%
11.85%
12.05%
11.99%
Total (Tier II)
12.69%
12.79%
12.99%
12.86%
Tier I Leverage
9.50%
9.67%
9.77%
9.54%
Tangible Common
Equity
9.23%
9.32%
9.58%
8.71%
3/31/2014
6/30/2014
9/30/2014
12/31/2014
Tier I
11.65%
11.68%
11.60%
11.45%
Total (Tier II)
12.63%
12.62%
12.54%
12.32%
Tier I Leverage
9.43%
9.51%
9.39%
9.09%
Tangible Common
Equity
9.18%
9.18%
9.21%
8.29%
Capital Position -
Bryn Mawr Trust Company*
* The decrease in the capital ratios from 9/30/2014 to 12/31/2014 was primarily
related to the increased cash balance, the goodwill and intangible assets
created
from
the
Powers
Craft
Parker
and
Beard
acquisition,
and
the
increase
in
the
liability
from
the
pension
plan
reflected
in
other
comprehensive
loss
25 |
 Wealth
Division
Review
26 |
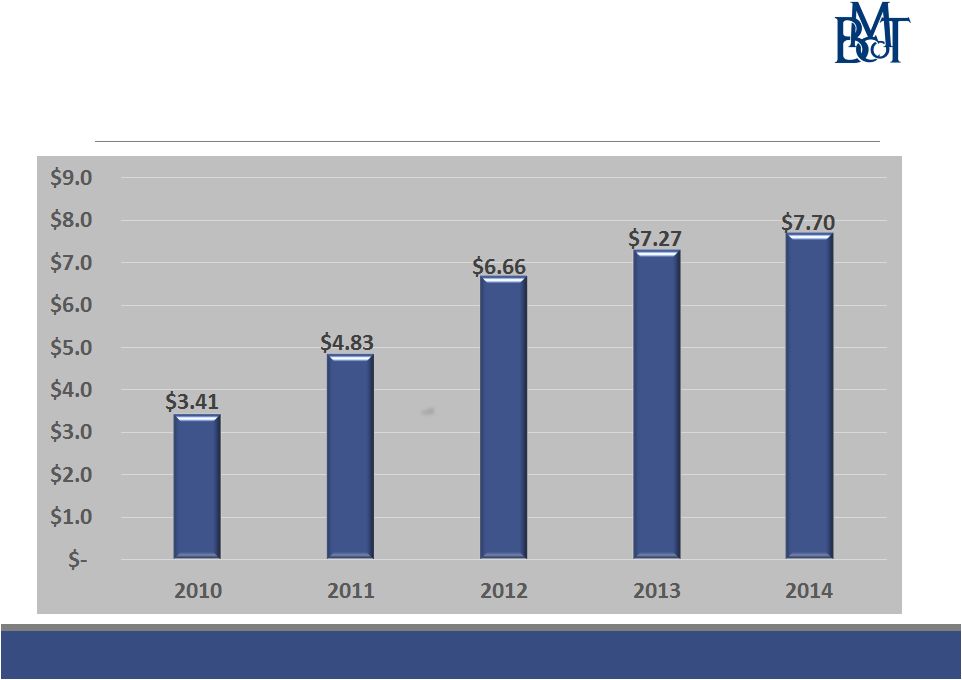 Wealth
Assets
Under
Management,
Administration,
Supervision
and Brokerage
(Year-end $ in billions)
27 |
 Wealth Management Fees
($ in millions)
28 |
 Wealth Division Highlights
(as of December 31, 2014)
Wealth Management
•
$7.7 billion in total wealth assets under management, administration,
supervision and brokerage
•
Integrated solutions to protect and preserve wealth
•
Financial Planning
•
Estate Planning
•
Retirement Planning
•
Investment Management
•
Custody Services
•
Philanthropic Services
•
Fiduciary Trust Services
•
Multi-family Office
•
Tax Services
•
Brokerage Services
29 |
 Wealth Division Highlights -
continued
BMTC of Delaware (Greenville, DE)
$1.72 billion in assets
Provides corporate fiduciary and administrative trustee services
under Delaware law and the full spectrum of tax advantaged
strategies
Powers Craft Parker & Beard, Inc.
Insurance brokerage, acquired October 1, 2014
30 |
 Credit
Review
31 |
 Portfolio Loan & Lease Growth
(Period-end $ in millions)
* From 2010 forward, includes the addition of the First Keystone
loan portfolio.
** From 2012 forward, includes the addition of the loans acquired from First Bank
of Delaware. 32 |
 Loan
Composition at December 31, 2014 ($ in millions)
Total loans and leases of $1.65 billion
33 |
 Quarterly Asset Quality Data
As of or for the quarter ended
12/31/13
3/31/14
6/30/14
9/30/14
12/31/14
Non-performing loans and
leases as a % of portfolio
loans and leases
0.68%
0.65%
0.52%
0.51%
0.61%
Allowance as a % of portfolio
loans and leases
1.00%
1.01%
0.96%
0.95%
0.88%
Non-performing assets as a %
of total assets
0.55%
0.55%
0.43%
0.43%
0.50%
Annualized net loan and lease
charge-offs as a % of average
quarterly loans and leases
0.09%
0.13%
0.05%
0.10%
0.17%
Non-GAAP Ratio:
Allowance and Loan mark
as a % of loans and leases*
1.60%
1.55%
1.42%
1.37%
1.26%
* See Non-GAAP Measures disclosure beginning on slide 39
34 |
 Loan
and Lease Update •
The addition of Continental Bank’s strong lending team and its loan portfolio is
expected to augment loan growth in 2015.
•
Continuing successful strategy of hiring seasoned professionals with strong customer
ties that wish to affiliate with a reputable bank.
•
The lending group continues to take advantage of market opportunities which should
continue to deliver solid quality loan growth.
•
Due to a positive significant event, a single commercial loan client prepaid a loan of
approximately $20 million late in the 4 quarter 2014.
35
th |
 Summary
•Outstanding
franchise in stable markets •Focus on Wealth Services, including Insurance and Business Banking
•Diversified
income base-non interest income 39.8% of total revenue for the three months
ended December 31, 2014
•Outstanding
loan quality •Sound business strategy, strong asset quality, well capitalized at December 31, 2014 and
solid risk management procedures
•Focus on
earnings per share •Continue to make IT infrastructure investments that should provide longer-term benefits
36 |
 Frank Leto
President & CEO
610-581-4730
fleto@bmtc.com
Joseph Keefer
Chief Lending Officer
610-581-4869
jkeefer@bmtc.com
Duncan Smith
Chief Financial Officer
610-526 –2466
jdsmith@bmtc.com
Chad Fortenbaugh –
Shareholder Relations –
610-581-4823 –
cfortenbaugh@bmtc.com
Gary Madeira
EVP -
Wealth
610-581-4791
gmadeira@bmtc.com
37 |
 Safe
Harbor This presentation contains statements which, to the extent that they are not
recitations of historical fact may constitute forward-looking statements for
purposes of the Securities Act of 1933, as amended, and the Securities Exchange Act of 1934, as
amended. Such forward-looking statements may include financial and other projections
as well as statements regarding Bryn Mawr Bank Corporation (the “Corporation”) that may include future plans, objectives,
performance, revenues, growth, profits, operating expenses or the Corporation’s underlying
assumptions. The words “may”, “would”, “should”, “could”, “will”,
“likely”, “possibly”, “expect,”
“anticipate,”
“intend”, “estimate”, “target”, “potentially”,
“probably”, “outlook”, “predict”, “contemplate”, “continue”,
“strategic”, “objective”, “plan”, “forecast”,
“project” and “believe”
or other similar words, phrases or concepts may identify forward-looking statements.
Persons reading or present at this presentation are cautioned that such statements are
only predictions, and that the Corporation’s actual future results or performance
may be materially different. Such forward-looking statements involve known and
unknown risks and uncertainties. A number of factors, many of which are beyond the Corporation’s
control,
could
cause
our
actual
results,
events
or
developments,
or
industry
results,
to
be
materially
different
from
any
future
results,
events
or
developments
expressed, implied or anticipated by such forward-looking statements, and so our business
and financial condition and results of operations could be materially and adversely
affected. Such
factors
include,
among
others,
that
the
integration
of
Continental’s
business
with
the
Corporation
may
take
longer
than
anticipated
or
be
more
costly
to
complete and that the anticipated benefits, including any anticipated cost savings or
strategic gains, may be significantly harder to achieve or take longer than
anticipated
or
may
not
be
achieved,
our
need
for
capital,
our
ability
to
control
operating
costs
and
expenses,
and
to
manage
loan
and
lease
delinquency
rates;
the
credit
risks
of
lending
activities
and
overall
quality
of
the
composition
of
our
loan,
lease
and
securities
portfolio;
the
impact
of
economic
conditions,
consumer
and
business
spending
habits,
and
real
estate
market
conditions
on
our
business
and
in
our
market
area;
changes
in
the
levels
of
general
interest
rates,
deposit
interest
rates,
or
net
interest
margin
and
funding
sources;
changes
in
banking
regulations
and
policies
and
the
possibility
that
any
banking
agency
approvals
we
might
require
for
certain
activities
will
not
be
obtained
in
a
timely
manner
or
at
all
or
will
be
conditioned
in
a
manner
that
would
impair
our
ability
to
implement
our
business
plans;
changes
in
accounting
policies
and
practices;
the
inability
of
key
third-party
providers
to
perform
their
obligations
to
us;
our
ability
to
attract
and
retain
key
personnel;
competition
in
our
marketplace;
war
or
terrorist
activities;
material
differences
in
the
actual
financial
results,
cost
savings
and
revenue
enhancements
associated
with
our
acquisitions;
and
other
factors
as
described
in
our
securities
filings.
All
forward-looking
statements
and
information
made
herein
are
based
on
management’s
current
beliefs
and
assumptions
as
of
January
23,
2015
and
speak
only
as
of
that
date.
The
Corporation
does
not
undertake
to
update
forward-looking
statements.
For a complete discussion of the assumptions, risks and uncertainties related to our business,
you are encouraged to review our filings with the Securities and Exchange Commission,
including our most recent annual report on Form 10-K, as well as any changes in risk factors that we may identify in our quarterly or
other reports subsequently filed with the SEC.
This
presentation
is
for
discussion
purposes
only,
and
shall
not
constitute
any
offer
to
sell
or
the
solicitation
of
an
offer
to
buy
any
security,
nor
is
it
intended
to
give rise to any legal relationship between the Corporation and you or any other person, nor
is it a recommendation to buy any securities or enter into any transaction with the
Corporation. The information contained herein is preliminary and material changes to
such information may be made at any time. If any offer of securities is made, it shall
be made pursuant to a definitive offering memorandum or prospectus (“Offering
Memorandum”) prepared by or on behalf of the Corporation, which would contain
material information not contained herein and which shall supersede, amend and supplement this information in its entirety. Any decision to invest in
the Corporation’s securities should be made after reviewing an Offering Memorandum,
conducting such investigations as the investor deems necessary or appropriate, and
consulting the investor’s own legal, accounting, tax, and other advisors in order to make an independent determination of the suitability and
consequences of an investment in such securities.
No
offer
to
purchase
securities
of
the
Corporation
will
be
made
or
accepted
prior
to
receipt
by
an
investor
of
an
Offering
Memorandum
and
relevant
subscription
documentation,
all
of
which
must
be
reviewed
together
with
the
Corporation’s
then-current
financial
statements
and,
with
respect
to
the
subscription
documentation,
completed
and
returned
to
the
Corporation
in
its
entirety.
Unless
purchasing
in
an
offering
of
securities
registered
pursuant
to
the
Securities
Act
of
1933,
as
amended,
all
investors
must
be
“accredited
investors”
as
defined
in
the
securities
laws
of
the
United
States
before
they
can
invest
in
the
Corporation.
38 |
 *Non
GAAP Measures Our management uses non-GAAP financial measures in their analysis of our
performance and believes that they provide useful supplemental information
that is essential to an investor’s understanding of Bryn Mawr Bank
Corporation’s operating results. These non-GAAP financial measures should not
be viewed as a substitute for financial measures determined in accordance with
GAAP, nor are they necessarily comparable to non-GAAP performance
measures that may be presented by other companies.
A reconciliation from GAAP measures to non-GAAP measures related to the
exclusion of due diligence and merger-related expenses or tax-effected due
diligence and merger-related expenses is provided on the following two slides:
39 |
 *Reconciliation of GAAP Measures to Non-GAAP Measures
$ in thousands
Full Year 2013
Full Year 2014
4 Qtr
2014
Net income (a GAAP measure)
$24,444
$27,843
$7,044
Add: Tax-effected due diligence and merger-related
expenses (35% tax rate)
$1,225
$1,542
$622
Net income, excluding tax-effected due diligence and
merger-related expenses (a non-GAAP measure)
$25,669
$29,385
$7,666
•Return on average assets, excluding tax-effected due diligence and
merger-related expenses (a non-GAAP measure) is calculated by dividing net
income, excluding tax-effected due diligence and merger-related expenses (a
non-GAAP measure) by average assets ($ in thousands) of $1,994,500
for
the
full
year
2013,
$2,115,482
for
the
full
year
2014,
and
$2,182,842
for
the
4
quarter
2014.
•Return on average equity, excluding tax-effected due diligence and
merger-related expenses (a non-GAAP measure) is calculated by dividing net
income, excluding tax-effected due diligence and merger-related expenses (a
non-GAAP measure) by average equity ($ in thousands) of $212,050 for
the
full
year
2013,
$240,778
for
the
full
year
2014,
and
$248,935
for
the
4
quarter
2014.
•Return on tangible common equity, excluding tax-effected due diligence
and merger-related expenses (a non-GAAP measure) is calculated by
dividing net income, excluding tax-effected due diligence and
merger-related expenses (a non-GAAP measure) by average tangible common equity ($
in
thousands)
of
$158,457
for
the
full
year
2013,
$187,557
for
the
full
year
2014,
and
$190,004
for
the
4
quarter
2014.
•The allowance and loan mark as a % of loans and leases (a non-GAAP
measure), is calculated by dividing the total allowance for loans and lease
losses plus the loan mark by total loans and leases.
40
$ in thousands
4 Qtr 2013
1 Qtr 2014
2
Qtr 2014
3
Qtr 2014
4 Qtr 2014
Allowance for loan and lease losses
$15,515
$15,770
$15,470
$15,599
$14,586
Loan mark
$9,243
$8,483
$7,510
$6,932
$6,255
Total allowance for loan and lease losses
and loan mark (a non-GAAP measure)
$24,758
$24,253
$22,980
$22,531
$20,841
th
th
th
th
th
rd
nd
st
th |