Attached files
| file | filename |
|---|---|
| EX-99.1 - Q4-14 PRESS RELEASE FINANCIALS - ManpowerGroup Inc. | exhibit_99-1.htm |
| 8-K - Q4-2014 FORM 8K - ManpowerGroup Inc. | form_8k.htm |
Exhibit 99.2

ManpowerGroup Fourth Quarter Results January 30, 2015

ManpowerGroup | January 2015 * Forward-Looking Statements This presentation contains statements, including financial projections, that are forward-looking in nature. These statements are based on managements’ current expectations or beliefs, and are subject to known and unknown risks and uncertainties regarding expected future results. Actual results might differ materially from those projected in the forward-looking statements. Additional information concerning factors that could cause actual results to materially differ from those in the forward-looking statements is contained in the ManpowerGroup Inc. Annual Report on Form 10-K dated December 31, 2013, which information is incorporated herein by reference, and such other factors as may be described from time to time in the Company’s SEC filings. Any forward-looking statements in this presentation speak only as of the date hereof. The Company assumes no obligation to update or revise any forward-looking statements. *

ManpowerGroup | January 2015 * As Reported Excluding PY Restructuring Charges Q4 Financial Highlights 2% 2% Revenue $5.1B 5% CC 5% CC Revenue $5.1B 10 bps 10 bps Gross Margin 17.0% 16% 0% Operating Profit $193M 27% CC 9% CC Operating Profit $193M 60 bps 10 bps OP Margin 3.8% 18% 1% EPS $1.47 28% CC 7% CC EPS $1.47 Excludes the impact of restructuring charges of $26.5M in Q4 2013. Throughout this presentation, the difference between reported variances and Constant Currency (CC) variances represents the impact of currency on our financial results. Constant Currency is further explained on our Web site. Consolidated Financial Highlights (1)

ManpowerGroup | January 2015 * Regional Average Daily Revenue Trends Year-on-year percent change in constant currency

ManpowerGroup | January 2015 * EPS Bridge – Q4 vs. Guidance Midpoint
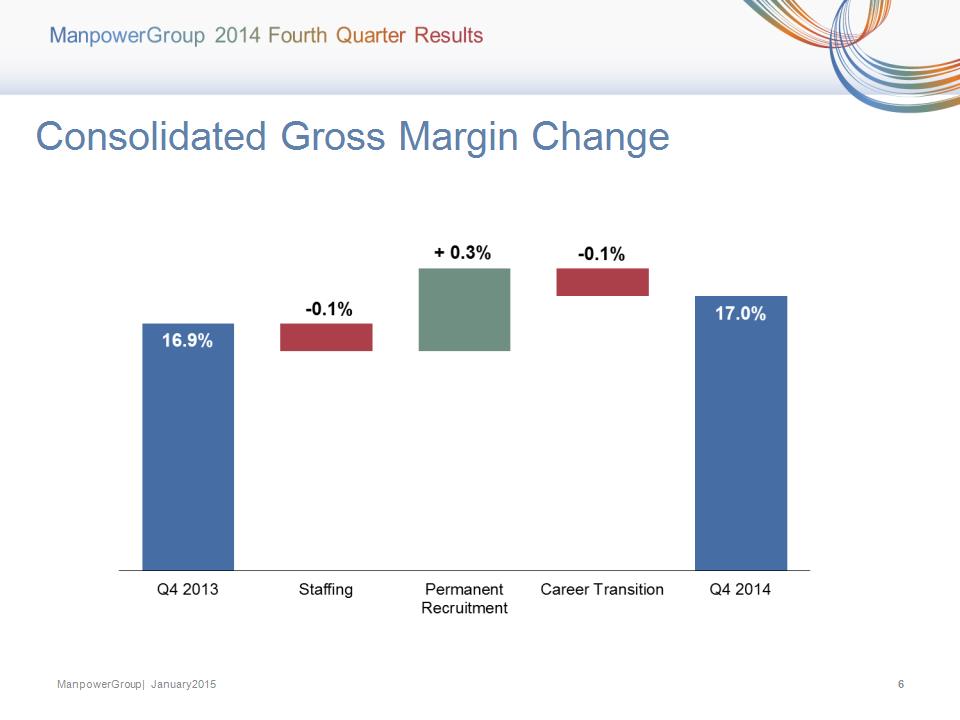
ManpowerGroup | January 2015 * Consolidated Gross Margin Change

ManpowerGroup | January 2015 * Growth in CC % Business Line Gross Profit – Q4 2014 █ Manpower █ Experis █ ManpowerGroup - Total █ ManpowerGroup Solutions █ Right Management
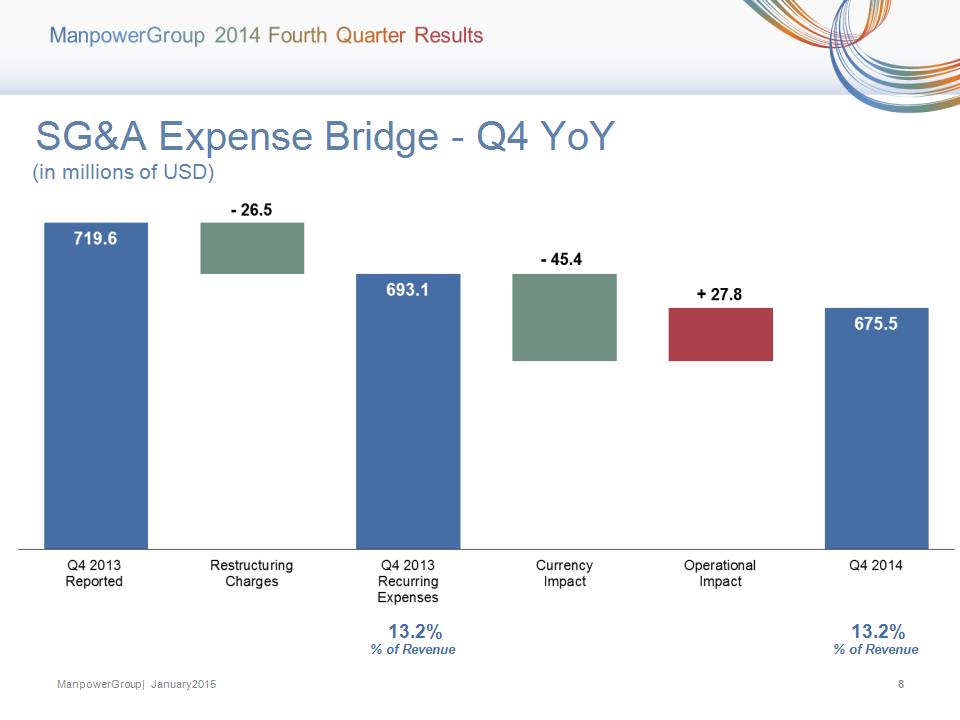
ManpowerGroup | January 2015 * SG&A Expense Bridge – Q4 YoY (in millions of USD) 13.2% % of Revenue 13.2% % of Revenue

ManpowerGroup | January 2015 * SG&A Expense Bridge –YTD YoY (in millions of USD) Productivity Gain 13.3% % of Revenue 13.7% % of Revenue

ManpowerGroup | January 2015 * Operating Unit Profit (OUP) is the measure that we use to evaluate segment performance. OUP is equal to segment revenues less direct costs and branch and national headquarters operating costs. As Reported Excluding Non-Recurring Items Q4 Financial Highlights 3% 3% Revenue $1.2B 7% CC 7% CC Revenue $1.2B 40% 20% OUP $55M 45% CC 24% CC OUP $55M 120 bps 60 bps OUP Margin 4.7% (1) Americas Segment (23% of Revenue) Included in these amounts is the US, which had revenue of $790M (+5%) and OUP of $40.4M (+48%), or +32% excluding the impact of restructuring charges in Q4 2013. Excludes the impact of restructuring charges of $6.6M in Q4 2013. (2)

ManpowerGroup | January 2015 * Americas – Q4 Revenue Growth YoY Revenue Growth - CC Revenue Growth % of Segment Revenue

ManpowerGroup | January 2015 * As Reported Excluding PY Restructuring Charges Q4 Financial Highlights 6% 6% Revenue $1.8B 3% CC 3% CC Revenue $1.8B 1% 1% OUP $92M 11% CC 7% CC OUP $92M 40 bps 20 bps OUP Margin 5.1% Southern Europe Segment (36% of Revenue) Included in these amounts is France, which had revenue of $1.3B (-1% CC) and OUP of $68.2M (+6% CC). Excludes the impact of restructuring charges of $2.7M in Q4 2013. (1) (2)

ManpowerGroup | January 2015 * Southern Europe – Q4 Revenue Growth YoY Revenue Growth - CC Revenue Growth % of Segment Revenue

ManpowerGroup | January 2015 * As Reported Excluding PY Restructuring Charges Q4 Financial Highlights 1% 1% Revenue $1.5B 7% CC 7% CC Revenue $1.5B 18% 3% OUP $54M 34% CC 9% CC OUP $54M 60 bps 10 bps OUP Margin 3.6% Northern Europe Segment (29% of Revenue) Excludes the impact of restructuring charges of $10.2M in Q4 2013. (1)

ManpowerGroup | January 2015 * Northern Europe – Q4 Revenue Growth YoY Revenue Growth - CC Revenue Growth % of Segment Revenue

ManpowerGroup | January 2015 * As Reported Excluding PY Restructuring Charges Q4 Financial Highlights 4% 4% Revenue $567M 3% CC 3% CC Revenue $567M 29% 14% OUP $21M 38% CC 22% CC OUP $21M 100 bps 60 bps OUP Margin 3.8% APME Segment (11% of Revenue) Excludes the impact of restructuring charges of $2.3M in Q4 2013. (1)
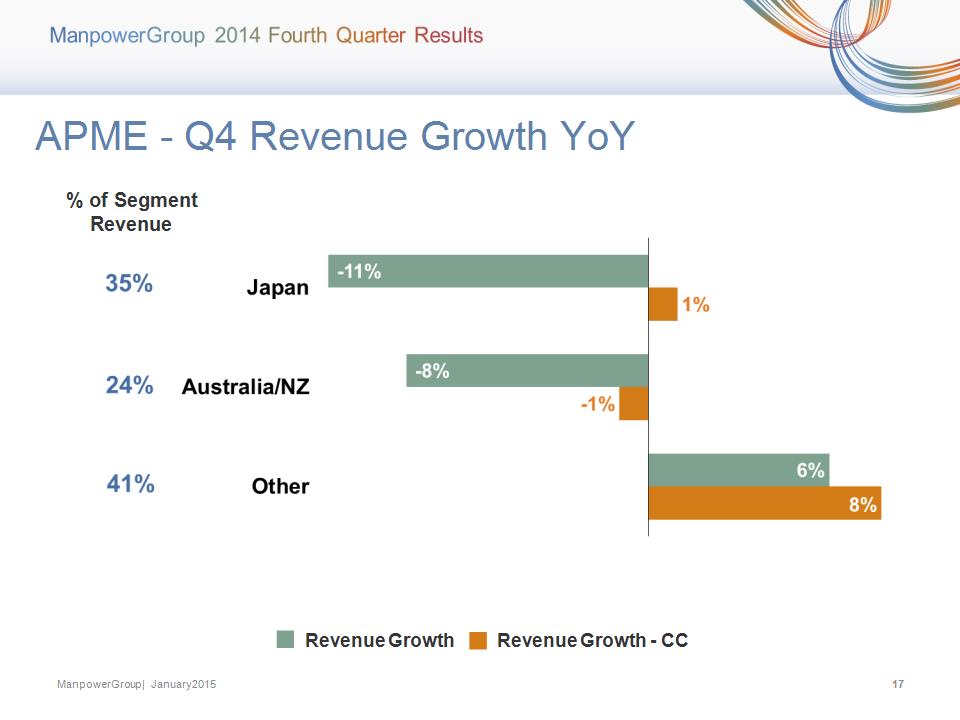
ManpowerGroup | January 2015 * APME – Q4 Revenue Growth YoY Revenue Growth - CC Revenue Growth % of Segment Revenue

ManpowerGroup | January 2015 * Right Management Segment (1% of Revenue) Excludes the impact of restructuring charges of $4.7M in Q4 2013.

ManpowerGroup | January 2015 * Cash Flow Summary – Full Year
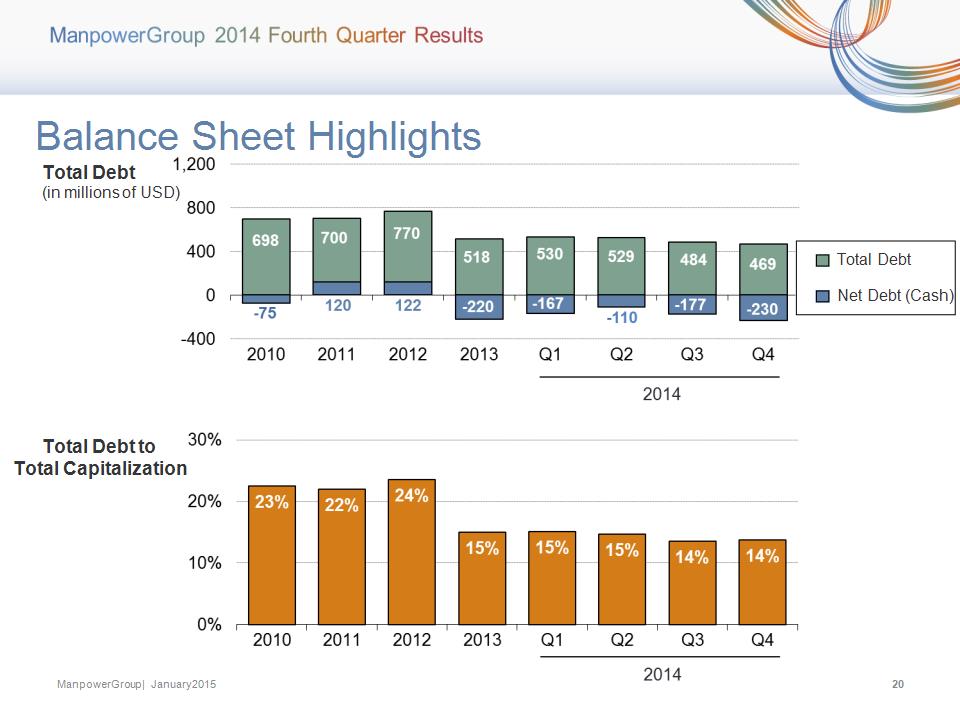
ManpowerGroup | January 2015 * Balance Sheet Highlights Total Debt (in millions of USD) Total Debt to Total Capitalization Total Debt Net Debt (Cash)

ManpowerGroup | January 2015 * Credit Facilities – December 31, 2014 (in millions of USD) (1) (2) The $600M agreement requires that we comply with a Leverage Ratio (Debt-to-EBITDA) of not greater than 3.5 to 1 and a Fixed Charge Coverage Ratio of not less than 1.5 to 1, in addition to other customary restrictive covenants. As defined in the agreement, we had a Debt-to-EBITDA ratio of 0.21 and a fixed charge coverage ratio of 4.25 as of December 31, 2014. As of December 31, 2014, there were $0.9M of standby letters of credit issued under the agreement. Represents subsidiary uncommitted lines of credit & overdraft facilities, which total $331.9M. Total subsidiary borrowings are limited to $300M due to restrictions in our Revolving Credit Facility, with the exception of Q3 when subsidiary borrowings are limited to $600M.

ManpowerGroup | January 2015 * First Quarter Outlook

ManpowerGroup | January 2015 * Where are we on our journey to 4%... 2014 EBITA margin of 3.6%. 120 basis point improvement since 2012 and ahead of our expectations. EBITA of $753M is at an all-time record and EBITA margin is the highest in more than 15 years. Above analysis excludes restructuring charges and other non-recurring items in all periods. As introduced in February 2013

ManpowerGroup | January 2015 * Key Take-Aways Strong 2014 performance with disciplined execution and focus on our strategic initiatives. Good progress on our journey to 4% EBITA margin. Currency headwinds expected in 2015; will impact reported earnings but not our underlying financial performance. Well positioned for continued success with our strong global brands and unrivalled global footprint.