Attached files
| file | filename |
|---|---|
| 8-K - 8-K - SunCoke Energy Partners, L.P. | d863306d8k.htm |
| EX-99.1 - EX-99.1 - SunCoke Energy Partners, L.P. | d863306dex991.htm |
| EX-99.3 - EX-99.3 - SunCoke Energy Partners, L.P. | d863306dex993.htm |
 SunCoke Energy Partners, L.P.
Q4 2014 Earnings
Q4 2014 Earnings
& 2015 Guidance
& 2015 Guidance
Conference Call
Conference Call
January 29, 2015
January 29, 2015
Exhibit 99.2 |
 Forward-Looking Statements
This slide presentation should be reviewed in conjunction with the Fourth Quarter
2014 earnings and 2015 guidance release of SunCoke Energy Partners, L.P.
(SXCP) and the conference call held on January 29, 2015 at 10:00 a.m. ET.
Some
of
the
information
included
in
this
presentation
constitutes
“forward-looking
statements.”
All
statements
in
this
presentation
that
express
opinions,
expectations,
beliefs,
plans,
objectives,
assumptions
or
projections
with
respect
to
anticipated
future
performance
of
SunCoke
Energy,
Inc.
(SXC) or SXCP, in contrast with statements of historical facts, are
forward-looking statements. Such forward-looking statements are based on
management’s beliefs and assumptions and on information currently available.
Forward-looking statements include information concerning possible or
assumed future results of operations, business strategies, financing plans, competitive position, potential growth opportunities, potential operating
performance improvements, the effects of competition and the effects of future
legislation or regulations. Forward-looking statements include all
statements
that
are
not
historical
facts
and
may
be
identified
by
the
use
of
forward-looking
terminology
such
as
the
words
“believe,”
“expect,”
“plan,”
“intend,”
“anticipate,”
“estimate,”
“predict,”
“potential,”
“continue,”
“may,”
“will,”
“should”
or the negative of these terms or similar expressions.
Although management believes that its plans, intentions and expectations reflected
in or suggested by the forward-looking statements made in this
presentation are reasonable, no assurance can be given that these plans, intentions
or expectations will be achieved when anticipated or at all. Moreover,
such statements are subject to a number of assumptions, risks and uncertainties. Many of these risks are beyond the control of SXC and
SXCP, and may cause actual results to differ materially from those implied or
expressed by the forward-looking statements. Each of SXC and SXCP
has included in its filings with the Securities and Exchange Commission cautionary
language identifying important factors (but not necessarily all the
important factors) that could cause actual results to differ materially from those
expressed in any forward-looking statement. For more information
concerning
these
factors,
see
the
Securities
and
Exchange
Commission
filings
of
SXC
and
SXCP.
All
forward-looking
statements
included
in
this
presentation are expressly qualified in their entirety by such cautionary
statements. Although forward-looking statements are based on current beliefs
and expectations, caution should be taken not to place undue reliance on any such
forward-looking statements because such statements speak only as of the
date hereof. SXC and SXCP do not have any intention or obligation to update publicly any forward-looking statement (or its associated
cautionary language) whether as a result of new information or future events or
after the date of this presentation, except as required by applicable
law.
This presentation includes certain non-GAAP financial measures intended to
supplement, not substitute for, comparable GAAP measures. Reconciliations of
non-GAAP financial measures to GAAP financial measures are provided in the Appendix at the end of the presentation. Investors
are urged to consider carefully the comparable GAAP measures and
the reconciliations to those measures provided in the Appendix.
1
SXCP Q4/ FY 2014 Earnings & 2015 Guidance Call |
 2014
Accomplishments 2
SXCP Q4/ FY 2014 Earnings & 2015 Guidance Call
Operations Excellence
•
Sustained solid operating and safety performance
•
Completed construction of Haverhill 2 gas sharing
project ahead of schedule
Successful Asset Dropdowns
•
Completed first dropdown transaction in May ‘14
•
Executed dropdown of 75% of Granite City in Jan. ’15
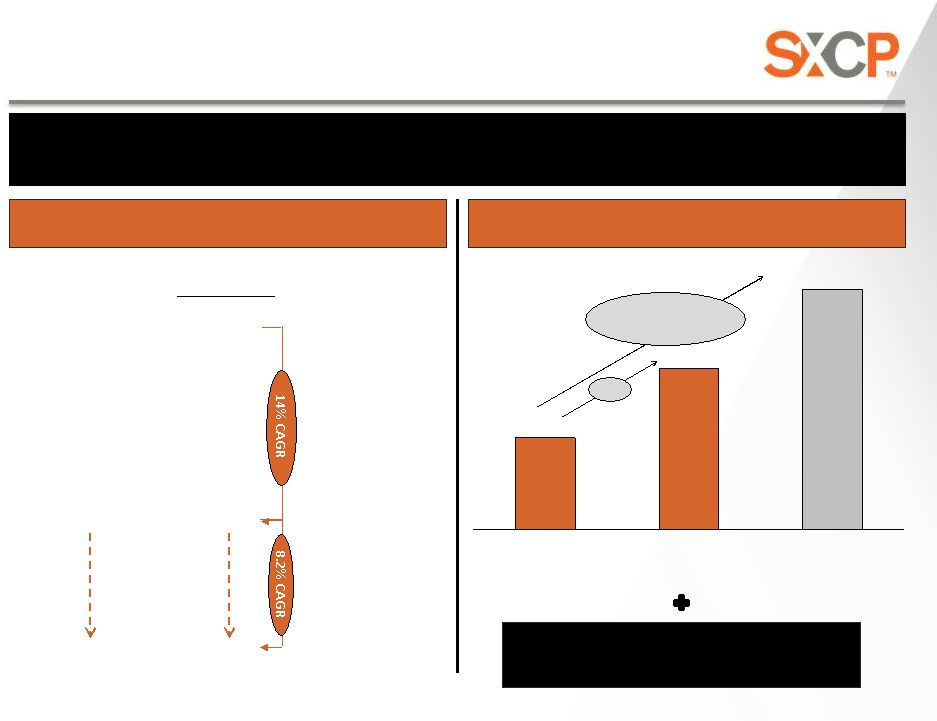
Strong Distribution Growth
•
Increased Q4 distribution 2.5% to $0.5408 per unit
•
Grew distributions ~14% since Q4 ‘13
•
Delivered strong distributable cash flow within 2014
guidance range
(1)
•
On track to deliver 8% -
10% cash distribution CAGR
through 2016 from domestic dropdowns alone
–
Total transaction value of $245M
–
Expect transaction will add $30M to Adj. EBITDA and
$11M –
$12M to distributable cash flow in 2015
(1)
Reflects proforma distributable cash flow
guidance of $91M - $97M provided in July 2014
earnings presentation.
|
 Q4
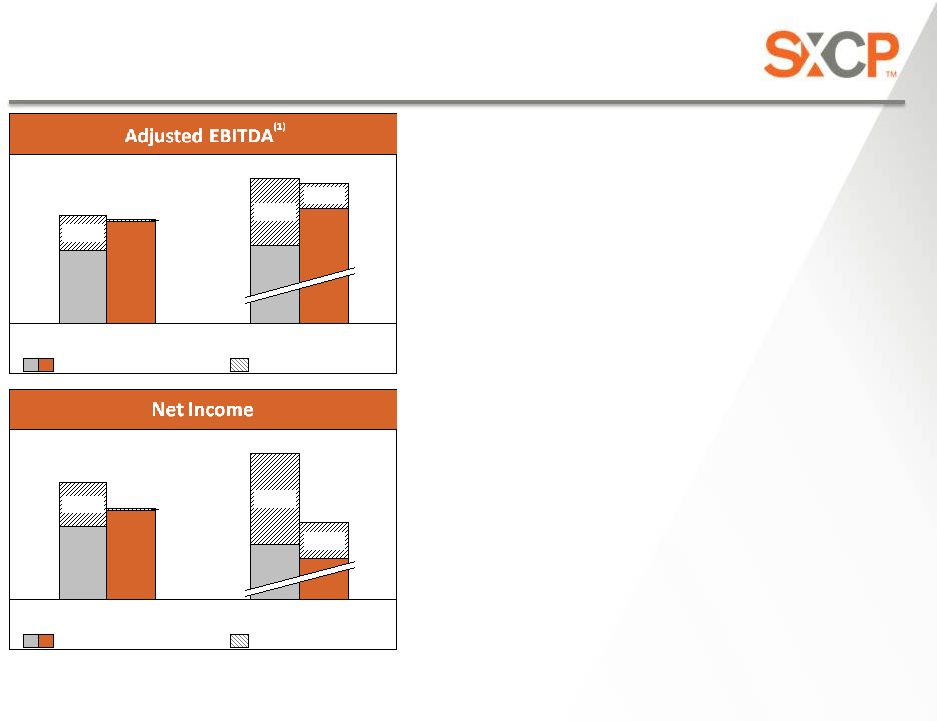
& FY 2014 Financial Results 3
SXCP Q4/ FY 2014 Earnings & 2015 Guidance Call
Attributable to SXC
Attributable to SXCP
Attributable to SXC
Attributable to SXCP
($ in millions)
($ in millions)
Q4 Adj. EBITDA down $1.3M
•
Higher O&M expense across Coke and
Coal Logistics segments
•
Adj. EBITDA attributable to SXCP
benefited from higher ownership interest
FY ‘14 Adj. EBITDA down $4.4M
•
Impacts of Q1 severe winter weather and
lower yields at Haverhill more than offset
full year Coal Logistics benefit
Q4 Net Income attributable to SXCP
rose $4.1M
•
Higher ownership interest
•
Higher interest expense, debt
extinguishment cost, call premium and
depreciation & amortization
$0.8
$38.9
Q4 ‘14
$39.7
Q4 ‘13
$41.0
$27.6
$13.4
FY ‘14
$150.6
$130.9
$19.7
FY ‘13
$155.0
$99.9
$55.1
(2)
$0.6
Q4 ‘14
$22.0
$21.4
Q4 ‘13
$28.1
$17.3
$10.8
FY ‘14
$56.0
$71.7
$15.7
FY ‘13
$102.9
$62.1
$40.8
(3)
(3)
(1)
For a definition and reconciliation of Adjusted EBITDA, please see appendix. (2)
Proforma assuming closing of SXCP IPO effective January 1, 2013. (3)
Includes predecessor net income prior to initial public offering on Jan. 24,
2013. FY ‘14
Net Income down $31.2M |
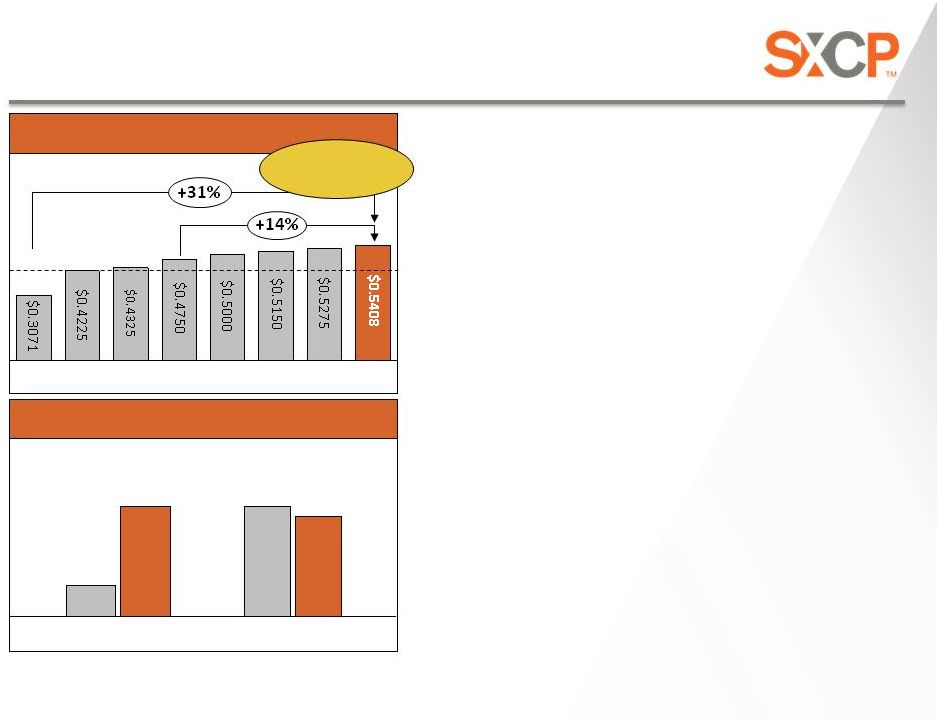 Distribution and Coverage
($/unit)
Q4 cash distribution per unit raised to
$0.5408
•
Up 14% vs. Q4 ‘13 and 31% vs. minimum
quarterly rate
•
Granite City and remaining dropdowns
support future per unit increases
Q4 Distributable cash flow up 11.5% to
$27.2M
•
Strong 1.28x Proforma
(2)
distribution
cash coverage ratio
Full Year 2014 Proforma
(2,3)
distribution cash coverage ratio of
~1.17x
Feb ‘15
May ‘14
Aug ‘13
Aug ‘14
Nov ‘14
Feb ‘14
Nov ‘13
May ‘13
($ in millions, except coverage ratio)
Q4 ‘14
$27.2
FY ‘14
$94.9
1.28x
1.17x
Q4 ‘14
FY ‘14
Distributable Cash Flow
Distribution Cash
Coverage Ratio
4
$0.4125 MQD
(1)
SXCP Q4/ FY 2014 Earnings & 2015 Guidance Call
7
th
consecutive
quarterly increase
(3)
(2)
(2,3)
Distribution per Unit
Distributable Cash Flow & Coverage Ratio
(1)
MQD – Minimum quarterly distribution. (2) Assumes no distributions to units issued in conjunction with the
Granite City dropdown (~1.9M units).
(3)
Assumes dropdown of additional 33% interest in Haverhill and Middletown occurred January 1,
2014. For a reconciliation of guidance, please see appendix. |
 Liquidity Position
$22.0
$10.5
$4.2
$33.3
$26.9
Distributions
to Unit Holders
($20.5)
Capex
($9.3)
Working Capital
Changes / Other
D&A
Net Income
Q3 2014
Cash Balance
Q4 2014
Cash Balance
Distributions
to SXC
($0.5)
Financial flexibility, solid cash position and virtually
undrawn revolver provide strong foundation for growth
5
SXCP Q4/ FY 2014 Earnings & 2015 Guidance Call
•
($3.3M) –
Ongoing
•
($6.0M) –
Environmental
•
($11.6M) –
SXC
(1)
•
($8.9M) –
Public holders
Revolver availability:
$250M
(1)
Includes $10.9M for LP distributions, $0.3M for IDR payment and $0.4M for distributions to SXC
for its 2% General Partner interest in our cokemaking facilities. |
 6
SXCP Q4/ FY 2014 Earnings & 2015 Guidance Call
2015 GUIDANCE |
 2015
Priorities 7
SXCP Q4/ FY 2014 Earnings & 2015 Guidance Call
Operations Excellence
•
Sustain strong operating and safety performance
•
Complete construction of gas sharing at Haverhill 1
Drive Growth
•
Pursue MLP-qualifying, industrial-facing processing &
handling M&A opportunities
•
Build Coal Logistics customer base
Optimize Business and Capital Structure
•
Management has indicated intent to execute at least
one additional dropdown in 2015
•
Expect to increase distributions by 2% per quarter in ‘15
•
Drive 8% –
10% cash distribution CAGR through 2016
from domestic dropdowns alone
•
Evaluate tightening distribution cash coverage, which
would
provide
further
flexibility
to
grow
distributions |
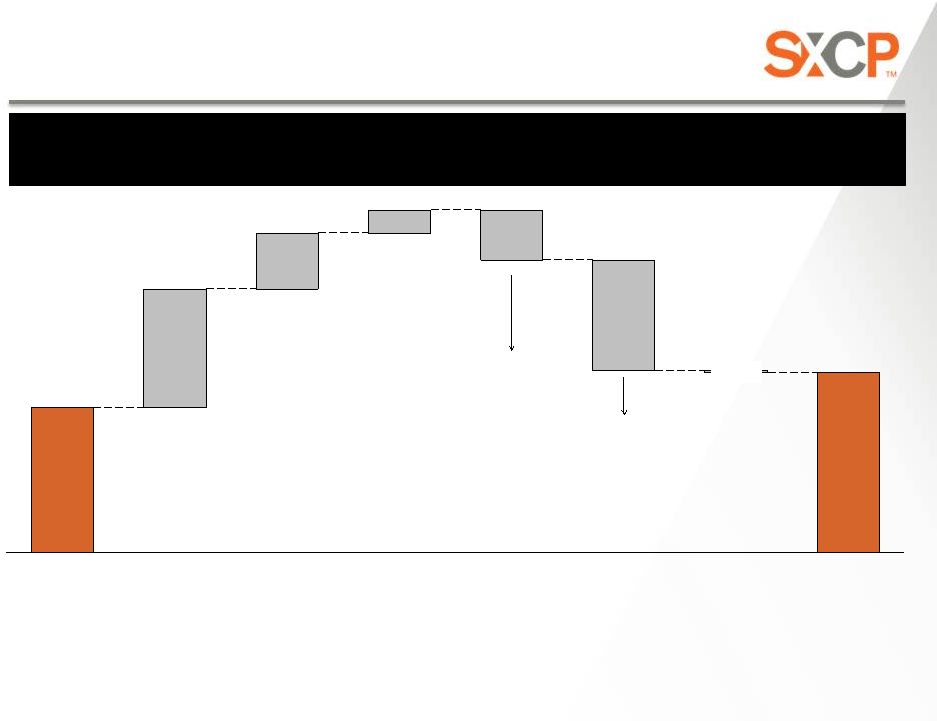
 Expected 2015 Adjusted EBITDA
(1)
$1 -
$3
$146
($3) –
($1)
Granite City
Coal Logistics
($5) -
$1
Corporate Costs
Proforma FY
2014 Adj. EBITDA
attrib. to SXCP
~$30
$169 -
$179
FY 2015E Adj.
EBITDA attrib.
to SXCP
(1)
For a definition and reconciliation of Adjusted EBITDA and Adjusted EBITDA per ton, please see
the appendix. (2)
Proforma assumes dropdown of additional 33% interest in Haverhill and Middletown occurred
January 1, 2014 (3)
Consists of Haverhill, Middletown, and Granite City facilities.
2015 Adj. EBITDA
(1)
outlook reflects benefit of Granite City dropdown
SXCP Q4/ FY 2014 Earnings & 2015 Guidance Call
8
($ in millions)
(2)
Coke Operating Performance (100% Basis)
2014
Actual
2015E
(3)
Low
2015E
(3)
High
Coke Sales (k tons)
1,755
2,410
2,460
Coke Adjusted EBITDA ($M)
(1)
143.5
$
180.0
$
190.0
$
Coke Adjusted EBITDA / ton
(1)
($/ton)
81.8
$
74.7
$
77.2
$
Coke
(ex. Granite City) |
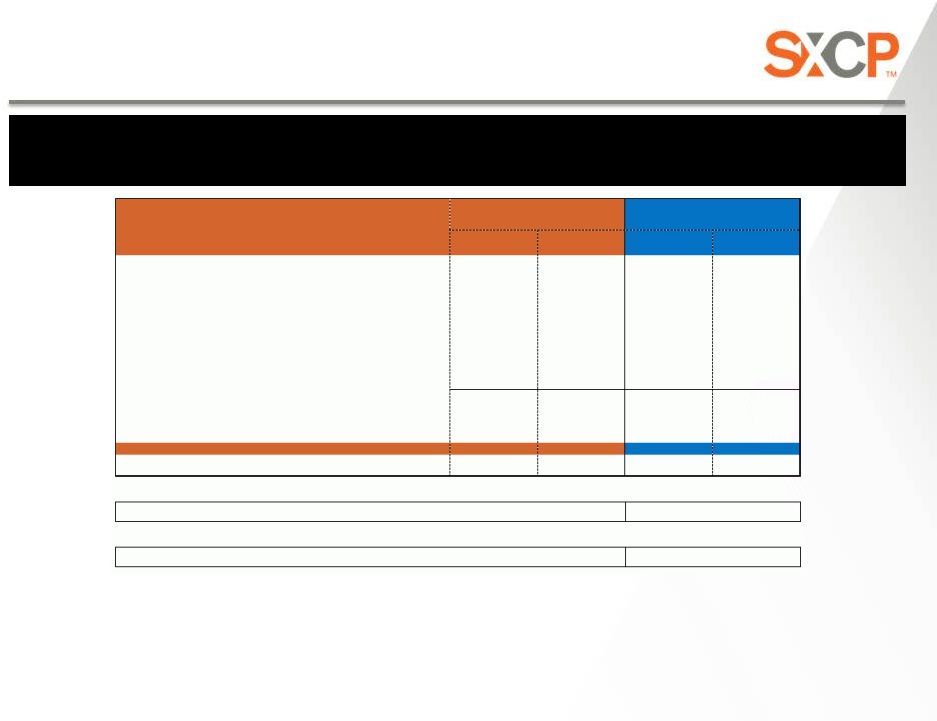 SXCP 2015 Outlook
Distributable cash flow outlook reflects Granite City dropdown benefit;
potential upside should we tighten our cash coverage ratio over time
SXCP Q4/ FY 2014 Earnings & 2015 Guidance Call
9
($ in millions, except per unit data)
As Reported
Proforma
(1)
Low
High
Adjusted EBITDA attributable to SXCP
$131
$146
$169
$179
Less:
Ongoing capital expenditures (SXCP share)
$15
$17
$17
$16
Accrual for replacement capital expenditures
5
6
7
7
Tax leakage
(2)
-
-
1
1
Cash interest
23
29
42
42
Estimated Distributable Cash Flow
$88
$95
$102
$113
Estimated Distributions
(3)
$82
$81
$95
$95
Total distribution cash coverage ratio
(4)
1.08x
1.17x
1.08x
1.19x
Coke Operating Performance (100% basis)
Coke Sales Tons (thousands)
1,755
1,755
2,410
2,460
Coal Logistics Operating Performance
Coal Tons Handled (thousands)
19,037
19,037
17,600
20,600
2014
2015 Outlook
Cash tax impact from the operations of Gateway Cogeneration Company LLC, which is an entity
subject to income taxes for federal and state purposes at the corporate level.
2015 guidance includes assumed distribution increases of 2% per quarter.
Total distribution cash coverage ratio is estimated distributable cash flow divided by total
estimated distributions. (1)
(2)
(3)
(4)
Proforma assumes dropdown of additional 33% interest in Haverhill and Middletown occurred
January 1, 2014, cash distributions of $0.5150 per unit for Q1 – Q2, $0.5275 for
Q3 and $0.5408 for Q4. Proforma also assumes no distributions to units issued in conjunction with the Granite City
dropdown (~1.9M units). For a reconciliation of guidance, please see appendix.
|
 Distribution Growth Outlook
Outperformed our 8% –
10% distribution growth target,
remain on track to achieve through 2016
$2.16
$1.90
2016E
Annualized DPU
Q4 ‘14
Annualized DPU
$2.40E -
$2.53E
Q4 ‘13
Annualized DPU
Q4 2013
Q1 2014
Q2 2014
Actual
($ per unit)
$0.4750
$0.5000
$0.5150
Q3 2014
$0.5275
SXCP Distribution Growth
8%
–
10%
Annual
Growth
$0.5408
SXCP Future Distribution Growth
Q4 2014
Other organic & acquisitive
opportunities
14%
SXCP Q4/ FY 2014 Earnings & 2015 Guidance Call
10
~$0.5854
Q4 2015E
Assumes 2015E
distribution growth
of 2% per quarter |
 Steel Fundamentals
11
SXCP Q4/ FY 2014 Earnings & 2015 Guidance Call
Recent capital markets sentiment & industry environment
has shifted negatively for steelmakers
US primary demand outlook reasonable
Steel pricing under pressure
On the other hand, commodity prices provide continued
tailwinds on carbon, scrap and, to an extent, iron ore
Customers continue to rationalize aged cokemaking capacity
•
Resilient automotive demand
•
Continued non-residential construction recovery
•
Expect challenges within tubular/oil & gas segment
•
Constructive industry consolidation in 2014 (e.g., TK, Severstal, Gallatin)
•
Elevated level of imports
•
Strong US dollar challenging domestic producers
•
Energy inputs also favorable |
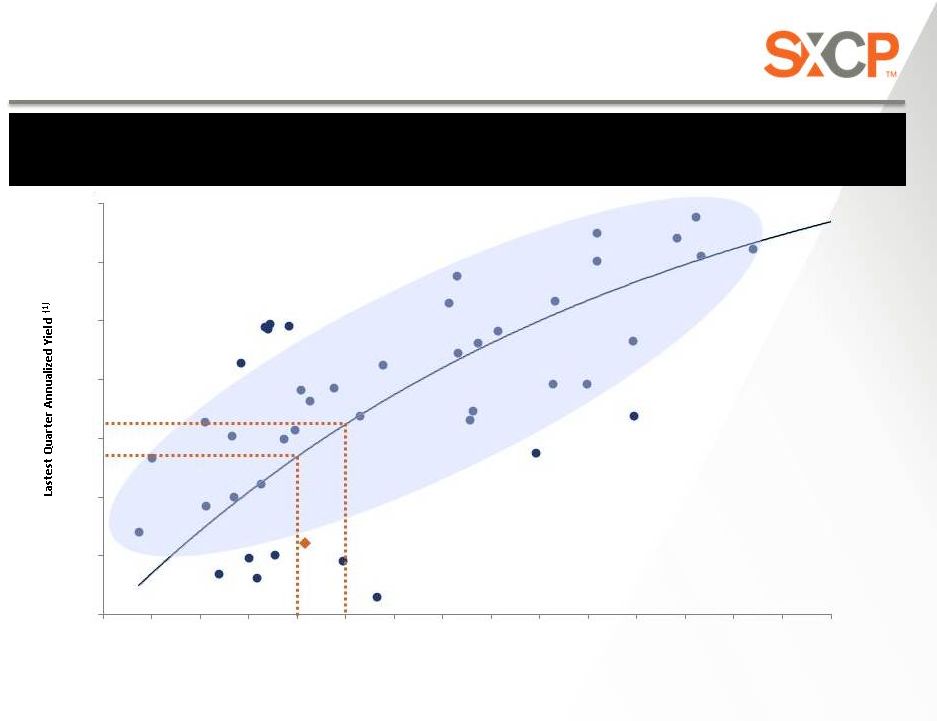 SXCP Valuation
12
SXCP Q4/ FY 2014 Earnings & 2015 Guidance Call
(1)
Represents LQA Yield as of 12/31/2014
(2)
Consensus estimates
SXCP trades at discount to other MLPs with
similar growth characteristics…
(2)
2.0 %
3.0 %
4.0 %
5.0 %
6.0 %
7.0 %
8.0 %
9.0 %
0.0 %
2.0 %
4.0 %
6.0 %
8.0 %
10.0 %
12.0 %
14.0 %
16.0 %
18.0 %
20.0 %
22.0 %
24.0 %
26.0 %
28.0 %
30.0 %
2014E -
2016E Distribution CAGR |
 SXCP Investment Thesis
13
SXCP Q4/ FY 2014 Earnings & 2015 Guidance Call
Visible Distribution
Outlook
Potential Growth
Opportunities
•
Well positioned to deliver 8% –
10%
cash distribution CAGR through 2016
from domestic coke dropdowns
alone
•
Company continues to pursue
organic and acquisitive growth
Strong Sponsor
Support
•
Customer and environmental risk
borne by SXC via omnibus agreement
Stable Cash Flows
•
Track record of delivering against
commitments since IPO
•
Minimal commodity risk
Significant Shareholder
Value Proposition
…however, compelling investment thesis remains intact |
 QUESTIONS
14
SXCP Q4/ FY 2014 Earnings & 2015 Guidance Call |
 Investor Relations
630-824-1987
630-824-1987
www.sxcpartners.com
www.sxcpartners.com |
 APPENDIX
16
SXCP Q4/ FY 2014 Earnings & 2015 Guidance Call |
 Definitions
17
SXCP Q4/ FY 2014 Earnings & 2015 Guidance Call
expiration of our nonconventional fuel tax credits in June 2012, EBITDA reflects sales
discounts included as a reduction in sales and other operating revenue. The sales
discounts represent the sharing with customers of a portion of nonconventional fuel tax credits, which reduce our
income tax expense. However, we believe our Adjusted EBITDA would be inappropriately penalized
if these discounts were treated as a reduction of EBITDA since they represent sharing
of a tax benefit that is not included in EBITDA. Accordingly, in computing Adjusted EBITDA, we
have added back these sales discounts. EBITDA and Adjusted EBITDA do not represent and should
not be considered alternatives to net income or operating income under GAAP and may not
be comparable to other similarly titled measures in other businesses. Management believes
Adjusted EBITDA is an important measure of the operating performance of the SXCP’s net
assets and provides useful information to investors because it highlights trends in our
business that may not otherwise be apparent when relying solely on GAAP measures and because it
eliminates items that have less bearing on our operating performance. Adjusted EBITDA is
a measure of operating performance that is not defined by GAAP, does not represent and
should not be considered a substitute for net income as determined in accordance with GAAP.
Calculations of Adjusted EBITDA may not be comparable to those reported by other companies.
•
Adjusted EBITDA
represents earnings before interest, taxes, depreciation and amortization
(“EBITDA”) adjusted for sales discounts. Prior to the •
EBITDA
represents
earnings
before
interest,
taxes,
depreciation
and
amortization.
•
Adjusted
EBITDA
attributable
to
SXC/SXCP
equals
Adjusted
EBITDA
less
Adjusted
EBITDA
attributable
to
noncontrolling
interests.
•
Adjusted
EBITDA/Ton
represents
Adjusted
EBITDA
divided
by
tons
sold. |
 Definitions
18
SXCP Q4/ FY 2014 Earnings & 2015 Guidance Call
•
Distributable
Cash
Flow
equals
Adjusted
EBITDA
less
net
cash
paid
for
interest
expense,
ongoing
capital
expenditures,
accruals
for
replacement
•
Ongoing
capital
expenditures
(“capex”)
are
capital
expenditures
made
to
maintain
the
existing
operating
capacity
of
our
assets
and/or
to
•
Replacement
capital
expenditures
(“capex”)
represents
an
annual
accrual
necessary
to
fund
SXCP’s
share
of
the
estimated
costs
to
replace
or
capital expenditures, and cash distributions to noncontrolling interests; plus amounts
received under the Omnibus Agreement and acquisition expenses deemed to be Expansion
Capital under our Partnership Agreement. Distributable Cash Flow is a non-GAAP supplemental financial
measure that management and external users of SXCP financial statements, such as industry
analysts, investors, lenders and rating agencies use to assess: •
SXCP's operating performance as compared to other publicly traded partnerships, without regard
to historical cost basis;
•
the ability of SXCP's assets to generate sufficient cash flow to make distributions to SXCP's
unitholders; •
SXCP's ability to incur and service debt and fund capital expenditures; and •
the viability of acquisitions and other capital expenditure projects and the returns on
investment of various investment opportunities.
extend their useful lives. Ongoing capex also includes new equipment that improves the
efficiency, reliability or effectiveness of existing assets. Ongoing capex does
not include normal repairs and maintenance, which are expensed as incurred, or significant capital expenditures. For
purposes of calculating distributable cash flow, the portion of ongoing capex attributable to
SXCP is used. rebuild our facilities at the end of their working lives. This accrual is estimated based on
the average quarterly anticipated replacement capital that we expect to incur over the
long term to replace our major capital assets at the end of their working lives. The replacement capex accrual
estimate will be subject to review and prospective change by SXCP’s general partner at
least annually and whenever an event occurs that causes a material adjustment of
replacement capex, provided such change is approved by our conflicts committee.
We believe that Distributable Cash Flow provides useful information to investors in assessing
SXCP's financial condition and results of operations. Distributable Cash Flow should
not be considered an alternative to net income, operating income, cash flows from operating activities, or any other
measure of financial performance or liquidity presented in accordance with generally accepted
accounting principles (GAAP). Distributable Cash Flow has important limitations as an
analytical tool because it excludes some, but not all, items that affect net income and net cash provided by operating
activities and used in investing activities. Additionally, because Distributable Cash Flow may
be defined differently by other companies in the industry, our definition of
Distributable Cash Flow may not be comparable to similarly titled measures of other companies, thereby diminishing their utility. |
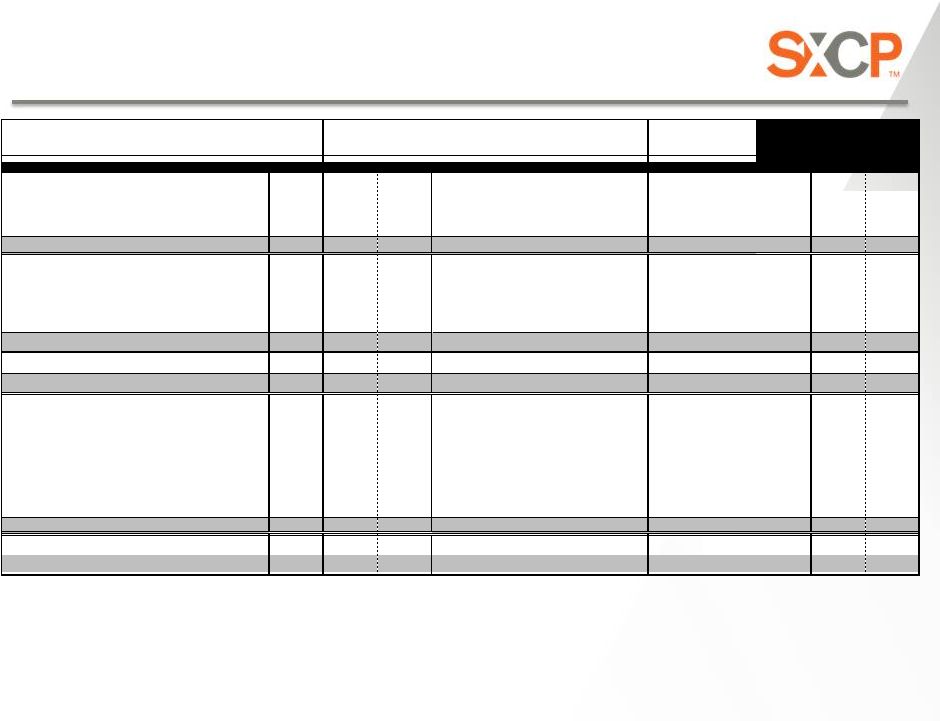   Adjusted EBITDA and Distributable Cash
Flow Reconciliations
19
SXCP Q4/ FY 2014 Earnings & 2015 Guidance Call
As
Reported
As
Reported
Proforma
As
Reported
As
Reported
As
Reported
As
Reported
Proforma
Proforma
Proforma
As
Reported
Proforma
($ in millions)
Q4 ‘13
FY ‘13
FY ‘13
(1,2)
Q1 ‘14
Q2 ‘14
Q3 ‘14
Q4 ‘14
Q1 ‘14
(1,3)
Q2 ‘14
(1,3)
Q4 ‘14
(1,4)
FY ‘14
FY ‘14
(1,3,4)
Net cash provided by operating activities
60.6
$
130.3
$
130.1
$
14.6
$
37.9
$
19.0
$
36.7
$
13.6
$
37.5
$
36.7
$
108.2
$
106.8
$
Depreciation and amortization expense
(9.5)
(33.0)
(33.0)
(9.7)
(10.2)
(10.2)
(10.5)
(9.7)
(10.2)
(10.5)
(40.6)
(40.6)
Changes in working capital and other
(23.0)
5.6
5.6
18.2
(6.5)
12.0
(4.2)
13.6
(8.5)
(4.2)
19.5
12.9
Loss on Debt Extinguishment
-
-
-
-
(15.4)
-
-
(15.4)
-
-
(15.4)
(15.4)
Net income
28.1
$
102.9
$
102.7
$
23.1
$
5.8
$
20.8
$
22.0
$
2.1
$
18.8
$
22.0
$
71.7
$
63.7
$
Add:
Depreciation and amortization expense
9.5
33.0
33.0
9.7
10.2
10.2
10.5
9.7
10.2
10.5
40.6
40.6
Interest expense, net
3.1
15.4
15.4
2.9
20.4
6.8
7.0
22.9
7.0
7.0
37.1
43.7
Income tax expense
0.3
4.5
4.5
0.3
0.2
0.5
0.2
0.3
0.2
0.2
1.2
1.2
Sales discounts
-
(0.6)
(0.6)
-
-
-
-
-
-
-
-
Adjusted EBITDA
41.0
$
155.2
$
155.0
$
36.0
$
36.6
$
38.3
$
39.7
$
35.0
$
36.2
$
39.7
$
150.6
$
149.2
$
Adjusted EBITDA attributable to NCI
(13.4)
(51.7)
(55.1)
(12.4)
(5.8)
(0.7)
(0.8)
(0.7)
(0.7)
(0.8)
(19.7)
(2.9)
Adjusted EBITDA attributable to Predecessor/SXCP
27.6
$
103.5
$
99.9
$
23.6
$
30.8
$
37.6
$
38.9
$
34.3
$
35.5
$
38.9
$
130.9
$
146.3
$
Less:
Adjusted EBITDA attributable to Predecessor
-
(9.7)
-
Ongoing capex (SXCP share)
(5.0)
(9.1)
(9.2)
(2.7)
(4.7)
(4.6)
(3.2)
(3.9)
(5.4)
(3.2)
(15.2)
(17.1)
Replacement capex accrual
(0.9)
(3.4)
(3.6)
(0.9)
(1.2)
(1.4)
(1.4)
(1.4)
(1.4)
(1.4)
(4.9)
(5.6)
Cash interest accrual
(3.1)
(11.1)
(11.7)
(3.1)
(5.5)
(7.2)
(7.1)
(7.2)
(7.2)
(7.1)
(22.9)
(28.7)
Make whole payment
0.3
0.9
0.9
-
-
-
-
-
-
-
-
Payment to DTE Energy Corporation in connection
with the Lake Terminal acquisition
-
1.8
1.8
-
-
-
-
-
-
-
-
Distributable cash flow
18.9
$
72.9
$
78.1
$
16.9
$
19.4
$
24.4
$
27.2
$
21.8
$
21.5
$
27.2
$
87.9
$
94.9
$
Quarterly Cash Distribution
15.2
52.4
55.8
19.2
19.8
20.5
22.2
19.8
19.9
21.2
81.7
81.4
Distribution Cash Coverge Ratio
(5)
1.24x
1.39x
1.40x
0.88x
0.98x
1.19x
1.23x
1.10x
1.08x
1.28x
1.08x
1.17x
Proforma adjustments made for changes in EBITDA and ongoing capex attributable to the
partnership, cash interest costs, replacement capital accruals, Corporate cost
allocations, distribution levels and units outstanding. Proforma 2013 assuming closing of SXCP IPO effective January 1, 2013.
Proforma assumes dropdown of additional 33% interest in Haverhill and Middletown occurred
January 1, 2014. Distribution based on quarterly distribution amount of
$0.5150/unit and then current units outstanding. Proforma also assumes no distributions
to units issued in conjunction with the Granite City dropdown (~1.9M units).
Distribution cash coverage ratio is distributable cash flow divided by total estimated
distributions to the limited and general partners. (1)
(2)
(3)
(4)
(5) |
  2014
EBITDA Reconciliation 20
SXCP Q4/ FY 2014 Earnings & 2015 Guidance Call
($ in millions)
As Reported
FY 2014
Net Income
72
$
63
$
Depreciation and amortization
41
41
Interest expense, net
37
44
Income tax expense
1
1
Adjusted EBITDA
151
$
149
$
EBITDA attributable to noncontrolling interest
(20)
(3)
Adjusted EBITDA attributable to
SXCP 131
$
146
$
Less:
Ongoing capex (SXCP share)
(15)
(17)
Replacement capex accrual
(5)
(6)
Cash interest accrual
(23)
(29)
Distributable cash flow
88
$
95
$
Proforma
FY 2014
(1,2)
(1)
Proforma adjustments made for changes in EBITDA and ongoing capex attributable to the
partnership, cash interest costs, replacement capital accruals, Corporate cost
allocations, distribution levels and units outstanding.
(2)
Proforma assumes dropdown of additional 33% interest in Haverhill and Middletown occurred
January 1, 2014, cash distributions of $0.5150 per unit for Q1 – Q2, $0.5275 for
Q3 and $0.5408 for Q4. Proforma also assumes no distributions
to units issued in conjunction with the Granite City dropdown (~1.9M units). For a reconciliation of guidance, please see
appendix.
|
 Expected 2015E EBITDA Reconciliation
21
SXCP Q4/ FY 2014 Earnings & 2015 Guidance Call
(1)
Adjusted EBITDA attributable to non-controlling interest represents SXC’s 2%
interest in Haverhill and Middletown’s projected Adjusted EBITDA and 25% interest
in Granite City ‘s projected Adjusted EBITDA for 2015E post dropdown date of January 13, 2015.
(2)
Cash tax impact from the operations of Gateway Cogeneration Company LLC, which is an entity
subject to income taxes for federal and state purposes at the corporate level.
($ in millions)
2015E
Low
2015E
High
Net Income
69
$
79
$
Depreciation and amortization
57
57
Interest expense, net
56
56
Income tax expense
1
1
Adjusted EBITDA
183
$
193
$
EBITDA attributable to noncontrolling interest
(1)
(14)
(14)
Adjusted EBITDA attributable to SXCP
169
$
179
$
Less:
Ongoing capex (SXCP share)
(17)
(16)
Replacement capex accrual
(7)
(7)
Cash interest accrual
(42)
(42)
Cash Taxes
(2)
(1)
(1)
Distributable cash flow
102
$
113
$
|
  2015E
Capital Expenditures 22
SXCP Q4/ FY 2014 Earnings & 2015 Guidance Call
100% Basis
($ in millions)
2014
2015E
(2)
Ongoing
$17
$17
Environmental Remediation
(1)
45
29
Prefunded from dropdown
proceeds
Expansion
- 6
Total CapEx
$62
$52
(1)
2015E Environmental Remediation cost of gas sharing at Haverhill (~$9 million) and Granite
City (~$20 million). These amounts have been pre-funded from dropdown
proceeds. (2) Includes Granite City. |