Attached files
| file | filename |
|---|---|
| 8-K - 8-K - TOTAL SYSTEM SERVICES INC | d860037d8k.htm |
| EX-99.1 - EX-99.1 - TOTAL SYSTEM SERVICES INC | d860037dex991.htm |
 2014
Fourth Quarter and YTD Results January 27, 2015
Exhibit 99.2
©2015 Total System Services, Inc.® Proprietary. All rights reserved worldwide. |
 ©2015 Total
System Services, Inc.® Proprietary. All rights reserved worldwide.
Forward-Looking Statements
2
This presentation and comments made by management contain forward-
looking
statements
including,
among
others,
statements
regarding
the
expected future operating results of TSYS. These statements are
based on
management’s current expectations and assumptions and are subject to
risks, uncertainties and changes in circumstances. Forward-looking
statements include all statements that are not historical facts and can be
identified by the use of forward-looking terminology such as the words
“believe,”
“expect,”
“anticipate,”
“intend,”
“plan,”
“potential”, “estimate”
or
similar expressions. Actual results may differ materially from those set
forth in the forward-looking statements due to a variety of
factors. More information about these risks, uncertainties and factors
may be found in TSYS’
filings with the Securities and Exchange Commission, including its
2013 Annual Report on Form 10-K. TSYS does not assume any obligation
to update any forward-looking statements as a result of new information,
future developments or otherwise. |
 ©2015 Total
System Services, Inc.® Proprietary. All rights reserved worldwide.
Use of Non-GAAP Financial Measures
3
This slide presentation contains certain non-GAAP financial measures
determined by methods other than in accordance with generally accepted
accounting principles. Such non-GAAP financial measures include the
following: revenues before reimbursable items; operating margin excluding
reimbursable items; revenues measured on a constant currency basis; free
cash flow; EBITDA, adjusted EBITDA, adjusted earnings per share,
adjusted
segment operating income and adjusted segment operating margin. The most
comparable GAAP measures to these measures are revenues; operating
margin; revenues; cash flows from operating activities; net income; net income;
earnings per share, operating income and operating margin, respectively.
Management uses these non-GAAP financial measures to assess the
performance of TSYS’
core business. TSYS believes that these non-GAAP
financial measures provide meaningful additional information about TSYS to
assist investors in evaluating TSYS’
operating results. These non-GAAP
financial measures should not be considered as a substitute for operating
results determined in accordance with GAAP and may not be comparable to
other similarly titled measures of other companies. The computations of the
non-GAAP financial measures used in this slide presentation are set forth in
the Appendix to this slide presentation. |
 ©2015 Total
System Services, Inc.® Proprietary. All rights reserved worldwide.
Troy Woods
President & Chief Executive Officer |
 ©2015 Total
System Services, Inc.® Proprietary. All rights reserved worldwide.
Paul Todd
Chief Financial Officer |
 ©2015 Total
System Services, Inc.® Proprietary. All rights reserved worldwide.
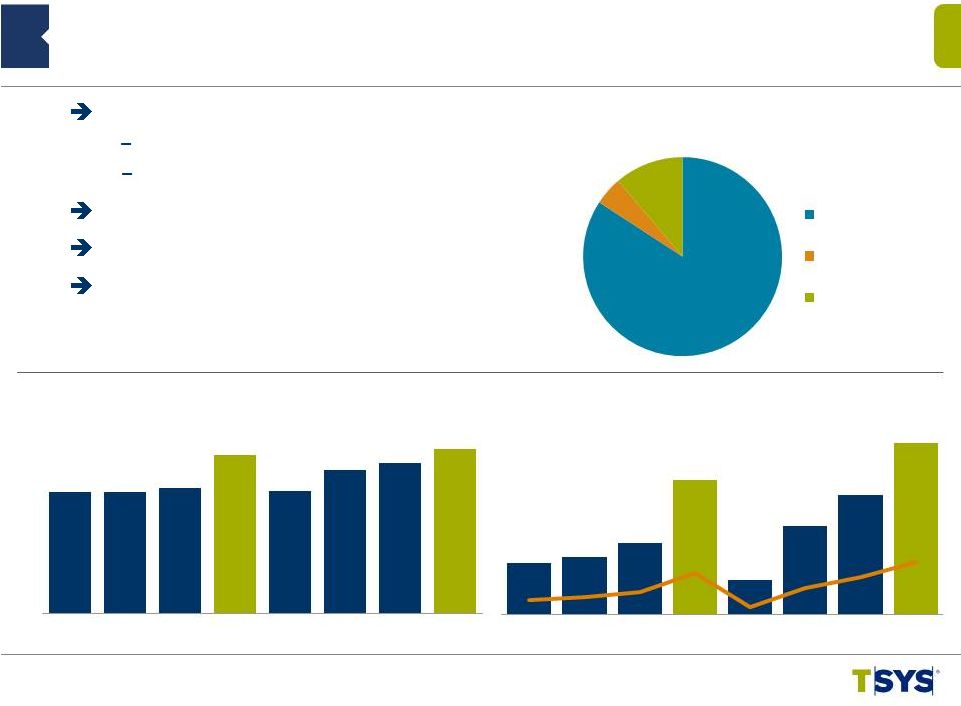
4Q 2014 North America Segment Highlights
6
($ in millions)
(*) Revenues Before Reimbursable Items
($ in millions)
0.8%
4.4%
4.5%
6.8%
Adjusted Segment Operating Income
Operating Margin
(1)
Includes Credit, Debit,
Retail, Prepaid & Loyalty
(2)
Includes Healthcare
9.1%
Historical High Revenue
Second Straight Quarter of Double Digit
Growth
Largest Quarter and Year of Operating Income
8.7%
10.9%
14.5%
Segment Revenue by Line of Business*
Consumer (1)
Commercial (2)
Other
$68.7
$81.3
$84.4
$87.1
$74.6
$84.6
$92.7
$99.6
33.4%
37.9%
38.9%
39.0%
33.2%
36.3%
38.5%
39.0%
1Q13
2Q13
3Q13
4Q13
1Q14
2Q14
3Q14
4Q14
$205.6
$214.5
$217.3
$223.3
$224.4
$233.2
$241.0
$255.5
1Q13
2Q13
3Q13
4Q13
1Q14
2Q14
3Q14
4Q14
Segment
Revenue*
YOY Growth %
3%
75%
22%
* |
 ©2015 Total
System Services, Inc.® Proprietary. All rights reserved worldwide.
4Q 2014 North America Segment Highlights
7
(*) Growth
Excluding
Prepaid,
Government
Services
and
Single
Use
Accounts
(in millions)
(in millions)
5.2%
6.3%
16.2%
16.5%
16.9%
11.2%
11.6%
13.4%
7.8%
11.5%
17.6%
13.4%
15.6%
17.2%
17.1%
Six Straight Quarters of Double Digit Growth in Traditional Accounts on File*
Largest Quarter and Year of Transaction Volume
Same Client Transactions up 13.0%
18.5%
19.1%
20.7%
17.4%
18.1%
18.3%
14.1%
16.6%
19.8%
2,013.4
2,235.0
2,395.8
2,488.6
2,327.6
2,696.7
2,833.6
2,980.0
1Q13
2Q13
3Q13
4Q13
1Q14
2Q14
3Q14
4Q14
Transaction Volume
YOY Growth %
422.8
430.7
461.4
481.9
495.5
510.3
541.4
550.0
1Q13
2Q13
3Q13
4Q13
1Q14
2Q14
3Q14
4Q14
Accounts on File
YOY Growth % |
 ©2015 Total
System Services, Inc.® Proprietary. All rights reserved worldwide.
Adjusted Segment Operating Income
5%
11%
4Q 2014 International Segment Highlights
8
($ in millions)
(*) Revenues Before Reimbursable Items
($ in millions)
(2.6%)
(4.0%)
0.7%
(0.9%)
3.1%
9.0%
8.6%
84%
0.5%
(4.6%)
Revenue $92.9M* –
Up 2.5%
Up 5.7% on Constant Currency
($2.9M) of Currency Impact
Processing Revenue Up in All Geographies
Margin Expansion Continues
Extended Relationship with Carrefour
(1.0%)
10.6%
1.8%
12.2%
4.4%
2.5%
5.7%
Reported
Constant
Currency
Segment Revenue by Region
QTD
Europe
MEA
Rest Of World
$76.4
$76.6
$77.9
$90.6
$76.8
$84.7
$87.4
$92.9
1Q13
2Q13
3Q13
4Q13
1Q14
2Q14
3Q14
4Q14
Segment
Revenue*
YOY Growth %
$6.9
$7.7
$9.5
$18.0
$4.6
$11.7
$16.0
$22.8
9.0%
10.0%
12.2%
19.9%
5.9%
13.9%
18.3%
24.6%
1Q13
2Q13
3Q13
4Q13
1Q14
2Q14
3Q14
4Q14
Operating
Margin
* |
 4Q
2014 International Segment Highlights 9
(in millions)
(in millions)
3.7%
9.9%
12.1%
8.5%
14.2%
23.3%
26.7%
17.3%
8.9%
19.3%
Same Client Transactions Grew 11.8%
7.5%
13.4%
8.1%
9.3%
12.7%
11.3%
©2015 Total System Services, Inc.® Proprietary. All rights reserved worldwide. 434.0
492.4
525.5
555.6
517.9
558.1
574.3
618.1
1Q13
2Q13
3Q13
4Q13
1Q14
2Q14
3Q14
4Q14
Transaction Volume
YOY Growth%
55.7
58.0
59.2
59.1
60.7
62.3
64.1
66.6
1Q13
2Q13
3Q13
4Q13
1Q14
2Q14
3Q14
4Q14
Accounts on File
YOY Growth% |
 ©2015 Total
System Services, Inc.® Proprietary. All rights reserved worldwide.
Revenues Decreased 2.4%*
-
Direct Up 2.6% with Continued Focus on Growth
Initiatives
-
Indirect Down (9.1)% But Exceeded Expectations
Industry Veteran Hired to Lead TSYS Merchant
Solutions
4Q 2014 Merchant Segment Highlights
10
(*) Revenues Before Reimbursable Items
($ in millions)
11.1%
15.6%
5.4%
4.3%
Adjusted Segment Operating Income
($ in millions)
41%
59%
(4.3%)
(4.1%)
1.2%
(2.4%)
Segment Revenue by Mix*
QTD
Direct
Indirect
$109.3
$113.0
$113.6
$110.4
$104.6
$108.3
$115.0
$107.7
1Q13
2Q13
3Q13
4Q13
1Q14
2Q14
3Q14
4Q14
Segment
Revenue*
YOY Growth %
$37.6
$41.3
$40.8
$36.0
$30.2
$32.9
$40.4
$31.4
34.4%
36.6%
35.9%
32.6%
28.8%
30.4%
35.1%
29.2%
1Q13
2Q13
3Q13
4Q13
1Q14
2Q14
3Q14
4Q14
Operating Margin* |
 ©2015 Total
System Services, Inc.® Proprietary. All rights reserved worldwide.
11
4Q 2014 Merchant Segment Highlights
(*) Excludes Managed Accounts
Segment Revenue by LOB
YOY Growth %
($ in billions)
35.3%
40.6%
22.0%
11.1%
(12%)
45%
55%
26%
22%
(11%)
(12%)
(12%)
($ in millions)
4%
(14%)
9.3%
POS Transactions Increased 4.4%, Excluding Deconverted Accounts
SBS Sales Volume Up 10.6%
Continued Investment in Product and Service Offerings
8.2%
1%
(10%)
4%
(2%)
10.0%
10.6%
(9%)
3%
$52
$51
$51
$48
$45
$46
$50
$44
$57
$62
$63
$62
$59
$62
$65
$64
1Q13
2Q13
3Q13
4Q13
1Q14
2Q14
3Q14
4Q14
Indirect
Direct
$4.8
$5.3
$5.3
$5.2
$5.3
$5.8
$5.9
$5.7
1Q13
2Q13
3Q13
4Q13
1Q14
2Q14
3Q14
4Q14
SBS
Sales Volume
*
YOY Growth % |
 Adjusted Segment Operating Income*
Operating Margin
Segment Revenue
YOY Growth %
4Q 2014 NetSpend Segment Highlights
12
($ in millions)
Revenue $119.2M –
Up 14.4%
Added 5k Distributing Locations and
Employers
Bringing the Total to Over 85k
Launched WalMart in Retail Channel
($ in millions)
(*NOTE: Periods prior to the acquisition by TSYS have been restated )
$28.0
$29.3
$34.6
$31.7
$28.7
$30.7
$36.1
$32.7
23.9%
27.9%
33.4%
30.5%
21.7%
26.3%
31.7%
27.5%
1Q13
2Q13
3Q13
4Q13
1Q14
2Q14
3Q14
4Q14
$117.3
$104.9
$103.7
$104.1
$132.6
$116.8
$114.0
$119.2
28.3%
22.9%
22.2%
16.1%
13.1%
11.4%
10.0%
14.4%
1Q13
2Q13
3Q13
4Q13
1Q14
2Q14
3Q14
4Q14
Segment Revenue by Channel
QTD
Partner
Retail
Direct
Paycard
10%
42%
34%
14%
©2015 Total System Services, Inc.® Proprietary. All rights reserved worldwide. * |
 4Q
2014 NetSpend Segment Highlights 13
Gross Dollar Volume
YOY Growth %
Direct Deposit Active Cards
YOY Growth %
Direct Deposit Active Cards up 21.9%
Gross Dollar Volume (GDV) up 18.2%
Full Year 2014 Exceeded $20 Billion
(in thousands)
($ in millions)
66.7%
42.3%
23.8%
22.1%
42.8%
30.1%
22.4%
21.2%
17.6%
20.6%
21.9%
21.5%
22.1%
17.2%
16.6%
18.2%
$5,378.7
$3,947.9
$3,780.9
$3,967.6
$6,567.2
$4,628.0
$4,409.3
$4,691.5
1Q13
2Q13
3Q13
4Q13
1Q14
2Q14
3Q14
4Q14
1,707.9
1,361.4
1,261.1
1,321.1
2,070.3
1,600.7
1,520.7
1,610.2
1Q13
2Q13
3Q13
4Q13
1Q14
2Q14
3Q14
4Q14
©2015 Total System Services, Inc.® Proprietary. All rights reserved worldwide. |
 ©2015 Total
System Services, Inc.® Proprietary. All rights reserved worldwide.
Consolidated Selected Financial Highlights
14
$635,104
$583,103
8.9%
Total Revenues
$2,446,877
$2,064,305
18.5%
569,301
525,259
8.4
Revenues Before Reimbursable Items
2,192,978
1,823,708
20.2
193,738
181,097
7.0
Adjusted EBITDA*
712,267
624,093
14.1
$0.58
$0.48
20.8
Adjusted EPS* from Continuing
Operations
$1.96
$1.73
13.2
(in
thousands,
except
per
share
data)
4
Qtr
2014
4
Qtr
2013
Percent
Change
YTD
2014
YTD
2013
Percent
Change
(*) Adjusted EBITDA and Adjusted EPS definitions are contained in Appendix
th
th |
 ©2015 Total
System Services, Inc.® Proprietary. All rights reserved worldwide.
Revenues before
Reimbursable
Items
Adjusted
Operating Margin
Adjusted
Segment
Operating Income
North America
$99,620
$255,539
38.98%
International
22,849
92,895
24.60%
Merchant
31,399
107,677
29.16%
NetSpend
32,742
119,165
27.48%
Eliminations
--
(5,975)
Corporate administration excluding stock comp
(31,897)
--
Adjusted operating margin
$154,713
$569,301
27.18%
Amortization of acquisition intangibles
(24,166)
NetSpend M&A expenses
(3)
Stock-based compensation
(7,771)
Operating income (US GAAP)
$122,773
Segment Operating Margin and Consolidated
Adjusted Operating Margin
(in thousands)
15
Three Months Ended December 31, 2014 |
 ©2015 Total
System Services, Inc.® Proprietary. All rights reserved worldwide.
Revenues before
Reimbursable
Items
Adjusted
Operating Margin
Adjusted
Segment
Operating Income
North America
$351,512
$954,082
36.84%
International
55,123
341,785
16.13%
Merchant
134,872
435,649
30.96%
NetSpend
128,285
482,686
26.58%
Eliminations
--
(21,224)
Corporate administration excluding stock comp
(107,175)
--
Adjusted operating margin
$562,617
$2,192,978
25.66%
Amortization of acquisition intangibles
(96,971)
NetSpend M&A expenses
(3,217)
Stock-based compensation
(30,790)
Operating income (US GAAP)
$431,639
Segment Operating Margin and Consolidated
Adjusted Operating Margin
(in thousands)
16
Twelve Months Ended December 31, 2014 |
 Rollforward of Quarterly Cash Balance
$200
$500
$100
$0
$300
Operating
Activities
$171
Cap Ex
($68)
Debt Pmts
($21)
Dividends
($19)
Ending
Balance
$289
(in millions)
9/30/2014
12/31/2014
17
$400
Share
Repurchase
($50)
Beginning
Balance
$266
Other
($10)
©2015 Total System Services, Inc.® Proprietary. All rights reserved worldwide. |
 ©2015 Total
System Services, Inc.® Proprietary. All rights reserved worldwide.
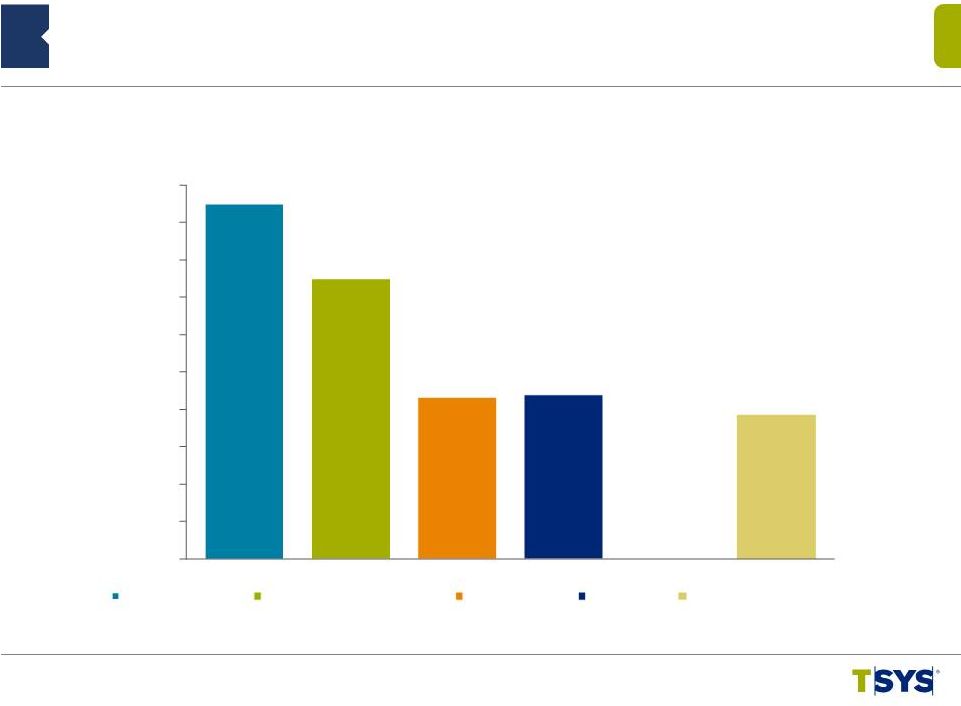
Cash Flow Strength:
2014 Consolidated Financial Highlights
18
(in millions)
$712
$561
$325
$329
$289
$0
$75
$150
$225
$300
$375
$450
$525
$600
$675
$750
Adjusted EBITDA
Cash flow from operations
Free cash flow
Net income
Ending cash |
 ©2015 Total
System Services, Inc.® Proprietary. All rights reserved worldwide.
2015 Guidance*
Range
Range
Percent Change
Total Revenues
$2,620
to
$2,660
to
Revenues Before Reimbursable Items
$2,370
to
$2,410
8%
to
10%
Adjusted EPS attributable to TSYS common
shareholders from continuing operations
$2.17
to
$2.21
11%
to
13%
Average Basic Weighted Shares
186
(in millions, except per share data)
19
(*) See Appendix for guidance assumptions
7%
9% |
 Q&A
©2015 Total System Services, Inc.® Proprietary. All rights reserved worldwide. |
 Appendix
©2015 Total System Services, Inc.® Proprietary. All rights reserved worldwide. |
 ©2015 Total
System Services, Inc.® Proprietary. All rights reserved worldwide.
Appendix: Non-GAAP Items –
Adjusted EBITDA
and Adjusted EPS
•
Adjusted EBITDA is net income excluding equity in income of equity investments,
nonoperating income/(expense), taxes, depreciation, amortization and
stock-based compensation expenses and NetSpend merger & acquisition expenses.
•
Adjusted EPS is adjusted earnings divided by weighted average shares outstanding
used for basic EPS calculations. Adjusted earnings is net income excluding
the after-tax impact of stock-based compensation expenses, amortization of acquisition intangibles, and NetSpend
merger & acquisition expenses.
•
Adjusted segment operating income is operating income at the segment level adjusted
for amortization of acquisition intangibles. •
Adjusted segment operating margin is adjusted segment operating income divided by
segment revenues before reimbursable items. •
The Company believes that these non-GAAP financial measures it presents are
useful to investors in evaluating the Company’s operating performance
for the following reasons: –
adjusted
EBITDA
and
adjusted
EPS
are
widely
used
by
investors
to
measure
a
company’s
operating
performance
without
regard
to
items,
such
as interest expense, income tax expense, depreciation and amortization, merger and
acquisition expenses and employee stock-based compensation
expense
that
can
vary
substantially
from
company
to
company
depending
upon
their
respective
financing
structures
and
accounting policies, the book values of their assets, their capital structures and
the methods by which their assets were acquired; and –
securities analysts use adjusted EBITDA and adjusted EPS as supplemental measures
to evaluate the overall operating performance of companies.
•
By comparing the Company’s adjusted EBITDA and adjusted EPS in different
historical periods, investors can evaluate the Company’s operating
results without the additional variations caused by employee stock-based compensation expense, which may not be comparable
from
period
to
period
due
to
changes
in
the
fair
market
value
of
the
Company’s
common
stock
(which
is
influenced
by
external
factors
like
the volatility of public markets and the financial performance of the
Company’s peers) and is not a key measure of the Company’s
operations.
•
The Company’s management uses the non-GAAP financial measures:
–
as measures of operating performance, because they exclude the impact of items not
directly resulting from the Company’s core operations; –
for planning purposes, including the preparation of the Company’s annual
operating budget; –
to allocate resources to enhance the financial performance of the Company’s
business; –
to evaluate the effectiveness of the Company’s business strategies; and
–
in communications with the Company’s board of directors concerning the
Company’s financial performance. 22 |
 ©2015 Total
System Services, Inc.® Proprietary. All rights reserved worldwide.
Consumer Credit
270.0
228.9
18.0
270.0
263.9
2.3
Retail
28.4
27.8
2.2
28.4
28.4
0.1
Total Consumer
298.4
256.7
16.3
298.4
292.3
2.1
Commercial
41.6
39.9
4.2
41.6
41.5
0.1
Other
22.4
18.9
18.7
22.4
21.2
5.7
Subtotal
362.4
315.5
14.9
362.4
355.0
2.1
Prepaid*/
Stored Value
127.3
118.0
7.9
127.3
125.1
1.8
Government
Services
67.4
62.2
8.2
67.4
66.7
1.0
Commercial Card
Single Use
59.6
45.3
31.5
59.6
58.7
1.5
Total AOF
616.7
541.0
14.0
616.7
605.5
1.8
Appendix: Accounts on File Portfolio Summary
(in millions)
Dec
2014
Dec
2013
%
Change
Dec
2014
Sep
2014
%
Change
23
(* -
Prepaid does not include NetSpend accounts) |
 ©2015 Total
System Services, Inc.® Proprietary. All rights reserved worldwide.
Appendix: Non-GAAP Reconciliation –
Revenues Before Reimbursable Items
Three Months
Ended Twelve Months Ended
Total Revenues
$635,104
$583,103
$2,446,877
$2,064,305
Reimbursable Items
65,803
57,844
253,899
240,597
Revenues Before Reimbursable Items
$569,301
$525,259
$2,192,978
$1,823,708
(in thousands)
24
12/31/14
12/31/13
12/31/14
12/31/13 |
 ©2015 Total
System Services, Inc.® Proprietary. All rights reserved worldwide.
Appendix: Non-GAAP Reconciliation –
Adjusted
Segment Operating Income and Operating Margin
Three Months
Ended Twelve Months Ended
(in thousands)
25
12/31/14
12/31/13
12/31/14
12/31/13
Operating income
$122,773
$108,858
$431,639
$382,500
Add: Acquisition intangible amort
24,166
24,751
96,971
65,893
Add: Corporate admin and other
39,671
39,176
141,182
137,290
Total segment adjusted operating income
$186,610
$172,785
$669,792
$585,683
By segment: North America services (a)
$99,620
$87,110
$351,512
$321,619
International services (b)
$22,849
$17,986
$55,123
$42,068
Merchant services (c)
$31,399
$35,952
$134,872
$155,643
NetSpend (d)
$32,742
$31,737
$128,285
$66,353
Total revenues
$635,104
$583,103
$2,446,877
$2,064,305
Reimbursable items
(65,803)
(57,844)
(253,899)
(240,597)
Total segment revenues before reimbursable items
$569,301
$525,259
$2,192,978
$1,823,708
Intersegment revenues
5,975
3,121
21,224
12,549
By segment: North America services (e)
$255,539
$223,266
$954,082
$860,645
International services (f)
$92,895
$90,595
$341,785
$321,484
Merchant services (g)
$107,677
$110,375
$435,649
$446,278
NetSpend (h)
$119,165
$104,144
$482,686
$207,850
Adjusted segment operating margin:
North America services (a) / (e)
38.98%
39.02%
36.84%
37.37%
International services (b) / (f)
24.60%
19.85%
16.13%
13.09%
Merchant services (c) / (g)
29.16%
32.57%
30.96%
34.88%
NetSpend (d) / (h)
27.48%
30.47%
26.58%
31.92% |
 ©2015 Total
System Services, Inc.® Proprietary. All rights reserved worldwide.
Twelve
Months Ended
12/31/14 12/31/13
Percentage
Change
Three
Months Ended
12/31/14 12/31/13
Percentage
Change
Appendix: Non-GAAP Reconciliation –
Constant Currency
(1) Reflects current period results on a non-GAAP basis as if foreign currency
rates did not change from the comparable prior year period. (2) Reflects the
impact of calculated changes in foreign currency rates from the comparable period.
(in thousands)
Consolidated:
Constant Currency (1)
$638,111
$583,103
9.4%
$2,431,947
$2,064,305
17.8%
Foreign Currency (2)
(3,007)
---
14,930
---
Total Revenues
$635,104
$583,103
8.9%
$2,446,877
$2,064,305
18.5%
International Services:
Constant Currency (1)
$101,655
$96,129
5.7%
$348,595
$341,549
2.1%
Foreign Currency (2)
(3,005)
---
14,764
---
Total Revenues
$98,650
$96,129
2.6%
$363,359
$341,549
6.4%
26 |
 ©2015 Total
System Services, Inc.® Proprietary. All rights reserved worldwide.
Twelve
Months Ended
12/31/14 12/31/13
Percentage
Change
Three
Months Ended
12/31/14 12/31/13
Percentage
Change
Appendix: Non-GAAP Reconciliation –
Constant Currency
(1) Reflects current period results on a non-GAAP basis as if foreign currency
rates did not change from the comparable prior year period. (2) Reflects the
impact of calculated changes in foreign currency rates from the comparable period.
(in thousands)
27
Consolidated:
Constant Currency (1)
$572,166
$525,259
8.9%
$2,178,951
$1,823,708
19.5%
Foreign Currency (2)
(2,865)
---
14,027
---
Revenues before
reimbursable items
$569,301
$525,259
8.4%
$2,192,978
$1,823,708
20.2%
International Services:
Constant Currency (1)
$95,758
$90,595
5.7%
$327,923
$321,484
2.0%
Foreign Currency (2)
(2,863)
---
13,862
---
Revenues before
reimbursable items
$92,895
$90,595
2.5%
$341,785
$321,484
6.3% |
 Appendix: Non-GAAP Reconciliation –
EBITDA and Adjusted EBITDA
(in thousands)
28
Three Months Ended
Twelve Months Ended
Dec
2014
Dec
2013
Dec
2014
Dec
2013
Net income :
As reported (GAAP) (a)
$81,242
$69,393
$329,406
$256,597
Adjusted for:
Add/(Deduct): Loss/(Income) from
discontinued operations
3,338
(751)
(48,655)
(2,055)
Deduct: Equity in Income of Equity
Investments
(5,751)
(3,691)
(17,583)
(13,047)
Add: Income Taxes
35,428
33,435
129,761
110,981
Add: Nonoperating expenses
8,516
10,472
38,711
30,024
Add: Depreciation and
amortization
63,191
61,268
246,620
199,026
EBITDA
$185,964
$170,126
$678,260
$581,526
Adjust for:
Add: Share-based compensation
7,771
9,345
30,790
28,933
Add: NetSpend M&A expenses
3
1,626
3,217
13,634
Adjusted EBITDA
$193,738
$181,097
$712,267
$624,093
©2015 Total System Services, Inc.® Proprietary. All rights reserved worldwide. |
 ©2015 Total
System Services, Inc.® Proprietary. All rights reserved worldwide.
Appendix: Non-GAAP Reconciliation –
Adjusted EPS
(in thousands)
29
Three Months Ended
Twelve Months Ended
Dec
2014
Dec
2013
Dec
2014
Dec
2013
Income from continuing operations available to
TSYS Common Shareholders:
As reported (GAAP) (a)
$83,198
$66,058
$275,216
$246,893
Adjusted for amounts attributable to TSYS
common shareholders (net of taxes):
Acquisition intangible amortization
17,747
16,609
65,127
43,743
Share-based compensation
5,777
6,405
20,944
19,830
NetSpend M&A expenses
3
1,318
3,115
15,251
Adjusted earnings (b)
$106,725
$90,390
$364,402
$325,717
Average common shares outstanding and
participating securities (c)
185,221
189,447
186,222
188,389
Basic EPS Available to TSYS Common
Shareholders (a) / (c)
$0.45
$0.35
$1.48
$1.31
Adjusted EPS Available to TSYS Common
Shareholders (b) / (c)
$0.58
$0.48
$1.96
$1.73 |
 Appendix: Non-GAAP Reconciliation –
Free Cash Flow
Twelve Months
Ended
12/31/2014
Cash Flows from Operating Activities
$561,094
Less:
Purchase of Property and Equipment
(75,913)
Additions to Licensed Computer Software from Vendors
(29,638)
Additions to Internally Developed Computer Software
(41,502)
Additions to Contract Acquisition Costs
(88,871)
Free Cash Flow
$325,170
(in thousands)
30
©2016 Total System Services, Inc.® Proprietary. All rights reserved worldwide. |
 Appendix: 2015 Guidance Assumptions
The guidance assumes:
•
•
•
•
•
•
31
©2015 Total System Services, Inc.® Proprietary. All rights reserved worldwide. There will be no significant
movements in the London Interbank Offered rate and TSYS will not make any
significant draws on the remaining balance of its credit facility;
There will be no significant movement in foreign currency exchange rates
related to TSYS’
business;
TSYS will not incur significant expenses associated with the conversion of
new large clients other than included in the 2015 estimate, additional
acquisitions,
or
any
significant
impairment
of
goodwill
or
other
intangibles;
There will be no deconversions of large clients during the year;
No share repurchases are included; and
The economy will not worsen. |
 Appendix: Non-GAAP Reconciliation –
EBITDA and Adjusted EBITDA
Twelve Months
Ended
12/31/2014
Net Income
$329,406
Adjusted for:
Deduct: Discontinued operations
(48,655)
Deduct: Equity in Income of Equity Investments
(17,583)
Add: Income Taxes
129,760
Add: Nonoperating expense
38,711
Add: Depreciation and Amortization
246,620
EBITDA
$678,259
Adjust for: Share-based compensation
30,790
NetSpend M&A Operating Expenses*
3,217
Adjusted EBITDA
$712,266
(in thousands)
32
* Excludes share-based compensation
©2015 Total System Services, Inc.® Proprietary. All rights reserved worldwide. |