Attached files
| file | filename |
|---|---|
| 8-K - 8-K - HANCOCK WHITNEY CORP | d856360d8k.htm |
Exhibit 99.1

For Immediate Release
January 22, 2015
For More Information
Trisha Voltz Carlson
SVP, Investor Relations Manager
504.299.5208
trisha.carlson@hancockbank.com
Hancock reports fourth quarter 2014 financial results
Continuing to replace declines in purchase accounting income with quality, core results;
full year 2014 core income and E.P.S. up over 30% compared to 2013
GULFPORT, Miss. (January 22, 2015) — Hancock Holding Company (Nasdaq: HBHC) today announced its financial results for the fourth quarter of 2014. Net income for the fourth quarter of 2014 was $40.1 million, or $.48 per diluted common share, compared to $46.6 million, or $.56 in the third quarter of 2014 and $34.7 million, or $.41 in the fourth quarter of 2013.
Operating income for the fourth quarter of 2014 was $46.4 million, or $.56 per diluted common share, compared to $49.1 million, or $.59, in the third quarter of 2014. Operating income was $45.8 million, or $.55, in the fourth quarter of 2013. We define our operating income as net income excluding tax-effected securities transactions gains or losses and nonoperating expense items. Nonoperating expenses totaled $9.7 million and $3.9 million (pre-tax), in the fourth and third quarters of 2014, respectively, and $17.1 million (pre-tax) in the fourth quarter of 2013. Management believes that operating income is one useful measure of our financial performance that helps investors compare the company’s fundamental operational performance from period to period. The financial tables include a reconciliation of net income to operating income.
Over the past several quarters we have disclosed our focus on strategic initiatives that are designed to replace declining levels of purchase accounting income from acquisitions with improvement in core income, which the company defines as operating income excluding tax-effected purchase accounting adjustments. Over time, this strategic focus should improve the company’s core income. Management believes that consistent reporting of core income helps investors understand the success management has had in executing its strategic initiatives. Our core income for the fourth quarter of 2014 was $41.5 million or $.50 per diluted common share, up from $41.2 million or $.49 in the third quarter of 2014 and $32.8 million, or $.39, in the fourth quarter of 2013. The financial tables include a reconciliation of net income to core income.
1
Hancock reports fourth quarter 2014 financial results
January 22, 2015
“The strategic initiatives we announced almost two years ago continue to generate results,” said Hancock’s President and Chief Executive Officer John M. Hairston. “During 2014 we reported a $50 million decline in pre-tax purchase accounting income that we more than replaced through successfully reducing and controlling expenses, and investing in revenue-generating initiatives. While operating results may look somewhat flat year over year, a comparison of our core results for 2014 to 2013 tells quite a different story. Core income increased $38 million, or 31%, E.P.S. grew $.47 per share, or up 33%, loans increased $1.6 billion, or 13%, deposits grew $1.2 billion, up 8%, the core margin for the year remained stable, credit metrics improved, capital remained solid, and our operating efficiency improved over 300 basis points. The management team is extremely proud of these results, and expects 2015 to reflect similar progress towards achieving our goals.”
Highlights of the company’s fourth quarter of 2014 results:
| • | Net loan growth of $547 million, or 16% linked-quarter annualized |
| • | Net deposit growth of $836 million, or 21% linked-quarter annualized |
| • | An increase of $1.2 million in core revenue and a $1.1 million decline in operating expense offset half of the $4.7 million decline in purchase accounting income |
| • | Over the past 2 quarters growth in core revenue and declines in operating expense offset approximately 90% of the decline in purchase accounting items |
| • | Solid capital levels with a tangible common equity (TCE) ratio of 8.59%, after using approximately $38 million of capital during the quarter to repurchase stock |
| • | Return on average assets (ROA) (operating) 0.92%; core ROA 0.82% |
| • | Total assets grew $761 million and totaled approximately $21 billion at year-end 2014 |
Loans
Total loans at December 31, 2014 were $13.9 billion, up $547 million from September 30, 2014.
All markets across the franchise reported growth during the quarter, with south Louisiana, Houston and central Florida generating approximately two-thirds of the quarter’s net loan growth. During the fourth quarter, approximately two-thirds of the average net loan growth came from commercial lending lines of business, with minimal growth in the energy sector over the past several months.
At December 31, 2014, loans in the energy segment totaled $1.7 billion, or 12% of total loans. The portfolio is comprised of credits to both the E&P industry and support industries. Additional details of the energy portfolio are included in the presentation slides posted on our Investor Relations website.
“We have been in the energy lending business for more than 60 years with relationships that go back generations,” said Hairston. “The potential impact of the recent precipitous drop in oil prices on our future results will depend on the severity and duration of this cycle. We are disciplined in our underwriting, and while we could see some pressure in risk ratings, based on what we know today we expect no significant loss in our energy portfolio and believe our current reserves are sufficient to cover any losses in the portfolio.”
2
Hancock reports fourth quarter 2014 financial results
January 22, 2015
Average loans totaled $13.6 billion for the fourth quarter of 2014, up $476 million, or 4%, from the third quarter of 2014.
Deposits
Total deposits at December 31, 2014 were $16.6 billion, up $836 million, or 5%, from September 30, 2014. Average deposits for the fourth quarter of 2014 were $15.9 billion, up $521 million, or 3%, from the third quarter of 2014. Initiatives were put in place recently with a focus on growing deposits in order to fund the Company’s loan growth. Previously the loan growth had been funded primarily through runoff in the securities portfolio.
Noninterest-bearing demand deposits (DDAs) totaled $5.9 billion at December 31, 2014, up $79 million, or 1%, compared to September 30, 2014. DDAs comprised 36% of total period-end deposits at December 31, 2014.
Interest-bearing transaction and savings deposits totaled $6.5 billion at the end of the fourth quarter of 2014, up $206 million, or 3%, from September 30, 2014. Time deposits (CDs) of $2.1 billion grew $103 million, or 5%, while interest-bearing public fund deposits increased $448 million, or 29%, to $2.0 billion at December 31, 2014. A portion of the public fund balances are seasonal, and we expect to see runoff in those deposits in the first quarter of 2015.
Asset Quality
Nonperforming assets (NPAs) totaled $148 million at December 31, 2014, up less than $1 million from September 30, 2014. During the fourth quarter of 2014, total nonperforming loans declined $2.6 million while foreclosed and surplus real estate (ORE) and other foreclosed assets increased $3.5 million. The increase in ORE was mainly additions of existing branch property. Nonperforming assets as a percent of total loans, ORE and other foreclosed assets was 1.06% at December 31, 2014, down 4 bps from September 30, 2014.
The total allowance for loan losses was $128.8 million at December 31, 2014, up $3.2 million from September 30, 2014. The ratio of the allowance for loan losses to period-end loans was .93% at December 31, 2014, virtually unchanged from September 30, 2014. The allowance maintained on the non-FDIC acquired portion of the loan portfolio increased $7.2 million linked-quarter, totaling $98.2 million, and the impaired reserve on the FDIC acquired loan portfolio declined $4.0 million linked-quarter.
During the quarter, management reviewed all energy credits $1 million and greater, and also stress tested the entire energy portfolio. Based on current conditions no additional reserve build was required for the energy portfolio at December 31, 2014. Should pricing pressures on oil continue, we could see some downward pressure on risk ratings that could lead to additional provision expense in future quarters. However, this will depend on the severity and duration of this cycle. Management believes that even if downgrades occur, they will not result in significant losses.
3
Hancock reports fourth quarter 2014 financial results
January 22, 2015
Net charge-offs from the noncovered loan portfolio were $2.6 million, or 0.08% of average total loans on an annualized basis in the fourth quarter of 2014, down from $6.4 million, or 0.19% of average total loans in the third quarter of 2014.
During the fourth quarter of 2014, Hancock recorded a total provision for loan losses of $9.7 million, up slightly from the third quarter of 2014 and primarily related to the noncovered portion of the allowance.
The non-single family portion of the FDIC loss share agreement related to the Peoples First acquisition in December 2009 expired at year-end 2014. Approximately $197 million of single family loans remain covered under a FDIC loss share agreement until December 31, 2019.
Net Interest Income and Net Interest Margin
Net interest income (TE) for the fourth quarter of 2014 was $163.6 million, down $2.6 million from the third quarter of 2014. The impact of purchase accounting items (PAAs) on net interest income was $16.0 million, down $5.5 million linked-quarter. Excluding the impact from purchase accounting items, core net interest income increased $2.8 million linked-quarter, replacing more than half of the runoff in PAAs. Average earning assets were $17.9 billion for the fourth quarter of 2014, up $587 million, or 3%, from the third quarter of 2014.
The reported net interest margin (TE) was 3.63% for the fourth quarter of 2014, down 18 bps from the third quarter of 2014. The core net interest margin (reported net interest income (TE) excluding total net purchase accounting adjustments, annualized, as a percent of average earning assets) declined 5 bps to 3.27% during the fourth quarter of 2014. Declines in the core loan yield (-3 bps) and an increase in the cost of funds (+2 bps) were the main drivers of the margin compression. An improved earning asset mix and increased loan volumes were drivers of the increase in core net interest income.
Noninterest Income
Noninterest income, including securities transactions, totaled $57.0 million for the fourth quarter of 2014, down $1.0 million, or 2%, from the third quarter of 2014. Included in the total is a reduction of $2.1 million related to the amortization of the FDIC indemnification asset, compared to a reduction of $2.8 million in the third quarter of 2014. Excluding the impact of this item, core noninterest income decreased by approximately $1.6 million linked-quarter.
Branch closures and sales led to some customer attrition and reductions in service charges and card fees during 2014. Service charges on deposits totaled $19.0 million for the fourth quarter of 2014, down $1.0 million, or 5%, from the third quarter of 2014. Bank card and ATM fees totaled $11.2 million, down $0.4 million, or 4%, from the third quarter of 2014.
4
Hancock reports fourth quarter 2014 financial results
January 22, 2015
Trust fees totaled $11.6 million, virtually unchanged linked-quarter. Investment and annuity income and insurance fees totaled $6.6 million, down $0.9 million, or 12%, linked-quarter.
Fees from secondary mortgage operations totaled $2.0 million for the fourth quarter of 2014, down $0.3 million, or 14%, linked-quarter.
Other noninterest income totaled $8.7 million, up $0.9 million, or 12%, from the third quarter of 2014.
Noninterest Expense & Taxes
Noninterest expense for the fourth quarter of 2014 totaled $153.7 million and included $9.7 million of nonoperating expenses. The nonoperating expenses were mainly incurred in connection with the Company’s ongoing expense and efficiency initiative, although a portion of these costs were amounts paid to recently separated executives. Excluding these costs, operating expense totaled $144.1 million in the fourth quarter of 2014, down $1.1 million, or less than 1%, linked-quarter. (The details of the changes in the noninterest expense categories noted below exclude the impact of nonoperating items.)
Total personnel expense was $79.5 million in the fourth quarter of 2014, down $0.5 million, or less than 1%, from the third quarter of 2014. Occupancy and equipment expense totaled $14.6 million in the fourth quarter of 2014, down $0.7 million, or 5%, from the third quarter of 2014.
ORE expense totaled $1.0 million for the fourth quarter of 2014, reflecting a more normalized level of quarterly expense. Net gains on ORE dispositions exceeded ORE expense in the third quarter of 2014 by $104,000.
Other operating expense totaled $42.6 million in the fourth quarter of 2014, down $0.8 million, or 2%, from the third quarter of 2014.
The effective income tax rate for the fourth quarter of 2014 was 26%, unchanged from the third quarter of 2014. Management expects the effective income tax rate to approximate 27-29% in 2015. The effective income tax rate continues to be less than the statutory rate of 35% due primarily to tax-exempt income and tax credits.
Capital
Common shareholders’ equity at December 31, 2014 totaled $2.5 billion. The tangible common equity (TCE) ratio was 8.59%, down 51 bps from September 30, 2014. The decline in the TCE ratio reflects organic growth in the balance sheet, the repurchase of common shares during the quarter and a decrease in other comprehensive income (OCI) primarily related to the year-end revaluation of the pension liability. Assets totaled $21 billion at December 31, 2014, up $761 million from September 30, 2014.
5
Hancock reports fourth quarter 2014 financial results
January 22, 2015
In July of 2014, the Board of Directors authorized a new common stock repurchase program for up to 5%, or approximately 4 million shares, of the Company’s common stock. During the fourth quarter, the Company repurchased 1,224,279 shares of its common stock at an average price of $30.75. To-date the Company has repurchased 37% of the total buyback authorization. Shares may be repurchased in the open market or in privately negotiated transactions from time to time, depending upon market conditions and other factors, and in accordance with applicable regulations of the Securities and Exchange Commission. The repurchase authorization will expire December 31, 2015. Additional capital ratios are included in the financial tables.
Conference Call and Slide Presentation
Management will host a conference call for analysts and investors at 9:00 a.m. Central Time on Friday, January 23, 2015 to review the results. A live listen-only webcast of the call will be available under the Investor Relations section of Hancock’s website at www.hancockbank.com. Additional financial tables and a slide presentation related to fourth quarter results are also posted as part of the webcast link. To participate in the Q&A portion of the call, dial (877) 564-1219 or (973) 638-3429. An audio archive of the conference call will be available under the Investor Relations section of our website. A replay of the call will also be available through January 30, 2015 by dialing (855) 859-2056 or (404) 537-3406, passcode 60107247.
About Hancock Holding Company
Hancock Holding Company is a financial services company with regional business headquarters and locations throughout a growing Gulf South corridor. The company’s banking subsidiary provides a comprehensive network of full-service financial choices through Hancock Bank locations in Mississippi, Alabama, and Florida and Whitney Bank offices in Louisiana and Texas, including traditional and online banking; commercial and small business banking; energy banking; private banking; trust and investment services; certain insurance services; mortgage services; and consumer financing. More information and online banking are available at www.hancockbank.com and www.whitneybank.com.
Forward-Looking Statements
This news release contains “forward-looking statements” within the meaning of section 27A of the Securities Act of 1933, as amended, and section 21E of the Securities Exchange Act of 1934, as amended, and we intend such forward-looking statements to be covered by the safe harbor provisions therein and are including this statement for purposes of invoking these safe-harbor provisions. Forward-looking statements provide projections of results of operations or of financial condition or state other forward-looking information, such as expectations about future conditions and descriptions of plans and strategies for the future.
Forward-looking statements that we may make include, but may not be limited to, comments with respect to future levels of economic activity in our markets, including the impact of volatility of oil and gas prices on our energy portfolio and associated loan loss reserves and the downstream impact on businesses that support the energy sector, especially in the Gulf Coast region, loan growth expectations, deposit trends, credit quality trends, net interest margin trends, future expense levels, success of revenue-generating initiatives, projected tax rates, future profitability, improvements in expense to revenue (efficiency) ratio, purchase accounting impacts such as accretion levels, the impact of the branch rationalization process, details of the common stock buyback, possible repurchases of shares under stock buyback programs, and the financial impact of regulatory requirements. Hancock’s ability to accurately project results, predict the effects of future plans or strategies, or predict market or economic developments is inherently limited. Although Hancock believes that the expectations reflected in its forward-looking statements are based on reasonable assumptions, actual results and performance could differ materially from those set forth in the forward-looking statements. Factors that could cause actual results to differ from those expressed in Hancock’s forward-looking statements include, but are not limited to, those risk factors outlined in Hancock’s public filings with the Securities and Exchange Commission, which are available at the SEC’s internet site (http://www.sec.gov).
6
Hancock reports fourth quarter 2014 financial results
January 22, 2015
You are cautioned not to place undue reliance on these forward-looking statements. Hancock does not intend, and undertakes no obligation, to update or revise any forward-looking statements, whether as a result of differences in actual results, changes in assumptions or changes in other factors affecting such statements, except as required by law.
7
HANCOCK HOLDING COMPANY
FINANCIAL HIGHLIGHTS
(Unaudited)
| Three Months Ended | Twelve Months Ended | |||||||||||||||||||
| (amounts in thousands, except per share data) |
12/31/2014 | 9/30/2014 | 12/31/2013 | 12/31/2014 | 12/31/2013 | |||||||||||||||
| INCOME STATEMENT DATA |
||||||||||||||||||||
| Net interest income |
$ | 160,813 | $ | 163,541 | $ | 166,007 | $ | 654,694 | $ | 680,731 | ||||||||||
| Net interest income (TE) (a) |
163,581 | 166,230 | 168,466 | 665,341 | 691,141 | |||||||||||||||
| Provision for loan losses |
9,718 | 9,468 | 7,331 | 33,840 | 32,734 | |||||||||||||||
| Noninterest income excluding securities transactions |
56,961 | 57,941 | 58,894 | 227,999 | 246,038 | |||||||||||||||
| Securities transactions gains |
— | — | 105 | — | 105 | |||||||||||||||
| Noninterest expense (excluding nonoperating expense items) |
144,080 | 145,192 | 157,097 | 580,980 | 640,271 | |||||||||||||||
| Nonoperating expense items |
9,667 | 3,887 | 17,116 | 25,686 | 38,003 | |||||||||||||||
| Net income |
40,092 | 46,553 | 34,716 | 175,722 | 163,356 | |||||||||||||||
| Operating income (b) |
46,376 | 49,079 | 45,773 | 194,145 | 187,990 | |||||||||||||||
| Core income (c) |
41,537 | 41,176 | 32,847 | 159,191 | 121,100 | |||||||||||||||
| PERIOD-END BALANCE SHEET DATA |
||||||||||||||||||||
| Loans |
$ | 13,895,276 | $ | 13,348,574 | $ | 12,324,817 | $ | 13,895,276 | $ | 12,324,817 | ||||||||||
| Investment securities |
3,826,454 | 3,913,370 | 4,033,124 | 3,826,454 | 4,033,124 | |||||||||||||||
| Earning assets |
18,544,930 | 17,748,600 | 16,651,295 | 18,544,930 | 16,651,295 | |||||||||||||||
| Total assets |
20,747,266 | 19,985,950 | 19,009,251 | 20,747,266 | 19,009,251 | |||||||||||||||
| Noninterest-bearing deposits |
5,945,208 | 5,866,255 | 5,530,253 | 5,945,208 | 5,530,253 | |||||||||||||||
| Total deposits |
16,572,831 | 15,736,694 | 15,360,516 | 16,572,831 | 15,360,516 | |||||||||||||||
| Common shareholders’ equity |
2,472,402 | 2,509,342 | 2,425,069 | 2,472,402 | 2,425,069 | |||||||||||||||
| AVERAGE BALANCE SHEET DATA |
||||||||||||||||||||
| Loans |
$ | 13,578,223 | $ | 13,102,108 | $ | 11,903,603 | $ | 12,938,869 | $ | 11,700,218 | ||||||||||
| Investment securities (d) |
3,836,123 | 3,780,089 | 4,070,657 | 3,816,724 | 4,140,051 | |||||||||||||||
| Earning assets |
17,911,143 | 17,324,444 | 16,376,587 | 17,195,492 | 16,443,868 | |||||||||||||||
| Total assets |
20,090,372 | 19,549,947 | 18,739,091 | 19,436,827 | 18,929,018 | |||||||||||||||
| Noninterest-bearing deposits |
5,849,356 | 5,707,523 | 5,483,918 | 5,641,792 | 5,393,955 | |||||||||||||||
| Total deposits |
15,892,507 | 15,371,209 | 14,915,677 | 15,399,993 | 15,117,236 | |||||||||||||||
| Common shareholders’ equity |
2,509,509 | 2,489,948 | 2,355,768 | 2,474,948 | 2,386,564 | |||||||||||||||
| COMMON SHARE DATA |
||||||||||||||||||||
| Earnings per share - diluted |
$ | 0.48 | $ | 0.56 | $ | 0.41 | $ | 2.10 | $ | 1.93 | ||||||||||
| Operating earnings per share - diluted (b) |
0.56 | 0.59 | 0.55 | 2.32 | 2.22 | |||||||||||||||
| Core earnings per share - diluted (c) |
0.50 | 0.49 | 0.39 | 1.90 | 1.43 | |||||||||||||||
| Cash dividends per share |
$ | 0.24 | $ | 0.24 | $ | 0.24 | $ | 0.96 | $ | 0.96 | ||||||||||
| Book value per share (period-end) |
$ | 30.74 | $ | 30.76 | $ | 29.49 | $ | 30.74 | $ | 29.49 | ||||||||||
| Tangible book value per share (period-end) |
21.37 | 21.44 | 19.94 | 21.37 | 19.94 | |||||||||||||||
| Weighted average number of shares - diluted |
81,530 | 81,942 | 82,220 | 82,034 | 83,167 | |||||||||||||||
| Period-end number of shares |
80,426 | 81,567 | 82,237 | 80,426 | 82,237 | |||||||||||||||
| Market data |
||||||||||||||||||||
| High sales price |
$ | 35.67 | $ | 36.47 | $ | 37.12 | $ | 38.50 | $ | 37.12 | ||||||||||
| Low sales price |
28.68 | 31.25 | 30.09 | 28.68 | 25.00 | |||||||||||||||
| Period-end closing price |
30.70 | 32.05 | 36.68 | 30.70 | 36.68 | |||||||||||||||
| Trading volume |
36,396 | 25,553 | 27,816 | 120,635 | 122,496 | |||||||||||||||
| PERFORMANCE RATIOS |
||||||||||||||||||||
| Return on average assets |
0.79 | % | 0.94 | % | 0.74 | % | 0.90 | % | 0.86 | % | ||||||||||
| Return on average assets (operating) (b) |
0.92 | % | 1.00 | % | 0.97 | % | 1.00 | % | 0.99 | % | ||||||||||
| Return on average common equity |
6.34 | % | 7.42 | % | 5.85 | % | 7.10 | % | 6.84 | % | ||||||||||
| Return on average common equity (operating) (b) |
7.33 | % | 7.82 | % | 7.71 | % | 7.84 | % | 7.88 | % | ||||||||||
| Return on average tangible common equity |
9.08 | % | 10.70 | % | 8.79 | % | 10.30 | % | 10.30 | % | ||||||||||
| Return on average tangible common equity (operating) (b) |
10.50 | % | 11.28 | % | 11.59 | % | 11.37 | % | 11.85 | % | ||||||||||
| Tangible common equity ratio (e) |
8.59 | % | 9.10 | % | 9.00 | % | 8.59 | % | 9.00 | % | ||||||||||
| Net interest margin (TE) (a) |
3.63 | % | 3.81 | % | 4.09 | % | 3.87 | % | 4.20 | % | ||||||||||
| Average loan/deposit ratio |
85.44 | % | 85.24 | % | 79.93 | % | 84.02 | % | 77.56 | % | ||||||||||
| Efficiency ratio (f) |
62.41 | % | 61.84 | % | 65.94 | % | 62.03 | % | 65.17 | % | ||||||||||
| Allowance for loan losses as a percent of period-end loans |
0.93 | % | 0.94 | % | 1.08 | % | 0.93 | % | 1.08 | % | ||||||||||
| Annualized net noncovered charge-offs to average loans |
0.08 | % | 0.19 | % | 0.17 | % | 0.13 | % | 0.21 | % | ||||||||||
| Allowance for loan losses to non-performing loans + accruing loans 90 days past due |
137.96 | % | 128.44 | % | 111.97 | % | 137.96 | % | 111.97 | % | ||||||||||
| Noninterest income excluding securities transactions as a percent of total revenue (TE) (a) |
25.83 | % | 25.85 | % | 25.90 | % | 25.52 | % | 26.25 | % | ||||||||||
| FTE Total Headcount |
3,794 | 3,787 | 3,978 | 3,794 | 3,978 | |||||||||||||||
| (a) | Tax-equivalent (TE) amounts are calculated using a federal income tax rate of 35%. |
| (b) | Net income less tax-effected securities transactions and nonoperating expense items. Management believes that operating income provides a useful measure of financial performance that helps investors compare the Company’s fundamental operations over time. |
| (c) | Operating income excluding tax-effected purchase accounting adjustments. Management believes that reporting on core income provides a useful measure of financial performance that helps investors determine whether management is successfully executing its strategic initiatives. |
| (d) | Average securities does not include unrealized holding gains/losses on available for sale securities. |
| (e) | The tangible common equity ratio is common shareholders’ equity less intangible assets divided by total assets less intangible assets. |
| (f) | The efficiency ratio is noninterest expense to total net interest (TE) and noninterest income, excluding amortization of purchased intangibles, nonoperating expense items, and securities transactions. |
8
HANCOCK HOLDING COMPANY
QUARTERLY HIGHLIGHTS
(Unaudited)
| Three Months Ended | ||||||||||||||||||||
| (amounts in thousands, except per share data) |
12/31/2014 | 9/30/2014 | 6/30/2014 | 3/31/2014 | 12/31/2013 | |||||||||||||||
| INCOME STATEMENT DATA |
||||||||||||||||||||
| Net interest income |
$ | 160,813 | $ | 163,541 | $ | 164,778 | $ | 165,562 | $ | 166,007 | ||||||||||
| Net interest income (TE) (a) |
163,581 | 166,230 | 167,332 | 168,198 | 168,466 | |||||||||||||||
| Provision for loan losses |
9,718 | 9,468 | 6,691 | 7,963 | 7,331 | |||||||||||||||
| Noninterest income excluding securities transactions |
56,961 | 57,941 | 56,398 | 56,699 | 58,894 | |||||||||||||||
| Securities transactions gains |
— | — | — | — | 105 | |||||||||||||||
| Noninterest expense (excluding nonoperating expense items) |
144,080 | 145,192 | 144,727 | 146,982 | 157,097 | |||||||||||||||
| Nonoperating expense items |
9,667 | 3,887 | 12,131 | — | 17,116 | |||||||||||||||
| Net income |
40,092 | 46,553 | 39,962 | 49,115 | 34,716 | |||||||||||||||
| Operating income (b) |
46,376 | 49,079 | 49,575 | 49,115 | 45,773 | |||||||||||||||
| Core income (c) |
41,537 | 41,176 | 38,736 | 37,742 | 32,847 | |||||||||||||||
| PERIOD-END BALANCE SHEET DATA |
||||||||||||||||||||
| Loans |
$ | 13,895,276 | $ | 13,348,574 | $ | 12,884,056 | $ | 12,527,937 | $ | 12,324,817 | ||||||||||
| Investment securities |
3,826,454 | 3,913,370 | 3,677,229 | 3,797,883 | 4,033,124 | |||||||||||||||
| Earning assets |
18,544,930 | 17,748,600 | 17,023,990 | 16,622,104 | 16,651,295 | |||||||||||||||
| Total assets |
20,747,266 | 19,985,950 | 19,349,431 | 19,004,170 | 19,009,251 | |||||||||||||||
| Noninterest-bearing deposits |
5,945,208 | 5,866,255 | 5,723,663 | 5,613,872 | 5,530,253 | |||||||||||||||
| Total deposits |
16,572,831 | 15,736,694 | 15,245,227 | 15,274,774 | 15,360,516 | |||||||||||||||
| Common shareholders’ equity |
2,472,402 | 2,509,342 | 2,492,582 | 2,462,534 | 2,425,069 | |||||||||||||||
| AVERAGE BALANCE SHEET DATA |
||||||||||||||||||||
| Loans |
$ | 13,578,223 | $ | 13,102,108 | $ | 12,680,861 | $ | 12,379,316 | $ | 11,903,603 | ||||||||||
| Investment securities (d) |
3,836,123 | 3,780,089 | 3,716,563 | 3,935,616 | 4,070,657 | |||||||||||||||
| Earning assets |
17,911,143 | 17,324,444 | 16,791,744 | 16,740,353 | 16,376,587 | |||||||||||||||
| Total assets |
20,090,372 | 19,549,947 | 19,039,264 | 19,055,107 | 18,739,091 | |||||||||||||||
| Noninterest-bearing deposits |
5,849,356 | 5,707,523 | 5,505,735 | 5,499,993 | 5,483,918 | |||||||||||||||
| Total deposits |
15,892,507 | 15,371,209 | 15,060,581 | 15,269,143 | 14,915,677 | |||||||||||||||
| Common shareholders’ equity |
2,509,509 | 2,489,948 | 2,463,385 | 2,435,980 | 2,355,768 | |||||||||||||||
| COMMON SHARE DATA |
||||||||||||||||||||
| Earnings per share - diluted |
$ | 0.48 | $ | 0.56 | $ | 0.48 | $ | 0.58 | $ | 0.41 | ||||||||||
| Operating earnings per share - diluted (b) |
0.56 | 0.59 | 0.59 | 0.58 | 0.55 | |||||||||||||||
| Core earnings per share - diluted (c) |
0.50 | 0.49 | 0.46 | 0.45 | 0.39 | |||||||||||||||
| Cash dividends per share |
$ | 0.24 | $ | 0.24 | $ | 0.24 | $ | 0.24 | $ | 0.24 | ||||||||||
| Book value per share (period-end) |
$ | 30.74 | $ | 30.76 | $ | 30.45 | $ | 29.93 | $ | 29.49 | ||||||||||
| Tangible book value per share (period-end) |
21.37 | 21.44 | 21.08 | 20.47 | 19.94 | |||||||||||||||
| Weighted average number of shares - diluted |
81,530 | 81,942 | 82,174 | 82,534 | 82,220 | |||||||||||||||
| Period-end number of shares |
80,426 | 81,567 | 81,860 | 82,282 | 82,237 | |||||||||||||||
| Market data |
||||||||||||||||||||
| High sales price |
$ | 35.67 | $ | 36.47 | $ | 37.86 | $ | 38.50 | $ | 37.12 | ||||||||||
| Low sales price |
28.68 | 31.25 | 32.02 | 32.66 | 30.09 | |||||||||||||||
| Period-end closing price |
30.70 | 32.05 | 35.32 | 36.65 | 36.68 | |||||||||||||||
| Trading volume |
36,396 | 25,553 | 27,432 | 31,328 | 27,816 | |||||||||||||||
| PERFORMANCE RATIOS |
||||||||||||||||||||
| Return on average assets |
0.79 | % | 0.94 | % | 0.84 | % | 1.05 | % | 0.74 | % | ||||||||||
| Return on average assets (operating) (b) |
0.92 | % | 1.00 | % | 1.04 | % | 1.05 | % | 0.97 | % | ||||||||||
| Return on average common equity |
6.34 | % | 7.42 | % | 6.51 | % | 8.18 | % | 5.85 | % | ||||||||||
| Return on average common equity (operating) (b) |
7.33 | % | 7.82 | % | 8.07 | % | 8.18 | % | 7.71 | % | ||||||||||
| Return on average tangible common equity |
9.08 | % | 10.70 | % | 9.47 | % | 12.04 | % | 8.79 | % | ||||||||||
| Return on average tangible common equity (operating) (b) |
10.50 | % | 11.28 | % | 11.75 | % | 12.04 | % | 11.59 | % | ||||||||||
| Tangible common equity ratio (e) |
8.59 | % | 9.10 | % | 9.29 | % | 9.24 | % | 9.00 | % | ||||||||||
| Net interest margin (TE) (a) |
3.63 | % | 3.81 | % | 3.99 | % | 4.06 | % | 4.09 | % | ||||||||||
| Average loan/deposit ratio |
85.44 | % | 85.24 | % | 84.20 | % | 81.20 | % | 79.93 | % | ||||||||||
| Efficiency ratio (f) |
62.41 | % | 61.84 | % | 61.67 | % | 62.23 | % | 65.94 | % | ||||||||||
| Allowance for loan losses as a percent of period-end loans |
0.93 | % | 0.94 | % | 1.00 | % | 1.02 | % | 1.08 | % | ||||||||||
| Annualized net noncovered charge-offs to average loans |
0.08 | % | 0.19 | % | 0.13 | % | 0.13 | % | 0.17 | % | ||||||||||
| Allowance for loan losses to non-performing loans + accruing loans 90 days past due |
137.96 | % | 128.44 | % | 126.26 | % | 112.64 | % | 111.97 | % | ||||||||||
| Noninterest income excluding securities transactions as a percent of total revenue (TE) (a) |
25.83 | % | 25.85 | % | 25.21 | % | 25.21 | % | 25.90 | % | ||||||||||
| FTE headcount |
3,794 | 3,787 | 3,901 | 3,974 | 3,978 | |||||||||||||||
| (a) | Tax-equivalent (TE) amounts are calculated using a federal income tax rate of 35%. |
| (b) | Net income less tax-effected securities transactions and nonoperating expense items. Management believes that operating income provides a useful measure of financial performance that helps investors compare the Company’s fundamental operations over time. |
| (c) | Operating income excluding tax-effected purchase accounting adjustments. Management believes that reporting on core income provides a useful measure of financial performance that helps investors determine whether management is successfully executing its strategic initiatives. |
| (d) | Average securities does not include unrealized holding gains/losses on available for sale securities. |
| (e) | The tangible common equity ratio is common shareholders’ equity less intangible assets divided by total assets less intangible assets. |
| (f) | The efficiency ratio is noninterest expense to total net interest (TE) and noninterest income, excluding amortization of purchased intangibles, nonoperating expense items, and securities transactions. |
9
HANCOCK HOLDING COMPANY
INCOME STATEMENT
(Unaudited)
| Three Months Ended | Twelve Months Ended | |||||||||||||||||||
| (dollars in thousands, except per share data) |
12/31/2014 | 9/30/2014 | 12/31/2013 | 12/31/2014 | 12/31/2013 | |||||||||||||||
| NET INCOME |
||||||||||||||||||||
| Interest income |
$ | 170,971 | $ | 172,701 | $ | 175,650 | $ | 692,813 | $ | 722,210 | ||||||||||
| Interest income (TE) |
173,739 | 175,390 | 178,109 | 703,460 | 732,620 | |||||||||||||||
| Interest expense |
10,158 | 9,160 | 9,643 | 38,119 | 41,479 | |||||||||||||||
|
|
|
|
|
|
|
|
|
|
|
|||||||||||
| Net interest income (TE) |
163,581 | 166,230 | 168,466 | 665,341 | 691,141 | |||||||||||||||
| Provision for loan losses |
9,718 | 9,468 | 7,331 | 33,840 | 32,734 | |||||||||||||||
| Noninterest income excluding securities transactions |
56,961 | 57,941 | 58,894 | 227,999 | 246,038 | |||||||||||||||
| Securities transactions gains |
— | — | 105 | — | 105 | |||||||||||||||
| Noninterest expense |
153,747 | 149,079 | 174,213 | 606,666 | 678,274 | |||||||||||||||
|
|
|
|
|
|
|
|
|
|
|
|||||||||||
| Income before income taxes |
54,309 | 62,935 | 43,462 | 242,187 | 215,866 | |||||||||||||||
| Income tax expense |
14,217 | 16,382 | 8,746 | 66,465 | 52,510 | |||||||||||||||
|
|
|
|
|
|
|
|
|
|
|
|||||||||||
| Net income |
$ | 40,092 | $ | 46,553 | $ | 34,716 | $ | 175,722 | $ | 163,356 | ||||||||||
|
|
|
|
|
|
|
|
|
|
|
|||||||||||
| ADJUSTMENTS FROM NET TO OPERATING INCOME |
||||||||||||||||||||
| Securities transactions gains |
— | — | 105 | — | 105 | |||||||||||||||
| Nonoperating expense items |
||||||||||||||||||||
| Impact of insurance business lines divestiture |
— | — | — | (9,101 | ) | — | ||||||||||||||
| FDIC settlement |
— | — | — | 10,268 | — | |||||||||||||||
| Expense and efficiency initiatives and other items |
9,667 | 3,887 | 17,116 | 21,058 | 38,003 | |||||||||||||||
| Early debt redemption |
— | — | — | 3,461 | — | |||||||||||||||
|
|
|
|
|
|
|
|
|
|
|
|||||||||||
| Total nonoperating expense items |
9,667 | 3,887 | 17,116 | 25,686 | 38,003 | |||||||||||||||
| Taxes on adjustments at marginal tax rate |
3,383 | 1,361 | 5,954 | 7,263 | 13,264 | |||||||||||||||
|
|
|
|
|
|
|
|
|
|
|
|||||||||||
| Total adjustments (net of taxes) |
6,284 | 2,526 | 11,057 | 18,423 | 24,634 | |||||||||||||||
|
|
|
|
|
|
|
|
|
|
|
|||||||||||
| Operating income (g) |
$ | 46,376 | $ | 49,079 | $ | 45,773 | $ | 194,145 | $ | 187,990 | ||||||||||
|
|
|
|
|
|
|
|
|
|
|
|||||||||||
| Purchase accounting adjustments (net of taxes) |
4,839 | 7,903 | 12,926 | 34,954 | 66,890 | |||||||||||||||
|
|
|
|
|
|
|
|
|
|
|
|||||||||||
| Core income (h) |
$ | 41,537 | $ | 41,176 | $ | 32,847 | $ | 159,191 | $ | 121,100 | ||||||||||
|
|
|
|
|
|
|
|
|
|
|
|||||||||||
| NONINTEREST INCOME AND NONINTEREST EXPENSE |
||||||||||||||||||||
| Service charges on deposit accounts |
$ | 19,025 | $ | 20,000 | $ | 19,605 | $ | 77,006 | $ | 79,000 | ||||||||||
| Trust fees |
11,559 | 11,530 | 10,214 | 44,826 | 38,186 | |||||||||||||||
| Bank card and ATM fees |
11,225 | 11,641 | 11,261 | 45,031 | 45,939 | |||||||||||||||
| Investment & annuity fees |
4,736 | 5,506 | 4,619 | 20,291 | 19,574 | |||||||||||||||
| Secondary mortgage market operations |
2,000 | 2,313 | 1,554 | 8,036 | 12,543 | |||||||||||||||
| Insurance fees |
1,862 | 1,979 | 3,304 | 9,473 | 15,804 | |||||||||||||||
| Amortization of FDIC loss share receivable |
(2,113 | ) | (2,760 | ) | (1,649 | ) | (12,102 | ) | (2,239 | ) | ||||||||||
| Other income |
8,667 | 7,732 | 9,986 | 35,438 | 37,231 | |||||||||||||||
|
|
|
|
|
|
|
|
|
|
|
|||||||||||
| Noninterest income excluding securities transactions |
56,961 | 57,941 | 58,894 | 227,999 | 246,038 | |||||||||||||||
| Securities transactions gains |
— | — | 105 | — | 105 | |||||||||||||||
|
|
|
|
|
|
|
|
|
|
|
|||||||||||
| Total noninterest income including securities transactions |
$ | 56,961 | $ | 57,941 | $ | 58,999 | $ | 227,999 | $ | 246,143 | ||||||||||
|
|
|
|
|
|
|
|
|
|
|
|||||||||||
| Personnel expense |
$ | 79,522 | $ | 80,043 | $ | 84,912 | $ | 320,502 | $ | 347,267 | ||||||||||
| Occupancy expense (net) |
10,571 | 10,798 | 11,613 | 43,476 | 48,847 | |||||||||||||||
| Equipment expense |
3,986 | 4,542 | 4,679 | 16,861 | 19,885 | |||||||||||||||
| Other real estate owned expense (net) |
1,001 | (104 | ) | 1,535 | 2,758 | 8,036 | ||||||||||||||
| Other operating expense |
42,555 | 43,343 | 47,180 | 170,586 | 186,766 | |||||||||||||||
| Amortization of intangibles |
6,445 | 6,570 | 7,178 | 26,797 | 29,470 | |||||||||||||||
|
|
|
|
|
|
|
|
|
|
|
|||||||||||
| Total operating expense |
144,080 | 145,192 | 157,097 | 580,980 | 640,271 | |||||||||||||||
| Nonoperating expense items |
9,667 | 3,887 | 17,116 | 25,686 | 38,003 | |||||||||||||||
|
|
|
|
|
|
|
|
|
|
|
|||||||||||
| Total noninterest expense |
$ | 153,747 | $ | 149,079 | $ | 174,213 | $ | 606,666 | $ | 678,274 | ||||||||||
|
|
|
|
|
|
|
|
|
|
|
|||||||||||
| COMMON SHARE DATA |
||||||||||||||||||||
| Earnings per share: |
||||||||||||||||||||
| Basic |
$ | 0.48 | $ | 0.56 | $ | 0.41 | $ | 2.10 | $ | 1.93 | ||||||||||
| Diluted |
0.48 | 0.56 | 0.41 | 2.10 | 1.93 | |||||||||||||||
| Operating earnings per share: |
||||||||||||||||||||
| Basic |
$ | 0.56 | $ | 0.59 | $ | 0.55 | $ | 2.32 | $ | 2.22 | ||||||||||
| Diluted |
0.56 | 0.59 | 0.55 | 2.32 | 2.22 | |||||||||||||||
| Core earnings per share: |
||||||||||||||||||||
| Basic |
$ | 0.50 | $ | 0.49 | $ | 0.39 | 1.90 | $ | 1.43 | |||||||||||
| Diluted |
0.50 | 0.49 | 0.39 | 1.90 | 1.43 | |||||||||||||||
| (g) | Net income less tax-effected securities transactions and nonoperating expense items. Management believes that operating income provides a useful measure of financial performance that helps investors compare the Company’s fundamental operations over time. |
| (h) | Operating income excluding tax-effected purchase accounting adjustments. Management believes that reporting on core income provides a useful measure of financial performance that helps investors determine whether management is successfully executing its strategic initiatives. |
10
HANCOCK HOLDING COMPANY
INCOME STATEMENT
(Unaudited)
| Three months ended | ||||||||||||||||||||
| (dollars in thousands) |
12/31/2014 | 9/30/2014 | 6/30/2014 | 3/31/2014 | 12/31/2013 | |||||||||||||||
| Interest income |
$ | 170,971 | $ | 172,701 | $ | 174,001 | $ | 175,140 | $ | 175,650 | ||||||||||
| Interest income (TE) |
173,739 | 175,390 | 176,555 | 177,776 | 178,109 | |||||||||||||||
| Interest expense |
10,158 | 9,160 | 9,223 | 9,578 | 9,643 | |||||||||||||||
|
|
|
|
|
|
|
|
|
|
|
|||||||||||
| Net interest income (TE) |
163,581 | 166,230 | 167,332 | 168,198 | 168,466 | |||||||||||||||
| Provision for loan losses |
9,718 | 9,468 | 6,691 | 7,963 | 7,331 | |||||||||||||||
| Noninterest income excluding securities transactions |
56,961 | 57,941 | 56,398 | 56,699 | 58,894 | |||||||||||||||
| Securities transactions gains |
— | — | — | — | 105 | |||||||||||||||
| Noninterest expense |
153,747 | 149,079 | 156,858 | 146,982 | 174,213 | |||||||||||||||
|
|
|
|
|
|
|
|
|
|
|
|||||||||||
| Income before income taxes |
54,309 | 62,935 | 57,627 | 67,316 | 43,462 | |||||||||||||||
| Income tax expense |
14,217 | 16,382 | 17,665 | 18,201 | 8,746 | |||||||||||||||
|
|
|
|
|
|
|
|
|
|
|
|||||||||||
| Net income |
$ | 40,092 | $ | 46,553 | $ | 39,962 | $ | 49,115 | $ | 34,716 | ||||||||||
|
|
|
|
|
|
|
|
|
|
|
|||||||||||
| ADJUSTMENTS FROM NET TO OPERATING INCOME |
||||||||||||||||||||
| Securities transactions gains |
— | — | — | — | 105 | |||||||||||||||
| Total nonoperating expense items |
9,667 | 3,887 | 12,131 | — | 17,116 | |||||||||||||||
| Taxes on adjustments at marginal tax rate |
3,383 | 1,361 | 2,518 | — | 5,954 | |||||||||||||||
|
|
|
|
|
|
|
|
|
|
|
|||||||||||
| Adjustments (net of taxes) |
6,284 | 2,526 | 9,613 | — | 11,057 | |||||||||||||||
|
|
|
|
|
|
|
|
|
|
|
|||||||||||
| Operating income (g) |
$ | 46,376 | $ | 49,079 | $ | 49,575 | $ | 49,115 | $ | 45,773 | ||||||||||
|
|
|
|
|
|
|
|
|
|
|
|||||||||||
| Core income (h) |
$ | 41,537 | $ | 41,176 | $ | 38,736 | $ | 37,742 | $ | 32,847 | ||||||||||
|
|
|
|
|
|
|
|
|
|
|
|||||||||||
| NONINTEREST INCOME AND NONINTEREST EXPENSE |
||||||||||||||||||||
| Service charges on deposit accounts |
$ | 19,025 | $ | 20,000 | $ | 19,269 | $ | 18,712 | $ | 19,605 | ||||||||||
| Trust fees |
11,559 | 11,530 | 11,499 | 10,238 | 10,214 | |||||||||||||||
| Bank card and ATM fees |
11,225 | 11,641 | 11,596 | 10,569 | 11,261 | |||||||||||||||
| Investment & annuity fees |
4,736 | 5,506 | 5,097 | 4,952 | 4,619 | |||||||||||||||
| Secondary mortgage market operations |
2,000 | 2,313 | 1,758 | 1,965 | 1,554 | |||||||||||||||
| Insurance fees |
1,862 | 1,979 | 1,888 | 3,744 | 3,304 | |||||||||||||||
| Amortization of FDIC loss share receivable |
(2,113 | ) | (2,760 | ) | (3,321 | ) | (3,908 | ) | (1,649 | ) | ||||||||||
| Other income |
8,667 | 7,732 | 8,612 | 10,427 | 9,986 | |||||||||||||||
|
|
|
|
|
|
|
|
|
|
|
|||||||||||
| Noninterest income excluding securities transactions |
56,961 | 57,941 | 56,398 | 56,699 | 58,894 | |||||||||||||||
| Securities transactions gains |
— | — | — | — | 105 | |||||||||||||||
|
|
|
|
|
|
|
|
|
|
|
|||||||||||
| Total noninterest income including securities transactions |
$ | 56,961 | $ | 57,941 | $ | 56,398 | $ | 56,699 | $ | 58,999 | ||||||||||
|
|
|
|
|
|
|
|
|
|
|
|||||||||||
| Personnel expense |
$ | 79,522 | $ | 80,043 | $ | 79,506 | $ | 81,432 | $ | 84,912 | ||||||||||
| Occupancy expense (net) |
10,571 | 10,798 | 10,840 | 11,266 | 11,613 | |||||||||||||||
| Equipment expense |
3,986 | 4,542 | 4,059 | 4,274 | 4,679 | |||||||||||||||
| Other real estate owned expense (net) |
1,001 | (104 | ) | 84 | 1,777 | 1,535 | ||||||||||||||
| Other operating expense |
42,555 | 43,343 | 43,494 | 41,195 | 47,180 | |||||||||||||||
| Amortization of intangibles |
6,445 | 6,570 | 6,744 | 7,038 | 7,178 | |||||||||||||||
|
|
|
|
|
|
|
|
|
|
|
|||||||||||
| Total operating expense |
144,080 | 145,192 | 144,727 | 146,982 | 157,097 | |||||||||||||||
| Nonoperating expense items |
9,667 | 3,887 | 12,131 | — | 17,116 | |||||||||||||||
|
|
|
|
|
|
|
|
|
|
|
|||||||||||
| Total noninterest expense |
$ | 153,747 | $ | 149,079 | $ | 156,858 | $ | 146,982 | $ | 174,213 | ||||||||||
|
|
|
|
|
|
|
|
|
|
|
|||||||||||
| (g) | Net income less tax-effected securities transactions and nonoperating expense items. Management believes that operating income provides a useful measure of financial performance that helps investors compare the Company’s fundamental operations over time. |
| (h) | Operating income excluding tax-effected purchase accounting adjustments. Management believes that reporting on core income provides a useful measure of financial performance that helps investors determine whether management is successfully executing its strategic initiatives. |
11
HANCOCK HOLDING COMPANY
PERIOD-END BALANCE SHEET
(Unaudited)
| Three Months Ended | ||||||||||||||||||||
| (dollars in thousands) |
12/31/2014 | 9/30/2014 | 6/30/2014 | 3/31/2014 | 12/31/2013 | |||||||||||||||
| ASSETS |
||||||||||||||||||||
| Commercial non-real estate loans |
$ | 6,044,060 | $ | 5,587,137 | $ | 5,393,691 | $ | 5,198,029 | $ | 5,064,224 | ||||||||||
| Construction and land development loans |
1,106,761 | 1,095,902 | 1,040,656 | 978,798 | 915,541 | |||||||||||||||
| Commercial real estate loans |
3,144,048 | 3,100,834 | 3,056,263 | 3,069,316 | 3,042,841 | |||||||||||||||
| Residential mortgage loans |
1,894,181 | 1,858,490 | 1,771,271 | 1,720,307 | 1,720,614 | |||||||||||||||
| Consumer loans |
1,706,226 | 1,706,211 | 1,622,175 | 1,561,487 | 1,581,597 | |||||||||||||||
|
|
|
|
|
|
|
|
|
|
|
|||||||||||
| Total loans |
13,895,276 | 13,348,574 | 12,884,056 | 12,527,937 | 12,324,817 | |||||||||||||||
| Loans held for sale |
20,252 | 15,098 | 22,017 | 15,911 | 24,515 | |||||||||||||||
| Securities |
3,826,454 | 3,913,370 | 3,677,229 | 3,797,883 | 4,033,124 | |||||||||||||||
| Short-term investments |
802,948 | 471,558 | 440,688 | 280,373 | 268,839 | |||||||||||||||
|
|
|
|
|
|
|
|
|
|
|
|||||||||||
| Earning assets |
18,544,930 | 17,748,600 | 17,023,990 | 16,622,104 | 16,651,295 | |||||||||||||||
| Allowance for loan losses |
(128,762 | ) | (125,572 | ) | (128,672 | ) | (128,248 | ) | (133,626 | ) | ||||||||||
| Goodwill |
621,193 | 621,193 | 621,193 | 625,675 | 625,675 | |||||||||||||||
| Other intangible assets, net |
132,810 | 139,256 | 145,825 | 152,734 | 159,773 | |||||||||||||||
| Other assets |
1,577,095 | 1,602,473 | 1,687,095 | 1,731,905 | 1,706,134 | |||||||||||||||
|
|
|
|
|
|
|
|
|
|
|
|||||||||||
| Total assets |
$ | 20,747,266 | $ | 19,985,950 | $ | 19,349,431 | $ | 19,004,170 | $ | 19,009,251 | ||||||||||
|
|
|
|
|
|
|
|
|
|
|
|||||||||||
| LIABILITIES |
||||||||||||||||||||
| Noninterest-bearing deposits |
$ | 5,945,208 | $ | 5,866,255 | $ | 5,723,663 | $ | 5,613,872 | $ | 5,530,253 | ||||||||||
| Interest-bearing transaction and savings deposits |
6,531,628 | 6,325,671 | 6,079,837 | 6,118,150 | 6,162,959 | |||||||||||||||
| Interest-bearing public fund deposits |
1,982,616 | 1,534,678 | 1,484,188 | 1,451,430 | 1,571,532 | |||||||||||||||
| Time deposits |
2,113,379 | 2,010,090 | 1,957,539 | 2,091,322 | 2,095,772 | |||||||||||||||
|
|
|
|
|
|
|
|
|
|
|
|||||||||||
| Total interest-bearing deposits |
10,627,623 | 9,870,439 | 9,521,564 | 9,660,902 | 9,830,263 | |||||||||||||||
|
|
|
|
|
|
|
|
|
|
|
|||||||||||
| Total deposits |
16,572,831 | 15,736,694 | 15,245,227 | 15,274,774 | 15,360,516 | |||||||||||||||
| Short-term borrowings |
1,151,573 | 1,171,809 | 1,063,664 | 712,634 | 657,960 | |||||||||||||||
| Long-term debt |
374,371 | 376,452 | 374,991 | 380,001 | 385,826 | |||||||||||||||
| Other liabilities |
176,089 | 191,653 | 172,967 | 174,227 | 179,880 | |||||||||||||||
|
|
|
|
|
|
|
|
|
|
|
|||||||||||
| Total liabilities |
18,274,864 | 17,476,608 | 16,856,849 | 16,541,636 | 16,584,182 | |||||||||||||||
|
|
|
|
|
|
|
|
|
|
|
|||||||||||
| COMMON SHAREHOLDERS’ EQUITY |
||||||||||||||||||||
| Common stock and capital surplus |
1,798,980 | 1,832,529 | 1,838,931 | 1,837,461 | 1,832,282 | |||||||||||||||
| Retained earnings |
723,497 | 703,506 | 676,942 | 657,062 | 628,166 | |||||||||||||||
| Accumulated other comprehensive income |
(50,075 | ) | (26,693 | ) | (23,291 | ) | (31,989 | ) | (35,379 | ) | ||||||||||
|
|
|
|
|
|
|
|
|
|
|
|||||||||||
| Total common shareholders’ equity |
2,472,402 | 2,509,342 | 2,492,582 | 2,462,534 | 2,425,069 | |||||||||||||||
|
|
|
|
|
|
|
|
|
|
|
|||||||||||
| Total liabilities & shareholders’ equity |
$ | 20,747,266 | $ | 19,985,950 | $ | 19,349,431 | $ | 19,004,170 | $ | 19,009,251 | ||||||||||
|
|
|
|
|
|
|
|
|
|
|
|||||||||||
| CAPITAL RATIOS |
||||||||||||||||||||
| Tangible common equity |
$ | 1,718,343 | $ | 1,748,828 | $ | 1,725,489 | $ | 1,684,037 | $ | 1,639,524 | ||||||||||
| Tier 1 capital (i) |
1,777,280 | 1,784,588 | 1,758,178 | 1,725,947 | 1,685,058 | |||||||||||||||
| Common equity (period-end) as a percent of total assets (period-end) |
11.92 | % | 12.56 | % | 12.88 | % | 12.96 | % | 12.76 | % | ||||||||||
| Tangible common equity ratio |
8.59 | % | 9.10 | % | 9.29 | % | 9.24 | % | 9.00 | % | ||||||||||
| Leverage (Tier 1) ratio (i) |
9.17 | % | 9.48 | % | 9.61 | % | 9.43 | % | 9.34 | % | ||||||||||
| Tier 1 risk-based capital ratio (i) |
11.22 | % | 11.59 | % | 11.83 | % | 11.90 | % | 11.76 | % | ||||||||||
| Total risk-based capital ratio (i) |
12.29 | % | 12.66 | % | 12.96 | % | 13.20 | % | 13.11 | % | ||||||||||
|
|
|
|
|
|
|
|
|
|
|
|||||||||||
| (i) | Estimated for most recent period-end. |
12
HANCOCK HOLDING COMPANY
AVERAGE BALANCE SHEET
(Unaudited)
| Three Months Ended | Twelve Months Ended | |||||||||||||||||||
| (dollars in thousands) |
12/31/2014 | 9/30/2014 | 12/31/2013 | 12/31/2014 | 12/31/2013 | |||||||||||||||
| ASSETS |
||||||||||||||||||||
| Commercial non-real estate loans |
$ | 5,727,003 | $ | 5,485,982 | $ | 4,782,476 | $ | 5,401,992 | $ | 4,612,208 | ||||||||||
| Construction and land development loans |
1,159,378 | 1,070,763 | 931,214 | 1,047,753 | 965,237 | |||||||||||||||
| Commercial real estate loans |
3,057,022 | 3,070,821 | 2,915,323 | 3,058,355 | 2,899,317 | |||||||||||||||
| Residential mortgage loans |
1,886,230 | 1,814,186 | 1,701,144 | 1,791,859 | 1,638,103 | |||||||||||||||
| Consumer loans |
1,748,590 | 1,660,356 | 1,573,446 | 1,638,910 | 1,585,353 | |||||||||||||||
|
|
|
|
|
|
|
|
|
|
|
|||||||||||
| Total loans |
13,578,223 | 13,102,108 | 11,903,603 | 12,938,869 | 11,700,218 | |||||||||||||||
| Loans held for sale |
15,424 | 16,885 | 18,776 | 16,540 | 24,986 | |||||||||||||||
| Securities (j) |
3,836,123 | 3,780,089 | 4,070,657 | 3,816,724 | 4,140,051 | |||||||||||||||
| Short-term investments |
481,373 | 425,362 | 383,551 | 423,359 | 578,613 | |||||||||||||||
|
|
|
|
|
|
|
|
|
|
|
|||||||||||
| Earning assets |
17,911,143 | 17,324,444 | 16,376,587 | 17,195,492 | 16,443,868 | |||||||||||||||
| Allowance for loan losses |
(127,356 | ) | (129,734 | ) | (138,708 | ) | (129,642 | ) | (137,897 | ) | ||||||||||
| Goodwill and other intangible assets |
757,123 | 763,652 | 788,990 | 768,047 | 799,996 | |||||||||||||||
| Other assets |
1,549,462 | 1,591,585 | 1,712,222 | 1,602,930 | 1,823,051 | |||||||||||||||
|
|
|
|
|
|
|
|
|
|
|
|||||||||||
| Total assets |
$ | 20,090,372 | $ | 19,549,947 | $ | 18,739,091 | $ | 19,436,827 | $ | 18,929,018 | ||||||||||
|
|
|
|
|
|
|
|
|
|
|
|||||||||||
| LIABILITIES AND SHAREHOLDERS’ EQUITY |
||||||||||||||||||||
| Noninterest-bearing deposits |
$ | 5,849,356 | $ | 5,707,523 | $ | 5,483,918 | $ | 5,641,792 | $ | 5,393,955 | ||||||||||
|
|
|
|
|
|
|
|
|
|
|
|||||||||||
| Interest-bearing transaction and savings deposits |
6,380,347 | 6,160,911 | 5,981,110 | 6,173,683 | 5,962,114 | |||||||||||||||
| Interest-bearing public fund deposits |
1,598,482 | 1,547,513 | 1,253,199 | 1,530,972 | 1,410,679 | |||||||||||||||
| Time deposits |
2,064,322 | 1,955,262 | 2,197,450 | 2,053,546 | 2,350,488 | |||||||||||||||
|
|
|
|
|
|
|
|
|
|
|
|||||||||||
| Total interest-bearing deposits |
10,043,151 | 9,663,686 | 9,431,759 | 9,758,201 | 9,723,281 | |||||||||||||||
|
|
|
|
|
|
|
|
|
|
|
|||||||||||
| Total deposits |
15,892,507 | 15,371,209 | 14,915,677 | 15,399,993 | 15,117,236 | |||||||||||||||
| Short-term borrowings |
1,135,255 | 1,139,694 | 848,934 | 1,005,680 | 806,082 | |||||||||||||||
| Long-term debt |
376,819 | 375,914 | 381,561 | 379,692 | 389,153 | |||||||||||||||
| Other liabilities |
176,282 | 173,182 | 237,151 | 176,514 | 229,983 | |||||||||||||||
| Common shareholders’ equity |
2,509,509 | 2,489,948 | 2,355,768 | 2,474,948 | 2,386,564 | |||||||||||||||
|
|
|
|
|
|
|
|
|
|
|
|||||||||||
| Total liabilities & shareholders’ equity |
$ | 20,090,372 | $ | 19,549,947 | $ | 18,739,091 | $ | 19,436,827 | $ | 18,929,018 | ||||||||||
|
|
|
|
|
|
|
|
|
|
|
|||||||||||
| (j) | Average securities does not include unrealized holding gains/losses on available for sale securities. |
13
HANCOCK HOLDING COMPANY
AVERAGE BALANCE AND NET INTEREST MARGIN SUMMARY
(Unaudited)
| Three Months Ended | ||||||||||||||||||||||||||||||||||||
| 12/31/2014 | 9/30/2014 | 12/31/2013 | ||||||||||||||||||||||||||||||||||
| (dollars in millions) |
Volume | Interest | Rate | Volume | Interest | Rate | Volume | Interest | Rate | |||||||||||||||||||||||||||
| AVERAGE EARNING ASSETS |
||||||||||||||||||||||||||||||||||||
| Commercial & real estate loans (TE) |
$ | 9,943.4 | $ | 105.8 | 4.23 | % | $ | 9,627.6 | $ | 108.2 | 4.46 | % | $ | 8,629.0 | $ | 104.1 | 4.79 | % | ||||||||||||||||||
| Residential mortgage loans |
1,886.2 | 20.3 | 4.31 | % | 1,814.2 | 20.0 | 4.41 | % | 1,701.1 | 23.5 | 5.52 | % | ||||||||||||||||||||||||
| Consumer loans |
1,748.6 | 23.9 | 5.43 | % | 1,660.4 | 24.0 | 5.74 | % | 1,573.4 | 24.4 | 6.15 | % | ||||||||||||||||||||||||
| Loan fees & late charges |
— | 0.6 | 0.00 | % | — | 0.4 | 0.00 | % | — | 1.0 | 0.00 | % | ||||||||||||||||||||||||
|
|
|
|
|
|
|
|
|
|
|
|
|
|
|
|
|
|
|
|||||||||||||||||||
| Total loans (TE) |
13,578.2 | 150.6 | 4.41 | % | 13,102.2 | 152.6 | 4.63 | % | 11,903.5 | 153.0 | 5.10 | % | ||||||||||||||||||||||||
|
|
|
|
|
|
|
|
|
|
|
|
|
|
|
|
|
|
|
|||||||||||||||||||
| Loans held for sale |
15.4 | 0.2 | 4.27 | % | 16.9 | 0.1 | 4.66 | % | 18.8 | 0.2 | 3.47 | % | ||||||||||||||||||||||||
|
|
|
|
|
|
|
|
|
|
|
|
|
|
|
|
|
|
|
|||||||||||||||||||
| US Treasury and government agency securities |
300.0 | 1.1 | 1.52 | % | 184.8 | 0.7 | 1.47 | % | 100.2 | 0.6 | 2.20 | % | ||||||||||||||||||||||||
| CMOs and mortgage backed securities |
3,324.5 | 19.1 | 2.30 | % | 3,379.2 | 19.2 | 2.27 | % | 3,725.4 | 21.6 | 2.33 | % | ||||||||||||||||||||||||
| Municipals (TE) |
199.3 | 2.3 | 4.63 | % | 203.7 | 2.4 | 4.62 | % | 235.8 | 2.4 | 4.14 | % | ||||||||||||||||||||||||
| Other securities |
12.3 | 0.1 | 2.24 | % | 12.3 | 0.1 | 2.21 | % | 9.3 | 0.1 | 2.49 | % | ||||||||||||||||||||||||
|
|
|
|
|
|
|
|
|
|
|
|
|
|
|
|
|
|
|
|||||||||||||||||||
| Total securities (TE) (j) |
3,836.1 | 22.6 | 2.36 | % | 3,780.0 | 22.4 | 2.36 | % | 4,070.7 | 24.7 | 2.43 | % | ||||||||||||||||||||||||
|
|
|
|
|
|
|
|
|
|
|
|
|
|
|
|
|
|
|
|||||||||||||||||||
| Total short-term investments |
481.4 | 0.3 | 0.23 | % | 425.3 | 0.3 | 0.23 | % | 383.6 | 0.2 | 0.23 | % | ||||||||||||||||||||||||
|
|
|
|
|
|
|
|
|
|
|
|
|
|
|
|
|
|
|
|||||||||||||||||||
| Average earning assets yield (TE) |
$ | 17,911.1 | 173.7 | 3.86 | % | $ | 17,324.4 | 175.4 | 4.02 | % | $ | 16,376.6 | 178.1 | 4.32 | % | |||||||||||||||||||||
|
|
|
|
|
|
|
|
|
|
|
|
|
|
|
|
|
|
|
|||||||||||||||||||
| INTEREST-BEARING LIABILITIES |
||||||||||||||||||||||||||||||||||||
| Interest-bearing transaction and savings deposits |
$ | 6,380.3 | 2.1 | 0.13 | % | $ | 6,160.9 | 1.6 | 0.11 | % | $ | 5,981.1 | 1.4 | 0.09 | % | |||||||||||||||||||||
| Time deposits |
2,064.3 | 3.5 | 0.68 | % | 1,955.3 | 3.1 | 0.64 | % | 2,197.5 | 3.3 | 0.60 | % | ||||||||||||||||||||||||
| Public funds |
1,598.5 | 1.1 | 0.28 | % | 1,547.5 | 1.1 | 0.27 | % | 1,253.2 | 0.7 | 0.21 | % | ||||||||||||||||||||||||
|
|
|
|
|
|
|
|
|
|
|
|
|
|
|
|
|
|
|
|||||||||||||||||||
| Total interest-bearing deposits |
10,043.1 | 6.7 | 0.27 | % | 9,663.7 | 5.8 | 0.24 | % | 9,431.8 | 5.4 | 0.23 | % | ||||||||||||||||||||||||
|
|
|
|
|
|
|
|
|
|
|
|
|
|
|
|
|
|
|
|||||||||||||||||||
| Short-term borrowings |
1,135.3 | 0.3 | 0.09 | % | 1,139.7 | 0.2 | 0.08 | % | 848.9 | 1.1 | 0.51 | % | ||||||||||||||||||||||||
| Long-term debt |
376.8 | 3.1 | 3.28 | % | 375.9 | 3.2 | 3.27 | % | 381.6 | 3.2 | 3.29 | % | ||||||||||||||||||||||||
|
|
|
|
|
|
|
|
|
|
|
|
|
|
|
|
|
|
|
|||||||||||||||||||
| Total borrowings |
1,512.1 | 3.4 | 0.88 | % | 1,515.6 | 3.4 | 0.87 | % | 1,230.5 | 4.3 | 1.37 | % | ||||||||||||||||||||||||
|
|
|
|
|
|
|
|
|
|
|
|
|
|
|
|
|
|
|
|||||||||||||||||||
| Total interest-bearing liabilities cost |
11,555.2 | 10.1 | 0.35 | % | 11,179.3 | 9.2 | 0.33 | % | 10,662.3 | 9.7 | 0.36 | % | ||||||||||||||||||||||||
|
|
|
|
|
|
|
|
|
|
|
|
|
|
|
|
|
|
|
|||||||||||||||||||
| Net interest-free funding sources |
6,355.9 | 6,145.1 | 5,714.3 | |||||||||||||||||||||||||||||||||
|
|
|
|
|
|
|
|
|
|
|
|
|
|
|
|
|
|
|
|||||||||||||||||||
| Total cost of funds |
17,911.1 | 10.1 | 0.23 | % | 17,324.4 | 9.2 | 0.21 | % | 16,376.6 | 9.7 | 0.23 | % | ||||||||||||||||||||||||
|
|
|
|
|
|
|
|
|
|
|
|
|
|
|
|
|
|
|
|||||||||||||||||||
| Net Interest Spread (TE) |
$ | 163.6 | 3.51 | % | $ | 166.2 | 3.69 | % | $ | 168.5 | 3.96 | % | ||||||||||||||||||||||||
|
|
|
|
|
|
|
|
|
|
|
|
|
|
|
|
|
|
|
|||||||||||||||||||
| Net Interest Margin (TE) |
$ | 17,911.1 | $ | 163.6 | 3.63 | % | $ | 17,324.4 | $ | 166.2 | 3.81 | % | $ | 16,376.6 | $ | 168.5 | 4.09 | % | ||||||||||||||||||
|
|
|
|
|
|
|
|
|
|
|
|
|
|
|
|
|
|
|
|||||||||||||||||||
| (j) | Average securities does not include unrealized holding gains/losses on available for sale securities. |
14
HANCOCK HOLDING COMPANY
AVERAGE BALANCE AND NET INTEREST MARGIN SUMMARY
(Unaudited)
| Twelve Months Ended | ||||||||||||||||||||||||
| 12/31/2014 | 12/31/2013 | |||||||||||||||||||||||
| (dollars in millions) |
Volume | Interest | Rate | Volume | Interest | Rate | ||||||||||||||||||
| AVERAGE EARNING ASSETS |
||||||||||||||||||||||||
| Commercial & real estate loans (TE) |
$ | 9,508.1 | $ | 430.2 | 4.52 | % | $ | 8,476.8 | $ | 430.3 | 5.08 | % | ||||||||||||
| Residential mortgage loans |
1,791.9 | 82.7 | 4.61 | % | 1,638.1 | 101.8 | 6.21 | % | ||||||||||||||||
| Consumer loans |
1,638.9 | 94.7 | 5.78 | % | 1,585.4 | 103.1 | 6.50 | % | ||||||||||||||||
| Loan fees & late charges |
— | 2.4 | 0.00 | % | — | 3.5 | 0.00 | % | ||||||||||||||||
|
|
|
|
|
|
|
|
|
|
|
|
|
|||||||||||||
| Total loans (TE) |
12,938.9 | 610.0 | 4.71 | % | 11,700.2 | 638.7 | 5.45 | % | ||||||||||||||||
|
|
|
|
|
|
|
|
|
|
|
|
|
|||||||||||||
| Loans held for sale |
16.5 | 0.7 | 4.28 | % | 25.0 | 0.9 | 3.60 | % | ||||||||||||||||
|
|
|
|
|
|
|
|
|
|
|
|
|
|||||||||||||
| US Treasury and government agency securities |
145.2 | 2.3 | 1.62 | % | 28.1 | 0.1 | 2.16 | % | ||||||||||||||||
| CMOs and mortgage backed securities |
3,450.9 | 79.6 | 2.31 | % | 3,870.1 | 81.9 | 2.12 | % | ||||||||||||||||
| Municipals (TE) |
206.4 | 9.5 | 4.61 | % | 233.3 | 10.3 | 4.43 | % | ||||||||||||||||
| Other securities |
14.2 | 0.3 | 2.22 | % | 8.5 | 0.2 | 2.44 | % | ||||||||||||||||
|
|
|
|
|
|
|
|
|
|
|
|
|
|||||||||||||
| Total securities (TE) (j) |
3,816.7 | 91.7 | 2.40 | % | 4,140.1 | 92.5 | 2.23 | % | ||||||||||||||||
|
|
|
|
|
|
|
|
|
|
|
|
|
|||||||||||||
| Total short-term investments |
423.4 | 1.0 | 0.23 | % | 578.6 | 1.4 | 0.24 | % | ||||||||||||||||
|
|
|
|
|
|
|
|
|
|
|
|
|
|||||||||||||
| Average earning assets yield (TE) |
$ | 17,195.5 | 703.4 | 4.09 | % | $ | 16,443.9 | 732.6 | 4.45 | % | ||||||||||||||
|
|
|
|
|
|
|
|
|
|
|
|
|
|||||||||||||
| INTEREST-BEARING LIABILITIES |
||||||||||||||||||||||||
| Interest-bearing transaction and savings deposits |
$ | 6,173.7 | 6.7 | 0.11 | % | $ | 5,962.1 | 6.0 | 0.10 | % | ||||||||||||||
| Time deposits |
2,053.5 | 12.8 | 0.62 | % | 2,350.5 | 14.9 | 0.63 | % | ||||||||||||||||
| Public funds |
1,531.0 | 3.7 | 0.24 | % | 1,410.7 | 3.3 | 0.23 | % | ||||||||||||||||
|
|
|
|
|
|
|
|
|
|
|
|
|
|||||||||||||
| Total interest-bearing deposits |
9,758.2 | 23.2 | 0.24 | % | 9,723.3 | 24.2 | 0.25 | % | ||||||||||||||||
|
|
|
|
|
|
|
|
|
|
|
|
|
|||||||||||||
| Short-term borrowings |
1,005.7 | 2.4 | 0.23 | % | 806.1 | 4.5 | 0.56 | % | ||||||||||||||||
| Long-term debt |
379.7 | 12.5 | 3.30 | % | 389.2 | 12.8 | 3.28 | % | ||||||||||||||||
|
|
|
|
|
|
|
|
|
|
|
|
|
|||||||||||||
| Total borrowings |
1,385.4 | 14.9 | 1.08 | % | 1,195.3 | 17.3 | 1.45 | % | ||||||||||||||||
|
|
|
|
|
|
|
|
|
|
|
|
|
|||||||||||||
| Total interest-bearing liabilities cost |
11,143.6 | 38.1 | 0.34 | % | 10,918.5 | 41.5 | 0.38 | % | ||||||||||||||||
|
|
|
|
|
|
|
|
|
|
|
|
|
|||||||||||||
| Net interest-free funding sources |
6,051.9 | 5,525.4 | ||||||||||||||||||||||
|
|
|
|
|
|
|
|
|
|
|
|
|
|||||||||||||
| Total cost of funds |
17,195.5 | 38.1 | 0.22 | % | 16,443.9 | 41.5 | 0.25 | % | ||||||||||||||||
|
|
|
|
|
|
|
|
|
|
|
|
|
|||||||||||||
| Net Interest Spread (TE) |
$ | 665.3 | 3.75 | % | $ | 691.1 | 4.07 | % | ||||||||||||||||
|
|
|
|
|
|
|
|
|
|
|
|
|
|||||||||||||
| Net Interest Margin (TE) |
$ | 17,195.5 | $ | 665.3 | 3.87 | % | $ | 16,443.9 | $ | 691.1 | 4.20 | % | ||||||||||||
|
|
|
|
|
|
|
|
|
|
|
|
|
|||||||||||||
| (j) | Average securities does not include unrealized holding gains/losses on available for sale securities. |
15
HANCOCK HOLDING COMPANY
ASSET QUALITY INFORMATION
(Unaudited)
| Three Months Ended | Twelve Months Ended | |||||||||||||||||||
| (dollars in thousands) |
12/31/2014 | 9/30/2014 | 12/31/2013 | 12/31/2014 | 12/31/2013 | |||||||||||||||
| Nonaccrual loans (k) |
$ | 79,537 | $ | 83,154 | $ | 99,711 | $ | 79,537 | $ | 99,711 | ||||||||||
| Restructured loans - still accruing |
8,971 | 7,944 | 9,247 | 8,971 | 9,247 | |||||||||||||||
|
|
|
|
|
|
|
|
|
|
|
|||||||||||
| Total nonperforming loans |
88,508 | 91,098 | 108,958 | 88,508 | 108,958 | |||||||||||||||
| ORE and foreclosed assets |
59,569 | 56,081 | 76,979 | 59,569 | 76,979 | |||||||||||||||
|
|
|
|
|
|
|
|
|
|
|
|||||||||||
| Total nonperforming assets |
$ | 148,077 | $ | 147,179 | $ | 185,937 | $ | 148,077 | $ | 185,937 | ||||||||||
|
|
|
|
|
|
|
|
|
|
|
|||||||||||
| Nonperforming assets as a percent of loans, ORE and foreclosed assets |
1.06 | % | 1.10 | % | 1.50 | % | 1.06 | % | 1.50 | % | ||||||||||
| Accruing loans 90 days past due |
$ | 4,825 | $ | 6,667 | $ | 10,387 | $ | 4,825 | $ | 10,387 | ||||||||||
| Accruing loans 90 days past due as a percent of loans |
0.03 | % | 0.05 | % | 0.08 | % | 0.03 | % | 0.08 | % | ||||||||||
| Nonperforming assets + accruing loans 90 days past due to loans, ORE and foreclosed assets |
1.10 | % | 1.15 | % | 1.58 | % | 1.10 | % | 1.58 | % | ||||||||||
|
|
|
|
|
|
|
|
|
|
|
|||||||||||
| ALLOWANCE FOR LOAN LOSSES |
||||||||||||||||||||
| Beginning Balance |
$ | 125,572 | $ | 128,672 | $ | 138,223 | $ | 133,626 | $ | 136,171 | ||||||||||
| Net provision for loan losses - covered loans |
(160 | ) | (391 | ) | (532 | ) | (926 | ) | 7,455 | |||||||||||
| Provision for loan losses - noncovered loans |
9,878 | 9,859 | 7,863 | 34,766 | 25,279 | |||||||||||||||
|
|
|
|
|
|
|
|
|
|
|
|||||||||||
| Net provision for loan losses |
9,718 | 9,468 | 7,331 | 33,840 | 32,734 | |||||||||||||||
|
|
|
|
|
|
|
|
|
|
|
|||||||||||
| (Decrease) increase in FDIC loss share receivable |
(4,514 | ) | (6,695 | ) | (10,111 | ) | (19,084 | ) | (8,615 | ) | ||||||||||
| Net charge-offs - covered |
(624 | ) | (566 | ) | (3,399 | ) | 2,501 | 2,355 | ||||||||||||
| Charge-offs - noncovered |
8,229 | 8,482 | 11,515 | 31,502 | 42,899 | |||||||||||||||
| Recoveries - noncovered |
(5,591 | ) | (2,043 | ) | (6,299 | ) | (14,383 | ) | (18,590 | ) | ||||||||||
|
|
|
|
|
|
|
|
|
|
|
|||||||||||
| Net charge-offs |
2,014 | 5,873 | 1,817 | 19,620 | 26,664 | |||||||||||||||
|
|
|
|
|
|
|
|
|
|
|
|||||||||||
| Ending Balance |
$ | 128,762 | $ | 125,572 | $ | 133,626 | $ | 128,762 | $ | 133,626 | ||||||||||
|
|
|
|
|
|
|
|
|
|
|
|||||||||||
| Allowance for loan losses as a percent of period-end loans |
0.93 | % | 0.94 | % | 1.08 | % | 0.93 | % | 1.08 | % | ||||||||||
| Allowance for loan losses to nonperforming loans + accruing loans 90 days past due |
137.96 | % | 128.44 | % | 111.97 | % | 137.96 | % | 111.97 | % | ||||||||||
|
|
|
|
|
|
|
|
|
|
|
|||||||||||
| NET CHARGE-OFF INFORMATION |
||||||||||||||||||||
| Net charge-offs - noncovered: |
||||||||||||||||||||
| Commercial & real estate loans |
$ | 1,446 | $ | 2,451 | $ | 2,183 | $ | 6,437 | $ | 11,684 | ||||||||||
| Residential mortgage loans |
349 | 558 | (197 | ) | 1,641 | 361 | ||||||||||||||
| Consumer loans |
843 | 3,430 | 3,230 | 9,041 | 12,264 | |||||||||||||||
|
|
|
|
|
|
|
|
|
|
|
|||||||||||
| Total net charge-offs - noncovered |
$ | 2,638 | $ | 6,439 | $ | 5,216 | $ | 17,119 | $ | 24,309 | ||||||||||
|
|
|
|
|
|
|
|
|
|
|
|||||||||||
| Net charge-offs - noncovered to average loans: |
||||||||||||||||||||
| Commercial & real estate loans |
0.06 | % | 0.10 | % | 0.10 | % | 0.07 | % | 0.14 | % | ||||||||||
| Residential mortgage loans |
0.07 | % | 0.12 | % | (0.05 | )% | 0.09 | % | 0.02 | % | ||||||||||
| Consumer loans |
0.19 | % | 0.82 | % | 0.81 | % | 0.55 | % | 0.77 | % | ||||||||||
|
|
|
|
|
|
|
|
|
|
|
|||||||||||
| Total net charge-offs - noncovered to average loans |
0.08 | % | 0.19 | % | 0.17 | % | 0.13 | % | 0.21 | % | ||||||||||
|
|
|
|
|
|
|
|
|
|
|
|||||||||||
| (k) | Nonaccrual loans and accruing loans past due 90 days or more do not include acquired credit-impaired loans which were written down to fair value upon acquisition and accrete interest income over the remaining life of the loan. Included in nonaccrual loans are $7.0 million, $9.9 million, and $15.7 million at 12/31/14, 9/30/14 and 12/31/13, respectively, in nonaccruing restructured loans. |
16
HANCOCK HOLDING COMPANY
ASSET QUALITY INFORMATION
(Unaudited)
| Three months ended | ||||||||||||||||||||
| (dollars in thousands) |
12/31/2014 | 9/30/2014 | 6/30/2014 | 3/31/2014 | 12/31/2013 | |||||||||||||||
| Nonaccrual loans |
$ | 79,537 | $ | 83,154 | $ | 89,901 | $ | 101,400 | $ | 99,711 | ||||||||||
| Restructured loans - still accruing |
8,971 | 7,944 | 7,868 | 8,459 | 9,247 | |||||||||||||||
|
|
|
|
|
|
|
|
|
|
|
|||||||||||
| Total nonperforming loans |
88,508 | 91,098 | 97,769 | 109,859 | 108,958 | |||||||||||||||
| ORE and foreclosed assets |
59,569 | 56,081 | 59,732 | 69,813 | 76,979 | |||||||||||||||
|
|
|
|
|
|
|
|
|
|
|
|||||||||||
| Total nonperforming assets |
$ | 148,077 | $ | 147,179 | $ | 157,501 | $ | 179,672 | $ | 185,937 | ||||||||||
|
|
|
|
|
|
|
|
|
|
|
|||||||||||
| Nonperforming assets as a percent of loans, ORE and foreclosed assets |
1.06 | % | 1.10 | % | 1.22 | % | 1.43 | % | 1.50 | % | ||||||||||
| Accruing loans 90 days past due |
$ | 4,825 | $ | 6,667 | $ | 4,142 | $ | 3,998 | $ | 10,387 | ||||||||||
| Accruing loans 90 days past due as a percent of loans |
0.03 | % | 0.05 | % | 0.03 | % | 0.03 | % | 0.08 | % | ||||||||||
| Nonperforming assets + accruing loans 90 days past due to loans, ORE and foreclosed assets |
1.10 | % | 1.15 | % | 1.25 | % | 1.46 | % | 1.58 | % | ||||||||||
|
|
|
|
|
|
|
|
|
|
|
|||||||||||
| Allowance for loan losses |
$ | 128,762 | $ | 125,572 | $ | 128,672 | $ | 128,248 | $ | 133,626 | ||||||||||
| Allowance for loan losses as a percent of period-end loans |
0.93 | % | 0.94 | % | 1.00 | % | 1.02 | % | 1.08 | % | ||||||||||
| Allowance for loan losses to nonperforming loans + accruing loans 90 days past due |
137.96 | % | 128.44 | % | 126.26 | % | 112.64 | % | 111.97 | % | ||||||||||
|
|
|
|
|
|
|
|
|
|
|
|||||||||||
| Provision for loan losses |
$ | 9,718 | $ | 9,468 | $ | 6,691 | $ | 7,963 | $ | 7,331 | ||||||||||
|
|
|
|
|
|
|
|
|
|
|
|||||||||||
| NET CHARGE-OFF INFORMATION |
||||||||||||||||||||
| Net charge-offs - noncovered: |
||||||||||||||||||||
| Commercial & real estate loans |
$ | 1,446 | $ | 2,451 | $ | 1,148 | $ | 1,392 | $ | 2,183 | ||||||||||
| Residential mortgage loans |
349 | 558 | 587 | 147 | (197 | ) | ||||||||||||||
| Consumer loans |
843 | 3,430 | 2,329 | 2,439 | 3,230 | |||||||||||||||
|
|
|
|
|
|
|
|
|
|
|
|||||||||||
| Total net charge-offs - noncovered |
$ | 2,638 | $ | 6,439 | $ | 4,064 | $ | 3,978 | $ | 5,216 | ||||||||||
|
|
|
|
|
|
|
|
|
|
|
|||||||||||
| Net charge-offs - noncovered to average loans: |
||||||||||||||||||||
| Commercial & real estate loans |
0.06 | % | 0.10 | % | 0.05 | % | 0.06 | % | 0.10 | % | ||||||||||
| Residential mortgage loans |
0.07 | % | 0.12 | % | 0.13 | % | 0.03 | % | (0.05 | )% | ||||||||||
| Consumer loans |
0.19 | % | 0.82 | % | 0.59 | % | 0.63 | % | 0.81 | % | ||||||||||
|
|
|
|
|
|
|
|
|
|
|
|||||||||||
| Total net charge-offs - noncovered to average loans |
0.08 | % | 0.19 | % | 0.13 | % | 0.13 | % | 0.17 | % | ||||||||||
|
|
|
|
|
|
|
|
|
|
|
|||||||||||
| AVERAGE LOANS |
||||||||||||||||||||
| Commercial & real estate loans |
$ | 9,943,403 | $ | 9,627,566 | $ | 9,355,196 | $ | 9,095,606 | $ | 8,629,013 | ||||||||||
| Residential mortgage loans |
1,886,230 | 1,814,186 | 1,744,313 | 1,720,640 | 1,701,144 | |||||||||||||||
| Consumer loans |
1,748,590 | 1,660,356 | 1,581,352 | 1,563,070 | 1,573,446 | |||||||||||||||
|
|
|
|
|
|
|
|
|
|
|
|||||||||||
| Total average loans |
$ | 13,578,223 | $ | 13,102,108 | $ | 12,680,861 | $ | 12,379,316 | $ | 11,903,603 | ||||||||||
|
|
|
|
|
|
|
|
|
|
|
|||||||||||
17
HANCOCK HOLDING COMPANY
SUPPLEMENTAL ASSET QUALITY INFORMATION
(Unaudited)
| Originated Loans | Acquired Loans (l) | FDIC Acquired (m) | Total | |||||||||||||
| (dollars in thousands) |
12/31/2014 | |||||||||||||||
| Nonaccrual loans (n) |
$ | 71,296 | $ | 6,139 | $ | 2,102 | $ | 79,537 | ||||||||
| Restructured loans - still accruing |
8,971 | — | — | 8,971 | ||||||||||||
|
|
|
|
|
|
|
|
|
|||||||||
| Total nonperforming loans |
80,267 | 6,139 | 2,102 | 88,508 | ||||||||||||
| ORE and foreclosed assets (o) |
40,148 | — | 19,421 | 59,569 | ||||||||||||
|
|
|
|
|
|
|
|
|
|||||||||
| Total nonperforming assets |
$ | 120,415 | $ | 6,139 | $ | 21,523 | $ | 148,077 | ||||||||
|
|
|
|
|
|
|
|
|
|||||||||
| Accruing loans 90 days past due |
$ | 4,564 | $ | 261 | — | $ | 4,825 | |||||||||
| Allowance for loan losses |
$ | 97,701 | $ | 477 | $ | 30,584 | $ | 128,762 | ||||||||
|
|
|
|
|
|
|
|
|
|||||||||
| 9/30/2014 | ||||||||||||||||
| Nonaccrual loans (n) |
$ | 68,362 | $ | 11,572 | $ | 3,220 | $ | 83,154 | ||||||||
| Restructured loans - still accruing |
7,944 | — | — | 7,944 | ||||||||||||
|
|
|
|
|
|
|
|
|
|||||||||
| Total nonperforming loans |
76,306 | 11,572 | 3,220 | 91,098 | ||||||||||||
| ORE and foreclosed assets (o) |
38,096 | — | 17,985 | 56,081 | ||||||||||||
|
|
|
|
|
|
|
|
|
|||||||||
| Total nonperforming assets |
$ | 114,402 | $ | 11,572 | $ | 21,205 | $ | 147,179 | ||||||||
|
|
|
|
|
|
|
|
|
|||||||||
| Accruing loans 90 days past due |
$ | 5,149 | $ | 1,518 | — | $ | 6,667 | |||||||||
| Allowance for loan losses |
$ | 81,822 | $ | 9,117 | $ | 34,633 | $ | 125,572 | ||||||||
|
|
|
|
|
|
|
|
|
|||||||||
| Originated Loans | Acquired Loans (l) | FDIC Acquired (m) | Total | |||||||||||||
| LOANS OUTSTANDING |
12/31/2014 | |||||||||||||||
| Commercial non-real estate loans |
$ | 5,917,728 | $ | 120,137 | $ | 6,195 | $ | 6,044,060 | ||||||||
| Construction and land development loans |
1,073,964 | 21,123 | 11,674 | 1,106,761 | ||||||||||||
| Commercial real estate loans |
2,428,195 | 688,045 | 27,808 | 3,144,048 | ||||||||||||
| Residential mortgage loans |
1,704,770 | 2,378 | 187,033 | 1,894,181 | ||||||||||||
| Consumer loans |
1,685,542 | 985 | 19,699 | 1,706,226 | ||||||||||||
|
|
|
|
|
|
|
|
|
|||||||||
| Total loans |
$ | 12,810,199 | $ | 832,668 | $ | 252,409 | $ | 13,895,276 | ||||||||
|
|
|
|
|
|
|
|
|
|||||||||
| Change in loan balance from previous quarter |
$ | 1,524,631 | ($ | 949,508 | ) | ($ | 28,421 | ) | $ | 546,702 | ||||||
|
|
|
|
|
|
|
|
|
|||||||||
| 9/30/2014 | ||||||||||||||||
| Commercial non-real estate loans |
$ | 4,806,740 | $ | 769,226 | $ | 11,171 | $ | 5,587,137 | ||||||||
| Construction and land development loans |
974,442 | 110,294 | 11,166 | 1,095,902 | ||||||||||||
| Commercial real estate loans |
2,245,855 | 813,429 | 41,550 | 3,100,834 | ||||||||||||
| Residential mortgage loans |
1,635,462 | 37,739 | 185,289 | 1,858,490 | ||||||||||||
| Consumer loans |
1,623,069 | 51,488 | 31,654 | 1,706,211 | ||||||||||||
|
|
|
|
|
|
|
|
|
|||||||||
| Total loans |
$ | 11,285,568 | $ | 1,782,176 | $ | 280,830 | $ | 13,348,574 | ||||||||
|
|
|
|
|
|
|
|
|
|||||||||
| Change in loan balance from previous quarter |
$ | 627,116 | ($ | 139,603 | ) | ($ | 22,995 | ) | $ | 464,518 | ||||||
|
|
|
|
|
|
|
|
|
|||||||||
| (l) | Loans which have been acquired and no allowance brought forward in accordance with acquisition accounting. Acquired-performing loans in pools with fully accreted purchase fair value discounts are reported as originated loans. |
| (m) | Loans acquired in an FDIC-assisted transaction. Non-single family loss share agreement expired at 12/31/14. As of 12/31/14, $196.7 million in loans and $7.1 million in ORE remain covered by the FDIC single family loss share agreement, providing considerable protection against credit risk. |
| (n) | Included in originated nonaccrual loans are $7.0 million and $9.9 million at 12/31/14 and 09/30/14, respectively, in nonaccruing restructured loans. |
| (o) | ORE received in settlement of acquired loans is no longer subject to purchase accounting guidance and has been included with ORE from originated loans. ORE received in settlement of covered loans remains covered under the FDIC loss share agreements. |
18
 Fourth Quarter 2014
Financial Results
January 22, 2015
Fourth Quarter 2014
Financial Results
January 22, 2015 |
 Certain of the statements or information included in this presentation
may constitute forward-looking statements.
Forward-looking statements include projections of revenue,
costs, results of operations or financial condition or statements
regarding future market conditions or our potential plans and
strategies for the future. Hancock’s ability to
accurately project results, predict the effects of future plans or
strategies, or predict market or economic developments is
inherently limited. We believe that the expectations
reflected or implied by any forward-looking statements are
based on reasonable assumptions, but actual results and performance could differ
materially from those set forth in the forward-looking
statements. Factors that could cause actual results or
outcomes to differ from those expressed in the Company's
forward-looking statements include, but are not limited to, those
outlined in Hancock's SEC filings, including the “Risk
Factors” section of the Company’s 10-K for the
year ended December 31, 2013 and form 10-Q for the most
recent quarter end. Hancock undertakes no obligation to
update or revise any forward-looking statements, and you are
cautioned not to place undue reliance on such forward-looking statements.
Forward Looking Statement
2 |
 Hancock Holding Company
•
$21 billion in Total Assets
•
$14 billion in Total Loans
•
$17 billion in Total Deposits
•
ROA (operating) 0.92%
•
ROTCE (operating) 10.50%
•
NIM 3.63%
•
Efficiency Ratio 62.4%
•
Tangible Common Equity (TCE) 8.59%
•
Rated among the strongest, safest
financial institutions in the country by
BauerFinancial, Inc.
•
Earned top customer service marks with
Greenwich Excellence Awards
As
of
December
31,
2014
and
4
th
quarter
of
2014
3 |
 2014 Highlights
•
Core earnings up $38 million, or 31%, and covered
120% of the after-tax runoff in purchase accounting
adjustments
•
Core E.P.S. up $.47 or 33%
•
Loans up $1.6 billion, or 13%, funded almost
entirely by deposit growth (up $1.2 billion, or 8%)
•
Stable core NIM
•
Achieved $50 million cost reduction goal
3 quarters early
•
Core revenue growth began in second half of 2014
and helped lower the operating efficiency ratio
314bps
•
Maintained strong credit quality and solid capital
4
($s in millions; except per share
data)
2014
2013
Fav/
(unfav)
Net Income
$175.7
$163.4
8%
Earnings Per Share (diluted)
$2.10
$1.93
9%
Operating Income*
$194.1
$188.0
3%
Operating Earnings Per Share
$2.32
$2.22
4%
Core Income**
$159.2
$121.1
31%
Core Earnings Per Share
$1.90
$1.43
33%
Nonoperating expense items
$25.7
$38.0
32%
Return on Assets (operating) (%)
1.00
0.99
1bp
Return on Tangible Common
Equity (operating) (%)
11.37
11.85
(48bps)
Total Loans
$13,895
$12,325
13%
Total Deposits
$16,573
$15,361
8%
Net Interest Margin (%)
3.87
4.20
(33bps)
Net Interest Margin (%) (core)
3.33
3.39
(6bps)
Net Charge-offs (%)
(non-covered)
0.13
0.21
8bps
Tangible Common Equity (%)
8.59
9.00
(41bps)
Efficiency Ratio*** (%)
62.03
65.17
314bps
* Operating income is defined as net income
excluding tax-effected securities transactions gains or losses and nonoperating expense items.
** Core income is defined as operating income less purchase
accounting adjustments. See table on slide 28. *** Noninterest expense to total revenue (TE) excluding amortization of
purchased intangibles, nonoperating expense items, and securities transactions.
|
 Fourth Quarter 2014 Highlights
•
Steep declines in purchase accounting
adjustments over the last 2 quarters ($5 million in
each 3Q & 4Q) were offset by higher core
earnings with only a slight drop in operating
earnings
•
Higher core revenue of $7 million over the last 2
quarters achieved with operating expenses
essentially flat
•
Organic balance sheet growth momentum builds
in 4Q with loans up $547 million, or 16% LQA,
funded entirely by deposits (up $836 million, or
21% LQA)
•
Solid capital with a tangible common equity
(TCE) ratio at 8.59%, after using approximately
$38 million of capital to buyback stock during
the quarter and notwithstanding strong asset
growth
•
Minimal net charge-offs with a $7 million
increase in the allowance for noncovered loans
($s in millions; except per share
data)
4Q14
3Q14
Fav/
(unfav)
Net Income
$40.1
$46.6
(14%)
Earnings Per Share (diluted)
$.48
$.56
(14%)
Operating Income*
$46.4
$49.1
(5%)
Operating Earnings Per Share
$.56
$.59
(5%)
Core Income**
$41.5
$41.2
1%
Core Earnings Per Share
$.50
$.49
2%
Nonoperating expense items
$9.7
$3.9
n/m
Return on Assets (operating) (%)
0.92
1.00
(8bps)
Return on Tangible Common
Equity (operating) (%)
10.50
11.28
(78bps)
Total Loans
$13,895
$13,349
4%
Total Deposits
$16,573
$15,737
5%
Net Interest Margin (%)
3.63
3.81
(18bps)
Net Interest Margin (%) (core)
3.27
3.32
(5bps)
Net Charge-offs (%)
(non-covered)
0.08
0.19
11bps
Tangible Common Equity (%)
8.59
9.10
(51bps)
Efficiency Ratio*** (%)
62.41
61.84
(57bps)
5
* Operating income is defined as net income
excluding tax-effected securities transactions gains or losses and nonoperating expense items.
** Core income is defined as operating income less purchase
accounting adjustments. See table on slide 28. *** Noninterest expense to total revenue (TE) excluding amortization of
purchased intangibles, nonoperating expense items, and securities transactions. |
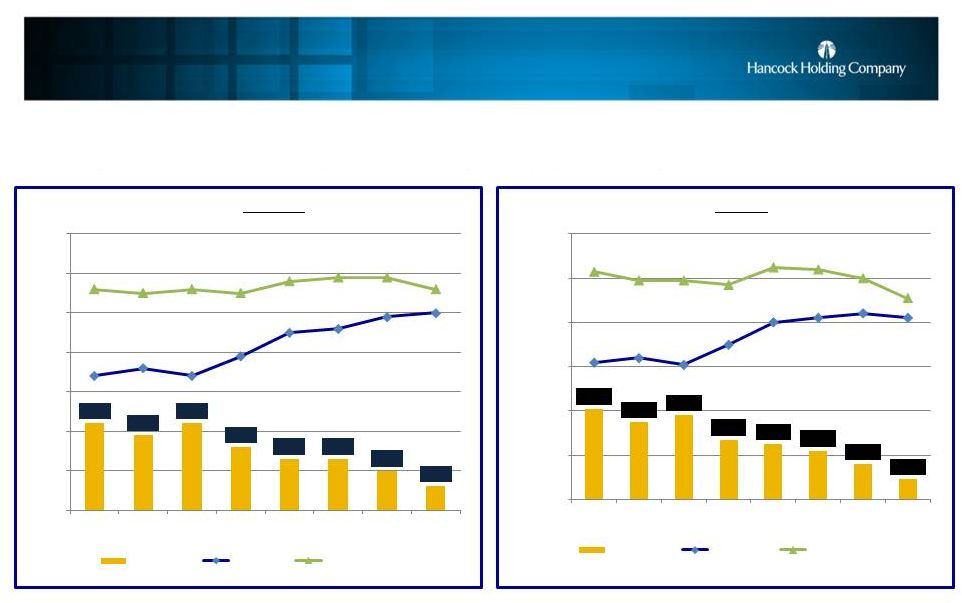 Improving Trends in Core Results;
Narrowing The Gap Between Operating and Core
6
E.P.S.
ROA
Core income is defined as operating income less purchase accounting
adjustments (PAA). PAA items include loan accretion from Whitney and Peoples First, offset by amortization of the
Whitney bond portfolio premium, amortization of the Peoples First
indemnification asset and amortization of intangibles. Operating income is defined as net income excluding tax-effected
securities transactions gains or losses and nonoperating expense
items. See table on slide 28.
Expect to eliminate the gap and begin reporting growth in operating
results in 2015 $0.34
$0.36
$0.34
$0.39
$0.45
$0.46
$0.49
$0.50
$0.56
$0.55
$0.56
$0.55
$0.58
$0.59
$0.59
$0.56
$0.00
$0.10
$0.20
$0.30
$0.40
$0.50
$0.60
$0.70
1Q13
2Q13
3Q13
4Q13
1Q14
2Q14
3Q14
4Q14
"PAA Gap"
Core EPS
Operating EPS
$0.22
$0.19
$0.22
$0.16
$0.13
$0.13
$0.10
$0.06
0.00%
0.20%
0.40%
0.60%
0.80%
1.00%
1.20%
1Q13
2Q13
3Q13
4Q13
1Q14
2Q14
3Q14
4Q14
0.62%
0.64%
0.61%
0.70%
0.80%
0.82%
0.84%
0.82%
1.03%
0.99%
0.99%
0.97%
1.05%
1.04%
1.00%
0.92%
0.41%
0.35%
0.38%
0.27%
0.25%
0.22%
0.16%
0.10%
"PAA Gap"
Core ROA
Operating ROA |
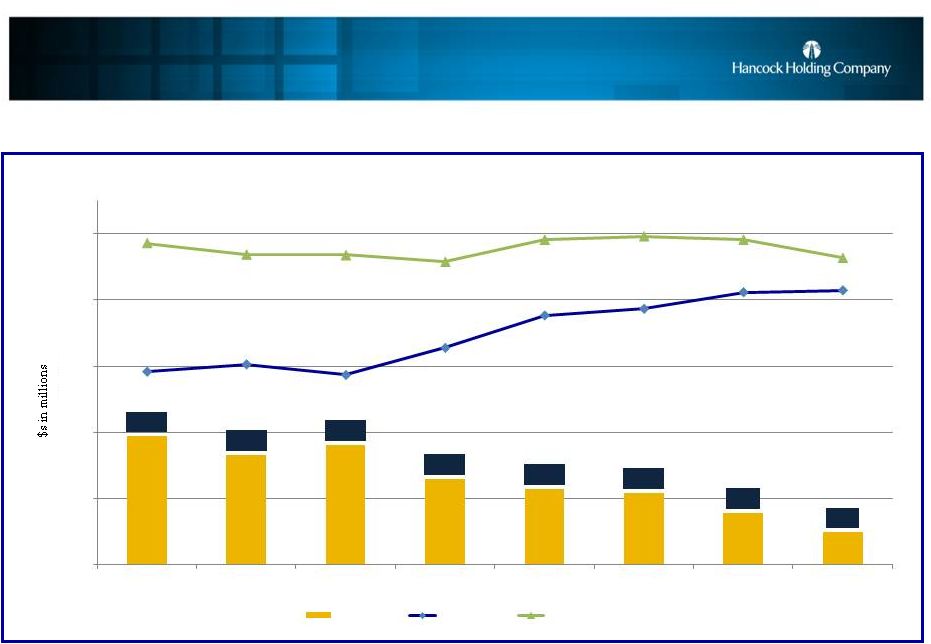 Less Than $5 Million Quarterly Gap
Between Operating and Core Net Income
Core income is defined as operating income less purchase accounting
adjustments (PAA). PAA items include loan accretion from Whitney and Peoples First, offset by amortization of the
Whitney bond portfolio premium, amortization of the Peoples First
indemnification asset and amortization of intangibles. Operating income is defined as net income excluding tax-effected
securities transactions gains or losses and nonoperating expense
items. See table on slide 28.
$12.3 million increase in quarterly core earnings since 1Q13 offset 85%
of the decline in PAA income 7
$0
$10
$20
$30
$40
$50
1Q13
2Q13
3Q13
4Q13
1Q14
2Q14
3Q14
4Q14
$19.4
$16.6
$18.1
$13.0
$11.4
$10.9
$7.9
$4.9
$29.2
$30.3
$28.7
$32.8
$37.7
$38.7
$41.2
$41.5
$48.6
$46.9
$46.8
$45.8
$49.1
$49.6
$49.1
$46.4
"PAA Gap"
Core income
Operating income |
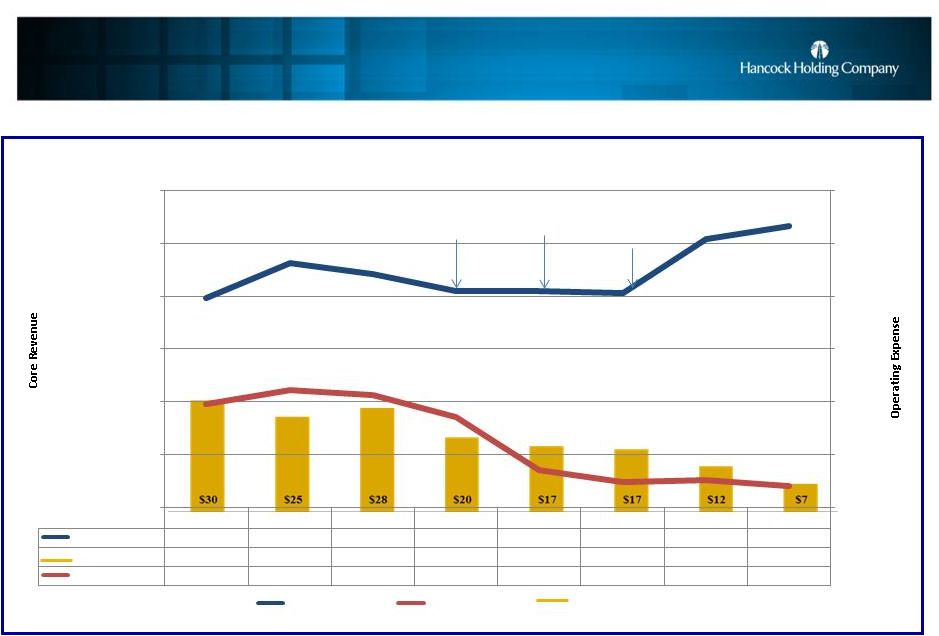 Switch From Focus On Expense Reductions To
Revenue Growth In Offsetting Declining PAA
8
Insurance
Business Lines
Divestiture
26 Branch
Closures
12 Branch
Sales/Closures
$s in millions
Core revenue up $7 million last 2 quarters while operating expense down
$1 million Core income is defined as operating income less
purchase accounting adjustments (PAA). PAA items include loan accretion from Whitney and Peoples First, offset by amortization of the
Whitney bond portfolio premium, amortization of the Peoples First
indemnification asset and amortization of intangibles. Operating income is defined as net income excluding tax-effected
securities transactions gains or losses and nonoperating expense
items. See table on slide 28.
1Q13
2Q13
3Q13
4Q13
1Q14
2Q14
3Q14
4Q14
Core Revenue (TE)
$200
$203
$202
$201
$201
$200
$205
$207
PAA impact (pre-tax)
$30
$25
$28
$20
$17
$17
$12
$7
Operating Expense
$160
$162
$161
$157
$147
$145
$145
$144
$140
$150
$160
$170
$180
$190
$200
$180
$185
$190
$195
$200
$205
$210
Core Revenue (TE)
Operating Expense
PAA impact (pre-tax) |
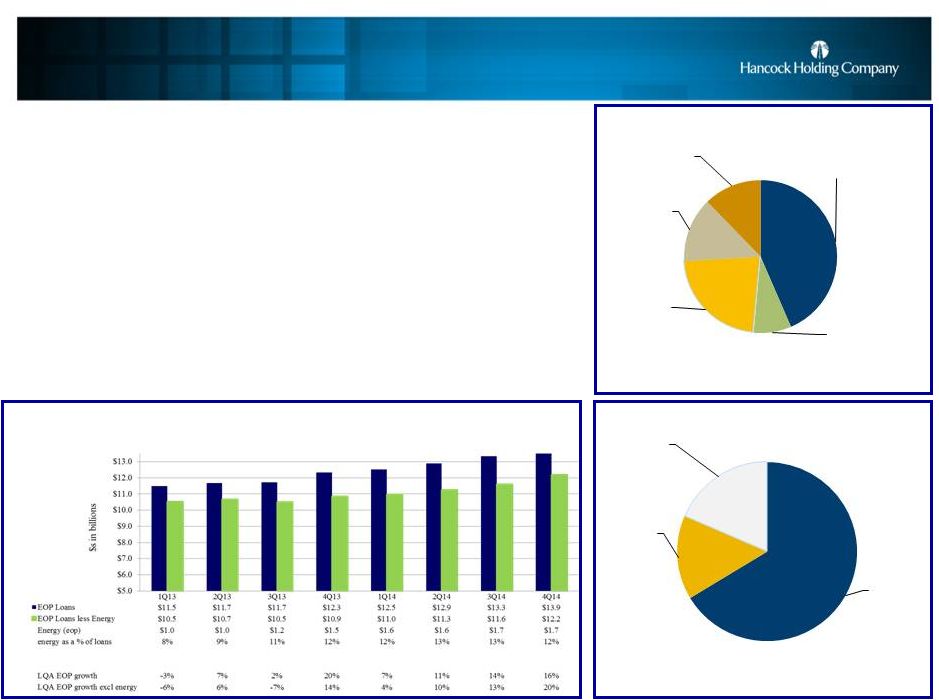 Loans Have Grown Steadily Since 1Q13
•
Total EOP loans of $13.9 billion were up $547 million,
or 16% LQA
•
All markets across the franchise reported net loan
growth during the quarter, with south Louisiana,
Houston and central Florida generating two-thirds of the
growth
•
Energy loans totaled $1.7 billion or 12% of total loans
at December 31, 2014; minimal energy portfolio growth
in the second half of 2014
$s in millions
$s in millions
9
Commercial
& RE loans
$316
66%
Mortgage
$72
15%
Consumer
$88
19%
Average 4th qtr
net loan growth by category
+$476 million
C&I
$6,044
43%
C&D
$1,107
8%
CRE
$3,144
23%
Mortgage
$1,894
14%
Consumer
$1,706
12%
Total Loans
$13,895 million
12/31/14 |
 Energy Concentration Risk Is
Well-Managed
•
Energy lending has been a core competency for more than 60 years
•
Disciplined underwriting, long term relationships
•
Reviewed all energy clients with $1 million or greater in exposure
and stress tested the entire energy portfolio
•
Should pricing pressures on oil continue, we could see some
downward pressure on risk ratings that could lead to additional
provision expense in future quarters
•
Impact and severity will depend on overall oil price reduction and
duration of the cycle
•
Management believes that even if downgrades occur, they will not
result in significant losses
10
As of December 31, 2014 |
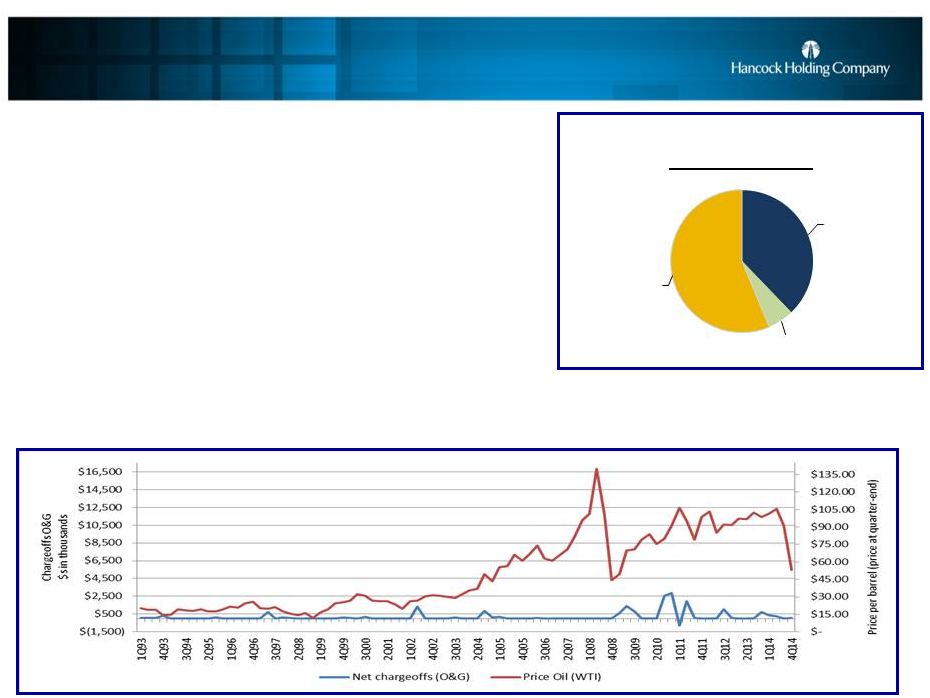 Oil & Gas Portfolio Strong;
Monitoring For Signs of Stress
•
Relationship business dating back to post WWII
•
Excellent source of no/low cost core deposits
•
Low prices can limit loan growth for new bank customers
•
High credit quality portfolio
•
After coming off 4 good years in the industry, our clients
typically have low/moderate leverage and strong balance sheets
•
With experienced management in place, many of our clients
have been reacting to the reduction in oil prices by proactively
managing expenses, lowering discretionary spending or
reducing capital expenditures
11
As of December 31, 2014
$s in millions
Diversified portfolio with concentration limits for
individual categories
High credit quality portfolio with historically low loss rates;
disciplined underwriting Low level of cumulative losses over
previous down cycles E&P (RBL)
$648
38%
Product
Transportation
$102
6%
Support
$964
56%
Oil & Gas Portfolio 12/31/14
(outstandings=$1.7B) |
 E&P (RBL) Portfolio Diversified,
Profitable
•
Priority, secured loans
•
59% private companies, 41% public companies
•
Approximately 60% oil, 40% gas
•
Lend
only
on
proved
reserves
(on
a
risked
basis);
90%+
are
covered
by
Proved
Developed
Producing
Reserves alone
•
75% of our E&P customers have hedges in place;
average tenor 2 years
•
Our clients breakeven at different prices/barrel oil
–
Breakeven varies depending on the basin
–
Our customers are diversified across 12 primary basins in the
U.S. and in the Gulf of Mexico –
Average
cash
flow
breakeven
price
per
barrel
of
oil
extracted,
for
our
clients,
based
on
current
proved,
producing reserves
is approximately $25 per barrel (ie. lifting costs, taxes)
–
Lower cost basins will remain active; higher cost basins will slow in
activity •
Underwriting price decks lowered in line with the NYMEX strip price;
based on a longer-term forecast
•
Borrowing base redeterminations twice per year
•
Current line utilization is approximately 58%
12
As of December 31, 2014
E. Tx/Barnett
6%
Rockies
16%
Black Warrior
1%
Eagle Ford
7%
Raton
2%
Mid-continent
22%
LA onshore
4%
California
1%
Permian Basin
15%
Appalachia
3%
Gulf of Mexico -
shelf
20%
Gulf of Mexico -
deep water
3%
% of E&P portfolio |
 Support Sector Companies Have
Weathered Previous Cycles
•
Many of our clients have operated through previous cycles,
including the mid 80s, late 90’s and 2008
•
Our clients typically have low/moderate leverage,
strong balance sheets and experienced management
•
Support drilling:
–
Contract drillers (33%), Rental tools (30%),
Completion services (24%), Other (13%)
•
Support nondrilling:
–
Helicopter and marine transportation (52%)
–
Fabrication, Construction, Installation (21%)
–
Other (i.e. Engineering, Inspection, Diving,
Management) (19%)
–
Supply/Manufacturing (8%)
–
Most of the support nondrilling companies are
based in south Louisiana and Houston, and many are supporting offshore
activity •
Day rates and service sector profitability will be impacted, but
we believe current
margins and liquidity will cushion the impact for our customers
•
Current line utilization is approximately 57%
13
As of December 31, 2014
Current clients
Average
years in
business
Average
years with
the bank
Support drilling
29
17
Support nondrilling
27
15
$s in millions
Support -
drilling
$310
32%
Support -
nondrilling
(transportation)
$342
36%
Support -
nondrilling (other)
$311
32%
Support Sector 12/31/14
(outstandings=$1.0B) |
 Allowance For Loan Losses
•
The allowance for loan losses was $128.8 million (0.93%) compared to
$125.6 million (0.94%) linked-quarter
–
The allowance maintained on the non-FDIC acquired portion of the
loan portfolio increased $7.2 million linked-quarter,
totaling $98.2 million and the impaired reserve on the FDIC
acquired loan portfolio declined $4.0 million linked-quarter
–
Impact of the current energy cycle on the allowance:
–
Year-end allowance calculation reflects our review of all $1
million+ energy
credits and stress testing of the entire energy portfolio
–
We are disciplined in our underwriting, and while we could see some
pressure in risk ratings, based on what we know today we expect
no significant loss in our energy portfolio
–
We believe our current reserves are sufficient to cover any losses in
the portfolio –
Should pricing pressures on oil continue, we could see some downward
pressure on risk ratings that could lead to additional
provision expense in future quarters –
Impact and severity will depend on overall oil price reduction and
duration of the cycle
14
As of December 31, 2014 |
 Solid Asset Quality Metrics
•
NPA ratio 1.06%, down from 1.10% linked-quarter
–
Nonperforming assets totaled $148 million, up less than $1 million from
September 30, 2014 –
Nonperforming loans declined $2.6 million linked-quarter
–
ORE and foreclosed assets increased $3.5 million linked-quarter,
mainly related to former branch property
–
ORE includes approximately $18 million of former branch
property •
Provision for loan losses (mostly for noncovered loans) was $9.7
million, up $0.3 million
from 3Q14
•
Noncovered net charge-offs totaled $2.6 million, or 0.08%, down
from $6.4 million, or 0.19%, in 3Q14
15
As of December 31, 2014
1Q13
2Q13
3Q13
4Q13
1Q14
2Q14
3Q14
4Q14
1.98%
1.84%
1.83%
1.50%
1.43%
1.22%
1.10%
1.06%
Nonperforming
Asset
(NPA)
Ratio |
 Securities Portfolio No Longer
Funding Loan Growth
•
Portfolio totaled $3.8 billion, down $87 million
linked-quarter
•
Yield 2.36% -
unchanged linked-quarter
•
Unrealized gain (net) of $28.4 million on AFS
•
57% HTM, 43% AFS
•
Duration 3.5 compared to 3.9 at September 30,
2014
•
Balance sheet is asset sensitive over a 2 year
period to rising interest rates under various
shock scenarios
•
IRR modeling is based on conservative
assumptions
–
Flat balance sheet
–
Loan portfolio 55% variable
–
Modeled lag in deposit rate increases
–
Conservative % DDA attrition for certain increases in
rates
$s in millions
Period-end balances. As of December 31, 2014
16
Net Interest Income Scenarios
Regulatory Rate Shocks
CMO
$1,174
31%
MBS
$2,117
56%
Munis
$195
5%
U. S. Agencies
and other
$312
8%
Securities Portfolio
Mix 12/31/14
0.00%
2.00%
4.00%
6.00%
8.00%
10.00%
12.00%
14.00%
+100 shock
+200 shock
+300 shock
+400 shock
Year 1
Year 2 |
 Solid Levels Of Core Deposit Funding
•
Total deposits $16.6 billion, up $836 million, or 5%,
linked-quarter
$s in billions
$s in millions
17
$s in millions
1Q13
2Q13
3Q13
4Q13
1Q14
2Q14
3Q14
4Q14
Avg Qtrly Deposits
$15.3
$15.2
$15.0
$14.9
$15.3
$15.1
$15.4
$15.9
LQA EOP growth
-13%
-3%
-3%
8%
-2%
-1%
13%
21%
$13.5
$14.0
$14.5
$15.0
$15.5
$16.0
Noninterest
bearing
$5,945
36%
bearing
transaction &
savings
$6,532
39%
bearing public
funds
$1,983
12%
Time deposits
$2,113
13%
Total Deposits
$16,573 million
12/31/14
Noninterest
bearing
$142
27%
bearing
transaction &
savings
$219
42%
bearing public
funds
$51
10%
Time deposits
$109
21%
•
Funding mix remained strong
•
DDA comprised 36% of total period-end deposits
•
Cost of funds increased 2 basis points to 23 bps
Noninterest-bearing demand deposits (DDA) increased $79
million $206 million increase in interest-bearing
transaction and savings deposits $103 million increase in time
deposits (CDs) $448 million increase in seasonal
interest-bearing public fund deposits –
–
–
–
Interest-
Interest-
Interest-
Interest-
category +$521 million
Average 4 qtr net deposit growth by th
|
 Core NIM Expected To Stabilize
•
Reported net interest margin (NIM) 3.63%, down 18 bps
linked-quarter; $6 million decline in purchase accounting
loan accretion •
Core NIM declined 5 bps
–
Decline in core loan yield (-3bps) and increase in the cost of
funds (+2bps) impacted NIM –
Stabilization of core NIM began in late 3Q14
–
Better earning asset mix and increased loan volume drivers of
increases in core net interest income 18
As of December 31, 2014
5.10%
5.00%
4.86%
4.63%
4.41%
4.09%
4.02%
3.97%
3.94%
3.91%
2.43%
2.47%
2.43%
2.36%
2.36%
0.23%
0.23%
0.22%
0.21%
0.23%
4Q13
1Q14
2Q14
3Q14
4Q14
Loan Yield
-
reported
Loan Yield
-
core*
Securities Yield
-
reported
Cost
of
Funds
-
reported
4.09%
4.06%
3.99%
3.81%
3.63%
3.40%
3.37%
3.35%
3.32%
3.27%
$136
$138
$140
$142
$144
$146
$148
$150
0.00%
0.50%
1.00%
1.50%
2.00%
2.50%
3.00%
3.50%
4.00%
4.50%
4Q13
1Q14
2Q14
3Q14
4Q14
Core NII
NIM -
reported
NIM -
core
Core NIM = reported net interest income (TE) excluding total net
purchase accounting adjustments, annualized, as a percent of
average earning assets. (See slide 27)
|
 Manageable Declines in Purchase Accounting
Impact Expected in Future Quarters
Impact of Purchase Accounting Adjustments
(projections
will be updated quarterly; subject to change)
$s in millions
*Projected revenue includes loan accretion from Whitney and Peoples
First, offset
by
amortization
of
the
Whitney
bond
portfolio
premium
and
amortization
of the Peoples First indemnification asset.
19
N/M
N/M
As of December 31, 2014
1Q13
2Q13
3Q13
4Q13
1Q14
2Q14
3Q14
4Q14
1Q15
E
2Q15
E
3Q15
E
4Q15
E
1Q16
E
2Q16
E
3Q16
E
4Q16
E
PAA Revenue
-
act*
37
33
35
27
24
23
19
14
PAA Revenue
-
proj*
11
10
9
9
4
4
3
3
Intangible Amort
7
7
7
7
7
7
7
6
6
6
6
6
5
5
5
5
Pre-tax impact
30
25
28
20
17
17
12
7
5
4
3
3
-1
-1
-2
-2
$0
$5
$10
$15
$20
$25
$30
$35
$40
4
2012
2013
2014
2015
2016
Post
2016
Revenue impact*
$124
$132
$80
$39
$14
$16
Pre-tax impact PAA
$93
$103
$54
$15
$0
$25
$50
$75
$100
$125
$150 |
 Core Noninterest Income Down Linked-Quarter;
Investing In Future Growth Initiatives
•
Noninterest income, including securities transactions, totaled
$57 million, down $1.0 million linked-quarter
–
Amortization of the indemnification asset for FDIC covered loans
totaled
$2.1 million, compared to $2.8 million in the third quarter; the
amortization is a reduction to noninterest income and is a result of a
lower level of expected future losses on covered loans
(non-core) •
Noninterest income, adjusted for the item noted above, decreased
approximately $1.6 million linked-quarter
•
Service charges on deposits totaled $19 million, down $1 million,
or 5%, from the third quarter
•
Investment & annuity income and insurance fees totaled $6.6
million, down $0.9 million, or 12%, linked-quarter
reflecting seasonality in this line of business
•
Trust fees totaled $11.6 million, virtually unchanged from the third
quarter with an increase in core business during the quarter
offset by recent market volatility
•
Fees from secondary mortgage operations totaled $2.0 million, down $0.3
million, or 14%, linked-quarter
•
Other noninterest income (excluding IA amortization) totaled $8.7
million, up $0.9 million, or 12%, linked-quarter
$s in millions
20
As of December 31, 2014
Service
Charges on
Deposit
$19.0
33%
Trust
$11.6
20%
Investment &
annuity
$4.7
8%
Insurance
$1.9
3%
Bankcard and
ATM
$11.2
20%
Secondary
mortgage
operations
$2.0
4%
Other
(including IA
amort)
$6.6
12%
Fee Mix 4Q14 |
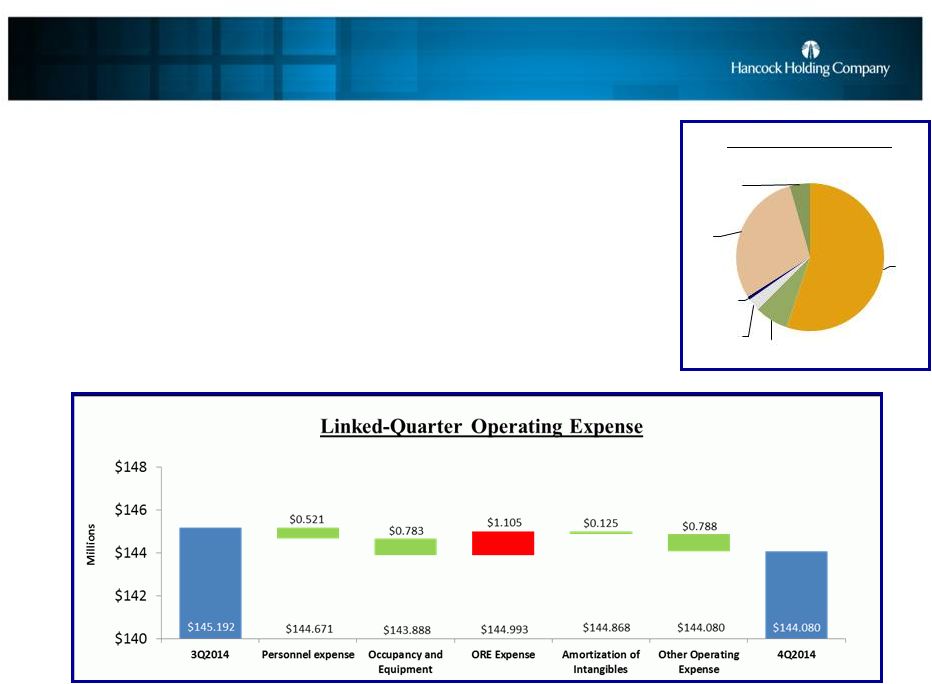 Continuing To Manage To A Lower
Level Of Operating Expense
•
Operating expense totaled $144 million in 4Q14, down $1.1 million
linked-quarter •
4Q14 operating expense excludes $9.7 million of nonoperating expenses,
mainly incurred in connection with the Company’s ongoing
expense and efficiency initiative, although a portion of these
costs were amounts paid to recently separated executives •
Personnel expense totaled $79.5 million, a decrease of $0.5 million, or
less than 1%, linked-quarter •
Occupancy and equipment totaled $14.6 million, down $0.7 million, or
5%, linked-quarter •
ORE expense totaled $1.0 million for 4Q14, reflecting a more normalized
level of quarterly expense –
The prior 2 quarters included gains from ORE dispositions which offset
quarterly expenses •
Other operating expense declined $0.8 million, or 2%,
linked-quarter As of December 31, 2014; excluding
nonoperating expense items 21
$s in millions
Personnel
$79.5
55%
Occupancy
$10.6
7%
Equipment
$4.0
3%
ORE
$1.0
1%
Other
$42.6
30%
Amortization
of intangibles
$6.4
4%
Operating Expense Mix 4Q14 |
 Targeted Efficiency Ratio:
Below 60% By 4Q16
•
Continuing to manage expenses in the near-term, however expenses
may rise over the next couple of quarters as investments in
higher- return, revenue-generating initiatives are
made •
Remain committed to keeping expenses in line with expectations;
expect normal annual increases
22
55%
60%
65%
70%
1Q13
2Q13
3Q13
4Q13
1Q14
2Q14
3Q14
4Q14
Efficiency Ratio*
Efficiency Ratio
ER Target
*The efficiency ratio is noninterest expense to total revenue (TE)
excluding amortization of purchased intangibles, nonoperating expense items, and securities transactions.
|
 Recent Revenue Initiatives
•
Realigned banking organization under a single executive and implemented
geographic leadership to improve focus on revenue
•
Making progress in our Business, Commercial & Private Banking
Segments with over 50% loan growth in 2014
–
We believe these segments offer better granularity in the portfolio and
will help us improve our loan yield
–
In addition, these segments present great opportunities to continue to
build strong core deposits •
Continuing to introduce new initiatives designed to add loan volume,
improve pricing and enhance loan/earning asset mix
–
Entering Equipment Finance Business -
a perfect complement to our large C&I client base
–
Hired seasoned Equipment Finance Industry executive to build a scalable
Equipment Finance Company
–
Placing a huge emphasis on improving our loan yield through improving
our mix of loans, as well as making investments in new pricing
tools and better discipline •
Investing in products to improve our position in processing payments
for clients in Small Business and Commercial Banking
–
We expect to make a similar investment in Merchant Services in 2015
–
Our core Treasury Management business continues to grow nicely as we
build market share across the commercial segments
23 |
 Solid Capital Levels
•
TCE ratio 8.59%, down 51 bps linked-quarter related to organic
balance sheet growth, common stock buyback and a decrease in OCI
primarily related to a change in pension liability •
New
5%
common
stock
buyback
authorized
by
the
Board
of
Directors
in
July
2014
—
Approximately 4 million shares
—
Repurchased 1,224,279 shares @ an average price of $30.75
(approximately $38 million) in 4Q14 —
YTD
repurchases total 1,529,542 shares @ an average price of
$31.13 (approximately $48 million), or 37% of total
authorization —
Authorization effective through 12/31/15
•
Will continue to review additional options to deploy excess capital in
the best interest of the Company and its shareholders
–
Organic growth
–
Stock buyback
–
M&A
–
Dividends
*Stock Buyback
(ASR) initiated
24
As of December 31, 2014
7.00%
8.00%
9.00%
10.00%
11.00%
12.00%
13.00%
1Q13
2Q13*
3Q13
4Q13
1Q14
2Q14
3Q14
4Q14e
Capital Ratios
TCE
Tier 1 Risk-Based Capital |
 Near-Term Outlook
4Q14
Items to note
Outlook
Loans
+16% LQA
+13% Y-o-Y
8-12% EOP growth for full year 2015
(Limited growth in energy)
Purchase
Accounting
Adjustments (PAAs)
$7.4 million
pre-tax
(see slide 28)
Includes items
impacting revenue
and expense
Continuing declines in quarterly PAA revenue and
expense (see slide 19)
Net Interest Margin
(NIM)
3.63% reported
3.27% core
Reported down
18bps; Core down
5bps
Downward pressure on reported margin; stabilization
of core NIM; increasing core net interest income
Core Revenue
$206.7 million
Excludes PAAs
noted above
Recent growth reflects initiatives started in the prior
several quarters; expect growth to accelerate in 2H15
as initiatives continue to mature
Loan Loss Provision
$9.7 million
Includes $7 million
of reserve build
Should pricing pressures on oil continue, we could
see some risk rating downgrades and increased
provisions; not expecting significant charge-offs
Noninterest Expense
$144.1 million
operating
$9.7 million of
nonoperating costs
Slightly higher in the near term due to seasonality and
as investments are made in revenue-generating
initiatives
E.P.S. –
operating
E.P.S. –
core
$.56
$.50
See calculation on
slides 26 and 28
Operating E.P.S. flat due to declining purchase
accounting revenue; expect growth in 2H15
Continued growth in core E.P.S.
25
As of December 31, 2014 |
 Appendix:
EPS calculation
$s in thousands, except E.P.S.
Three
Months
Ended
12/31/14
Three
Months
Ended
9/30/14
Three
Months
Ended
12/31/13
Operating income to common shareholders
$46,376
$49,079
$45,773
Income allocated to participating securities
(981)
(931)
(932)
Operating income allocated to common shareholders
$45,395
$48,148
$44,841
Weighted
average
common
shares
–
diluted
81,530
81,942
82,220
E.P.S. -
diluted
$.56
$.59
$.55
See Note 7 in the most recent 10Q for more details on the
two-class method for E.P.S. calculation. 26
|
 Appendix: Purchase Accounting Adjustments
Core NII & NIM Reconciliation
($s in millions)
4Q14
3Q14
2Q14
1Q14
4Q13
Net
Interest
Income
(TE)
–
reported
(NII)
$163.6
$166.2
$167.3
$168.2
$168.5
Whitney expected loan accretion (performing)
2.7
5.0
5.8
6.7
9.3
Whitney expected loan accretion (credit impaired)
13.8
17.0
19.8
20.8
18.2
Peoples First expected loan accretion
.7
.8
2.5
2.1
2.8
Excess cash recoveries*
---
---
---
---
---
Total Loan Accretion
$17.2
$22.8
$28.1
$29.7
$30.3
Whitney premium bond amortization
(1.2)
(1.3)
(1.4)
(1.5)
(1.8)
Whitney and Peoples First CD accretion
---
---
.1
.1
.1
Total Net Purchase Accounting
Adjustments (PAAs) impacting NII
$16.0
$21.5
$26.7
$28.3
$28.5
Net
Interest
Income
(TE)
–
core
(Reported NII less net PAAs)
$147.6
$144.7
$140.6
$139.9
$140.0
Average Earning Assets
$17,911
$17,324
$16,792
$16,740
$16,377
Net
Interest
Margin
–
reported
3.63%
3.81%
3.99%
4.06%
4.09%
Net Purchase Accounting Adjustments (%)
.36%
.49%
.64%
.69%
.69%
Net
Interest
Margin
-
core
3.27%
3.32%
3.35%
3.37%
3.40%
* Excess cash recoveries include cash collected on certain zero
carrying value acquired loan pools above expected amounts.
27 |
 Appendix: Non-GAAP Reconciliation
(Net Income, ROA, E.P.S.)
$s in millions
Three
Months
Ended
12/31/14
Three
Months
Ended
9/30/14
Three
Months
Ended
12/31/13
Twelve
Months
Ended
12/31/14
Twelve
Months
Ended
12/31/13
Net income
$40.1
$46.6
$34.7
$175.7
$163.4
Adjustments from net to operating income
Securities transactions gains/(losses)
-
-
0.1
-
0.1
Total nonoperating expense items (pre-tax)
9.7
3.9
17.1
25.7
38.0
Taxes on adjustments at marginal tax rate
3.4
1.4
6.0
7.2
13.3
Total adjustments (net of taxes)
6.3
2.5
11.1
18.4
24.6
Operating income
$46.4
$49.1
$45.8
$194.1
$188.0
Adjustments from operating to core income
PAA –
Net Interest Margin (see slide 27)
16.0
21.5
28.5
92.5
133.9
Intangible Amortization (noninterest expense)
-6.4
-6.6
-7.0
-26.6
-28.8
Amortization of Indemnification Asset (noninterest income)
-2.1
-2.8
-1.6
-12.1
-2.2
Total Purchase Accounting Adjustments (PAA) (pre-tax)
$7.4
$12.1
$19.9
$53.8
$102.9
Taxes on adjustments at marginal tax rate
2.6
4.2
7.0
18.8
36.0
Total PA adjustments (net of taxes)
4.8
7.9
12.9
35.0
66.9
Core Income (Operating less purchase accounting items)
$41.5
$41.2
$32.9
$159.2
$121.1
Average Assets
$20,090
$19,550
$18,739
$19,437
$18,929
ROA (operating)
0.92%
1.00%
0.97%
1.00%
0.99%
ROA (core)
0.82%
0.84%
0.70%
0.82%
0.64%
Weighted Average Diluted Shares (thousands)
81,530
81,942
82,220
82,034
83,167
E.P.S. (operating)
$.56
$.59
$.55
$2.32
$2.22
E.P.S. (core)
$.50
$.49
$.39
$1.90
$1.43
28 |
 Appendix:
Whitney Portfolio Continues Solid Performance
•
Loan mark on the acquired-performing portfolio accreted into
earnings over the life of the portfolio
•
Credit-impaired loan mark available for charge-offs; if not
needed for charge-offs then accreted into income
•
Quarterly reviews of accretion levels and portfolio performance will
impact reported margin $s in millions
Credit-
Impaired
Performing
Total
Whitney loan mark at acquisition
(as adjusted in 4Q11)
$284
$187
$471
Acquired portfolio loan balances at acquisition
$818
$6,101
$6,919
Discount at acquisition
34.7%
3.1%
6.8%
Remaining Whitney loan mark at 12/31/14
$65
$5
$70
Remaining acquired portfolio loan balances at 12/31/14
$123
$777
$900
Acquired loan charge-offs from acquisition thru 12/31/14
$23
$14
$37
Discount at 12/31/14
52.8%
0.6%
7.8%
29
As of December 31, 2014 |
 Appendix:
Peoples First Loan Mark Used For Charge-Offs
•
FDIC acquired loan portfolio
•
Entire loan mark available for charge-offs; if not needed for
charge-offs then accreted into income •
Quarterly reviews of accretion levels and portfolio performance will
impact reported margin •
FDIC loss share receivable totaled $60.3 million at December 31, 2014
•
Non-single family FDIC loss share agreement expired at December 31,
2014 •
$197
million
remains
covered
under
FDIC
single
family
loss
share
agreement
$s in millions
Credit Impaired
Peoples First loan mark at acquisition (12/2009)
$509
Charge-offs from acquisition thru 12/31/14
$430
Accretion since acquisition date
$90
Remaining loan mark at 12/31/14
$33
Impairment reserve at 12/31/14
$31
Remaining portfolio loan balances at 12/31/14
$284
Discount & allowance at 12/31/14
23%
30
As of December 31, 2014 |
 Fourth Quarter 2014
Financial Results
January 22, 2015
Fourth Quarter 2014
Financial Results
January 22, 2015 |