Attached files
| file | filename |
|---|---|
| 8-K - 8-K - Townsquare Media, Inc. | form8-kpreliminary4thquart.htm |
| EX-99.1 - PRESS RELEASE - Townsquare Media, Inc. | exhibit991.htm |
| EX-99.3 - SHAREHOLDER LETTER - Townsquare Media, Inc. | shareholderletterfinal.htm |

Local Diversified Media January 2015 Investor Presentation

Color Scheme 28 86 45 255 0 0 124 188 222 242 150 3 85 181 144 0 115 207 Forward-Looking Statements 1 This presentation contains, and our other communications may contain, forward-looking statements within the meaning of Section 27A of the Securities Act of 1933, as amended, and Section 21E of the Securities Exchange Act of 1934, as amended. These statements can be identified by the fact that they do not relate strictly to historical or current facts. Forward-looking statements, written, oral or otherwise made, represent the Company’s expectation or belief concerning future events. All forward-looking statements are subject to assumptions, risks, and uncertainties, which may change over time and many of which are beyond our control. By nature, forward-looking statements involve risks and uncertainties that could cause actual results to differ materially from those projected or implied by the forward-looking statement. Forward-looking statements are based on current expectations and assumptions and currently available data and are neither predictions nor guarantees of future events or performance. You should not place undue reliance on forward-looking statements, which speak only as of the date hereof. Some of the factors that may cause actual results or other future events, circumstances, or aspirations to differ from those in forward-looking statements are described in the sections entitled “Risk Factors” and “Forward-Looking Statements” included in our final prospectus filed on July 25, 2014, or other applicable documents that are filed or furnished with the Securities and Exchange Commission (“SEC”). We do not undertake to update any forward- looking statement to reflect the impact of events, circumstances, or results that arise after the date that the statement was made. You, however, should consult further disclosures (including disclosures of a forward-looking nature) that we may make in any subsequent Annual Report on Form 10-K, Quarterly Report on Form 10-Q, Current Report on Form 8-K, or other applicable document that is filed or furnished with the SEC. The unaudited estimates and statements included herein are the opinion of management and represent estimates and expectations based on the most current information available. While we believe that our assumptions are reasonable, we caution that it is very difficult to predict the impact of known factors and it is impossible for us to anticipate all factors that could affect our actual results. Our actual results may differ materially from these estimates due to the completion of our financial closing procedures, final adjustments and other developments that may arise between now and the time the financial results for our fourth quarter are finalized. This preliminary financial data has been prepared by and is the responsibility of management. Our independent registered public accounting firm, McGladrey LLP, has not audited, reviewed, compiled or performed any procedures with respect to the accompanying preliminary financial data. Accordingly, McGladrey LLP does not express an opinion or any other form of assurance with respect thereto. As a result of the foregoing considerations and limitations, investors are cautioned not to place undue reliance on this projected financial information.

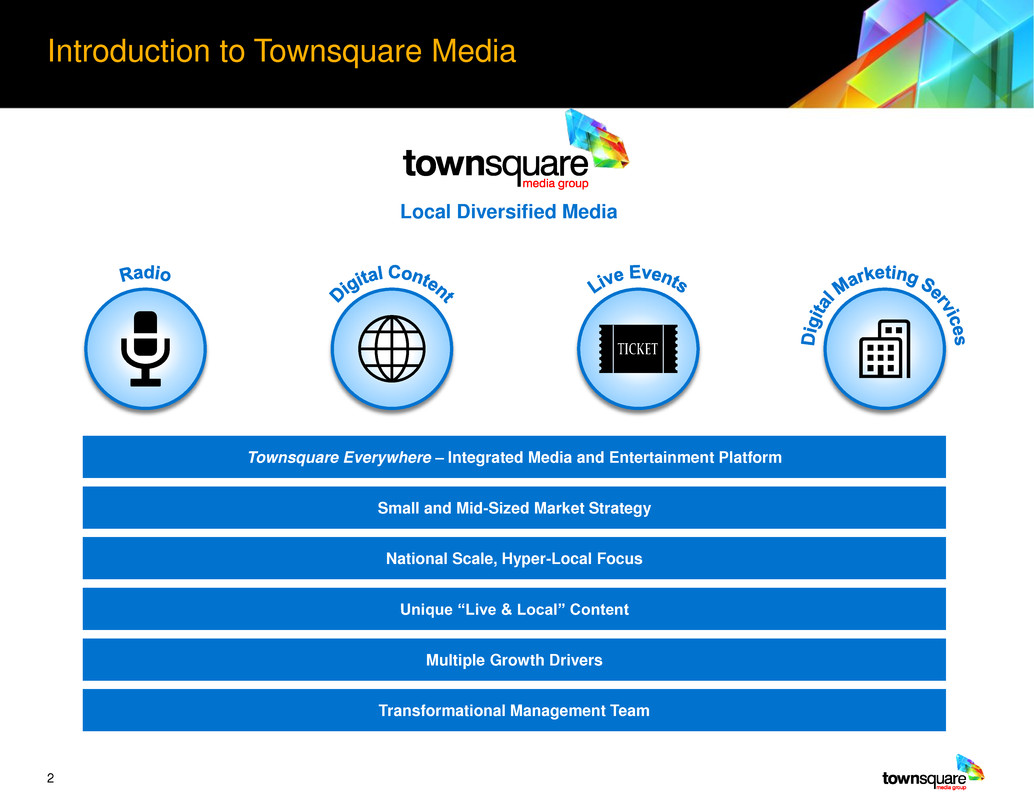
Color Scheme 28 86 45 255 0 0 124 188 222 242 150 3 85 181 144 0 115 207 Introduction to Townsquare Media Unique “Live & Local” Content Townsquare Everywhere – Integrated Media and Entertainment Platform National Scale, Hyper-Local Focus Small and Mid-Sized Market Strategy Multiple Growth Drivers Transformational Management Team Local Diversified Media 2

Color Scheme 28 86 45 255 0 0 124 188 222 242 150 3 85 181 144 0 115 207 311/66 ~500 325+ Radio Stations/Markets Live Events (1) Local Websites 8%+ ~30% >100% 2014 Pro Forma Revenue Growth (2) $384 - $385 million / $98 - $99 million Pro Forma 2014 Revenue / Adjusted EBITDA (3) Non-Spot Revenue 2014 ~42% Excluding Vintage 2011-2013 Radio Acquisitions Online Reach as a % of Over The Air Reach (4) #1 Digital Ad Network 4,900+ Revenue per Audience Member (7) Focused on Music Content (5) Digital Marketing Services Subscription Customers (6) www (1) Over the 12 months ended December 31, 2014. (2) Pro forma for all material acquisitions and divestitures as if they had occurred on December 31, 2013. (3) Represents 2014 revenue and Adjusted EBITDA excluding duplicative corporate expenses pro forma for all material acquisitions and divestitures as if they had occurred on December 31, 2013. Adjusted EBITDA excluding duplicative corporate expenses is Adjusted EBITDA as further adjusted for pro forma adjustments to corporate expenses to reflect the removal of duplicative acquired company corporate expenses. (4) Based on Google Analytics, our local websites reached an average number of US based unique visitors in December 2014, representing over 100% of our radio stations’ weekly cumulative audience as determined by Nielsen Spring 2014 data. (5) December 2014 US Multiplatform comScore unique visitors (“UVs”). (6) Based on UVs per comScore as of December 2014. (7) Represents 2013 revenue per audience member. Peer average includes iHeart Media, Cumulus and Entercom. Townsquare by the Numbers 3 $30 $24 $0 $5 $10 $15 $20 $25 $30 $35 Townsquare Peer Average

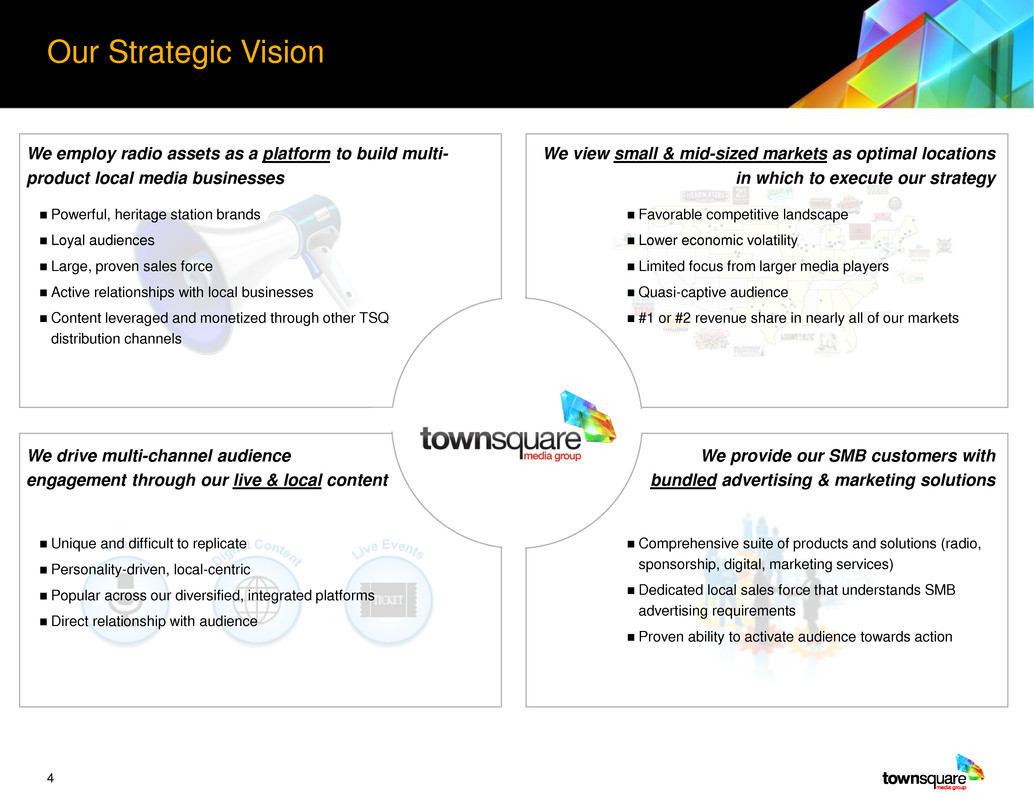
Color Scheme 28 86 45 255 0 0 124 188 222 242 150 3 85 181 144 0 115 207 We view small & mid-sized markets as optimal locations in which to execute our strategy Favorable competitive landscape Lower economic volatility Limited focus from larger media players Quasi-captive audience #1 or #2 revenue share in nearly all of our markets We provide our SMB customers with bundled advertising & marketing solutions Comprehensive suite of products and solutions (radio, sponsorship, digital, marketing services) Dedicated local sales force that understands SMB advertising requirements Proven ability to activate audience towards action We drive multi-channel audience engagement through our live & local content Unique and difficult to replicate Personality-driven, local-centric Popular across our diversified, integrated platforms Direct relationship with audience We employ radio assets as a platform to build multi- product local media businesses Powerful, heritage station brands Loyal audiences Large, proven sales force Active relationships with local businesses Content leveraged and monetized through other TSQ distribution channels Our Strategic Vision 4

Color Scheme 28 86 45 255 0 0 124 188 222 242 150 3 85 181 144 0 115 207 Lower Economic Volatility in Small and Mid-Sized Markets #1 or #2 Revenue Market Share in 65 of our 66 Markets Strong Relationships with Local and Regional Advertisers 60 markets are home to four year universities 15 markets are home to major military installations Seven markets are state capitals Numerous markets are home to regional medical centers, retail hubs and state fairs Attractive Competitive Landscape ‒ Limited competition vs. large players Source: BIA Kelsey. Geographic Diversification with Regional Strength in Northeast, Upper Midwest, Texas and Mountain West Less competitive with more stability Superior Opportunity in Small and Mid-Sized Markets Small and Mid-Sized Market Footprint Townsquare Markets Less Competitive with More Stability Stable, Locally Significant Institutions 5

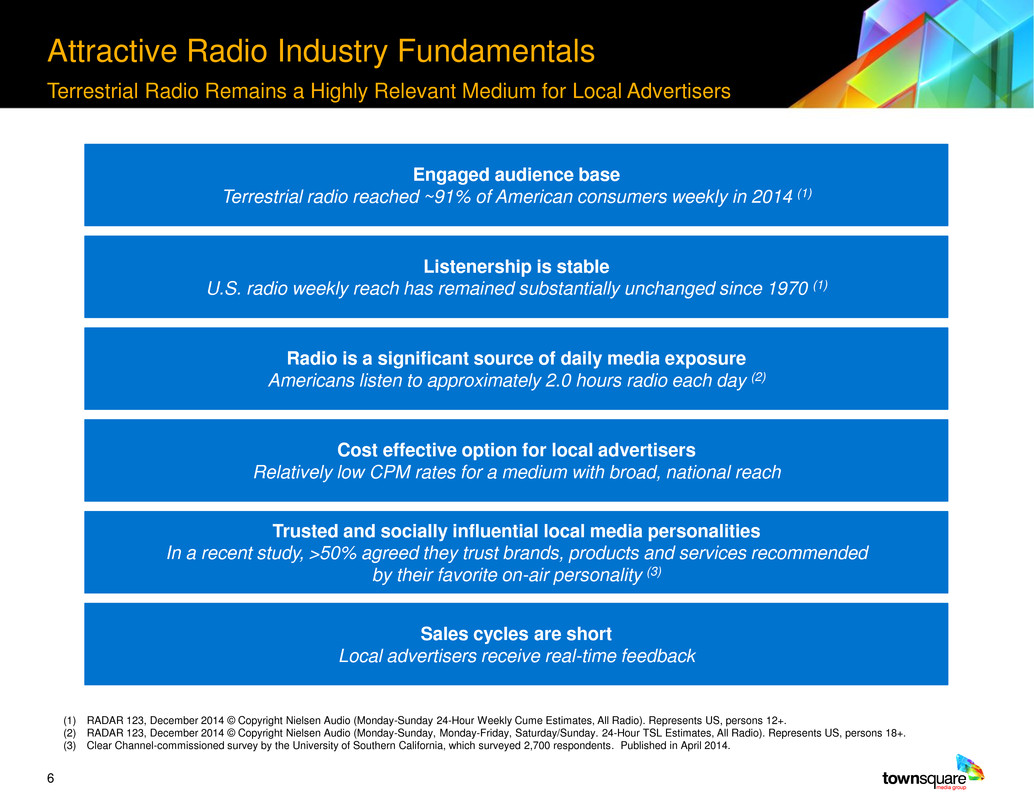
Color Scheme 28 86 45 255 0 0 124 188 222 242 150 3 85 181 144 0 115 207 Attractive Radio Industry Fundamentals Terrestrial Radio Remains a Highly Relevant Medium for Local Advertisers Engaged audience base Terrestrial radio reached ~91% of American consumers weekly in 2014 (1) Listenership is stable U.S. radio weekly reach has remained substantially unchanged since 1970 (1) Radio is a significant source of daily media exposure Americans listen to approximately 2.0 hours radio each day (2) Trusted and socially influential local media personalities In a recent study, >50% agreed they trust brands, products and services recommended by their favorite on-air personality (3) Cost effective option for local advertisers Relatively low CPM rates for a medium with broad, national reach Sales cycles are short Local advertisers receive real-time feedback (1) RADAR 123, December 2014 © Copyright Nielsen Audio (Monday-Sunday 24-Hour Weekly Cume Estimates, All Radio). Represents US, persons 12+. (2) RADAR 123, December 2014 © Copyright Nielsen Audio (Monday-Sunday, Monday-Friday, Saturday/Sunday. 24-Hour TSL Estimates, All Radio). Represents US, persons 18+. (3) Clear Channel-commissioned survey by the University of Southern California, which surveyed 2,700 respondents. Published in April 2014. 6

Color Scheme 28 86 45 255 0 0 124 188 222 242 150 3 85 181 144 0 115 207 Music 17% Non-Music 83% Selected Live Event Franchises Types of Live Events TSQ’s Competitive Advantage Overview ~500 live events across 66 markets in 2014 ‒ Up from <50 live events in 2010 ‒ <2 events per station, per year ~90% of live events are annually recurring with branded franchises >700,000 attendees in 2014 Accessible, family friendly entertainment Music events (Multi & single day) Lifestyle events (Beer festivals, etc.) Athletic events (5k fun runs, etc.) Consumer expositions and trade shows Other entertainment (Cooking shows, children’s shows, etc.) Leverage radio and digital assets ‒ Promoted on stations and websites ‒ Sponsorship sold by sales force Operate events in all 66 Local Advertising markets ‒ Live Event Managers in majority of TSQ markets Ability to syndicate a successful event in a single market across all 66 markets Shared central strategic and administrative services: Event ideation Templatization Sharing of best practices Underwriting / green lighting Talent and venue booking 7 Complementary and Growing Live Events Platform Production Risk mitigation / insurance Legal Financial administration Accounting

Color Scheme 28 86 45 255 0 0 124 188 222 242 150 3 85 181 144 0 115 207 Solid track record of integrating acquisitions ̶ Expanded radio station portfolio from 60 to 311 by completing 11 transactions since May 2010 Executed >15 acquisitions in the live events and digital sectors Focus on assets that have strong brands, leading market share positions Recently announced acquisition of WE Fest, world’s largest country music and camping festival Continuously evaluate assets that provide natural extension to our core competency Add to Portfolio of Attractive Radio Station Clusters 1 Augment the Growth of Our Digital and Live Events Offerings Through Acquisitions 2 Evaluate New Product Opportunities 3 Townsquare employs stringent M&A criteria to filter opportunities that match our desired risk-reward profile Opportunities in small and mid-sized markets Radio assets with strong brands and leading market share Complementary digital and live events assets Financially accretive acquisition prices Pursue Accretive Acquisition Opportunities 8

Color Scheme 28 86 45 255 0 0 124 188 222 242 150 3 85 181 144 0 115 207 With Townsquare Since Background Steven Price Chairman & Chief Executive Officer Co-founder Co-Founder and Managing Director of FiveWire Media Ventures (“FiveWire”) Prior to co-founding FiveWire, Mr. Price was a Senior Managing Director at private equity firm Centerbridge Partners Former President and CEO of PriCellular Corporation, which was sold in 1998 for $1.4bn Stu Rosenstein EVP & Chief Financial Officer Co-founder Co-Founder and Managing Director of FiveWire Prior to co-founding FiveWire, Mr. Rosenstein was previously the owner and managing principal of AMG Financial Former EVP and CFO of PriCellular Corporation, which was sold in 1998 for $1.4bn Bill Wilson EVP & Chief Content and Digital Officer 2010 Previously, President of AOL Media where Mr. Wilson had overall responsibility for global content strategy Prior to AOL, served as SVP, Worldwide Marketing at Bertelsmann Music Group Alex Berkett EVP, Business Development and M&A Co-founder Managing Director of FiveWire, which he joined at its inception Prior to joining FiveWire, Mr. Berkett worked in J.P. Morgan and Bear Stearns’ Technology, Media & Telecom Investment Banking Groups Erik Hellum EVP, Local Advertising 2010 Previously President of GAP West since 2008 Prior to joining GAP West, Mr. Hellum worked at Bonneville International Communications, Clear Channel and Katz Radio Dhruv Prasad EVP, Live Events Co-founder Managing Director of FiveWire, which he joined at its inception Prior to joining FiveWire, Mr. Prasad worked as a private equity investor at Thomas H. Lee Partners and Spectrum Equity Investors Mark Stewart EVP & Chief Strategy Officer 2012 Previously, VP, Global Media at Kraft Foods Prior to Kraft Foods, Mr. Stewart was EVP and Managing Director at OMD N.Y. Transformational Management Team Track record of success outside of the Radio industry Incentivization aligned with public shareholders Management Owns ~5% of Equity 9

Color Scheme 28 86 45 255 0 0 124 188 222 242 150 3 85 181 144 0 115 207 Townsquare Media Financial Snapshot $384-$385 million / $98-$99 million 2014 PF Revenue / PF Adjusted EBITDA(1) Attractive Growth Substantial Scale ~25-26% 2014 PF Adjusted EBITDA Margin(1) Rapidly Diversifying ~30% 2014 Non-Spot Revenue % Strong Margins 8%+ 2014 Revenue Growth Note: Pro forma for material completed transactions. Direct Profit defined as net income before the deduction of income taxes, other income (expense), net, net loss on derivative instruments, loss on early extinguishment of debt, interest expense, net, change in fair value of contingent consideration, transaction and other restructuring costs, corporate expenses, net (loss) gain on sale of assets and depreciation and amortization. Adjusted EBITDA is defined as Direct Profit less corporate expenses (excluding stock-based compensation). Adjusted EBITDA excluding duplicative corporate expenses is Adjusted EBITDA as further adjusted for pro forma adjustments to corporate expenses to reflect the removal of duplicative acquired company corporate expenses. (1) Represents Pro Forma Adjusted EBITDA excluding duplicative corporate expenses. 10

Color Scheme 28 86 45 255 0 0 124 188 222 242 150 3 85 181 144 0 115 207 Earnings Highlights: Q4 Preliminary Results ($ in Millions) Note: Pro forma for all material transactions. Represents Adjusted EBITDA excluding duplicative and non-recurring corporate expenses, defined as Direct Profit less corporate expenses (excluding stock-based compensation) and further adjusted for pro forma adjustments to corporate expenses to reflect the removal of duplicative acquired company corporate expenses and the removal of non-recurring reversal of legal accrual in connection with certain litigation. Direct Profit is defined as net income before the deduction of income taxes, other income (expense), net, net loss on derivative instruments, loss on early extinguishment of debt, interest expense, net, change in fair value of contingent consideration, transaction and other restructuring costs, corporate expenses, net (loss) gain on sale of assets and depreciation and amortization. No reconciliation of Direct Profit or Adjusted EBITDA excluding duplicative and non-recurring corporate expenses have been provided for 2014 as this information is not yet available. For 2013 reconciliations, see our final prospectus filed with the SEC on July 25, 2014. TSQ does not expect to be a material cash tax payer until 2019 Q4 Year 11 2014 Growth % 2013 Low High Low High Net Revenue $355.1 $384.0 $385.0 8.1% 8.4% Adjusted EBITDA $94.8 $97.9 $98.9 3.3% 4.4% % Margin 26.7% 25.5% 25.7% 2014 Growth % 2013 Low High Low High Guidance Net Revenue $85.6 $93.0 $94.0 8.6% 9.8% High Single Digit Growth Rate Adjusted EBITDA $22.9 $24.0 $25.0 4.9% 9.3% High Single Digit Growth Rate % Margin 26.7% 25.8% 26.6%

Color Scheme 28 86 45 255 0 0 124 188 222 242 150 3 85 181 144 0 115 207 Pro Forma Balance Sheet and Ownership ~$39 million liquidity ̶ $15 million undrawn revolver and ~$24 million cash Weighted average cost of debt of 7.8% ̶ Refinancing opportunity for 9.0% Senior Unsecured Notes at first call date in April 2015 – potential for significant interest savings Prioritizing making high ROI investments and de-leveraging Capitalization (12/31/2014) ($ in Millions) Balance Sheet Highlights Note: Pro forma for all completed transactions. Represents Adjusted EBITDA excluding duplicative corporate expenses, defined as Direct Profit less corporate expenses (excluding stock-based compensation) and further adjusted for pro forma adjustments to corporate expenses to reflect the removal of duplicative acquired company corporate expenses. Leverage multiples based on expected 2014 pro forma Adjusted EBITDA excluding duplicative corporate expenses of $97.9 million - $98.9 million. (1) Represents ownership as of November 6, 2014. (2) Exchangeable for Class A common stock. Current Ownership (1) Shares Outstanding (1) Townsquare’s multi-class structure is driven largely by FCC considerations Class B (high vote) and Class C (no vote) shares revert to Class A (1 vote) shares upon a sale (Shares in Millions) # of Total Votes Primary Holders Clas A Common Stock 9.5 1 Public l ss B C mmon Stock 3.0 10 Oaktree & FiveWire (Mgmt) Class C Common Stock 4.9 0 GE & MSD Total Common Stock 17.4 Class A Warrants (2) 9.5 0 Oaktree Total Shares + Warrants O/S 26.9 Oaktree Capital Management 46% GE Capital 12% MSD Capital 6% Management 5% Others 31% Total 100% 12 Maturity Pricing Cash $24.5 $25mm Revolver $10.0 2016 L+350 Term Loans 111.2 2018 L+350 Capitalized Obligations 0.4 Total Secured Debt $121.6 Senior Unsecured No e 410.9 2019 9.0% Total Debt $532.5 Secured Debt / 2014 PF Adj. EBITDA 1.2x Total Debt / 2014 PF Adj. EBITDA 5.4x Net Debt / 2014 PF Adj. EBITDA 5.1x - 5.2x
