Attached files
| file | filename |
|---|---|
| EX-32.1 - EXHIBIT 32.1 - Townsquare Media, Inc. | exhibit321_12312015.htm |
| EX-31.1 - EXHIBIT 31.1 - Townsquare Media, Inc. | exhibit311_12312015.htm |
| EX-31.2 - EXHIBIT 31.2 - Townsquare Media, Inc. | exhibit312_12312015.htm |
| EX-23.1 - EXHIBIT 23.1 - Townsquare Media, Inc. | exhibit231_12312015.htm |
| EX-32.2 - EXHIBIT 32.2 - Townsquare Media, Inc. | exhibit322_12312015.htm |
| EX-21 - EXHIBIT 21 - Townsquare Media, Inc. | exhibit211_12312015.htm |
UNITED STATES SECURITIES AND EXCHANGE COMMISSION | ||
Washington, D.C. 20549 __________________ | ||
FORM 10-K __________________ | ||
[X] ANNUAL REPORT PURSUANT TO SECTION 13 OR 15(d) OF THE SECURITIES EXCHANGE ACT OF 1934 For the fiscal year ended December 31, 2015 OR [ ] TRANSITION REPORT PURSUANT TO SECTION 13 OR 15(d) OF THE SECURITIES EXCHANGE ACT OF 1934 For the transition period from _______ to ______ Commission file number 333-197002 Townsquare Media, Inc. (Exact name of registrant as specified in its charter) | ||
Delaware (State or other jurisdiction of incorporation or organization) | 4832 (Primary Standard Industrial Classification Code Number) | 27-1996555 (I.R.S. Employer Identification No.) |
240 Greenwich Avenue Greenwich, Connecticut 06830 (203) 861-0900 (Address, including zip code, and telephone number, including area code, of registrant’s principal executive offices) | ||
Securities registered pursuant to Section 12(b) of the Act:
Class A Common Stock, $0.01 par value per share | The New York Stock Exchange | |
(Title of each class) | (Name of each exchange on which registered) | |
Securities registered pursuant to Section 12(g) of the Act:
None
________________________________
Indicate by check mark if the registrant is a well-known seasoned issuer, as defined in Rule 405 of the Securities Act. Yes ☐ No ☒
Indicate by check mark if the registrant is not required to file reports pursuant to Section 13 or Section 15(d) of the Act. Yes ☐ No ☒
Indicate by check mark whether the registrant: (1) has filed all reports required to be filed by Section 13 or 15(d) of the Securities Exchange Act of 1934 during the preceding 12 months (or for such shorter period that the registrant was required to file such reports), and (2) has been subject to such filing requirements for the past 90 days. Yes ☒ No ☐
Indicate by check mark whether the registrant has submitted electronically and posted on its corporate Web site, if any, every Interactive Data File required to be submitted and posted pursuant to Rule 405 of Regulation S-T (§232.405 of this chapter) during the preceding 12 months (or for such shorter period that the registrant was required to submit and post such files). Yes ☒ No ☐
Indicate by check mark if disclosure of delinquent filers pursuant to Item 405 of Regulation S-K is not contained herein, and will not be contained, to the best of Registrant’s knowledge, in definitive proxy or information statements incorporated by reference in Part III of this Form 10-K or any amendment to this Form 10-K. ☐
Indicate by check mark whether the registrant is a large accelerated filer, an accelerated filer, a non-accelerated filer, or a smaller reporting company. See definition of “accelerated filer”, “large accelerated filer”, and “smaller reporting company” in Rule 12b-2 of the Exchange Act.
Large accelerated filer | ☐ | Accelerated filer | x | ||
Non-accelerated filer | ☐ (Do not check if a smaller reporting company) | Smaller reporting company | ☐ | ||
Indicate by check mark whether the registrant is a shell company (as defined in Rule 12b-2 of the Exchange Act). Yes ☐ No ☒
As of February 25, 2016, the registrant had 17,863,318 outstanding shares of common stock consisting of: (i) 9,946,354 shares of Class A common stock, par value $0.01 per share; (ii) 3,022,484 shares of Class B common stock, par value $0.01 per share; and (iii) 4,894,480 shares of Class C common stock, par value $0.01 per share. The registrant also had 9,508,878 warrants to purchase Class A common stock outstanding as of that date.
The aggregate market value of the registrant's voting and non-voting common stock held by non-affiliates of the registrant was $170,201,087 as of June 30, 2015.
DOCUMENTS INCORPORATED BY REFERENCE
Portions of the registrant’s definitive proxy statement relating to its 2016 annual meeting of stockholders (the “2016 Proxy Statement”), to be filed with the Securities and Exchange Commission ("SEC"), are incorporated by reference in Part III, Items 10 to 14 of this Annual Report on Form 10-K as indicated herein.
TOWNSQUARE MEDIA, INC.
INDEX
PART I | |||
PART II | |||
PART III | |||
i
CERTAIN DEFINITIONS
On July 25, 2014, Townsquare Media, LLC a Delaware limited liability company organized in 2010, converted to Townsquare Media, Inc. (together with its consolidated subsidiaries, except as the context may otherwise require, "we," "us," "our," "Company," or "Townsquare").
"Transactions" refers to all material acquisitions and divestitures that were completed from January 1, 2013 to December 31, 2015. The Transactions include, but are not limited to, the acquisition of all of the membership interests of Heartland Group, LLC, and its wholly-owned subsidiary North American Midway Entertainment ("NAME") on September 1, 2015, the sale of 43 towers to a subsidiary of Vertical Bridge, LLC ("Vertical Bridge") on September 1, 2015 (the "Tower Sale"), the acquisition of certain assets of FACE, Festivals and Concert Events, Inc. ("WE Fest"), which closed on October 31, 2014, certain assets of MAC Events ("MAC"), which closed on November 20, 2013, the acquisition of our Boise market from Peak II Holding, LLC ("Boise" or "Peak"), which closed on November 14, 2013, the acquisitions of certain assets from Cumulus Media, Inc. ("Cumulus II") which closed on November 14, 2013, and the acquisition of certain assets of Country Jam, which closed on July 12, 2013. The Transactions are disclosed in more detail in our annual consolidated financial statements included elsewhere in this annual report.
MARKET, RANKING AND OTHER INDUSTRY DATA
In this annual report we rely on and refer to information and statistics regarding our industry, the size of certain markets and our position within the sectors in which we compete. Some of the market and industry data contained in this annual report are based on independent industry publications or other publicly available information, while other information is based on our good faith estimates, which are derived from our review of internal surveys, as well as independent sources listed in this annual report, and our management’s knowledge and experience in the markets in which we operate. Our estimates have also been based on information obtained from our customers, suppliers and other contacts in the markets in which we operate. We believe that these independent sources and our internal data are reliable as of their respective dates.
TRADEMARKS, SERVICE MARKS AND TRADE NAMES
We own or have rights to trademarks, service marks or trade names that we use in connection with the operation of our business. In addition, our names, logos and website names and addresses are owned by us or licensed by us. We also own or have the rights to copyrights that protect the content of our products. Solely for convenience, the trademarks, service marks, trade names and copyrights referred to in this annual report are listed without the ©, ® and ™ symbols, but we will assert, to the fullest extent under applicable law, our rights or the rights of the applicable licensors to these trademarks, service marks, trade names and copyrights. This annual report may include trademarks, service marks or trade names of other companies. Our use or display of other parties’ trademarks, service marks, trade names or products is not intended to, and does not imply a relationship with, or endorsement or sponsorship of us by, the trademark, service mark or trade name owners.
ii
IMPLICATIONS OF BEING AN EMERGING GROWTH COMPANY
As a company with less than $1.0 billion in revenue during our most recently completed fiscal year, we qualify as an emerging growth company as defined in Section 2(a) of the Securities Act of 1933, as amended (the "Securities Act"), as modified by Section 102 of the Jumpstart Our Business Startups Act (the "JOBS Act"). As an emerging growth company, we may take advantage of specified reduced disclosure and other requirements that are otherwise applicable generally to public companies that are not emerging growth companies. These provisions include:
• | reduced disclosure about our executive compensation arrangements; |
• | not being subject to non-binding shareholder advisory votes on executive compensation or golden parachute arrangements; and |
• | an exemption from the auditor attestation requirement in the assessment of our internal control over financial reporting. |
We may take advantage of these exemptions for up to five years or such earlier time that we are no longer an emerging growth company. We will cease to be an emerging growth company upon the earlier of (i) the last day of the fiscal year in which our annual gross revenue exceeds $1.0 billion, (ii) the last day of the fiscal year that we become a "large accelerated filer" as defined in Rule 12b-2 under the Securities Exchange Act of 1934, as amended (the "Exchange Act"), which would occur if the market value of our ordinary shares held by non-affiliates exceeds $700 million as of the last business day of our most recently completed second fiscal quarter and we have been publicly reporting for at least 12 months or (iii) the date on which we have issued more than $1.0 billion in non-convertible debt during the preceding three-year period. The JOBS Act permits emerging growth companies to take advantage of an extended transition period to comply with new or revised accounting standards applicable to public companies. We have chosen to "opt out" of this provision and, as a result, we will comply with new or revised accounting standards by no later than the relevant dates on which adoption of such standards is required for non-emerging growth companies. This decision to opt out of the extended transition period under the JOBS Act is irrevocable.
FORWARD-LOOKING STATEMENTS
This annual report on Form 10-K contains forward-looking statements that are subject to risks and uncertainties. All statements other than statements of historical fact included in this annual report are forward-looking statements. Forward-looking statements discuss our current expectations and projections relating to our financial condition, results of operations, plans, objectives, future performance and business. You can identify forward-looking statements by the fact that they do not relate strictly to historical or current facts. These statements may include words such as "aim," "anticipate," "believe," "estimate," "expect," "forecast," "outlook," "potential," "project," "projection," "plan," "intend," "seek," "believe," "may," "could," "would," "will," "should," "can," "can have," "likely," the negatives thereof and other words and terms of similar meaning in connection with any discussion of the timing or nature of future operating or financial performance or other events. For example, all statements we make relating to our estimated and projected earnings, revenue, costs, expenditures, cash flows, growth rates and financial results, our plans and objectives for future operations, growth or initiatives, strategies, or the expected outcome or impact of pending or threatened litigation are forward-looking statements. All forward-looking statements are subject to risks and uncertainties that may cause actual results to differ materially from those that we expected, including:
• | the impact of general economic conditions in the United States or Canada, or in the specific markets in which we currently do business; |
• | industry conditions, including existing competition and future competitive technologies; |
• | the popularity of radio as a broadcasting and advertising medium; |
• | cancellations, disruptions or postponements of advertising schedules in response to national or world events; |
iii
• | our dependence on key personnel; our capital expenditure requirements; our continued ability to identify suitable acquisition targets, and consummate and integrate any future acquisitions; |
• | legislative or regulatory requirements; risks and uncertainties relating to our leverage; changes in interest rates; |
• | our ability to obtain financing at times, in amounts and at rates considered appropriate by us; |
• | our ability to access the capital markets as and when needed and on terms that we consider favorable to us; and |
• | other factors mentioned in the section entitled "Risk Factors." |
While we believe that our assumptions are reasonable, we caution that it is very difficult to predict the impact of known factors, and it is impossible for us to anticipate all factors that could affect our actual results. Important factors that could cause actual results to differ materially from our expectations, or cautionary statements, are disclosed under "Risk Factors" and "Management’s Discussion and Analysis of Financial Condition and Results of Operations" in this annual report, as well as other risks discussed from time to time in our filings with the SEC. The cautionary statements referred to in this section also should be considered in connection with any subsequent written or oral forward-looking statements that may be issued by us or persons acting on our behalf. All forward-looking statements are expressly qualified in their entirety by these cautionary statements. You should evaluate all forward-looking statements made in this annual report in the context of these risks and uncertainties. We caution you that the important factors referenced above may not contain all of the factors that are important to you. In addition, we cannot assure you that we will realize the results or developments we expect or anticipate or, even if substantially realized, that they will result in the consequences we anticipate or affect us or our operations in the way we expect. In addition, as a result of these and other factors, our past financial performance should not be relied on as an indication of future performance. The forward-looking statements included in this annual report are made only as of the date hereof. We undertake no obligation to publicly update or revise any forward-looking statement as a result of new information, future events or otherwise, except as otherwise required by law. If we do update one or more forward-looking statements, no inference should be made that we will make additional updates with respect to those or other forward-looking statements.
ELECTRONIC ACCESS TO COMPANY REPORTS
Our investor website can be accessed at www.townsquaremedia.com under the "Equity Investors" tab. Our Annual Reports on Form 10-K, Quarterly Reports on Form 10-Q, Current Reports on Form 8-K and amendments to those reports filed with or furnished to the SEC pursuant to Section 13(a) or Section 15(d) of the Securities Exchange Act of 1934, as amended, are available free of charge on our investor website promptly after we electronically file those materials with, or furnish those materials to, the SEC. We also use the "Equity Investors" section of our website as a means of disclosing material non-public information and for complying with our disclosure obligations under Regulation FD. Investors are urged to monitor our investor website for announcements of material information relating to us. No information contained on any of our websites is intended to be included as part of, or incorporated by reference into, this Annual Report on Form 10-K.
iv
PART I
ITEM 1. BUSINESS
Description of Business
Townsquare Media, Inc. is a media, entertainment and digital marketing solutions company principally focused on small and mid-sized markets across the United States As of December 31, 2015, our assets included 309 radio stations and more than 325 local websites in 66 U.S. markets, approximately 650 live events with nearly 18 million annual attendees in the U.S. and Canada, a digital marketing solutions company serving approximately 8,000 small to medium sized businesses, and one of the largest digital advertising networks focused on music and entertainment reaching more than 60 million unique visitors each month. Our brands include local media assets such as WYRK, KLAQ, K2 and NJ101.5; music festivals such as Mountain Jam, WE Fest and the Taste of Country Music Festival; touring lifestyle and entertainment events such as the America on Tap craft beer festival series, the Insane Inflatable 5K obstacle race series, and North American Midway Entertainment, North America’s largest mobile amusement company; and tastemaker music and entertainment owned and affiliated websites such as XXL.com, TasteofCountry.com, Loudwire.com, JustJared.com and BrooklynVegan.com.
Local Advertising
Our Local Advertising segment is composed of 309 owned and operated radio stations and over 325 owned and operated local websites in 66 small and mid-sized markets. Our radio stations capture the number one market share of radio revenue in 44 out of our 66 markets, with 21 capturing the number two market share. Almost all of our radio stations have local companion websites that utilize the station brands and are populated with proprietary, original content created and curated by our local media personalities. Nearly all of our radio stations are available to be streamed online via their local companion websites, as well as our proprietary mobile application, radioPup.
We believe that we are the largest and best-capitalized owner and operator of radio stations that focuses solely on serving audiences and advertisers in small and mid-sized markets. These markets have historically exhibited lower volatility in radio advertising spending, unemployment rates and real estate values as compared to U.S. national averages. These markets also typically have fewer media competitors than large markets. Our Local Advertising operations are organized around a regional strategy with cluster concentrations in and around the Northeast, Upper Midwest, Texas and the Mountain West.
Our radio stations and local websites are broadly diversified in terms of brand, music format and target demographics. Many of our brands enjoy a long, often multi-decade, heritage in our markets, increasing their relevance and resonance with our audience. The strength of our brands, combined with the size and targeted nature of our audience, enables us to compete for advertising expenditures against television and print media as well as other radio operators and digital media companies. Our local websites leverage our radio brands, extensive and integrated on-air promotion and the relevant, often local, content to drive audience engagement. We also use our brands’ social media channels to drive traffic to our local websites where we are able to monetize the resulting audience engagement. All of our local websites are search engine and mobile optimized.
Live Events
Our Live Events segment is composed of a diverse range of live events, which we create, promote and produce, including music concerts, multi-day music festivals, consumer expositions and trade shows, athletic events, lifestyle events, as well as mobile amusement parks at fairs and other forms of entertainment. Our live events are local, family oriented and community-based in nature and offer unique, out-of-home experiences for our audience as well as sponsorship, exhibit space and activation opportunities for our advertisers. We also offer event production services to third parties and own a proprietary ticketing platform.
Over the twelve months ended December 31, 2015, and pro forma for the Transactions, we produced approximately 650 live events that attracted approximately 18 million attendees in the U.S. and Canada. Approximately
1
90% of these events are annually recurring branded franchises such as El Paso's Balloonfest, Utica's FrogFest, the Insane Inflatable 5K, and the state and local fairs at which we operate the amusement attractions, including rides, games and concessions such as the Eastern States Exposition and the Calgary Stampede and multi-day music festivals, such as WE Fest and Mountain Jam. We replicate live events that demonstrate a track record of success in additional markets, many of which are within our Local Advertising footprint, where we are able to utilize existing assets and employees, a templated syndication process we refer to as "Events in a Box".
We often customize live events that we operate in our Local Advertising markets to offer entertainment that complements the formats of our radio stations and local websites, reinforcing our brand integration while allowing us to further monetize our existing audience and advertiser relationships. Our live events in our Local Advertising markets are typically executed by our in-market teams, while leveraging centralized underwriting, talent booking and general and administration infrastructure.
Other Media and Entertainment
Our Other Media and Entertainment business is primarily composed of our digital marketing solutions offering, national digital assets and e-commerce offering and also includes miscellaneous revenue. These assets extend our audience and advertiser reach into and beyond our Local Advertising markets.
Digital Marketing Solutions
We offer digital marketing solutions, on a subscription basis, to small and mid-sized local and regional businesses ("SMBs") in small and mid-sized markets across the United States, including markets in which we operate our Local Advertising segment. Our digital marketing solutions, offered under the brand name Townsquare Interactive, include traditional and mobile-enabled website development and hosting services, search engine and online directory optimization services, online reputation management and social media management.
National Digital Assets
We own and operate a portfolio of 16 music and entertainment focused national websites, including Taste of Country, XXL , PopCrush, ScreenCrush, Ultimate Classic Rock, Loudwire, and ComicsAlliance. We employ a dedicated
advertising sales force based in New York with a presence in Los Angeles, Chicago, Detroit and Dallas.
We own and operate the nation’s largest digital advertising network focused on music content. This digital advertising network provides services such as advertising sales representation and advertising trafficking to approximately 150 third-party music and entertainment focused affiliate websites, such as Just Jared, Hype Machine, Brooklyn Vegan and RapUp. In most cases, the digital properties we represent through our digital advertising network do not employ a sales force to pursue advertising revenue. We are compensated for the services we provide to our affiliate websites through revenue-sharing arrangements.
The scale of our national audience reach complements our Local Advertising assets and allows us to deliver a compelling value proposition to national advertisers, such as Toyota, McDonalds, Mazda and Apple, seeking to reach media and entertainment enthusiasts.
E-Commerce
We offer e-commerce products to consumers and advertisers through Seize the Deal, our proprietary deal and auction platform. Seize the Deal enables small businesses, some of which may not have the resources to utilize our Local Advertising products, to sell certain of their products and services online through our auction platform. Our auction platform supports over 106 local auctions annually, which are often used as a gateway to a broader advertising relationship with Townsquare.
2
Competitive Strengths
We believe that we are well-positioned to capitalize on the following competitive strengths to achieve further growth in our future performance:
National Scale and Media Expertise, on a Local Level, in Small and Mid-Sized Markets.
Our scale, national reach and expertise in media and entertainment across our portfolio of Local Advertising assets in small and mid-sized markets provide significant competitive advantages.
Large-Market Products, Technology and Practices Deployed in Small and Mid-Sized Markets.
Our flexible and customized content management system, digital advertising products and delivery capabilities, mobile applications, digital marketing solutions capabilities, online video content and repeatable live event templates allow us to deliver world-class products supported by advanced technology in small and mid-sized markets. We believe with our scale we can offer superior solutions for advertisers and audiences alike as compared to many of our local competitors.
National Scale with Local Focus.
We believe we are the largest and best-capitalized owner and operator of radio stations focused solely on small and mid-sized markets in the United States. This national scale allows us to have greater relevance to, and recognition from, our advertising clients while sharing best practices for strategy and operations across our asset portfolio.
Captive Local Audience Drives Superior Opportunity in Small and Mid-Sized Markets.
The competitive and economic environments found in small and mid-sized markets, particularly the markets where we have an established presence, provide significant advantages to us and, we believe, reduce the volatility in our financial results.
Attractive Competitive Landscapes.
There are fewer and less well-capitalized, local media competitors across our small and mid-sized markets relative to larger markets. In 43 of our 66 local markets, we do not compete against any of the five largest English language national radio competitors, as measured by revenue. We believe this competitive landscape allows our brands to gain a greater share of both audience and advertising expenditures in our markets than what is generally achieved by peers operating in large markets.
Lower Economic Volatility in Small and Mid-Sized Markets.
Our markets have, on average, exhibited lower volatility in radio advertising spending, unemployment rates and real estate values as compared to national averages, resulting in more stable radio advertising revenue compared to the national average historically.
Strategically Assembled Market Portfolio Characterized by Stable, Locally Significant Institutions.
We have assembled our radio station assets and most of our live events operations across a collection of small and mid-sized markets, organized in regional clusters, supported by stable, locally significant institutions such as universities, military bases, state capitals, state fairs, regional medical centers and retail hubs. We believe these stabilizing institutions will further reduce the volatility of advertising spending in our markets.
3
#1 or #2 Revenue Market Share in Nearly All of Our Markets.
Our brands, in the aggregate, capture the largest or the second largest radio revenue share in 65 of our 66 markets, and in 44 markets we are ranked number one. This leading market share position is indicative of our audience reach and engagement as well as our relevance to advertisers in our markets.
Strong Relationships with Local and Regional Advertisers.
In the year ended December 31, 2015, we generated approximately 83% of our revenue across our reportable segments from a broad array of local and regional advertisers in a number of industries, including automotive dealers, banking and mortgage service providers, furniture and home furnishings retailers, food and beverage service providers, healthcare service providers and media and telecommunications service providers. We generate a majority of our Local Advertising revenue by selling directly to local advertisers, as well as to local and regional advertising agencies which affords us the opportunity to better present our products to advertisers, cross sell products and more directly influence their advertising expenditure decisions.
Geographic Diversification with Strength in Northeast, Upper Midwest, Texas and Mountain West.
Our Local Advertising assets are geographically diversified, which helps to mitigate potential regional economic volatility and inclement weather events. By clustering our markets in certain geographic regions we are able to create compelling audience coverage for regional advertisers and to benefit from scale economies.
Diversified and Integrated Product Offering - Townsquare Everywhere.
Our diversified product offerings substantially differentiate us from our competition. This allows us to provide superior solutions to both our audience and advertisers, underpins our growth strategy and, we believe, helps to mitigate the risks associated with advertising revenue concentration.
Audience Engagement In and Out-of-Home, Across Multiple Platforms.
We offer our audience the ability to access our branded content on-air, online and on-site across multiple distribution channels. We believe that leveraging technology to make our branded content experiences accessible between devices and locations strengthens our audience engagement.
Targeted Audience Reach, Closer to the Point of Sale, to Local, Regional and National Advertisers.
A significant portion of our audience engagement occurs when our audience is out-of-home, particularly in the car, in the office or at our live events. Our audience frequently interacts with our content in close proximity to purchase events.
Launch Point for Non-Radio Products.
Our radio reach and engagement provide a powerful promotional vehicle from which we are able to grow our existing and new websites, online radio streams, mobile applications, digital marketing solutions and live events. We believe that the increased interaction with consumers across these new products and platforms in turn reinforces consumer loyalty and affinity toward our radio brands and enables us to develop and grow complementary products in our markets.
Diversified Revenue Base.
We generate revenue from a diversified base of products and services, advertisers and markets. In the year ended December 31, 2015, pro forma for the Transactions, approximately 50% of our net revenue was derived from sources other than the sale of terrestrial radio station advertising. We refer to this revenue as non-spot revenue. For the year ended December 31, 2015, no single advertiser represented more than 1% of our revenue, no advertising category
4
represented more than 20% of our revenue and we did not generate more than 10% of our revenue in any one market or 15% of our revenue in any one state.
Monetization of Our Audience Relationships.
We believe that our diversified and integrated product and service offerings, which we refer to as Townsquare Everywhere, combined with our leading market position in small and mid-sized markets based on radio revenue share, together may enable us to generate higher total revenue per audience member than radio station owners focused on larger markets.
Influential Local and National Brands.
Strong Brand Recognition with Deep Local Heritage.
We believe our brands are well positioned, both to defend their competitive position in the radio medium and to expand their competitive position online, on mobile devices and in live events, which will allow for greater audience reach and deeper, more frequent interaction with our audience.
Original Live Events and Nationally Oriented Digital Brands Delivering Significant Audience Growth.
In addition to our heritage brands, we have established several new brands that have experienced significant audience growth since their inception.
Focus On Providing Original Entertainment, Music and Lifestyle Media Experiences to Our Audience.
We believe that our focus on providing original entertainment, music and lifestyle media experiences to our audience is the key driver of our powerful audience reach and engagement metrics.
Market Leadership in High-Quality, Live and Locally-Focused Content.
In our markets, we are among the largest providers of locally-focused content available to consumers, including in-car commuters. The quality and availability of our locally-focused content allows our brands to distinguish themselves from other local advertising offerings, attract larger audiences and build a loyal audience base. Several of our competitors, particularly in print media, are reducing the amount of original local content they are producing or creating pay-walls that restrict access to their digital content. We believe these trends will continue to advantage our offerings versus other media offerings.
Expertise in Music and Entertainment.
We believe that our expertise in the creation of music and entertainment content represents the foundation of our audience value proposition and is, in part, responsible for many of the strong metrics evidencing our broad and deep audience engagement, our ability to attract employees who excel at content production and our success with advertisers seeking to reach the valuable consumers attracted by our premium content.
Attractive Radio Industry Fundamentals.
The local media industry is an important medium for advertisers to reach targeted local consumers and for consumers to engage with relevant local content and events. Radio is a significant component of total local advertising spend as it remains a highly relevant and important medium for consumers.
Stable and Engaged Audience Base.
Despite the increased number of alternative mediums, terrestrial radio has experienced negligible audience fragmentation over the past 40 years and remains a significant source of daily media exposure. According to the Radio
5
Advertising Bureau, in the third quarter of 2015 terrestrial radio broadcasts reached approximately 93% of American adults age 18+ each week, approximately unchanged since 1970.
Cost-Effective Value Proposition to Advertisers.
Given the stability of its audience, its broad reach and its relatively low cost as compared to competing advertising mediums such as television, we believe radio continues to offer an attractive value proposition to advertisers.
Trusted and Socially-Influential Local Media Personalities.
Research suggests that radio personalities are trusted by their audience and are socially influential. Six out of ten listeners in a joint Clear Channel/University of Southern California study, released in April 2014, say radio on-air personalities are "like a friend," whose opinions they trust. Additionally, more than half of the study participants agreed that they trust brands, products and services recommended by their favorite on-air personality.
Free Delivery of Local Content to End-Users.
Terrestrial radio’s free content distribution model provides an effective competitive advantage against other mediums, particularly those that deploy a subscription-based business model or rely on costs associated with internet connectivity or bandwidth use. In most of our markets, radio represents the only local content available to consumers free of charge.
Key Provider of Safety Information and Charitable Support in the Communities We Serve.
Our radio stations and local websites, together with our employees, play a vital role in the communities we serve by providing emergency information in times of crisis and by supporting a wide variety of charitable endeavors. During weather and other emergencies, our audience and government officials rely on our radio stations to disseminate critical, occasionally life-saving, information. Our radio stations and local websites also routinely support charity and community events through on-air and digital promotions to bolster fundraising activities and emergency relief efforts. These efforts further strengthen our position with both our audience and our advertisers.
Reliable and Substantial Cash Flow Generation.
Our business enjoys strong cash flow generation owing to the relatively limited capital needs of our operation. During the year ended December 31, 2015, we recorded $14.7 million of capital expenditures which represented 3.3% of net revenue during the same period. In addition, we benefit from certain tax attributes to generate tax deductions which have historically limited the amount of cash taxes we pay.
Strong, Experienced and Incentivized Management Team and Committed, Well-Capitalized Sponsors.
We have an experienced senior management team with a proven, multi-disciplinary track record of delivering results for stakeholders. Further, certain funds managed by Oaktree Capital Management, L.P. ("Oaktree") own a majority of our equity. Oaktree is a leading global investment management firm focused on alternative markets and provides strong sponsorship, strategic support and financial resources for our continued growth.
Operating Strategy
The principal features of our operating strategy are:
Diversify Revenue Mix by Continuing to Grow Digital and Live Events Revenue Streams.
The natural synergies between our products allow us to leverage our operating structure and better monetize existing audience and advertiser relationships. Based on our recent success, we intend to continue to increase our digital
6
audience, roll out new digital products and increase the contribution from our live events we operate, both organically and through acquisitions.
Solidify Our Position in Our Markets.
Our market positioning is supported by the demonstrable and consistent positive results our products produce for advertisers. The price point for radio advertising on a cost per thousand basis is lower than most other local media which deliver similar scale. This makes radio more affordable and accessible for the type of small and mid-sized businesses typically found in our markets.
Continue to Develop New Products That Foster Interaction with Our Audience Across Multiple Mediums and Increase Monetization Opportunities.
Our audience reach, combined with our direct relationship with local advertisers in our markets, positions us to launch and monetize new products and services, further diversifying and growing our revenue. In recent years, we have introduced a mobile station streaming application (radioPup), an e-commerce product (Seize the Deal) and a digital presence and marketing solutions platform (Townsquare Interactive). In addition to delivering non-spot revenue growth, these products and services frequently appeal to advertisers in our markets who may not access our radio products, thereby increasing our overall customer base and advertising market share.
Continue to Build Our Premium Portfolio of Brands.
Our branding strategy is fundamental to growing our audience and revenue. Across our markets, we have a large portfolio of distinct local brands that resonate with and appeal to our audiences. Many of our brands have several decades of heritage in our markets. Consumers associate our brands with high quality, locally-relevant content and entertainment. We intend to continue to invest in marketing and promotions in support of our brands and to actively participate in community events to increase our local market presence.
Focus on Differentiated Live and Local Content.
We generally provide a larger proportion of live and local content relative to other local media offerings in our markets. We believe such live and local content is more engaging to our audience and significantly differentiates our offerings in an increasingly crowded media landscape, mitigating the threat of audience attrition. Many audio media offerings that we compete with, including Pandora, Spotify and SiriusXM, do not offer local content in our markets. We intend to continue providing audiences with this differentiated content and enjoy the advantages it provides us with our audience and our advertisers.
Deepen Relationships with Advertisers to Increase Share of Advertising Spend.
We are committed to growing our sales force, training our sales personnel and investing in programs that allow us to deepen relationships with our advertisers, including developing new products that will allow our content, and our advertisers, to reach a broader audience more frequently and in more locations. Over time, we believe we can capture a greater share of the advertising expenditure in our markets across all mediums.
Capitalize on Strong Positions and Brands in News/Talk/Sports, Country and Rock Formats.
We own 72, 68 and 53 radio stations, representing approximately 23%, 22% and 17% of our radio stations, respectively, which are formatted with News/Talk/Sports, Country and Rock content, respectively. The majority of our radio stations airing these formats capture the largest audience among radio stations airing similar content in their respective markets, as ranked by Nielsen or other ratings services. We create audio programming, online content and live events which leverage our strength in these formats, together with the strength of our brands. We intend to continue to use our expertise and knowledge in these formats to share best practices and optimize content across our portfolio, in order to maximize audience aggregation within these formats.
7
Leverage Scalable Structure and Continue to Improve Operating Efficiencies Across Our Company.
Our various media products share common, largely fixed-cost operating infrastructure, resulting in significant scale economies. We also negotiate vendor contracts with key suppliers on a centralized basis, which reduces costs. As a result, as we grow our revenue, a significant majority of each incremental dollar of revenue is converted into incremental earnings.
Acquisition Strategy
The principal features of our acquisition strategy are:
Prudently Pursue Attractively-Valued Acquisition Opportunities.
We have a successful track record of integrating acquisitions. We intend to continue to pursue attractively-priced acquisitions of radio stations, digital properties and live events. We target assets that have strong brands, enjoy leading market share positions, generate strong cash flow and generally possess traits consistent with our existing assets. In addition, acquiring assets allows us to further achieve certain economies of scale, share best practices across a broader platform and diversify our revenue base across our properties and geographies.
Add to Our Portfolio of Attractive Radio Station Clusters.
Since our current senior management team founded the Company in 2010, we have expanded our radio station portfolio from 60 to 309 by completing 11 radio transactions. Radio station ownership in the United States remains significantly fragmented with over 3,000 owners operating over 10,000 commercial radio stations. While FCC ownership limitations restrict, in some cases, our ability to acquire incremental radio stations in certain of our markets, there remain a large number of markets with characteristics that are consistent with Townsquare’s acquisition criteria, in which we have no presence today. Given our acquisition track record, we are viewed by many sellers of radio stations to be a potential buyer of their stations, which has provided us with the opportunity to review the majority of properties sold in recent years. We expect to remain active and disciplined from a valuation perspective in the radio station marketplace.
Augment the Growth of Our Digital and Live Events Product Offerings Through Acquisitions.
In addition to our radio acquisition activity, since 2010 we have executed more than thirty acquisitions of assets in the digital and live events sectors, including certain assets of AOL Music, multi-day music festivals WE Fest, Mountain Jam and Country Jam, various trade shows and other live events properties. We also acquired NAME, North America's largest mobile amusement company, in September, 2015, which further extends our multi-product, cross-platform offering and provides additional geographic and revenue diversification. In these acquisitions, we were able to leverage our existing platform in combination with the acquired assets to drive operating efficiencies and financial performance. In many cases, we are able to template acquired live event properties and syndicate them into additional markets across our footprint. We expect to remain active in the digital and live events acquisition marketplace.
Evaluate New Product Opportunities.
We have evaluated a number of acquisition opportunities in other sectors that we view as adjacent and complementary to our existing asset portfolio. We expect to continue to consider such opportunities and potentially transact in the event that we find assets that provide a natural extension to our core competencies, further diversify our revenue and demonstrate a risk-reward profile that meets our stringent requirements.
Sources of Revenue
We generate revenue by selling multiple products and services across a range of media platforms. We approach our media products holistically, maximizing our revenue potential by pursuing integrated cross-platform sales and solutions for our advertising clients. Specifically, we offer advertisers cross-platform packages that incorporate our
8
audience reach across radio, websites, social media, online video, mobile, digital marketing solutions, e-commerce and live events.
Our revenue is generated primarily through the integrated sale of the following solutions:
Local Advertising
• | Spot radio advertisements sold to local, regional and national advertisers. |
• | Sponsorships, live reads and endorsements sold to local, regional and national advertisers. |
• | Remote broadcasts of our radio stations at advertisers’ places of business sold to local and regional advertisers. |
• | Barter-based auctions sold to local and regional advertisers. |
• | Display, sponsorship and video advertising, including custom developed digital advertisement products, on our affiliated, owned and operated local websites to local, regional and national advertisers. Display and sponsorship advertising on our mobile application, radioPup, sold to local, regional and national advertisers. |
• | Advertising and sponsorships in our radio stations’ online radio streams accessible on computing devices as well as on mobile devices through our mobile application, radioPup, sold to local, regional and national advertisers. |
• | Sponsored video content, including branded content series, often featuring musicians or other celebrities, and distributed across our portfolio of digital properties and social media channels, sold to local, regional and national advertisers. |
Live Events
• | Tickets, merchandise, rides, food and other concessions and other ancillary products and services sold to our audience. |
• | Sponsorships, exhibit space and activations sold to our local, regional and national advertisers. |
• | Sponsored events, generally featuring musicians, sponsored by and custom produced on behalf of our advertisers, sold to advertisers. |
Other Media and Entertainment
• | Traditional and mobile-enabled website development and hosting services, search engine and online directory optimization services, online reputation management and social media management sold to local and regional small and mid-sized businesses. |
• | E-Commerce offerings, including daily deals, ongoing deals and auctions sold to local and regional advertisers. |
• | Display, sponsorship and video advertising, including custom developed digital advertisement products, on our owned and operated national websites as well as our affiliate websites sold to local, regional and national advertisers. |
• | Sponsored video content, including branded content series, often featuring musicians or other celebrities, and distributed across our portfolio of digital properties and social media channels, sold to local, regional and national advertisers. |
9
We are positioned to generate growth in revenue by increasing audience interaction with our radio stations, local and national websites, online radio streams, mobile applications and live events, which lead to an enhanced share of advertising expenditures, as well as an increased share of consumer spending.
Our Industry
The local media industry is an important medium for advertisers to reach targeted local consumers and for consumers to engage with relevant local content and events. According to SNL Kagan, in 2015 local advertising spending across all U.S. major media categories totaled $75.0 billion. Since 2010, U.S. local advertising has increased at a 1.2% compound annual growth rate and is projected to grow at a 4.0% compound annual growth rate through 2020. In 2015, local advertising spending on radio and digital, among our target categories, totaled $34.2 billion while consumer spending on live event tickets and advertiser spending on live event sponsorships, event marketing, and activation opportunities were additional substantial and growing markets. Since 2010, U.S. local advertising spending on radio and digital has increased at a 9.3% compound annual growth rate and is projected to grow at a 7.8% compound annual growth rate through 2020.
Radio. The primary source of revenue for radio broadcasting companies is the sale of advertising time to local, regional and national spot advertisers, and national network advertisers. According to SNL Kagan, over the past 10 years radio advertising has generally represented approximately 6.3% to 7.9% of the overall U.S. advertising market, and has typically followed macroeconomic growth trends. In 2015, radio advertising revenue reached $14.3 billion of which $10.6 billion was local radio advertising. The radio industry has a stable and engaged audience base and continues to be one of the core methods for advertisers to reach their targeted audience. According to the Radio Advertising Bureau, in the third quarter of 2015, terrestrial radio broadcasts reached approximately 93% of American adults age 18+ each week, a level that has remained substantially unchanged since 1970.
Digital. The primary source of revenue for national and local websites, accessed either from a PC, tablet or mobile device, is the sale of search ads, display ads and video advertising directly to advertisers and indirectly through advertising networks and exchanges. According to SNL Kagan, in 2015 digital advertising revenue reached $57.3 billion of which $23.6 billion was local. Since 2010, local digital advertising has represented one of the fastest growing local media advertising categories with a compounded annual growth rate of 17.3%, outpacing national advertising which grew at 16.5%. Local digital advertising is projected to grow at a compounded annual growth rate of 10.7% through 2020 and continue to gain market share on national advertising which is projected to grow at 4.6%.
Live Events. The primary source of revenue for live events is the sale of tickets to attendees and sponsorships, event marketing, and activation opportunities for local, regional and national advertisers. According to IBIS World, total revenue from the U.S. live event industry, which includes the creation, management and promotion of live performances and events, ranging from concerts and theater performances to state fairs and air shows, grew to $25.1 billion in 2015, up from $20.0 billion in 2010, which represents a 4.7% compounded annual growth rate. Live event industry revenue is projected to grow at a compounded annual growth rate of 5.0% through 2020. For 2015, Pollstar estimates the total size of the North American live concert industry at $6.9 billion, up from $4.3 billion in 2010, which represents a compound annual growth rate of 12.9%. Concert tour attendance increased in 2015, as measured by the top 100 grossing North American concert ticket sales, which increased by 10.2% to over 42 million, representing a record high.
Competition
The local media industry is very competitive. The success of each of our radio stations, digital properties and live events depends largely upon each product’s ability to attract audience, pricing, the number of local media competitors and the overall demand for advertising within individual markets. We mitigate these competitive pressures by focusing on small to mid-sized markets, where there are fewer and less well-capitalized local media competitors across all mediums, including radio stations, broadcast television stations, pay television networks, locally-focused websites, live events, outdoor advertising, newspapers, magazines and directories. The lack of competition often allows our brands to garner a greater share of both the local audience and advertising expenditures in our markets.
10
Radio
Our radio stations compete for audiences and advertising revenue directly with other radio stations within their respective markets as well as with other alternative mediums including satellite radio, television, print and digital media. Additionally, new online music services have begun to sell advertising locally, creating additional competition for both audience and advertisers. By building strong brands with a targeted audience consisting of specific demographic groups in each of our markets, we are able to attract advertisers seeking to reach those particular audiences.
Factors that affect a radio station’s competitive position include its brand identity and audience loyalty, management experience, the radio station’s local audience rank in its market (which is highly affected by the competitive radio landscape in a market and format changes that occur from time to time), transmitter power and location, assigned frequency, audience characteristics, local program acceptance and the number and characteristics of other radio stations and other advertising media in the market area. We attempt to improve our competitive position in each market by constantly researching and improving the content of our radio stations and websites, implementing advertising campaigns aimed at the demographic groups for which our radio stations target content and managing our sales efforts to attract a larger share of advertising dollars for each radio station individually.
Local Digital Content
Our websites compete for audiences and advertisers directly with other local radio station websites, television station websites, newspaper websites, online directories, local sections of national digital properties, blogs and other types of locally focused websites, as well as all national and international websites. We attempt to improve our competitive position, maximize our audience and grow our revenue by focusing on high quality, differentiated local content and by providing innovative and effective advertising integration for our customers.
Live Events
Our live events compete for audiences and sponsorships with both national competitors, such as Live Nation and AEG, and a variety of local or regional competitors, promoters and event marketing companies. Additionally, we compete with venue operators, including arenas, theaters and casinos, which bring in live entertainment directly.
Digital Marketing Solutions
The market for local online advertising solutions is competitive and dynamic. Some of our competitors enjoy substantial competitive advantages, such as greater name recognition, longer operating histories and larger marketing budgets, as well as substantially greater financial, technical and other resources. Our competitors include large internet marketing providers, offline media companies such as yellow page publishers, newspaper and television companies as well as other local SMB marketing providers.
National Digital Content
Our national digital assets compete for audience and advertisers with a diverse and large pool of advertising, media and internet companies. We expect that this competition will persist in the future as a result of the continuing maturation of the industry and a lack of significant barriers to entry. Our success will depend upon a number of factors, including the quality of content on our owned and operated as well as our affiliated websites, the ability to manage search engine optimization efforts to direct traffic to these websites, our customer service and support efforts, our sales and marketing efforts and the ability to remain price competitive.
Employees
As of December 31, 2015, we employed approximately 2,900 full and part-time employees. Additionally, we hire approximately 900 seasonal workers between March and November of each year. None of our employees are covered by collective bargaining agreements and we consider our relations with our employees to be satisfactory.
11
We employ individuals in a large variety of roles. On occasion, in order to protect our interests we enter into employment agreements with certain of our employees, including members of senior management, product leaders, Local Advertising market general managers and selected sales personnel and local media personalities. We do not believe that the loss of any one these individuals, excluding certain key members of our senior management, would have a material adverse effect on our financial condition or results of operations, taken as a whole. Our risks related to losing key members of our senior management are more fully described in the section titled "Risk Factors."
Financial Information About Geographic Areas
See Part II-Item 8. Financial Statements and Supplementary Data, Note 11, "Segment Reporting" for discussion of net revenue, operating income and long-lived assets attributable to Canada and to our country of domicile, the United States.
Federal Regulation of Radio Broadcasting
General
The ownership, operation and sale of radio stations, including those licensed to us, are subject to the jurisdiction of the FCC, which acts under authority of the Communications Act. The Telecommunications Act of 1996 amended the Communications Act and directed the FCC to change certain of its broadcast rules. Among its other regulatory responsibilities, the FCC issues permits and licenses to construct and operate radio stations; assigns broadcast frequencies; determines whether to approve changes in ownership or control of radio station licenses; regulates transmission equipment, operating power and other technical parameters of radio stations; adopts and implements regulations and policies that directly or indirectly affect the ownership, operation and employment practices of radio stations; regulates the content of some forms of radio broadcast content; and has the authority under the Communications Act to impose penalties for violations of its rules.
The following is a brief summary of certain provisions of the Communications Act and relevant FCC rules and published policies (collectively, the "Communications Laws"). This description does not purport to be comprehensive and reference should be made to the Communications Laws, public notices, and decisions issued by the FCC for further information concerning the nature and extent of federal regulation of radio stations. Failure to observe the provisions of the Communications Laws can result in the imposition of various sanctions, including monetary forfeitures and the grant of a "short-term" (less than the maximum term) license renewal. For particularly egregious violations, the FCC may deny a radio station’s license renewal application, revoke a radio station’s license, or deny applications in which an applicant seeks to acquire additional broadcast properties.
License Grant and Renewal
Radio broadcast licenses are generally granted and renewed for terms of eight years. Licenses are renewed by filing an application with the FCC. Petitions to deny license renewal applications may be filed by interested parties, including members of the public. While we are not currently aware of any facts that would prevent the renewal of our
licenses to operate our radio stations, there can be no assurance that any of our licenses will be renewed for a full term without adverse consequences.
Service Areas
Each class of FM station has the right to broadcast with a certain amount of power from an antenna located at a certain height. The most powerful FM radio stations are Class C FM radio stations, which may operate with the equivalent of up to 100 kilowatts of effective radiated power ("ERP") at an antenna height of up to 1,968 feet above average terrain. These radio stations typically provide service to large areas that cover one or more counties. There are also Class C0, C1, C2 and C3 FM radio stations which may operate with progressively less power and/or antenna
12
height. Class B FM stations operate with the equivalent of up to 50 kilowatts ERP at an antenna height of up to 492 feet above average terrain. Class B radio stations typically serve large metropolitan areas and their outer suburban areas. There are also Class B1 radio stations that can operate with up to 25 kilowatts ERP at an antenna height of up to 328 feet above average terrain. Class A FM radio stations may operate with the equivalent of 6 kilowatts ERP at an antenna height of up to 328 feet above average terrain, and generally serve smaller cities and towns or suburbs of larger cities.
The area served by an AM radio station is determined by a combination of frequency, transmitter power, antenna orientation and soil conductivity. To determine the effective service area of an AM radio station, the radio station’s power, operating frequency, antenna patterns and its day/night operating modes are required. The area served by an FM radio station is determined by a combination of transmitter power and antenna height, with radio stations divided into eight classes according to these technical parameters, as set forth above.
The following tables set forth, as of February 18, 2016, the market, call letters, cities of license, frequencies and FCC license expiration dates and our station clusters’ revenue rankings as reported by Nielsen of all our owned radio stations and all stations operated under Time Brokerage Agreements ("TBAs") or Local Marketing Agreements ("LMAs").
Owned/Operated Stations
Market (Nielsen Ranking) | Station | City of License | Frequency | License Expiration Date | |||||
Abilene, TX (#235) | KEAN-FM | Abilene, TX | 105.1 | August 1, 2021 | |||||
KEYJ-FM | Abilene, TX | 107.9 | August 1, 2021 | ||||||
KULL(FM) | Abilene, TX | 100.7 | August 1, 2021 | ||||||
KSLI(AM) | Abilene, TX | 1280 | August 1, 2021 | ||||||
KMWX(FM) | Abilene, TX | 92.5 | August 1, 2021 | ||||||
KYYW(AM) | Abilene, TX | 1470 | August 1, 2021 | ||||||
Albany-Schenectady-Troy, NY (#65) | WQSH(FM) | Malta, NY | 105.7 | June 1, 2022 | |||||
W256BU(FX)(3) | Albany, NY | 99.1 | June 1, 2022 | ||||||
WGNA-FM | Albany, NY | 107.7 | June 1, 2022 | ||||||
WQBJ(FM) | Cobleskill, NY | 103.5 | June 1, 2022 | ||||||
WQBK-FM | Rensselaer, NY | 103.9 | June 1, 2022 | ||||||
WTMM-FM | Mechanicville, NY | 104.5 | June 1, 2022 | ||||||
Amarillo, TX (#169) | KATP(FM) | Amarillo, TX | 101.9 | August 1, 2021 | |||||
KIXZ(AM) | Amarillo, TX | 940 | August 1, 2021 | ||||||
KXSS-FM | Amarillo, TX | 96.9 | August 1, 2021 | ||||||
KMXJ-FM | Amarillo, TX | 94.1 | August 1, 2021 | ||||||
KPRF(FM) | Amarillo, TX | 98.7 | August 1, 2021 | ||||||
Atlantic City-Cape May, NJ (#151) | WENJ(FM) | Millville, NJ | 97.3 | June 1, 2022 | |||||
WPGG(AM) | Atlantic City, NJ | 1450 | June 1, 2022 | ||||||
WFPG(FM) | Atlantic City, NJ | 96.9 | June 1, 2022 | ||||||
WPUR(FM) | Atlantic City, NJ | 107.3 | June 1, 2022 | ||||||
WSJO(FM) | Egg Harbor City, NJ | 104.9 | June 1, 2022 | ||||||
Augusta-Waterville, ME (#258) | WEBB(FM) | Waterville, ME | 98.5 | April 1, 2022 | |||||
WJZN(AM) | Augusta, ME | 1400 | April 1, 2022 | ||||||
WMME-FM | Augusta, ME | 92.3 | April 1, 2022 | ||||||
WTVL(AM) | Waterville, ME | 1490 | April 1, 2022 | ||||||
Bangor, ME (#218) | WEZQ(FM) | Bangor, ME | 92.9 | April 1, 2022 | |||||
WWMJ(FM) | Ellsworth, ME | 95.7 | April 1, 2022 | ||||||
13
WQCB(FM) | Brewer, ME | 106.5 | April 1, 2022 | ||||||
WBZN(FM) | Old Town, ME | 107.3 | April 1, 2022 | ||||||
WDEA(AM) | Ellsworth, ME | 1370 | April 1, 2022 | ||||||
Battle Creek, MI (#255) | WBCK(FM) | Battle Creek, MI | 95.3 | October 1, 2020 | |||||
WBXX(FM) | Marshall, MI | 104.9 | October 1, 2020 | ||||||
Billings, MT (#240) | KMHK(FM) | Billings, MT | 103.7 | April 1, 2021 | |||||
KBUL(AM) | Billings, MT | 970 | April 1, 2021 | ||||||
KCTR-FM | Billings, MT | 102.9 | April 1, 2021 | ||||||
KKBR(FM) | Billings, MT | 97.1 | April 1, 2021 | ||||||
KCHH(FM) | Worden, MT | 95.5 | April 1, 2021 | ||||||
K236AB(FX)(3) | Billings, MT | 95.1 | April 1, 2021 | ||||||
Binghamton, NY (#186) | WAAL(FM) | Binghamton, NY | 99.1 | June 1, 2022 | |||||
WHWK(FM) | Binghamton, NY | 98.1 | June 1, 2022 | ||||||
WNBF(AM) | Binghamton, NY | 1290 | June 1, 2022 | ||||||
WWYL(FM) | Chenango Bridge, NY | 104.1 | June 1, 2022 | ||||||
WYOS(AM) | Binghamton, NY | 1360 | June 1, 2022 | ||||||
Bismarck, ND (#259) | KBYZ(FM) | Bismarck, ND | 96.5 | April 1, 2021 | |||||
KACL(FM) | Bismarck, ND | 98.7 | April 1, 2021 | ||||||
KKCT(FM) | Bismarck, ND | 97.5 | April 1, 2021 | ||||||
KUSB(FM) | Hazelton, ND | 103.3 | April 1, 2021 | ||||||
KLXX(AM) | Bismarck-Mandan, ND | 1270 | April 1, 2021 | ||||||
Boise, ID (#97) | KAWO(FM) | Boise, ID | 104.3 | October 1, 2021 | |||||
KCIX(FM) | Garden City, ID | 105.9 | October 1, 2021 | ||||||
KFXD(AM) | Boise, ID | 630 | October 1, 2021 | ||||||
KIDO(AM) | Nampa, ID | 580 | October 1, 2021 | ||||||
KSAS-FM | Caldwell, ID | 103.5 | October 1, 2021 | ||||||
KXLT-FM | Eagle, ID | 107.9 | October 1, 2021 | ||||||
Bozeman, MT (Not Rated ("NR")) | KZMY(FM) | Bozeman, MT | 103.5 | April 1, 2021 | |||||
KISN(FM) | Belgrade, MT | 96.7 | April 1, 2021 | ||||||
KMMS-FM | Bozeman, MT | 95.1 | April 1, 2021 | ||||||
KMMS(AM) | Bozeman, MT | 1450 | April 1, 2021 | ||||||
KPRK(AM) | Livingston, MT | 1340 | April 1, 2021 | ||||||
KXLB(FM) | Livingston, MT | 100.7 | April 1, 2021 | ||||||
K254AL(FX)(3) | Livingston, MT | 98.7 | April 1, 2021 | ||||||
Buffalo-Niagara Falls, NY (#57) | WBLK(FM) | Depew, NY | 93.7 | June 1, 2022 | |||||
WBUF(FM) | Buffalo, NY | 92.9 | June 1, 2022 | ||||||
WMSX(FM) | Buffalo, NY | 96.1 | June 1, 2022 | ||||||
WYRK(FM) | Buffalo, NY | 106.5 | June 1, 2022 | ||||||
Casper, WY (NR) | KKTL(AM) | Casper, WY | 1400 | October 1, 2021 | |||||
KRNK(FM) | Casper, WY | 96.7 | October 1, 2021 | ||||||
KRVK(FM) | Vista West, WY | 107.9 | October 1, 2021 | ||||||
KTRS-FM | Casper, WY | 104.7 | October 1, 2021 | ||||||
KTWO(AM) | Casper, WY | 1030 | October 1, 2021 | ||||||
KWYY(FM) | Midwest, WY | 95.5 | October 1, 2021 | ||||||
Cedar Rapids, IA (#205) | KDAT(FM) | Cedar Rapids, IA | 104.5 | February 1, 2021 | |||||
KHAK(FM) | Cedar Rapids, IA | 98.1 | February 1, 2021 | ||||||
KRNA(FM) | Iowa City, IA | 94.1 | February 1, 2021 | ||||||
KRQN(FM)(1)(3) | Vinton, IA | 107.1 | February 1, 2021 | ||||||
Cheyenne, WY (#270) | KIGN(FM) | Burns, WY | 101.9 | October 1, 2021 | |||||
14
KGAB(AM) | Orchard Valley, WY | 650 | October 1, 2021 | ||||||
KLEN(FM) | Cheyenne, WY | 106.3 | October 1, 2021 | ||||||
Danbury, CT (#197) | WINE(AM) | Brookfield, CT | 940 | April 1, 2022 | |||||
WRKI(FM) | Brookfield, CT | 95.1 | April 1, 2022 | ||||||
WDBY(FM) | Patterson, NY | 105.5 | June 1, 2022 | ||||||
WDBY-FM1(3) | Brookfield, CT | 105.5 | June 1, 2022 | ||||||
Dubuque, IA (NR) | KLYV(FM) | Dubuque, IA | 105.3 | February 1, 2021 | |||||
KXGE(FM) | Dubuque, IA | 102.3 | February 1, 2021 | ||||||
WDBQ(AM) | Dubuque, IA | 1490 | February 1, 2021 | ||||||
WDBQ-FM | Galena, IL | 107.5 | December 1, 2020 | ||||||
WJOD(FM) | Asbury, IA | 103.3 | February 1, 2021 | ||||||
Duluth-Superior, MN, WI (#210) | KKCB(FM) | Duluth, MN | 105.1 | April 1, 2021 | |||||
KLDJ(FM) | Duluth, MN | 101.7 | April 1, 2021 | ||||||
WEBC(AM) | Duluth, MN | 560 | April 1, 2021 | ||||||
KBMX(FM) | Proctor, MN | 107.7 | April 1, 2021 | ||||||
W293CT(FX)(3) | Duluth, MN | 106.5 | April 1, 2021 | ||||||
El Paso, TX (#75) | KLAQ(FM) | El Paso, TX | 95.5 | August 1, 2021 | |||||
KROD(AM) | El Paso, TX | 600 | August 1, 2021 | ||||||
KSII(FM) | El Paso, TX | 93.1 | August 1, 2021 | ||||||
Evansville, IN (#162) | WDKS(FM) | Newburgh, IN | 106.1 | August 1, 2020 | |||||
WGBF(AM) | Evansville, IN | 1280 | August 1, 2020 | ||||||
WGBF-FM | Henderson, KY | 103.1 | August 1, 2020 | ||||||
WJLT(FM) | Evansville, IN | 105.3 | August 1, 2020 | ||||||
WKDQ(FM) | Henderson, KY | 99.5 | August 1, 2020 | ||||||
Faribault/Owatonna, MN (NR) | KDHL(AM) | Faribault, MN | 920 | April 1, 2021 | |||||
KQCL(FM) | Faribault, MN | 95.9 | April 1, 2021 | ||||||
KRFO(AM) | Owatonna, MN | 1390 | April 1, 2021 | ||||||
KRFO-FM | Owatonna, MN | 104.9 | April 1, 2021 | ||||||
Flint, MI (#136) | WCRZ(FM) | Flint, MI | 107.9 | October 1, 2020 | |||||
WFNT(AM) | Flint, MI | 1470 | October 1, 2020 | ||||||
WLCO(AM) | Lapeer, MI | 1530 | October 1, 2020 | ||||||
WQUS(FM) | Lapeer, MI | 103.1 | October 1, 2020 | ||||||
WRCL(FM) | Frankenmuth, MI | 93.7 | October 1, 2020 | ||||||
WWBN(FM) | Tuscola, MI | 101.5 | October 1, 2020 | ||||||
Ft. Collins-Greeley, CO (#112) | KKPL(FM) | Cheyenne, WY | 99.9 | October 1, 2021 | |||||
KMAX-FM | Wellington, CO | 94.3 | April 1, 2021 | ||||||
KTRR(FM) | Loveland, CO | 102.5 | April 1, 2021 | ||||||
KUAD-FM | Windsor, CO | 99.1 | April 1, 2021 | ||||||
Grand Junction, CO (#245) | KEKB(FM) | Fruita, CO | 99.9 | April 1, 2021 | |||||
KBKL(FM) | Grand Junction, CO | 107.9 | April 1, 2021 | ||||||
KMXY(FM) | Grand Junction, CO | 104.3 | April 1, 2021 | ||||||
KKNN(FM) | Delta, CO | 95.1 | April 1, 2021 | ||||||
KEXO(AM) | Grand Junction, CO | 1230 | April 1, 2021 | ||||||
Grand Rapids, MI (#68) | WFGR(FM) | Grand Rapids, MI | 98.7 | October 1, 2020 | |||||
WGRD-FM | Grand Rapids, MI | 97.9 | October 1, 2020 | ||||||
WLHT-FM | Grand Rapids, MI | 95.7 | October 1, 2020 | ||||||
WNWZ(AM) | Grand Rapids, MI | 1410 | October 1, 2020 | ||||||
WTRV(FM) | Walker, MI | 100.5 | October 1, 2020 | ||||||
Kalamazoo, MI (#184) | WKFR-FM | Battle Creek, MI | 103.3 | October 1, 2020 | |||||
15
WKMI(AM) | Kalamazoo, MI | 1360 | October 1, 2020 | ||||||
WRKR(FM) | Portage, MI | 107.7 | October 1, 2020 | ||||||
W273AR(FX)(3) | Paw Paw, MI | 102.5 | October 1, 2020 | ||||||
Killeen-Temple, TX (#140) | KSSM(FM) | Copperas Cove, TX | 103.1 | August 1, 2021 | |||||
KUSJ(FM) | Harker Heights, TX | 105.5 | August 1, 2021 | ||||||
KLTD(FM) | Temple, TX | 101.7 | August 1, 2021 | ||||||
KTEM(AM) | Temple, TX | 1400 | August 1, 2021 | ||||||
KOOC(FM) | Belton, TX | 106.3 | August 1, 2021 | ||||||
Lafayette, LA (#107) | KPEL-FM | Breaux Bridge, LA | 96.5 | June 1, 2020 | |||||
KHXT(FM) | Erath, LA | 107.9 | June 1, 2020 | ||||||
KMDL(FM) | Kaplan, LA | 97.3 | June 1, 2020 | ||||||
KPEL(AM) | Lafayette, LA | 1420 | June 1, 2020 | ||||||
KROF(AM) | Abbeville, LA | 960 | June 1, 2020 | ||||||
KTDY(FM) | Lafayette, LA | 99.9 | June 1, 2020 | ||||||
Lake Charles, LA (#219) | KHLA(FM) | Jennings, LA | 92.9 | June 1, 2020 | |||||
KLCL(AM) | Lake Charles, LA | 1470 | June 1, 2020 | ||||||
KJMH(FM) | Lake Arthur, LA | 107.5 | June 1, 2020 | ||||||
KNGT(FM) | Lake Charles, LA | 99.5 | June 1, 2020 | ||||||
KJEF(AM) | Jennings, LA | 1290 | June 1, 2020 | ||||||
KTSR(FM) | De Quincy, LA | 92.1 | June 1, 2020 | ||||||
Lansing-East Lansing, MI (#127) | WFMK(FM) | East Lansing, MI | 99.1 | October 1, 2020 | |||||
WMMQ(FM) | East Lansing, MI | 94.9 | October 1, 2020 | ||||||
WVFN(AM) | East Lansing, MI | 730 | October 1, 2020 | ||||||
WITL-FM | Lansing, MI | 100.7 | October 1, 2020 | ||||||
WJIM(AM) | Lansing, MI | 1240 | October 1, 2020 | ||||||
WJIM-FM | Lansing, MI | 97.5 | October 1, 2020 | ||||||
Laramie, WY (NR) | KCGY(FM) | Laramie, WY | 95.1 | October 1, 2021 | |||||
KOWB(AM) | Laramie, WY | 1290 | October 1, 2021 | ||||||
Lawton, OK (NR) | KLAW(FM) | Lawton, OK | 101.3 | June 1, 2021 | |||||
KVRW(FM) | Lawton, OK | 107.3 | June 1, 2021 | ||||||
KZCD(FM) | Lawton, OK | 94.1 | June 1, 2021 | ||||||
Lubbock, TX (#170) | KFMX-FM | Lubbock, TX | 94.5 | August 1, 2021 | |||||
KFYO(AM) | Lubbock, TX | 790 | August 1, 2021 | ||||||
KKAM(AM) | Lubbock, TX | 1340 | August 1, 2021 | ||||||
KKCL-FM | Lorenzo, TX | 98.1 | August 1, 2021 | ||||||
KQBR(FM) | Lubbock, TX | 99.5 | August 1, 2021 | ||||||
KZII-FM | Lubbock, TX | 102.5 | August 1, 2021 | ||||||
Lufkin-Nacogdoches, TX (NR) | KVLL-FM | Wells, TX | 94.7 | August 1, 2021 | |||||
KYKS(FM) | Lufkin, TX | 105.1 | August 1, 2021 | ||||||
KAFX-FM | Diboll, TX | 95.5 | August 1, 2021 | ||||||
KSFA(AM) | Nacogdoches, TX | 860 | August 1, 2021 | ||||||
KTBQ(FM) | Nacogdoches, TX | 107.7 | August 1, 2021 | ||||||
Missoula, MT (NR) | KYSS-FM | Missoula, MT | 94.9 | April 1, 2021 | |||||
KGVO(AM) | Missoula, MT | 1290 | April 1, 2021 | ||||||
KMPT(AM) | East Missoula, MT | 930 | April 1, 2021 | ||||||
KBAZ(FM) | Hamilton, MT | 96.3 | April 1, 2021 | ||||||
KLYQ(AM) | Hamilton, MT | 1240 | April 1, 2021 | ||||||
KGVO-FM | Frenchtown, MT | 101.5 | April 1, 2021 | ||||||
KENR(FM) | Superior, MT | 107.5 | April 1, 2021 | ||||||
16
KENR-FM1(3) | Missoula, MT | 107.5 | April 1, 2021 | ||||||
K252BM(FX)(3) | Seeley Lake, MT | 98.3 | April 1, 2021 | ||||||
Monmouth-Ocean, NJ (#53) | WADB(AM) | Asbury Park, NJ | 1310 | June 1, 2022 | |||||
WCHR-FM | Manahawkin, NJ | 105.7 | June 1, 2022 | ||||||
WJLK(FM) | Asbury Park, NJ | 94.3 | June 1, 2022 | ||||||
WOBM(AM) | Lakewood Township, NJ | 1160 | June 1, 2022 | ||||||
WOBM-FM | Toms River, NJ | 92.7 | June 1, 2022 | ||||||
New Bedford-Fall River, MA (#179) | WBSM(AM) | New Bedford, MA | 1420 | April 1, 2022 | |||||
WFHN(FM) | Fairhaven, MA | 107.1 | April 1, 2022 | ||||||
Odessa-Midland, TX (#167) | KBAT(FM) | Monahans, TX | 99.9 | August 1, 2021 | |||||
KODM(FM) | Odessa, TX | 97.9 | August 1, 2021 | ||||||
KNFM(FM) | Midland, TX | 92.3 | August 1, 2021 | ||||||
KZBT(FM) | Midland, TX | 93.3 | August 1, 2021 | ||||||
KMND(AM) | Midland, TX | 1510 | August 1, 2021 | ||||||
KGEE(FM) | Pecos, TX | 97.3 | August 1, 2021 | ||||||
Oneonta, NY (NR) | WBKT(FM) | Norwich, NY | 95.3 | June 1, 2022 | |||||
WCHN(AM) | Norwich, NY | 970 | June 1, 2022 | ||||||
WDHI(FM) | Delhi, NY | 100.3 | June 1, 2022 | ||||||
W232AS(FX)(3) | Oneonta, NY | 94.3 | June 1, 2022 | ||||||
WDLA(AM) | Walton, NY | 1270 | June 1, 2022 | ||||||
WDLA-FM | Walton, NY | 92.1 | June 1, 2022 | ||||||
WDOS(AM) | Oneonta, NY | 730 | June 1, 2022 | ||||||
WIYN(FM) | Deposit, NY | 94.7 | June 1, 2022 | ||||||
WKXZ(FM) | Norwich, NY | 93.9 | June 1, 2022 | ||||||
W232AT(FX)(3) | Norwich, NY | 94.3 | June 1, 2022 | ||||||
W257BE(FX)(3) | Hamilton, NY | 99.3 | June 1, 2022 | ||||||
WSRK(FM) | Oneonta, NY | 103.9 | June 1, 2022 | ||||||
WTBD-FM | Delhi, NY | 97.5 | June 1, 2022 | ||||||
WZOZ(FM) | Oneonta, NY | 103.1 | June 1, 2022 | ||||||
Owensboro, KY (NR) | WBKR(FM) | Owensboro, KY | 92.5 | August 1, 2020 | |||||
WOMI(AM) | Owensboro, KY | 1490 | August 1, 2020 | ||||||
W256CF(FX)(3) | Owensboro, KY | 99.1 | August 1, 2020 | ||||||
Portland, ME (#92) | WBLM(FM) | Portland, ME | 102.9 | April 1, 2022 | |||||
WCYY(FM) | Biddeford, ME | 94.3 | April 1, 2022 | ||||||
WHOM(FM) | Mount Washington, NH | 94.9 | April 1, 2022 | ||||||
WJBQ(FM) | Portland, ME | 97.9 | April 1, 2022 | ||||||
Portsmouth-Dover-Rochester, NH | WSHK(FM) | Kittery, ME | 105.3 | April 1, 2022 | |||||
(#123) | WOKQ(FM) | Dover, NH | 97.5 | April 1, 2022 | |||||
WSAK(FM) | Hampton, NH | 102.1 | April 1, 2022 | ||||||
WPKQ(FM) | North Conway, NH | 103.7 | April 1, 2022 | ||||||
W250AB(FX)(3) | Manchester, NH | 97.9 | April 1, 2022 | ||||||
Poughkeepsie, NY (#164) | WRRB(FM) | Arlington, NY | 96.9 | June 1, 2022 | |||||
WCZX(FM) | Hyde Park, NY | 97.7 | June 1, 2022 | ||||||
WPDA(FM) | Jeffersonville, NY | 106.1 | June 1, 2022 | ||||||
WKNY(AM) | Kingston, NY | 1490 | June 1, 2022 | ||||||
WKXP(FM) | Kingston, NY | 94.3 | June 1, 2022 | ||||||
WRRV(FM) | Middletown, NY | 92.7 | June 1, 2022 | ||||||
WEOK(AM) | Poughkeepsie, NY | 1390 | June 1, 2022 | ||||||
17
WPDH(FM) | Poughkeepsie, NY | 101.5 | June 1, 2022 | ||||||
WZAD(FM) | Wurtsboro, NY | 97.3 | June 1, 2022 | ||||||
W239AC(FX)(3) | Middletown, NY | 95.7 | June 1, 2022 | ||||||
Presque Isle, ME (NR) | WBPW(FM) | Presque Isle, ME | 96.9 | April 1, 2022 | |||||
WOZI(FM) | Presque Isle, ME | 101.9 | April 1, 2022 | ||||||
WQHR(FM) | Presque Isle, ME | 96.1 | April 1, 2022 | ||||||
Quad Cities, IA-IL (#155) | KJOC(FM) | Bettendorf, IA | 93.5 | February 1, 2021 | |||||
KBOB(AM) | Davenport, IA | 1170 | February 1, 2021 | ||||||
KQCS(FM) | De Witt, IA | 104.9 | February 1, 2021 | ||||||
WXLP(FM) | Moline, IL | 96.9 | December 1, 2020 | ||||||
KBEA (FM) | Muscatine, IA | 99.7 | February 1, 2021 | ||||||
Quincy, IL-Hannibal, MO (NR) | KHMO(AM) | Hannibal, MO | 1070 | February 1, 2021 | |||||
KICK-FM | Palmyra, MO | 97.9 | February 1, 2021 | ||||||
KRRY(FM) | Canton, MO | 100.9 | February 1, 2021 | ||||||
WLIQ(AM) | Quincy, IL | 1530 | December 1, 2020 | ||||||
Richland-Kennewick-Pasco, WA (#181) | KEYW(FM) | Pasco, WA | 98.3 | February 1, 2022 | |||||
KFLD(AM) | Pasco, WA | 870 | February 1, 2022 | ||||||
KOLW(FM) | Basin City, WA | 97.5 | February 1, 2022 | ||||||
KORD-FM | Richland, WA | 102.7 | February 1, 2022 | ||||||
KXRX(FM) | Walla Walla, WA | 97.1 | February 1, 2022 | ||||||
Rochester, MN (#221) | KFIL-FM | Chatfield, MN | 103.1 | April 1, 2021 | |||||
KFIL(AM) | Preston, MN | 1060 | April 1, 2021 | ||||||
KDCZ(FM) | Eyota, MN | 103.9 | April 1, 2021 | ||||||
KOLM(AM) | Rochester, MN | 1520 | April 1, 2021 | ||||||
KROC(AM) | Rochester, MN | 1340 | April 1, 2021 | ||||||
KROC-FM | Rochester, MN | 106.9 | April 1, 2021 | ||||||
KWWK(FM) | Rochester, MN | 96.5 | April 1, 2021 | ||||||
KDZZ(FM) | St. Charles, MN | 107.7 | April 1, 2021 | ||||||
KVGO(FM) | Spring Valley, MN | 104.3 | April 1, 2021 | ||||||
KYBA(FM) | Stewartville, MN | 105.3 | April 1, 2021 | ||||||
K285EL(FX)(3) | Rochester, MN | 104.9 | April 1, 2021 | ||||||
K292EM(FX)(3) | Rochester, MN | 106.3 | April 1, 2021 | ||||||
Rockford, IL (#159) | WXXQ(FM) | Freeport, IL | 98.5 | December 1, 2020 | |||||
WKGL-FM | Loves Park, IL | 96.7 | December 1, 2020 | ||||||
WROK(AM) | Rockford, IL | 1440 | December 1, 2020 | ||||||
WZOK(FM) | Rockford, IL | 97.5 | December 1, 2020 | ||||||
San Angelo, TX (#262) | KELI(FM) | San Angelo, TX | 98.7 | August 1, 2021 | |||||
KGKL(AM) | San Angelo, TX | 960 | August 1, 2021 | ||||||
KGKL-FM | San Angelo, TX | 97.5 | August 1, 2021 | ||||||
KKCN(FM) | Ballinger, TX | 103.1 | August 1, 2021 | ||||||
KKCN-FM1(3) | San Angelo, TX | 103.1 | August 1, 2021 | ||||||
KNRX(FM) | Sterling City, TX | 96.5 | August 1, 2021 | ||||||
KNRX-FM1(3) | San Angelo, TX | 96.5 | August 1, 2021 | ||||||
Sedalia, MO (NR) | KSDL(FM) | Sedalia, MO | 92.3 | February 1, 2021 | |||||
KSIS(AM) | Sedalia, MO | 1050 | February 1, 2021 | ||||||
KXKX(FM) | Knob Noster, MO | 105.7 | February 1, 2021 | ||||||
Shelby, MT (NR) | KSEN(AM) | Shelby, MT | 1150 | April 1, 2021 | |||||
KZIN-FM | Shelby, MT | 96.7 | April 1, 2021 | ||||||
18
Shreveport, LA (#136) | KEEL(AM) | Shreveport, LA | 710 | June 1, 2020 | |||||
KXKS-FM | Shreveport, LA | 93.7 | June 1, 2020 | ||||||
KRUF(FM) | Shreveport, LA | 94.5 | June 1, 2020 | ||||||
KVKI-FM | Shreveport, LA | 96.5 | June 1, 2020 | ||||||
KWKH(AM) | Shreveport, LA | 1130 | June 1, 2020 | ||||||
KTUX(FM) | Carthage, TX | 98.9 | August 1, 2021 | ||||||
Sioux Falls, SD (NR) | KXRB(AM) | Sioux Falls, SD | 1000 | April 1, 2021 | |||||
KKLS-FM | Sioux Falls, SD | 104.7 | April 1, 2021 | ||||||
KIKN-FM | Salem, SD | 100.5 | April 1, 2021 | ||||||
KSOO(AM) | Sioux Falls, SD | 1140 | April 1, 2021 | ||||||
KMXC(FM) | Sioux Falls, SD | 97.3 | April 1, 2021 | ||||||
KYBB(FM) | Canton, SD | 102.7 | April 1, 2021 | ||||||
KDEZ(FM) | Brandon, SD | 100.1 | April 1, 2021 | ||||||
KSOO-FM | Lennox, SD | 99.1 | April 1, 2021 | ||||||
St. Cloud, MN (NR) | KLZZ(FM) | Waite Park, MN | 103.7 | April 1, 2021 | |||||
KMXK(FM) | Cold Spring, MN | 94.9 | April 1, 2021 | ||||||
KXSS(AM) | Waite Park, MN | 1390 | April 1, 2021 | ||||||
KZRV(FM) | Sartell, MN | 96.7 | April 1, 2021 | ||||||
WJON(AM) | St. Cloud, MN | 1240 | April 1, 2021 | ||||||
WWJO(FM) | St. Cloud, MN | 98.1 | April 1, 2021 | ||||||
Texarkana, TX-AR (#253) | KKYR-FM | Texarkana, TX | 102.5 | August 1, 2021 | |||||
KOSY(AM) | Texarkana, AR | 790 | June 1, 2020 | ||||||
KPWW(FM) | Hooks, TX | 95.9 | August 1, 2021 | ||||||
KYGL(FM) | Texarkana, AR | 106.3 | June 1, 2020 | ||||||
KMJI(FM) | Ashdown, AR | 93.3 | June 1, 2020 | ||||||
Trenton, NJ (#149) | WKXW(FM) | Trenton, NJ | 101.5 | June 1, 2022 | |||||
Tuscaloosa, AL (#213) | WBEI(FM) | Reform, AL | 101.7 | April 1, 2020 | |||||
WDGM(FM) | Greensboro, AL | 99.1 | April 1, 2020 | ||||||
WFFN(FM) | Coaling, AL | 95.3 | April 1, 2020 | ||||||
WTSK(AM) | Tuscaloosa, AL | 790 | April 1, 2020 | ||||||
WTUG-FM | Northport, AL | 92.9 | April 1, 2020 | ||||||
Twin Falls-Sun Valley, ID (#248) | KEZJ-FM | Twin Falls, ID | 95.7 | October 1, 2021 | |||||
KLIX(AM) | Twin Falls, ID | 1310 | October 1, 2021 | ||||||
KLIX-FM | Twin Falls, ID | 96.5 | October 1, 2021 | ||||||
KSNQ(FM) | Twin Falls, ID | 98.3 | October 1, 2021 | ||||||
Tyler-Longview, TX (#142) | KISX(FM) | Whitehouse, TX | 107.3 | August 1, 2021 | |||||
KNUE(FM) | Tyler, TX | 101.5 | August 1, 2021 | ||||||
KTYL-FM | Tyler, TX | 93.1 | August 1, 2021 | ||||||
KKTX-FM | Kilgore, TX | 96.1 | August 1, 2021 | ||||||
Utica/Rome, NY (#168) | WFRG-FM | Utica, NY | 104.3 | June 1, 2022 | |||||
WIBX(AM) | Utica, NY | 950 | June 1, 2022 | ||||||
WLZW(FM) | Utica, NY | 98.7 | June 1, 2022 | ||||||
WODZ-FM | Rome, NY | 96.1 | June 1, 2022 | ||||||
Victoria, TX (NR) | KIXS(FM) | Victoria, TX | 107.9 | August 1, 2021 | |||||
KLUB(FM) | Bloomington, TX | 106.9 | August 1, 2021 | ||||||
KQVT(FM) | Victoria, TX | 92.3 | August 1, 2021 | ||||||
KTXN-FM(2)(3) | Victoria, TX | 98.7 | August 1, 2021 | ||||||
Waterloo-Cedar Falls, IA (#238) | KOEL(AM) | Oelwein, IA | 950 | February 1, 2021 | |||||
Wichita Falls, TX (#249) | KBZS(FM) | Wichita Falls, TX | 106.3 | August 1, 2021 | |||||
19
KNIN-FM | Wichita Falls, TX | 92.9 | August 1, 2021 | ||||||
KWFS(AM) | Wichita Falls, TX | 1290 | August 1, 2021 | ||||||
KWFS-FM | Wichita Falls, TX | 102.3 | August 1, 2021 | ||||||
Yakima, WA (#197) | KDBL(FM) | Toppenish, WA | 92.9 | February 1, 2022 | |||||
KATS(FM) | Yakima, WA | 94.5 | February 1, 2022 | ||||||
KFFM(FM) | Yakima, WA | 107.3 | February 1, 2022 | ||||||
KIT(AM) | Yakima, WA | 1280 | February 1, 2022 | ||||||
KUTI(AM) | Yakima, WA | 1460 | February 1, 2022 | ||||||
KMGW(FM) | Naches, WA | 99.3 | February 1, 2022 | ||||||
K232CV(FX)(3) | Ellensburg, WA | 94.3 | February 1, 2022 | ||||||
(1) Townsquare Media Cedar Rapids, LLC programs KRQN(FM) pursuant to a TBA.
(2) Townsquare Media Victoria, LLC programs KTXN-FM pursuant to an LMA.
(3) Our station count of 309 excludes the booster, LMA and TBA stations, as well as FM translators listed above.
Regulatory Approvals
The Communications Laws prohibit the assignment or transfer of control of a broadcast license without the prior approval of the FCC. In determining whether to grant an application for assignment or transfer of control of a broadcast license, the Communications Act requires the FCC to find that the assignment or transfer would serve the public interest. The FCC considers a number of factors in making this determination, including (i) compliance with various rules limiting common ownership of media properties, (ii) the financial and "character" qualifications of the assignee or transferee (including those parties holding an "attributable" interest in the assignee or transferee), (iii) compliance with the Communications Act’s foreign ownership restrictions, and (iv) compliance with other Communications Laws, including those related to content and filing requirements.
As discussed in greater detail below, the FCC may also review the effect of proposed assignments and transfers of broadcast licenses on economic competition and diversity. See "Antitrust and Market Concentration Considerations."
Ownership Matters
The Communications Act restricts us from having more than one-fourth of our equity owned or voted by non-U.S. persons, foreign governments or non-U.S. entities.
The Communications Laws also generally restrict (i) the number of radio stations one person or entity may own, operate or control in a local market and (ii) the common ownership, operation or control of radio stations and television broadcast stations serving the same local market and the common ownership, operation or control of a radio station and a daily newspaper serving the same local market.
None of these multiple and cross ownership rules requires any change in our current ownership of radio stations. The Communications Laws could limit the number of additional radio stations that we may acquire in the future in our existing markets as well as new markets.
The FCC generally applies its television/radio/newspaper cross-ownership rules and its broadcast multiple ownership rules by considering the "attributable" or cognizable interests held by a person or entity. With some exceptions, a person or entity will be deemed to hold an attributable interest in a radio station, television station or daily newspaper if the person or entity serves as an officer, director, partner, stockholder, member, or, in certain cases, a debt holder of a company that owns that broadcast station or newspaper. Whether that interest is attributable and thus subject to the FCC’s multiple ownership rules is determined by the FCC’s attribution rules. If an interest is attributable, the FCC treats the person or entity who holds that interest as an "owner" of the radio station, television station or daily newspaper in question, and that interest thus counts against the person in determining compliance with the FCC’s ownership rules.
20
With respect to a partnership (or limited liability company), only the interest of a general partner (or managing member) is attributable if the entity’s organizational documents include certain terms. With respect to a corporation, officers, directors and persons or entities that directly or indirectly hold 5.0% or more of the corporation’s voting stock (20.0% or more of such stock in the case of insurance companies, investment companies, bank trust departments and certain other "passive investors" that hold such stock for investment purposes only) generally are attributed with ownership of the radio stations, television stations and daily newspapers owned by the corporation. As discussed below, participation in an LMA or a JSA also may result in an attributable interest. See "Local Marketing Agreements" and "Joint Sales Agreements."
The following interests generally are not attributable:
1. | debt instruments, non-voting stock, and options and warrants for voting stock, partnership interests, or membership interests that have not yet been exercised; |
2. | limited partnership or limited liability company membership interests where (a) the limited partner or member is not "materially involved" in the media-related activities of the partnership or limited liability company, and (b) the limited partnership agreement or limited liability company agreement expressly "insulates" the limited partner or member from such material involvement by inclusion of provisions specified in FCC rules; and |
3. | holders of less than 5.0% of an entity’s voting stock. Non-voting equity and debt interests which, in the aggregate, constitute more than 33.0% of a radio station’s "enterprise value" (which consists of the total equity and debt capitalization) are considered attributable in certain circumstances. |
In March 2014, as part of its periodic review of broadcast ownership rules required by the Communications Act, the FCC issued a Further Notice of Proposed Rulemaking seeking comment on its multiple ownership rules and certain proposed changes to them. The proposals include permitting local radio/newspaper cross-ownership. The FCC also asked for comment on whether to eliminate its radio/television cross-ownership rule. We cannot predict the outcome of this or other proceedings or whether any new rules adopted by the FCC will have a material adverse effect on us.
Content and Operation
The Communications Act requires broadcasters to serve the "public interest." To satisfy that obligation, broadcasters are required by the Communications Laws to present content that is responsive to community problems, needs and interests and to maintain certain records demonstrating such responsiveness. Complaints from audiences concerning a radio station’s content may be filed at any time and will be considered by the FCC both at the time they are filed and in connection with a licensee’s renewal application. FCC rules also require broadcasters to provide equal employment opportunities ("EEO") in the hiring of new personnel, to abide by certain procedures in advertising employment opportunities, to make information available on employment opportunities on their websites (if they have one), and maintain certain records concerning their compliance with EEO rules. The FCC will entertain individual complaints concerning a broadcast licensee’s failure to abide by the EEO rules and also conducts random audits on broadcast licensees’ compliance with EEO rules. We have been the subject of several EEO audits. To date, none of those audits has disclosed any major violation that would have a material adverse effect on our operations. Radio stations also must follow provisions in the Communications Laws that regulate a variety of other activities, including political advertising, the broadcast of obscene or indecent content, sponsorship identification, the broadcast of contests and lotteries, and technical operations (including limits on radiofrequency radiation).
On May 31, 2007, the FCC proposed the adoption of certain rules and other measures to enhance the ability of radio stations to provide content responsive to the needs and interests of their respective communities. The measures proposed include the establishment of guidelines in FCC rules to evaluate the nature and quantity of non-entertainment content provided by the broadcaster, and the requirement that radio stations make their local public inspection files available over the internet. On January 28, 2016, the FCC adopted certain rules requiring radio stations to make their local public files available over the internet on a system hosted by the FCC. The requirements will be phased in over time, starting with stations in the top 50 Nielsen markets with five or more full-time employees. The rules will apply to other stations two years later, on March 1, 2018. Also on January 28, 2016, the FCC proposed adoption of certain
21
rules to strengthen the Emergency Alert System ("EAS"). The proposals are intended to facilitate involvement on the state and local levels, support greater testing and awareness of the system, leverage technological advances, and enhance EAS security. We cannot predict at this time to what extent, if any, the FCC’s proposals will be adopted or the impact which adoption of any one or more of those proposals will have on our Company.
Local Marketing Agreements
A number of radio stations, including certain of our radio stations, have entered into LMAs (also known as Time Brokerage Agreements ("TBA")). In a typical LMA, the licensee of a radio station makes available, for a fee, airtime on its radio station to a party which supplies content to be broadcast during that airtime and collects revenue from advertising aired during such content. LMAs are subject to compliance with the antitrust laws and the Communications Laws, including the requirement that the licensee must maintain independent control over the radio station and, in particular, its personnel, content and finances. The FCC has held that such agreements do not violate the Communications Laws as long as the licensee of the radio station receiving content from another station maintains ultimate responsibility for, and control over radio station operations and otherwise ensures compliance with the Communications Laws.
A radio station that brokers more than 15.0% of the weekly content hours on another radio station in its market will be considered to have an attributable ownership interest in the brokered radio station for purposes of the FCC’s ownership rules. As a result, a radio station may not enter into an LMA that allows it to program more than 15.0% of the weekly content hours of another radio station that it could not own under the FCC’s multiple ownership rules.
Joint Sales Agreements
From time to time, radio stations enter into JSAs. A typical JSA authorizes one radio station to sell another radio station’s advertising time and retain the revenue from the sale of that airtime. A JSA typically includes a periodic payment to the radio station whose airtime is being sold (which may include a share of the revenue being collected from the sale of airtime). Like LMAs, JSAs are subject to compliance with antitrust laws and the Communications Laws, including the requirement that the licensee must maintain independent control over the radio station and, in particular, its personnel, content and finances. The FCC has held that such agreements do not violate the Communications Laws as long as the licensee of the radio station whose time is being sold by another station maintains ultimate responsibility for, and control over, radio station operations and otherwise ensures compliance with the Communications Laws.
Under the Communication Laws, a radio station owner that sells more than 15.0% of the weekly advertising time of another radio station in the same market will be attributed with the ownership of that other station. In that situation, a station cannot have a JSA with another station in the same market if the FCC’s ownership rules would otherwise prohibit that common ownership.
Antitrust and Market Concentration Considerations
Potential future acquisitions, to the extent they meet specified size thresholds, will be subject to applicable waiting periods and possible review under the Hart-Scott-Rodino Antitrust Improvements Act of 1976, as amended (the "HSR Act"), by the DOJ or the FTC, either of whom can be required to evaluate a transaction to determine whether that transaction should be challenged under the federal antitrust laws. Transactions are subject to the HSR Act only if the acquisition price or fair market value of the radio stations to be acquired is above a certain threshold that increases periodically (presently $78.2 million as of February 25, 2016). Our acquisitions have not met this threshold. Acquisitions that are not required to be reported under the HSR Act may still be investigated by the DOJ or the FTC under the antitrust laws before or after consummation. At any time before or after the consummation of a proposed acquisition, the DOJ or the FTC could take such action under the antitrust laws as it deems necessary, including seeking to enjoin the acquisition or seeking divestiture of the business acquired or certain of our other assets. The DOJ has reviewed numerous radio station acquisitions where an operator proposes to acquire additional radio stations in its existing markets or multiple radio stations in new markets and has challenged a number of such transactions. Some of these challenges have resulted in consent decrees requiring the sale of certain radio stations, the termination of LMAs or other relief. In general, the Department of Justice has more closely scrutinized radio mergers and acquisitions resulting
22
in local market shares in excess of 35.0% of local radio advertising revenue, depending on format, signal strength and other factors. There is no precise numerical rule, however, and certain transactions resulting in more than 35.0% revenue shares have not been challenged, while certain other transactions may be challenged based on other criteria such as audience shares in one or more demographic groups as well as the percentage of revenue share. We estimate that we have more than a 35.0% share of radio advertising revenue in many of our markets.
The DOJ enforces the antitrust laws in the broadcasting industry and there can be no assurance that one or more of our pending or future acquisitions will not be the subject of an investigation or enforcement action by the DOJ. Similarly, there can be no assurance that the DOJ, the FTC or the FCC will not prohibit such acquisitions, require that they be restructured, or require that we divest radio stations we already own. In addition, private parties may under certain circumstances bring legal action to challenge an acquisition.
As part of its review of certain radio station acquisitions, the DOJ has stated publicly that it believes that commencement of operations under LMAs, JSAs and other similar agreements customarily entered into in connection with radio station ownership assignments and transfers prior to the expiration of the waiting period under the HSR Act could violate the HSR Act. In connection with acquisitions subject to the waiting period under the HSR Act, we will not commence operation under an LMA, a JSA, or similar agreement of any affected radio station to be acquired until the waiting period has expired or been terminated.
Formation and Form of Organization
Townsquare Media, Inc. was formed as a Delaware limited liability company, Townsquare Media, LLC, on February 26, 2010. In connection with our initial public offering, we converted to a Delaware corporation on July 25, 2014.
23
ITEM 1A. RISK FACTORS
Many statements contained in this annual report are forward-looking in nature. These statements are based on our current plans, intentions or expectations and actual results could differ materially as we cannot guarantee that we will achieve these plans, intentions or expectations. See "Forward Looking-Statements." Forward-looking statements are subject to numerous risks and uncertainties, including those specifically identified below.
Risks Related to Our Business
Decreased spending by advertisers, decline in attendance of our live events and changes in the economy may have a material adverse effect on our business.
Because a substantial majority of our net revenue is generated from the sale of local, regional and national advertising on our radio stations, digital properties and at our live events, a downturn in the U.S. economy may have a material adverse impact on our business, financial condition and results of operations, as advertisers generally reduce their spending during economic downturns. Furthermore, because a substantial portion of our revenue is derived from local advertisers, our ability to generate advertising revenue in specific markets could be adversely affected by local or regional economic downturns. A downturn in the U.S. economy could also adversely affect our ability to collect accounts receivable from advertisers.
In addition, a significant percentage of our advertising revenue is generated from the sale of advertising to the automotive, financial services and retail industries. These industries, among others, have been adversely affected by prior downturns in the economy, and may be adversely affected by any future downturns in the economy, and a significant decrease in revenue in the future could have a material adverse effect on our business, financial condition and results of operations.
A decline in attendance at or reduction in the number of music concerts, multi-day music festivals, fairs, consumer expositions and trade shows, lifestyle events and other forms of entertainment may have an adverse effect on revenue and operating income from our live events business. In addition, during periods of economic slowdown and recession, many consumers have historically reduced their discretionary spending and advertisers have reduced their advertising expenditures. Consumer discretionary spending is sensitive to many factors such as employment, fuel and energy prices, and general economic conditions. The impact of economic slowdowns on our business is difficult to predict, but they may result in reductions in ticket sales, sponsorships and our ability to generate revenue. The risks associated with our live events business may become more acute in periods of a slowing economy or recession, which may be accompanied by a decrease in attendance at our live events. Many of the factors affecting the number and availability of live events are beyond our control. There can be no assurance that consumer spending will not be adversely impacted by economic conditions, or by any future deterioration in economic conditions, thereby possibly impacting the operating results and growth of our live events business.
We may lose audience ratings, market share and advertising revenue to competing radio stations or other types of media competitors.
We operate in a highly competitive industry. Our Local Advertising business competes for audiences and advertising market share with other radio stations and radio station groups, radio networks, other syndicated content and other media such as broadcast television, newspapers, magazines, cable television, satellite television, satellite radio, internet radio, the internet, outdoor advertising and hand-held programmable devices such as iPods and cellular phones. Any adverse change in a particular market or in the relative market positions of the radio stations located in a particular market, or any adverse change in audiences’ preferences could have a material adverse effect on our ratings or revenue. Other radio broadcasting companies may enter the markets in which we operate or may operate in the future or offer syndicated content that competes with our content and these companies may be larger and have more financial resources than we do. In addition, from time to time, other radio stations may change their format or content, or a radio station may adopt a format to compete directly with us for audiences and advertisers. These tactics could result in lower ratings, lower market share and lower advertising revenue or increased promotion and other expenses and, consequently, lower earnings and cash flow for us.
24
We face substantial competition for advertising revenue in our various markets from free and paid newspapers, magazines, websites, digital platforms and applications, television, radio, other forms of media, direct marketing and online advertising networks and exchanges. Competition for advertising is generally based on audience levels and demographics, price, service and advertising results. It has intensified both as a result of the continued development and fragmentation of digital media and adverse economic conditions. Competition from all of these media and services affects our ability to attract and retain advertisers and consumers and to maintain or increase our advertising rates.
Audience preferences as to format or content may also shift due to demographic changes, personnel or other content changes, a decline in broadcast listening trends or other reasons. We may not be able to adapt to these changes or trends, any of which would have a material adverse impact on our business, financial condition and results of operations.
We face intense competition in the live events industry, and we may not be able to maintain or increase our current revenue, which could adversely affect our business, financial condition and results of operations.
The live events industry is highly competitive, and we may not be able to maintain or increase our current revenue due to such competition. The live events industry competes with other forms of music and non-music entertainment for consumers’ discretionary spending and within this industry we compete with other venues to win contracts and book talent, and, in the markets in which we promote music concerts and festivals, we face competition from other promoters and venue operators. Our competitors compete with us for key employees who have existing talent relationships and that have a history of being able to book talent for concerts and tours. Our competitors may engage in more extensive development efforts, undertake more far-reaching marketing campaigns, adopt more aggressive pricing policies and clients, talent and venues. Our competitors may develop services, advertising options or venues that are equal or superior to those we provide or that achieve greater market acceptance and brand recognition than we achieve. In addition, although many live events formats are annual in nature, there is risk that they will reach the end of their product cycle lives as consumer tastes evolve and we are unable to develop new events that cater to new consumer preferences. It is possible that new competitors may emerge and rapidly acquire significant market share.
Poor weather and personal injuries and accidents adversely affect expenses and attendance at our live events, which could negatively impact our financial performance from period to period.
We produce, promote and/or ticket many live events. Weather conditions surrounding these events affect sales of tickets, concessions and merchandise, among other things. Poor weather conditions can have a material effect on our results of operations particularly because we produce, promote and/or ticket a finite number of events. Due to weather conditions, we may be required to reschedule an event to another available day or a different venue, which would increase our costs for the event and could negatively impact the attendance at the event, as well as food, beverage, ride and merchandise sales. Poor weather can affect current periods as well as successive events in future periods, any of which would adversely affect our business, financial condition and results of operations.
There are inherent risks involved with producing live events. As a result, personal injuries and accidents have, and may, occur from time to time, which could subject us to claims and liabilities for personal injuries. Incidents in connection with our live events at any of our venues, or festival sites that we own or rent, or involving any of our owned or rented equipment could also result in claims, reducing operating income or reducing attendance at our events, which could cause a decrease in our revenue. While we maintain insurance policies that provide coverage within limits that are sufficient, in management’s judgment, to protect us from material financial loss for personal injuries sustained by persons at our venues or events or accidents in the ordinary course of business, there can be no assurance that such insurance will be adequate at all times and in all circumstances.
Our business, financial condition and results of operations may be adversely affected if our broadcast rights contracts are not renewed on sufficiently favorable terms.
We sometimes enter into broadcast rights contracts in the ordinary course of business for both the acquisition and distribution of media content and products, including contracts for both the acquisition and distribution of content
25
rights for sporting events and other programs, and contracts relating to content produced by third parties on our radio stations. As these contracts expire, the parties must renew or renegotiate the contracts, and if we are unable to renew them on acceptable terms, we may lose these rights, the related content and the related revenue. Even if these contracts are renewed, the cost of obtaining content rights may increase (or increase at faster rates than in the past) or the revenue from distribution of content may be reduced (or increase at slower rates than in the past). With respect to the acquisition of content rights, the impact of these broadcast rights contracts on our results over the terms of the contracts will depend on a number of factors beyond our control, including the strength of advertising markets, effectiveness of marketing efforts, the size of audiences, and the related contract expenses and costs. There can be no assurance that revenue from content based on these rights will exceed the cost of the rights plus the other costs of producing and distributing the content.
If we lose key members of our senior management team, our business could be disrupted and our financial performance could suffer. Our business depends upon the continued efforts, abilities and expertise of our senior management team.
We believe that the skills and experience of our senior management team would be difficult to replace, and the loss of one or more members of our senior management team could have a material adverse effect on our business, financial condition and results of operations, including impairing our ability to execute our business strategy. We believe that our future success will depend greatly on our continued ability to attract and retain highly skilled and qualified personnel.
We may lose key on-air talent to competing radio stations or other types of media competitors.
We compete for creative and performing on-air talent with other radio stations and radio station groups, radio networks, and other providers of syndicated content and other media such as broadcast television, cable television, satellite television, the internet and satellite radio. Our employees and other on-air talent are subject to change and may be lost to competitors or for other reasons. Any adverse changes in particular programs, formats or on-air talent could have a material adverse effect on our ratings and our ability to attract advertisers, which would negatively impact our business, financial condition or results of operations.
Our results are dependent on radio advertising revenue, which can vary from even to odd-numbered years based on the volatility and unpredictability of political revenue.
Approximately 0.5%, 1.7% and 0.6% of our net revenue, pro forma for the Transactions, for the years ended December 31, 2015, 2014 and 2013, respectively, consisted of political advertising revenue. Political advertising revenue from elections, which is generally greater in even-numbered years, has the potential to create fluctuations in our operating results on a year-to-year basis. For example, during 2015, we had political advertising revenue of $2.9 million, compared to $8.1 million in 2014 and $2.2 million in 2013, pro forma for the Transactions. In addition, political advertising revenue is dependent on the level of political ad spend and competitiveness of elections within each local market.
If fuel prices increase significantly, our results of operations could be adversely affected.
We are subject to risk with respect to purchases of fuel. Prices and availability of petroleum products are subject to political, economic and market factors that are generally outside our control. Political events, weather-related events and natural disasters, and current and future legislation (such as market-based (cap-and-trade) greenhouse gas emissions control mechanisms) may also cause the price of fuel to increase. Because certain of our operations, primarily our live events, are dependent upon diesel fuel, significant increases in diesel fuel costs could materially and adversely affect our results of operations and financial condition if we are unable to pass increased costs on to customers through price increases.
26
We are exposed to foreign currency risks from our Canadian operations that could adversely affect our financial results.
A significant portion of the revenue and operating costs of our NAME operations are denominated in Canadian dollars. We are therefore exposed to fluctuations in the exchange rate between the US dollar and the Canadian dollar. We do not currently hedge, and have not historically hedged, our operational exposure to this foreign currency fluctuation. Our consolidated financial results are presented in US dollars and therefore, during times of a strengthening US dollar versus the Canadian dollar, our reported revenue and earnings that are generated in Canada will be reduced because the Canadian dollar will translate into fewer US dollars. In addition, the assets and liabilities of our Canadian operations are translated into US dollars at the exchange rates in effect at the balance sheet date. Revenue and expenses are translated into US dollars at the average exchange rate for the period. Translation adjustments arising from the use of differing exchange rates from period to period are recorded in stockholders’ equity as an accumulated currency translation adjustment. Translation adjustments arising from intercompany receivables with our Canadian operations are generally recorded as a component of other comprehensive loss, before tax. Accordingly, changes in currency exchange rates will cause our revenue, operating costs, comprehensive income and shareholders’ equity to fluctuate, and such fluctuations may have an adverse effect on our financial condition and results of operations.
The rates we charge for in-stream and mobile advertisements are currently less than those we charge for terrestrial radio advertisements.
The rates we charge for in-stream and mobile advertisements are currently less than those we charge for terrestrial radio advertisements. Listeners are increasingly shifting toward online radio streams and mobile applications. If we are unable to sufficiently increase the rates we charge for in-stream and mobile advertisements, a significant shift in listeners could have a material adverse impact on our business, financial condition and results of operations.
To remain competitive, we must respond to changes in technology, services and standards that characterize our industry.
The radio broadcasting industry is subject to technological change, evolving industry standards and the emergence of new media technologies and trends. We may not have the resources to acquire new technologies or to introduce new services that could compete with these new technologies and may allow us to adapt to new trends.
Various new media technologies and services have been or are being developed or introduced, including:
• | satellite-delivered digital audio radio service, which has resulted in the introduction of new subscriber-based satellite radio services with numerous niche formats; |
• | audio content by cable systems, direct-broadcast satellite systems, personal communications systems, content available over the internet and other digital audio broadcast formats; |
• | in-band on-channel digital radio, which provides multi-channel, multi-format digital radio services in the same bandwidth currently occupied by traditional AM and FM radio services; |
• | the FCC has authorized many new Low-Power FM radio stations, and is likely to authorize many more, which will result in additional FM radio broadcast outlets, although such radio stations are required to operate on a non-commercial basis; |
• | iPhone/iPod/iPad and similar mobile devices; and |
• | streaming internet services such as Pandora and Spotify. |
The radio broadcasting industry historically has grown despite the introduction of new technologies for the delivery of entertainment and information, including the introduction of new technologies used in automobiles, as a result, in part, of a growing population, greater use of the automobile and increased commuter times. We cannot guarantee
27
that this historical growth will continue. Some of the technologies, particularly satellite digital audio radio service and internet radio, compete for the consumer’s attention in the car, workplace, outdoors and elsewhere. In addition, we cannot predict the effect, if any, that competition arising from new technologies or regulatory changes may have on the radio broadcasting industry or on our business, financial condition and results of operations, some of which could result in the imposition of significant costs and expenses not previously part of our business operations.
The failure or destruction of transmitter and other facilities that we depend upon to distribute our content could materially adversely affect our business, financial condition and results of operations.
We use studios, satellite systems, transmitter facilities and the internet to originate and/or distribute our content. We rely on third-party contracts and services to operate our origination and distribution facilities. These third-party contracts and services include, but are not limited to, electrical power, satellite downlinks, telecom circuits and internet connectivity. Distribution may be disrupted due to one or more third parties losing their ability to provide particular services to us, which could adversely affect our distribution capabilities. A disruption can be caused as a result of any number of events such as local disasters (accidental or environmental), various acts of terrorism, power outages, major telecom and internet connectivity failures or satellite failures. Our ability to distribute content to radio station audience and/or network affiliates may be disrupted for an undetermined period of time until alternate facilities are engaged and put on-line. Furthermore, until we fix issues that arise or third-party services resume when applicable, the inability to originate or distribute content could have a material adverse effect on our business, financial condition and results of operations.
If we are unable to retain and grow our digital audience, our business will be adversely affected.
The increasing number of digital media options available on the internet, through social networking tools and through mobile and other devices distributing news and other content is expanding consumer choice significantly. Faced with a multitude of media choices and a dramatic increase in accessible information, consumers may place greater value on when, where, how and at what price they consume digital content than they do on the source or reliability of such content. The increasing popularity of news aggregation websites and customized news feeds (often free to users) may reduce our traffic levels by creating a disincentive for the audience to visit our websites or use our mobile applications. In addition, the undifferentiated presentation of some of our content in aggregation with other content may lead audiences to fail to distinguish our content from the content of other providers. Our reputations for quality journalism and content are important in competing for revenue in this environment and are based on consumer and advertiser perceptions. If consumers fail to differentiate our content from other content providers in digital media, or if the quality of our journalism or content is perceived as less reliable, we may not be able to increase our online traffic sufficiently or retain a base of frequent visitors to our digital properties.
Online traffic is also driven by internet search results, including search results provided by Google, the primary search engine directing traffic to our websites. Search engines frequently update and change the methods for directing search queries to websites or change methodologies or metrics for valuing the quality and performance of internet traffic on delivering cost-per-click advertisements. Any such changes could decrease the amount of revenue that we generate from online advertisements. The failure to successfully manage search engine optimization efforts across our business could result in a significant decrease in traffic to our various websites, which could result in substantial decreases in conversion rates and repeat business, as well as increased costs if we were to replace free traffic with paid traffic, any or all of which would adversely affect our business, financial condition and results of operations.
If traffic levels stagnate or decline, we may not be able to create sufficient advertiser interest in our digital properties or to maintain or increase the advertising rates of the inventory on our digital properties. Even if we maintain traffic levels, the market position of our brands may not be enough to counteract a significant downward pressure on advertising rates as a result of a significant increase in inventory.
28
If we fail to increase the number of subscribers or retain existing subscriber services at Townsquare Interactive, our revenue and business will be harmed.
The ability to grow Townsquare Interactive depends in large part on maintaining and expanding our subscriber base. To do so, we must convince prospective subscribers of the benefits of our technology platform and existing subscribers of the continuing value of our products and services. The digital marketing solutions sector is a highly competitive area with many competitors in which our customers have many competing alternatives. We believe our solutions are well positioned to serve the SMBs in the small and mid-sized markets we focus upon. However, if our subscribers cancel their subscriptions with us, or if we are unable to attract new subscribers in numbers greater than the number of subscribers that we lose, our subscriber base will decrease and our business, financial condition and operating results will be adversely affected.
Our digital advertising network competes in a rapidly growing and evolving market. If our advertising solutions are not compelling or we falter on execution, we may be unable to attract new affiliates or existing clients may turn to alternative solutions.
The national digital advertising market represents a significant growth opportunity. Our success is dependent on many factors outside of our control including the quality of content on our affiliates’ websites, the number of visitors they attract and their level of user engagement. The execution of our own business strategy including the effectiveness of the advertising solutions we provide and the abilities of our national digital sales force will impact our level of success. We also face a variety of competitors who have greater scale, market share and platforms that could hinder our ability to compete effectively. The success of our strategy will depend on our ability to convince new advertisers of the benefits of our advertising platform and existing clients of the continuing value of our solutions. Failure to deliver on those objectives could significantly affect our business operations and our ability to compete effectively.
Our national digital businesses are dependent on technology and technical and sales talent.
Future success and growth in our national digital businesses will depend upon our continued ability to develop and maintain technology and identify, hire, develop, motivate and retain highly skilled technical and sales talent. Competition for employees with these skill sets is intense and our continued ability to compete effectively depends, in part, upon our ability to attract new employees. We will also need to be able to balance the costs of recruiting and retaining these employees with profitable growth. If we are unable to do so, our business, financial condition or results of operations may be adversely affected.
There are risks associated with our acquisition strategy.
We may continue to grow in part by acquiring radio stations, digital properties, live events or other businesses in the future. We cannot predict whether we will be successful in pursuing these acquisitions or what the consequences of these acquisitions will be. Any acquisitions in the future may be subject to various conditions, such as compliance with FCC and antitrust regulatory requirements. The FCC requirements include:
• | approval of license assignments and transfers; |
• | limits on the number of radio stations a broadcaster may own in a given local market; and |
• | other rules and policies, such as the ownership attribution rules, that could limit our ability to acquire radio stations in certain markets where one or more of our stockholders, officers or directors have other media interests. |
The antitrust regulatory requirements include:
• | filings with the DOJ and the FTC under the HSR Act, where applicable; |
• | expiration or termination of any applicable waiting period under the HSR Act; and |
29
• | possible review by the DOJ or the FTC of antitrust issues under the HSR Act or otherwise. |
Completion of any acquisition may also only be approved subject to our compliance with certain conditions.
These conditions may be onerous, and may include the requirement that we divest certain assets, which may include radio stations we already own or we propose to acquire. We cannot be certain whether any of these conditions will be satisfied, the timing thereof, or the potential impact on us any such conditions may have. In addition, the FCC has in the past asserted the authority to review levels of local radio market concentration as part of its acquisition approval process, even where proposed assignments would comply with the numerical limits on local radio station ownership in the FCC’s rules and the Communications Act.
Our acquisition strategy involves numerous other risks, including risks associated with:
• | identifying acquisition candidates and negotiating definitive purchase agreements on satisfactory terms; |
• | integrating operations and systems and managing a large and geographically diverse group of assets; |
• | diverting our management’s attention from other business concerns; |
• | potentially losing key employees at acquired businesses; and |
• | a diminishing number of properties available for sale in appropriately sized and located markets. |
We cannot be certain that we will be able to successfully integrate any acquisitions or manage the resulting business effectively, or that any acquisition will achieve the benefits that we anticipate. In addition, we are not certain that we will be able to acquire properties at valuations as favorable as those of previous acquisitions. Depending upon the nature, size and timing of potential future acquisitions, we may be required to raise additional financing in order to consummate additional acquisitions. Our debt agreements, as may be in place at any time, may not permit us to consummate an acquisition or access the necessary additional financing because of certain covenant restrictions. Furthermore, we cannot be certain that additional financing will be available to us or, if available, that financing would be on terms acceptable to our management.
Due to various market and financial conditions, we may not be able to successfully complete future acquisitions or future dispositions of our radio stations.
We pursue strategic acquisitions when such acquisitions are strategic and financially additive and such acquisitions meet our overall business needs. We engage in strategic sales of our assets from time to time, as it makes financial sense to do so and meets our overall business needs, and have also been required by the FCC to divest radio stations, which radio stations are now held in trust pending sale. However, in light of the current financial and economic market conditions, both in the radio industry and in the overall U.S. economy, our consummation of future acquisitions or dispositions, even those required radio station divestitures, is uncertain and may be very difficult.
Our success is dependent upon audience acceptance of our content, particularly our radio programs and live events, which is difficult to predict.
Media and radio content production and distribution is an inherently risky business because the revenue derived from the production and distribution of media content or a radio program, and the licensing of rights to the intellectual property associated with the content or program, depend primarily upon their acceptance by the public, which is difficult to predict. The commercial success of content or a program also depends upon the quality and acceptance of other competing programs released into the marketplace at or near the same time, the availability of alternative forms of entertainment and leisure time activities, general economic conditions and other tangible and intangible factors, all of which are difficult to predict.
30
Ratings for broadcast radio stations and traffic or visitors on a particular website are also factors that are weighed when advertisers determine which outlets to use and in determining the advertising rates that the outlet receives. Poor ratings or traffic levels can lead to a reduction in pricing and advertising revenue. For example, if there is an event causing a change of programming at one of our radio stations, there could be no assurance that any replacement programming would generate the same level of ratings, revenue or profitability as the previous programming. In addition, changes in ratings methodology and technology could adversely impact our ratings and negatively affect our advertising revenue. Nielsen, the leading supplier of ratings data for U.S. radio markets, developed technology to passively collect data for its ratings service. The Portable People Meter™ ("PPM™") is a small, pager-sized device that does not require any active manipulation by the end user and is capable of automatically measuring radio, television, internet, satellite radio and satellite television signals that are encoded for the service by the broadcaster. While our ratings are primarily measured by the traditional diary method (which involves individual surveys), certain of our market ratings are being measured by PPM™. In each market, there has been a compression in the relative ratings of all radio stations in the market, enhancing the competitive pressure within the market for advertising dollars. In addition, ratings for certain radio stations when measured by PPM™ as opposed to the traditional diary methodology can be materially different. PPM™ based ratings may be scheduled to be introduced in some of our other markets. Because of the competitive factors we face and the introduction of PPM™, we cannot assure investors that we will be able to maintain or increase our current audience ratings and advertising revenue, which could have an adverse impact on our business, financial condition and results of operations.
Our live events business depends in part on our ability to anticipate the tastes of consumers and to offer events that appeal to them. Since we rely on unrelated parties to create and perform at live events, any lack of availability of popular artists could limit our ability to generate revenue. In addition, our live events business typically plans and makes certain commitments to future events up to 18 months in advance of the event, and often agrees to pay an artist or other service providers or venues a fixed guaranteed deposit amount prior to our receiving any revenue as is standard in the live events industry. Therefore, if the public is not receptive to the event, or we or an artist cancel the event, we may incur a loss for the event depending on the amount of the fixed guaranteed or incurred costs relative to any revenue earned, as well as revenue we could have earned at the event. For certain events, we have cancellation insurance policies in place to cover a portion of our losses but it may not be sufficient and is subject to deductibles. Furthermore, consumer preferences change from time to time, and our failure to anticipate, identify or react to these changes could result in reduced demand for our live events, which would adversely affect our business, financial condition and results of operations.
New technologies could block our ads, which would harm our business.
Technologies have been developed that can block the display of our ads and that provide tools to users to opt out of our advertising products. Most of our revenue from our digital businesses are derived from fees paid to us by advertisers in connection with the display of ads on web pages for our users. As a result, such technologies and tools could adversely affect our operating results.
We rely on third parties to provide the technologies necessary to deliver content, advertising and services to our audience, and any change in the licensing terms, costs, availability, or acceptance of these formats and technologies could adversely affect our business.
We rely on third parties to provide the technologies that we use to deliver content, advertising, and services to our audience. There can be no assurance that these providers will continue to license their technologies or intellectual property to us on reasonable terms, or at all. Providers may change the fees they charge users or otherwise change their business model in a manner that slows the widespread acceptance of their technologies. In order for our services to be successful, there must be a large base of users of the technologies necessary to deliver our content, advertising and services. We have limited or no control over the availability or acceptance of those technologies, and any change in the licensing terms, costs, availability, or user acceptance of these technologies could adversely affect our business.
31
Certain components of our online business depends on continued and unimpeded access to the internet by us and our audience. Internet access providers may be able to block, degrade, or charge for access to certain of our products and services, which could lead to additional expenses and the loss of our audience and advertisers.
Certain of our products and services depend on the ability of our audience to access the internet, and certain of our products require significant bandwidth to work effectively. Currently, this access is provided by companies that have significant market power in the broadband and internet access marketplace, including incumbent telephone companies, cable companies, mobile communications companies and government-owned service providers. Some of these providers have taken, or have stated that they may take, measures that could degrade, disrupt, or increase the cost of access to certain of our products by restricting or prohibiting the use of their infrastructure to support or facilitate our offerings, or by charging increased fees to us or our audience to provide our offerings. Such interference could result in a loss of existing audience and advertisers, and increased costs, and could impair our ability to attract new audience and advertisers, thereby harming our revenue and growth.
A security breach or a cyber-attack could adversely affect our business.
A security breach or cyber-attack of our computer systems could interrupt or damage our operations or harm our reputation. If third parties or our employees are able to penetrate our network security or otherwise misappropriate our customers' personal information or contract information, or if we give third parties or our employees improper access to our customers' personal information or contract information, we could be subject to liability. This liability could include identity theft or other similar fraud-related claims. This liability could also include claims for other misuses or losses of personal information, including for unauthorized marketing purposes. Other liabilities could include claims alleging misrepresentation of our privacy and data security practices. We could also be subject to regulatory action in certain jurisdictions.
We rely on encryption and authentication technology licensed from third parties to provide the security and authentication necessary to effect secure online transmission of confidential consumer information. Advances in computer capabilities, new discoveries in the field of cryptography or other events or developments may result in a compromise or breach of the algorithms that we use to protect sensitive customer transaction data. A party who is able to circumvent our security measures could misappropriate proprietary information or cause interruptions in our operations. We may be required to expend capital and other resources to protect against such security breaches or cyber-attacks or to alleviate problems caused by such breaches or attacks and our insurance coverage may not be adequate to cover all the costs related to such breaches or attacks. Our security measures are designed to protect against security breaches and cyber-attacks, but our failure to prevent such security breaches and cyber-attacks could subject us to liability, adversely affect our results of operations and damage our reputation.
We are controlled by a financial sponsor, whose interests may not be aligned with ours or yours.
We are controlled by funds managed by Oaktree, and therefore they have the power to control our affairs and policies, including entering into mergers, sales of substantially all of our assets and other extraordinary transactions as well as decisions to issue shares, declare dividends, and make other decisions, and they may have an interest in our doing so. The interests of Oaktree could conflict with your interests in material respects. Furthermore, Oaktree is in the business of making investments in companies and may from time to time acquire and hold interests in businesses that compete directly or indirectly with us, as well as businesses that represent major customers of our business. Oaktree may also pursue acquisition opportunities that may be complementary to our business, and as a result, those acquisition opportunities may not be available to us. So long as Oaktree continues to own a significant amount of our outstanding capital stock, they will continue to be able to strongly influence or effectively control our decisions.
We may be adversely affected by the occurrence of extraordinary events, such as terrorist attacks or natural disasters.
The occurrence of extraordinary events, such as terrorist attacks, natural disasters, intentional or unintentional mass casualty incidents or similar events may substantially impact our operations in specific geographic areas, as well as nationally, and it may decrease the use of and demand for advertising, which may decrease our revenue or expose
32
us to substantial liability. The September 11, 2001 terrorist attacks, for example, caused a nationwide disruption of commercial activities. The occurrence of future terrorist attacks, military actions by the U.S., contagious disease outbreaks or other unforeseen similar events cannot be predicted, and their occurrence can be expected to further negatively affect the economies where we do business generally, specifically the market for advertising. In addition, an act of God or a natural disaster could adversely impact any one or more of the markets where we do business, thereby impacting our business, financial condition and results of operations.
Capital requirements necessary to operate our business or implement acquisitions could pose risks.
Our business requires a certain level of capital expenditures. If our cash flows and capital resources are insufficient to fund our debt service obligations, we could face liquidity problems and could be forced to reduce or delay investments and capital expenditures, adversely impacting our business, financial condition and results of operations. We face competition from other media companies for acquisition opportunities. If the prices sought by sellers of these companies were to rise, we would find fewer acceptable acquisition opportunities. In addition, the purchase price of a possible acquisition could require additional debt or equity financing on our part. Since the terms and availability of this financing depend to a large degree upon general economic conditions and third parties over which we have no control, we can give no assurance that we will obtain the needed financing or that we will obtain such financing on attractive terms. In addition, our ability to obtain financing depends on a number of other factors, many of which are also beyond our control, such as interest rates and national and local business conditions. If the cost of obtaining needed financing is too high or the terms of such financing are otherwise unacceptable in relation to the acquisition opportunity we are presented with, we may decide to forego that opportunity. Additional indebtedness could increase our leverage and make us more vulnerable to economic downturns and may limit our ability to withstand competitive pressures.
Our substantial indebtedness could have an adverse impact on us.
We have a significant amount of indebtedness. As of December 31, 2015, we had $598.8 million of outstanding indebtedness, with annual debt service requirements of approximately $32.3 million. On an as reported basis, debt service for the year ended December 31, 2015 was $39.0 million, which represented 150% of cash flow from operating activities. Our substantial level of indebtedness increases the risk that we may be unable to generate cash sufficient to pay amounts due in respect of our indebtedness. Our substantial indebtedness could have other significant effects on our business.
For example, it could:
• | increase our vulnerability to adverse changes in general economic, industry and competitive conditions; |
• | require us to dedicate a substantial portion of our cash flow from operations to make payments on our indebtedness, thereby reducing the availability of our cash flow to fund working capital, capital expenditures and other general corporate purposes; |
• | limit our flexibility in planning for, or reacting to, changes in our business and the industry in which we operate; |
• | restrict us from taking advantage of opportunities to grow our business; |
• | make it more difficult to satisfy our financial obligations; |
• | place us at a competitive disadvantage compared to our competitors that have less debt obligations; and |
• | limit our ability to borrow additional funds for working capital, capital expenditures, acquisitions, debt service requirements, execution of our business strategy or other general corporate purposes on satisfactory terms or at all. |
33
We believe that our cash balance, together with the undrawn portion of our revolving credit facility and cash generated by operating activities, will be sufficient to fund our operations, service our debt obligations and pursue our strategy in the future.
In addition, the agreements evidencing or governing our current indebtedness do contain, and the agreements evidencing or governing our future indebtedness may contain, restrictive covenants that will limit our ability to engage in activities that may be in our long-term best interest. Our failure to comply with those covenants could result in an event of default which, if not cured or waived, could result in the acceleration of all of our indebtedness.
Risks Related to Governmental Regulation and Legislation
Future losses could be caused by future asset impairment of our FCC licenses and/or goodwill.
Under Financial Accounting Standards Board Accounting Standards Codification ("FASB ASC") Topic 350, "Intangibles—Goodwill and Other," goodwill and indefinite-lived intangibles, including FCC licenses, are not amortized but instead are tested for impairment at least annually, or more frequently if events or circumstances indicate that there may be an impairment. Impairment is measured as the excess of the carrying value of the goodwill or intangible asset over its fair value. Intangible assets that have finite useful lives continue to be amortized over their useful lives and are also measured for impairment if events or circumstances indicate that they may be impaired. Impairment losses are recorded as operating expenses.
As of December 31, 2015, our FCC licenses and goodwill comprised approximately 74% of our consolidated total assets. The valuation of intangible assets is subjective and based on estimates rather than precise calculations. If actual future results are not consistent with the assumptions and estimates used, we may be exposed to impairment charges in the future. The fair value measurements for both our goodwill and indefinite-lived intangible assets use significant unobservable inputs which reflect our own assumptions about the estimates that market participants would use in measuring fair value including assumptions about risk.
Given the current economic environment and the potential negative impact on our business, there can be no assurance that our estimates and assumptions regarding the period and strength of the current economic recovery, made for the purpose of our non-amortizable intangible fair value estimates, will prove to be accurate.
Interim and/or annual impairment testing, as applicable, could result in future impairment losses. The fair value of FCC licenses and goodwill is primarily dependent on the expected future cash flows of our business. If actual market conditions and operational performance underlying the intangible assets were to deteriorate, or if facts and circumstances change that would more likely than not reduce the estimated fair value of the FCC licenses or goodwill below their adjusted carrying amounts, the Company may be required to recognize additional non-cash impairment charges in future periods, which could have a material impact on the Company’s business, financial condition and results of operations.
Our business depends upon licenses issued by the FCC, and if licenses were not renewed or we were to be out of compliance with FCC regulations and policies, our business could be materially impaired.
Our radio stations depend upon maintaining their broadcasting licenses issued by the FCC, which are currently issued for a maximum term of eight years and are renewable. Interested parties may challenge a renewal application. On rare occasions, the FCC has revoked licenses, not renewed them, or renewed them with significant qualifications, including renewals for less than a full term of eight years. In the last renewal cycle, the FCC granted nearly all of the license renewal applications that were filed for our radio stations. However, we cannot be certain that our future license renewal applications will be approved, or that the renewals will not include conditions or qualifications that could adversely affect our business, financial condition and results of operations, could result in material impairment and could adversely affect our liquidity and financial condition. If any of our FCC licenses are not renewed, it could prevent us from operating the affected radio station and generating revenue from it. Further, the FCC has a general policy restricting the transferability of a radio station license while a renewal application for that radio station is pending. In addition, we must comply with extensive FCC regulations and policies governing the ownership and operation of our
34
radio stations. FCC regulations limit the number of radio stations that a licensee can own in a market, which could restrict our ability to consummate future transactions. The FCC’s rules governing our radio station operations impose costs on our operations and changes in those rules could have an adverse effect on our business. The FCC also requires radio stations to comply with certain technical requirements to limit interference between two or more radio stations. If the FCC relaxes these technical requirements, it could impair the signals transmitted by our radio stations and could have a material adverse effect on our business. Moreover, governmental regulations and policies may change over time, and the changes may have a material adverse impact upon our business, financial condition and results of operations. For further details on federal regulation of radio broadcasting, see "Business—Federal Regulation of Radio Broadcasting."
We may be adversely affected by the FCC’s enforcement of its indecency regulations against the broadcast industry as well as by the increased amounts of the potential fines.
The FCC’s rules prohibit the broadcast of obscene material at any time and indecent material between the hours of 6 a.m. and 10 p.m. Broadcasters risk violating the prohibition against broadcasting indecent material because of the vagueness of the FCC’s definition of indecent material, coupled with the spontaneity of live content. The FCC vigorously enforces its indecency rules against the broadcasting industry as a whole and violations of these rules may result in fines or, in some instances, revocation of an FCC license. The FCC also can impose separate fines for each allegedly indecent "utterance" within radio content. In addition, in 2006 Congress increased the maximum forfeiture for a single indecency violation to $325,000, with a maximum forfeiture exposure of $3,000,000 for any continuing violation arising from a single act or failure to act. Several appeals of certain of the FCC’s recent enforcement actions and of the FCC’s underlying indecency standards are pending in the federal courts. We cannot predict the outcome of these court proceedings or whether Congress will consider or adopt further legislation in this area. In the ordinary course of business, we have received complaints or the FCC has received complaints about whether a limited number of our radio stations have broadcast indecent content. To the extent these complaints or other proceedings by the FCC result in the imposition of fines, a settlement with the FCC, revocation of any of our radio station licenses or denials of license renewal applications, our business, financial condition and results of operations could be materially adversely affected.
We may be adversely affected by the FCC’s actions with respect to Revitalization of AM Radio.
In October 2015, the FCC released a First Report and Order and Further Notice of Proposed Rulemaking titled "Revitalization of AM Radio Service," enacting several modifications to its technical rules for AM radio stations. Included in the order is the elimination of a rule which requires certain AM stations to reduce nighttime interference when seeking to modify their facilities. Also included is a relaxation of the FCC’s requirements for AM stations to provide their communities of license with a specific level of signal coverage, with the intended purpose of permitting AM stations to change the locations of their transmitting facilities. As a result of these rule changes, it is possible that some of our stations may experience increased nighttime interference from other stations in connection with facility modifications. It is also possible that stations owned by others and not serving our markets could move into our markets and become new competitors. Another aspect of the FCC’s revitalization order is exclusive AM filing windows in 2016 to allow AM stations to move an FM translator up to 250 miles to rebroadcast that AM station’s signal, and windows in 2017 exclusively for AM stations to apply for a new FM translator construction permit. The first of these windows, for moving FM translators that will rebroadcast lower-power Class C and D AM stations, opened on January 29, 2016 and will close on July 28, 2016. A second window for moving FM translators rebroadcasting any class of AM station, will open on July 29, 2016 and close on October 31, 2016. These windows may have the effect of increasing competition from other radio stations in our markets, however we cannot predict at this time to what extent, if any, the impact of the FCC's new rules will have on our Company.
Proposed legislation requires radio broadcasters to pay royalties to record labels and recording artists.
Legislation has been introduced that would require radio broadcasters to pay royalties to record labels and performing artists for exhibition or use of the over the air broadcast of their recorded songs. Currently, we pay royalties to song composers and publishers through Broadcast Music, Inc., the American Society of Composers, Authors and Publishers and SESAC, Inc. The proposed legislation would add an additional layer of royalties to be paid directly to
35
the record labels and artists. It is currently unknown what proposed legislation, if any, will become law, and what significance this royalty would have on our business, financial condition and results of operations.
We are required to obtain prior federal approval for each station acquisition, which approvals may be subject to our compliance with certain conditions, possibly including asset divestitures, which may be material.
Acquisitions have been and may continue to be, a critical component of our overall strategy. The acquisition of a radio station requires the prior approval of the FCC and may require approvals by other governmental agencies, such as the Department of Justice ("DOJ") or the Federal Trade Commission ("FTC"). To obtain that approval, a proposed acquirer is required to file a transfer of control or assignment of license application with the FCC. The Communications Act of 1934, as amended (the "Communications Act") and FCC rules allow members of the public and other interested parties to file petitions to deny or other objections to the FCC with respect to the grant of any transfer or assignment application. The FCC could rely on those objections or its own initiative to deny a transfer or assignment application or to require changes in the transaction, including the divestiture of radio stations and other assets, as a condition to having the application granted. Although we do not currently expect such divestitures to be material to our financial position or results of operations, no assurances can be provided that we would not be required to divest additional radio stations in connection with obtaining such approval, or that any such required divestitures would not be material to our financial position or results of operations. The FCC could also change its existing rules and policies to reduce the number of radio stations that we would be permitted to acquire in some markets. For these and other reasons, there can be no assurance that the FCC will approve potential future acquisitions that we deem material to our business.
New or changing federal, state or international privacy legislation or regulation could hinder the growth of our internet properties.
A variety of federal and state laws govern the collection, use, retention, sharing and security of consumer data that our internet properties use to operate certain services and to deliver certain advertisements to its customers, as well as the technologies used to collect such data. Not only are existing privacy-related laws in these jurisdictions evolving and subject to potentially disparate interpretation by governmental entities, new legislative proposals affecting privacy are now pending at both the federal and state level in the U.S. Changes to the interpretation of existing law or the adoption of new privacy-related requirements could hinder the growth of our internet presence. Also, a failure or perceived failure to comply with such laws or requirements or with our own policies and procedures could result in significant liabilities, including a possible loss of consumer or investor confidence or a loss of customers or advertisers, and could adversely affect our business, financial condition and results of operations.
Risks Related to Ownership of Our Class A Common Stock
As an "emerging growth company" under the JOBS Act we are eligible to take advantage of certain exemptions from various reporting requirements.
We are an "emerging growth company," as defined in the JOBS Act, and we are eligible to take advantage of certain exemptions from various reporting requirements that are applicable to other public companies that are not "emerging growth companies" including, but not limited to, not being required to comply with the auditor attestation requirements of Section 404 of the Sarbanes-Oxley Act, reduced disclosure obligations regarding executive compensation in our periodic reports and proxy statements, and exemptions from the requirements of holding a non-binding advisory vote on executive compensation and shareholder approval of any golden parachute payments not previously approved. In addition, as an emerging growth company, we are not required to provide five years of selected financial data in this annual report. Some investors may find our securities less attractive because we may rely on these exemptions. The result may be a less active trading market for our securities and our security prices may be more volatile.
In addition, Section 107 of the JOBS Act also provides that an "emerging growth company" can take advantage of the extended transition period provided in Section 7(a)(2)(B) of the Securities Act for complying with new or revised accounting standards. In other words, an "emerging growth company" can delay the adoption of certain accounting standards until those standards would otherwise apply to private companies. However, we chose to "opt out" of such
36
extended transition period, and as a result, we will comply with new or revised accounting standards on the relevant dates on which adoption of such standards is required for non-emerging growth companies.
We could remain an "emerging growth company" for up to five years, or until the earliest of (i) the last day of the first fiscal year in which our annual gross revenue exceed $1 billion, (ii) the date that we become a "large accelerated filer" as defined in Rule 12b-2 under the Exchange Act, which would occur if the market value of our common stock that is held by non-affiliates exceeds $700 million as of the last business day of our most recently completed second fiscal quarter, or (iii) the date on which we have issued more than $1 billion in non-convertible debt during the preceding three year period.
We are classified as a "controlled company" and, as a result, we qualify for, and rely on, exemptions from certain corporate governance requirements. You will not have the same protections afforded to stockholders of companies that are subject to such requirements.
Certain funds managed by Oaktree continue to control a majority of the voting power of our common stock. As a result, we are a "controlled company" within the meaning of the applicable stock exchange corporate governance standards. Under the rules of the New York Stock Exchange ("NYSE"), a company of which more than 50% of the outstanding voting power is held by an individual, group or another company is a "controlled company" and may elect not to comply with certain stock exchange corporate governance requirements, including:
• | the requirement that a majority of the board of directors consists of independent directors; |
• | the requirement that nominating and corporate governance matters be decided solely by independent directors; and |
• | the requirement that employee and officer compensation matters be decided solely by independent directors. |
We intend to continue to utilize these exemptions. As a result, we may not have a majority of independent directors and our nominating and corporate governance and compensation functions may not be decided solely by independent directors. Accordingly, you would not have the same protections afforded to stockholders of companies that are subject to all of the stock exchange corporate governance requirements.
The public market for our Class A Common Stock may be volatile.
We cannot assure you that the market price of our Class A common stock will not fluctuate significantly in response to a number of factors, many of which we cannot control, including those described under "—Risks Related to Our Business" and the following:
• | changes in financial estimates by any securities analysts who follow our Class A common stock, our failure to meet these estimates or failure of those analysts to initiate or maintain coverage of our Class A common stock; |
• | downgrades by any securities analysts who follow our Class A common stock; |
• | future sales of our common stock; |
• | market conditions or trends in our industry or the economy as a whole and, in particular, in the retail sales environment; |
• | investors’ perceptions of our prospects; |
• | announcements by us or our competitors of significant contracts, acquisitions, joint ventures or capital commitments; and |
37
• | changes in key personnel. |
In addition, the stock markets have experienced extreme price and volume fluctuations that have affected and continue to affect the market prices of equity securities of many companies. In the past, stockholders have instituted securities class action litigation following periods of market volatility. If we were involved in securities litigation, we could incur substantial costs, and our resources and the attention of management could be diverted from our business.
Our majority stockholder has the ability to control significant corporate activities and our majority stockholder’s interests may not coincide with yours.
Certain funds managed by Oaktree beneficially own approximately 1.6 million shares of our Class A common stock, 2.2 million shares of our Class B common stock and approximately 8.6 million shares of our Class A common stock underlying warrants, which together represent approximately 57.5% of the voting power of our common stock. Pursuant to a Stockholders’ Agreement entered into by and between Oaktree, FiveWire Media Ventures LLC ("FiveWire") (an entity formed for the purpose of investing in the Company by certain members of management, including Steven Price, Stuart Rosenstein, Dhruv Prasad and certain other individuals (together, the "FiveWire Holders")) and the FiveWire Holders (the "Stockholders' Agreement"), Oaktree controls approximately 79.3% of the voting power on matters presented to our stockholders. As a result of its ownership, Oaktree, so long as it holds a majority of the voting power on matters presented to our stockholders, will have the ability to control the outcome of matters submitted to a vote of stockholders and, through our Board of Directors, the ability to control decision-making with respect to our business direction and policies. Pursuant to the Stockholders’ Agreement, each FiveWire Holder grants to Oaktree an irrevocable proxy to vote their shares of Class B common stock, which shall remain in effect for so long as Oaktree beneficially owns at least 50% of the number of shares of common stock held immediately following our initial public offering. In addition, pursuant to the Stockholders’ Agreement, until Oaktree ceases to beneficially own at least 33.3% of the number of shares of common stock held immediately following our initial public offering, Oaktree has the right to designate three directors to our board of directors, each of whom will have, until Oaktree ceases to beneficially own at least 70.0% of the number of shares of common stock held immediately following our initial public offering, two votes on each matter. Matters over which Oaktree will, directly or indirectly, exercise control include:
• | the election of our board of directors and the appointment and removal of our officers; |
• | mergers and other business combination transactions, including proposed transactions that would result in our stockholders receiving a premium price for their shares; |
• | other acquisitions or dispositions of businesses or assets; |
• | incurrence of indebtedness and the issuance of equity securities; |
• | repurchase of stock and payment of dividends; and |
• | the issuance of shares to management under our equity incentive plans. |
Even if the voting power of certain funds managed by Oaktree falls below a majority and those funds no longer have the right to designate directors to our board of directors pursuant to the Stockholders’ Agreement, they may continue to be able to strongly influence or effectively control our decisions. Under our certificate of incorporation, Oaktree and its affiliates do not have any obligation to present to us, and Oaktree may separately pursue, corporate opportunities of which they become aware, even if those opportunities are ones that we would have pursued if granted the opportunity.
38
Future sales of our common stock, or the perception in the public markets that these sales may occur, may depress our stock price.
Sales of substantial amounts of our common stock in the public market, or the perception that these sales could occur, could adversely affect the price of our Class A common stock and could impair our ability to raise capital through the sale of additional shares. As of December 31, 2015 we have 9,946,354 shares of Class A common stock outstanding, outstanding warrants to purchase 9,508,878 shares of Class A common stock, 3,022,484 shares of Class B common stock outstanding and 4,894,480 shares of Class C common stock outstanding. The shares of Class A common stock are freely tradable without restriction under the Securities Act, except for any shares of our Class A common stock that may be held or acquired by our directors, executive officers and other affiliates, as that term is defined in the Securities Act, which are restricted securities under the Securities Act. Restricted securities may not be sold in the public market unless the sale is registered under the Securities Act or an exemption from registration is available.
Holders of approximately 20.3 million shares of our Class A common stock (including shares underlying outstanding warrants and assuming the conversion of all shares of Class B and Class C common stock into shares of Class A common stock, each on a one-for-one basis) have the right to require us to register the sales of their shares under the Securities Act, under the terms of a registration agreement between us and the holders of these securities.
In the future, we may also issue our securities in connection with investments or acquisitions. The amount of shares of our common stock issued in connection with an investment or acquisition could constitute a material portion of our then-outstanding shares of our common stock.
Failure to comply with requirements to design, implement and maintain effective internal controls could have a material adverse effect on our business and stock price.
We are not required to comply with Section 404(b) of the Sarbanes-Oxley Act for the annual reporting period ended December 31, 2015, and therefore our auditors are not required to make a formal assessment of the effectiveness of our internal controls for that purpose. Being a public company, we have significant requirements for enhanced financial reporting and internal controls. The process of designing and implementing effective internal controls is a continuous effort that requires us to anticipate and react to changes in our business and the economic and regulatory environments and to expend significant resources to maintain a system of internal controls that is adequate to satisfy our reporting obligations as a public company. If we are unable to establish or maintain appropriate internal financial reporting controls and procedures, it could cause us to fail to accurately report our financial results, fail to meet our reporting obligations on a timely basis, result in material misstatements in our consolidated financial statements and harm our operating results. Testing and maintaining internal controls may also divert our management’s attention from other matters that are important to our business. We may not be able to conclude on an ongoing basis that we have effective internal control over financial reporting in accordance with Section 404 of the Sarbanes-Oxley Act or our independent registered public accounting firm may not issue an unqualified opinion. If either we are unable to conclude that we have effective internal control over financial reporting or our independent registered public accounting firm is unable to provide us with an unqualified report, investors could lose confidence in our reported financial information, which could have a material adverse effect on the trading price of our stock.
Our independent registered public accounting firm will not be required to attest formally to the effectiveness of our internal control over financial reporting until the annual report required to be filed with the SEC following the date we are no longer an emerging growth company. We cannot assure you that there will not be material weaknesses or significant deficiencies in our internal controls in the future.
Our certificate of incorporation designates the Court of Chancery of the State of Delaware as the sole and exclusive forum for certain types of actions and proceedings that may be initiated by our stockholders, which could limit our stockholders’ ability to obtain a favorable judicial forum for disputes with us or our directors, officers or employees.
Our certificate of incorporation provides that, subject to limited exceptions, the Court of Chancery of the State of Delaware will be the sole and exclusive forum for (i) any derivative action or proceeding brought on our behalf, (ii)
39
any action asserting a claim of breach of a fiduciary duty owed by any of our directors, officers or other employees to us or our stockholders, (iii) any action asserting a claim against us arising pursuant to any provision of the Delaware General Corporation Law, our certificate of incorporation or our by-laws, or (iv) any other action asserting a claim against us that is governed by the internal affairs doctrine. Any person or entity purchasing or otherwise acquiring any interest in shares of our capital stock shall be deemed to have notice of and to have consented to the provisions of our certificate of incorporation described above. This choice of forum provision may limit a stockholder’s ability to bring a claim in a judicial forum that it finds favorable for disputes with us or our directors, officers or other employees, which may discourage such lawsuits against us and our directors, officers and employees. Alternatively, if a court were to find these provisions of our certificate of incorporation inapplicable to, or unenforceable in respect of, one or more of the specified types of actions or proceedings, we may incur additional costs associated with resolving such matters in other jurisdictions, which could adversely affect our business and financial condition.
Under our Amended and Restated Certificate of Incorporation, individuals or entities that bring certain claims or join such claims may be obligated to reimburse the Company for the expenses it reasonably incurs in connection with such actions if the claim proves unsuccessful.
Our Amended and Restated Certificate of Incorporation provides, to the fullest extent permitted by law, in the event that any person or entity (the "Claimant") (x) initiates or asserts (1) any derivative action or proceeding brought on behalf of the Company, (2) any claim of breach of a fiduciary duty owed by any director, officer, employee or agent of the Company to the Company or its stockholders, (3) any action against the Company or any of its directors, officers, employees or agents arising pursuant to any provision of the General Corporation Law of the State of Delaware, our Amended and Restated Certificate of Incorporation or our Amended and Restated Bylaws, or (4) any action asserting a claim governed by the internal affairs doctrine (each of the foregoing, a "Claim"), or joins any such Claim as a named party, and (y) does not thereby obtain a judgment on the merits that substantially achieves the full remedy or relief sought in the Claim, such Claimant shall be jointly and severally obligated to reimburse the Company for all fees, costs and expenses (including attorneys’ fees and the fees of experts) actually and reasonably incurred by the Company in defending such Claim. This provision of our Amended and Restated Certificate of Incorporation may deter shareholder litigation that may be in the best interests of the Company or our stockholders.
If securities or industry analysts do not publish research or publish inaccurate or unfavorable research about our business, our stock price and trading volume could decline.
The trading market for our Class A common stock depends in part on the research and reports that securities or industry analysts publish about us or our business. If one or more of the analysts who covers us downgrades our Class A common stock or publishes inaccurate or unfavorable research about our business, our stock price would likely decline. If one or more of these analysts ceases coverage of us or fails to publish reports on us regularly, demand for our Class A common stock could decrease, which could cause our stock price and trading volume to decline.
Because we do not intend to pay cash dividends in the foreseeable future, you may not receive any return on investment unless you are able to sell your Class A common stock for a price greater than your purchase price.
The continued operation and expansion of our business will require substantial funding. Accordingly, we do not anticipate that we will pay any cash dividends on shares of our Class A common stock for the foreseeable future. Any determination to pay dividends in the future will be at the discretion of our Board of Directors and will depend upon results of operations, financial condition, contractual restrictions, including agreements governing our indebtedness, any potential indebtedness we may incur, restrictions imposed by applicable law and other factors our Board of Directors deems relevant. Accordingly, if you purchase shares, realization of a gain on your investment will depend on the appreciation of the price of our Class A common stock, which may never occur. Investors seeking cash dividends in the foreseeable future should not purchase our common stock.
40
We are a holding company and rely on dividends, distributions and other payments, advances and transfers of funds from our subsidiaries to meet our obligations.
We are a holding company that does not conduct any business operations of our own. As a result, we are largely dependent upon cash dividends and distributions and other transfers from our subsidiaries to meet our obligations. The deterioration of income from, or other available assets of, our subsidiaries for any reason could limit or impair their ability to pay dividends or other distributions to us.
Provisions of our certificate of incorporation could have the effect of preventing the Company from having the benefit of certain business opportunities that it may otherwise be entitled to pursue.
Our certificate of incorporation provides that certain funds managed by Oaktree and its affiliates are not required to offer corporate opportunities of which they become aware to us and could, therefore, offer such opportunities instead to other companies, including affiliates of Oaktree. In the event that Oaktree obtains business opportunities from which we might otherwise benefit but chooses not to present such opportunities to us, these provisions of our certificate of incorporation could have the effect of preventing us from pursuing transactions or relationships that would otherwise be in the best interests of our stockholders.
Anti-takeover provisions in our certificate of incorporation or bylaws may delay, discourage or prevent a change in control.
Our certificate of incorporation and bylaws contain provisions that may delay, discourage or prevent a merger or acquisition that a shareholder may consider favorable. As a result, shareholders may be limited in their ability to obtain a premium for their shares.
Item 1B. Unresolved Staff Comments
Not applicable.
Item 2. Properties
The types of properties required to support our business include offices, radio station studios as well as transmitter and tower sites. In each of our Local Advertising markets our radio station studios and offices are generally co-located. Transmitter and tower sites are also generally co-located. The location of our towers is generally chosen so as to provide optimal signal coverage, within the confines of FCC broadcast rules.
As of December 31, 2015, we owned 47 facilities containing broadcast studios and 282 towers in our 66 Local Advertising markets. Where we do not own studios or towers, we lease such facilities. In addition, we lease various office facilities across the U.S. for our corporate, digital marketing solutions, e-commerce and national digital asset operations, including spaces in Greenwich, Connecticut and White Plains, New York for our principal corporate offices. We also lease venues to host our live events from time to time.
We do not anticipate any difficulties in renewing any facility leases or in leasing alternative or additional space, if required. We own or lease substantially all of our other equipment, consisting principally of transmitting antennae, transmitters, studio equipment, certain live event production equipment and general office equipment. Where we do not own necessary equipment, we lease such equipment. In some cases, we lease the equipment in addition to our owned equipment.
No single property is material to our operations. We believe that our properties are generally in good condition and suitable for our operations; however, we continually look for opportunities to upgrade our operations. We continuously evaluate how to optimize our capital allocation as it relates to our properties.
Item 3. Legal Proceedings
41
In the normal course of business, the Company is subject to various regulatory proceedings, lawsuits, claims and other matters related to intellectual property, personal injury, employee, or other matters. Such matters are subject to many uncertainties and outcomes are not predictable with assurance, however we do not believe that the ultimate resolution of these matters will have a material adverse effect on our financial position or results of operations.
Item 4. Mine Safety Disclosures
Not applicable.
PART II
Item 5. Market for Registrant's Common Equity, Related Stockholder Matters and Issuer Purchases of Equity Securities
Market Information
Shares of our Class A common stock, par value $0.01 per share, commenced trading under the symbol "TSQ" on the NYSE on July 24, 2014. Prior to that date, there was no public trading market for our Class A common stock. There is no established public trading market for our Class B common stock or our Class C common stock. Our Class A common stock in our initial public offering was priced at $11.00 per share on July 24, 2014. The following table sets forth, for the periods indicated, the high and low sales price per share of our Class A common stock as reported on the NYSE for the fiscal year ended December 31, 2015, since our initial public offering.
High | Low | ||||||
2014: | |||||||
Third quarter | $ | 12.30 | $ | 9.93 | |||
Fourth quarter | $ | 13.83 | $ | 11.38 | |||
2015: | |||||||
First quarter | $ | 14.35 | $ | 11.91 | |||
Second quarter | $ | 14.34 | $ | 12.13 | |||
Third quarter | $ | 14.13 | $ | 8.60 | |||
Fourth quarter | $ | 12.05 | $ | 9.60 | |||
Holders
On February 9, 2016 the Company had 202 Class A common stockholders, 8 Class B common stockholders and 5 Class C common stockholders.
Dividend Policy
We currently intend to retain all available funds and any future earnings to fund the development and growth of our business, and therefore we do not anticipate paying any cash dividends in the foreseeable future. Additionally, our ability to pay dividends on our Class A common stock will be limited by restrictions on the ability of our subsidiaries and us to pay dividends or make distributions under the terms of current and any future agreements governing our indebtedness. Any future determination to pay dividends will be at the discretion of our Board of Directors, subject to compliance with covenants in our current and future agreements governing our indebtedness, and will depend upon our results of operations, financial condition, capital requirements and other factors that our Board of Directors deems relevant.
In addition, since we are a holding company, substantially all of the assets shown on our consolidated balance sheet are held by our subsidiaries. Accordingly, our earnings, cash flow and ability to pay dividends are largely dependent upon the earnings and cash flows of our subsidiaries and the distribution or other payment of such earnings to us in the form of dividends.
Securities Authorized for Issuance Under Equity Compensation Plan
The following table summarizes information, as of December 31, 2015, relating to equity compensation plans of the Company (including individual compensation arrangements) pursuant to which equity securities of the Company are authorized for issuance.
43
Plan Category | Number of Securities to be Issued Upon Exercise of Outstanding Options, Warrants and Rights (a) | Weighted-Average Exercise Price of Outstanding Options, Warrants and Rights (b) | Number of Securities Remaining Available for Future Issuance Under Equity Compensation Plans (excluding securities reflected in column (a)) (c) | |||
Equity compensation plans approved by shareholders | 7,329,334 | $11.20 | 4,208,956 | |||
Equity compensation plans not approved by shareholders | N/A | N/A | N/A | |||
Total | 7,329,334 | $11.20 | 4,208,956 | |||
On January 26, 2016, the Company granted 1,600,000 options under the 2014 Omnibus Incentive Plan at an exercise price of $8.96 to employees and directors of the Company.
Recent Sale of Unregistered Securities
On September 1, 2015, the Company issued 481,948 shares of Class A common stock as a portion of the consideration in its acquisition of NAME, in a private transaction in reliance upon the exemption provided by Section 4(a)(2) of the Securities Act.
Issuer Purchase of Equity Securities
None.
44
Performance Graph
Our common stock began trading on the NYSE under the symbol "TSQ" on July 24, 2014. Prior to that time, there was no public market for our common stock.
The following graph compares total shareholder returns for the period July 24, 2014 (the date our Class A common stock commenced trading on the New York Stock Exchange) through December 31, 2015 to the Standard & Poor’s 500 Stock Index ("S&P 500"), the Russell 2000 Index ("Russell 2000") and an index ("Radio Index") comprised of radio broadcast and media companies (see note (1) below). The price of the Company’s Class A common stock on July 24, 2014 at its initial public offering (on which the graph is based) was $11.00. The past shareholder return shown on the following graph is not necessarily indicative of future performance.
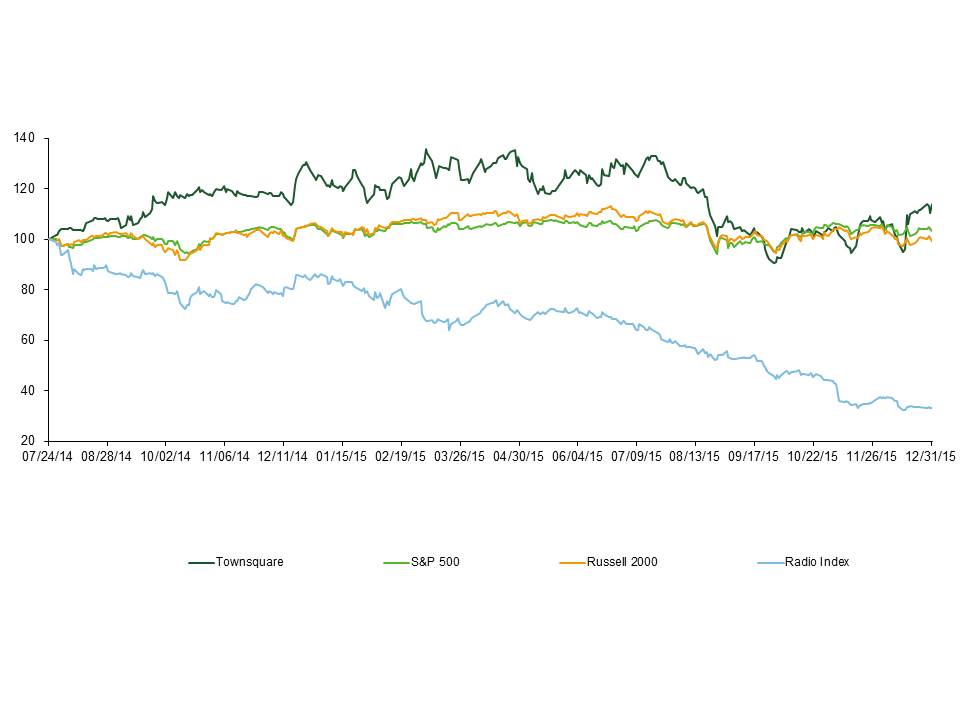
Comparison of Cumulative Total Return
July 24, 2014 | December 31, 2015 | ||||
Townsquare | 100.00 | 113.90 | |||
Radio Index(1) | 100.00 | 33.13 | |||
S&P 500 | 100.00 | 103.32 | |||
Russell 2000 | 100.00 | 99.23 | |||
(1) The Radio Index consists of the following companies: Cumulus Media Inc., Beasley Broadcast Group, Inc., iHeartmedia, Inc. (formerly Clear Channel Holdings, Inc.) Emmis Communications Corporation, Entercom Communications Corp., Radio One, Inc. and Saga Communications, Inc.
45
Item 6. Selected Financial Data
The following tables set forth our selected historical consolidated financial information for the periods ended and as of the dates set forth below. The selected historical financial data as of December 31, 2012, 2013, 2014 and 2015, and for fiscal years ended December 31, 2012, 2013, 2014 and 2015, have been derived from our audited consolidated financial statements and related notes, which are included elsewhere in this annual report.
The following selected historical financial information should be read in conjunction with the sections titled "Management’s Discussion and Analysis of Financial Condition and Results of Operations" and the financial statements and the related notes thereto included elsewhere in this annual report.
Year Ended December 31, | |||||||||||||||
2012 | 2013 | 2014 | 2015 | ||||||||||||
($ in thousands except per share data) | |||||||||||||||
Net revenue | $ | 222,736 | $ | 268,578 | $ | 373,892 | $ | 441,222 | |||||||
Operating costs and expenses: | |||||||||||||||
Direct operating expenses, excluding depreciation, amortization and stock-based compensation | 154,566 | 187,148 | 253,440 | 317,835 | |||||||||||
Depreciation and amortization | 14,824 | 15,189 | 16,878 | 17,577 | |||||||||||
Corporate expenses | 16,287 | 19,190 | 24,996 | 25,411 | |||||||||||
Stock-based compensation (1) | — | — | 37,739 | 4,278 | |||||||||||
Transaction costs | 1,782 | 2,001 | 217 | 1,739 | |||||||||||
Change in fair value of contingent consideration | — | (1,100 | ) | — | — | ||||||||||
Impairment of FCC licenses | — | — | — | 1,680 | |||||||||||
Net loss (gain) on sale of assets | 123 | (36 | ) | 90 | (12,029 | ) | |||||||||
Total operating costs and expenses | 187,582 | 222,392 | 333,360 | 356,491 | |||||||||||
Operating income | 35,154 | 46,186 | 40,532 | 84,731 | |||||||||||
Other expenses: | |||||||||||||||
Interest expense, net | 28,291 | 35,620 | 46,502 | 35,979 | |||||||||||
Loss on extinguishment of debt | — | — | — | 30,305 | |||||||||||
Other expense, net | 123 | 115 | 111 | 277 | |||||||||||
Income (loss) before income taxes | 6,740 | 10,451 | (6,081 | ) | 18,170 | ||||||||||
Provision for income taxes | 340 | 340 | 10,872 | 7,924 | |||||||||||
Net income (loss) | $ | 6,400 | $ | 10,111 | $ | (16,953 | ) | $ | 10,246 | ||||||
Net income (loss) per share: | |||||||||||||||
Basic | * | * | $ | (1.41 | ) | $ | 0.58 | ||||||||
Diluted | * | * | $ | (1.41 | ) | $ | 0.37 | ||||||||
Pro forma C Corporation data (unaudited) | |||||||||||||||
Historical income (loss) before income taxes | $ | 6,740 | $ | 10,451 | $ | (6,081 | ) | * | |||||||
Pro forma income tax expense (benefit) | 2,656 | 4,118 | (2,396 | ) | * | ||||||||||
Pro forma net income (loss) | $ | 4,084 | $ | 6,333 | $ | (3,685 | ) | * | |||||||
Pro forma net income (loss) per share: | |||||||||||||||
Basic | $ | 0.57 | $ | 0.84 | $ | (0.31 | ) | * | |||||||
Diluted | $ | 0.25 | $ | 0.37 | $ | (0.31 | ) | * | |||||||
Weighted average shares outstanding: | Pro Forma | Pro Forma | Pro Forma | Actual | |||||||||||
Basic | 7,132 | 7,569 | 12,013 | 17,537 | |||||||||||
Diluted | 16,253 | 17,078 | 12,013 | 27,724 | |||||||||||
46
Years Ended December 31, | |||||||||||||||
($ in thousands) | 2012 | 2013 | 2014 | 2015 | |||||||||||
Selected Balance Sheet Data (at end of period): | |||||||||||||||
Cash | $ | 22,305 | $ | 45,467 | $ | 24,462 | $ | 33,298 | |||||||
Working capital | 31,440 | 58,486 | 39,106 | 41,123 | |||||||||||
Total assets | 610.121 | 939.203 | 937,312 | 1,060,711 | |||||||||||
Total debt, including current maturities | 367,447 | 653,472 | 530,040 | 588,828 | |||||||||||
Stockholders' and Members' equity: | |||||||||||||||
Class A common stock, par value $0.01 per share; 300,000,000 shares authorized, 9,457,242 and 9,946,354 shares issued and outstanding at December 31, 2014 and 2015 | * | * | 95 | 100 | |||||||||||
Class B common stock, par value $0.01 per share; 50,000,000 shares authorized, 3,022,484 shares issued and outstanding at December 31, 2014 and 2015 | * | * | 30 | 30 | |||||||||||
Class C common stock, par value $0.01 per share; 50,000,000 shares authorized, 4,894,480 shares issued and outstanding at December 31, 2014 and 2015 | * | * | 49 | 49 | |||||||||||
Additional paid-in capital | — | — | 351,984 | 361,186 | |||||||||||
Retained earnings (deficit) | 207,896 | 234,039 | (8,439 | ) | 1,391 | ||||||||||
Accumulated other comprehensive income | — | — | — | 44 | |||||||||||
Non-controlling interest | 442 | 492 | 443 | 640 | |||||||||||
* Does not apply to the period indicated.
(1) In connection with the 2014 conversion from a limited liability company to a Delaware corporation, the Company recorded a one-time charge for share-based compensation of $37.6 million. Refer to Note 7 of the Notes to Consolidated Financial Statements for additional information.
47
Item 7. Management’s Discussion and Analysis of Financial Condition and Results of Operations
The following management’s discussion and analysis ("MD&A") is intended to provide the reader with an overall understanding of our financial condition, results of operations, cash flows and sources and uses of cash. This section also includes general information about our business and a discussion of our management’s analysis of certain trends, risks and opportunities in our industry. In addition, we also provide a discussion of accounting policies that require critical judgments and estimates as well as discuss certain risks and uncertainties that could cause our actual future results to differ materially from our historical results or our current expectations. This discussion should be read in conjunction with our consolidated financial statements and related notes appearing elsewhere in this annual report. The following discussion contains forward-looking statements that involve numerous risks and uncertainties. Our actual results could differ materially from those discussed in the forward-looking statements as a result of these risks and uncertainties, including those set forth in this annual report.
We use the term "Transactions" to refer to all material acquisitions and divestitures, and certain smaller live event acquisitions that were completed from January 1, 2013 to December 31, 2015. The Transactions include, but are not limited to, the acquisition of NAME and the Tower Sale, which closed on September 1, 2015, the acquisition of WE Fest, which closed on October 31, 2014, the acquisition of MAC Events, which closed on November 20, 2013, the acquisition of Peak, which closed on November 14, 2013, the acquisitions of certain assets from Cumulus II, which closed on November 14, 2013, the acquisition of Country Jam, which closed on July 12, 2013, and certain smaller acquisitions of live events acquired from January 1, 2013 through December 31, 2015 (which smaller acquisitions we refer to in this section, together with our acquisitions of NAME, WE Fest, MAC Events and Country Jam, as the "Live Events Acquisitions"). The Transactions are disclosed in more detail in our annual consolidated financial statements included elsewhere in this annual report. We use the term "pro forma" in this section to refer to results that include the Transactions as if they had been completed on January 1, 2013.
Format of Presentation
Townsquare is a media, entertainment and digital marketing solutions company, principally focused on small and mid-sized markets across the United States. Our assets include market leading radio stations, live events, and digital, mobile, video and social media properties. Our integrated and diversified product and service offerings, which we refer to as Townsquare Everywhere, enable local, regional and national advertisers to target audience engagement across multiple platforms, including on-air, online and at live events. We believe our Townsquare Everywhere capabilities, combined with our leading market position in small and mid-sized markets, enable us to generate higher total net revenue per audience member than radio station owners focused on larger markets.
Our discussion is presented on both a consolidated and segment basis. We have two reportable operating segments, which are Local Advertising and Live Events, and report the remainder of our business in an Other Media and Entertainment category. Our Local Advertising segment offers broadcast, digital and mobile advertising within our local markets. Our Live Events segment is composed of a diverse range of live events, which we create, promote and produce, including music concerts, multi-day music festivals, fairs, consumer expositions and trade shows, athletic events, lifestyle events and other forms of entertainment. Other Media and Entertainment is primarily composed of our digital marketing solutions offering, national digital assets and e-commerce offering and also includes tower and other miscellaneous revenue.
Local Advertising
Our Local Advertising segment is composed of 309 owned and operated radio stations and over 325 owned and operated local websites in 66 small and mid-sized markets. Almost all of our radio stations have local companion websites that utilize the station brands and are populated with proprietary, original content created or curated by our local media personalities.
Our primary source of Local Advertising net revenue is the sale of advertising and sponsorship on our radio stations, local companion websites, radio stations’ online streams and mobile applications. Our sales of advertisements
48
and sponsorship are primarily affected by the demand for advertising from local, regional and national advertisers and the advertising rates we charge. Advertising demand and rates are based primarily on our ability to attract audiences to our various products in the demographic groups targeted by advertisers, as measured principally by various services on a periodic basis. We endeavor to develop strong audience loyalty and believe that the diversification of formats on our radio stations and websites helps to insulate our radio stations and websites from the effects of changes in musical tastes of the public with respect to any particular format. We believe that the sale of our online and mobile advertisements, which currently have rates per advertisement that are less than those of terrestrial radio advertisements, has not negatively impacted our terrestrial radio advertising net revenue. Should a significant and sudden shift in demand for these products toward online and mobile occur, there could be a material adverse impact on our financial condition and results of operations if we are unable to increase rates accordingly. We believe that as a result of our strong brands and quality online and mobile offerings we are well positioned to increase rates as demand increases for these products.
We strive to maximize net revenue by managing our advertising inventory time and adjusting prices up or down based on supply and demand. Our selling and pricing activity is based on demand for our advertising inventory and, in general, we respond to this demand by varying prices rather than by varying our target inventory levels. The optimal number of advertisements available for sale depends on the platform and in the case of our radio stations and their online streams, the programming format of a particular radio station. Each of our products has a general target level of inventory available for advertising.
We seek to broaden our base of advertisers in each of our markets by providing a wide array of audience demographic segments across our platforms, thereby providing each of our potential advertisers with an effective means of reaching a targeted demographic group.
Our Local Advertising contracts are generally short-term. In the local media industry, companies sometimes utilize barter agreements that exchange advertising time for goods or services such as travel or lodging, instead of cash. Barter revenue totaled $9.3 million, $13.1 million and $16.4 million for the years ended December 31, 2013, 2014 and 2015, respectively. Barter expense totaled $8.5 million, $12.0 million and $14.2 million for the years ended December 31, 2013, 2014 and 2015, respectively.
Our most significant Local Advertising expenses are sales, programming, digital, marketing and promotional, engineering and general and administrative expenses. We strive to control these expenses by closely monitoring and managing each Local Advertising market and through efficiencies gained from the centralization of finance, accounting, legal and human resources functions and management information systems. We also use our scale and diversified geographic portfolio to negotiate favorable rates with vendors, where feasible.
A portion of our Local Advertising segment’s expenses are variable. These variable expenses primarily relate to sales costs, such as commissions as well as certain programming costs, such as music license fees. Other programming, digital, engineering and general and administrative expenses are primarily fixed costs. Marketing and promotions expenses are discretionary and are primarily incurred in an effort to maintain and/or increase our audience share.
Live Events
Our primary source of Live Events net revenue is from ticket sales. Our live events also generate substantial net revenue through the sale of sponsorships, ride tickets, food and other concessions, merchandise and other ancillary products and services. Live event ticket pricing is based on consumer demand for each event and the geographic location and target audience demographic of each event. Unforeseen events such as inclement weather conditions can have an adverse impact on our Live Event net revenue. In certain cases, we mitigate this risk with insurance policies, which cover a portion of lost revenue as a result of unforeseen events including inclement weather.
Certain expenses attributable to the live events business are variable, including sponsorship sales commissions, certain costs related to production and certain revenue sharing agreements with partners. A portion of our revenue and expenses, related to some of NAME's operations, are denominated in Canadian dollars and expose us to translational foreign currency risk. We have not historically hedged our exposure to this risk.
49
Other Media and Entertainment
The Other Media and Entertainment business is primarily composed of our digital marketing solutions offering, national digital assets and e-commerce offering and also includes other miscellaneous revenue. These assets extend our audience and advertiser reach into and beyond our Local Advertising markets.
Our primary source of Other Media and Entertainment net revenue is from national digital advertising and digital marketing solutions. Demand for national digital advertising is primarily for display advertisements. Our national digital assets are subject to general advertising trends as well as advertisers’ perception and demand for our products. A downturn in advertising spending or the economy could have an adverse effect on this net revenue. We believe this risk is mitigated by the subscription nature of our digital marketing solutions as well as the level of investment in our advertising products, services and brands.
Other sources of revenue within our Other Media and Entertainment business include tower and other miscellaneous revenue. We generate revenue from leasing space on our own tower facilities sold generally to communications companies and local authorities, as well as from other miscellaneous revenue sources. As a result of the September 1, 2015 Tower Sale, tower lease revenue is no longer a significant contributor to other revenue.
A portion of the expenses attributable to the Other Media and Entertainment business is variable. These variable expenses primarily relate to sales costs, such as commissions. Certain technology infrastructure related to our digital marketing solutions, national digital assets and e-commerce business are generally fixed costs in nature.
Seasonality
Our net revenue varies throughout the year. We expect that our first calendar quarter will produce the lowest net revenue for the year, as advertising expenditures generally decline following the winter holidays, and the second and third calendar quarters will generally produce the highest net revenue for the year. In addition to advertising revenue seasonality, our Live Events net revenue exhibits seasonality resulting in the third quarter being the highest revenue period, followed by the second, then fourth, then first quarter. Large drivers of this seasonality are our summertime multi-day festivals, and NAME's revenue which is concentrated in the third quarter. During even-numbered years, net revenue generally includes increased advertising expenditures by political candidates, political parties and special interest groups. Political spending is typically highest during the fourth quarter. Our operating results in any period may be affected by the incurrence of advertising and promotion expenses that typically do not have an effect on net revenue generation until future periods, if at all.
Macroeconomic Indicators
Our advertising revenue for our businesses is highly correlated to changes in gross domestic product ("GDP") as advertising spending has historically trended in line with, and in our experience often lags, changes in GDP. According to the U.S. Department of Commerce estimate as of January 29, 2016, U.S. GDP growth for the year ended December 31, 2015 was 2.4%.
LLC Conversion and Initial Public Offering
On July 25, 2014, Townsquare Media, LLC converted into a Delaware corporation (the "LLC Conversion"), and was renamed Townsquare Media, Inc.
Pursuant to the conversion, each unit and warrant to purchase units of Townsquare Media, LLC was exchanged for a number of shares of Class A, Class B or Class C common stock of Townsquare Media Inc. and warrants to purchase shares of Class A common stock of Townsquare Media, Inc. The conversion was structured so as to retain the relative equity interests of each of the respective equity holders of Townsquare Media, LLC in Townsquare Media, Inc. As a result of these exchanges, a one-time charge for share-based compensation of $37.6 million was recorded in 2014 operating results ($24.9 million after the related tax benefit).
50
On July 24, 2014, our shares began trading on the NYSE in an initial public offering ("IPO"). Our shares are traded under the symbol "TSQ." The IPO consisted of a total of 8,923,333 shares of common stock (including the subsequent exercise of an underwriters' option to purchase additional shares), at an offering price of $11.00 per share. We received total proceeds from the offering, net of underwriting discounts and commissions, of $88.1 million.
See to Note 7 of the Notes to Consolidated Financial Statements for additional information.
Emerging Growth Company
The Company is an "emerging growth company," as defined in the Jumpstart Our Business Startups Act of 2012 ("JOBS Act"), and may take advantage of certain exemptions from various reporting requirements that are applicable to other public companies that are not "emerging growth companies" including, but not limited to, not being required to comply with the auditor attestation requirements of Section 404(b) of the Sarbanes-Oxley Act, and exemptions from the requirements of Sections 14A(a) and (b) of the Securities Exchange Act to hold a nonbinding advisory vote of stockholders on executive compensation and any golden parachute payments not previously approved.
Executive Summary
The key developments in our business for the year ended December 31, 2015 as compared to 2014 are summarized below:
▪ | Consolidated net revenue for 2015 increased $67.3 million, or 18.0%. Organic growth accounts for $27.5 million of this increase, and acquisitions account for the remaining $39.8 million. |
▪ | Local Advertising net revenue increased $0.5 million, or 0.2%. |
▪ | Live Events net revenue increased $56.7 million, or 138.5%. |
▪ | Other Media and Entertainment net revenue increased $10.1 million, or 33.4%. |
▪ | Pro forma consolidated net revenue increased $25.6 million, or 5.4%. Excluding the effects of fluctuations in the Canadian dollar to U.S. dollar exchange rate, pro forma net revenue increased $30.4 million, or 6.4%. |
▪ | Pro forma Local Advertising net revenue increased $0.5 million, or 0.2%. Excluding the impact of political advertising revenue in 2015, a non-election year, pro forma Local Advertising net revenue increased $5.7 million, or 1.9%. |
▪ | Pro forma Live Events net revenue increased $14.6 million, or 10.1%, primarily attributable to increases in the attendance and revenue per attendee of our events. On a constant currency basis, pro forma Live Events net revenue increased $19.4 million, or 13.9%. |
▪ | Pro forma Other Media and Entertainment net revenue increased $10.5 million, or 36.3%, primarily driven by strong growth within our digital marketing solution offerings and national digital assets. |
The key developments in our business for the year ended December 31, 2014 as compared to 2013 are summarized below:
▪ | Consolidated net revenue increased $105.3 million, or 39.2%. Organic growth accounts for $24.9 million of this increase, and acquisitions account for the remaining $80.4 million. |
51
▪ | Local Advertising net revenue increased $73.0 million, or 31.8%. |
▪ | Live Events net revenue increased $20.1 million, or 96.4%. |
▪ | Other Media and Entertainment net revenue increased $12.2 million, or 67.6%. |
▪ | Pro forma consolidated net revenue increased $32.6 million, or 7.4%. Excluding the effects of fluctuations in the Canadian dollar to U.S. dollar exchange rate, pro forma net revenue increased $33.6 million, or 7.7%. |
▪ | Pro forma Local Advertising net revenue increased $7.6 million, or 2.6%. Excluding the impact of political advertising revenue in 2014, an election year, pro forma Local Advertising net revenue increased $1.7 million, or 0.6%. |
▪ | Pro forma Live Events net revenue increased $15.6 million, or 12.0%, primarily attributable to increases in the attendance and revenue per attendee of our events. On a constant-currency basis, pro forma Live Events net revenue increased $16.5 million, or 13.4%. |
▪ | Pro forma Other Media and Entertainment net revenue increased $9.5 million, or 48.6%, primarily driven by growth within our digital marketing solutions offerings and national digital assets. |
52
Consolidated Results of Operations
Year Ended December 31, 2014 compared to Year Ended December 31, 2015
The following table summarizes our historical consolidated results of operations:
Year Ended December 31, | ||||||||||||||
($ in thousands) | 2014 | 2015 | $ Change | % Change | ||||||||||
Statement of Operations Data: | ||||||||||||||
Local Advertising net revenue | $ | 302,648 | $ | 303,130 | $ | 482 | 0.2 | % | ||||||
Live Events net revenue | 40,954 | 97,681 | 56,727 | 138.5 | % | |||||||||
Other Media and Entertainment net revenue | 30,290 | 40,411 | 10,121 | 33.4 | % | |||||||||
Net revenue | 373,892 | 441,222 | 67,330 | 18.0 | % | |||||||||
Operating Costs and Expenses: | ||||||||||||||
Local Advertising direct operating expenses | 189,975 | 194,020 | 4,045 | 2.1 | % | |||||||||
Live Events direct operating expenses | 35,087 | 88,994 | 53,907 | 153.6 | % | |||||||||
Other Media and Entertainment direct operating expenses | 28,378 | 34,821 | 6,443 | 22.7 | % | |||||||||
Station operating expenses, excluding depreciation, amortization and stock-based compensation | 253,440 | 317,835 | 64,395 | 25.4 | % | |||||||||
Depreciation and amortization | 16,878 | 17,577 | 699 | 4.1 | % | |||||||||
Corporate expenses | 24,996 | 25,411 | 415 | 1.7 | % | |||||||||
Stock-based compensation | 37,739 | 4,278 | (33,461 | ) | ** | |||||||||
Transaction costs | 217 | 1,739 | 1,522 | 701.4 | % | |||||||||
Impairment charge, FCC licenses | — | 1,680 | 1,680 | ** | ||||||||||
Net loss (gain) on sale of assets | 90 | (12,029 | ) | (12,119 | ) | ** | ||||||||
Total operating costs and expenses | 333,360 | 356,491 | 23,131 | 6.9 | % | |||||||||
Operating income | 40,532 | 84,731 | 44,199 | 109.0 | % | |||||||||
Other expense: | ||||||||||||||
Interest expense, net | 46,502 | 35,979 | (10,523 | ) | (22.6 | )% | ||||||||
Loss on extinguishment of debt | — | 30,305 | 30,305 | ** | ||||||||||
Other expense, net | 111 | 277 | 166 | 149.5 | % | |||||||||
Total other expense | 46,613 | 66,561 | 19,948 | 42.8 | % | |||||||||
(Loss) income before income taxes | (6,081 | ) | 18,170 | 24,251 | 398.8 | % | ||||||||
Provision for income taxes | 10,872 | 7,924 | (2,948 | ) | (27.1 | )% | ||||||||
Net (loss) income | $ | (16,953 | ) | $ | 10,246 | $ | 27,199 | 160.4 | % | |||||
**Percent change not meaningful.
Net Revenue
Net revenue for the year ended December 31, 2015 increased $67.3 million, or 18.0%, as compared to 2014. This was primarily due to an increase in net revenue from Live Events of $56.7 million, or 138.5%. The increase in Live Events net revenue was composed of $16.9 million of growth from our existing business and $39.8 million of growth from acquisitions made in 2015 and the latter half of 2014, including their subsequent performance from the date of acquisition as further detailed below.
53
Local Advertising net revenue for the year ended December 31, 2015 increased $0.5 million, or 0.2%, as compared to the year ended December 31, 2014. The increase in non-political advertising of $5.7 million was offset by the decrease of political advertising of $5.2 million.
Live Events net revenue for the year ended December 31, 2015 increased $56.7 million, or 138.5%, as compared to the year ended December 31, 2014. The increase was composed of $16.9 million of growth from our existing business and $39.8 million of growth from acquisitions made in 2015 and the latter half of 2014, including their subsequent performance from the date of acquisition. The $39.8 million of growth related to acquisitions is attributable to (i) $10.3 million from the full-year effect of the 2014 acquisition of WE Fest, (ii) $27.8 million from the 2015 acquisition of NAME and (iii) $1.7 million from various live events acquisitions. The $16.9 million of growth from our existing business was primarily attributable to increases in the attendance and revenue per attendee of our live events.
Other Media and Entertainment net revenue for the year ended December 31, 2015 increased $10.1 million, or 33.4%, as compared to 2014. This increase was driven primarily by increases within our digital marketing solutions offerings and national digital assets, partially offset by a decrease in tower lease revenue as the result of the Tower Sale.
Direct Operating Expenses
Direct operating expenses for the year ended December 31, 2015 increased $64.4 million, or 25.4%, as compared to 2014. As further detailed below, this increase was due to higher direct operating expenses in our Live Events, Local Advertising and Other Media and Entertainment businesses.
Local Advertising direct operating expenses for the year ended December 31, 2015 increased $4.0 million, or 2.1%, as compared to 2014. This resulted from increased investment in our digital products as well as slightly increased general and administrative expenses. This was primarily related to increased costs in benefits and other headcount related expenses, as a result of our continued investment in additional headcount to support the growth of our business.
Live Events direct operating expenses for the year ended December 31, 2015 increased $53.9 million, or 153.6%, as compared to 2014. The increase in Live Events direct operating expenses in 2015 offset much of the corresponding increase in related net revenue. This was primarily the result of our heightened level of investment in infrastructure and new and existing events.
Other Media and Entertainment direct operating expenses increased $6.4 million, or 22.7%, commensurate with net revenue growth in our digital marketing solutions offerings and national digital assets.
Depreciation and Amortization
Depreciation and amortization expense for the year ended December 31, 2015 increased $0.7 million, or 4.1%, as compared to 2014. This increase primarily related to depreciation and amortization on property, equipment and finite-lived intangible assets acquired through the acquisition of NAME and the 2014 acquisition of WE Fest, which was partially offset by a decrease in amortization of capitalized software development costs.
Corporate Expenses
Corporate expense for the year ended December 31, 2015 increased $0.4 million, or 1.7%, as compared to 2014. This increase was primarily driven by increased costs in professional services to support our needs as a public company, as well as increased costs in headcount-related expenses including employee compensation and increased rent expense for office space to support the continued growth of our business.
54
Stock-based Compensation
Stock-based compensation was $4.3 million for the year ended December 31, 2015 due to the grant of immediately vested stock options in 2015 to certain employees under the 2014 Incentive Plan. Stock-based compensation in 2014 was $37.7 million, $37.6 million of which was due to a one-time, non-recurring charge related to the conversion of certain units into shares of Class A and Class B common stock and stock option grants, both in connection with our LLC Conversion and IPO in July 2014.
Transaction Costs
Transaction costs for the year ended December 31, 2015 were $1.7 million as compared to $0.2 million in 2014. Our transaction costs increased in 2015 primarily related to costs associated with the NAME acquisition, which closed on September 1, 2015.
Impairment charge, FCC licenses
Based on the results of the Company’s 2015 annual impairment evaluations, the Company recorded impairment charges aggregating $1.7 million pertaining to FCC licenses in our Quad Cities and Grand Junction markets.
Net Loss (Gain) on Sale of Assets
We recognized a $12.0 million net gain on the sale of assets for the year ended December 31, 2015, as compared to a $0.1 million net loss in 2014. The net gain in 2015 primarily resulted from the Tower Sale.
Other Expense
Interest Expense is the major recurring component of other expense. Interest expense for the year ended December 31, 2015 decreased $10.5 million, or 22.6%, as compared to 2014. This decrease was due to a lower overall average interest rate on our debt and a lower level of outstanding indebtedness throughout 2015, as compared to 2014.
Year Ended December 31, | |||||||
2014 | 2015 | ||||||
($ in thousands) | |||||||
Unsecured Senior Notes | $ | 35,286 | $ | 23,447 | |||
Term Loans | 6,191 | 10,757 | |||||
Subordinated Notes | 1,797 | — | |||||
Capital loans and other | 68 | 55 | |||||
Loan origination cost | 3,160 | 1,720 | |||||
Interest expense, net | $ | 46,502 | $ | 35,979 | |||
During the year ended December 31, 2015, the Company refinanced substantially all of its outstanding indebtedness. The Company paid $27.7 million in redemption premiums to the holders of its then-existing notes as a result of the early redemption. In addition, the Company recognized a loss of $9.1 million and a gain of $6.8 million on the write-off of unamortized deferred financing costs and bond premium, respectively. These costs are reflected as
Loss on extinguishment of debt in the table above.
Provision for income taxes
We recognized a provision for income taxes of $7.9 million for the year ended December 31, 2015. Our effective tax rate for the period was 43.6%. Our effective tax rate may vary significantly from period to period, and can be influenced by many factors. These factors include, but are not limited to, changes to the statutory rates in the
55
jurisdictions where we have operations and changes in the valuation of deferred tax assets and liabilities. The difference between the effective tax rate and the federal statutory rate of 35% in 2015 primarily related to foreign and state income taxes.
On September 1, 2015, we acquired all of the membership interests in NAME. As we acquired all of the outstanding equity of NAME, we inherited the tax basis of the acquired assets from the former owners. Therefore, our tax basis in the acquired assets is different from the GAAP basis of the same assets, which reflects estimated fair market value. We have recognized an opening deferred tax liability in connection with the acquisition of NAME to reflect this difference between tax basis and GAAP basis.
Prior to our IPO, for income tax purposes we were comprised principally of limited liability entities, which were not subject to federal and certain state income taxes at the entity level and certain corporations whose operations were subject to income taxes at the company level. Upon completion of our IPO and the LLC Conversion, all of our operations became subject to income taxes at the corporation level.
56
Year Ended December 31, 2013 compared to Year Ended December 31, 2014
The following table summarizes our historical consolidated results of operations:
Year Ended December 31, | ||||||||||||||
($ in thousands) | 2013 | 2014 | $ Change | % Change | ||||||||||
Statement of Operations Data: | ||||||||||||||
Local Advertising net revenue | $ | 229,653 | $ | 302,648 | $ | 72,995 | 31.8 | % | ||||||
Live Events net revenue | 20,851 | 40,954 | 20,103 | 96.4 | % | |||||||||
Other Media and Entertainment net revenue | 18,074 | 30,290 | 12,216 | 67.6 | % | |||||||||
Net revenue | 268,578 | 373,892 | 105,314 | 39.2 | % | |||||||||
Operating Costs and Expenses: | ||||||||||||||
Local Advertising direct operating expenses | 147,720 | 189,975 | 42,255 | 28.6 | % | |||||||||
Live Events direct operating expenses | 18,287 | 35,087 | 16,800 | 91.9 | % | |||||||||
Other Media and Entertainment direct operating expenses | 21,141 | 28,378 | 7,237 | 34.2 | % | |||||||||
Station operating expenses, excluding depreciation, amortization and stock-based compensation | 187,148 | 253,440 | 66,292 | 35.4 | % | |||||||||
Depreciation and amortization | 15,189 | 16,878 | 1,689 | 11.1 | % | |||||||||
Corporate expenses | 19,190 | 24,996 | 5,806 | 30.3 | % | |||||||||
Stock-based compensation | — | 37,739 | 37,739 | ** | ||||||||||
Transaction costs | 2,001 | 217 | (1,784 | ) | (89.2 | )% | ||||||||
Change in fair value of contingent consideration | (1,100 | ) | — | 1,100 | ** | |||||||||
Net (gain) loss on sale of assets | (36 | ) | 90 | 126 | 350.0 | % | ||||||||
Total operating costs and expenses | 222,392 | 333,360 | 110,968 | 49.9 | % | |||||||||
Operating income | 46,186 | 40,532 | (5,654 | ) | (12.2 | )% | ||||||||
Other expense: | ||||||||||||||
Interest expense, net | 35,620 | 46,502 | 10,882 | 30.6 | % | |||||||||
Other expense, net | 115 | 111 | (4 | ) | (3.5 | )% | ||||||||
Total other expense | 35,735 | 46,613 | 10,878 | 30.4 | % | |||||||||
Income (loss) before income taxes | 10,451 | (6,081 | ) | (16,532 | ) | (158.2 | )% | |||||||
Provision for income taxes | 340 | 10,872 | 10,532 | 3,097.6 | % | |||||||||
Net income (loss) | $ | 10,111 | $ | (16,953 | ) | $ | (27,064 | ) | (267.7 | )% | ||||
**Percent change not meaningful.
Net Revenue
Net revenue for the year ended December 31, 2014 increased $105.3 million, or 39.2%, as compared to 2013. This increase was composed of $24.9 million of growth from our existing business and $80.4 million of growth from acquisitions made since January 1, 2013, including their subsequent performance from the date of acquisition. The $80.4 million of growth related to acquisitions is attributable to (i) $9.4 million from Peak’s Boise market, (ii) $63.6 million from Cumulus II assets and (iii) $7.4 million from various live events acquisitions. The $24.9 million of growth related to our existing business was driven by a $4.7 million increase in Local Advertising net revenue, a $9.8 million increase in Live Events net revenue and a $10.4 million increase in Other Media and Entertainment net revenue, as further detailed below.
57
Local Advertising net revenue for the year ended December 31, 2014 increased $73.0 million, or 31.8%, as compared to 2013. The increase was composed of $4.7 million of growth from our existing business and $68.3 million of growth from acquisitions made since January 1, 2013, including their subsequent performance from the date of acquisition. The $68.3 million of growth related to acquisitions is attributable to $8.2 million from Peak’s Boise market and $60.1 million from Cumulus II assets. The $4.7 million of growth related to our existing business was primarily driven by an increase in political net revenue of $3.1 million and non-political net revenue of $1.6 million.
Live Events net revenue for the year ended December 31, 2014 increased $20.1 million, or 96.4%, as compared to 2013. The increase was composed of $9.8 million of growth from our existing business and $10.3 million of growth from acquisitions made since January 1, 2013, including their subsequent performance from the date of acquisition. The $10.3 million of growth related to acquisitions is attributable to (i) $1.0 million from Peak's Boise market, (ii) $1.9 million from Cumulus II assets and (iii) $7.4 million from various live events acquisitions. The $9.8 million of growth from our existing business was primarily attributable to increases in the number, attendance and revenue per attendee of our live events.
Other Media and Entertainment net revenue for the year ended December 31, 2014 increased $12.2 million, or 67.6%, as compared to 2013. The increase was composed of $10.4 million of growth from our existing business and $1.8 million of growth from acquisitions made since January 1, 2013, including their subsequent performance from the date of acquisition. The $1.8 million of growth related to acquisitions is attributable to (i) $0.2 million from Peak’s Boise market and (ii) $1.6 million from Cumulus II assets. The $10.4 million of growth related to our existing business was driven by increases within our digital marketing service and national digital assets, which was partially offset by a decrease in our e-commerce net revenue.
Direct Operating Expenses
Direct operating expenses for the year ended December 31, 2014 increased $66.3 million, or 35.4%, as compared to 2013. The increase was composed of $18.8 million of increased expense from our existing business and $47.5 million of increased expense from acquisitions made since January 1, 2013, including their subsequent performance from the date of acquisition. The $47.5 million of increased expense related to acquisitions is attributable to (i) $6.1 million from Peak’s Boise market, (ii) $36.0 million from Cumulus II assets and (iii) $5.4 million from various live events acquisitions. The $18.8 million of increased expense related to our existing business was driven by a $2.8 million increase in Local Advertising direct operating expenses, a $9.2 million increase in Live Events direct operating expenses and a $6.7 million increase in Other Media and Entertainment direct operating expenses, as further detailed below.
Local Advertising direct operating expenses for the year ended December 31, 2014 increased $42.3 million, or 28.6%, as compared to 2013. The increase was composed of $2.8 million of increased expense from our existing business and $39.5 million of increased expense from acquisitions made since January 1, 2013, including their subsequent performance from the date of acquisition. The $39.5 million of increased expense related to acquisitions is attributable to $5.3 million from Peak’s Boise market and $34.2 million from Cumulus II assets. The $2.8 million of increased expense related to our existing business was driven by an increase within our general and administrative expenses primarily related to increased costs in benefits and other headcount related expenses, as a result of our continued investment in additional headcount to support the growth of our business.
Live Events direct operating expenses for the year ended December 31, 2014 increased $16.8 million, or 91.9%, as compared to 2013. The increase was composed of $9.2 million of increased expense from our existing business and $7.6 million of increased expense related to acquisitions made since January 1, 2013, including their subsequent performance from the date of acquisition. The $7.6 million of increased expense related to acquisitions is attributable to (i) $0.7 million from Peak's Boise market, (ii) $1.5 million from Cumulus II assets and (iii) $5.4 million from various live events acquisitions. The $9.2 million of increased expense related to our existing business was primarily attributable to increased expenses in the number, attendance and expense per attendee of our live events, as well as investment in growth in new products we expect to realize going forward. Additionally, the $9.2 million of increased expense from our existing business included $0.8 million for incremental overhead added throughout the year to support future growth.
58
Other Media and Entertainment direct operating expenses for the year ended December 31, 2014 increased $7.2 million, or 34.2%, as compared to 2013. The increase was composed of $6.7 million of increased expense from our existing business and $0.5 million of increased expense from acquisitions made since January 1, 2013, including their subsequent performance from the date of acquisition. The $0.5 million of increased expense related to acquisitions is attributable to (i) $0.1 million from Peak’s Boise market and (ii) $0.4 million from Cumulus II assets. The $7.2 million of increased expense related to our existing business was driven by increases within our digital marketing service and national digital assets commensurate with revenue growth.
Depreciation and Amortization
Depreciation and amortization expense for the year ended December 31, 2014 increased $1.7 million, or 11.1%, as compared to 2013. The increase was primarily composed of an increase in depreciation and amortization for assets acquired in the Peak and Cumulus II transactions.
Corporate Expenses
Corporate expense for the year ended December 31, 2014 increased $5.8 million, or 30.3%, as compared to 2013. The increase primarily consisted of an increase of $2.2 million in legal fees, net of the April 18, 2013 dismissal of the Brill lawsuit, whereby we reversed $2.1 million of the remaining liability as a credit to legal fees in corporate expense on the consolidated statement of operations for the year ended December 31, 2013. Excluding the benefit of the one-time reversal of legal expense corporate expense increased $3.7 million, or 17.5%, in 2014 as compared to 2013. This is primarily a result of increased costs in salaries and benefits, from our continued investment in additional headcount to support the growth of our business and costs associated with being a public company.
Stock-based Compensation
The increase was primarily composed of a one-time, non-recurring, non-cash stock based compensation expense charge of approximately $37.6 million, recorded during the year ended December 31, 2014. This amount consisted of approximately $5.0 million with respect to the conversion of Class B units into shares of Class A common stock and Class B common stock, and approximately $32.6 million with respect to the options granted as a result of our IPO, which closed on July 29, 2014.
Transaction Costs
Transaction costs for the year ended December 31, 2014 decreased $1.8 million, or 89.2%, as compared to 2013. Transaction costs for the year ended December 31, 2013 primarily consisted of costs relating to our Peak and Cumulus II acquisitions, which closed in November 2013. Transaction costs for the year ended December 31, 2014 primarily consisted of costs relating to our WE Fest acquisition, which closed in October 2014.
Net (Gain) Loss on Sale of Assets
Loss on sale of assets for the year ended December 31, 2014 increased $0.1 million, or 350.0%, as compared to 2013. The change relates to a $0.2 million loss relating to the sale of land in Odessa, TX, which was partially offset by $0.1 million gain relating to proceeds received for the sale of a portion of land in Lubbock, Texas.
59
Other Expense
Interest Expense, net is the major recurring component of other expense. Interest expense, net for the year ended December 31, 2014 increased $10.9 million, or 30.6%, as compared to 2013. The increase was primarily a result of the financings for the Peak and Cumulus II transactions. The table below illustrates the current year and prior year components of our interest expense, net.
Year Ended December 31, | |||||||
2013 | 2014 | ||||||
($ in thousands) | |||||||
Unsecured Senior Notes | $ | 27,668 | $ | 35,286 | |||
Term Loans | 5,353 | 6,191 | |||||
Subordinated Notes | 392 | 1,797 | |||||
Capital loans and other | 96 | 68 | |||||
Loan origination cost | 2,111 | 3,160 | |||||
Interest expense, net | $ | 35,620 | $ | 46,502 | |||
Provision for income taxes
As a result of the LLC Conversion the Company recorded a net deferred income tax expense of $2.8 million relating to the differences in the basis of the assets and liabilities for accounting and income tax basis of the LLC entities which existed at the date of conversion. The $2.8 million has been charged to operations and is included in the income tax expense for the year ended December 31, 2014.
The Company has recorded in its historical statements of operations for the year ended December 31, 2014 total income tax expense of $10.9 million which is comprised of the foregoing $2.8 million of net deferred taxes recorded as of the date of the LLC Conversion and income taxes based on its operations for the period from the July 25, 2014 date of the LLC Conversion to December 31, 2014 of approximately $7.7 million of additional deferred income taxes. Additionally, the Company recorded approximately $0.4 million for Texas gross receipts tax.
Supplemental Pro Forma Net Revenue
For comparative purposes and to enable the reader to adequately compare prior year results with current year results, the following discussion and tables present net revenue for Townsquare, pro forma for the Transactions disclosed in more detail in our consolidated financial statements contained elsewhere in this annual report. The following tables present our pro forma results, which include the results of acquisitions and exclude the results of divestitures prior to the transaction dates. Also provided are constant currency adjustments which aim to normalize the effect of fluctuations in the Canadian-US dollar exchange rate, and its effect on our Canadian-based NAME business over time.
60
Year Ended December 31, 2015
($ in thousands) | Townsquare | NAME Jan 1, 2015 - Aug 31, 2015 | Tower Sale | Townsquare Pro Forma for the Transactions | Constant Currency Adjustment | Townsquare Pro Forma for Transactions (Constant Currency) | ||||||||||||
Local Advertising net revenue | $ | 303,130 | $ | — | $ | — | $ | 303,130 | $ | — | $ | 303,130 | ||||||
Live Events net revenue | 97,681 | 61,661 | — | 159,342 | — | 159,342 | ||||||||||||
Other Media and Entertainment net revenue | 40,411 | — | (961 | ) | 39,450 | — | 39,450 | |||||||||||
Net revenue | $ | 441,222 | $ | 61,661 | $ | (961 | ) | $ | 501,922 | $ | — | $ | 501,922 | |||||
Year Ended December 31, 2014
($ in thousands) | Townsquare | Tower Sale | NAME | Live Events Acquisitions | Townsquare Pro Forma for the Transactions | Constant Currency Adjustment | Townsquare Pro Forma for Transactions (Constant Currency) | ||||||||||||||
Local Advertising net revenue | $ | 302,648 | $ | — | $ | — | $ | — | $ | 302,648 | $ | — | $ | 302,648 | |||||||
Live Events net revenue | 40,954 | — | 92,936 | 10,845 | 144,735 | (4,778 | ) | 139,957 | |||||||||||||
Other Media and Entertainment net revenue | 30,290 | (1,342 | ) | — | — | 28,948 | — | 28,948 | |||||||||||||
Net revenue | $ | 373,892 | $ | (1,342 | ) | $ | 92,936 | $ | 10,845 | $ | 476,331 | $ | (4,778 | ) | $ | 471,553 | |||||
Year Ended December 31, 2013
($ in thousands) | Townsquare | Peak Jan. 1, 2013 - Nov. 13, 2013 | Cumulus II Jan. 1, 2013 - Nov. 13, 2013 | NAME | Live Events Acquisitions | Tower Sale | Other Divestitures | Townsquare Pro Forma for the Transactions | Constant Currency Adjustment | Townsquare Pro Forma for Transactions (Constant Currency) | ||||||||||||||||||||
Local Advertising net revenue | $ | 229,653 | $ | 7,075 | $ | 58,335 | $ | — | $ | — | $ | — | $ | (2 | ) | $ | 295,061 | $ | — | $ | 295,061 | |||||||||
Live Events net revenue | 20,851 | 165 | 1,150 | 89,809 | 17,197 | — | — | 129,172 | (5,734 | ) | 123,438 | |||||||||||||||||||
Other Media and Entertainment net revenue | 18,074 | 565 | 2,003 | — | — | (1,160 | ) | — | 19,482 | — | 19,482 | |||||||||||||||||||
Net revenue | $ | 268,578 | $ | 7,805 | $ | 61,488 | $ | 89,809 | $ | 17,197 | $ | (1,160 | ) | $ | (2 | ) | $ | 443,715 | $ | (5,734 | ) | $ | 437,981 | |||||||
61
The following table summarizes our pro forma, constant currency net revenue for the years ended December 31, 2014 and 2015:
Year Ended December 31, | $ | % | Constant Currency Year Ended December 31, | $ | % | ||||||||||||||||||||||||
($ in thousands) | 2014 | 2015 | Change | Change | 2014 | 2015 | Change | Change | |||||||||||||||||||||
Local Advertising net revenue | $ | 302,648 | $ | 303,130 | $ | 482 | 0.2 | % | $ | 302,648 | $ | 303,130 | $ | 482 | 0.2 | % | |||||||||||||
Live Events net revenue | 144,735 | 159,342 | 14,607 | 10.1 | % | 139,957 | $ | 159,342 | 19,385 | 13.9 | % | ||||||||||||||||||
Other Media and Entertainment net revenue | 28,948 | 39,450 | 10,502 | 36.3 | % | 28,948 | 39,450 | 10,502 | 36.3 | % | |||||||||||||||||||
Net revenue | $ | 476,331 | $ | 501,922 | $ | 25,591 | 5.4 | % | $ | 471,553 | $ | 501,922 | $ | 30,369 | 6.4 | % | |||||||||||||
On a pro forma consolidated basis, net revenue for the year ended December 31, 2015 increased by $25.6 million, or 5.4%, as compared to 2014. The increase resulted from a $0.5 million increase in Local Advertising net revenue, a $14.6 million increase in Live Events net revenue and a $10.5 million increase in Other Media and Entertainment net revenue as further described below. Adjusted for the effects of fluctuations in the Canadian dollar to U.S. dollar exchange rate, net revenue for the year ended December 31, 2015 increased by $30.4 million, or 6.4%, driven by an increase in constant currency Live Events net revenue of $19.4 million, or 13.9%.
On a pro forma basis, Local Advertising net revenue for the year ended December 31, 2015 increased by $0.5 million, or 0.2%, as compared to 2014. The increase was driven by an increase in non-political net revenue of $5.7 million, partially offset by a $5.2 million decrease in political revenue.
On a pro forma basis, Live Events net revenue for the year ended December 31, 2015 increased by $14.6 million, or 10.1%, as compared to 2014. This increase was primarily driven by increases in the attendance and revenue per attendee of our live events. We have continued to make strategic investments in our live event portfolio that have positively contributed to our net revenue growth. On a constant currency basis, Live Events net revenue increased by $19.4 million, or 13.9%, the difference attributable to changes in the Canadian dollar to U.S. dollar exchange rate.
On a pro forma basis, Other Media and Entertainment net revenue for the year ended December 31, 2015 increased by $10.5 million, or 36.3%, as compared to 2014. The increase was primarily driven by growth within our digital marketing solutions offering and national digital assets, partially offset by a decline in other miscellaneous revenue.
The following table summarizes our pro forma, constant currency net revenue for the years ended December 31, 2013 and 2014:
Year Ended December 31, | $ | % | Constant Currency Year Ended December 31, | $ | % | ||||||||||||||||||||||||
($ in thousands) | 2013 | 2014 | Change | Change | 2013 | 2014 | Change | Change | |||||||||||||||||||||
Local Advertising net revenue | $ | 295,061 | $ | 302,648 | $ | 7,587 | 2.6 | % | $ | 295,061 | $ | 302,648 | $ | 7,587 | 2.6 | % | |||||||||||||
Live Events net revenue | 129,172 | 144,735 | 15,563 | 12.0 | % | 123,438 | 139,957 | 16,519 | 13.4 | % | |||||||||||||||||||
Other Media and Entertainment net revenue | 19,482 | 28,948 | 9,466 | 48.6 | % | 19,482 | 28,948 | 9,466 | 48.6 | % | |||||||||||||||||||
Net revenue | $ | 443,715 | $ | 476,331 | $ | 32,616 | 7.4 | % | $ | 437,981 | $ | 471,553 | $ | 33,572 | 7.7 | % | |||||||||||||
On a pro forma consolidated basis, net revenue for the year ended December 31, 2014 increased by $32.6 million, or 7.4%, as compared to 2013. The increase was the result of a $15.6 million increase in Live Events net revenue, a $9.5 million increase in Other Media and Entertainment net revenue and a $7.6 million increase in Local Advertising net revenue as further described below. Adjusted for the effects of fluctuations in the Canadian dollar to U.S. dollar exchange rate, net revenue for the year ended December 31, 2014 increased by $33.6 million, or 7.7%, driven by an increase in Live Events net revenue of $16.5 million, or 13.4%.
62
On a pro forma basis, Local Advertising net revenue for the year ended December 31, 2014 increased by $7.6 million, or 2.6%, as compared to 2013. This increase was primarily driven by increases in political and non-political net revenue of $5.9 million and $1.7 million, respectively.
On a pro forma basis, Live Events net revenue for the year ended December 31, 2014 increased by $15.6 million, or 12.0%, as compared to 2013. The increase was primarily attributable to increases in the number, attendance and revenue per attendee of our live events. On a constant currency basis, Live Events net revenue increased by $16.5 million, or 13.4%, the difference attributable to changes in the Canadian dollar to U.S. dollar exchange rate.
On a pro forma basis, Other Media and Entertainment net revenue for the year ended December 31, 2014 increased $9.5 million, or 48.6%, as compared to 2013. The increase was primarily driven by growth within our digital marketing solutions offering and national digital assets.
Liquidity and Capital Resources
Year Ended December 31, | ||||||||||||
($ in thousands) | 2013 | 2014 | 2015 | |||||||||
Cash | $ | 45,647 | $ | 24,462 | $ | 33,298 | ||||||
Cash provided by operating activities | 26,204 | 45,262 | 25,943 | |||||||||
Cash used in investing activities | (286,170 | ) | (39,709 | ) | (71,777 | ) | ||||||
Cash provided by (used in) financing activities | 283,308 | (26,738 | ) | 54,431 | ||||||||
Net effect of foreign currency exchange rate changes | — | — | 239 | |||||||||
Net increase (decrease) in cash | $ | 23,342 | $ | (21,185 | ) | $ | 8,836 | |||||
We fund our working capital requirements through a combination of cash flows from our operating, investing and financing activities. Based on current and anticipated levels of operations and conditions in our markets and industry, we believe that our cash on hand and cash flows from our operating, investing and financing activities, including funds available under our revolving credit facility, will enable us to meet our working capital, capital expenditures, debt service and other funding requirements for at least the next twelve months. As of December 31, 2015, we had $588.8 million of outstanding indebtedness, net of deferred financing costs of $10.0 million, and we expect our debt service requirements to be approximately $32.4 million over the next twelve months. In addition, as of December 31, 2015, we have $33.3 million of cash, and $60.1 million of receivables from customers, which historically have had an average collection cycle of approximately 50 days. Additionally, we have $50.0 million of available borrowing capacity under our revolving credit facility.
Our anticipated uses of cash in the near term include working capital needs, debt payments, other obligations, and capital expenditures. However, our ability to fund our working capital needs, debt payments, other obligations, capital expenditures, and to comply with the financial covenants under our debt agreements, depends on our future operating performance and cash flow, which are in turn subject to prevailing economic conditions, increases or decreases in advertising spending, rapid changes in the highly competitive industry in which we operate and other factors, many of which are beyond our control.
Additionally, on a continual basis, we evaluate and consider strategic acquisitions and divestitures to enhance our strategic and competitive position as well as our financial performance. Any future acquisitions, joint ventures or other similar transactions will likely require additional capital and such capital may not be available to us on acceptable terms, if at all.
We closely monitor the impact of capital and credit market conditions on our liquidity as related to our floating rate debt. We also routinely monitor the changes in the financial condition of our customers and the potential impact on our results of operations.
63
Operating Activities
Cash flows provided by operating activities for the year ended December 31, 2015 were $25.9 million, primarily driven by $34.5 million in cash generated by operations, partially offset by a net increase in our operating assets and liabilities of $8.6 million. The net increase in operating assets and liabilities primarily consisted of (i) an increase of $2.0 million in accounts receivable, (ii) an increase of $6.8 million in prepaid expenses and other current assets and (iii) a decrease of $4.3 million in accrued interest due to the 2015 refinancing of our long-term debt. These changes were partially offset by a $2.9 million increase in other long-term liabilities and a $1.7 million increase in accounts payable and accrued expenses.
Cash flows provided by operating activities for the year ended December 31, 2014 were $45.3 million, primarily driven by $53.4 million in cash generated by operations, partially offset by a net decrease in our operating assets and liabilities of $8.1 million. The net decrease in operating assets and liabilities primarily consisted of (i) an increase of $6.8 million in accounts receivable driven by an increase in business activity as a result of our acquisitions in late 2013, (ii) a decrease of $3.0 million in accounts payable and accrued expense and other current liabilities as a result of timing of payments, and (iii) a $1.7 million decrease in prepaid expenses primarily relating to our live events business.
Cash flows provided by operating activities during the year ended December 31, 2013 were $26.2 million, primarily driven by $27.6 million in cash generated by operations, partially offset by a net decrease in our operating assets and liabilities of $1.4 million. This net decrease in operating assets and liabilities primarily consisted of: (i) a $4.2 million increase in accounts receivable, driven by an increase in business activity during the period as a result of our continued growth through our acquisitions, (ii) an increase of $5.2 million in prepaid expenses and other assets, driven by the increase in our live event business, offset by (iii) an increase of $5.5 million in accounts payable and accrued expenses and other liabilities as a result of timing of payments for employee bonuses, (iv) an increase of $3.4 million in accrued interest as a result of Transaction financings and (v) a decrease in other long-term liabilities of $0.9 million which primarily relates to the reversal of liabilities held for asset retirement obligations that no longer exist.
Investing Activities
Currently, our investing activities primarily relate to our continued investment in acquisitions which is consistent with our strategy to prudently invest in market leading properties. Additionally, our investing activities include payments made for capital expenditures. Cash used in investing activities for the year ended December 31, 2013, 2014 and 2015 was $286.2 million, $39.7 million and $71.8 million, respectively. Cash used in investing activities relating to acquisitions for the year ended December 31, 2013, 2014 and 2015 was $276.8 million, $26.1 million and $76.2 million, respectively. Cash used in investing activities relating to capital expenditures for the year ended December 31, 2013, 2014 and 2015 was $9.5 million, $13.5 million and $14.7 million, respectively. In the future, we anticipate capital expenditures to be consistent with prior years, but increase when adjusted for the impact of acquisitions. We believe that our capital structure provides adequate liquidity and scale for us to pursue and finance potential strategic acquisitions in the future.
Financing Activities
Cash flows provided by financing activities for the year ended December 31, 2015 were $54.4 million and primarily consisted of $620.0 million of proceeds from our new long-term borrowing arrangements, partially offset by $553.6 million of repayments of our existing debt and $11.4 million of debt financing costs paid.
Cash flows used in financing activities for the year ended December 31, 2014 were $26.7 million, and primarily consisted of (i) $88.1 million of net proceeds from our IPO, including the underwriters' overallotment shares, net of underwriters' fees and offering costs of $10.1 million, (ii) $123.7 million of debt repayments, (iii) $10.0 million of proceeds from the draw-down on our then-existing revolving credit facility to finance the WE Fest acquisition, (iv) $0.4 million in fees relating to debt financing costs, (v) $0.5 million of equity distributions and (v) $0.2 million of repayments for our capitalized lease obligations.
64
On July 24, 2014, our shares began trading on the NYSE in connection with our IPO of 8,333,333 shares of common stock, at an offering price of $11.00 per share. We received proceeds from the IPO of $82.1 million, net of underwriting discounts and commissions of $6.4 million and offering expenses of $3.2 million. Subsequently, on August 15, 2014, the underwriters of our IPO partially exercised their option to purchase additional shares electing to purchase 590,000 shares of Class A common stock at the offering price of $11.00 per share. We recognized net incremental proceeds of approximately $6.0 million, net of underwriting discounts and commissions of $0.5 million. We used substantially all of the net proceeds, together with $37.0 million of cash on hand, to repay $90.0 million of our incremental term loans and $32.2 million of our Senior PIK Notes, representing the entire outstanding balances at that time.
Cash flows provided by financing activities for the year ended December 31, 2013 were $283.3 million and primarily consisted of $287.0 million of proceeds from long-term debt, which were issued in connection with the financing of the Cumulus II and Peak transactions. Additionally, during the year ended December 31, 2013 we paid $2.4 million in fees relating to debt financing costs, as well as $1.0 million of principal payments on our then-outstanding long-term debt.
Financing Arrangements
On April 1, 2015, the Company issued $300.0 million of new 6.5% Unsecured Senior Notes due in 2023 (the "2023 Notes") and entered into a new Senior Secured Credit Facility, including a new seven year, $275.0 million term loan facility (the "New Term Loan") and a new five year, $50.0 million revolving credit facility (the "New Revolver" and together with the New Term Loan, the "New Senior Secured Credit Facility"). The New Term Loan has an initial interest rate of 4.25% (based on current LIBOR levels, a 1% LIBOR floor and an applicable margin of 325 basis points. The New Revolver has an interest rate based either on LIBOR and an applicable margin of 250 basis points, or an alternative base rate and an applicable margin of 150 basis points.
The proceeds from the 2023 Notes and New Term Loan were used to repay all previous long-term borrowings outstanding at that time. As of December 31, 2015, the Company had $298.5 million of New Term Loan borrowings, and no outstanding borrowings under the New Revolver.
On September 1, 2015, the Company issued incremental term loans of $45.0 million under the New Senior Secured Credit Facility, the proceeds of which were used to partially fund the purchase price of NAME. Further, on September 30, 2015, the Company made a $20.0 million voluntary prepayment of borrowings under the New Term Loan. The Company recognized a loss of $0.3 million on the write-off of unamortized deferred financing costs in connection with this voluntary prepayment. The write-off of the unamortized deferred financing costs is included in net loss on debt extinguishment in the Company’s Consolidated Statements of Operations for the year ended December 31, 2015.
As of December 31, 2015, the Company is in compliance with all terms and covenants of its borrowing arrangements, and has $50 million of revolving credit availability under the New Senior Secured Credit Facility. We expect our debt service requirements to be approximately $32.4 million over the next twelve months.
We have historically serviced our debt obligations from funds generated by operating activities. We believe that our cash balance, together with our remaining capacity under the New Revolver and cash generated by operating activities, will be sufficient to fund our operations, service our debt obligations and pursue our strategy for the next twelve months.
65
Contractual Obligations and Commitments
The below table reflects our estimated contractual obligations and other commercial commitments as of December 31, 2015.
Payments due by period | ||||||||||||||||||||
Less than 1 year | 1 to 3 years | 3 to 5 years | More than 5 years | Total | ||||||||||||||||
2023 Notes | $ | — | $ | — | $ | — | $ | 300,000 | $ | 300,000 | ||||||||||
New Revolver | — | — | — | — | — | |||||||||||||||
New Term Loans | — | — | — | 298,512 | 298,512 | |||||||||||||||
Capitalized obligations | 172 | 96 | 10 | — | 278 | |||||||||||||||
Interest payments (1) | 32,398 | 64,726 | 64,761 | 59,910 | 221,795 | |||||||||||||||
Significant contracts (2) | 9,225 | 10,954 | 2,982 | 2,821 | 25,982 | |||||||||||||||
Operating leases | 9,568 | 14,977 | 9,267 | 9,169 | 42,981 | |||||||||||||||
Total contractual cash obligations | $ | 51,363 | $ | 90,753 | $ | 77,020 | $ | 670,412 | $ | 889,548 | ||||||||||
(1) The interest amounts relate to our 2023 Notes and New Senior Secured Credit Facility and represent an annual amount estimated based on interest rates in effect as of December 31, 2015.
(2) Significant contracts relate to our agreements with Nielsen, the radio broadcast industry’s principal ratings service, and unconditional fee obligations which result from our advance commitments to provide rides, games and concessions at certain fairs.
In January 2016, the Company signed a lease for office space in Charlotte, North Carolina, for use by its digital marketing solutions operation. The lease commences March 1, 2016, and has a ten-year term. Initially 28,000 square feet will be leased, increasing to 51,288 square feet by year four. The annual minimum rental commitment aggregates $0.3 million at commencement of the lease, escalating to $1.3 million by year ten.
Off-Balance Sheet Arrangements
We have no material off-balance sheet arrangements or transactions.
Impact of Inflation
We do not believe inflation has a significant impact on our operations. However, there can be no assurance that future inflation would not have an adverse impact on our financial condition and results of operations.
Critical Accounting Policies and Estimates
The preparation of our annual consolidated financial statements requires management to make estimates that affect the reported amounts of assets, liabilities, revenue and expenses, and related disclosures of contingent items. Actual results could differ significantly from those estimates. The following discussion addresses the more critical accounting policies. These policies are important to the presentation of our operating results and financial position and require significant judgment or the use of estimates.
Revenue Recognition
We recognize broadcast revenue for commercial broadcasting advertisements when the commercial is broadcast. We report net revenue net of agency commissions. We calculate agency commissions based on a stated percentage applied to gross billing revenue for advertisers that use agencies. We recognize live event revenue and other non-broadcast advertising revenue as events are conducted. We derive internet revenue primarily from the sale of
66
internet-based advertising campaigns to local and national advertisers and we recognize it over the duration of the campaigns.
Allowance for Doubtful Accounts
We reduce the carrying amount of accounts receivable by a valuation allowance that reflects our best estimate of the accounts that will not be collected. In addition to reviewing delinquent accounts receivable, we consider many factors in estimating our general allowance including historical data, experience, customer types, creditworthiness and economic trends. From time to time, we may adjust our assumptions for anticipated changes in any of those or other factors expected to affect collectability. We charge off account balances against the allowance when it is probable the receivable will not be recovered.
Acquisitions and Business Combinations
We account for our business acquisitions under the purchase method of accounting in accordance with ASC, Business Combination Topic 805. We allocate the total cost of acquisitions to the underlying identifiable net assets, based on their respective estimated fair values at the date of acquisition. Goodwill represents the excess of the purchase price over the fair value of net assets acquired, including the amounts assigned to identifiable intangible assets. Determining the fair value of assets acquired and liabilities assumed requires management’s judgment and often involves the use of significant estimates and assumptions, including assumptions with respect to future cash inflows and outflows, discount rates, asset lives and market multiples, among other items. In addition, we may establish liabilities in the Company’s consolidated balance sheet related to acquired liabilities and qualifying restructuring costs and contingencies based on assumptions made at the time of acquisition. We evaluate these reserves on a regular basis to determine the adequacies of the amounts.
This standard requires an acquiring entity to recognize all the assets acquired and liabilities assumed in a transaction at the acquisition date’s fair value with limited exceptions and changes in the accounting treatment for certain specific items, including:
• | acquisition costs are generally expensed as incurred; |
• | noncontrolling interests (previously referred to as "minority interests") are valued at fair value at the acquisition date; and |
• | restructuring costs associated with a business combination are generally expensed subsequent to the acquisition date. |
Intangible Assets
We consider our FCC licenses to be indefinite lived intangibles. We evaluate our FCC licenses for impairment annually or more frequently if events or changes in circumstances indicate that the assets might be impaired. We evaluate the fair value of our FCC licenses at the unit of account level and have determined that the geographic market is the appropriate unit of accounting. We determine the fair value of our FCC licenses using an income-based approach.
We evaluate our goodwill for impairment at least on an annual basis, or when events or changes in circumstances indicate that the carrying value of such assets may not be recoverable.
Deferred Financing Costs
We capitalize deferred financing costs related to the issuance of debt and amortize them over the life of the note in such a way as to result in a constant rate of interest when applied to the amount outstanding at the beginning of any given period (the interest method). We record the amortization of these costs as interest expense, net in the consolidated statements of operations. We have early-adopted ASU 2015-03, Interest-Imputation of Interest: Simplifying
67
the Presentation of Debt Issuance Costs, and have accordingly deducted unamortized deferred financing costs as of December 31, 2014 and 2015 from the long-term debt balance in the Consolidated Balance Sheets presented herein.
Stock-based Compensation
We measure and recognize stock-based compensation expense related to stock-based transactions, including employee awards, in the consolidated financial statements based on the fair value of the award on the grant date. We estimate the fair value of option awards using the Black-Scholes option-pricing model. This model requires assumptions including the fair value of our common stock, expected volatility, expected term of the award, expected dividend yield and risk-free interest rate. We recognize stock-based compensation expense immediately as the equity awards vest.
Income Taxes
Prior to our IPO, for income tax purposes we were comprised of limited liability entities, which were not subject to federal and certain state income taxes at the entity level and Townsquare Media, 2010, Inc., formerly known as Townsquare Media, Inc. ("TMI") a corporation whose operations were subject to income taxes at the company level. Upon completion of the IPO and the conversion of the parent entity into a corporation (the "LLC Conversion") all of our operations became subject to income taxes at the corporation level. Accordingly the statements of operations for the periods prior to the LLC Conversion only reflect the income tax effect of the operations of TMI. In connection with the LLC Conversion as of July 25, 2014, we are a C corporation for federal and state income tax purposes. Income taxes are accounted for under the asset and liability method. Deferred tax assets and liabilities are recognized for the future tax consequences attributable to differences between the financial statement carrying amounts of existing assets and liabilities and their respective tax bases and operating loss and tax credit carry forwards. Deferred tax assets and liabilities are measured using enacted tax rates expected to apply to taxable income in the years in which those temporary differences are expected to be recovered or settled. The effect on deferred tax assets and liabilities of a change in tax rates is recognized in the period that includes the enactment date.
We evaluate the need for valuation allowances to reduce the deferred tax assets to realizable amounts. Management evaluates all positive and negative evidence and uses judgment regarding past and future events, including operating results, to help determine when it is more likely than not that all or some portion of the deferred tax assets may not be realized. When appropriate, a valuation allowance is recorded against deferred tax assets to offset future tax benefits that may not be realized.
We follow the provisions of ASC Topic 740, Accounting for Income Taxes. ASC Topic 740 clarifies that accounting for uncertainties in income taxes recognized in an enterprise’s financial statements. ASC Topic 740 also prescribes a recognition threshold and measurement attribute for the financial statement recognition and measurement of a tax position taken or expected to be taken in a tax return. ASC Topic 740 provides guidance on derecognition, classification, interest and penalties, disclosures and transition. As required by the uncertain tax position guidance in ASC Topic 740, we recognize the financial statement benefit of a tax position only after determining that the relevant tax authority would more likely than not sustain the position following an audit. For tax positions meeting the more-likely-than-not threshold, the amount recognized in the financial statements is the largest benefit that has a greater than fifty percent likelihood of being realized upon ultimate settlement with the relevant tax authority. We applied the uncertain tax position guidance in ASC Topic 740 to all tax positions for the years 2011 through 2014, which are the years for which the statute of limitations currently remains open. Our policy is to recognize interest and penalties accrued on unrecognized tax benefits as part of income tax expense. We did not identify any material uncertain tax positions as a result of the application of this standard.
Contingencies and Litigation
On an ongoing basis, we evaluate our exposure related to contingencies and litigation and record a liability when available information indicates that a liability is probable and estimable. We also disclose significant matters that are reasonably possible to result in a loss that is expected to be material to our operations or financial results or are probable but not estimable.
68
Recent Accounting Pronouncements
For a discussion of accounting standards updates that have been adopted or will be adopted in the future, please refer to Note 2 of the Notes to Consolidated Financial Statements.
Item 7A. Quantitative and Qualitative Disclosure about Market Risk
Interest Rate Risk
As of December 31, 2015 we were not subject to market risk from exposure to changes in interest rates with respect to borrowings under our existing 2023 Notes.
As of December 31, 2015 we were subject to market risk from exposure to changes in interest rates on borrowings under our New Senior Secured Credit Facility, specifically the impact of LIBOR interest rates on our variable rate borrowings. Based upon our December 31, 2015 outstanding term loan borrowings of $298.5 million under the New Senior Secured Credit Facility, an increase in the LIBOR interest rate of 1% would result in an increase in our annual interest expense of approximately $1.3 million. We anticipate such interest rate risk will remain a market risk exposure for the foreseeable future.
Item 8. Financial Statements and Supplementary Data
The information in response to this item is included in our consolidated financial statements, together with the report thereon of RSM US LLP, beginning on page F-1 of this Annual Report on Form 10-K, which follows the signature page hereto.
Item 9. Changes in and Disagreements with Accountants on Accounting and Financial Disclosure
Not applicable.
Item 9A. Controls and Procedures
Evaluation of Disclosure Controls and Procedures
We maintain "disclosure controls and procedures," as defined in Rules 13a-15(e) and 15d-15(e) under the Securities Exchange Act, that are designed to ensure that information required to be disclosed by a company in the reports that it files or submits under the Exchange Act is recorded, processed, summarized and reported, within the time periods specified in the SEC’s rules and forms. Disclosure controls and procedures include, without limitation, controls and procedures designed to ensure that such information is accumulated and communicated to a company’s management, including its principal executive and principal financial officers, as appropriate to allow timely decisions regarding required disclosure.
In designing and evaluating the disclosure controls and procedures, our management recognizes that any controls and procedures, no matter how well designed and operated, can provide only reasonable assurance of achieving the desired control objectives, and our management necessarily was required to apply its judgment in evaluating the cost-benefit relationship of possible controls and procedures. Furthermore, our controls and procedures can be circumvented by the individual acts of some persons, by collusion of two or more people or by management override of the control and misstatements due to error or fraud may occur and not be detected on a timely basis.
Our management, with the participation of our Chief Executive Officer and our Chief Financial Officer, has evaluated the effectiveness of our disclosure controls and procedures as of December 31, 2015, the end of the period
69
covered by this Annual Report on Form 10-K. Based upon such evaluation, our Chief Executive Officer and our Chief Financial Officer have concluded that our disclosure controls and procedures were effective as of such date.
Report of Management on Internal Control over Financial Reporting
Our management is responsible for establishing and maintaining adequate internal control over financial reporting, as defined in Rules 13a-15(f) and 15d-15(f) under the Exchange Act, for our Company. Internal control over financial reporting is a process to provide reasonable assurance regarding the reliability of our financial reporting and the preparation of financial statements for external purposes in accordance with accounting principles generally accepted in the United States of America. Internal control over financial reporting includes maintaining records that in reasonable detail accurately and fairly reflect our transactions; providing reasonable assurance that transactions and disposition of assets are recorded as necessary for preparation of our financial statements; providing reasonable assurance that receipts and expenditures are made in accordance with the authorization of our management and directors; and providing reasonable assurance that unauthorized acquisition, use or disposition of our assets that could have a material effect on the financial statements would be prevented or detected on a timely basis. Because of its inherent limitations, internal control over financial reporting is not intended to provide absolute assurance that a misstatement of our financial statements would be prevented or detected. Furthermore, our controls and procedures can be circumvented by the individual acts of some persons, by collusion of two or more people or by management override of the control and misstatements due to error or fraud may occur and not be detected on a timely basis.
Management conducted its evaluation of the effectiveness of our company’s internal controls over financial reporting based on the framework in Internal Control - Integrated Framework issued by the Committee of Sponsoring Organizations of the Treadway Commission in 2013, and concluded that our Company’s internal control over financial reporting was effective as of December 31, 2015.
Changes in Internal Controls
There was no change in our internal control over financial reporting that occurred during the period covered by this Annual Report on Form 10-K that has materially affected, or is reasonably likely to materially affect, our internal control over financial reporting.
Item 9B. Other Information
None.
70
PART III
Item 10. Directors, Executive Officers and Corporate Governance
The information required by this Item 10 is incorporated in this report by reference to the applicable information set forth in our proxy statement for the 2016 Annual Meeting of Shareholders, which we expect to file with the Securities and Exchange Commission within 120 days of our fiscal year end (the "2016 Proxy Statement").
Item 11. Executive Compensation
The information required by this Item 11 is incorporated in this report by reference to the applicable information set forth in our 2016 Proxy Statement.
Item 12. Security Ownership of Certain Beneficial Owners and Management and Related Stockholder Matters
The information required by this Item 12 is incorporated in this report by reference to the applicable information set forth in our 2016 Proxy Statement.
Item 13. Certain Relationships and Related Transactions, and Director Independence
The information required by this Item 13 is incorporated in this report by reference to the applicable information set forth in our 2016 Proxy Statement.
Item 14. Principal Accountant Fees and Services
The information required by this Item 14 is incorporated in this report by reference to the applicable information set forth in our 2016 Proxy Statement.
71
Item 15. Exhibits, Financial Statement Schedules
(a) (1)-(2) Financial Statements. The financial statements and financial statement schedule listed in the Index to Consolidated Financial Statements appearing on page F-1 of this annual report on Form 10-K are filed as a part of this report. All other schedules for which provision is made in the applicable accounting regulations of the SEC have been omitted either because they are not required under the related instructions or because they are not applicable.
2.1†*** | Asset Purchase and Exchange Agreement, dated as of April 28, 2012, among Townsquare Radio, LLC, Townsquare Media of Bloomington, Inc., Townsquare Media of Peoria, Inc. and companies set forth as Townsquare Purchasers on the signature page thereto and Cumulus Media Inc., Cumulus Broadcasting LLC, Cumulus Licensing LLC, Citadel Broadcasting Company and Radio License Holding CBC, LLC | |
2.2†*** | Asset Purchase and Exchange Agreement, dated as of August 30, 2013, among Townsquare Radio, LLC, on the one hand, and Cumulus Media Holdings Inc., Cumulus Broadcasting LLC and Cumulus Licensing LLC | |
2.3†*** | Asset Purchase Agreement, dated as of August 30, 2013, among Townsquare Radio, LLC and Cumulus Media Holdings Inc., Cumulus Broadcasting LLC, Cumulus Licensing LLC, Citadel Broadcasting Company and Radio License Holding CBC, LLC | |
2.4** | Securities Purchase Agreement by and among Townsquare Live Events, LLC, Townsquare Media, Inc., Heartland Group, LLC, Danny Huston and Jeffrey Blomsness Dated as of August 14, 2015 | |
3.1*** | Certificate of Incorporation of Townsquare Media, Inc. | |
3.2*** | Bylaws of Townsquare Media, Inc. | |
4.1**** | Indenture dated as of April 1, 2015, among Townsquare Media, Inc., the guarantors named therein and Wilmington Trust, National Association, as trustee | |
4.2**** | Form of 6.500% Senior Note due 2013 | |
4.3***** | Warrant Agreement, dated as of July 25, 2014, by and among Townsquare Media, Inc., the persons set forth on Schedule I thereto, and any other registered holders of the Warrant Certificates (as defined therein) from time to time party thereto | |
10.1**** | Credit Agreement dated as of April 1, 2015, among Townsquare Media, Inc., Royal Bank of Canada, as administrative agent and collateral agent, and the lenders and financial institutions party thereto | |
10.2**** | Guarantee and Security Agreement dated as of April 1, 2015, among Townsquare Media, Inc., the guarantors party thereto and Royal Bank of Canada, as administrative and collateral agent | |
10.3** | Incremental Agreement No. 1, dated as of September 1, 2015, among Townsquare Media, Inc. and Royal Bank of Canada as administrative agent and Incremental Term Lender | |
10.4*** | Selldown Agreement | |
10.5*** | 2014 Omnibus Incentive Plan | |
10.6*** | Form of Option Grant Agreement | |
10.7*** | Form of Option Grant at IPO | |
10.8*** | Form of Indemnification Agreement | |
10.9***** | Plan of Conversion, dated as of July 25, 2014, by and among Townsquare Media, LLC, OCM POF AIF GAP Holdings, L.P. and OCM PF/FF Radio Holdings PT, L.P. | |
10.10***** | Second Amended and Restated Registration Agreement, dated as of July 29, 2014, by and among Townsquare Media, Inc., OCM POF IV AIF GAP Holdings, L.P., OCM PF/FF Radio Holdings PT, L.P. and the other persons signatory thereto | |
72
10.11***** | Stockholders Agreement, dated as of July 29, 2014, by and among Townsquare Media, Inc., OCM POF IV GAP Holdings, L.P., OCM PF/FF Radio Holdings PT, L.P., FiveWire Media Ventures, LLC, Steven Price, Stuart Rosenstein, Alex Berkett, Scott Schatz and Dhruv Prasad. | |
21* | List of Subsidiaries of Townsquare Media, Inc. | |
23.1* | Consent of Independent Registered Public Accounting Firm | |
31.1* | Certification of Chief Financial Officer Pursuant to Rule 13a-14(a) or Rule 15d-14(a) of the Securities Exchange Act of 1934, as amended | |
31.2* | Certification of Chief Executive Officer pursuant to Rule 13a-14(a) or Rule 15d-14(a) of the Securities Exchange Act of 1934, as amended | |
32.1* | Certification of Chief Financial Officer pursuant to 18 U.S.C. 1350 | |
32.2* | Certification of Chief Executive Officer pursuant to 18 U.S.C. 1350 | |
101.INS* | XBRL Instance Document | |
101.SCH* | XBRL Taxonomy Extension Schema Document | |
101.CAL* | XBRL Taxonomy Extension Calculation Linkbase Document | |
101.DEF* | XBRL Taxonomy Extension Definition Linkbase Document | |
101.LAB* | XBRL Taxonomy Extension Label Linkbase Document | |
101.PRE* | XBRL Taxonomy Extension Presentation Linkbase Document | |
* Filed herewith. | ||
**Previously filed as an exhibit to our Quarterly Report on Form 10-Q filed on November 9, 2015. | ||
***Previously filed as an exhibit to our Registration Statement No. 333-197002 on Form S-1, as amended. | ||
****Previously filed as an exhibit to our Form 8-K filed on April 1, 2015. | ||
*****Previously filed as an exhibit to our Form 8-K filed on July 31, 2014. | ||
† Schedules have been omitted pursuant to Item 601(b)(2) of Regulation S-K. The Company hereby undertakes to
furnish supplemental copies of any of the omitted schedules upon request by the SEC.
(b) Exhibits. See Exhibits above.
(c) Financial Statement Schedules. Schedule II - Valuation and Qualifying Accounts
73
SIGNATURES
Pursuant to the requirements of Section 13 or 15(d) of the Securities Exchange Act of 1934, the registrant has duly caused this annual report on Form 10-K to be signed on its behalf by the undersigned, thereunto duly authorized, on the 26th day of February 2016.
TOWNSQUARE MEDIA, INC. | ||
By: | /s/ Stuart Rosenstein | |
Name: Stuart Rosenstein | ||
Title: Executive Vice President and Chief Financial Officer | ||
Pursuant to the requirements of the Securities Exchange Act of 1934, this annual report on Form 10-K has been signed below by the following persons on behalf of the registrant and in the capacities and on the dates indicated.
Signature | Title | |
/s/ Steven Price | Chairman and Chief Executive Officer | February 26, 2016 |
Steven Price | (Principal Executive Officer) | |
/s/ Stuart Rosenstein | Executive Vice President and Chief Financial Officer | February 26, 2016 |
Stuart Rosenstein | (Principal Financial Officer) | |
/s/ Linda Lie | Senior Vice President | February 26, 2016 |
Linda Lie | and Chief Accounting Officer | |
/s/ B. James Ford | Director | February 26, 2016 |
B. James Ford | ||
/s/ Gary Ginsberg | Director | February 26, 2016 |
Gary Ginsberg | ||
/s/ Stephen Kaplan | Director | February 26, 2016 |
Stephen Kaplan | ||
/s/ David Lebow | Director | February 26, 2016 |
David Lebow | ||
/s/ David Quick | Director | February 26, 2016 |
David Quick | ||
/s/ Amy Miles | Director | February 26, 2016 |
Amy Miles | ||
74
INDEX TO CONSOLIDATED FINANCIAL STATEMENTS
The following Consolidated Financial Statements of Townsquare Media, Inc., are included in Item 8:
F-1
REPORT OF INDEPENDENT REGISTERED PUBLIC ACCOUNTING FIRM
To the Board of Directors and Stockholders
Townsquare Media, Inc. and subsidiaries
We have audited the accompanying consolidated balance sheets of Townsquare Media, Inc. and subsidiaries as of December 31, 2014 and 2015, and the related consolidated statements of operations, comprehensive income (loss), stockholders' and members’ equity, and cash flows for each of the three years in the period ended December 31, 2015. Our audits also included the financial statement schedule of Townsquare Media, Inc. and subsidiaries listed in Item 15(a). These financial statements and financial statement schedule are the responsibility of the Company's management. Our responsibility is to express an opinion on these financial statements based on our audits.
We conducted our audits in accordance with the standards of the Public Company Accounting Oversight Board (United States). Those standards require that we plan and perform the audit to obtain reasonable assurance about whether the financial statements are free of material misstatement. The Company is not required to have, nor were we engaged to perform, an audit of its internal control over financial reporting. Our audits included consideration of internal control over financial reporting as a basis for designing audit procedures that are appropriate in the circumstances, but not for the purpose of expressing an opinion on the effectiveness of the Company’s internal control over financial reporting. Accordingly, we express no such opinion. An audit also includes examining, on a test basis, evidence supporting the amounts and disclosures in the financial statements, assessing the accounting principles used and significant estimates made by management, as well as evaluating the overall financial statement presentation. We believe that our audits provide a reasonable basis for our opinion.
In our opinion, the consolidated financial statements referred to above present fairly, in all material respects, the financial position of Townsquare Media, Inc. and subsidiaries as of December 31, 2014 and 2015, and the results of their operations and their cash flows for each of the three years in the period ended December 31, 2015, in conformity with U.S. generally accepted accounting principles. Also, in our opinion, the related financial statement schedule, when considered in relation to the basic consolidated financial statements taken as a whole, presents fairly in all material respects the information set forth therein.
/s/ RSM US LLP
New York, NY
February 26, 2016
F-2
TOWNSQUARE MEDIA, INC.
CONSOLIDATED BALANCE SHEETS
(in Thousands, Except Share Data)
December 31, 2014 | December 31, 2015 | ||||||
ASSETS | |||||||
Current assets: | |||||||
Cash | $ | 24,462 | $ | 33,298 | |||
Accounts receivable, net of allowance of $3,350 and $2,114, respectively | 61,151 | 60,143 | |||||
Prepaid expenses and other current assets | 6,416 | 9,766 | |||||
Total current assets | 92,029 | 103,207 | |||||
Property and equipment, net | 96,247 | 133,943 | |||||
Intangible assets, net | 505,839 | 517,979 | |||||
Goodwill | 242,300 | 292,953 | |||||
Investments | 484 | 5,049 | |||||
Other assets | 413 | 7,580 | |||||
Total assets | $ | 937,312 | $ | 1,060,711 | |||
LIABILITIES AND STOCKHOLDERS’ EQUITY | |||||||
Current liabilities: | |||||||
Accounts payable | $ | 6,747 | $ | 9,549 | |||
Current portion of long-term debt | 1,293 | 171 | |||||
Deferred revenue | 14,299 | 17,496 | |||||
Accrued expenses and other current liabilities | 21,339 | 29,958 | |||||
Accrued interest | 9,245 | 4,910 | |||||
Total current liabilities | 52,923 | 62,084 | |||||
Long-term debt, less current portion, (net of deferred financing costs of $9,636 and $9,962, respectively, and inclusive of bond premium of $7,203 and $0, respectively) | 528,747 | 588,657 | |||||
Deferred tax liabilities | 10,507 | 35,233 | |||||
Other long-term liabilities | 973 | 11,297 | |||||
Total liabilities | 593,150 | 697,271 | |||||
Stockholders’ equity: | |||||||
Class A common stock, par value $0.01 per share; 300,000,000 shares authorized, 9,457,242 and 9,946,354 shares issued and outstanding at December 31, 2014 and 2015, respectively | 95 | 100 | |||||
Class B common stock, par value $0.01 per share; 50,000,000 shares authorized, 3,022,484 shares issued and outstanding at December 31, 2014 and 2015, respectively | 30 | 30 | |||||
Class C common stock, par value $0.01 per share; 50,000,000 shares authorized, 4,894,480 shares issued and outstanding at December 31, 2014 and 2015, respectively | 49 | 49 | |||||
Total common stock | 174 | 179 | |||||
Additional paid-in capital | 351,984 | 361,186 | |||||
Retained earnings (deficit) | (8,439 | ) | 1,391 | ||||
Accumulated other comprehensive income | — | 44 | |||||
Non-controlling interest | 443 | 640 | |||||
Total liabilities and stockholders’ equity | $ | 937,312 | $ | 1,060,711 | |||
See Notes to Consolidated Financial Statements
F-3
TOWNSQUARE MEDIA, INC.
CONSOLIDATED STATEMENTS OF OPERATIONS
(in Thousands, Except Per Share Data)
Years Ended December 31, | |||||||||||
2013 | 2014 | 2015 | |||||||||
Net revenue | $ | 268,578 | $ | 373,892 | $ | 441,222 | |||||
Operating costs and expenses: | |||||||||||
Direct operating expenses, excluding depreciation, amortization and stock-based compensation | 187,148 | 253,440 | 317,835 | ||||||||
Depreciation and amortization | 15,189 | 16,878 | 17,577 | ||||||||
Corporate expenses | 19,190 | 24,996 | 25,411 | ||||||||
Stock-based compensation | — | 37,739 | 4,278 | ||||||||
Transaction costs | 2,001 | 217 | 1,739 | ||||||||
Change in fair value of contingent consideration | (1,100 | ) | — | — | |||||||
Impairment of FCC licenses | — | — | 1,680 | ||||||||
Net (gain) loss on sale of assets | (36 | ) | 90 | (12,029 | ) | ||||||
Total operating costs and expenses | 222,392 | 333,360 | 356,491 | ||||||||
Operating income | 46,186 | 40,532 | 84,731 | ||||||||
Other expenses: | |||||||||||
Interest expense, net | 35,620 | 46,502 | 35,979 | ||||||||
Loss on extinguishment of debt | — | — | 30,305 | ||||||||
Other expense, net | 115 | 111 | 277 | ||||||||
Income (loss) before income taxes | 10,451 | (6,081 | ) | 18,170 | |||||||
Provision for income taxes | 340 | 10,872 | 7,924 | ||||||||
Net income (loss) | $ | 10,111 | $ | (16,953 | ) | $ | 10,246 | ||||
Net income (loss) attributable to: | |||||||||||
Controlling interests | $ | 10,061 | $ | (17,372 | ) | $ | 9,830 | ||||
Non-controlling interests | 50 | 419 | 416 | ||||||||
Net (loss) income per share: | |||||||||||
Basic | $ | (1.41 | ) | $ | 0.58 | ||||||
Diluted | $ | (1.41 | ) | $ | 0.37 | ||||||
Pro forma C Corporation data (unaudited): | |||||||||||
Historical income (loss) before income taxes | $ | 10,451 | $ | (6,081 | ) | ||||||
Pro forma income tax expense (benefit) | 4,118 | (2,396 | ) | ||||||||
Pro forma net income (loss) | $ | 6,333 | $ | (3,685 | ) | ||||||
Pro forma net income (loss) per share: | |||||||||||
Basic | $ | 0.84 | $ | (0.31 | ) | ||||||
Diluted | $ | 0.37 | $ | (0.31 | ) | ||||||
Weighted average shares outstanding: | Pro Forma | Pro Forma | Actual | ||||||||
Basic | 7,569 | 12,013 | 17,537 | ||||||||
Diluted | 17,078 | 12,013 | 27,724 | ||||||||
See Notes to Consolidated Financial Statements
F-4
TOWNSQUARE MEDIA, INC.
CONSOLIDATED STATEMENTS OF COMPREHENSIVE INCOME (LOSS)
(in Thousands)
Year Ended December 31, | |||||||||||
2013 | 2014 | 2015 | |||||||||
Net income (loss) | $ | 10,111 | $ | (16,953 | ) | $ | 10,246 | ||||
Other comprehensive income, before tax: | |||||||||||
Foreign currency translation adjustment | — | — | 78 | ||||||||
Income tax benefit related to other comprehensive income | — | — | 34 | ||||||||
Other comprehensive income, net of tax benefit | $ | — | $ | — | $ | 44 | |||||
Comprehensive income (loss) | $ | 10,111 | $ | (16,953 | ) | $ | 10,290 | ||||
See Notes to Consolidated Financial Statements
F-5
TOWNSQUARE MEDIA, INC.
CONSOLIDATED STATEMENTS OF STOCKHOLDERS’ AND MEMBERS' EQUITY
(in Thousands, except Share Data)
Number of Units Outstanding | Shares of Common Stock | ||||||||||||||||||||||||||||||||||||||||||||||
Class A | Class A | Class B | Class A | Class B | Class C | ||||||||||||||||||||||||||||||||||||||||||
Preferred Units | Common Units | Common Units | Warrants | Shares | Shares | Shares | Warrants | Common Stock | Additional Paid-in Capital | Retained Earnings (Deficit) | Controlling Interest in Predecessor LLC | Non-Controlling Interest | Total | ||||||||||||||||||||||||||||||||||
Balance at January 1, 2013 | 40,351,108 | 40,351,108 | 9,790,850 | 15,609,760 | — | — | — | — | $ | — | $ | — | $ | — | $ | 207,896 | $ | 442 | $ | 208,338 | |||||||||||||||||||||||||||
Net income | — | — | — | — | — | — | — | — | — | — | — | 10,061 | 50 | 10,111 | |||||||||||||||||||||||||||||||||
Units Issued | — | — | 218,500 | — | — | — | — | — | — | — | — | — | — | — | |||||||||||||||||||||||||||||||||
Units Forfeited | — | — | (301,550 | ) | — | — | — | — | — | — | — | — | — | — | — | ||||||||||||||||||||||||||||||||
Equity issued in respect of Peak acquisition | 1,204,597 | 1,204,597 | — | 1,377,801 | — | — | — | — | — | — | — | 16,241 | — | 16,241 | |||||||||||||||||||||||||||||||||
Units repurchase and held in Treasury | — | — | — | — | — | — | — | — | — | — | — | (159 | ) | — | (159 | ) | |||||||||||||||||||||||||||||||
Balance at December 31, 2013 | 41,555,705 | 41,555,705 | 9,707,800 | 16,987,561 | — | — | — | — | $ | — | $ | — | $ | — | $ | 234,039 | $ | 492 | $ | 234,531 | |||||||||||||||||||||||||||
Net (loss) income | — | — | — | — | — | — | — | — | — | — | (30,167 | ) | $ | 12,795 | $ | 419 | $ | (16,953 | ) | ||||||||||||||||||||||||||||
Units Issued | — | — | 527,500 | — | — | — | — | — | — | — | — | — | — | — | |||||||||||||||||||||||||||||||||
Units Forfeited | — | — | (102,355 | ) | — | — | — | — | — | — | — | — | — | — | — | ||||||||||||||||||||||||||||||||
Conversion from LLC to Corporation | (41,555,705 | ) | (41,555,705 | ) | (10,132,945 | ) | (16,987,561 | ) | 433,909 | 3,022,484 | 4,894,480 | — | 84 | 225,022 | 21,728 | (246,834 | ) | — | — | ||||||||||||||||||||||||||||
Issuance of warrants to purchase class A shares conversion | — | — | — | — | — | — | — | 9,508,878 | — | — | — | — | — | — | |||||||||||||||||||||||||||||||||
Issuance of common stock in connection with initial public offering, including underwriters' overallotment shares | — | — | — | — | 8,923,333 | — | — | — | 89 | 98,068 | — | — | — | 98,157 | |||||||||||||||||||||||||||||||||
Offering costs | — | — | — | — | — | — | — | — | — | (3,219 | ) | — | — | — | (3,219 | ) | |||||||||||||||||||||||||||||||
Underwriters' fees | — | — | — | — | — | — | — | — | — | (6,871 | ) | — | — | — | (6,871 | ) | |||||||||||||||||||||||||||||||
Stock-based compensation | — | — | — | — | — | — | — | — | — | 37,739 | — | — | — | 37,739 | |||||||||||||||||||||||||||||||||
Cash distribution | — | — | — | — | — | — | — | — | — | — | — | — | (468 | ) | (468 | ) | |||||||||||||||||||||||||||||||
Issuance of common stock in connection with WE Fest acquisition | — | — | — | — | 100,000 | — | — | — | 1 | 1,245 | — | — | — | 1,246 | |||||||||||||||||||||||||||||||||
Balance at December 31, 2014 | — | — | — | — | 9,457,242 | 3,022,484 | 4,894,480 | 9,508,878 | $ | 174 | $ | 351,984 | $ | (8,439 | ) | $ | — | $ | 443 | $ | 344,162 | ||||||||||||||||||||||||||
F-6
TOWNSQUARE MEDIA, INC.
CONSOLIDATED STATEMENTS OF STOCKHOLDERS’ AND MEMBERS' EQUITY (continued)
(in Thousands, except Share Data)
Shares of Common Stock | |||||||||||||||||||||||||||||||||||
Class A | Class B | Class C | |||||||||||||||||||||||||||||||||
Shares | Shares | Shares | Warrants | Common Stock | Additional Paid-in Capital | Retained Earnings (Deficit) | Accumulated Other Comprehensive Income | Non-Controlling Interest | Total | ||||||||||||||||||||||||||
Balance at December 31, 2014 | 9,457,242 | 3,022,484 | 4,894,480 | 9,508,878 | $ | 174 | $ | 351,984 | $ | (8,439 | ) | $ | — | $ | 443 | $ | 344,162 | ||||||||||||||||||
Net income | — | — | — | — | — | — | 9,830 | — | 416 | 10,246 | |||||||||||||||||||||||||
Offering costs | — | — | — | — | — | (92 | ) | — | — | — | (92 | ) | |||||||||||||||||||||||
Stock-based compensation | — | — | — | — | — | 4,278 | — | — | — | 4,278 | |||||||||||||||||||||||||
Stock options exercised | 7,164 | — | — | — | — | 71 | — | — | — | 71 | |||||||||||||||||||||||||
Issuance of common stock in connection with NAME acquisition | 481,948 | — | — | — | 5 | 4,945 | — | — | 225 | 5,175 | |||||||||||||||||||||||||
Foreign currency exchange gain | — | — | — | 44 | — | 44 | |||||||||||||||||||||||||||||
Cash distributions | — | — | — | — | — | — | — | — | (444 | ) | (444 | ) | |||||||||||||||||||||||
Balance at December 31, 2015 | 9,946,354 | 3,022,484 | 4,894,480 | 9,508,878 | $ | 179 | $ | 361,186 | $ | 1,391 | $ | 44 | $ | 640 | $ | 363,440 | |||||||||||||||||||
See Notes to Consolidated Financial Statements
F-7
TOWNSQUARE MEDIA, INC.
CONSOLIDATED STATEMENTS OF CASH FLOWS
(in Thousands)
Year Ended December 31, | |||||||||||
2013 | 2014 | 2015 | |||||||||
Cash flows from operating activities: | |||||||||||
Net income (loss) attributable to: | |||||||||||
Controlling interests | $ | 10,061 | $ | (17,372 | ) | $ | 9,830 | ||||
Non-controlling interests | 50 | 419 | 416 | ||||||||
Net income (loss) | $ | 10,111 | $ | (16,953 | ) | $ | 10,246 | ||||
Adjustments to reconcile net income (loss) to net cash from operating activities: | |||||||||||
Depreciation and amortization | 15,189 | 16,878 | 17,577 | ||||||||
Amortization of deferred financing costs | 2,111 | 3,161 | 1,720 | ||||||||
Deferred income tax expense | — | 10,507 | 7,737 | ||||||||
Provision for doubtful accounts | 8 | 1,903 | 1,170 | ||||||||
Stock-based compensation expense | — | 37,739 | 4,278 | ||||||||
Non-cash interest expense | 392 | 1,796 | — | ||||||||
Amortization of bond premium | (221 | ) | (1,695 | ) | (424 | ) | |||||
Write-off deferred financing costs | — | — | 9,348 | ||||||||
Write-off of bond premium | — | — | (6,779 | ) | |||||||
Impairment of FCC licenses | — | — | 1,680 | ||||||||
Net (gain) loss on sale of assets | (36 | ) | 90 | (12,029 | ) | ||||||
Changes in assets and liabilities, net of acquisitions: | |||||||||||
Accounts receivable | (4,202 | ) | (6,757 | ) | (2,015 | ) | |||||
Prepaid expenses and other assets | (5,183 | ) | 1,747 | (6,805 | ) | ||||||
Accounts payable | 385 | (2,086 | ) | 33 | |||||||
Accrued expenses | 5,140 | (941 | ) | 1,657 | |||||||
Accrued interest | 3,449 | (166 | ) | (4,335 | ) | ||||||
Other long-term liabilities | (939 | ) | 39 | 2,884 | |||||||
Net cash provided by operating activities | 26,204 | 45,262 | 25,943 | ||||||||
Cash flows from investing activities: | |||||||||||
Payments for acquisitions, net of cash received | (276,799 | ) | (26,076 | ) | (76,213 | ) | |||||
Acquisition of intangibles | — | (510 | ) | (377 | ) | ||||||
Purchase of property and equipment | (9,526 | ) | (13,531 | ) | (14,724 | ) | |||||
Proceeds from sale of assets | 155 | 408 | 19,087 | ||||||||
Proceeds from insurance settlement | — | — | 450 | ||||||||
Net cash used in investing activities | (286,170 | ) | (39,709 | ) | (71,777 | ) | |||||
Cash flows from financing activities: | |||||||||||
Proceeds from stock initial public offering and underwriters' overallotment shares | — | 98,157 | — | ||||||||
Offering costs | — | (3,219 | ) | (92 | ) | ||||||
Underwriters' fees | — | (6,871 | ) | — | |||||||
Proceeds from option exercises | — | — | 72 | ||||||||
Repayment of long-term debt | (1,020 | ) | (123,746 | ) | (553,552 | ) | |||||
Proceeds from issuance of long-term debt | 287,019 | 10,000 | 620,000 | ||||||||
Debt financing costs | (2,388 | ) | (440 | ) | (11,394 | ) | |||||
Units repurchased | (159 | ) | — | — | |||||||
Cash distributions to non-controlling interest | — | (468 | ) | (444 | ) | ||||||
Repayments of capitalized obligations | (144 | ) | (151 | ) | (159 | ) | |||||
Net cash provided by (used in) financing activities | 283,308 | (26,738 | ) | 54,431 | |||||||
Net effect of foreign currency exchange rate changes | — | — | 239 | ||||||||
Net increase (decrease) in cash | 23,342 | (21,185 | ) | 8,836 | |||||||
Cash: | |||||||||||
Beginning of period | 22,305 | 45,647 | 24,462 | ||||||||
End of period | $ | 45,647 | $ | 24,462 | $ | 33,298 | |||||
See Notes to Consolidated Financial Statements
F-8
TOWNSQUARE MEDIA, INC.
CONSOLIDATED STATEMENTS OF CASH FLOWS (continued)
(in Thousands)
Year Ended December 31, | |||||||||||
2013 | 2014 | 2015 | |||||||||
Supplemental Disclosure of Cash Flow Information: | |||||||||||
Cash payments: | |||||||||||
Payments to redeem long term debt prior to maturity | $ | — | $ | — | $ | 27,735 | |||||
Interest | 31,392 | 43,361 | 38,978 | ||||||||
Income taxes | 493 | 446 | 622 | ||||||||
Barter transactions: | |||||||||||
Barter revenue - included in net revenue | 9,296 | 13,065 | 16,366 | ||||||||
Barter expense - included in direct operating expenses | 8,542 | 11,984 | 14,198 | ||||||||
Equity issued in respect of acquisitions: | |||||||||||
Members' equity, Peak acquisition | 16,241 | — | — | ||||||||
Common stock, WE Fest Acquisition | — | 1,246 | — | ||||||||
Common stock, NAME acquisition | — | — | 4,950 | ||||||||
Allocation of business acquisition to non-controlling interest: | |||||||||||
NAME | — | — | 225 | ||||||||
See Notes to Consolidated Financial Statements
F-9
TOWNSQUARE MEDIA, INC.
NOTES TO THE CONSOLIDATED FINANCIAL STATEMENTS
1. Organization and Basis of Presentation
Description of Business
On July 25, 2014, Townsquare Media, LLC converted into a Delaware corporation (the "LLC Conversion"), and was renamed Townsquare Media, Inc. The accompanying consolidated financial statements are presented post-conversion as Townsquare Media, Inc. (together with its consolidated subsidiaries, except as the context may otherwise require, "we," "us," "our," "Company," or "Townsquare").
Pursuant to the conversion, each unit and warrant to purchase units of Townsquare Media, LLC was exchanged for a number of shares of Class A, Class B or Class C common stock of Townsquare Media Inc., and warrants to purchase shares of Class A common stock of Townsquare Media, Inc. The conversion was structured to retain the relative equity interests of each of the respective equity holders of Townsquare Media, LLC in Townsquare Media, Inc.
In conjunction with the LLC Conversion, the Company's shares began trading on the New York Stock Exchange ("NYSE") in an initial public offering ("IPO") on July 24, 2014. The Company's shares are traded on NYSE under the symbol "TSQ." See Note 7 for additional information.
Nature of Business
Townsquare Media, Inc. is a media, entertainment and digital marketing solutions company principally focused on small and mid-sized markets across the United States As of December 31, 2015, our assets included 309 radio stations and more than 325 local websites in 66 U.S. markets, approximately 650 live events with nearly 18 million annual attendees in the U.S. and Canada, a digital marketing solutions company serving approximately 8,000 small to medium sized businesses, and one of the largest digital advertising networks focused on music and entertainment reaching more than 60 million unique visitors each month. Our brands include local media assets such as WYRK, KLAQ, K2 and NJ101.5; music festivals such as Mountain Jam, WE Fest and the Taste of Country Music Festival; touring lifestyle and entertainment events such as the America on Tap craft beer festival series, the Insane Inflatable 5K obstacle race series, and North American Midway Entertainment, North America’s largest mobile amusement company; and tastemaker music and entertainment owned and affiliated websites such as XXL.com, TasteofCountry.com, Loudwire.com, JustJared.com and BrooklynVegan.com.
2. Summary of Significant Accounting Policies
Basis of Presentation and Principles of Consolidation: The accompanying consolidated financial statements include the accounts of the Company and its wholly owned subsidiaries. All intercompany accounts and transactions have been eliminated in consolidation. Certain amounts in the prior year’s financial statements have been reclassified to conform to the current year’s presentation. The Company has evaluated subsequent events through the date of issuance of these financial statements.
Segment Reporting: Operating segments are organized internally by type of products and services provided. The Company has aggregated similar operating segments into two reportable segments, which are Local Advertising and Live Events. The Company reports the remainder of its business in an Other Media and Entertainment category. The Company's Local Advertising segment offers broadcast, digital and mobile advertising within our local markets. The Company's Live Events segment is composed of a diverse range of live events, which the Company creates, promotes and produces, including music concerts, multi-day music festivals, fairs, consumer expositions and trade shows, athletic events, lifestyle events and other forms of entertainment. The segment disclosure is consistent with the management decision-making process that determines the allocation of resources and the measurement of performance.
Use of Estimates: The preparation of consolidated financial statements in conformity with accounting principles generally accepted in the United States of America requires management to make estimates and assumptions that affect the reported amounts of assets and liabilities and disclosure of contingent assets and liabilities at the date of the financial statements and the reported amounts of revenue and expenses during the reporting period. Actual results could differ from those estimates.
F-10
TOWNSQUARE MEDIA, INC.
NOTES TO THE CONSOLIDATED FINANCIAL STATEMENTS
Concentrations of Credit Risk: Financial instruments which potentially subject the Company to concentrations of credit risk consist primarily of accounts receivable. The credit risk is limited due to the large number of customers comprising the Company’s customer base and their dispersion across several different geographic areas of the country.
Cash: The Company maintains its cash balances at large financial institutions throughout the United States. Accounts at the institutions are insured by the Federal Deposit Insurance Corporation. Balances in these accounts may at times exceed federally insured limits. The Company has not experienced any losses in such accounts.
Accounts Receivable and Allowance for Doubtful Accounts: The carrying amount of accounts receivable is reduced by a valuation allowance that reflects management’s best estimate of the accounts that will not be collected. In addition to reviewing delinquent accounts receivable, management considers many factors in estimating its general allowance including historical data, experience, customer types, creditworthiness and economic trends. From time to time, management may adjust its assumptions for anticipated changes in any of those or other factors expected to affect collectability. Account balances are charged off against the allowance when it is probable the receivable will not be recovered.
Property and Equipment: Property and equipment are stated at cost. Property and equipment acquired in a business combination are recorded at their estimated fair value at the date of acquisition under the purchase method of accounting. Major additions or improvements are capitalized, while repairs and maintenance are charged to expense.
Depreciation expense on property and equipment is determined on a straight-line basis. The estimated useful lives for depreciation are as follows:
Property Type | Depreciation Period in Years | |
Buildings and improvements | 10 to 39 years | |
Broadcasting equipment | 3 to 20 years | |
Rides and related equipment | 10 to 20 years | |
Computer and office equipment | 3 to 5 years | |
Furnitures and fixtures | 5 to 10 years | |
Transportation equipment | 5 to 10 years | |
Software development costs | 1 to 2 years | |
Leasehold improvements | Shorter of their useful life or remaining term | |
Upon sale or disposition of an asset, the cost and related accumulated depreciation are removed from the accounts and any loss or gain is recognized in other expense in the consolidated statements of operations.
Software Development Costs: As of December 31, 2014 and 2015, the Company had capitalized software development costs of $3.5 million and $3.9 million (net of accumulated amortization of $0.3 million and $0.3 million), respectively, in accordance with Accounting Standards Codification (“ASC”) Topic 985, Software. Costs incurred for software development prior to technological feasibility are expensed in the period incurred. Once technological feasibility is reached, which is generally at the point of time of the completion of a working model, development costs are capitalized until the product is ready for general release. Software development costs consist primarily of salary and benefits for the Company’s development and technical support staff, contractors’ fees and other costs associated with the development and localization of products and services.
Acquisitions and Business Combinations: The Company accounts for its business acquisitions under the purchase method of accounting in accordance with ASC Topic 805, Business Combinations. The total cost of acquisitions is allocated to the underlying identifiable net assets, based on their respective estimated fair values at the date of acquisition. Goodwill represents the excess of the purchase price over the fair value of net assets acquired, including the amounts assigned to identifiable intangible assets. Determining the fair value of assets acquired and liabilities assumed requires management’s judgment and often involves the use of significant estimates and assumptions,
F-11
TOWNSQUARE MEDIA, INC.
NOTES TO THE CONSOLIDATED FINANCIAL STATEMENTS
including assumptions with respect to future cash inflows and outflows, discount rates, asset lives and market multiples, among other items.
This standard requires an acquiring entity to recognize all the assets acquired and liabilities assumed in a transaction at the acquisition date’s fair value with limited exceptions and changes the accounting treatment for certain specific items, including:
• | Acquisition costs are generally expensed as incurred; |
• | Noncontrolling interests are valued at fair value at the acquisition date; and |
• | Restructuring costs associated with a business combination are generally expensed subsequent to the acquisition date. |
Intangible Assets: Intangible assets consist principally of FCC broadcast licenses and goodwill, which have been recorded at their estimated fair value as of the date of acquisition.
FCC Broadcast Licenses: FCC broadcast licenses have an indefinite useful life and therefore are not amortized. Costs associated with other definite-lived intangible assets are being amortized using the straight-line method over the term of the related agreements, which range from 1 to 39 years.
The Company evaluates the fair value of its FCC licenses at the unit of account level. Each market's broadcasting licenses are combined into a single unit of accounting for purposes of testing for impairments. The Company has determined that the geographic market is the appropriate unit of accounting. The Company evaluates its FCC licenses for impairment as of December 31, or more frequently if events or changes in circumstances indicate that the assets might be impaired. The Company determines the fair value of its FCC licenses using an income approach. This income approach attempts to isolate the local advertising income that is attributable to FCC licenses at the unit of account level. The fair value is calculated by estimating and discounting the cash flows that a typical market participant would assume could be available from similar radio stations operated as part of a group of commonly owned radio stations in a similar sized geographic radio market. The Company believes this method of valuation provides the best estimate of the fair value of the FCC licenses. The Company did not utilize a market approach as transactions involving FCC licenses are frequently private transactions that are highly dependent on the collection of assets with limited disclosure. The cost approach is not applicable as FCC licenses are not able to be re-created or duplicated. There was no impairment at December 31, 2013 and 2014. As a result of the December 31, 2015 evaluation, the Company recorded impairment charges aggregating $1.7 million pertaining to licenses in our Quad Cities and Grand Junction markets.
For purposes of testing the carrying value of the Company’s FCC licenses for impairment, the fair value of FCC licenses for each geographic market contains significant assumptions incorporating variables that are based on past experiences and judgments about future performance using industry information within each market. These variables would include, but are not limited to: (1) forecasted revenue growth rates for each geographic market; (2) profit margin for the market; (3) estimated capital expenditures and working capital requirements during the projection period; (4) risk-adjusted discount rate; and (5) expected growth rates in perpetuity to estimate terminal values. These variables are susceptible to changes in estimates, which could result in significant changes to the fair value of the FCC licenses. If the carrying amount of the FCC licenses is greater than its estimated fair value in a given geographic market, the carrying amount of the FCC license is reduced to its estimated fair value and this reduction may have a material impact on the Company’s consolidated financial condition and results of operations.
Goodwill: The purchase method of accounting requires that the excess of purchase price paid over the estimated fair value of identifiable tangible and intangible net assets of acquired businesses be recorded as goodwill. Under the provisions of ASC Topic 350, Intangibles—Goodwill and Other, goodwill is not amortized, but is reviewed for impairment at least on an annual basis, or when events or changes in circumstances indicate that the carrying value of such assets may not be recoverable. The Company evaluates goodwill for impairment at the reporting unit level and has determined that there are six reporting units with goodwill. The most material, the Local Advertising operating segment is comprised of the components representing the local advertising businesses of all geographic markets, which
F-12
TOWNSQUARE MEDIA, INC.
NOTES TO THE CONSOLIDATED FINANCIAL STATEMENTS
are aggregated into one reporting unit for testing. Other reporting units tested for goodwill impairment include national events, which includes acquired festivals and other national events businesses that are a component of the Live Events operating segment and the national digital assets which are a component of the Other Media and Entertainment operating segment.
Recoverability of goodwill is evaluated using a two-step process. The first step involves a comparison of the fair value of a reporting unit with its carrying value. For purposes of testing the carrying value of the Company's goodwill for impairment, the fair value of goodwill for each reporting unit contains significant assumptions incorporating variables that are based on past experiences and judgments about future performance using industry information. These variables would include, but are not limited to: (1) forecasted revenue growth rates; (2) profit margin; (3) estimated capital expenditures and working capital requirements during the projection period; (4) risk-adjusted discount rate; and (5) expected growth rates in perpetuity to estimate terminal values. These variables are susceptible to changes in estimates, which could result in significant changes to the fair value of the goodwill in any component within the reporting unit.
The Company also performed a reasonableness test on the fair value results for goodwill by comparing the carrying value of the Company's assets to the Company's enterprise value based on its market capitalization. The Company determined the results were reasonable.
If the carrying value of the reporting unit exceeds its fair value, the second step of the process involves a comparison of the implied fair value and carrying value of the goodwill of that reporting unit. If the carrying value of the goodwill exceeds the implied fair value of that goodwill, an impairment loss is recognized in an amount equal to the excess. Impairment losses, if any, are reflected in operating income or loss in the consolidated statements of operations for the period in which such losses are recognized.
The Company has selected December 31st as the annual valuation date. The valuations conducted as of December 31, 2013, 2014 and 2015 did not result in any goodwill impairment.
Investments: Long-term investments consist of minority holdings in companies that management believes are synergistic with Townsquare. Management does not exercise significant control over operating and financial policies of the investees, accordingly the investments are reflected under the cost method of accounting. The initial equity valuations were based upon a discounted cash flows analysis, using unobservable inputs categorized as Level 3 within the ASC 820 framework. It is impracticable to obtain these Level 3 inputs as of the reporting date, accordingly a current market valuation has not been performed. Due to the short period of time that the Company has held the investments, however, management believes that current market value is not materially different from carrying value.
Deferred Financing Costs: Deferred financing costs related to the issuance of debt are capitalized and are amortized over the life of the note in such a way as to result in a constant rate of interest when applied to the amount outstanding at the beginning of any given period (the interest method). The amortization of these costs is recorded as interest expense, net in the consolidated statements of operations. The Company has early-adopted ASU 2015-03, Interest-Imputation of Interest: Simplifying the Presentation of Debt Issuance Costs, accordingly unamortized deferred financing costs as of December 31, 2014 and 2015 have been deducted from the long-term debt balance in the Consolidated Balance Sheets presented herein.
Impairment of Long-Lived Assets: Long-lived assets (including property, equipment and intangible assets subject to amortization) to be held and used are reviewed for impairment whenever events or changes in circumstances indicate that the carrying amount of an asset may not be recoverable. The carrying amount of a long-lived asset group may not be recoverable if it exceeds the sum of the undiscounted cash flows expected to result from the use and eventual disposal of the asset group. If it were determined that the carrying amount of an asset was not recoverable, an impairment loss would be recorded. The Company determines the fair value of its long-lived assets based upon the market value of similar assets, if available, or independent appraisals, if necessary. Long-lived assets to be disposed of and/or held for sale are reported at the lower of carrying amount or fair value, less cost to sell. The fair value of assets held for sale is determined in the same manner as described for assets held and used. There was no impairment at December 31, 2013, 2014 and 2015.
F-13
TOWNSQUARE MEDIA, INC.
NOTES TO THE CONSOLIDATED FINANCIAL STATEMENTS
Self-Insurance Liabilities: The Company is self-insured for medical liability. In addition, the Company has stop loss coverage in excess of certain defined limits. Liabilities associated with the risks that are retained by the Company are estimated, in part, by considering claims experience, severity factors and other assumptions. For any legal costs expected to be incurred in connection with a loss contingency, the Company recognizes the expense as incurred.
Asset Retirement Obligations: Under the provisions of ASC 410, Asset Retirement and Environmental Obligations, the Company is required to recognize a liability for the fair value of a conditional asset retirement obligation when incurred if the fair value can be reasonably estimated. The liability is accreted to its present value each period and the capitalized cost is depreciated over the useful life of the related asset. Upon settlement of the liability, the Company settles the obligation for its recorded amount and records a gain or loss upon settlement. The obligation for equipment removal at the end of the lease term as of December 31, 2014 and 2015 was $0.9 million, which is included in other long-term liabilities in the consolidated balance sheets.
Revenue Recognition: Broadcast revenue for commercial broadcasting advertisements is recognized when the commercial is broadcast. Net revenue is reported net of agency commissions. Agency commissions are calculated based on a stated percentage applied to gross billing revenue for advertisers that use agencies. Live events revenue and other non-broadcast advertising revenue are recognized as events are conducted. Deferred revenue consists primarily of advance ticket sales on events scheduled to take place at dates in the future. Digital revenue is derived primarily from the sale of internet-based advertising campaigns to local and national advertisers and is recognized over the duration of the campaigns.
Barter Transactions: Barter transactions (advertising provided in exchange for goods and services) are reported at the estimated fair value of the products or services received. Revenue from barter transactions is recognized when advertisements are broadcast. Merchandise or services received is charged to expense when received or utilized. If merchandise or services are received prior to the broadcast of the advertising, a liability is recorded. If advertising is broadcast before the receipt of the goods or services, a receivable is recorded.
Local Marketing Agreements: At times, the Company enters into local marketing agreements (“LMAs”) in connection with the purchase or sale of radio stations. In most cases, an LMA is in effect from the signing of the acquisition agreement or shortly thereafter, through the closing date of the purchase or sale. Generally, under the contractual terms of an LMA, the buyer agrees to furnish the programming content for and provide other services to the radio stations and in return, receives the right to sell and broadcast advertising on the radio station and collect receipts for such advertising. During the period the Company operates radio stations under LMAs for the purchase of a radio station, the Company recognizes revenue and expenses for such radio stations in the same manner as for owned radio stations and includes such revenue and expenses related to such radio stations in operations from the effective dates of the LMAs.
As of December 31, 2015, the Company owned one radio station that was operated by others under an LMA, and operated one non-owned radio station. The total net revenue for the contractual portion of the LMA of the radio station(s) and its total expenses for the contractual portion of the LMA were immaterial.
Financial Instruments: ASC 825, Disclosures about Fair Value of Financial Instruments, requires the Company to disclose estimated fair values for its financial instruments. Management has reviewed its cash, accounts receivable, other current assets, accounts payable and accrued expenses and has determined that their carrying values approximate their fair value due to the short maturity of these instruments. The fair value of the Company’s long-term debt is disclosed in Note 6.
Fair Value Measurements: ASC 820, Fair Value Measurements and Disclosures (“ASC 820”), defines fair value as the price that would be received to sell an asset or paid to transfer a liability in an orderly transaction between market participants at the measurement date. ASC 820 also establishes a framework for measuring fair value and expands disclosures about fair value measurements.
F-14
TOWNSQUARE MEDIA, INC.
NOTES TO THE CONSOLIDATED FINANCIAL STATEMENTS
The fair value framework under ASC 820 provides for a fair value hierarchy that prioritizes the inputs to valuation techniques used to measure fair value. The three levels of the fair value hierarchy are as follows:
• | Level 1: Inputs are quoted prices (unadjusted) in active markets for identified assets or liabilities that the Company has the ability to access at the measurement date. |
• | Level 2: Inputs are inputs other than quoted prices included within Level 1 that are observable for the asset or liability, either directly or indirectly. Level 2 assets include quoted prices for similar assets and liabilities in active markets; quoted prices for identical or similar assets that are not active; and inputs other than quoted prices that are observable such as models. |
• | Level 3: Inputs are unobservable inputs for the asset or liability. Inputs reflect management’s best estimate of what market participants would use in pricing the asset or liability at the measurement date. |
Advertising and Promotion Costs: Costs of media advertising (including barter) and associated production costs are expensed to direct operating expenses the first time the advertising takes place. The Company recorded advertising expenses of $1.7 million, $2.5 million, and $5.1 million for the years ended December 31, 2013, 2014 and 2015, respectively.
Income Taxes: Prior to the Company’s IPO, for income tax purposes the Company was comprised of limited liability entities, which were not subject to federal and certain state income taxes at the entity level, and Townsquare Media, 2010, Inc., formerly known as Townsquare Media, Inc. ("TMI"), a corporation whose operations were subject to income taxes at the company level. Upon completion of the IPO and the LLC Conversion, all of the Company’s operations became subject to income taxes at the corporation level. Accordingly the statements of operations for the periods prior to the LLC Conversion reflect only the income tax effect of the operations of TMI. In connection with the LLC Conversion as of July 25, 2014, the Company is a C corporation for federal and state income tax purposes. Income taxes are accounted for under the asset and liability method. Deferred tax assets and liabilities are recognized for the future tax consequences attributable to differences between the financial statement carrying amounts of existing assets and liabilities and their respective tax bases and operating loss and tax credit carry forwards. Deferred tax assets and liabilities are measured using enacted tax rates expected to apply to taxable income in the years in which those temporary differences are expected to be recovered or settled. The effect on deferred tax assets and liabilities of a change in tax rates is recognized in the period that includes the enactment date.
The company has early-adopted ASU 2015-17, Balance Sheet Classification of Deferred Taxes, accordingly all deferred taxes are classified as long-term in the Consolidated Balance Sheets included herein, for all periods presented.
The Company also evaluates the need for valuation allowances to reduce the deferred tax assets to realizable amounts. Management evaluates all positive and negative evidence and uses judgment regarding past and future events, including operating results, to help determine when it is more likely than not that all or some portion of the deferred tax assets may not be realized. When appropriate, a valuation allowance is recorded against deferred tax assets to offset future tax benefits that may not be realized.
The Company follows the provisions of ASC Topic 740, Accounting for Income Taxes. ASC Topic 740 clarifies the accounting for uncertainties in income taxes recognized in an enterprise’s financial statements. ASC Topic 740 also prescribes a recognition threshold and measurement attribute for the financial statement recognition and measurement of a tax position taken or expected to be taken in a tax return. ASC Topic 740 provides guidance on derecognition, classification, interest and penalties, disclosures and transition. As required by the uncertain tax position guidance in ASC Topic 740, the Company recognizes the financial statement benefit of a tax position only after determining that the relevant tax authority would more likely than not sustain the position following an audit. For tax positions meeting the more-likely-than-not threshold, the amount recognized in the financial statements is the largest benefit that has a greater than fifty percent likelihood of being realized upon ultimate settlement with the relevant tax authority. The Company applied the uncertain tax position guidance in ASC Topic 740 to all tax positions for the years 2012 through 2015, which are the years for which the statue of limitations currently remains open. The Company’s policy is to recognize interest and penalties accrued on unrecognized tax benefits as part of income tax expense. The Company did not identify any material uncertain tax positions as a result of the application of this standard.
F-15
TOWNSQUARE MEDIA, INC.
NOTES TO THE CONSOLIDATED FINANCIAL STATEMENTS
Stock-based compensation: Stock-based compensation expense related to stock-based transactions, including employee awards, is measured and recognized in the consolidated financial statements based on the fair value of the award on the grant date. The fair value of option awards is estimated using the Black-Scholes option-pricing model. This model requires assumptions including the fair value of the Company’s common stock, expected volatility, expected term of the award, expected dividend yield and risk-free interest rate. Stock-based compensation expense is recognized as the equity awards vest.
Legal Costs: In accordance with ASC Topic 450, Contingencies, the Company accrues for estimated legal costs to be incurred in defending lawsuits and asserted claims. The Company monitors the stage of progress of its litigation matters and relates that to estimated accrual of cost to determine if any adjustments are required.
In the normal course of business, the Company is subject to various regulatory proceedings, lawsuits, claims and other matters. Additionally, from time to time the Company is engaged in various legal proceedings related to its intellectual property, employees or other matters. Although such matters are subject to many uncertainties and outcomes are not predictable with assurance, as of December 31, 2014 and 2015 management does not believe any such matters are material to the Company's consolidated operations or financial condition.
In accordance with ASC Topic 450, the Company accrued legal costs in connection with the Company's 2003 purchase of twelve radio stations from Brill Media Company LLC and related entities. On April 18, 2013, the Company received a summary judgment dismissing all claims in the Brill lawsuit and as a result, during the second quarter of 2013, the Company reversed its remaining legal liability of $2.1 million as a reduction to legal expense on the Company’s Consolidated Statements of Operations.
Recently Issued Accounting Pronouncements
In May 2014, the FASB issued ASU 2014-09, Revenue from Contracts with Customers (Topic 606). This new standard will replace all current U.S. GAAP related to revenue recognition and will eliminate all industry-specific guidance. The core principle of this new standard is that a company should recognize revenue to depict the transfer of promised goods or services to customers in an amount that reflects the consideration to which the company expects to be entitled in exchange for those goods or services. In July 2015, the FASB affirmed its proposal to defer the effective date of this new standard. As a result, public companies will apply the new revenue standard to annual reporting periods beginning after December 15, 2017. The Company is currently assessing the potential impact ASU 2014-09 will have on its financial statements.
In June 2014, the FASB issued ASU 2014-12, Compensation-Stock Compensation (Topic 718): Accounting for Share-Based Payments When the Terms of an Award Provide That a Performance Target Could Be Achieved after the Requisite Service Period. ASU 2014-12 requires a performance target that affects vesting and that can be achieved after the requisite service period to be treated as a performance condition. Compensation cost should be recognized in the period in which it becomes probable that the performance target will be achieved. ASU 2014-12 will be effective for annual periods and interim periods within those annual periods beginning after December 15, 2015, and can be applied either prospectively to new or modified awards or retrospectively to awards outstanding as of the beginning of the earliest annual period presented and to all new or modified awards thereafter. The Company has not yet selected a transition method and is currently evaluating the impact of the adoption of this standard on the Company’s consolidated financial statements. This guidance is consistent with our present practice and, accordingly, is not expected to have an impact on the Company’s consolidated financial statements.
In September 2015, the FASB issued ASU 2015-16, Business Combinations. This update amends Topic 805, Business Combinations, and requires that an acquirer recognize adjustments to estimated amounts that are identified during the measurement period in the reporting period in which the adjustment amounts are determined. Further, the amendments require that the acquirer record, in the same period’s financial statements, the effect on earnings of changes in depreciation, amortization, or other income effects, if any, as a result of the change to the estimated amounts, calculated as if the accounting had been completed at the acquisition date. The amendments also require an entity to present separately on the face of the income statement or disclose in the notes the portion of the amount recorded in current-period earnings by line item that would have been recorded in previous reporting periods if the adjustment to the
F-16
TOWNSQUARE MEDIA, INC.
NOTES TO THE CONSOLIDATED FINANCIAL STATEMENTS
estimated amounts had been recognized as of the acquisition date. ASU 2015-16 is effective for fiscal years beginning after December 15, 2015, including interim periods within those fiscal years. The Company does not believe adoption of ASU 2015-16 will have a material impact on its financial statements.
In January 2016, the FASB issued ASU 2016-01, Financial Instruments - Overall. ASU 2016-01 requires cost-method equity investments to be measured at fair value with changes in fair value recognized in net income. An entity may choose to measure equity investments that do not have readily determinable fair values at cost minus impairment, if any, plus or minus changes resulting from observable price changes in orderly transactions for the identical or a similar investment of the same issuer. The ASU simplifies the impairment assessment of equity investments without readily determinable fair values by requiring a qualitative assessment to identify impairment, and a measurement of the investment at fair value only when an impairment is qualitatively identified to exist. Additionally, ASU 2016-01 requires public business entities to use the exit price notion when measuring the fair value of financial instruments for disclosure purposes. The standard is effective for fiscal years beginning after December 15, 2017, including interim periods within those fiscal years. Early adoption is not permitted. The Company is currently assessing the potential impact ASU 2016-01 will have on its financial statements.
3. Significant Acquisitions
Country Jam Acquisition: On July 12, 2013, the Company, through a subsidiary of Townsquare Live Events LLC ("Townsquare Live Events"), purchased substantially all of the assets of Country Jam, a Colorado-based annual music festival, for $4.1 million, net of adjustments of $0.6 million. Approximately $3.7 million was paid at closing and $0.4 million was paid following the event in June 2014. The Company estimated the fair value of acquired trademarks using the relief from royalty method. This transaction has been accounted for as a business combination with $2.0 million allocated to the trademark and $2.7 million allocated to goodwill. The total amount of goodwill that is expected to be deductible for tax purposes is $2.7 million.
The purchase price allocation is as follows:
(in thousands) | |||
Trademark | $ | 1,951 | |
Goodwill | 2,749 | ||
Deferred revenue | (583 | ) | |
Total purchase price | $ | 4,117 | |
Peak Acquisition: On November 14, 2013, the Company acquired, in a business combination, 100% of the equity interests of Peak, which owned 6 radio stations in Boise, Idaho and 5 radio stations in Fresno, California, for approximately $33.9 million of cash and 2,582,398 of Class A Common Units and 2,582,398 Class A Preferred Units (or warrants to purchase the same) of Townsquare, which were valued at approximately $16.2 million. The value of the Company’s equity was determined based upon a multiple of Direct Profit as defined in the agreement. In valuing the equity securities that were part of the consideration transferred, we utilized the acquisition date fair value measured in accordance with the principles of ASC Topic 820 which reflects fair value measured from the perspective of a market participant that holds the equity securities as an asset. The valuation methodology used an income approach which took into account the pro forma Direct Profit for the trailing twelve months and applying a market participant multiple selected from a range of multiples observed for comparable companies to determine an enterprise value. Enterprise value was adjusted for cash on hand, and indebtedness to determine the equity value. The selection of the multiple used required significant judgment.
Prior to the Company’s consummation of Peak, Oaktree owned 33% of the equity of Peak. For financial reporting purposes, the equity interest owned by Oaktree was transferred to the Company and accounted for as a transaction between entities under common control. Upon consummation of the Peak transaction, the Company obtained a controlling interest in Peak, which was subsequently renamed Lyla Acquisition Company, LLC ("Lyla").
F-17
TOWNSQUARE MEDIA, INC.
NOTES TO THE CONSOLIDATED FINANCIAL STATEMENTS
In connection with this transaction, Townsquare Radio, LLC, the Company's wholly-owned indirect subsidiary ("Townsquare Radio") borrowed $37.0 million in incremental term loans under the Company’s then-existing Credit Agreement with a syndicate of banks, led by General Electric Capital as Administrative Agent (see Note 6—Long-Term Debt).
The purchase price was allocated to the tangible and intangible assets and liabilities at their fair value at the date of acquisition, with any excess of the purchase price over the net assets acquired being reported as goodwill. The total amount of goodwill that is expected to be deductible for tax purposes is $25.8 million. The valuation considered a number of factors, including valuations or appraisals, in determining the fair values of individual assets. The fair value of the FCC licenses was determined on the same basis as discussed in Note 2—Intangible Assets.
The purchase price and fair value of previously owned interests is as follows:
(in thousands) | |||
Accounts receivable | $ | 3,499 | |
Other current assets | 241 | ||
Property and equipment | 8,364 | ||
Goodwill | 25,802 | ||
Other intangibles – advertising relationships | 400 | ||
FCC licenses | 14,500 | ||
Accounts payable and accrued expenses | (2,657) | ||
Total | $ | 50,149 | |
Cumulus II Acquisition: On November 14, 2013, the Company through its subsidiary, Zader Acquisition Company, LLC ("Zader"), acquired through an asset purchase, certain radio stations and related assets and liabilities of Cumulus Media, Inc. and its subsidiaries. The Company acquired substantially all of the assets and liabilities of 50 radio stations in Danbury, Connecticut; Rockford, Illinois; Cedar Rapids and Waterloo, Iowa; Quad Cities, Iowa-Illinois; Portland, Maine; Battle Creek, Kalamazoo and Lansing, Michigan; Faribault-Owatonna and Rochester, Minnesota; and Portsmouth-Dover-Rochester, New Hampshire, for approximately $235.9 million in cash, net of adjustments at closing.
In connection with this transaction, the Company and Townsquare Radio entered into a number of financing commitments with various financial institutions. Townsquare Radio borrowed $65.0 million incremental term loans under the Company’s then-existing Credit Agreement with a syndicate of banks, led by General Electric Capital as Administrative Agent (see Note 6—Long-Term Debt). Additionally, Townsquare Radio issued $145.9 million of 9% Unsecured Senior Notes due in April 2019 as an add-on to its then-existing Notes. The Company issued $30.0 million of 10.0% Senior PIK Notes due in 2019 to complete the financing for the transaction.
The purchase price was allocated to the tangible and intangible assets and liabilities at their fair value at the date of acquisition, with any excess of the purchase price over the net assets acquired being reported as goodwill. The total amount of goodwill that is expected to be deductible for tax purposes is $101.0 million. The valuation considered a number of factors, including valuations or appraisals, in determining the fair values of individual assets. The fair value of the FCC licenses was determined on the same basis as discussed in Note 2—Intangible Assets.
F-18
TOWNSQUARE MEDIA, INC.
NOTES TO THE CONSOLIDATED FINANCIAL STATEMENTS
The purchase price allocation for the acquisitions described is as follows:
(in thousands) | |||
Accounts receivable | $ | 9,677 | |
Other current assets | 521 | ||
Property and equipment | 16,436 | ||
Goodwill | 101,022 | ||
Other intangibles – advertising relationships | 4,400 | ||
FCC licenses | 107,500 | ||
Accounts payable and accrued expenses | (3,642) | ||
Total purchase price | $ | 235,914 | |
As a result of the above transaction, KCRR(FM), KKHQ(FM) and KOEL(FM) in Waterloo, Iowa, were placed into a trust pursuant to a trust agreement which complies with Communications Laws.
Cumulus Asset Exchange: On November 14, 2013, the Company purchased through an asset exchange, the assets and certain liabilities, including 15 radio stations owned by Cumulus Media, Inc. and its subsidiaries in and around Dubuque, Iowa and Poughkeepsie, New York ("Cumulus Asset Exchange"). In exchange for these assets and liabilities, the Company agreed to transfer to Cumulus Media, Inc. the assets and certain liabilities, including 5 radio broadcast stations in Fresno, California acquired by the Company from Peak. In exchange for the 5 radio stations in Fresno, California, the Company used a valuation model that utilized a multiple of Direct Profit (as defined) to determine the value of non-monetary assets. The Company received approximately $0.9 million in cash from Cumulus pursuant to the exchange. In valuing the non-monetary assets that were part of the consideration transferred, we utilized the acquisition date fair value measured in accordance with the principles of ASC Topic 820 which reflects fair value measured from the perspective of a market participant. The valuation methodology used an income approach which took into account the pro forma Direct Profit for the trailing twelve months and applied a market participant multiple selected from a range of multiples observed for comparable companies. The selection of the multiple used required significant judgment.
The purchase price was allocated to the tangible and intangible assets and liabilities at their fair value at the date of acquisition, with any excess of the purchase price over the net assets acquired being reported as goodwill. The total amount of goodwill that is expected to be deductible for tax purposes is $8.9 million. The valuation considered a number of factors, including valuations or appraisals, in determining the fair values of individual assets. The fair value of the FCC licenses was determined on the same basis as discussed in Note 2—Intangible Assets.
The allocation of the purchase price and cash consideration received is as follows:
(in thousands) | |||
Accounts receivable | $ | 1,377 | |
Other current assets | 76 | ||
Property and equipment | 3,016 | ||
Goodwill | 8,945 | ||
Other intangibles – advertising relationships | 500 | ||
FCC licenses | 18,500 | ||
Accounts payable and accrued expenses | (248 | ) | |
Total purchase price | 32,166 | ||
Less: Fair value of radio stations exchanged | (33,074) | ||
Total cash consideration received | $ | (908 | ) |
MAC Events Acquisition: On November 20, 2013, the Company through a wholly owned subsidiary, Townsquare Expos, LLC, acquired substantially all of the assets of MAC Events, LLC (“MAC Events”), a New Jersey-based consumer and trade show producer, for approximately $3.4 million in cash net of adjustments. The total amount of goodwill that is expected to be deductible for tax purposes is $2.9 million.
F-19
TOWNSQUARE MEDIA, INC.
NOTES TO THE CONSOLIDATED FINANCIAL STATEMENTS
The purchase price allocation is as follows:
(in thousands) | |||
Accounts receivable | $ | 562 | |
Other current assets | 425 | ||
Trademark | 1,073 | ||
Goodwill | 2,947 | ||
Deferred revenue | (1,313) | ||
Accounts payable | (307) | ||
Total purchase price | $ | 3,387 | |
WE Fest Acquisition: On October 31, 2014, the Company through a subsidiary of Townsquare Live Events, purchased substantially all of the assets of FACE, Festivals and Concert Events, Inc. ("WE Fest"), for approximately $21.5 million, net of closing adjustments, and 100,000 of the Company's Class A common shares valued at $1.2 million. Cash consideration was satisfied from cash on hand, a $10.0 million draw-down on the Company's then-existing revolving credit facility and a working capital adjustment of approximately $3.7 million. The Company estimated the fair value of acquired trademarks using the relief from royalty method. This transaction was accounted for as a business combination with $3.4 million allocated to the trademark and $22.2 million allocated to goodwill. The total amount of goodwill that is expected to be deductible for tax purposes is $22.2 million.
The purchase price allocation is as follows:
(in thousands) | |||
Current assets | $ | 197 | |
Trademark | 3,402 | ||
Property and Equipment | 890 | ||
Goodwill | 22,208 | ||
Deferred revenue | (3,922) | ||
Total purchase price | $ | 22,775 | |
NAME Acquisition: On September 1, 2015, the Company, through its subsidiary Townsquare Live Events, LLC, purchased all of the issued and outstanding membership interests of Heartland Group, LLC, and its wholly-owned subsidiary North American Midway Entertainment ("NAME"), for approximately $70.0 million in cash, 481,948 unregistered shares of the Company's Class A common shares valued at $4.9 million, and a working capital adjustment of $0.4 million. Cash consideration was satisfied from cash on hand and $45.0 million of incremental term loan borrowings, with $1.3 million remaining payable as of December 31, 2015. The Company estimated the fair value of acquired intangibles using the discounted cash flow method. The purchase price was allocated to the tangible and intangible assets and liabilities at their fair value at the date of acquisition, with any excess of the purchase price over the net assets acquired being reported as goodwill. The Company expects none of this goodwill to be deductible for tax purposes. The Company has recognized an opening deferred tax liability in connection with the acquisition of NAME, as the initial tax basis of the acquired assets differ from their initial basis under GAAP, which reflects estimated fair market value. Refer to Note 8 for more information regarding the income tax effects of the NAME acquisition.
The NAME purchase price allocation is shown in the following table. It includes such adjustments to our preliminary allocation as were necessary to reflect the more complete information that was available as of December 31, 2015.
F-20
TOWNSQUARE MEDIA, INC.
NOTES TO THE CONSOLIDATED FINANCIAL STATEMENTS
(in thousands) | |||
Current assets | $ | 5,148 | |
Customer relationships | 8,700 | ||
Trade name | 4,600 | ||
Other intangibles | 1,000 | ||
Property and Equipment | 42,894 | ||
Goodwill | 39,866 | ||
Accounts payable and accrued expenses | (9,586) | ||
Deferred tax liability | (17,035) | ||
Non-controlling interest | (225) | ||
Total purchase price | $ | 75,362 | |
Pro-Forma Results: The following table illustrates the unaudited pro forma information reflecting net revenue and net income (loss) for the years ended December 31, 2013, 2014 and 2015 as if the above acquisitions, as well as certain other non-significant transactions, had occurred as of the beginning of the comparable prior annual reporting period. The unaudited pro forma amounts are for informational purposes only and do not purport to represent what the Company’s actual results of operations would have been if the transactions had been completed as of January 1, 2013 or any other historical date, nor is it reflective of the Company’s expected actual results of operations for any future periods.
Year ended December 31, | |||||||||||
2013 | 2014 | 2015 | |||||||||
Net revenue | $ | 444,879 | $ | 477,673 | $ | 502,883 | |||||
Net income (loss) | $ | 35,374 | $ | (10,046 | ) | $ | 11,263 | ||||
4. Property and Equipment
(in thousands) | |||||||
December 31, 2014 | December 31, 2015 | ||||||
Land and improvements | $ | 25,275 | $ | 20,329 | |||
Buildings and leasehold improvements | 30,889 | 32,997 | |||||
Broadcast equipment | 71,002 | 70,656 | |||||
Rides and related equipment | — | 40,369 | |||||
Computer and office equipment | 8,093 | 10,742 | |||||
Furniture and fixtures | 5,460 | 7,428 | |||||
Transportation equipment | 7,622 | 11,543 | |||||
Software development costs | 13,366 | 17,571 | |||||
161,707 | 211,635 | ||||||
Less: Accumulated depreciation and amortization | (65,460 | ) | (77,692 | ) | |||
Property and equipment, net | $ | 96,247 | $ | 133,943 | |||
Depreciation and amortization expense was $14.0 million, $14.8 million and $14.7 million for the years ended December 31, 2013, 2014 and 2015, respectively.
In September 2015, the Company closed on the sale of 43 towers located on 41 sites in 28 markets to a subsidiary of Vertical Bridge, LLC ("Vertical Bridge"). The divested towers house antenna that broadcast certain of the Company’s radio stations. The Company also entered into an agreement with Vertical Bridge whereby Vertical Bridge will serve as the exclusive marketing agent for the over 282 towers retained by the Company. The Company received total cash proceeds of $21.6 million, net of closing adjustments, in exchange for the sale of the towers and
F-21
TOWNSQUARE MEDIA, INC.
NOTES TO THE CONSOLIDATED FINANCIAL STATEMENTS
the exclusive marketing arrangement. In addition, the Company has leased a portion of the space on the sold towers that house certain of the Company's antenna. The lease is for a period of 35 years, including an initial term of 20 years and three optional 5-year renewal periods. The Company will pay $41 of rent per annum ($1 per site per annum) to Vertical Bridge for the right to house its existing antenna on the divested towers.
The Company has determined that the relative fair value of the towers sold and the exclusive marketing arrangement were $25.8 million and $3.1 million, respectively. The following has been recognized in the Company's consolidated balance sheet at December 31, 2015 in connection with this transaction with Vertical Bridge:
($ in thousands) | Fair Value | Balance Sheet Location | |||
Long-term prepaid rent asset | $ | 7,311 | Other long term assets | ||
Deferred gain on the sale of towers | $ | 7,311 | Other long term liabilities | ||
Exclusive marketing arrangement | $ | 3,111 | Other long term liabilities | ||
The Company realized an $11.5 million gain in connection with the sale of these towers during the year ended December 31, 2015, which is included in net gain on sale in the Company's consolidated statements of operations. In addition, the Company determined that the lease is an operating lease and is amortizing the long-term prepaid rent asset and deferred gain on the sale of towers as offsetting amounts over the lease term. The exclusive marketing arrangement is being amortized to net revenue over the 5-year term of the arrangement in the Company's consolidated statements of income.
5. Goodwill and Other Intangible Assets
Indefinite-lived assets consist of FCC broadcast licenses and goodwill. FCC licenses represent a substantial portion of the Company’s total assets. The FCC licenses are renewable in the ordinary course of business, generally for a maximum of eight years. The fair value of FCC licenses is primarily dependent on the future cash flows of the radio markets and other assumptions, including, but not limited to, forecasted revenue growth rates, profit margins and a risk-adjusted discount rate.
The Company has selected December 31st as the annual valuation date. Based on the results of the Company’s 2015 annual impairment evaluations, the Company recorded impairment charges aggregating $1.7 million pertaining to FCC licenses in our Quad Cities and Grand Junction markets. All other fair values of the Company’s intangibles exceeded their carrying value, therefore, no impairment of these assets had occurred as of the date of the annual tests. If market conditions and operational performance of the Company’s reporting units were to deteriorate and management had no expectation that the performance would improve within a reasonable period of time or if an event occurs or circumstances change that would reduce the fair value of its goodwill and intangible assets below the amounts reflected in the balance sheet, the Company may be required to recognize additional impairment charges in future periods.
The following represents the changes in goodwill for the years ended December 31, 2014 and 2015:
(in thousands) | |||
Balance December 31, 2013 | $ | 217,150 | |
WE Fest acquisition | 22,208 | ||
Live Events acquisitions | 1,787 | ||
Other Media and Entertainment acquisitions | 1,155 | ||
Balance December 31, 2014 | 242,300 | ||
NAME acquisition | 39,866 | ||
Live Events acquisitions | 10,674 | ||
Local Advertising acquisitions | 113 | ||
Balance, December 31, 2015 | $ | 292,953 | |
F-22
TOWNSQUARE MEDIA, INC.
NOTES TO THE CONSOLIDATED FINANCIAL STATEMENTS
Intangible assets consist of the following:
(in thousands) | |||||||||
Estimated Useful Life | December 31, 2014 | December 31, 2015 | |||||||
Intangible Assets: | |||||||||
FCC licenses | Indefinite | $ | 487,804 | $ | 486,229 | ||||
Trademarks and trade names | Indefinite | — | 4,600 | ||||||
Customer and advertising relationships | 10 years | 14,317 | 23,017 | ||||||
Leasehold interests | 5 to 39 years | 1,085 | 1,085 | ||||||
Tower space | 3 to 9 years | 637 | 454 | ||||||
Sports broadcast rights | 1 to 2 years | 665 | 665 | ||||||
Non-compete agreements | 1 to 2 years | 243 | 243 | ||||||
Trademarks and trade names | 15 years | 9,438 | 12,258 | ||||||
Other intangibles | 3 years | 500 | 980 | ||||||
Total | 514,689 | 529,531 | |||||||
Less: Accumulated amortization | (8,850 | ) | (11,552 | ) | |||||
Net amount | $ | 505,839 | $ | 517,979 | |||||
Amortization expense for definite-lived intangible assets for the years ended December 31, 2013, 2014 and 2015 was $1.2 million, $2.0 million and $2.9 million, respectively.
Estimated future amortization expense for each of the five succeeding fiscal years and thereafter as of December 31, 2015 is as follows:
(in thousands) | |||
2016 | $ | 3,658 | |
2017 | 3,477 | ||
2018 | 2,628 | ||
2019 | 2,505 | ||
2020 | 2,433 | ||
Thereafter | 12,449 | ||
$ | 27,150 | ||
F-23
TOWNSQUARE MEDIA, INC.
NOTES TO THE CONSOLIDATED FINANCIAL STATEMENTS
6. Long-Term Debt
Long-term debt consisted of the following:
(in thousands) | |||||||
December 31, 2014 | December 31, 2015 | ||||||
Townsquare: | |||||||
2023 Notes | $ | — | $ | 300,000 | |||
New Term Loans | — | 298,512 | |||||
Capitalized lease obligations | 409 | 278 | |||||
Townsquare Radio: | |||||||
2019 Notes (inclusive of bond premium of $7,203 and $0, respectively) | $ | 418,103 | $ | — | |||
Term loans | 111,164 | — | |||||
Revolver | 10,000 | — | |||||
539,676 | 598,790 | ||||||
Deferred financing costs | (9,636 | ) | (9,962 | ) | |||
530,040 | 588,828 | ||||||
Less: current portion of long-term debt | (1,293 | ) | (171 | ) | |||
$ | 528,747 | $ | 588,657 | ||||
On April 1, 2015, the Company issued $300.0 million of new 6.5% Unsecured Senior Notes due in 2023 (the "2023 Notes") and entered into a new Senior Secured Credit Facility, including a new seven year, $275.0 million term loan facility (the "New Term Loan") and a new five year, $50.0 million revolving credit facility (the "New Revolver" and together with the New Term Loan, the "New Senior Secured Credit Facility"). The 2023 Notes are subject to certain prepayment premiums in the event of redemption prior to their scheduled maturity. The New Senior Secured Credit Facility is subject to mandatory pre-payment upon the occurrence of certain events, including the incurrence of additional debt by the Company or its subsidiaries other than certain permitted debt, and certain asset sales.
At December 31, 2015, the New Term Loan continued to bear interest at its initial interest rate of 4.25% (based on current LIBOR levels, a 1% LIBOR floor and an applicable margin of 325 basis points). The New Revolver has an interest rate based either on LIBOR and an applicable margin of 250 basis points, or an alternative base rate and an applicable margin of 150 basis points. As of December 31, 2015, the Company had no outstanding borrowings under the New Revolver.
The proceeds from the 2023 Notes and New Term Loan were used to redeem the 9% Unsecured Senior Notes due April 2019 issued by Townsquare Radio together with Townsquare Radio, Inc., as co-borrowers (the "2019 Notes"), and repay all outstanding borrowings under Townsquare Radio's then-existing Senior Secured Credit Facility, including a $10.0 million revolving credit facility. The Company paid $27.7 million in redemption premiums to holders of the 2019 Notes in connection with the redemption. In addition, the Company recognized a loss of $9.1 million and a gain of $6.8 million on the write-off of unamortized deferred financing costs and bond premium, respectively in connection with these repayments. The payment to holders of the 2019 Notes and the write-off of the unamortized deferred financing costs and bond premium are included in net loss on debt extinguishment in the Company’s Consolidated Statements of Income for the year ended December 31, 2015.
On September 1, 2015, the Company issued incremental term loans of $45.0 million under the New Senior Secured Credit Facility, the proceeds of which were used to partially fund the purchase price of NAME. Further, on September 30, 2015, the Company made a $20.0 million voluntary prepayment of borrowings under the New Term Loans. The Company recognized a loss of $0.3 million on the write-off of unamortized deferred financing costs in connection with this voluntary prepayment. The write-off of the unamortized deferred financing costs is included in
F-24
TOWNSQUARE MEDIA, INC.
NOTES TO THE CONSOLIDATED FINANCIAL STATEMENTS
net loss on debt extinguishment in the Company’s Consolidated Statements of Operations for the year ended December 31, 2015.
The 2023 Notes mature on April 1, 2023, with interest payable on April 1 and October 1 of each year. Prior to maturity, the Company may redeem all or part of the 2023 Notes at specified redemption premiums as set forth in the indenture, together with any accrued and unpaid interest thereon. Additionally, if the Company experiences certain change of control events, holders of the 2023 Notes may require the Company to repurchase all or part of their notes at 101% of the principal amount thereof.
The 2023 Notes rank equally with all of the Company's existing and future senior debt, are senior to all of the Company's existing and future subordinated debt, and are guaranteed on a senior basis by certain of the Company’s direct and indirect wholly-owned subsidiaries.
The 2023 Notes indenture contains restrictive covenants that limit the ability of the Company and its subsidiaries to, among other things, incur additional debt or issue preferred stock; create liens; create restrictions on the Company’s subsidiaries’ ability to make payments to the Company; pay dividends and make other distributions in respect of the Company’s and its subsidiaries’ capital stock; make certain investments or certain other restricted payments; guarantee indebtedness; designate unrestricted subsidiaries; sell certain kinds of assets; enter into certain types of transactions with affiliates; and effect mergers and consolidations.
The New Term Loan matures on April 1, 2022, and the New Revolver matures on April 1, 2020. Borrowings under the New Senior Secured Credit Facility are subject to mandatory prepayments equal to the net proceeds to the Company of any additional debt issuances or asset sales, as well as half of annual excess cash flow as defined (subject to certain reductions). Borrowings are guaranteed by each of the Company’s direct and indirect subsidiaries, and subject to certain exceptions, are secured by substantially all of the tangible and intangible assets of the Company and its subsidiaries.
The New Senior Secured Credit Facility contains covenants that, among other things, limit or restrict the ability of the Company and its subsidiaries to incur additional indebtedness or liens; engage in mergers or other fundamental changes; sell certain property or assets; pay dividends or other distributions; make acquisitions, investments, loans and advances; prepay certain indebtedness including the 2023 Notes; change the nature of its business; engage in certain transactions with affiliates and incur restrictions on interactions between the Company and its subsidiaries, or limit actions in relation to the New Senior Secured Credit Facility.
The Company is in compliance with its covenants under the 2023 Notes and the New Senior Secured Credit Facility as of December 31, 2015.
Based on available market information, as of December 31, 2015, the estimated fair value of the 2023 Notes and the New Term Loans were $271.8 million and $294.0 million, respectively.
As of December 31, 2015, annual maturities of the Company's long-term debt for each of the next five fiscal years are as follows:
(in thousands) | |||
2016 | $ | 172 | |
2017 | 91 | ||
2018 | 5 | ||
2019 | 5 | ||
2020 | 5 | ||
Thereafter | 598,512 | ||
$ | 598,790 | ||
F-25
TOWNSQUARE MEDIA, INC.
NOTES TO THE CONSOLIDATED FINANCIAL STATEMENTS
7. Stockholders' Equity
The table below presents a summary, as of December 31, 2015, of our authorized and outstanding common stock, and securities convertible into common stock, excluding options issued under our 2014 Omnibus Incentive Plan.
Security1 | Par Value Per Share | Number Authorized | Number Outstanding | Description | |||
Class A common stock | $ | 0.01 | 300,000,000 | 9,946,354 | One vote per share. | ||
Class B common stock | $ | 0.01 | 50,000,000 | 3,022,484 | 10 votes per share.2 | ||
Class C common stock | $ | 0.01 | 50,000,000 | 4,894,480 | No votes.2 | ||
Warrants | 9,508,878 | Each warrant is exercisable for one share of Class A common stock, at an exercise price of $0.0001 per share. The aggregate exercise price for all warrants currently outstanding is $951.3 | |||||
Total | 400,000,000 | 27,372,196 | |||||
1 Each of the shares of common stock, including the shares of Class A common stock issuable upon exercise of the warrants, have equal economic rights. | |||||||
2 Each share converts into one share of Class A common stock upon transfer or at the option of the holder, subject to certain conditions, including compliance with FCC rules. | |||||||
3 The warrants are fully vested and exercisable for shares of Class A common stock, subject to certain conditions, including compliance with FCC rules. | |||||||
The foregoing share totals exclude 3,527,141 of Class A common stock and 3,802,193 of Class B common stock issuable upon exercise of stock options, which options have an exercise price of between $10.63 and $13.02 per share. Additionally, the Company is authorized to issue 50,000,000 shares of undesignated preferred stock.
On July 24, 2014, the Company's shares began trading on the NYSE in connection with its IPO, whereby the Company issued and sold 8,333,333 shares of its Class A common stock, at an offering price of $10.63 per share. The Company received net proceeds from the IPO of $82.1 million, net of underwriting discounts and commissions of $6.4 million and offering costs of $3.2 million. Subsequently, on August 15, 2014, the underwriters of the Company's IPO partially exercised their option to purchase additional shares, electing to purchase 590,000 shares of Class A common stock at the offering price of $11.00 per share. The Company recognized net incremental proceeds of approximately $6.0 million, net of underwriting discounts and commissions of $0.5 million. Offering costs incurred as of December 31, 2014 of $3.2 million were recorded as a reduction in paid-in capital. The Company used substantially all of the net proceeds from the IPO, together with approximately $37.0 million of cash on hand, to repay its then-outstanding Senior PIK Notes due in 2019 in their entirety and $90.0 million of the then-outstanding term loans under the Company's Senior Secured Credit Facility.
On October 31, 2014, in connection with the purchase of WE Fest, the Company issued an additional 100,000 shares of Class A common stock. On September 1, 2015, in connection with the purchase of NAME, the Company issued an additional 481,948 shares of Class A common stock. These transactions are more fully described in Note 3.
In connection with the LLC Conversion, the Company replaced its existing management equity compensation program with 186,922 shares of the Company’s Class A common stock and 267,624 shares of the Company’s Class B common stock and a new grant of options to purchase 3,082,298 shares of Class A common stock and options to purchase 3,876,040 shares of Class B common stock, in each case based on the offering price of $11.00 per share. This was the result of the conversion of the Company’s outstanding Class B incentive units, which constituted the Company’s management equity compensation program, into the shares of Class A common stock and Class B common stock pursuant to the conversion, and via a grant of the options following the conversion but prior to the completion of the offering. The options granted have an exercise price equal to the public offering price. In connection with these grants, in the third calendar quarter of 2014, the Company recorded a one-time, non-recurring, non-cash stock based
F-26
TOWNSQUARE MEDIA, INC.
NOTES TO THE CONSOLIDATED FINANCIAL STATEMENTS
compensation expense, of approximately $37.6 million. This amount consisted of approximately $5.0 million with respect to the conversion of Class B units into shares of Class A common stock and Class B common stock, and approximately $32.6 million with respect to the options granted. The Company does not expect to record any future stock-based compensation expense in connection with the conversion of its Class B units pursuant to the Conversion or the grant of options described above.
Holders of shares of Class A common stock, Class B common stock and Class C common stock vote together as a single class on all matters presented to the Company's stockholders for their vote or approval, except as otherwise required by applicable law. Each holder of the Company's Class A common stock is entitled to one vote per share on each matter submitted to a vote of stockholders. The Company's Class A common stock is neither convertible nor redeemable. Each holder of the Company's Class B common stock is entitled to ten votes per share on each matter submitted to a vote of stockholders. The Company's Class B common stock is not redeemable, but is convertible 1:1 (including automatically upon certain transfers) into Class A common stock. Holders of shares of Class C common stock are not entitled to any voting rights with respect to such shares. The Company's Class C common stock is not redeemable, but is convertible 1:1 (including automatically upon certain transfers) into Class A common stock.
The Company's common stock is not entitled to preemptive or other similar subscription rights to purchase any of our securities. Unless the Company's Board of Directors determines otherwise, we will issue all of our capital stock in uncertificated form.
Stock-based Compensation
On July 21, 2014 the Board of Directors approved the 2014 Omnibus Incentive Plan (the "2014 Incentive Plan"), which provides for grants of stock options, stock appreciation rights, restricted stock, other stock-based awards and other cash-based awards. Directors, officers and other employees of the Company and its subsidiaries, as well as others performing consulting or advisory services for the Company, are eligible for grants under the 2014 Incentive Plan. The purpose of the 2014 Incentive Plan is to provide incentives that will attract, retain and motivate high performing officers, directors, employees and consultants by providing them with appropriate incentives and rewards either through a proprietary interest in our long-term success or compensation based on their performance in fulfilling their personal responsibilities. The aggregate number of shares of common stock which may be issued or used for reference purposes under the 2014 Incentive Plan or with respect to which awards may be granted may not exceed 12,000,000 shares. As of December 31, 2015, 4,208,956 shares were available for grant.
The fair value of the equity awards was estimated on the date of grant using the Black-Scholes option pricing model, which requires estimates of the expected term of the option, the expected volatility of the price of the Company's common stock, dividend yield and the risk-free rate. The below table summarizes the assumptions used when estimating the fair value of the equity awards:
Expected volatility | 30% - 40% | |
Expected term | 6.3 years | |
Risk free interest rate | 1.8% - 2.1% | |
Expected dividend yield | 0.0 | % |
The options provide for immediate vesting and have an exercise price of between $10.63 and $13.02 per share. Due to the Company's lack of option exercise history, the expected term is calculated using the simplified method defined as the midpoint between the vesting period and the contractual term of each award. The expected volatility was based on market conditions of comparable companies. The risk free interest rate is based on the U.S. Treasury yield curve in effect on the date of grant which most closely corresponds to the expected term of the option. The Company historically has not issued dividends and therefore does not utilize a dividend yield in the calculation.
F-27
TOWNSQUARE MEDIA, INC.
NOTES TO THE CONSOLIDATED FINANCIAL STATEMENTS
The following table summarizes stock option activity for the years ended December 31, 2014 and 2015:
Options | Weighted Average Exercise Price | Weighted Average Remaining Contractual Life (years) | Aggregate Intrinsic Value | ||||||||||
Outstanding at December 31, 2013 | — | $ | — | ||||||||||
Granted | 6,958,338 | 11.00 | |||||||||||
Exercised | — | — | |||||||||||
Forfeited | (33,435 | ) | 11.00 | ||||||||||
Outstanding at December 31, 2014 | 6,924,903 | 11.00 | 9.51 | $ | 15,214,966 | ||||||||
Granted | 1,021,000 | 12.41 | |||||||||||
Exercised | (7,164 | ) | 11.00 | ||||||||||
Forfeited | (609,405 | ) | 11.15 | ||||||||||
Outstanding at December 31, 2015 | 7,329,334 | $ | 11.20 | 8.70 | $ | 6,170,341 | |||||||
Exercisable at December 31, 2015 | 7,329,334 | $ | 11.20 | 8.70 | $ | 6,170,341 | |||||||
The weighted average grant date fair value of stock options granted during the years ended December 31, 2014 and 2015 was $4.68 and $4.62, respectively. For the years ended December 31, 2014 and 2015, the Company recognized approximately $32.6 million and $4.3 million, respectively, of stock-based compensation expense with respect to the options granted.
During the year ended December 31, 2014, the Company granted 454,546 immediately-vesting restricted stock units, with a weighted average grant date fair value of $11.00. No restricted stock units were granted during the year ended December 31, 2015.
On January 26, 2016, the Company granted 1,600,000 options under the 2014 Omnibus Incentive Plan at an exercise price of $8.96 to employees and directors of the Company.
The Company has issued stock to employees and independent directors. The shares are subject to a Selldown Agreement, pursuant to which FiveWire Media Ventures LLC ("FiveWire") (an entity formed for the purpose of investing in the Company by certain members of management, including Steven Price, Stuart Rosenstein, Dhruv Prasad, Scott Schatz and certain other individuals (together, the "FiveWire Holders")) and certain other members of management are subject to certain restrictions on sales of the Company's common stock held by them. Pursuant to the terms of the Selldown Agreement, the FiveWire Holders and certain other members of management are generally restricted from transferring a specified percentage (which is expected to range between 50% and 100%) of the shares of the Company's common stock held by them at the closing of the IPO. If Oaktree sells a portion of the shares of common stock or warrants to purchase common stock that it holds (the percentage of shares and warrants, collectively, held by Oaktree at such time that it sells in such a transaction, referred to as the "Sale Percentage"), those subject to the Selldown Agreement will be permitted to sell a percentage of the shares of common stock and warrants held by them, up to an amount equal to the Sale Percentage. The Selldown Agreement will terminate on the earlier of (i) the date that Oaktree no longer holds at least 10% of the shares of common stock and warrants exercisable for common stock, collectively, held by Oaktree immediately following the closing of the IPO, and (ii) the third anniversary of the closing of the IPO.
F-28
TOWNSQUARE MEDIA, INC.
NOTES TO THE CONSOLIDATED FINANCIAL STATEMENTS
8. Income Taxes
Income tax expense for the years ended December 31, 2013, 2014 and 2015 consisted of the following:
(in thousands) | ||||||||||||
2013 | 2014 | 2015 | ||||||||||
Current income tax expense | ||||||||||||
Federal | $ | — | $ | — | $ | — | ||||||
State | 340 | 365 | 350 | |||||||||
Foreign | — | — | (163 | ) | ||||||||
Total current income tax expense | $ | 340 | $ | 365 | $ | 187 | ||||||
Deferred tax expense | ||||||||||||
Federal | $ | — | $ | 8,706 | $ | 6,402 | ||||||
State | — | 1,801 | 1,377 | |||||||||
Foreign | — | — | (42 | ) | ||||||||
Total deferred income tax expense | — | 10,507 | 7,737 | |||||||||
Total income tax expense | $ | 340 | $ | 10,872 | $ | 7,924 | ||||||
Total income tax expense differed from the amount computed by applying the federal statutory tax rate of 35.0% for the three years ended December 31, 2015 due to the following:
(in thousands) | ||||||||||||
2013 | 2014 | 2015 | ||||||||||
Pretax income (loss) at federal statutory rate | $ | 3,658 | $ | (2,128 | ) | $ | 6,359 | |||||
Foreign taxes at different rates from the U.S. rate | — | — | 77 | |||||||||
State income tax expense, net federal expense | 340 | 1,408 | 1,156 | |||||||||
Non-deductible items | — | 1,821 | 366 | |||||||||
Pre-IPO income which had no tax effect | (3,658 | ) | (4,550 | ) | — | |||||||
Stock compensation expense recorded at LLC conversion | — | 11,403 | — | |||||||||
Deferred federal and state income taxes recorded at LLC conversion | — | 2,728 | — | |||||||||
Adjustment of prior year deferred taxes | — | — | (128 | ) | ||||||||
Change in valuation allowance | — | 190 | 94 | |||||||||
Total provision for income taxes | $ | 340 | $ | 10,872 | $ | 7,924 | ||||||
F-29
TOWNSQUARE MEDIA, INC.
NOTES TO THE CONSOLIDATED FINANCIAL STATEMENTS
The tax effects of temporary differences that give rise to significant portions of the deferred tax assets and liabilities at December 31, 2014 and 2015 are presented below:
(in thousands) | |||||||
2014 | 2015 | ||||||
Deferred tax assets: | |||||||
Allowance for doubtful accounts | $ | 1,087 | $ | 668 | |||
Accrued expenses and other current liabilities | 459 | 462 | |||||
Stock-based compensation | 12,833 | 14,465 | |||||
Property and equipment | 4,056 | — | |||||
Capitalized interest cost | 1,025 | — | |||||
Prepaid rent | — | 1,486 | |||||
Deferred revenue | — | 1,140 | |||||
Noncurrent liabilities | 169 | 221 | |||||
Net operating loss carryforwards | 26,229 | 40,090 | |||||
45,858 | 58,532 | ||||||
Less: valuation allowance | (13,496 | ) | (13,601 | ) | |||
Deferred tax assets | 32,362 | 44,931 | |||||
Deferred tax liabilities: | |||||||
Intangible assets | 41,059 | 69,772 | |||||
Property and equipment | — | 7,578 | |||||
Software development costs | 1,810 | 2,814 | |||||
Deferred tax liabilities | 42,869 | 80,164 | |||||
Net deferred tax liabilities | $ | 10,507 | $ | 35,233 | |||
Net deferred tax liabilities as of December 31, 2015 include $0.9 million pertaining to Canadian operations.
The company has early-adopted ASU 2015-17, Balance Sheet Classification of Deferred Taxes, accordingly the net deferred tax liability classified as long-term in the Consolidated Balance Sheets included herein, for all periods presented.
As of December 31, 2015, the Company has federal net operating loss carry forwards available to offset future income of approximately $96.9 million which will expire in the years 2016 through 2035, of which $50.4 million is applicable to TMI and can only be utilized against its future earnings subject to limitations under Section 382 of the Internal Revenue Code, and $46.5 million applicable to post IPO operations of the Company which can be utilized against future earnings without limitation through 2035. Additionally, the Company has net operating loss carry forwards for state purposes aggregating $10.3 million at December 31, 2015 which are subject to the foregoing limitations. The ultimate utilization of these carryfowards prior to expiration will also be dependent upon the individual taxable jurisdictions where future earnings may occur.
F-30
TOWNSQUARE MEDIA, INC.
NOTES TO THE CONSOLIDATED FINANCIAL STATEMENTS
9. Accrued Expenses and Other Current Liabilities
Accrued expenses and other current liabilities consist of the following:
(in thousands) | |||||||
December 31, 2014 | December 31, 2015 | ||||||
Accrued compensation and benefits | $ | 10,930 | $ | 14,157 | |||
Accrued professional fees | 1,793 | 935 | |||||
Accrued commissions | 1,983 | 2,252 | |||||
Accrued taxes | 862 | 2,786 | |||||
Accrued music and FCC licensing | 228 | 1,103 | |||||
Accrued publisher fees | 498 | 1,088 | |||||
Accrued national representation fees | 1,344 | 1,060 | |||||
Due to sellers, business combinations | 172 | 2,286 | |||||
Accrued other | 3,529 | 4,291 | |||||
$ | 21,339 | $ | 29,958 | ||||
10. Lease and Other Commitments
Operating Leases: The Company leases certain facilities and equipment used in its operations. Certain of the Company’s operating leases contain renewal options through 2062, escalating rent provisions and/or cost of living adjustments. Total rental expense was approximately $10.1 million, $16.9 million and $19.2 million for the years ended December 31, 2013, 2014 and 2015, respectively. Total rental expense includes costs incurred for live events including venue and equipment rentals.
At December 31, 2015, the total minimum annual rental commitments under non-cancelable operating leases are as follows:
(in thousands) | |||
2016 | $ | 9,568 | |
2017 | 8,178 | ||
2018 | 6,799 | ||
2019 | 5,612 | ||
2020 | 3,655 | ||
Thereafter | 9,169 | ||
Total minimum payments | $ | 42,981 | |
In January 2016, the Company signed a lease for office space in Charlotte, North Carolina, for use by its digital marketing solutions operation. The lease commences March 1, 2016, and has a ten year term. Initially 28,000 square feet will be leased, increasing to 51,288 square feet by year four. The annual minimum rental commitment aggregates $0.3 million at commencement of the lease, escalating to $1.3 million by year ten.
Other Commitments: The radio broadcast industry’s principal ratings service is Nielsen Holdings N.V. ("Nielsen"), which publishes surveys for domestic radio markets. The Company’s remaining aggregate obligation under the agreements with Nielsen as of December 31, 2015 is approximately $12.8 million and is expected to be paid in accordance with the agreements through October 2018.
F-31
TOWNSQUARE MEDIA, INC.
NOTES TO THE CONSOLIDATED FINANCIAL STATEMENTS
We normally commit one or more years in advance to provide rides, games and concessions at certain fairs. These agreements include an obligation to pay event fees, which may be expressed as a flat fee or as a percentage of revenues. At December 31, 2015, our total minimum fee commitments for contracts with a remaining term in excess of one year are as follows:
(in thousands) | |||
2016 | $ | 2,626 | |
2017 | 2,531 | ||
2018 | 2,215 | ||
2019 | 1,920 | ||
2020 | 1,062 | ||
Thereafter | 2,821 | ||
Total minimum payments | $ | 13,175 | |
11. Segment Reporting
The Company has two reportable segments, Local Advertising, which offers broadcast, digital and mobile advertising within our local markets, and Live Events, which is composed of a diverse range of live events, which we create, promote and produce, including music concerts, multi-day music festivals, fairs, consumer expositions and trade shows, athletic events, lifestyle events and other forms of entertainment. The Company reports the remainder of its business in its Other Media and Entertainment category, which principally provide digital marketing solutions, e-commerce solutions and digital advertising services nationally. The segment disclosure is consistent with the management decision-making process that determines the allocation of resources and measurement of performance.
The following table presents the Company’s reportable segment results for the year ended December 31, 2013:
(in thousands) | |||||||||||||||||||
Local Advertising | Live Events | Other Media and Entertainment | Corporate and other reconciling items | Consolidated | |||||||||||||||
Year Ended December 31, 2013 | |||||||||||||||||||
Net revenue | $ | 229,653 | $ | 20,851 | $ | 18,074 | $ | — | $ | 268,578 | |||||||||
Direct operating expenses, excluding depreciation, amortization and stock-based compensation | 147,720 | 18,287 | 21,141 | — | 187,148 | ||||||||||||||
Depreciation and amortization | 11,202 | — | 3,498 | 489 | 15,189 | ||||||||||||||
Corporate expenses | — | — | — | 19,190 | 19,190 | ||||||||||||||
Transaction costs | — | 99 | — | 1,902 | 2,001 | ||||||||||||||
Change in fair value of contingent consideration | — | — | — | (1,100 | ) | (1,100 | ) | ||||||||||||
Net loss on sale of assets | — | — | — | (36 | ) | (36 | ) | ||||||||||||
Operating income (loss) | $ | 70,731 | $ | 2,465 | $ | (6,565 | ) | $ | (20,445 | ) | $ | 46,186 | |||||||
Long-lived Assets | $ | 791,447 | $ | 11,263 | $ | 11,413 | $ | 1,220 | $ | 815,343 | |||||||||
Capital expenditures | $ | 4,586 | $ | 23 | $ | 4,066 | $ | 851 | $ | 9,526 | |||||||||
F-32
TOWNSQUARE MEDIA, INC.
NOTES TO THE CONSOLIDATED FINANCIAL STATEMENTS
The following table presents the Company’s reportable segment results for the year ended December 31, 2014:
(in thousands) | |||||||||||||||||||
Local Advertising | Live Events | Other Media and Entertainment | Corporate and other reconciling items | Consolidated | |||||||||||||||
Year Ended December 31, 2014 | |||||||||||||||||||
Net revenue | $ | 302,648 | $ | 40,954 | $ | 30,290 | $ | — | $ | 373,892 | |||||||||
Direct operating expenses, excluding depreciation, amortization and stock-based compensation | 189,975 | 35,087 | 28,378 | — | 253,440 | ||||||||||||||
Depreciation and amortization | 12,776 | 397 | 2,525 | 1,180 | 16,878 | ||||||||||||||
Corporate expenses | — | — | — | 24,996 | 24,996 | ||||||||||||||
Stock-based compensation | 6,775 | 2,899 | 1,016 | 27,049 | 37,739 | ||||||||||||||
Transaction costs | — | 136 | — | 81 | 217 | ||||||||||||||
Net gain on sale of assets | — | — | — | 90 | 90 | ||||||||||||||
Operating income (loss) | $ | 93,122 | $ | 2,435 | $ | (1,629 | ) | $ | (53,396 | ) | $ | 40,532 | |||||||
Long-lived Assets | $ | 783,595 | $ | 39,955 | $ | 16,554 | $ | 4,282 | $ | 844,386 | |||||||||
Capital expenditures | $ | 7,287 | $ | 1,124 | $ | 4,096 | $ | 1,024 | $ | 13,531 | |||||||||
The following table presents the Company’s reportable segment results for the year ended December 31, 2015:
(in thousands) | |||||||||||||||||||
Local Advertising | Live Events | Other Media and Entertainment | Corporate and other reconciling items | Consolidated | |||||||||||||||
Year Ended December 31, 2015 | |||||||||||||||||||
Net revenue | $ | 303,130 | $ | 97,681 | $ | 40,411 | $ | — | $ | 441,222 | |||||||||
Direct operating expenses, excluding depreciation, amortization and stock-based compensation | 194,020 | 88,994 | 34,821 | — | 317,835 | ||||||||||||||
Depreciation and amortization | 10,691 | 3,059 | 1,992 | 1,835 | 17,577 | ||||||||||||||
Corporate expenses | — | — | — | 25,411 | 25,411 | ||||||||||||||
Stock-based compensation | 1,144 | 550 | 214 | 2,370 | 4,278 | ||||||||||||||
Transaction costs | — | — | — | 1,739 | 1,739 | ||||||||||||||
Impairment charge, FCC licenses | 1,680 | — | — | — | 1,680 | ||||||||||||||
Net loss on sale of assets | — | — | — | (12,029 | ) | (12,029 | ) | ||||||||||||
Operating income (loss) | $ | 95,595 | $ | 5,078 | $ | 3,384 | $ | (19,326 | ) | $ | 84,731 | ||||||||
Long-Lived Assets | $ | 773,103 | $ | 148,113 | $ | 10,692 | $ | 12,967 | $ | 944,875 | |||||||||
Capital expenditures | $ | 5,112 | $ | 3,570 | $ | 4,176 | $ | 1,866 | $ | 14,724 | |||||||||
NAME, acquired by a subsidiary of the Company on September 1, 2015, conducts a portion of its business in Canada. Consolidated revenue for the year ended December 31, 2015 includes $5.1 million of Canadian revenue, and long-lived assets located in Canada aggregated $3.8 million as of December 31, 2015.
F-33
TOWNSQUARE MEDIA, INC.
NOTES TO THE CONSOLIDATED FINANCIAL STATEMENTS
No single customer accounts for more than 1% of revenue in any of the years ended December 31, 2013, 2014 and 2015.
12. Pro Forma C Corporation Tax Data (unaudited)
In connection with the Company’s IPO and the Company’s LLC Conversion, the Company converted to a C corporation for federal and state income tax purposes. Upon conversion, the Company established net current deferred tax assets of $1.6 million, net long-term deferred tax assets of $17.4 million and net long-term deferred tax liabilities of $21.8 million. The pro forma C corporation data for the years ended December 31, 2013 and 2014 are based on the pre-tax earnings in the historical consolidated statements of operations and give effect on a pro forma basis to the income tax expense that would have been recorded if the Company had been a C corporation for the entire duration of the periods presented. The pro forma income or loss per share information is based on the pro forma net income or loss.
Note 13. Net (Loss) Income Per Common Share
Net (Loss) Income per Share
Basic earnings (loss) per common share (“EPS”) are generally calculated as income (loss) available to common shareholders divided by the weighted average number of common shares outstanding. Diluted EPS is generally calculated as income (loss) available to common shareholders divided by the weighted average number of common shares outstanding plus the dilutive effect of common share equivalents.
The calculation of basic and diluted EPS for the years ended December 31, 2014 and 2015 was as follows:
(in thousands, except per share data) | |||||||
Year Ended December 31, | |||||||
2014 | 2015 | ||||||
Numerator: | |||||||
Net (loss) income | $ | (16,953 | ) | $ | 10,246 | ||
Denominator: | |||||||
Weighted average shares of common stock outstanding | 12,013 | 17,537 | |||||
Effect of dilutive common stock equivalents | — | 10,187 | |||||
Weighted average diluted common shares outstanding | 12,013 | 27,724 | |||||
Net (loss) income per share: | |||||||
Basic | $ | (1.41 | ) | $ | 0.58 | ||
Diluted | $ | (1.41 | ) | $ | 0.37 | ||
The Company had the following dilutive securities that were not included in the computations of net income (loss) per share as they were considered anti-dilutive:
(in thousands) | |||||
Year Ended December 31, | |||||
2014 | 2015 | ||||
Warrants | 9,509 | — | |||
Stock options | 6,925 | 167 | |||
F-34
TOWNSQUARE MEDIA, INC.
NOTES TO THE CONSOLIDATED FINANCIAL STATEMENTS
Pro Forma Net Income (Loss) per Share (unaudited)
Pro forma basic and diluted net income (loss) per common share have been computed to give effect to the assumed conversion of the units and warrants to purchase units of Townsquare Media, LLC into Class A, Class B, and Class C common stock and warrants and options to purchase common stock of Townsquare Media, Inc. upon the completion of the IPO of the Company’s common stock. In addition, the pro forma net income applied in computing the pro forma basic and diluted net income per share is based upon the Company’s historical net income as adjusted to reflect the conversion of the Company from a limited liability company into a Delaware corporation. Prior to such conversion, the Company was treated as a partnership and generally was not subject to income taxes. The pro forma net income, therefore, includes adjustments for income tax expense as if the Company had been a corporation and subject to income taxes at an assumed combined federal, state, and local income tax rate of 39.4%.
The following table sets forth the computation of basic and diluted pro forma net income (loss) per share:
(in thousands except per share data) | |||||||
Year Ended December 31, | |||||||
2013 | 2014 | ||||||
Numerator: | |||||||
Net (loss) income | $ | 6,333 | $ | (3,685 | ) | ||
Denominator: | |||||||
Weighted average shares of common stock outstanding | 7,569 | 12,013 | |||||
Effect of dilutive common stock equivalents | 9,509 | — | |||||
Weighted average diluted common shares outstanding | 17,078 | 12,013 | |||||
Pro forma net income (loss) per share: | |||||||
Basic | $ | 0.84 | $ | (0.31 | ) | ||
Diluted | $ | 0.37 | $ | (0.31 | ) | ||
The Company had the following dilutive securities that were not included in the computations of pro forma net (loss) income per share as they were considered anti-dilutive:
(in thousands) | |||||
Year Ended December 31, | |||||
2013 | 2014 | ||||
Warrants | — | 9,509 | |||
Stock options | — | 6,925 | |||
F-35
SCHEDULE II
TOWNSQUARE MEDIA, INC.
FINANCIAL STATEMENT SCHEDULE
VALUATION AND QUALIFYING ACCOUNTS
Fiscal Year | Balance at Beginning of Year | Charged to Costs and Expenses | Deductions | Balance at End of Year | |||||||||||
Allowance for doubtful accounts | |||||||||||||||
2013 | $ | 2,774 | $ | 8 | $ | (132 | ) | $ | 2,650 | ||||||
2014 | $ | 2,650 | $ | 1,903 | $ | (1,203 | ) | $ | 3,350 | ||||||
2015 | $ | 3,350 | $ | 1,170 | $ | (2,406 | ) | $ | 2,114 | ||||||
S-1