Attached files
| file | filename |
|---|---|
| 8-K - 8-K - CANTEL MEDICAL LLC | a15-2391_18k.htm |
Exhibit 99.1
|
|
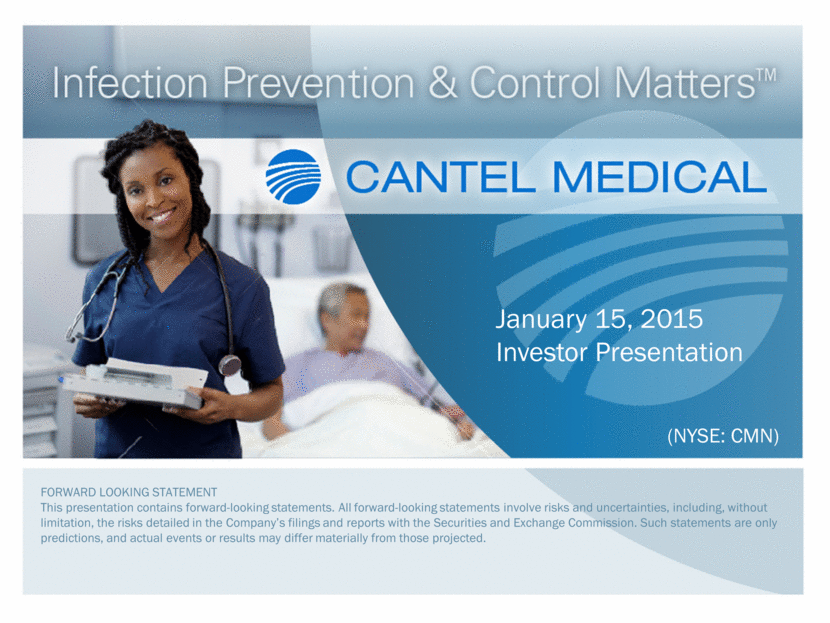
FORWARD LOOKING STATEMENT This presentation contains forward-looking statements. All forward-looking statements involve risks and uncertainties, including, without limitation, the risks detailed in the Company’s filings and reports with the Securities and Exchange Commission. Such statements are only predictions, and actual events or results may differ materially from those projected. (NYSE: CMN) January 15, 2015 Investor Presentation |
|
|
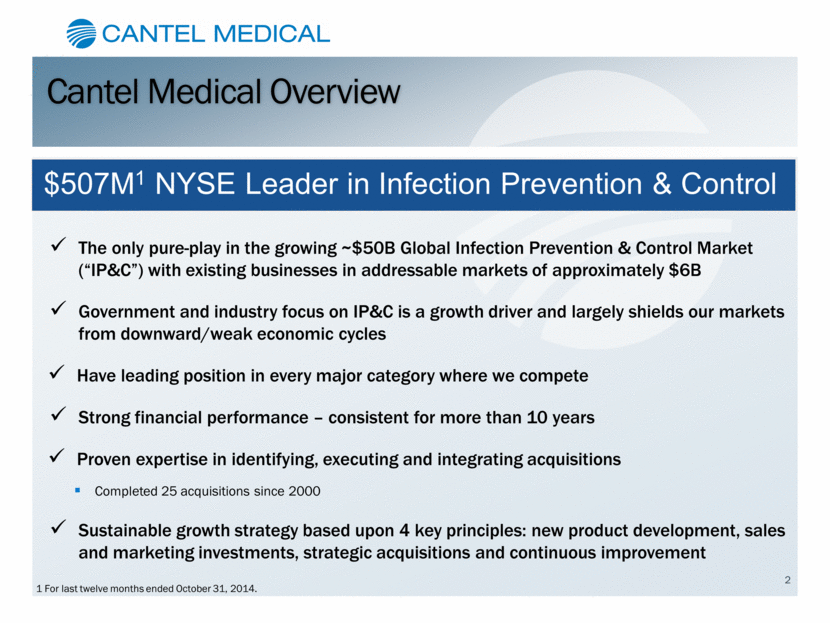
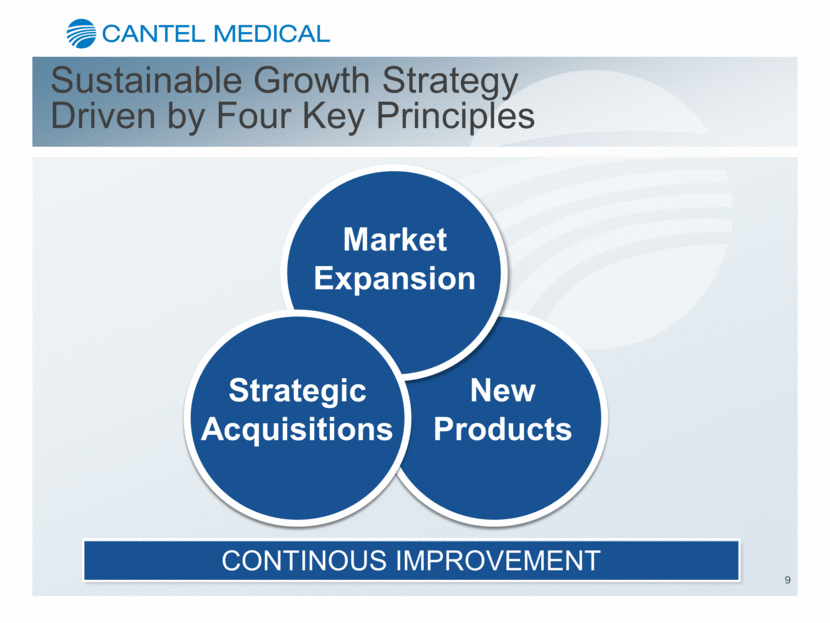
Cantel Medical Overview The only pure-play in the growing ~$50B Global Infection Prevention & Control Market (“IP&C”) with existing businesses in addressable markets of approximately $6B Government and industry focus on IP&C is a growth driver and largely shields our markets from downward/weak economic cycles Have leading position in every major category where we compete Strong financial performance – consistent for more than 10 years Proven expertise in identifying, executing and integrating acquisitions Completed 25 acquisitions since 2000 Sustainable growth strategy based upon 4 key principles: new product development, sales and marketing investments, strategic acquisitions and continuous improvement 1 For last twelve months ended October 31, 2014. 2 $507M1 NYSE Leader in Infection Prevention & Control |
|
|
Our Mission Statement Our Purpose Cantel Medical is dedicated to delivering innovative infection prevention and control (IP&C) products and services for patients, caregivers, and other healthcare providers, which improve outcomes and help save lives. Our Business Priorities New Products: Continually introduce new and innovative IP&C products and services. Market Expansion: Expand our products and services into key markets to provide global solutions that meet local needs. Continuous Improvement: Continuously improve our company in everything we do. Strategic Acquisitions: Effectively identify, acquire and integrate synergistic companies and technologies. Financial Performance: Achieve above market financial performance benefiting our shareholders and employees. Our Values Treat all people with respect while embracing diversity and cultural differences. Operate with integrity and ethics, and comply with all regulations in the worldwide markets we serve. Understand customers' needs and deliver high quality, innovative, safe solutions better than our competitors. Work in high performance teams, empowered to make a difference, and continue to learn and grow. Act with accountability and a sense of urgency to deliver on our goals. 3 |
|
|
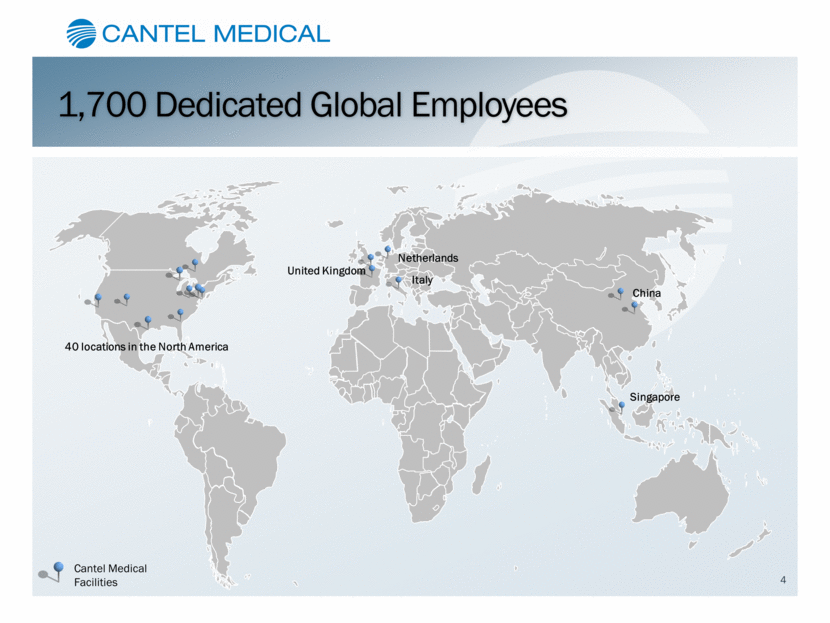
Cantel Medical Facilities 40 locations in the North America Netherlands Singapore China United Kingdom 1,700 Dedicated Global Employees Italy 4 |
|
|
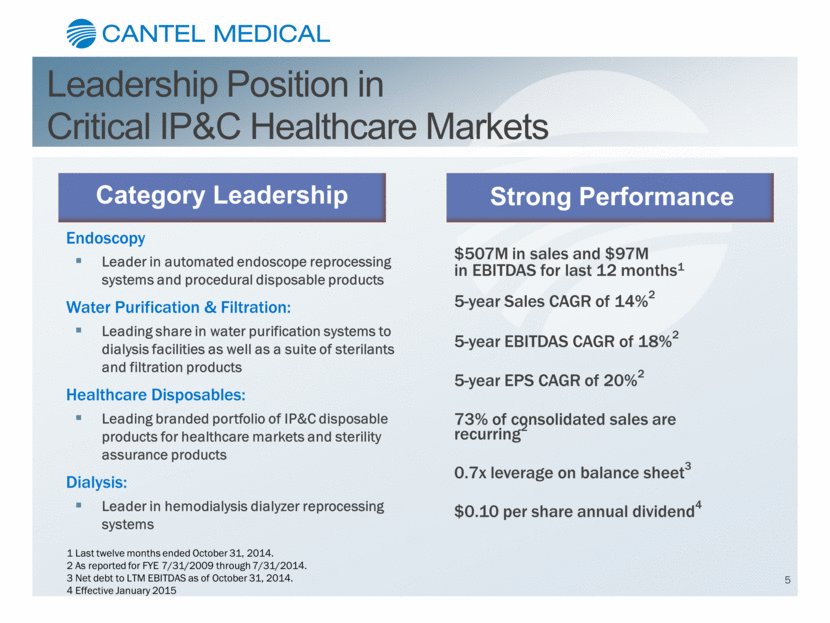
Endoscopy Leader in automated endoscope reprocessing systems and procedural disposable products Water Purification & Filtration: Leading share in water purification systems to dialysis facilities as well as a suite of sterilants and filtration products Healthcare Disposables: Leading branded portfolio of IP&C disposable products for healthcare markets and sterility assurance products Dialysis: Leader in hemodialysis dialyzer reprocessing systems $507M in sales and $97M in EBITDAS for last 12 months1 5-year Sales CAGR of 14%2 5-year EBITDAS CAGR of 18%2 5-year EPS CAGR of 20%2 73% of consolidated sales are recurring2 0.7x leverage on balance sheet3 $0.10 per share annual dividend4 1 Last twelve months ended October 31, 2014. 2 As reported for FYE 7/31/2009 through 7/31/2014. 3 Net debt to LTM EBITDAS as of October 31, 2014. 4 Effective January 2015 Strong Performance Category Leadership Leadership Position in Critical IP&C Healthcare Markets 5 |
|
|
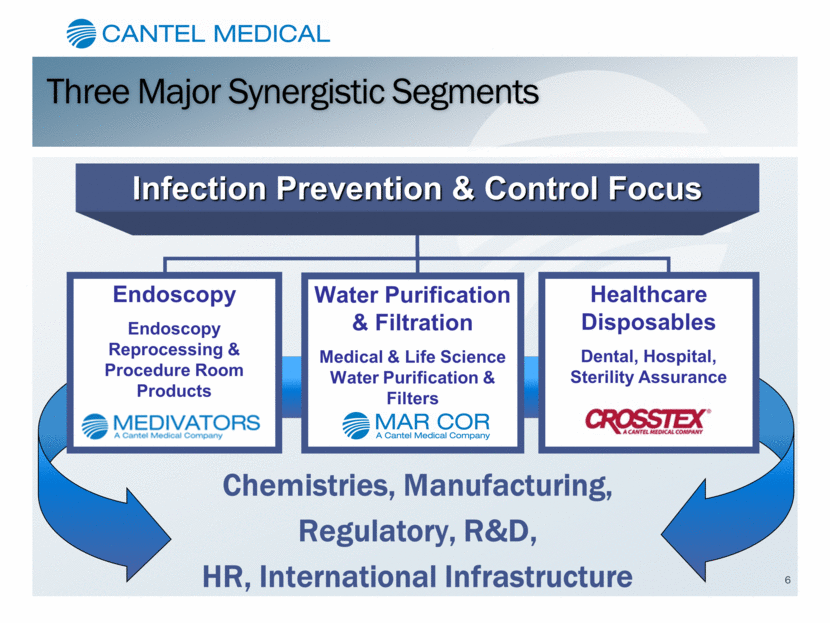
Three Major Synergistic Segments Infection Prevention & Control Focus Endoscopy Endoscopy Reprocessing & Procedure Room Products Water Purification & Filtration Medical & Life Science Water Purification & Filters Healthcare Disposables Dental, Hospital, Sterility Assurance Chemistries, Manufacturing, Regulatory, R&D, HR, International Infrastructure 6 |
|
|
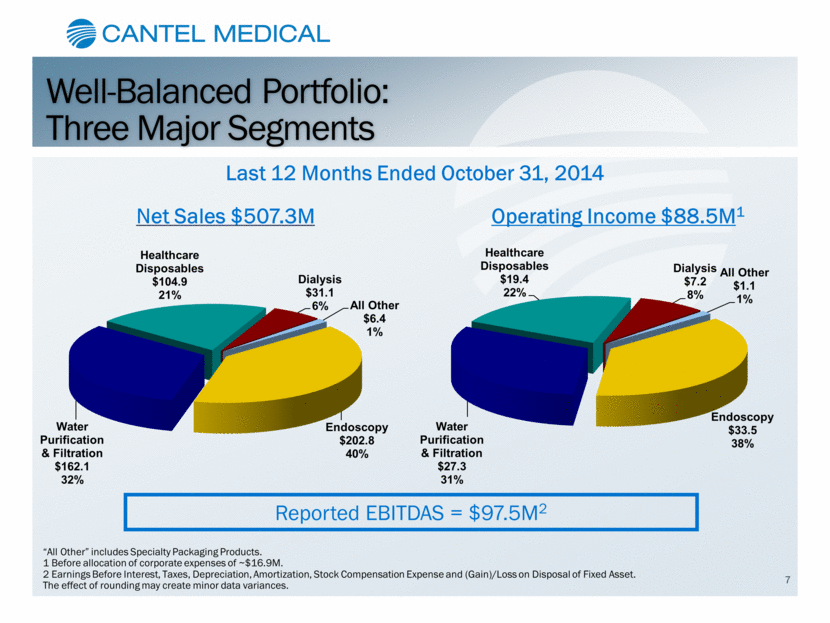
Well-Balanced Portfolio: Three Major Segments Last 12 Months Ended October 31, 2014 Net Sales $507.3M Operating Income $88.5M1 “All Other” includes Specialty Packaging Products. 1 Before allocation of corporate expenses of ~$16.9M. 2 Earnings Before Interest, Taxes, Depreciation, Amortization, Stock Compensation Expense and (Gain)/Loss on Disposal of Fixed Asset. The effect of rounding may create minor data variances. Reported EBITDAS = $97.5M2 7 Endoscopy $202.8 40% Water Purification & Filtration $162.1 32% Healthcare Disposables $104.9 21% Dialysis $31.1 6% All Other $6.4 1% Endoscopy $33.5 38% Water Purification & Filtration $27.3 31% Healthcare Disposables $19.4 22% Dialysis $7.2 8% All Other $1.1 1% |
|
|
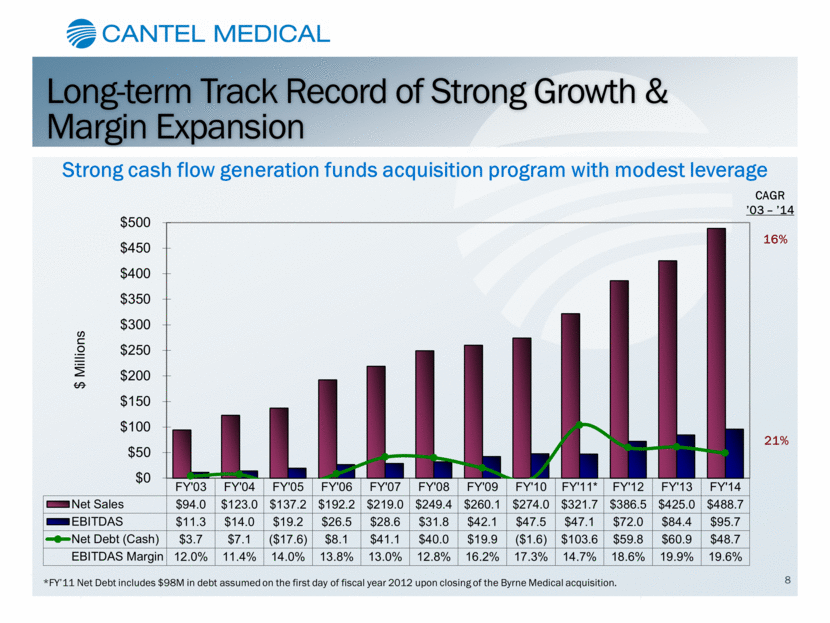
*FY’11 Net Debt includes $98M in debt assumed on the first day of fiscal year 2012 upon closing of the Byrne Medical acquisition. Long-term Track Record of Strong Growth & Margin Expansion CAGR ’03 – ’14 16% 21% 8 Strong cash flow generation funds acquisition program with modest leverage |
|
|
New Products Sustainable Growth Strategy Driven by Four Key Principles CONTINOUS IMPROVEMENT Market Expansion Strategic Acquisitions 9 |
|
|
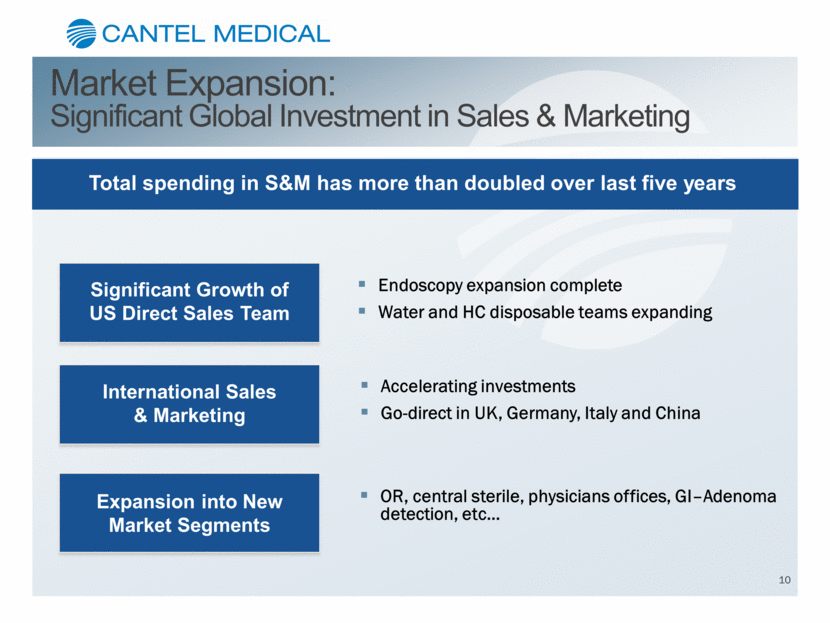
Market Expansion: Significant Global Investment in Sales & Marketing OR, central sterile, physicians offices, GI–Adenoma detection, etc Endoscopy expansion complete Water and HC disposable teams expanding Accelerating investments Go-direct in UK, Germany, Italy and China Total spending in S&M has more than doubled over last five years Significant Growth of US Direct Sales Team International Sales & Marketing Expansion into New Market Segments 10 |
|
|
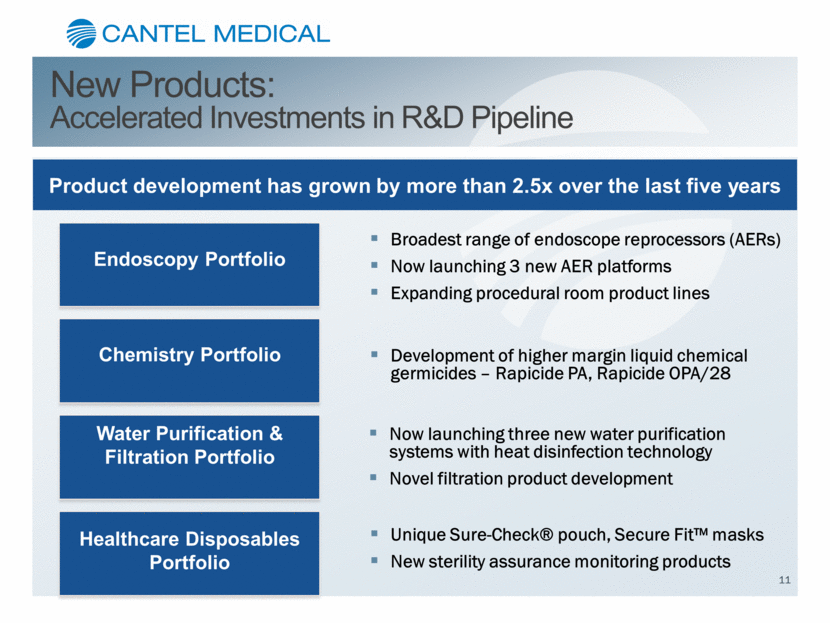
New Products: Accelerated Investments in R&D Pipeline Product development has grown by more than 2.5x over the last five years Endoscopy Portfolio Chemistry Portfolio Water Purification & Filtration Portfolio Healthcare Disposables Portfolio Broadest range of endoscope reprocessors (AERs) Now launching 3 new AER platforms Expanding procedural room product lines Development of higher margin liquid chemical germicides – Rapicide PA, Rapicide OPA/28 Now launching three new water purification systems with heat disinfection technology Novel filtration product development 11 Unique Sure-Check® pouch, Secure Fit™ masks New sterility assurance monitoring products |
|
|
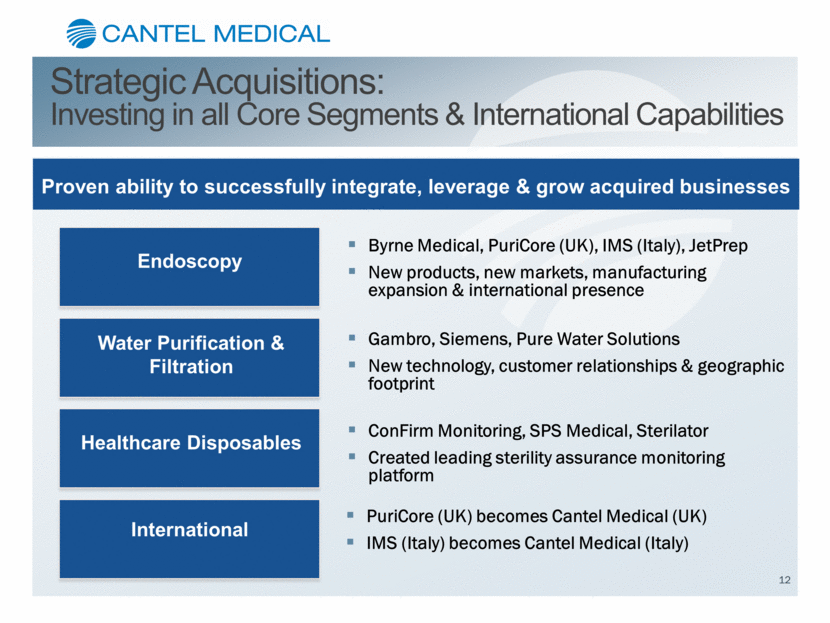
Strategic Acquisitions: Investing in all Core Segments & International Capabilities Proven ability to successfully integrate, leverage & grow acquired businesses Endoscopy Water Purification & Filtration Healthcare Disposables Byrne Medical, PuriCore (UK), IMS (Italy), JetPrep New products, new markets, manufacturing expansion & international presence Gambro, Siemens, Pure Water Solutions New technology, customer relationships & geographic footprint ConFirm Monitoring, SPS Medical, Sterilator Created leading sterility assurance monitoring platform 12 International PuriCore (UK) becomes Cantel Medical (UK) IMS (Italy) becomes Cantel Medical (Italy) |
|
|
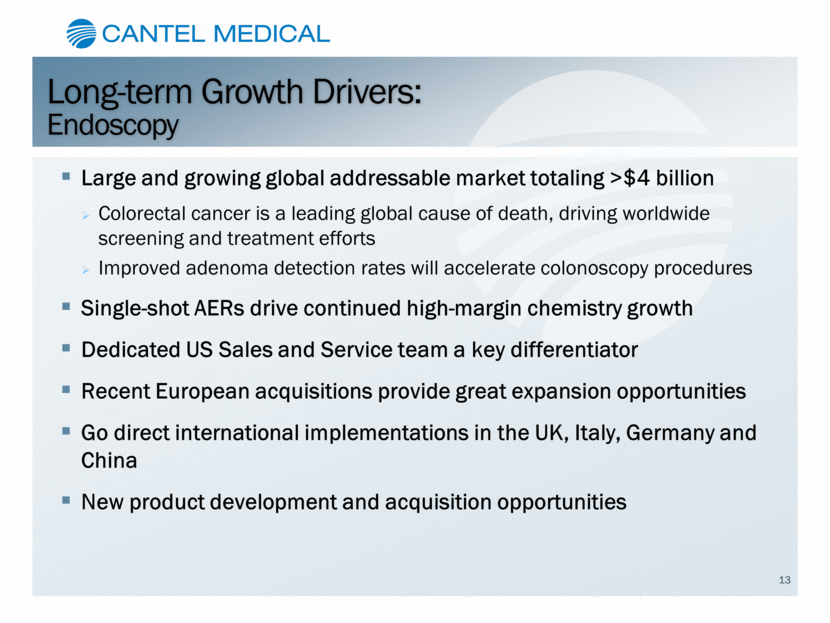
Long-term Growth Drivers: Endoscopy Large and growing global addressable market totaling >$4 billion Colorectal cancer is a leading global cause of death, driving worldwide screening and treatment efforts Improved adenoma detection rates will accelerate colonoscopy procedures Single-shot AERs drive continued high-margin chemistry growth Dedicated US Sales and Service team a key differentiator Recent European acquisitions provide great expansion opportunities Go direct international implementations in the UK, Italy, Germany and China New product development and acquisition opportunities 13 |
|
|
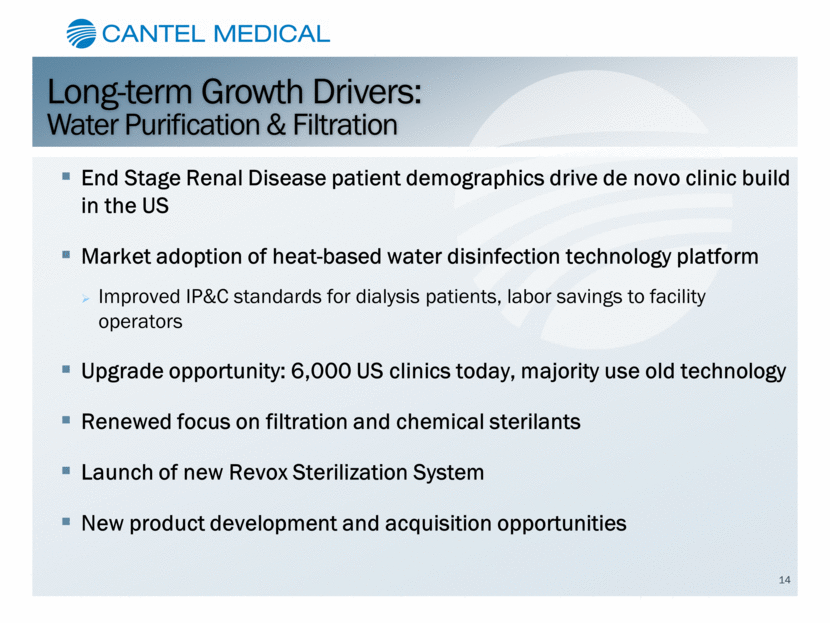
Long-term Growth Drivers: Water Purification & Filtration End Stage Renal Disease patient demographics drive de novo clinic build in the US Market adoption of heat-based water disinfection technology platform Improved IP&C standards for dialysis patients, labor savings to facility operators Upgrade opportunity: 6,000 US clinics today, majority use old technology Renewed focus on filtration and chemical sterilants Launch of new Revox Sterilization System New product development and acquisition opportunities 14 |
|
|
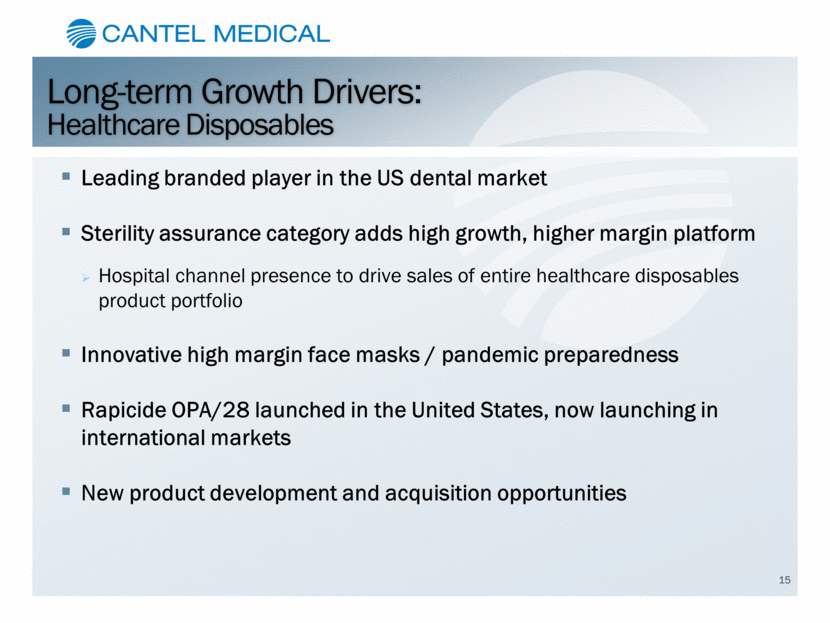
Long-term Growth Drivers: Healthcare Disposables Leading branded player in the US dental market Sterility assurance category adds high growth, higher margin platform Hospital channel presence to drive sales of entire healthcare disposables product portfolio Innovative high margin face masks / pandemic preparedness Rapicide OPA/28 launched in the United States, now launching in international markets New product development and acquisition opportunities 15 |
|
|
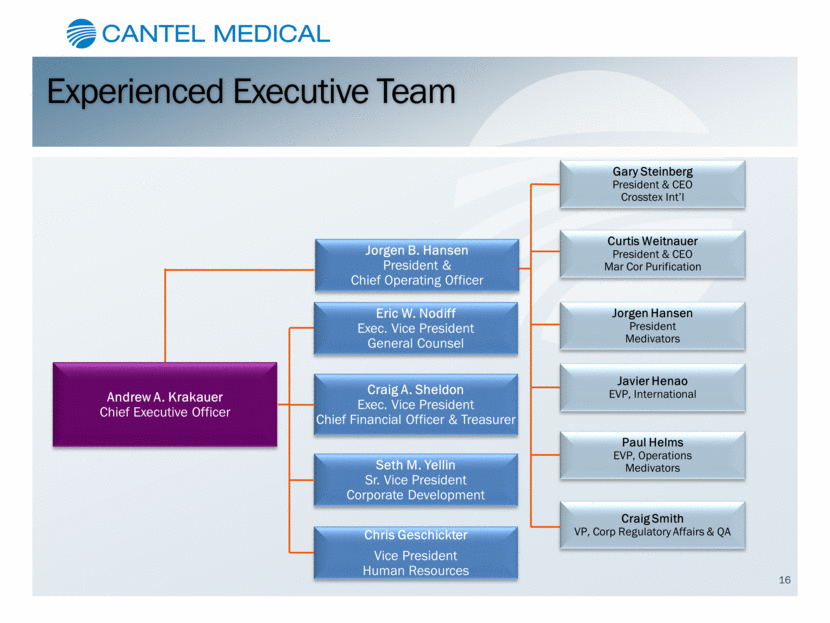
Experienced Executive Team Andrew A. Krakauer Chief Executive Officer Jorgen B. Hansen President & Chief Operating Officer Eric W. Nodiff Exec. Vice President General Counsel Craig A. Sheldon Exec. Vice President Chief Financial Officer & Treasurer Seth M. Yellin Sr. Vice President Corporate Development Chris Geschickter Vice President Human Resources Gary Steinberg President & CEO Crosstex Int’l Curtis Weitnauer President & CEO Mar Cor Purification Jorgen Hansen President Medivators Javier Henao EVP, International Paul Helms EVP, Operations Medivators 16 Craig Smith VP, Corp Regulatory Affairs & QA |
|
|
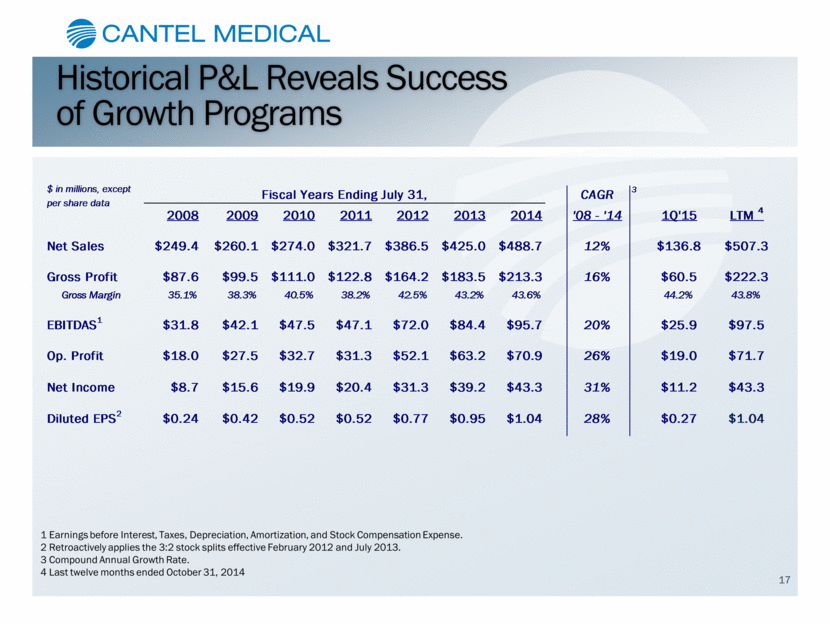
Historical P&L Reveals Success of Growth Programs 1 Earnings before Interest, Taxes, Depreciation, Amortization, and Stock Compensation Expense. 2 Retroactively applies the 3:2 stock splits effective February 2012 and July 2013. 3 Compound Annual Growth Rate. 4 Last twelve months ended October 31, 2014 17 $ in millions, except per share data Fiscal Years Ending July 31, CAGR 3 2008 2009 2010 2011 2012 2013 2014 '08 - '14 1Q'15 LTM 4 Net Sales $249.4 $260.1 $274.0 $321.7 $386.5 $425.0 $488.7 12% $136.8 $507.3 Gross Profit $87.6 $99.5 $111.0 $122.8 $164.2 $183.5 $213.3 16% $60.5 $222.3 Gross Margin 35.1% 38.3% 40.5% 38.2% 42.5% 43.2% 43.6% 44.2% 43.8% EBITDAS1 $31.8 $42.1 $47.5 $47.1 $72.0 $84.4 $95.7 20% $25.9 $97.5 Op. Profit $18.0 $27.5 $32.7 $31.3 $52.1 $63.2 $70.9 26% $19.0 $71.7 Net Income $8.7 $15.6 $19.9 $20.4 $31.3 $39.2 $43.3 31% $11.2 $43.3 Diluted EPS2 $0.24 $0.42 $0.52 $0.52 $0.77 $0.95 $1.04 28% $0.27 $1.04 |
|
|
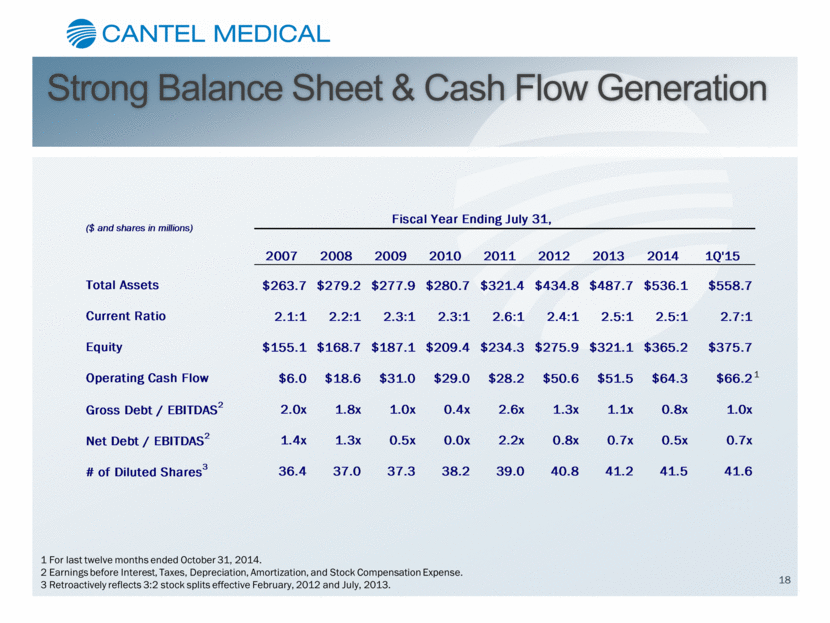
Strong Balance Sheet & Cash Flow Generation 1 For last twelve months ended October 31, 2014. 2 Earnings before Interest, Taxes, Depreciation, Amortization, and Stock Compensation Expense. 3 Retroactively reflects 3:2 stock splits effective February, 2012 and July, 2013. 18 1 ($ and shares in millions) Fiscal Year Ending July 31, 2007 2008 2009 2010 2011 2012 2013 2014 1Q'15 Total Assets $263.7 $279.2 $277.9 $280.7 $321.4 $434.8 $487.7 $536.1 $558.7 Current Ratio 2.1:1 2.2:1 2.3:1 2.3:1 2.6:1 2.4:1 2.5:1 2.5:1 2.7:1 Equity $155.1 $168.7 $187.1 $209.4 $234.3 $275.9 $321.1 $365.2 $375.7 Operating Cash Flow $6.0 $18.6 $31.0 $29.0 $28.2 $50.6 $51.5 $64.3 $66.2 Gross Debt / EBITDAS2 2.0x 1.8x 1.0x 0.4x 2.6x 1.3x 1.1x 0.8x 1.0x Net Debt / EBITDAS2 1.4x 1.3x 0.5x 0.0x 2.2x 0.8x 0.7x 0.5x 0.7x # of Diluted Shares3 36.4 37.0 37.3 38.2 39.0 40.8 41.2 41.5 41.6 |
|
|
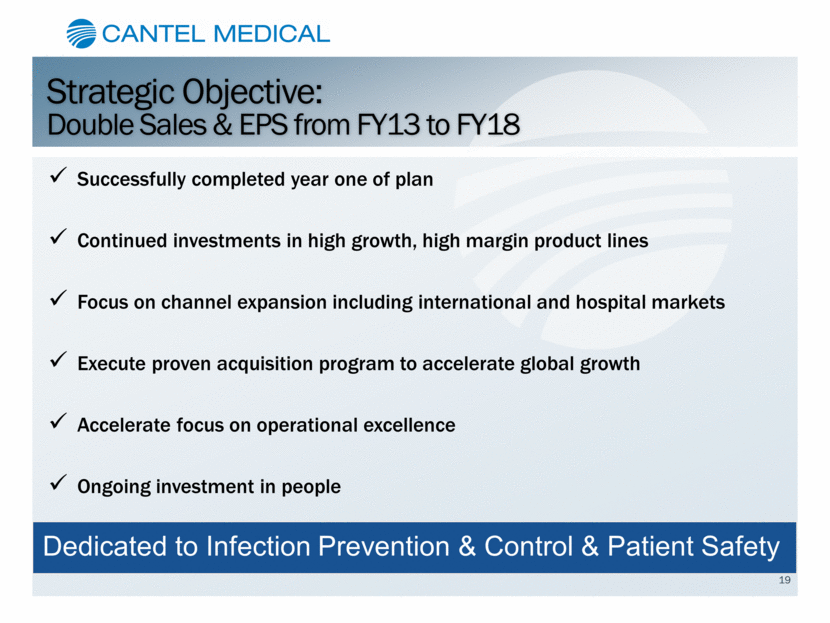
Strategic Objective: Double Sales & EPS from FY13 to FY18 Successfully completed year one of plan Continued investments in high growth, high margin product lines Focus on channel expansion including international and hospital markets Execute proven acquisition program to accelerate global growth Accelerate focus on operational excellence Ongoing investment in people 19 Dedicated to Infection Prevention & Control & Patient Safety |
|
|
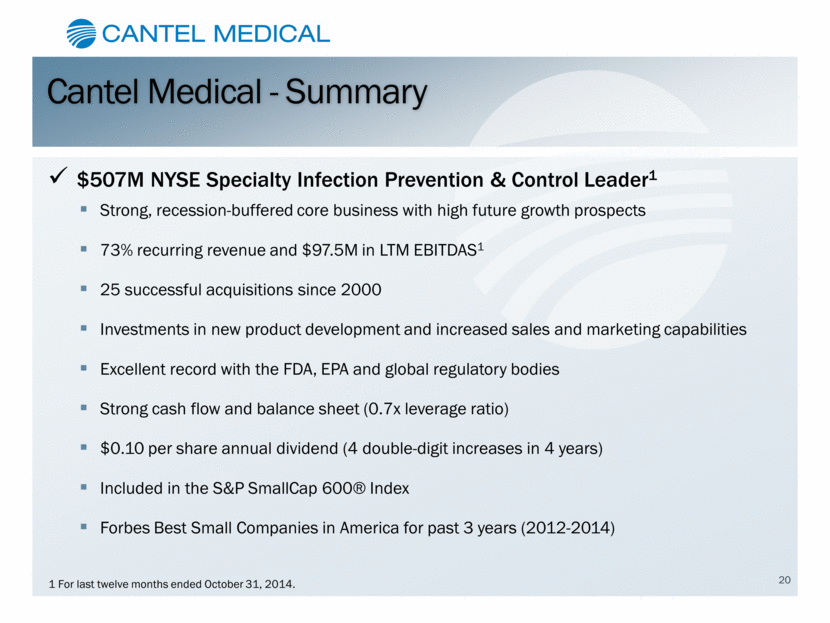
Cantel Medical - Summary $507M NYSE Specialty Infection Prevention & Control Leader1 Strong, recession-buffered core business with high future growth prospects 73% recurring revenue and $97.5M in LTM EBITDAS1 25 successful acquisitions since 2000 Investments in new product development and increased sales and marketing capabilities Excellent record with the FDA, EPA and global regulatory bodies Strong cash flow and balance sheet (0.7x leverage ratio) $0.10 per share annual dividend (4 double-digit increases in 4 years) Included in the S&P SmallCap 600® Index Forbes Best Small Companies in America for past 3 years (2012-2014) 1 For last twelve months ended October 31, 2014. 20 |
|
|
21 THANK YOU! |

