Attached files
| file | filename |
|---|---|
| 8-K - KAMAN CORPORATION FORM 8-K DATED JANUARY 13, 2015 - KAMAN Corp | form8-k11315.htm |
* Investor Presentation January 14, 2015

* Forward Looking Statements FORWARD-LOOKING STATEMENTS This presentation contains "forward-looking statements" within the meaning of the safe harbor provisions of the U.S. Private Securities Litigation Reform Act of 1995. Forward-looking statements also may be included in other publicly available documents issued by the Company and in oral statements made by our officers and representatives from time to time. These forward-looking statements are intended to provide management's current expectations or plans for our future operating and financial performance, based on assumptions currently believed to be valid. They can be identified by the use of words such as "anticipate," "intend," "plan," "goal," "seek," "believe," "project," "estimate," "expect," "strategy," "future," "likely," "may," "should," "would," "could," "will" and other words of similar meaning in connection with a discussion of future operating or financial performance. Examples of forward looking statements include, among others, statements relating to future sales, earnings, cash flows, results of operations, uses of cash and other measures of financial performance. Because forward-looking statements relate to the future, they are subject to inherent risks, uncertainties and other factors that may cause the Company's actual results and financial condition to differ materially from those expressed or implied in the forward-looking statements. Such risks, uncertainties and other factors include, among others: (i) changes in domestic and foreign economic and competitive conditions in markets served by the Company, particularly the defense, commercial aviation and industrial production markets; (ii) changes in government and customer priorities and requirements (including cost-cutting initiatives, government and customer shut-downs, the potential deferral of awards, terminations or reductions of expenditures to respond to the priorities of Congress and the Administration, or budgetary cuts resulting from Congressional actions or automatic sequestration); (iii) changes in geopolitical conditions in countries where the Company does or intends to do business; (iv) the successful conclusion of competitions for government programs and thereafter contract negotiations with government authorities, both foreign and domestic; (v) the existence of standard government contract provisions permitting renegotiation of terms and termination for the convenience of the government; (vi) the conclusion to government inquiries or investigations; (vii) risks and uncertainties associated with the successful implementation and ramp up of significant new programs; (viii) potential difficulties associated with variable acceptance test results, given sensitive production materials and extreme test parameters; (ix) the receipt and successful execution of production orders for the U.S. government JPF contract, including the exercise of all contract options and receipt of orders from allied militaries, as all have been assumed in connection with goodwill impairment evaluations; (x) the continued support of the existing K-MAX® helicopter fleet, including sale of existing K-MAX® spare parts inventory; (xi) the accuracy of current cost estimates associated with environmental remediation activities; (xii) the profitable integration of acquired businesses into the Company's operations; (xiii) the ability to implement our ERP systems in a cost-effective and efficient manner, limiting disruption to our business, and to capture their planned benefits while maintaining an adequate internal control environment; (xiv) changes in supplier sales or vendor incentive policies; (xv) the effects of price increases or decreases; (xvi) the effects of pension regulations, pension plan assumptions, pension plan asset performance and future contributions; (xvii) future levels of indebtedness and capital expenditures; (xviii) the continued availability of raw materials and other commodities in adequate supplies and the effect of increased costs for such items; (xix) the effects of currency exchange rates and foreign competition on future operations; (xx) changes in laws and regulations, taxes, interest rates, inflation rates and general business conditions; (xxi) future repurchases and/or issuances of common stock; and (xxii) other risks and uncertainties set forth herein and in our 2013 Form 10-K.

* What is Kaman? Solving Our Customers’ Critical Problems with Technically Differentiated Products & Services Leading Provider of Highly Engineered Aerospace & Industrial Products Serving a Broad Range of End Markets
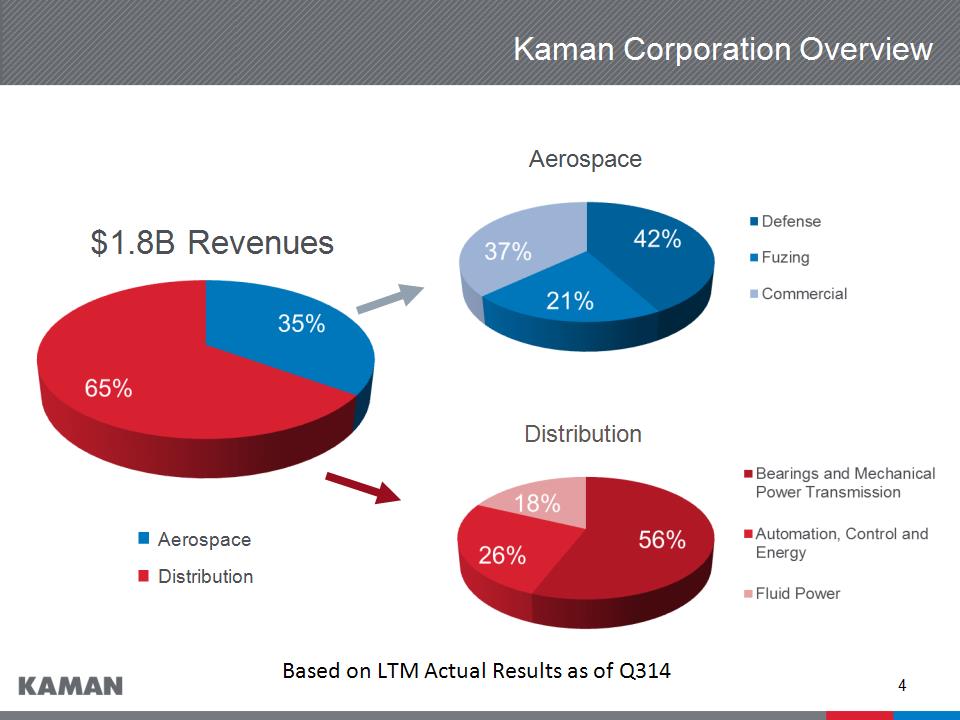
* Distribution Kaman Corporation Overview Distribution Aerospace $1.8B Revenues Aerospace Based on LTM Actual Results as of Q314

* Outstanding portfolio of intellectual property across Aerospace Distribution aligned with best-in-class, vendors Diverse end market exposure provides consistent performance to fund growth Strategically Positioned Kaman Investment Highlights Improving Financials Reliable Business Strategies Focused on driving strong top-line growth Deliver earnings growth through scale and operational execution Generate strong consistent cash flow to fund long-term growth ERP investments will yield improved efficiencies & financial performance over medium-term Disciplined acquisition growth to achieve scale and margin enhancements Continuing focus on innovation to maintain differentiation Relentless effort to drive operational excellence and lean Shared services allow for efficient allocation of resources

* Aerospace Overview v AEROSYSTEMS SPECIALTY BEARINGS & ENGINEERED PRODUCTS FUZING & PRECISION PRODUCTS v Engineering design and testing Tooling design & manufacture Advanced machining and composite aerostructure manufacturing Complex assembly Helicopter MRO and support Self-lube airframe bearings Traditional airframe bearings Flexible drive systems Bomb and missile safe and arm fuzing devices Precision measuring systems Memory products Global commercial and defense OEM’s Super Tier I’s to subcontract manufacturers Aircraft operators and MRO Specialized aerospace distributors Global commercial and defense OEM’s Super Tier I’s to subcontract manufacturers Aircraft operators and MRO Specialized aerospace distributors U.S. and allied militaries Weapon system OEMs “One Kaman” combines design and build capabilities to provide customers with a global integrated solution Bearing product lines strong commercial customer base expected to provide growth from new program wins and higher build rates “One Kaman” combines design and build capabilities to provide customers with a global integrated solution Bearing product lines strong commercial customer base expected to provide growth from new program wins and higher build rates Exclusivity and significant backlog provide a stable revenue base Business Dynamic Customer Product

* Distribution Overview PRODUCT PLATFORM BEARINGS & MECHANICAL POWER TRANSMISSION (BPT) FLUID POWER AUTOMATION, CONTROL & ENERGY (ACE) % of Sales (LTM Q3 2014) 56% 18% 26% Market Size $13 Billion $7 Billion $15 Billion Acquisitions since 2008 Industrial Supply Corp Allied Bearings Supply Plains Bearing Florida Bearings Inc. Ohio Gear and Transmission INRUMEC Catching Northwest Hose & Fittings Western Fluid Components B. W. Rogers Zeller Minarik Target Electronic Supply B. W. Rogers G.C. Fabrication@ Major Suppliers @ Expected to close late January 2015
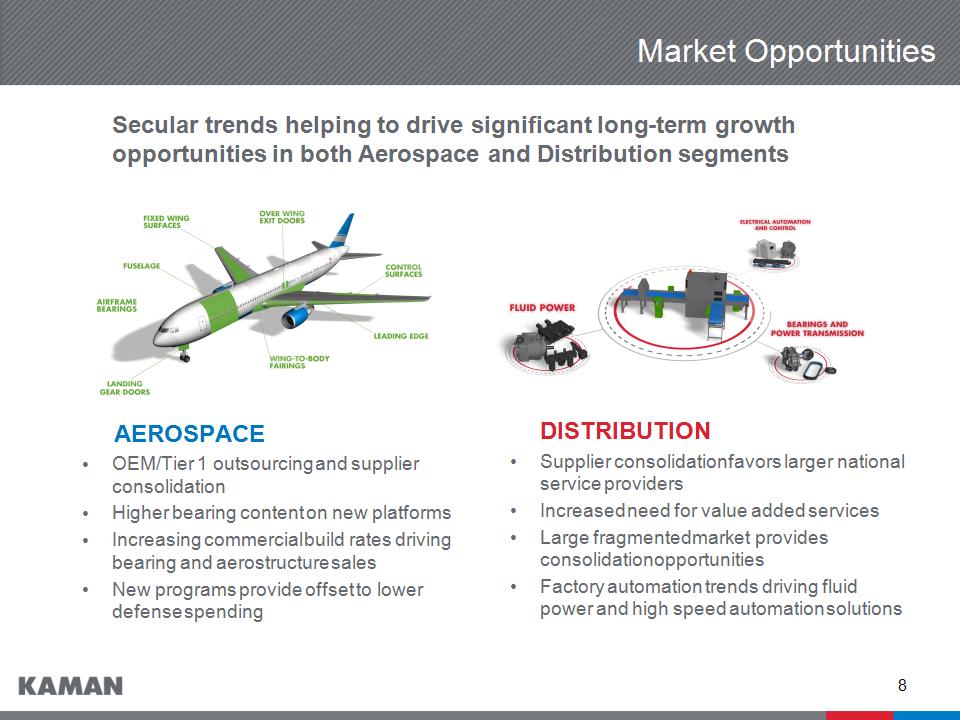
* Market Opportunities Secular trends helping to drive significant long-term growth opportunities in both Aerospace and Distribution segments AEROSPACE OEM/Tier 1 outsourcing and supplier consolidation Higher bearing content on new platforms Increasing commercial build rates driving bearing and aerostructure sales New programs provide offset to lower defense spending DISTRIBUTION Supplier consolidation favors larger national service providers Increased need for value added services Large fragmented market provides consolidation opportunities Factory automation trends driving fluid power and high speed automation solutions

* Organic Growth Drivers Aerospace Distribution “One Kaman Approach” New product development efforts at Specialty Bearings and Precision Products Continued commercial aerospace cycle growth JPF Navy Opportunity Expanded geographic footprint Supplier consolidation Factory automation trends Differentiated product and services Product platform cross-selling National account opportunities Sales force expansion

* Operational Excellence KEY INITIATIVES Significant ERP investments at both Segments New state-of-the-art facilities in the UK and Germany Low Cost Country operations provide margin expansion opportunities Increasing use of automation and robotics are favorably impacting quality, throughput and labor costs

* Acquisition Strategy Framework

* 35% Aerospace

* Aerospace Profile Sales by Product Line LTM Q314 LTM Net Sales Q314 $629M LTM OI% Q314 16.4%(1) Financial Summary Technology Profile (1) Adjusted, excludes goodwill impairment charge of $2.1 million

* Aerospace Strategy

* 1 2 3 4 5 6 7 8 9 10 11 12 13 14 15 16 Aircraft Programs/Capabilities 1. Doors 2. Nose landing gear 3. Engine/thrust reverser 4. Flight controls 5. Flaps 6. Main landing gear 7. Rudder 8. Horizontal stabilizer Bearing Products Other Products 9. Door assemblies 10. Top covers 11. Fixed leading edge 12. Fixed trailing edge 13. Winglets 14. Wing structures, flaps, slats 15. Access doors 16. Nacelle components

* 1 4 1 2 3 5 6 6 6 7 Aircraft Programs/Capabilities 1. Flexible drive systems 2. Flight control bearings 3. Landing gear bearings Bearing Products Other Products 4. Manufacture and assembly of tail rotor pylon 5. Blade manufacture, repair and overhaul 6. Manufacture and subassembly of cabins and structures 7. Manufacture of cockpit
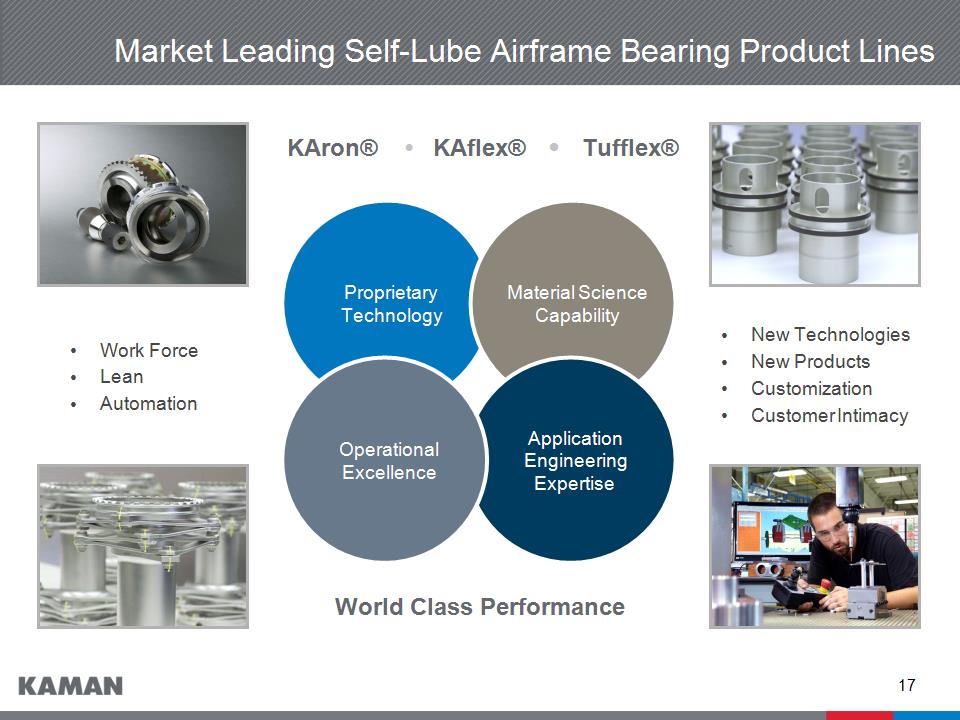
* Market Leading Self-Lube Airframe Bearing Product Lines Proprietary Technology Material Science Capability Application Engineering Expertise Operational Excellence KAron® • KAflex® • Tufflex® New Technologies New Products Customization Customer Intimacy Work Force Lean Automation World Class Performance

* Fuzing Products SLAM-ER HARPOON MAVERICK AMRAAM FMU-139 TOMAHAWK JPF STANDARD MISSILE SLAM-ER SLAM-ER AMRAAM TOMAHAWK STANDARD MISSILE AGM-65M AMRAAM On a Majority of U.S. Weapon Systems
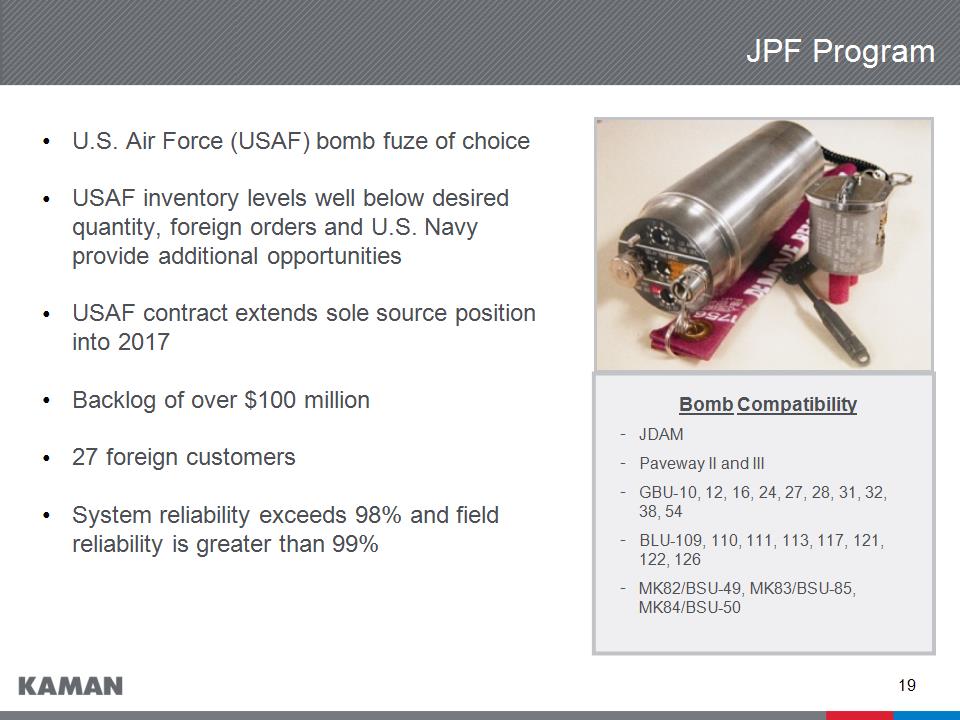
* U.S. Air Force (USAF) bomb fuze of choice USAF inventory levels well below desired quantity, foreign orders and U.S. Navy provide additional opportunities USAF contract extends sole source position into 2017 Backlog of over $100 million 27 foreign customers System reliability exceeds 98% and field reliability is greater than 99% Bomb Compatibility JDAM Paveway II and III GBU-10, 12, 16, 24, 27, 28, 31, 32, 38, 54 BLU-109, 110, 111, 113, 117, 121, 122, 126 MK82/BSU-49, MK83/BSU-85, MK84/BSU-50 JPF Program
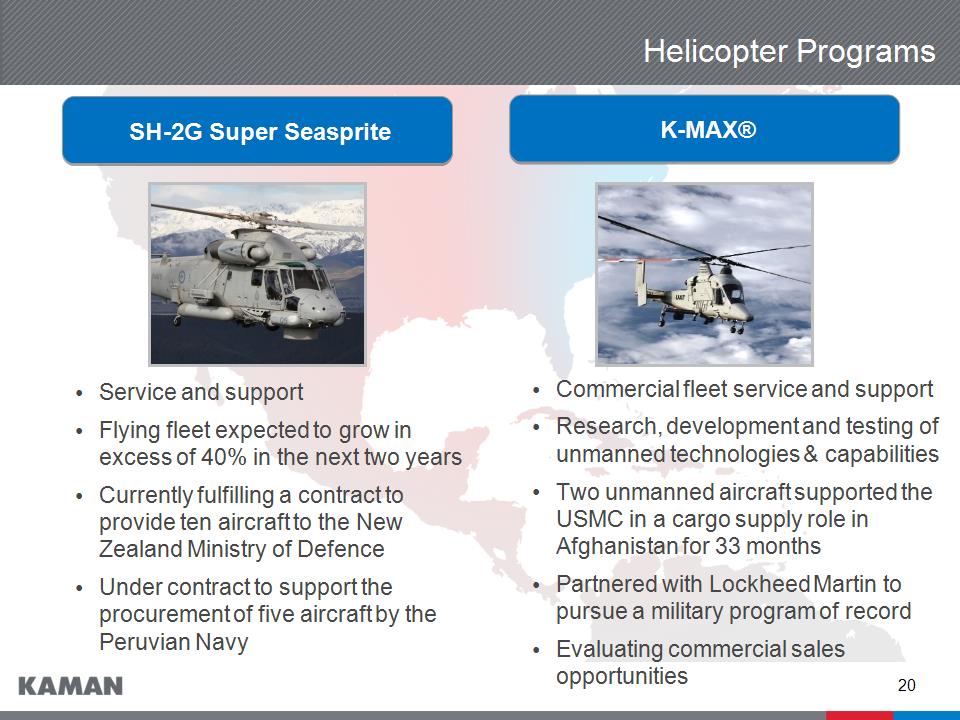
* Helicopter Programs SH-2G Super Seasprite K-MAX® Service and support Flying fleet expected to grow in excess of 40% in the next two years Currently fulfilling a contract to provide ten aircraft to the New Zealand Ministry of Defence Under contract to support the procurement of five aircraft by the Peruvian Navy Commercial fleet service and support Research, development and testing of unmanned technologies & capabilities Two unmanned aircraft supported the USMC in a cargo supply role in Afghanistan for 33 months Partnered with Lockheed Martin to pursue a military program of record Evaluating commercial sales opportunities

* Aerospace – Key 2015 Operational Objectives Complete the New Zealand SH-2(G)I contract and transition to the Peru program Build on the growth and success of bearing product lines Continue to ramp up programs to full rate production to build on improved cash flow generation Build on the “One Kaman” effort to offer customers a one stop solution for their Aerosystem needs and close open bids Capitalize on market opportunities for fuze programs Continue improvement in operational execution across the segment to enhance competitiveness and margins

* Distribution

* Kaman Distribution Segment LTM Q314 Net Sales $1,145M LTM Q314 OI% 4.4% # of Customers 65,000 SKUs in Catalog 4+ million Business Overview Served Market Size = $35B dollars in billions Source: PTDA Market Size Report; US Census Bureau; ARC Advisory

* Business Strategies

* Scale Distribution – Road to 7+% Operating Margin TODAY <5% FUTURE 7+% Improved Operational Efficiencies Product Mix Strategic Pricing CATALYSTS

* Platform Evolution a a a For the years 2009-2013 a

* Executing Strategy and Building Network

* Acquisitions in all Product Platforms Distribution Group Sales

* GCF Acquisition Announced an agreement to acquire the assets of G.C. Fabrication, Inc. (expected to close late January) A premier Schneider Electric distributor, ~ $20 Million in revenue Highly complimentary product offering & brands of electrical control, power, process and automation Services include systems programming, power & energy management, communication & networking, HVAC systems Will extend key brand authorizations into New York metro area for industrial, commercial building & infrastructure markets 5th acquisition in AC&E platform since 2010 Expected to be accretive and integrate rapidly with Automation, Control & Energy platform of the Distribution segment

* Adding Leading Brands in Multiple Technologies PLCs, HMIs Sensors & Signaling Machine Safety Hydraulics Pneumatics Fluid Connectors Motion Control Servos & Steppers Linear Motion Bearings Power Transmission Industrial Supplies Value- Added Technologies

* Extensive Solution and Service Capabilities

* Distribution – Key 2015 Operational Objectives Continue to drive higher margins across the segment Increase organic growth, capitalizing on expense leverage through increased customer engagement, and broader product offering across our three business platforms Continue to pursue accretive acquisitions and gain additional sales and cost synergies from completed acquisitions Continue deployment of new ERP system to consolidate disparate systems and drive significant productivity enhancements Leverage strong supplier relationships to increase sales of higher margin product lines

* Proven strategies have delivered strong shareholder value over time Aerospace – Leveraging unique set of proprietary products and capabilities – Strong platform positions across commercial & defense markets – Robust pipeline of future opportunities Distribution – Three product platform strategy expands growth opportunities – Increased scale provides improved operating leverage – ERP implementation benefits Successfully execute future acquisitions - maintain discipline Leverage experienced management and workforce across the company Positioned for Future Growth

* Financial Information

* Financial Highlights – Full Year 2013

* Financial Highlights – Full Year 2013

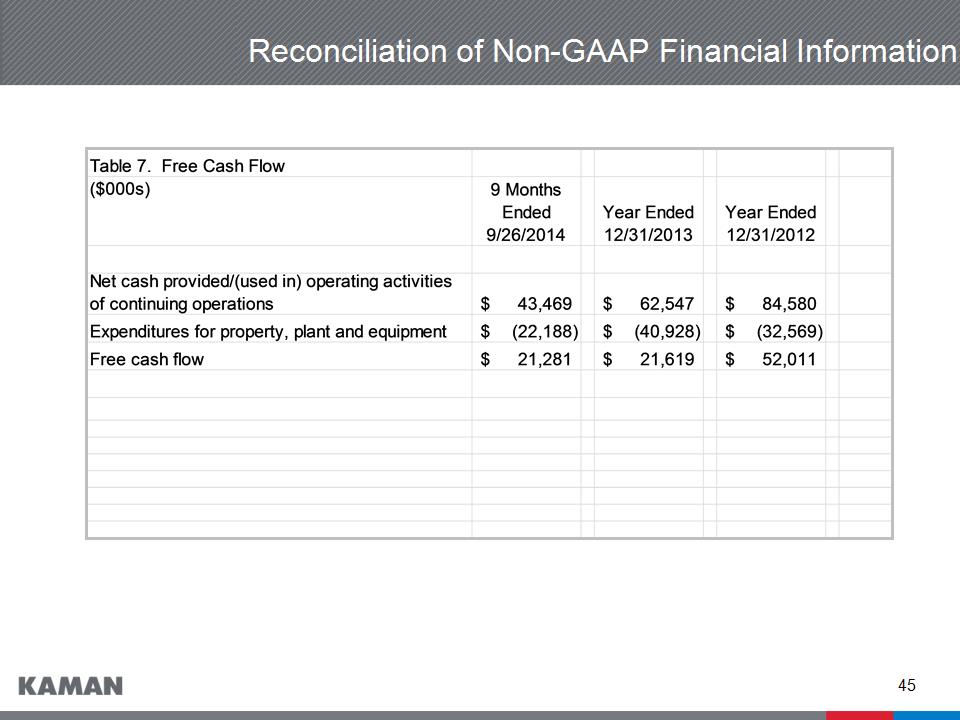
* Balance Sheet, Capital Factors, and Cash Flow Items (In Millions) As of 9/26/14 As of 12/31/13 As of 12/31/12 Cash and Cash Equivalents $ 9.8 $ 10.4 $ 16.6 Notes Payable and Long-term Debt $ 338.0 $ 275.2 $ 259.6 Shareholders’ Equity $ 547.7 $ 511.3 $ 420.2 Debt as % of Total Capitalization 38.2% 35.0% 38.2% Capital Expendituresa $ 22.2 $ 40.9 $ 32.6 Depreciation & Amortizationa $ 26.5 $ 31.9 $ 28.4 Free Cash Flow*a $ 21.3 $ 21.6 $ 52.0 aYTD 9/26/2014
* Appendix I Non-GAAP Reconciliations

* Reconciliation of Non-GAAP Financial Information

* Reconciliation of Non-GAAP Financial Information

* Reconciliation of Non-GAAP Financial Information

* Reconciliation of Non-GAAP Financial Information

* Reconciliation of Non-GAAP Financial Information

* Reconciliation of Non-GAAP Financial Information
* Reconciliation of Non-GAAP Financial Information

* Appendix II Incentive Compensation

* Performance-Driven Incentives Annual cash incentive driven by financial performance Corporate – compared against the 5-year average of Russell 2000: Return on Investment EPS growth EPS performance against plan Business Units – compared against targets Return on Investment Year over year growth in operating income Year over year growth in sales Free cash flow Senior Executives – Long-term Incentive Return on Investment Growth in EPS Total Shareholder Return