Attached files
| file | filename |
|---|---|
| EX-24 - EXHIBIT 24 - KAMAN Corp | kamn-12312014ex24.htm |
| EX-21 - EXHIBIT 21 - KAMAN Corp | kamn-12312014ex21.htm |
| EX-23.2 - EXHIBIT 23.2 - KAMAN Corp | kamn-12312014ex232.htm |
| EX-32.2 - EXHIBIT 32.2 - KAMAN Corp | kamn-12312014ex322.htm |
| EX-31.2 - EXHIBIT 31.2 - KAMAN Corp | kamn-12312014ex312.htm |
| EX-31.1 - EXHIBIT 31.1 - KAMAN Corp | kamn-12312014ex311.htm |
| EX-32.1 - EXHIBIT 32.1 - KAMAN Corp | kamn-12312014ex321.htm |
| EX-23.1 - EXHIBIT 23.1 - KAMAN Corp | kamn-12312014ex231.htm |
| EXCEL - IDEA: XBRL DOCUMENT - KAMAN Corp | Financial_Report.xls |
UNITED STATES
SECURITIES AND EXCHANGE COMMISSION
WASHINGTON, D.C. 20549
FORM 10-K
x | ANNUAL REPORT PURSUANT TO SECTION 13 OR 15(d) OF THE SECURITIES EXCHANGE ACT OF 1934 |
For the fiscal year ended December 31, 2014 | |
Commission File No. 001-35419
KAMAN CORPORATION
(Exact name of registrant as specified in its charter)
Connecticut | 06-0613548 | |
(State or other jurisdiction | (I.R.S. Employer | |
of incorporation or organization) | Identification No.) | |
1332 Blue Hills Avenue
Bloomfield, Connecticut 06002
(Address of principal executive offices)
Registrant's telephone number, including area code: (860) 243-7100
Securities registered pursuant to Section 12(b) of the Act:
Title of each class | Name of each exchange on which registered | |
Common Stock ($1 par value) | New York Stock Exchange LLC | |
Securities registered pursuant to Section 12(g) of the Act: None
Indicate by check mark if the registrant is a well-known seasoned issuer, as defined in Rule 405 of the Securities Act.
Yes x No ¨
Indicate by check mark if the registrant is not required to file reports pursuant to Section 13 or Section 15(d) of the Exchange Act. Yes ¨ No x
Indicate by check mark whether the registrant (1) has filed all reports required to be filed by Section 13 or 15 (d) of the Securities Exchange Act of 1934 during the preceding 12 months (or for such shorter period that the registrant was required to file such reports), and (2) has been subject to such filing requirements for the past 90 days. Yes x No ¨
Indicate by checkmark whether the registrant has submitted electronically and posted on its corporate web site, if any, every Interactive Data File required to be submitted and posted pursuant to Rule 405 of Regulation S-T (Section 232.405 of this chapter) during the preceding 12 months (or for such shorter period that the registrant was required to submit and post such files). Yes x No ¨
Indicate by check mark if disclosure of delinquent filers pursuant to Item 405 of Regulation S-K (Section 229.405 of this chapter) is not contained herein, and will not be contained, to the best of registrant's knowledge, in definitive proxy or information statements incorporated herein by reference in Part III of this Form 10-K or any amendment to this Form 10-K x
Indicate by check mark whether the registrant is a large accelerated filer, an accelerated filer, a non-accelerated filer or a smaller reporting company. See definitions of “large accelerated filer”, “accelerated filer” and “smaller reporting company” in Rule 12b-2 of the Exchange Act.
Large accelerated filer x Accelerated filer ¨ Non-accelerated filer ¨ Smaller reporting company ¨
Indicate by check mark whether the registrant is a shell company (as defined in Rule 12b-2 of the Exchange Act). Yes o No x
The aggregate market value on June 27, 2014, (the last business day of the Company’s most recently completed second quarter) of the voting common stock held by non-affiliates of the registrant, computed by reference to the closing price of the stock, was approximately $1,134,777,043.
At January 30, 2015, there were 27,140,073 shares of Common Stock outstanding.
Documents Incorporated Herein By Reference
Portions of our definitive proxy statement for our 2015 Annual Meeting of Shareholders are incorporated by reference into Part III of this Report.
Kaman Corporation
Index to Form 10-K
Part I | ||
Item 1 | ||
Item 1A | ||
Item 1B | ||
Item 2 | ||
Item 3 | ||
Item 4 | ||
Part II | ||
Item 5 | ||
Item 6 | ||
Item 7 | ||
Item 7A | ||
Item 8 | ||
Item 9 | ||
Item 9A | ||
Item 9B | ||
Part III | ||
Item 10 | ||
Item 11 | ||
Item 12 | ||
Item 13 | ||
Item 14 | ||
Part IV | ||
Item 15 | ||
2
PART I
ITEM 1. | BUSINESS |
GENERAL
Kaman Corporation, headquartered in Bloomfield, Connecticut, was incorporated in 1945. We are a diversified company that conducts business in the aerospace and distribution markets. We report information for ourselves and our subsidiaries (collectively, “we,” “us,” “our,” and “the Company”) in two business segments, Distribution and Aerospace. A discussion of 2014 developments is included in Item 7, Management’s Discussion and Analysis of Financial Condition and Results of Operations, in this Form 10-K.
Distribution Segment
The Distribution segment brings our commitment to technological leadership and value-added services to the distribution business. The Distribution segment is a leading power transmission, motion control, electrical and automation, and fluid power industrial distributor with operations throughout the United States. We provide products including bearings, mechanical and electrical power transmission, fluid power, motion control, automation, material handling components, electrical control and power distribution, and MRO supplies to a broad spectrum of industrial markets throughout the United States. Locations consist of over 240 branches, distribution centers and call centers across the United States (including Puerto Rico). We offer approximately four million items, as well as value-added services, to over 65,000 active customers representing a highly diversified cross section of North American industry.
Aerospace Segment
The Aerospace segment produces and/or markets proprietary aircraft bearings and components; complex metallic and composite aerostructures for commercial, military and general aviation fixed and rotary wing aircraft; safe and arming solutions for missile and bomb systems for the U.S. and allied militaries; subcontract helicopter work; support for our SH-2G Super Seasprite maritime helicopters and K-MAX® manned and unmanned medium-to-heavy lift helicopters; and engineering design, analysis and certification services.
Principal customers include the U.S. military, Sikorsky Aircraft Corporation, The Boeing Company, Bell Helicopter, Airbus, Lockheed Martin and Raytheon. The SH-2G aircraft is currently in service with the Egyptian Air Force and the New Zealand and Polish navies. Operations are conducted throughout the United States, as well as in facilities located in the United Kingdom, Germany and Mexico. Additionally, the Company maintains an investment in a joint venture in India.
FINANCIAL INFORMATION ABOUT OUR SEGMENTS
Financial information about our segments is included in Item 7, Management’s Discussion and Analysis of Financial Condition and Results of Operations, and Note 19, Segment and Geographic Information, of the Notes to Consolidated Financial Statements, included in Item 8, Financial Statements and Supplementary Data, of this Annual Report on Form 10-K.
WORKING CAPITAL
A discussion of our working capital is included in Item 7, Management’s Discussion and Analysis of Financial Condition and Results of Operations – Liquidity and Capital Resources, in this Form 10-K.
Our Distribution segment requires substantial working capital related to accounts receivable and inventories. Significant amounts of inventory are carried to meet our customers’ requirements. Sales returns do not have a material effect on our working capital requirements.
Our Aerospace segment’s working capital requirements are dependent on the nature and life cycles of the programs for which work is performed. New programs may initially require higher working capital to complete nonrecurring start-up activities and fund the purchase of inventory and equipment necessary to perform the work. Non-recurring start-up costs on large and complex programs often take longer to recover, negatively impacting working capital in the short-term and producing a corresponding benefit in future periods. As these programs mature and efficiencies are gained in the production process, working capital requirements generally decrease.
3
Our credit agreement includes a revolving credit facility which is available for additional working capital requirements and investment opportunities. See Item 7, Management's Discussion and Analysis of Financial Condition and Results of Operations, and Note 11, Debt, of the Notes to Consolidated Financial Statements, included in Item 8, Financial Statements and Supplementary Data, of this Annual Report on Form 10-K.
PRINCIPAL PRODUCTS AND SERVICES
The following is information for the three preceding years concerning the percentage contribution of each business segment’s products and services to consolidated net sales from continuing operations:
Years Ended December 31, | |||||||||
2014 | 2013 | 2012 | |||||||
Distribution | 64.7 | % | 62.9 | % | 62.9 | % | |||
Aerospace | 35.3 | % | 37.1 | % | 37.1 | % | |||
Total | 100.0 | % | 100.0 | % | 100.0 | % | |||
AVAILABILITY OF RAW MATERIALS
While we believe we have sufficient sources for the materials, components, services and supplies used in our manufacturing activities, we are highly dependent on the availability of essential materials, parts and subassemblies from our suppliers and subcontractors. The most important raw materials required for our aerospace products are aluminum (sheet, plate, forgings and extrusions), titanium, nickel, copper and composites. Many major components and product equipment items are procured from or subcontracted on a sole-source basis with a number of domestic and non-U.S. companies. Although alternative sources generally exist for these raw materials, qualification of the sources could take a year or more. We are dependent upon the ability of a large number of suppliers and subcontractors to meet performance specifications, quality standards and delivery schedules at anticipated costs. While we maintain an extensive qualification system to control risk associated with such reliance on third parties, failure of suppliers or subcontractors to meet commitments could adversely affect production schedules and contract profitability, while jeopardizing our ability to fulfill commitments to our customers. Although high prices for some raw materials important to some of our products (steel, copper, aluminum, titanium and nickel) may cause margin and cost pressures, we do not foresee any near term unavailability of materials, components or supplies that would have an adverse effect on either of our business segments. For further discussion of the possible effects of changes in the cost or availability of raw materials on our business, see Item 1A, Risk Factors, in this Form 10-K.
PATENTS AND TRADEMARKS
We hold patents and trademarks reflecting functional, design and technical accomplishments in a wide range of areas covering both basic production of certain aerospace products as well as highly specialized devices and advanced technology products in defense related and commercial fields.
Although the Company's patents and trademarks enhance our competitive position, we believe that none of such patents or trademarks is singularly or as a group essential to our business as a whole. We hold or have applied for U.S. and foreign patents with expiration dates that range through the year 2027.
Registered trademarks of the Company include KAflex®, KAron®, and K-MAX®. In all, we maintain 18 U.S. and foreign trademarks.
BACKLOG
The majority of our backlog is attributable to the Aerospace segment. We anticipate that approximately 79.9% of our backlog at the end of 2014 will be performed in 2015. Approximately 57.5% of the Aerospace segment's backlog at the end of 2014 is related to U.S. Government contracts or subcontracts.
4
Total backlog at December 31, 2014, 2013 and 2012, and the portion of the backlog we expect to complete in 2015, is as follows:
Total Backlog at December 31, 2014 | 2014 Backlog to be completed in 2015 | Total Backlog at December 31, 2013 | Total Backlog at December 31, 2012 | |||||||||||||
In thousands | ||||||||||||||||
Aerospace | $ | 518,025 | $ | 399,916 | $ | 601,954 | $ | 531,923 | ||||||||
Distribution | 70,154 | 70,154 | 50,667 | 47,607 | ||||||||||||
Total | $ | 588,179 | $ | 470,070 | $ | 652,621 | $ | 579,530 | ||||||||
Backlog related to uncompleted contracts for which we have recorded a provision for estimated losses was $3.0 million as of December 31, 2014. There was no amount in backlog that was firm but not yet funded at December 31, 2014. See Item 7, Management's Discussion and Analysis of Financial Condition and Results of Operations for further discussion.
REGULATORY MATTERS
Government Contracts
The U.S. Government ("USG"), and other governments, may terminate any of our government contracts at their convenience or for default if we fail to meet specified performance measurements. If any of our government contracts were to be terminated for convenience, we generally would be entitled to receive payment for work completed and allowable termination or cancellation costs. If any of our government contracts were to be terminated for default, generally the USG would pay only for the work that has been accepted and can require us to pay the difference between the original contract price and the cost to re-procure the contract items, net of the work accepted from the original contract. The USG can also hold us liable for damages resulting from the default.
During 2014, approximately 98.3% of the work performed by the Company directly or indirectly for the USG was performed on a fixed-price basis and the balance was performed on a cost-reimbursement basis. Under a fixed-price contract, the price paid to the contractor is negotiated at the outset of the contract and is not generally subject to adjustment to reflect the actual costs incurred by the contractor in the performance of the contract. Cost reimbursement contracts provide for the reimbursement of allowable costs and an additional negotiated fee.
Compliance with Environmental Protection Laws
Our operations are subject to and affected by a variety of federal, state, local and non-U.S. environmental laws and regulations relating to the discharge, treatment, storage, disposal, investigation and remediation of certain materials, substances and wastes. We continually assess our compliance status and management of environmental matters in an effort to ensure our operations are in substantial compliance with all applicable environmental laws and regulations.
Operating and maintenance costs associated with environmental compliance and management of sites are a normal, recurring part of our operations. These costs often are allowable costs under our contracts with the USG. It is reasonably possible that continued environmental compliance could have a material impact on our results of operations, financial condition or cash flows if more stringent clean-up standards are imposed, additional contamination is discovered and/or clean-up costs are higher than estimated.
See Environmental Matters in Item 3, Legal Proceedings, and Critical Accounting Estimates - Environmental Costs in Item 7, Management's Discussion and Analysis of Financial Condition and Results of Operations, and Note 16, Commitments and Contingencies, in the Notes to Consolidated Financial Statements, included in Item 8, Financial Statements and Supplementary Data, of this Annual Report on Form 10-K, for further discussion of our environmental matters.
With respect to all other matters that may currently be pending, in the opinion of management, based on our analysis of relevant facts and circumstances, we do not believe that compliance with relevant environmental protection laws is likely to have a material adverse effect upon our capital expenditures, earnings or competitive position. In arriving at this conclusion, we have taken into consideration site-specific information available regarding total costs of any work to be performed, and the extent of work previously performed. If we are identified as a “potentially responsible party” (PRP) by environmental authorities at a particular site, we, using information available to us, will also review and consider a number of other factors, including: (i) the financial resources of other PRPs involved in each site, and their proportionate share of the total volume of waste at the site; (ii) the existence of insurance, if any, and the financial viability of the insurers; and (iii) the success others have had in receiving reimbursement for similar costs under similar insurance policies issued during the periods applicable to each site.
5
International
Our international sales are subject to U.S. and non-U.S. governmental regulations and procurement policies and practices, including regulations relating to import-export control, investment, exchange controls and repatriation of earnings. International sales are also subject to varying currency, political and economic risks.
Section 219 of the Iran Threat Reduction and Syria Human Rights Act of 2012 ("ITRA") added subsection (r) to section 13 of the Securities Exchange Act of 1934, as amended, (the "Exchange Act"), requiring a public reporting issuer to disclose in its annual or quarterly reports whether it or any of its affiliates have knowingly engaged in specified activities or transactions relating to Iran, including activities not prohibited by U.S. law and conducted outside the U.S. by non-U.S. affiliates in compliance with local law. Issuers must also file a notice with the U.S. Securities and Exchange Commission ("SEC") if any disclosable activities under ITRA have been included in the annual or quarterly report. We did not have any disclosable activities for the year ended December 31, 2014.
COMPETITION
The Distribution segment competes for business with several other national distributors of bearings, power transmission, electrical and fluid power products, two of which are substantially larger, and with many regional and local distributors and Original Equipment Manufacturers ("OEMs"). Competitive forces have intensified due to the increasing trend towards national contracts, customers' efforts to obtain material cost savings and the extension of supplier product authorizations within the distribution channel. We compete for business based upon the breadth and quality of products offered, product availability, delivery performance, and price, as well as on the basis of value-added services that we are able to provide.
The Aerospace segment operates in a highly competitive environment with many other organizations, some of which are substantially larger than us and have greater financial strength and more extensive resources. We compete for composite and metallic aerostructures subcontracts, helicopter structures, bearings and components business on the basis of price and quality; product endurance and special performance characteristics; proprietary knowledge; the quality of our products and services; the availability of facilities, equipment and personnel to perform contracts; and the reputation of our business. Competitors for our business include small machine shops and offshore manufacturing facilities. We compete for engineering design services business primarily on the basis of technical competence, the reputation of our business, the availability of our personnel and price. We compete for advanced technology fuzing business primarily on the basis of technical competence, product quality and price; and also on the basis of our experience as a developer and manufacturer of fuzes for particular weapon types and the availability of our facilities, equipment and personnel. We are also affected by the political and economic circumstances of our potential foreign customers.
RESEARCH AND DEVELOPMENT EXPENDITURES
Government funded research expenditures (which are included in cost of sales) were $1.6 million in 2014, $3.3 million in 2013, and $7.8 million in 2012. Independent research and development expenditures (which are included in selling, general and administrative expenses) were $6.7 million in 2014, $7.2 million in 2013, and $5.5 million in 2012.
EMPLOYEES
As of December 31, 2014, we employed 4,797 individuals.
FINANCIAL INFORMATION ABOUT GEOGRAPHIC AREAS
Financial information about geographic areas is included in Note 19, Segment and Geographic Information, of the Notes to Consolidated Financial Statements, included in Item 8, Financial Statements and Supplementary Data, of this Annual Report on Form 10-K.
6
AVAILABLE INFORMATION
We are subject to the reporting requirements of the Exchange Act and its rules and regulations. The Exchange Act requires us to file reports, proxy statements and other information with the SEC. Copies of these reports, proxy statements and other information can be read and copied at:
SEC Public Reference Room
100 F Street NE
Washington, D.C. 20549
Information on the operation of the Public Reference Room may be obtained by calling the SEC at 1-800-732-0330. The SEC maintains a website that contains reports, proxy statements and other information regarding issuers that file electronically with the SEC. These materials may be obtained electronically by accessing the SEC’s website at http://www.sec.gov.
We make available, free of charge on our website, our annual reports on Form 10-K, quarterly reports on Form 10-Q, proxy statements, and current reports on Form 8-K as well as amendments to those reports filed or furnished pursuant to Section 13 or 15(d) of the Exchange Act, together with Section 16 insider beneficial stock ownership reports, as soon as reasonably practicable after we electronically file these documents with, or furnish them to, the SEC. These documents are posted on our website at www.kaman.com — select the “Investor Relations” link, then the "Financial Information" link and then the “SEC Filings” link.
We also make available, free of charge on our website, our Certificate of Incorporation, By–Laws, Governance Principles and all Board of Directors' standing Committee Charters (Audit, Corporate Governance, Personnel & Compensation and Finance). These documents are posted on our website at www.kaman.com — select the “Investor Relations” link and then the "Corporate Governance" link.
The information contained on our website is not intended to be, and shall not be deemed to be, incorporated into this
Form 10-K or any other filing under the Exchange Act or the Securities Act of 1933, as amended.
7
EXECUTIVE OFFICERS OF THE REGISTRANT
The Company’s executive officers as of the date of this report are as follows:
Name | Age | Position | Prior Experience |
Neal J. Keating | 59 | Chairman, President, Chief Executive Officer and Director | Mr. Keating was appointed President and Chief Operating Officer as well as elected a Director of the company effective September 17, 2007. Effective January 1, 2008, he was appointed to the offices of President and Chief Executive Officer and effective March 1, 2008, he was appointed to the additional position of Chairman. Prior to joining the company, Mr. Keating served as Chief Operating Officer at Hughes Supply, a $5.4 billion industrial distributor that was acquired by Home Depot in 2006. Prior to that, he held senior positions at GKN Aerospace, an aerospace subsidiary of GKN, plc, and Rockwell Collins Commercial Systems, and served as a board member of GKN plc and Agusta-Westland. |
Steven J. Smidler | 56 | President of Kaman Industrial Technologies and Executive Vice President of Kaman Corporation | Mr. Smidler assumed the role of President of Kaman Industrial Technologies on September 1, 2010, after joining the company in December 2009 as Senior Vice President and Chief Operating Officer of Kaman Industrial Technologies. Effective February 20, 2012, he was appointed Executive Vice President of Kaman Corporation. Mr. Smidler joined the company from Lenze Americas Corporation where he served as Executive Vice President, with responsibility for marketing, sales, finance, business systems and product technology for the Americas. Mr. Smidler was also a member of the management committee of the Lenze Group, Germany, and held the position of President and Treasurer for Lenze Americas and served as Treasurer and a Board member for the Lenze ACTech production company. Prior to that, he served as Vice President, Americas Sales Operations at Eaton Corporation and Vice President, Marketing of the Global Manufacturing Group at Rockwell Automation, Inc. |
Gregory L. Steiner | 57 | President of Kaman Aerospace Group, Inc. and Executive Vice President of Kaman Corporation | Mr. Steiner joined the company as President of Kaman Aerospace Group, Inc., with overall responsibility for the company's Aerospace segment, effective July 7, 2008. Effective February 20, 2012, he was appointed Executive Vice President of Kaman Corporation. From 2005 to 2007, Mr. Steiner was employed at GE Aviation-Systems, serving first as Vice President and General Manager, Military Mission Systems and then as Vice President, Systems for GE Aviation-Systems. Prior to that, he served as Group Vice President at Curtiss-Wright Controls, Inc., with responsibility for four aerospace and industrial electronics businesses located in the U.S. and U.K. Before Curtiss Wright, he had an 18 year career with Rockwell Collins, Inc., serving in a number of progressively responsible positions, departing as Vice President and General Manager of Passenger Systems. |
Ronald M. Galla | 63 | Senior Vice President and Chief Information Officer | Mr. Galla has been Senior Vice President and Chief Information Officer since 1995. Mr. Galla has been responsible for the Company's management information systems since 1984. |
Phillip A. Goodrich | 58 | Senior Vice President - Corporate Development | Mr. Goodrich, joined the company in 2009 as Vice President - Corporate Development and was named Senior Vice President - Corporate Development in February 2012. He was previously Senior Vice President, Corporate Development with Barnes Group, Inc., Bristol, Connecticut. Mr. Goodrich held similar positions with Ametek, Inc., Paoli, Pennsylvania; and General Signal Corporation, Stamford, Connecticut. |
8
Name | Age | Position | Prior Experience |
Shawn G. Lisle | 48 | Senior Vice President and General Counsel | Mr. Lisle joined the company in 2011 and was appointed Senior Vice President and General Counsel effective December 1, 2012. Prior to joining the company, Mr. Lisle served as Senior Counsel for International Paper Company in Memphis, Tennessee. Prior to that, he served as legal counsel for Dana Corporation in Toledo, Ohio, and as an attorney at Porter Wright Morris & Arthur LLP in Columbus, Ohio. He also previously worked as a trial attorney at the U.S. Department of Justice, Tax Division in Washington, D.C. and was a Judge Advocate in the U.S. Navy. |
Robert D. Starr | 47 | Senior Vice President and Chief Financial Officer | Mr. Starr was appointed Senior Vice President and Chief Financial Officer effective July 1, 2013. Mr. Starr joined the company in 2009 as Vice President - Treasurer. Prior to joining Kaman, Mr. Starr served as Assistant Treasurer at Crane Co. of Stamford, Connecticut, a $2.6 billion diversified manufacturer of highly engineered industrial products. He also previously served as Managing Director, Corporate Finance at Aetna, Inc. of Hartford, Connecticut and as Director, Capital Markets and Risk Management at Fisher Scientific International, Inc. of Hampton, New Hampshire. Mr. Starr was also an associate at both Salomon Smith Barney in New York and Chase Securities, Inc. in New York and Singapore. |
Gregory T. Troy | 59 | Senior Vice President – Human Resources and Chief Human Resources Officer | Mr. Troy joined the company as Senior Vice President – Human Resources in March 2012. On February 19, 2013, he was appointed to the position of Chief Human Resources Officer. Prior to joining the company, Mr. Troy served as Chief Human Resources Officer of Force Protection, Inc. from April 2011 to March 2012 , where he was a member of the Executive Committee. Prior to joining Force Protection, Mr. Troy served as Vice President and Chief Human Resources Officer at Modine Manufacturing Company from February 2006 to April 2011, providing global human resources leadership in the Americas, Europe and Asia. Mr. Troy also previously worked in OMNOVA Solutions Inc., Bosch Corporation, and Mobil Corporation, after serving as a Transportation Officer in the United States Army. |
John J. Tedone | 50 | Vice President, Finance and Chief Accounting Officer | From April 2006 to April 2007, Mr. Tedone served as Vice President, Internal Audit and prior to that as Assistant Vice President, Internal Audit. |
Each executive officer holds office for a term of one year and until his or her successor is duly appointed and qualified, in accordance with the Company’s By-Laws.
9
ITEM 1A. RISK FACTORS
Our business, financial condition, operating results and cash flows can be impacted by the factors set forth below, any one of which could cause our actual results to vary materially from recent results or from our anticipated future results.
Our future operating results may be impacted by changes in global economic and political conditions.
Our future operating results and liquidity may be impacted by changes in general economic and political conditions which may affect, among other things, the following:
• | The availability of credit and our ability to obtain additional bank financing, the lack of which may limit our ability to invest in capital projects and planned expansions or to fully execute our business strategy; |
• | Market rates of interest, any increase in which would increase the interest payable on some of our borrowings and adversely impact our cash flow; |
• | The investment performance of our pension plan, as well as the associated discount rate, any adverse changes in which may result in a deterioration in the funded status of the plan and an increase in required contributions and plan expense; |
• | The relationship between the U.S. Dollar and other currencies, any changes in which could negatively impact our financial results; |
• | The ability of our customers to pay for products and services on a timely basis, any adverse change in which could negatively impact sales and require us to increase our bad debt reserves; |
• | The amount of orders we receive from our customers, any adverse change in which could result in lower operating profits as well as less absorption of fixed costs due to a decreased business base; and |
• | The ability of our suppliers to meet our demand requirements, maintain the pricing of their products, or continue operations, which may require us to find and qualify new suppliers. |
While general economic and political conditions have not impaired our ability to access credit markets and finance our operations to date, there can be no assurance that we will not experience future adverse effects that may be material to our cash flows, competitive position, financial condition, results of operations, or our ability to access capital.
Our financial performance is significantly influenced by conditions within the aerospace industry.
The results of our Aerospace segment, which generated approximately 35.3% of our 2014 consolidated net sales, and approximately 65.7% of our 2014 operating income from continuing operations before corporate expenses, are directly tied to economic conditions in the commercial aviation and defense industries. Changes in economic conditions may cause customers to request that firm orders be rescheduled or canceled, which could put a portion of our backlog at risk. Additionally, a significant amount of work that we perform under contract tends to be for a few large customers.
The commercial aviation industry tends to be cyclical, and capital spending by airlines and aircraft manufacturers may be influenced by a variety of global factors including current and future traffic levels, aircraft fuel pricing, labor issues, competition, the retirement of older aircraft, regulatory changes, terrorism and related safety concerns, general economic conditions, worldwide airline profits and backlog levels.
The defense industry is also affected by a changing global political environment, continued pressure on U.S. and global defense spending, U.S. foreign policy and the activity level of military flight operations.
Changes to the defense industry and continued pressure to reduce U.S. defense spending could have a material impact on several of our current aerospace programs, which could adversely affect our operating results. To mitigate these risks, we have worked to expand our customer and product bases within the commercial market.
Furthermore, because of the lengthy research and development cycle involved in bringing new products to market, we cannot predict the economic conditions that will exist when a new product is introduced. A reduction in capital spending in the aviation or defense industries could have a significant effect on the demand for our products, which could have an adverse effect on our financial performance or results of operations.
10
Our USG programs are subject to unique risks.
We have several significant long-term contracts either directly with the USG or where the USG is the ultimate customer, including the Sikorsky BLACK HAWK cockpit program, the Joint Programmable Fuze (“JPF”) program, the Bell Helicopter AH-1Z program, and the A-10 program. These contracts are subject to unique risks, some of which are beyond our control. Examples of such risks include:
• | The USG may modify, curtail or terminate its contracts and subcontracts at its convenience without prior notice, upon payment for work done and commitments made at the time of termination. Modification, curtailment or termination of our major programs or contracts could have a material adverse effect on our business, financial condition, results of operations and cash flows. |
• | Our USG business is subject to specific procurement regulations and other requirements. These requirements, although customary in USG contracts, increase our performance and compliance costs. These costs might increase in the future, reducing our margins, which could have a negative effect on our financial condition. Although we have procedures designed to assure compliance with these regulations and requirements, failure to do so under certain circumstances could lead to suspension or debarment, for cause, from USG contracting or subcontracting for a period of time and could have a material adverse effect on our business, financial condition, results of operation and cash flows and could adversely impact our reputation and our ability to receive other USG contract awards in the future. |
• | The costs we incur on our USG contracts, including allocated indirect costs, may be audited by USG representatives. Any costs found to be improperly allocated to a specific contract would not be reimbursed, and such costs already reimbursed would have to be refunded. We normally negotiate with those USG representatives before they settle on final adjustments to our contract costs. We have recorded contract revenues based upon results we expect to realize upon final audit. However, we do not know the outcome of any future audits and adjustments, and we may be required to reduce our revenues or profits upon completion and final negotiation of these audits. Although we have instituted controls intended to assure our compliance, if any audit reveals the existence of improper or illegal activities we may be subject to civil and criminal penalties and administrative sanctions, including termination of contracts, forfeiture of profits, suspension of payments, fines and suspension or prohibition from doing business with the USG. |
• | We are from time to time subject to USG inquiries and investigations of our business practices due to our participation in domestic and foreign government contracts and programs and our transaction of business domestically and internationally. Any adverse finding associated with such an inquiry or investigation could have a material adverse effect on our business, financial condition, results of operations and cash flows. |
Our business may be adversely affected by changes in budgetary priorities of the USG.
Because a significant percentage of our revenue is derived either directly or indirectly from contracts with the USG, changes in federal government budgetary priorities could directly affect our financial performance. A significant decline in government expenditures, a shift of expenditures away from programs that we support or a change in federal government contracting policies could cause federal government agencies to reduce their purchases under contracts, to exercise their right to terminate contracts at any time without penalty or not to exercise options to renew contracts.
During 2011, the federal government was unable to reach agreement on budget reduction measures required by the Budget Control Act of 2011 (the “Budget Act”) passed by Congress. Because Congress and the Administration could not reach agreement, the Budget Act triggered automatic reductions in both defense and discretionary spending in January 2013. While we do not believe these automatic spending reductions directly impacted our business, financial condition or operating results during 2014, the future impact of sequestration is uncertain and there can be no assurance that automatic across-the-board budget cuts will not adversely affect our business and profitability in future periods. One or more of our programs could be reduced, extended, or terminated, which could result in facility closures and personnel reductions that could significantly impact our operations.
11
The cost and effort to start up new aerospace programs could negatively impact our operating results and profits.
In recent years, we have been ramping up several new programs, as more fully discussed in Item 7, Management's Discussion and Analysis of Financial Condition and Results of Operations, in this Annual Report on Form 10-K. The time required and costs incurred to ramp up a new program can be significant and include nonrecurring costs for tooling, first article testing, finalizing drawings and engineering specifications and hiring new employees able to perform the technical work required. New programs can typically involve a greater volume of scrap, higher costs due to inefficiencies, delays in production, and learning curves that are often more extended than anticipated, all of which can negatively impact our operating results.
Competition from domestic and foreign manufacturers may result in the loss of potential contracts and opportunities.
The aerospace markets in which we participate are highly competitive, and we often compete for work not only with large OEMs but also sometimes with our own customers and suppliers. Many of our large customers may choose not to outsource production due to, among other things, their own direct labor and overhead considerations and capacity utilization objectives for their own facilities. This could result in these customers supplying their own products or services and competing directly with us for sales of these products or services, all of which could significantly reduce our revenues.
Our competitors may have more extensive or more specialized engineering, manufacturing and marketing capabilities than we do in some areas and we may not have the technology, cost structure, or available resources to effectively compete with them. We believe that developing and maintaining a competitive advantage requires continued investment in product development, engineering, supply chain management and sales and marketing, and we may not have enough resources to make the necessary investments to do so. Further, our significant customers may attempt to use their position to negotiate price or other concessions for a particular product or service without regard to the terms of an existing contract or the underlying cost of production.
We believe our strategies for our Aerospace segment will allow us to continue to effectively compete for key contracts and customers, but there can be no assurance that we will be able to compete successfully in this market or against such competitors.
We could be negatively impacted by the loss of key suppliers, lack of product availability, or changes in supplier programs that could adversely affect our operating results.
Our business depends on maintaining a sufficient supply of various products to meet our customers' demands. We have long-standing relationships with key suppliers but these relationships are non-exclusive and could be terminated by either party. If we lost a key supplier, or were unable to obtain the same levels of deliveries from these suppliers and were unable to supplement those purchases with products obtained from other suppliers, it could have a material adverse effect on our business. Additionally, we rely on foreign and domestic suppliers and commodity markets to secure raw materials used in many of the products we manufacture within our Aerospace segment or sell within our Distribution segment. This exposes us to volatility in the price and availability of raw materials. In some instances, we depend upon a single source of supply. Supply interruptions could arise from shortages of raw materials, labor disputes or weather conditions affecting suppliers' production, transportation disruptions, or other reasons beyond our control. Even if we continue with our current supplier relationships, high demand for certain products may result in us being unable to meet our customers' demands, which could put us at a competitive disadvantage. Additionally, our key suppliers could also increase the pricing of their products, which would negatively affect our operating results if we were not able to pass these price increases through to our customers. We base our supply management process on an appropriate balancing of the foreseeable risks and the costs of alternative practices. To protect ourselves against such risks, we engage in strategic inventory purchases during the year, negotiate long-term vendor supply agreements and monitor our inventory levels to ensure that we have the appropriate inventory on hand to meet our customers' requirements.
Our failure to comply with the covenants contained in our credit facility could trigger an event of default, which could materially and adversely affect our operating results and our financial condition.
Our credit facility requires us to maintain certain financial ratios and comply with various operational and other covenants. If, in the future, we were unable to maintain these ratios and comply with such covenants, we would need to seek relief from our lenders in order to avoid, cure or have waived an event of default under the facility. There can be no assurance that we would be able to obtain such relief on commercially reasonable terms or otherwise. If an event of default is not cured or waived, our lenders could, among other things, cause all outstanding indebtedness under the credit facility to be due and payable immediately. There can be no assurance that our assets or cash flows would be sufficient to enable us to fully repay those amounts or that we would be able to refinance or restructure the indebtedness. If, as or when required, we are unable to repay, refinance or restructure the indebtedness outstanding under our senior credit facility, or amend the financial ratios and
12
covenants contained therein, the lenders under our senior credit facility could elect to terminate their commitments thereunder, cease making further loans and institute foreclosure proceedings against our assets. This, in turn, could result in an event of default under one or more of our other financing agreements, including our convertible notes.
The value of our deferred tax assets could become impaired, which could materially and adversely affect our operating results.
As of December 31, 2014, we had approximately $57.2 million in net deferred tax assets after valuation allowance. These deferred tax assets can be used to offset taxable income in future periods and reduce income taxes payable in those future periods. Each quarter, we determine the probability of the realization of deferred tax assets, using significant judgments and estimates with respect to, among other things, historical operating results, expectations of future earnings and tax planning strategies. If we determine in the future that there is not sufficient positive evidence to support the valuation of these assets, we may be required to further adjust the valuation allowance to reduce our deferred tax assets. Such a reduction could result in a material non-cash charge in the period in which the valuation allowance is adjusted and could have a material adverse effect on our results of operations.
Estimates of future costs for long-term contracts impact our current and future operating results and profits.
We generally recognize sales and gross margin on long-term contracts based on the percentage-of-completion method of accounting. This method allows for revenue recognition as our work progresses on a contract and requires that we estimate future revenues and costs over the life of a contract. Revenues are estimated based upon the negotiated contract price, with consideration being given to exercised contract options, change orders and, in some cases, projected customer requirements. Contract costs may be incurred over a period of several years, and the estimation of these costs requires significant judgment based upon the acquired knowledge and experience of program managers, engineers, and financial professionals.
Estimated costs are based primarily on anticipated purchase contract terms, historical performance trends, business base and other economic projections. The complexity of certain programs as well as technical risks and the availability of materials and labor resources could affect our ability to accurately estimate future contract costs. Additional factors that could affect recognition of revenue under the percentage-of-completion method include:
• | Accounting for initial program costs; |
• | The effect of nonrecurring work; |
• | Delayed contract start-up; |
• | Transition of work to or from the customer or other vendors; |
• | Claims or unapproved change orders; |
• | Product warranty issues; |
• | Delayed completion of certain programs for which inventory has been built up; |
• | Our ability to estimate or control scrap level; |
• | Accrual of contract losses; and |
• | Changes in our overhead rates. |
Because of the significance of the judgments and estimation processes, it is likely that materially different sales and profit amounts could be recorded if we used different assumptions or if the underlying circumstances were to change. Changes in underlying assumptions, circumstances or estimates may adversely affect current and future financial performance. While we perform quarterly reviews of our long-term contracts to address and lessen the effects of these risks, there can be no assurance that we will not make material adjustments to underlying assumptions, circumstances or estimates relating to one or more long-term contracts that may have a material adverse effect on our business, financial condition, results of operations and cash flows.
We may lose money or generate lower than expected profits on our fixed-price contracts.
Our customers set demanding specifications for product performance, reliability and cost. Most of our government contracts and subcontracts provide for a predetermined, fixed price for the products we make regardless of the costs we incur. Therefore, we must absorb cost overruns, notwithstanding the difficulty of estimating all of the costs we will incur in performing these contracts and in projecting the ultimate level of sales that we may achieve. Our failure to anticipate technical problems, estimate costs accurately, integrate technical processes effectively or control costs during performance of a fixed-price contract may reduce the profitability of a fixed-price contract or cause a loss. While we believe that we have recorded adequate provisions in our financial statements for losses on our fixed-price contracts as required under generally accepted accounting
13
principles ("GAAP"), there can be no assurance that our contract loss provisions will be adequate to cover all actual future losses.
The start-up of a K-MAX® production line could adversely affect our operating results and cash flow generation.
Because the K-MAX® aircraft has not been manufactured in over a decade, restarting the production line could require significant investments of cash to fund costs associated with development and engineering work, the acquisition of new tooling, first article testing, and production inefficiencies. The Company currently has $17.2 million of K-MAX® inventory, a portion of which we expect to use in connection with a start-up of the production line. If this inventory is determined to be unusable then the Company could incur additional costs to replace such inventory, including potentially having to requalify suppliers for the manufacture of new components. The anticipated positive cash flows resulting from the sale of the aircraft may also be adversely impacted by production delays. Further, if we are unable to sustain interest in this program, we may incur additional costs associated with a shut-down of the production line.
A failure to develop and retain national accounts at our Distribution segment could adversely impact our financial results.
Companies continue to consolidate their purchases of industrial products, resulting in their doing business with only a few major distributors or integrated suppliers, rather than a large number of vendors. Through our national accounts strategy, our Distribution segment has worked to develop the relationships necessary to be one of those major distributors. Competition relative to these types of arrangements is significant.
If we are not awarded additional national accounts in the future, or if existing national account agreements are not renewed, our sales volume could be negatively impacted which may result in lower gross margins and weaker operating results. Additionally, national accounts may require an increased level of customer service, such as investments in the form of opening new branches to meet our customers' needs. The cost and time associated with these activities could be significant, and if the relationship is not maintained, we ultimately may not be able to generate a return on these investments.
The loss of the Distribution segment’s key suppliers with whom we have national reseller agreements and/or national distributor agreements could adversely affect our operating results and profits.
An element of our Distribution segment’s strategy is to establish alignment with a single vendor in certain portions of its business. As a result, we currently have distribution rights for certain product lines and depend on these distribution rights as a source of business. Many of these distribution rights are ours pursuant to contracts that are subject to cancellation upon little or no prior notice. Although we believe we could obtain alternate distribution rights in the event of such a cancellation, the termination or limitation by any key supplier of its relationship with the Company could result in a temporary disruption of our business and, in turn, could adversely affect our results of operations and financial condition.
Our information technology systems, processes, and sites may suffer interruptions or failures which may affect our ability to conduct our business.
Our information technology systems provide critical data connectivity, information and services for internal and external users. These interactions include, but are not limited to, ordering and managing materials from suppliers, inventory management, shipping products to customers, processing transactions, summarizing and reporting results of operations, complying with regulatory, legal or tax requirements, and other processes necessary to manage the business. Our computer systems face the threat of unauthorized access, computer hackers, computer viruses, malicious code, organized cyber-attacks and other security problems and system disruptions.
We have put in place business continuity plans and security precautions for our critical systems, including a back-up data center. However, if our information technology systems are damaged, or cease to function properly due to any number of causes, such as catastrophic events, power outages or security breaches resulting in unauthorized access, and our business continuity plans and security precautions do not effectively compensate on a timely basis, we may suffer interruptions in our operations or the misappropriation of proprietary information, which may adversely impact our business, financial condition, results of operations and cash flows.
14
Our implementation of enterprise resource planning (“ERP”) systems may adversely affect our business and results of operations or the effectiveness of internal controls over financial reporting.
We are currently implementing new ERP systems within our Aerospace and Distribution segments. ERP implementations are complex and time-consuming projects that involve substantial expenditures on system software and implementation activities that take several years. If we do not effectively implement the ERP systems or if the systems do not operate as intended, it could adversely affect our financial reporting systems and our ability to produce financial reports, the effectiveness of internal controls over financial reporting, and our business, financial condition, results of operations and cash flows.
We may make acquisitions or investments in new businesses, products or technologies that involve additional risks, which could disrupt our business or harm our financial condition or results of operations.
As part of our business strategy, we have made, and expect to continue to make, acquisitions of businesses or investments in companies that offer complementary products, services and technologies. Such acquisitions or investments involve a number of risks, including:
• | Assimilating operations and products may be unexpectedly difficult; |
• | Management's attention may be diverted from other business concerns; |
• | We may enter markets in which we have limited or no direct experience; |
• | We may lose key employees, customers or vendors of an acquired business; |
• | We may not be able to achieve the synergies or cost savings we anticipated; |
• | We may not realize the value of the acquired assets relative to the price paid; |
• | We may experience quality control failures or encounter other customer issues; and |
• | We may become subject to preexisting liabilities and obligations of the acquired businesses. |
These factors could have a material adverse effect on our business, financial condition, results of operations and cash flows. In addition, the consideration paid for any future acquisitions could include our stock or require that we incur additional debt and contingent liabilities. As a result, future acquisitions could cause dilution of existing equity interests and earnings per share.
Certain of our operations are conducted through joint ventures, which entail special risks.
The Company has a 26% equity interest in Kineco-Kaman Composites - India Private Limited, a composites manufacturing joint venture located in Goa, India. The Company relies significantly on the services and skills of its joint venture partner to manage and conduct the local business operations of the joint venture and ensure compliance with local laws and regulations. If our joint venture partner fails to perform these functions adequately, it may adversely affect our business, financial condition, results of operations and cash flows. Moreover, if our joint venture partner fails to honor its financial obligations to commit capital, equity or credit support to the joint venture as a result of financial or other difficulties or for any other reason, the joint venture may be unable to perform contracted services or deliver contracted products unless we provide the necessary capital, equity or credit support.
Our results of operations could be adversely affected by impairment of our goodwill or other intangible assets.
When we acquire a business, we record goodwill equal to the excess of the amount we pay for the business, including liabilities assumed, over the fair value of the tangible and identifiable intangible assets of the business we acquire. Goodwill and other intangible assets that have indefinite useful lives must be evaluated at least annually for impairment. The specific guidance for testing goodwill and other non-amortized intangible assets for impairment requires management to make certain estimates and assumptions when allocating goodwill to reporting units and determining the fair value of reporting unit net assets and liabilities, including, among other things, an assessment of market conditions, projected cash flows, investment rates, cost of capital and growth rates, which could significantly impact the reported value of goodwill and other intangible assets. Fair value is generally determined using a combination of the discounted cash flow, market multiple and market capitalization valuation approaches. Absent any impairment indicators, we generally perform our evaluations annually in the fourth quarter, using available forecast information. If at any time we determine an impairment has occurred, we are required to reflect the reduction in value as an expense within operating income, resulting in a reduction of earnings in the period such impairment is identified and a corresponding reduction in our net asset value.
15
We rely on the experience and expertise of our skilled employees, and must continue to attract and retain qualified technical, marketing and managerial personnel in order to succeed.
Our future success will depend largely upon our ability to attract and retain highly skilled technical, operational and financial managers and marketing personnel. There is significant competition for such personnel in the aerospace and distribution industries. We try to ensure that we offer competitive compensation and benefits as well as opportunities for continued development, and we continually strive to recruit and train qualified personnel and retain key employees. There can be no assurance, however, that we will continue to be successful in attracting and retaining the personnel we require to develop new and enhanced products and to continue to grow and operate profitably.
We are subject to litigation, tax, environmental and other legal compliance risks that could adversely affect our operating results.
We are subject to a variety of litigation, tax and legal compliance risks. These risks include, among other things, possible liability relating to contract-related claims, government contracts, product liability matters, personal injuries, intellectual property rights, taxes, environmental matters and compliance with U.S. and foreign export laws, competition laws and laws governing improper business practices. In the event that we or one of our business units engage in wrongdoing in connection with any of these kinds of matters, we could be subject to significant fines, penalties, repayments, other damages (in certain cases, treble damages), or suspension or debarment from government contracts. Moreover, our failure to comply with applicable export and trade practice laws could result in civil or criminal penalties and suspension or termination of export privileges.
As a global business, we are subject to complex laws and regulations in the U.S. and other countries in which we operate. Those laws and regulations may be interpreted in different ways. They may also change from time to time, as may related interpretations and other guidance. Changes in laws or regulations could result in higher expenses and payments, and uncertainty relating to laws or regulations may also affect how we conduct our operations and structure our investments and could limit our ability to enforce our rights. Changes in environmental and climate change laws or regulations, including laws relating to greenhouse gas emissions, could lead to new or additional investment in product designs and could increase environmental compliance expenditures. Changes in climate change concerns, or in the regulation of such concerns, including greenhouse gas emissions, could subject us to additional costs and restrictions, including increased energy and raw material costs.
Our financial results may be adversely affected by the outcome of pending legal proceedings and other contingencies that cannot be predicted. In accordance with GAAP, if a liability is deemed probable and reasonably estimable in light of the facts and circumstances known to us at a particular point in time, we make an estimate of material loss contingencies and establish reserves based on our assessment. Subsequent developments in legal proceedings may affect our assessment. The accrual of a loss contingency adversely affects our results of operations in the period in which a liability is recognized. This could also have an adverse impact on our cash flows in the period during which damages are paid.
For a discussion of these matters, please refer to Note 16, Commitments and Contingencies, in the Notes to Consolidated Financial Statements in this Annual Report on Form 10-K.
New regulations related to conflict minerals could adversely impact our business.
The Dodd-Frank Wall Street Reform and Consumer Protection Act contains provisions designed to improve transparency and accountability concerning the supply of certain minerals, known as conflict minerals, originating from the Democratic Republic of the Congo ("DRC") and adjoining countries. In August 2012, the SEC promulgated new disclosure and reporting requirements for companies who use conflict minerals in their products. Complying with these new disclosure and reporting requirements requires us to incur substantial costs and expenditures to conduct due diligence to determine the sources of conflict minerals used in our products. Moreover, these requirements may result in changes to the sourcing practices of our customers which may require the identification and qualification of alternate sourcing for the components of products we manufacture, which could impact the availability of, or cause increases in the price of, materials used in our products. We may face reputational challenges if we determine that certain of our products contain minerals not determined to be conflict free or if we are unable to verify the origin of conflict minerals used in our products through the procedures we implemented. As there may be only a limited number of suppliers offering “conflict free” conflict minerals, there can be no assurance that we will be able to obtain necessary conflict minerals from such suppliers in sufficient quantities or at competitive prices.
16
Our foreign operations require us to comply with a number of United States and international laws and regulations, violations of which could have a material adverse effect on our business, financial condition, results of operations and cash flows.
Our operations outside the United States require us to comply with a number of United States and international laws and regulations, such as the Foreign Corrupt Practices Act of 1977 (the "FCPA") and the UK Bribery Act. The FCPA generally prohibits United States companies or their agents and employees from providing anything of value to a foreign official for the purposes of influencing any act or decision of these individuals in their official capacity to help obtain or retain business, direct business to any person or corporate entity or obtain any unfair advantage. Because we operate in various countries, the risk of unauthorized payments or offers of payments by one of our employees or agents that could be in violation of the FCPA cannot be eliminated. While we have internal controls and procedures and compliance programs to train our employees and agents with respect to compliance with FCPA and other international laws and regulations, there can be no assurance that our policies, procedures and programs will always protect us from reckless or criminal acts committed by our employees or agents. Allegations of violations of applicable anti-corruption laws, including the FCPA and UK Bribery Act, may result in internal, independent, or government investigations. Violations of the FCPA and other international laws and regulations may result in severe criminal or civil sanctions, and we may be subject to other liabilities, which could have a material adverse effect on our business, financial condition, results of operations and cash flows.
Our foreign operations present additional risks and uncertainties which could have a material adverse effect on our business, financial condition, results of operations and cash flows.
Our foreign business operations create additional risks and uncertainties, including the following:
• | Longer payment cycles; |
• | Difficulties in accounts receivable collection; |
• | Changes in regulatory requirements; |
• | Export restrictions, tariffs and other trade barriers; |
• | Difficulties in staffing and managing foreign operations; |
• | Seasonal reductions in business activity during the summer months in Europe and certain other parts of the world; |
• | Political or economic instability in the markets we serve; |
• | Potentially adverse tax consequences; and |
• | Cultural and legal differences impacting the conduct of business. |
Any one or more of these factors could have a material adverse effect on our domestic or international operations, and, consequently, on our business, financial condition, results of operations and cash flows.
Our insurance coverage may be inadequate to cover all significant risk exposures.
We are exposed to risks that are unique to the products and services we provide. While we believe that we maintain adequate insurance for certain risks, insurance cannot be obtained to protect against all risks and liabilities. It is therefore possible that our insurance coverage may not cover all claims or liabilities, and we may be forced to bear substantial unanticipated costs.
Health care reform could adversely affect our operating results.
In 2010, the United States federal government enacted comprehensive health care reform legislation. Due to the breadth and complexity of this legislation, as well as the phased-in nature of its implementation and lack of interpretive guidance, it is difficult for the Company to predict the effects it will have on our business over the coming years. There can be no assurance that our operating results will not be adversely affected by increased costs, expanded liability exposure and requirements that change the ways we provide healthcare and other benefits to our employees.
Business disruptions could seriously affect our sales and financial condition or increase our costs and expenses.
Our business may be impacted by disruptions including, but not limited to, threats to physical security, information technology attacks or failures, damaging weather or other acts of nature and pandemics or other public health crises. Any of these disruptions could affect our internal operations or services provided to customers, and could impact our sales, increase our expenses or adversely affect our reputation or our stock price. We have developed and are implementing business continuity plans for each of our businesses, in order to mitigate the effects disruptions may have on our financial results.
17
Our revenue and quarterly results may fluctuate, which could adversely affect our stock price.
We may in the future experience significant fluctuations in our quarterly operating results attributable to a variety of factors. Such factors include but are not limited to:
• | Changes in demand for our products; |
• | Introduction, enhancement or announcement of products by us or our competitors; |
• | Market acceptance of our new products; |
• | The growth rates of certain market segments in which we compete; |
• | Size, timing and shipment terms of significant orders; |
• | Difficulties with our technical programs; |
• | Budgeting cycles of customers; |
• | Mix of distribution channels; |
• | Mix of products and services sold; |
• | Mix of domestic and international revenues; |
• | Fluctuations in currency exchange rates; |
• | Changes in the level of operating expenses; |
• | Changes in our sales incentive plans; |
• | Changes in tax laws in the jurisdictions in which we conduct business; |
• | Inventory obsolescence; |
• | Accrual of contract losses; |
• | Fluctuations in oil and utility costs; |
• | Completion or announcement of acquisitions; and |
• | General economic conditions in regions in which we conduct business. |
Most of our expenses are relatively fixed in the short-term, including costs of personnel and facilities, and are not easily reduced. Thus, an unexpected reduction in our revenue, or failure to achieve an anticipated rate of growth, could have a material adverse effect on our profitability. If our operating results do not meet the expectations of investors, our stock price may decline.
18
FORWARD-LOOKING STATEMENTS
This report contains "forward-looking statements" within the meaning of the safe harbor provisions of the U.S. Private Securities Litigation Reform Act of 1995. Forward-looking statements also may be included in other publicly available documents issued by the Company and in oral statements made by our officers and representatives from time to time. These forward-looking statements are intended to provide management's current expectations or plans for our future operating and financial performance, based on assumptions currently believed to be valid. They can be identified by the use of words such as "anticipate," "intend," "plan," "goal," "seek," "believe," "project," "estimate," "expect," "strategy," "future," "likely," "may," "should," "would," "could," "will" and other words of similar meaning in connection with a discussion of future operating or financial performance. Examples of forward looking statements include, among others, statements relating to future sales, earnings, cash flows, results of operations, uses of cash and other measures of financial performance.
Because forward-looking statements relate to the future, they are subject to inherent risks, uncertainties and other factors that may cause the Company's actual results and financial condition to differ materially from those expressed or implied in the forward-looking statements. Such risks, uncertainties and other factors include, among others: (i) changes in domestic and foreign economic and competitive conditions in markets served by the Company, particularly the defense, commercial aviation and industrial production markets; (ii) changes in government and customer priorities and requirements (including cost-cutting initiatives, government and customer shut-downs, the potential deferral of awards, terminations or reductions of expenditures to respond to the priorities of Congress and the Administration, or budgetary cuts resulting from Congressional actions or automatic sequestration); (iii) changes in geopolitical conditions in countries where the Company does or intends to do business; (iv) the successful conclusion of competitions for government programs and thereafter contract negotiations with government authorities, both foreign and domestic; (v) the existence of standard government contract provisions permitting renegotiation of terms and termination for the convenience of the government; (vi) the resolution of government inquiries or investigations; (vii) risks and uncertainties associated with the successful implementation and ramp up of significant new programs; (viii) potential difficulties associated with variable acceptance test results, given sensitive production materials and extreme test parameters; (ix) the receipt and successful execution of production orders for the U.S. government JPF contract, including the exercise of all contract options and receipt of orders from allied militaries, as all have been assumed in connection with goodwill impairment evaluations; (x) the continued support of the existing K-MAX® helicopter fleet, including sale of existing K-MAX® spare parts inventory; (xi) the accuracy of current cost estimates associated with environmental remediation activities; (xii) the profitable integration of acquired businesses into the Company's operations; (xiii) the ability to implement our ERP systems in a cost-effective and efficient manner, limiting disruption to our business and allowing us to capture their planned benefits while maintaining an adequate internal control environment; (xiv) changes in supplier sales or vendor incentive policies; (xv) the effects of price increases or decreases; (xvi) the effects of pension regulations, pension plan assumptions, pension plan asset performance and future contributions; (xvii) future levels of indebtedness and capital expenditures; (xviii) the continued availability of raw materials and other commodities in adequate supplies and the effect of increased costs for such items; (xix) the effects of currency exchange rates and foreign competition on future operations; (xx) changes in laws and regulations, taxes, interest rates, inflation rates and general business conditions; (xxi) future repurchases and/or issuances of common stock; and (xxii) other risks and uncertainties set forth in the Company's annual, quarterly and current reports, proxy statements and other filings with the SEC.
Any forward-looking information provided in this report should be considered with these factors in mind. We assume no obligation to update any forward-looking statements contained in this report.
ITEM 1B. | UNRESOLVED STAFF COMMENTS |
None.
19
ITEM 2. | PROPERTIES |
Our facilities are generally suitable for, and adequate to serve, their intended uses. At December 31, 2014, we occupied major facilities at the following principal locations:
Segment | Location | Property Type (1) | ||
Aerospace | Jacksonville, Florida | Leased - Manufacturing & Office | ||
Chihuahua, Mexico | Leased - Manufacturing & Office | |||
Wichita, Kansas | Leased - Manufacturing & Office | |||
Darwen, Lancashire, United Kingdom | Leased - Manufacturing & Office | |||
Hyde, Greater Manchester, United Kingdom | Leased - Manufacturing & Office | |||
Burnley, Lancashire, United Kingdom | Leased - Manufacturing & Office | |||
Orlando, Florida | Owned - Manufacturing & Office | |||
Everett, Washington | Leased - Office | |||
Höchstadt, Germany | Owned - Manufacturing & Office | |||
Middletown, Connecticut | Owned - Manufacturing & Office | |||
Bloomfield, Connecticut | Owned - Manufacturing, Office & Service Center | |||
Bennington, Vermont | Owned - Manufacturing & Office | |||
Distribution | Bloomfield, Connecticut | Owned - Office | ||
Ontario, California | Leased - Distribution Center & Office | |||
Albany, New York | Leased - Distribution Center & Office | |||
Savannah, Georgia | Leased - Distribution Center & Office | |||
Salt Lake City, Utah | Leased - Distribution Center & Office | |||
Louisville, Kentucky | Leased - Distribution Center & Office | |||
Gurabo, Puerto Rico | Leased - Distribution Center & Office | |||
Bolingbrook, Illinois | Leased - Office & Branch | |||
Rochester, New York | Leased - Office & Branch | |||
Akron, Ohio | Leased - Office | |||
Corporate | Bloomfield, Connecticut | Owned - Office & Information Technology Back-Up Data Center | ||
Square Feet | ||
Distribution (2) | 2,273,742 | |
Aerospace | 1,834,548 | |
Corporate (3) | 103,041 | |
Total | 4,211,331 | |
(1) | Owned facilities are unencumbered. |
(2) | The Distribution segment also has over 240 branches located across the United States and in Puerto Rico, generally operating in leased facilities. |
(3) | We occupy a 40,000 square foot corporate headquarters building, 38,000 square foot mixed use building and 8,000 square foot data center in Bloomfield, Connecticut. |
20
ITEM 3. LEGAL PROCEEDINGS
General
From time to time, as a normal incident of the nature and kinds of businesses in which the Company and its subsidiaries are, and were, engaged, various claims or charges are asserted and legal proceedings are commenced by or against the Company and/or one or more of its subsidiaries. Claimed amounts may be substantial but may not bear any reasonable relationship to the merits of the claim or the extent of any real risk of court or arbitral awards. We record accruals related to those matters for which we consider a loss to be both probable and reasonably estimable. Gain contingencies, if any, are not recognized until they are realized. Legal costs are generally expensed when incurred.
We evaluate, on a quarterly basis, developments in legal proceedings that could affect the amount of any accrual and developments that would make a loss contingency both probable and reasonably estimable. Our loss contingencies are subject to substantial uncertainties, however, including for each such contingency the following, among other factors: (i) the procedural status of the case; (ii) whether the case has or may be certified as a class action suit; (iii) the outcome of preliminary motions; (iv) the impact of discovery; (v) whether there are significant factual issues to be determined or resolved; (vi) whether the proceedings involve a large number of parties and/or parties and claims in multiple jurisdictions or jurisdictions in which the relevant laws are complex or unclear; (vii) the extent of potential damages, which are often unspecified or indeterminate; and (viii) the status of settlement discussions, if any, and the settlement postures of the parties. Because of these uncertainties, management has determined that, except as otherwise noted below, the amount of loss or range of loss that is reasonably possible in respect of each matter described below (including any reasonably possible losses in excess of amounts already accrued), is not reasonably estimable.
While it is not possible to predict the outcome of these matters with certainty, based upon available information, management believes that all settlements, arbitration awards and final judgments, if any, which are considered probable of being rendered against us in legal proceedings and that can be reasonably estimated are accrued for at December 31, 2014. Despite this analysis, there can be no assurance that the final outcome of these matters will not have a material adverse effect on our business, financial condition, results of operations or cash flows.
Except as set forth below, as of December 31, 2014, neither the Company nor any of its subsidiaries is a party, nor is any of its or their property subject, to any material pending legal proceedings, other than ordinary routine litigation incidental to the business of the Company and its subsidiaries. Additional information relating to certain of these matters is set forth in Note 16, Commitments and Contingencies of the Notes to Consolidated Financial Statements, included in Item 8, Financial Statements and Supplementary Data, of this Annual Report on Form 10-K.
Wichita Matter
As previously disclosed, the U.S. District Court for the District of Kansas issued a grand jury subpoena in 2011 to Plastic Fabricating Company, Inc. (“PlasticFab”), an indirect wholly owned subsidiary of the Company now known as Kaman Composites - Wichita, Inc., regarding a government investigation of record keeping associated with the manufacture of certain composite parts at PlasticFab's facility located in Wichita, Kansas. The subpoena required information related to the period January 1, 2006, through June 30, 2008. On October 21, 2014, the U.S. Attorney's Office for the District of Kansas and PlasticFab entered into a civil settlement agreement pursuant to which PlasticFab, without admitting any wrongdoing, agreed to pay $0.5 million, all of which was previously accrued. The U.S. Attorney's Office for the District of Kansas has also informed PlasticFab that it is closing its files and will conduct no further investigation relating to this matter.
Environmental Matters
The Company and its subsidiaries are subject to numerous U.S. Federal, state and international environmental laws and regulatory requirements and are involved from time to time in investigations or litigation of various potential environmental issues concerning activities at our facilities or former facilities or remediation as a result of past activities (including past activities of companies we have acquired). From time to time, we receive notices from the U.S. Environmental Protection Agency or equivalent state or international environmental agencies that we are a potentially responsible party under the Comprehensive Environmental Response, Compensation and Liability Act (commonly known as the “Superfund Act”) and/or equivalent laws. Such notices assert potential liability for cleanup costs at various sites, which include sites owned by us, sites we previously owned and treatment or disposal sites not owned by us, allegedly containing hazardous substances attributable to us from past operations. We are currently named as a potentially responsible party at one site. While it is not possible to predict the outcome of these proceedings, in the opinion of management, any payments we may be required to make as a result of all
21
such claims in existence at December 31, 2014, will not have a material adverse effect on our business, financial condition, results of operations or cash flows.
Asbestos Litigation
Like many other industrial companies, the Company and/or one of its subsidiaries may be named as a defendant in lawsuits alleging personal injury as a result of exposure to asbestos integrated into certain products sold or distributed by the Company and/or the named subsidiary. A substantial majority of these asbestos-related claims have been covered by insurance or other forms of indemnity or have been dismissed without payment. The rest have been resolved for amounts that are not material to the Company, either individually or in the aggregate. Based on information currently available, we do not believe that the resolution of any currently pending asbestos-related matters will have a material adverse effect on our business, financial condition, results of operations or cash flows.
ITEM 4. | MINE SAFETY DISCLOSURES |
Information concerning mine safety violations required by Section 1503(a) of the Dodd-Frank Wall Street Reform and Consumer Protection Act ("Dodd-Frank Act") and Item 104 of Regulation S-K was not required for this Annual Report on Form 10-K as there were no reportable violations during 2014.
22
PART II
ITEM 5. | MARKET FOR REGISTRANT'S COMMON EQUITY, RELATED STOCKHOLDER MATTERS AND ISSUER PURCHASES OF EQUITY SECURITIES |
MARKET, DIVIDEND AND SHAREHOLDER INFORMATION
Our Common Stock is traded on the New York Stock Exchange under the symbol "KAMN". As of January 30, 2015, there were 3,527 registered holders of our Common Stock. Holders of the Company’s Common Stock are eligible to participate in the Computershare Shareowner Services program, which offers a variety of services including dividend reinvestment. A booklet describing the program may be obtained by contacting Computershare at (800) 522-6645 or via the web at www.cpushareownerservices.com.
The following table sets forth the high, low and closing sale prices per share of the Company’s Common Stock and the dividends declared for the periods indicated:
Market Quotations | ||||||||||||||||
High | Low | Close | Dividend Declared | |||||||||||||
2014 | ||||||||||||||||
First quarter | $ | 41.77 | $ | 37.83 | $ | 40.02 | $ | 0.16 | ||||||||
Second quarter | 44.60 | 39.19 | 42.87 | 0.16 | ||||||||||||
Third quarter | 43.47 | 38.62 | 39.70 | 0.16 | ||||||||||||
Fourth quarter | 43.49 | 37.43 | 40.09 | 0.16 | ||||||||||||
2013 | ||||||||||||||||
First quarter | $ | 38.62 | $ | 34.14 | $ | 35.47 | $ | 0.16 | ||||||||
Second quarter | 35.90 | 32.16 | 34.56 | 0.16 | ||||||||||||
Third quarter | 39.91 | 34.45 | 37.70 | 0.16 | ||||||||||||
Fourth quarter | 40.35 | 36.41 | 39.73 | 0.16 | ||||||||||||
ISSUER PURCHASES OF EQUITY SECURITIES
The following table provides information about purchases of Common Stock by the Company during the three months ended December 31, 2014:
Period | Total Number of Shares Purchased | Average Price Paid per Share | Total Number of Shares Purchased as Part of a Publicly Announced Plan (a) | Maximum Number of Shares That May Yet Be Purchased Under the Plan | |||||||||
September 27, 2014 – October 24, 2014 | — | — | — | 964,757 | |||||||||
October 25, 2014 – November 21, 2014 | 201 | $ | 41.52 | — | 964,757 | ||||||||
November 22, 2014 – December 31, 2014 | — | — | — | 964,757 | |||||||||
Total | 201 | — | |||||||||||
(a) In November 2000, our Board of Directors approved a replenishment of the Company's stock repurchase program providing for repurchase of an aggregate of 1.4 million shares of Common Stock for use in the administration of our stock plans and for general corporate purposes (the "November 2000 stock repurchase program").
23
SECURITIES AUTHORIZED FOR ISSUANCE UNDER EQUITY COMPENSATION PLANS
The following table provides information as of December 31, 2014, concerning Common Stock issuable under the Company’s equity compensation plans.
Plan Category | (a) Number of securities to be issued upon exercise of outstanding options, warrants and rights | (b) Weighted- average exercise price of outstanding options, warrants and rights | (c) Number of securities remaining available for future issuance under equity compensation plans (excluding securities reflected in column (a)) | |||||||
Equity compensation plans approved by security holders: | ||||||||||
2003 Stock Incentive Plan | 720,651 | $ | 29.24 | — | ||||||
2013 Management Incentive Plan | 183,440 | 39.22 | 1,733,205 | |||||||
Employees Stock Purchase Plan | — | — | 388,632 | |||||||
Equity compensation plans not approved by security holders | — | — | — | |||||||
Total | 904,091 | $ | 31.26 | 2,121,837 | ||||||
PERFORMANCE GRAPH
Following is a comparison of our total shareholder return for the period 2009 – 2014 compared to the S&P 600 Small Cap Index and the Russell 2000 Small Cap Index. The performance graph does not include a published industry or line-of-business index or peer group of similar issuers because during the performance period the Company was conducting operations in diverse lines of business and we do not believe a meaningful industry index or peer group can be reasonably identified. Accordingly, as permitted by regulation, the graph includes the S&P 600 Small Cap Index and the Russell 2000 Small Cap Index, both of which are comprised of issuers with market capitalizations generally similar to that of the Company.
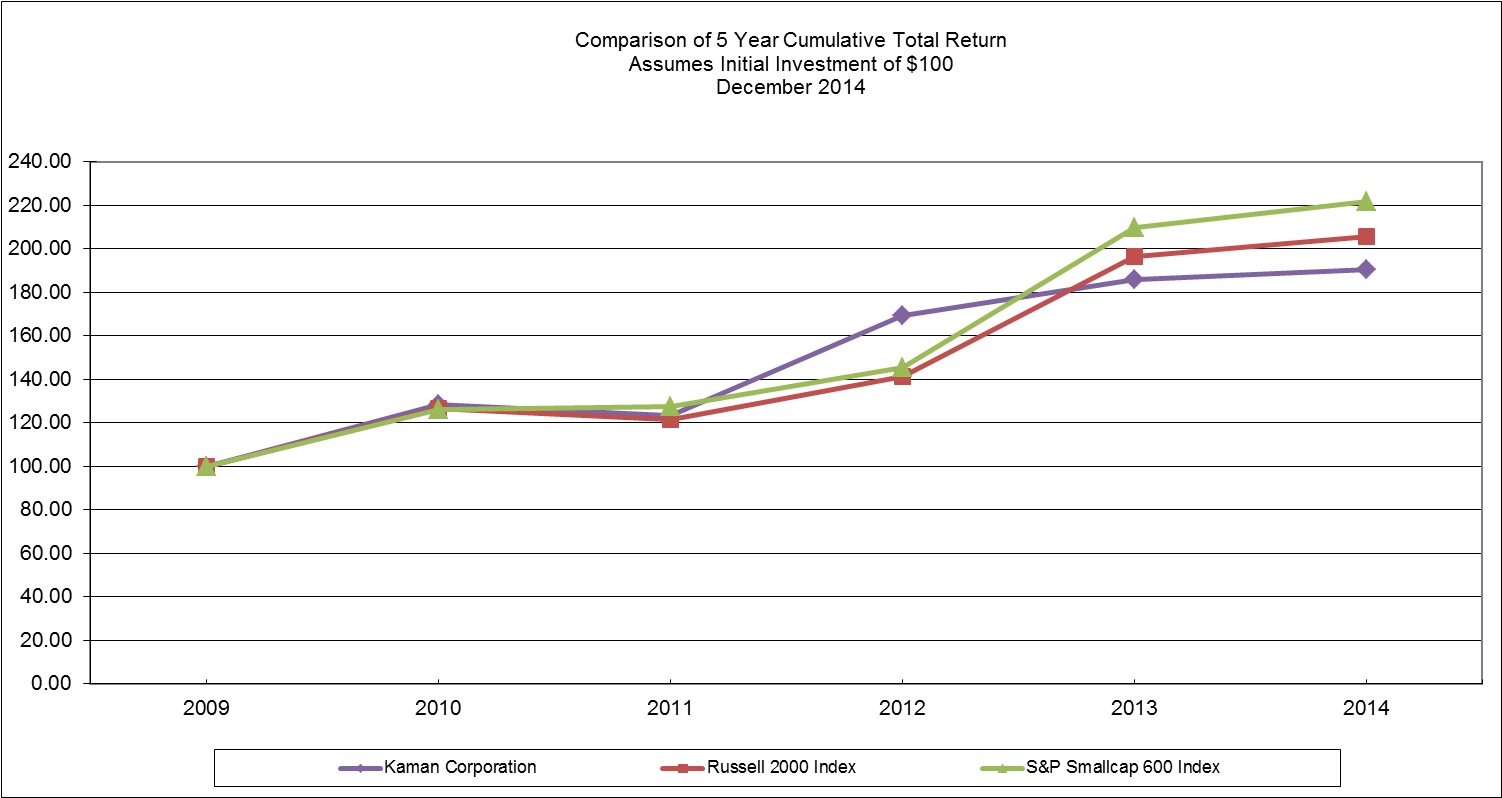
2009 | 2010 | 2011 | 2012 | 2013 | 2014 | |||||||||||||
Kaman Corporation | 100.00 | 128.60 | 123.30 | 169.24 | 185.97 | 190.65 | ||||||||||||
S&P Small Cap 600 | 100.00 | 126.31 | 127.59 | 145.57 | 209.74 | 221.81 | ||||||||||||
Russell 2000 | 100.00 | 126.81 | 121.52 | 141.42 | 196.32 | 205.93 | ||||||||||||
24
ITEM 6. SELECTED FINANCIAL DATA
FIVE-YEAR SELECTED FINANCIAL DATA
(in thousands, except per share amounts, shareholders and employees)
20141,6,7 | 20132,6,7 | 20123,6,7 | 20114,6,7 | 20105,6,7 | ||||||||||||||||
OPERATIONS | ||||||||||||||||||||
Net sales from continuing operations | $ | 1,794,962 | $ | 1,653,921 | $ | 1,563,342 | $ | 1,452,182 | $ | 1,277,441 | ||||||||||
Operating income from continuing operations | 110,507 | 103,346 | 91,589 | 86,819 | 57,332 | |||||||||||||||
Earnings before income taxes from continuing operations | 96,502 | 90,654 | 79,695 | 75,541 | 55,091 | |||||||||||||||
Income tax expense | 30,722 | 31,588 | 26,748 | 26,214 | 20,091 | |||||||||||||||
Earnings from continuing operations | 65,780 | 59,066 | 52,947 | 49,327 | 35,000 | |||||||||||||||
Earnings (loss) from discontinued operations, net of taxes | (2,924 | ) | (2,386 | ) | 755 | 1,815 | 611 | |||||||||||||
Gain (loss) on disposal of discontinued operations, net of taxes | (4,984 | ) | 420 | 1,323 | — | — | ||||||||||||||
Net earnings | $ | 57,872 | $ | 57,100 | $ | 55,025 | $ | 51,142 | $ | 35,611 | ||||||||||
FINANCIAL POSITION | ||||||||||||||||||||
Current assets | $ | 662,256 | $ | 665,205 | $ | 618,045 | $ | 600,102 | $ | 584,953 | ||||||||||
Current liabilities | 221,724 | 227,956 | 223,952 | 218,698 | 221,845 | |||||||||||||||
Working capital | 440,532 | 437,249 | 394,093 | 381,404 | 363,108 | |||||||||||||||
Property, plant and equipment, net | 147,825 | 148,508 | 128,669 | 111,895 | 89,719 | |||||||||||||||
Total assets | 1,201,205 | 1,140,631 | 1,096,993 | 996,398 | 895,757 | |||||||||||||||
Long-term debt, excluding current portion | 271,232 | 264,655 | 249,585 | 198,522 | 140,443 | |||||||||||||||
Shareholders’ equity | 517,665 | 511,292 | 420,193 | 373,071 | 362,670 | |||||||||||||||
PER SHARE AMOUNTS | ||||||||||||||||||||
Basic earnings per share from continuing operations | $ | 2.43 | $ | 2.21 | $ | 2.00 | $ | 1.88 | $ | 1.35 | ||||||||||
Basic earnings per share from discontinued operations | (0.11 | ) | (0.09 | ) | 0.03 | 0.07 | 0.02 | |||||||||||||
Basic earnings per share from disposal of discontinued operations | (0.18 | ) | 0.02 | 0.05 | — | — | ||||||||||||||
Basic earnings per share | $ | 2.14 | $ | 2.14 | $ | 2.08 | $ | 1.95 | $ | 1.37 | ||||||||||
Diluted earnings per share from continuing operations | $ | 2.37 | $ | 2.17 | $ | 1.99 | $ | 1.86 | $ | 1.34 | ||||||||||
Diluted earnings per share from discontinued operations | (0.11 | ) | (0.09 | ) | 0.03 | 0.07 | 0.02 | |||||||||||||
Diluted earnings per share from disposal of discontinued operations | (0.18 | ) | 0.02 | 0.05 | — | — | ||||||||||||||
Diluted earnings per share | $ | 2.08 | $ | 2.10 | $ | 2.07 | $ | 1.93 | $ | 1.36 | ||||||||||
Dividends declared | $ | 0.64 | $ | 0.64 | $ | 0.64 | $ | 0.60 | $ | 0.56 | ||||||||||
Shareholders’ equity | 19.08 | 19.04 | 15.79 | 14.22 | 13.93 | |||||||||||||||
Market price range – High | 44.60 | 40.35 | 37.54 | 38.40 | 30.00 | |||||||||||||||
Market price range – Low | 37.43 | 32.16 | 26.10 | 25.73 | 20.97 | |||||||||||||||
AVERAGE SHARES OUTSTANDING | ||||||||||||||||||||
Basic | 27,053 | 26,744 | 26,425 | 26,246 | 25,928 | |||||||||||||||
Diluted | 27,777 | 27,143 | 26,622 | 26,500 | 26,104 | |||||||||||||||
GENERAL STATISTICS | ||||||||||||||||||||
Registered shareholders | 3,532 | 3,642 | 3,685 | 3,813 | 3,879 | |||||||||||||||
Employees | 4,797 | 4,743 | 5,007 | 4,614 | 4,269 | |||||||||||||||
(See Footnotes below)
25
(Footnotes to Five-Year Selected Financial Data above)
Included within certain annual results are a variety of unusual or significant items that may affect comparability. The most significant of such items are described below as well as within Management’s Discussion and Analysis of Financial Condition and Results of Operations and the Notes to Consolidated Financial Statements.
1. | Results for 2014 include the sale of the Distribution segment's Mexican operations for $9.6 million on December 19, 2014. The net loss of $5.3 million resulting from the sale is included in the loss on disposal of discontinued operations for 2014. Additionally, we incurred $2.2 million of costs associated with the sale of our Moosup facility. |
2. | Results for 2013 include a $2.1 million non-cash non-tax deductible charge for the impairment of goodwill related to VT Composites and a gain on discontinued operations due to a $0.4 million favorable tax result versus previous estimates and other activity related to the settlement of the closing balance sheet of the Distribution segment's Canadian operations. |
3. | Results for 2012 include the sale of certain assets and certain liabilities of the Distribution segment's Canadian operations for $8.7 million on December 31, 2012, resulting in a net gain of $1.3 million. Additionally, we recorded $3.3 million of net loss related to the resolution of an Aerospace segment program related matter. |
4. | Results for 2011 include $6.2 million in expense recognized in the fourth quarter related to the settlement of the FMU-143 matter and the non-recurring benefit of $2.4 million recognized in the first quarter of 2011 resulting from the death of a former executive. |
5. | Results for 2010 include a $6.4 million non-cash non-tax deductible charge for the impairment of goodwill related to U.K. Composites, $2.0 million in additional losses related to the finalization of contract price negotiations on the Sikorsky Canadian MH-92 helicopter program, and $6.6 million of income related to the claim for look-back interest we filed with the Internal Revenue Service in connection with the Australian SH-2G(A) Super Seasprite Helicopter program. |
6. | The Company sold the Distribution segment's Mexican operations on December 19, 2014. The results of these discontinued operations have been reported as such in the table. |
7. | The Company sold substantially all assets and liabilities of the Distribution segment's Canadian operations on December 31, 2012. The results of these discontinued operations have been reported as such in the table. |
26
ITEM 7. | MANAGEMENT'S DISCUSSION AND ANALYSIS OF FINANCIAL CONDITION AND RESULTS OF OPERATIONS |
Management's Discussion and Analysis of Financial Condition and Results of Operations ("MD&A") is intended to provide readers of our consolidated financial statements with the perspectives of management. MD&A presents in narrative form information regarding our financial condition, results of operations, liquidity and certain other factors that may affect our future results. This should allow the readers of this report to obtain a comprehensive understanding of our businesses, strategies, current trends and future prospects. MD&A should be read in conjunction with the Consolidated Financial Statements and related Notes included in this Form 10-K.
OVERVIEW OF BUSINESS
Kaman Corporation conducts business through two business segments:
• | The Distribution segment is a leading power transmission, motion control, electrical and automation, and fluid power industrial distributor with operations throughout the United States. We provide products including bearings, mechanical and electrical power transmission, fluid power, motion control, automation, material handling components, electrical control and power distribution, and MRO supplies to a broad spectrum of industrial markets throughout the United States. |
• | The Aerospace segment produces and/or markets proprietary aircraft bearings and components; complex metallic and composite aerostructures for commercial, military and general aviation fixed and rotary wing aircraft; safe and arming solutions for missile and bomb systems for the U.S. and allied militaries; subcontract helicopter work; support for our SH-2G Super Seasprite maritime helicopters and K-MAX® manned and unmanned medium-to-heavy lift helicopters; and engineering design, analysis and certification services. |
Company financial performance
• | Net sales from continuing operations increased 8.5% compared to the prior year. |
• | Earnings from continuing operations increased 11.4% compared to the prior year. |
• | Diluted earnings per share from continuing operations increased to $2.37 in 2014 compared to $2.17 in the prior year. |
• | Cash flows provided by operating activities from continuing operations were $109.1 million for 2014, an increase of $44.2 million when compared to the prior year. |
• | Both our Distribution segment and our Aerospace segment had record annual sales from continuing operations of $1,162 million and $633.0 million, respectively. |
Acquisitions and Divestitures
• | On February 2, 2015, the Company announced that its Distribution segment acquired substantially all the operating assets of G.C. Fabrication, Inc. (GCF) of Northvale, New Jersey. GCF is a premier Schneider Electric/Square D distributor and carries a variety of electrical power, automation, process controls, specialized HVAC, water and wastewater systems, communication and networking devices from a premier set of global manufacturers. |
• | On December 19, 2014, the Company's Distribution segment sold its Mexico business unit Delamac de Mexico, S.A. de C.V. (“Delamac”) to Rodamientos y Accesorios S.A. de C.V (RYASA) of Mexico. |
• | On April 25, 2014, the Company acquired specific assets of B.W. Rogers Company, headquartered in Akron, Ohio. B.W. Rogers is a tri-motion distributor of Parker Hannifin motion and control products and represents many other premium manufacturers. |
Other key events
• | During the fourth quarter, the New Zealand Ministry of Defence (MoD) accepted the first three SH-2G(I) Super Seasprite helicopters for the New Zealand Defence Force (NZDF). Acceptance occurred at Kaman’s Bloomfield, Connecticut facility. |
• | During the fourth quarter, we were awarded a contract modification in the amount of $28.9 million for the procurement of Joint Programmable Fuzes (JPF). The award is a follow-on order raising the total under Option 11 of the JPF contract with the U.S. Air Force (USAF) to approximately $90.0 million. |
• | In November 2014, the Company was awarded an extension to its current contract with Bell Helicopter to manufacture skin and skin to core components for several of Bell’s commercial helicopter models. This three-year follow on contract has an expected value in excess of $24.0 million. |
• | During the fourth quarter, the Company entered into a contract with General Dynamics Canada to remanufacture and upgrade four Kaman SH-2G Super Seasprite aircraft and provide support for the operation of a fifth aircraft for the Peruvian Navy. The program value to Kaman is expected to exceed $40.0 million. |
• | On October 21, 2014, the Company entered into a civil settlement agreement with the U.S. Attorney's Office for the District of Kansas, associated with a matter at its Wichita facility. |
27
• | On September 18, 2014, the Company held its first Investor Day in New York City. |
• | On September 12, 2014, the Company announced that its subsidiary, Kaman Aerospace Corporation, sold its former manufacturing facility in Moosup, Connecticut, to TD Development, LLC. |
• | During the third quarter of 2014, the Company settled its revenue sharing agreement with the Commonwealth of Australia for $5.3 million. |
• | In April 2014, production of the Aerospace segment's specialty bearings in Germany was moved to a new state-of-the-art manufacturing facility in Höchstadt, Germany. |
• | In March 2014, the Company completed the move of its U.K. Tooling facility to a purpose-built facility in Burnley Lancashire, United Kingdom. |
• | On February 25, 2014, the Company announced that the Aerospace segment opened a new engineering services office at the Clemson University Restoration Institute campus (CURI) in North Charleston, S.C. |
Outlook
Our outlook for 2015 reveals strong sales growth at our Distribution segment, while our Aerospace segment is expected to have low single digit growth. Our Aerospace segment will continue to navigate through a period of transition, while certain legacy defense programs ramp down and others come to an end. The outlook for consolidated operating profit reflects strong underlying performance, offset by anticipated costs associated with pension, ERP and group health expense. Our 2015 outlook is as follows:
• | Distribution: |
• | Sales of $1,250 million to $1,280 million |
• | Operating margins of 4.9% to 5.2% |
• | Aerospace: |
• | Sales of $635 million to $655 million |
• | Operating margins of 16.8% to 17.2% |
• | Interest expense of approximately $13 million |
• | Corporate expenses of $52 million to $53 million |
• | Estimated annualized tax rate of approximately 34% |
• | Depreciation and amortization expense of approximately $40 million |
• | Capital expenditures of $30 million to $40 million |
• | Free cash flow of $75 million to $90 million |
2015 Outlook | |||||||
In millions | |||||||
Free Cash Flow(a): | |||||||
Net cash provided by operating activities | $ | 105.0 | to | $ | 130.0 | ||
Expenditures for property, plant and equipment | 30.0 | to | 40.0 | ||||
Free Cash Flow | $ | 75.0 | to | $ | 90.0 | ||
(a) Free Cash Flow, a non-GAAP financial measure, is defined as net cash provided by operating activities less expenditures for property, plant and equipment, both of which are presented in our consolidated statements of cash flows. See Management’s Discussion and Analysis of Financial Condition and Results of Operations—Non-GAAP Financial Measures, in this Form 10-K.
28
RESULTS OF CONTINUING OPERATIONS
Consolidated Results
Net Sales from Continuing Operations
2014 | 2013 | 2012 | ||||||||||
In thousands | ||||||||||||
Distribution | $ | 1,161,992 | $ | 1,039,954 | $ | 982,573 | ||||||
Aerospace | 632,970 | 613,967 | 580,769 | |||||||||
Total | $ | 1,794,962 | $ | 1,653,921 | $ | 1,563,342 | ||||||
$ change | $ | 141,041 | $ | 90,579 | $ | 111,160 | ||||||
% change | 8.5 | % | 5.8 | % | 7.7 | % | ||||||
The following table details the components of the above changes as a percentage of consolidated net sales:
2014 | 2013 | 2012 | |||||||
Organic Sales: | |||||||||
Distribution | 2.0 | % | (1.0 | )% | (0.4 | )% | |||
Aerospace | 1.1 | % | 2.1 | % | 0.8 | % | |||
Total Organic Sales | 3.1 | % | 1.1 | % | 0.4 | % | |||
Acquisition Sales: | |||||||||
Distribution | 5.4 | % | 4.7 | % | 5.8 | % | |||
Aerospace | — | % | — | % | 1.5 | % | |||
Total Acquisition Sales | 5.4 | % | 4.7 | % | 7.3 | % | |||
% change in net sales | 8.5 | % | 5.8 | % | 7.7 | % | |||
The increase in net sales from continuing operations for 2014 as compared to 2013 was attributable to an increase in organic sales at both our Aerospace and Distribution segments and the contribution of $89.4 million in sales from our Distribution segment acquisitions completed in 2014 and 2013. Foreign currency exchange rates had a $2.4 million favorable impact on sales from continuing operations during 2014.
The increase in net sales from continuing operations for 2013 as compared to 2012 was attributable to an increase in organic sales at our Aerospace segment and the contribution of $72.6 million in sales from our Distribution segment acquisitions completed in 2013 and 2012, partially offset by lower organic sales at our Distribution segment. Foreign currency exchange rates had a $0.3 million favorable impact on sales from continuing operations during 2013.
See Segment Results of Operations and Financial Condition below for further discussion of segment net sales.
Gross Profit from Continuing Operations
2014 | 2013 | 2012 | ||||||||||
In thousands | ||||||||||||
Gross profit | $ | 507,939 | $ | 463,311 | $ | 435,095 | ||||||
$ change | 44,628 | 28,216 | 28,573 | |||||||||
% change | 9.6 | % | 6.5 | % | 7.0 | % | ||||||
% of net sales | 28.3 | % | 28.0 | % | 27.8 | % | ||||||
29
Gross profit from continuing operations increased in 2014 primarily due to the contribution of $25.7 million of gross profit from the Distribution segment's 2014 and 2013 acquisitions and a combined 4.2% organic growth in Aerospace and Distribution segment gross profit. Contributing to the Aerospace segment's improved gross profit were the higher sales on the SH-2G(I) contract with New Zealand and higher sales of our commercial bearing products. These program/product profit increases of $16.6 million, which were in addition to the acquisition related gross profit noted above, were partially offset by $10.7 million related to the decrease in military bearing product sales and lower margin on the JPF as a result of decreased commercial sales to foreign militaries in 2014. The Distribution segment's organic gross profit increase was primarily due to increases in the machinery manufacturing, transportation equipment manufacturing and paper manufacturing industries partially offset by computer and electronic manufacturing industry.
Gross profit from continuing operations increased in 2013 primarily due to the increase in sales and profit for both military and commercial products/programs at our Aerospace segment and the contribution of $21.8 million of gross profit from our 2012 and 2013 acquisitions. Contributing to the Aerospace segment's improved gross profit were the incremental profit associated with higher sales of our bearing products and the gross profit associated with the initial recognition of revenue on the SH-2G(I) contract with New Zealand. These increases of $16.1 million, which were in addition to the acquisition related gross profit noted above, were partially offset by the decline in organic gross profit at the Distribution segment of approximately $10.6 million. The decline in the Distribution segment's organic gross profit was primarily due to decreases in the food and beverage manufacturing markets.
Selling, General & Administrative Expenses (S,G&A) from Continuing Operations
2014 | 2013 | 2012 | ||||||||||
In thousands | ||||||||||||
S,G&A | $ | 397,199 | $ | 357,752 | $ | 343,396 | ||||||
$ change | 39,447 | 14,356 | 23,965 | |||||||||
% change | 11.0 | % | 4.2 | % | 7.5 | % | ||||||
% of net sales | 22.1 | % | 21.6 | % | 22.0 | % | ||||||
S,G&A increased for the year ended December 31, 2014, as compared to 2013. The following table details the components of this change:
2014 | 2013 | 2012 | |||||||
Organic S,G&A: | |||||||||
Distribution | 2.5 | % | (0.9 | )% | 0.7 | % | |||
Aerospace | 0.2 | % | 0.5 | % | (3.0 | )% | |||
Corporate | 2.5 | % | (0.4 | )% | 2.6 | % | |||
Total Organic S,G&A | 5.2 | % | (0.8 | )% | 0.3 | % | |||
Acquisition S,G&A: | |||||||||
Distribution | 5.8 | % | 5.0 | % | 5.9 | % | |||
Aerospace | — | % | — | % | 1.3 | % | |||
Corporate | — | % | — | % | — | % | |||
Total Acquisition S,G&A | 5.8 | % | 5.0 | % | 7.2 | % | |||
% change in S,G&A | 11.0 | % | 4.2 | % | 7.5 | % | |||
S,G&A expenses associated with continuing operations increased for 2014 as compared to 2013 primarily due to $20.8 million of expenses related to our 2014 and 2013 acquisitions, a $9.2 million increase in corporate expenses and higher expenses at our Distribution segment. The increase in corporate expenses was driven by costs related to the sale of our Moosup facility, higher salary and wage expense, higher incentive compensation costs, higher campus costs and an increase in professional service fees. Higher Distribution segment costs related to higher employee related incentive costs, higher salary and wage expenses
30
primarily associated with the expansion of our sales force and higher depreciation related to the new enterprise-wide business system ("ERP").
S,G&A expenses from continuing operations increased for 2013 as compared to 2012 primarily due to $17.3 million of expenses related to our 2013 and 2012 acquisitions and an increase in expenses at our Aerospace segment. The increase in expense at our Aerospace segment was primarily due to higher research and development costs of approximately $2.0 million. These increases were slightly offset by lower expense for the Distribution segment's organic business due to $3.2 million of savings realized from the restructuring completed in the first quarter of 2013. Corporate expenses remained relatively flat from 2012 to 2013. This was a result of lower expenses related to our defined benefit pension plan, offset by an increase in insurance costs and building renovation expenses.
Goodwill Impairment
2014 | 2013 | 2012 | ||||||||||
In thousands | ||||||||||||
Goodwill impairment | $ | — | $ | 2,071 | $ | — | ||||||
During 2013, we recorded a non-cash non-tax deductible goodwill impairment charge of $2.1 million for our VT Composites reporting unit. This represented 11% of the reporting unit's total goodwill balance and reduced the carrying value of goodwill to its implied fair value. This charge has been included in the 2013 operating results of the Company's Aerospace segment. No such charges were taken in 2014 or 2012.
Operating Income from Continuing Operations
2014 | 2013 | 2012 | ||||||||||
In thousands | ||||||||||||
Operating income | $ | 110,507 | $ | 103,346 | $ | 91,589 | ||||||
$ change | 7,161 | 11,757 | 4,770 | |||||||||
% change | 6.9 | % | 12.8 | % | 5.5 | % | ||||||
% of net sales | 6.2 | % | 6.2 | % | 5.9 | % | ||||||
The increase in operating income from continuing operations for 2014 as compared to 2013 was driven by increases at both our Aerospace and Distribution segments. The increase in operating income from continuing operations for 2013 as compared to 2012 was driven by an increase at our Aerospace segment. See Segment Results of Operations and Financial Condition below for further discussion of segment operating income.
Interest Expense, Net
2014 | 2013 | 2012 | ||||||||||
In thousands | ||||||||||||
Interest expense, net | $ | 13,382 | $ | 12,294 | $ | 12,113 | ||||||
Net interest expense generally consists of interest charged on the revolving credit facility and other borrowings and the amortization of debt issuance costs, offset by interest income. The increase in net interest expense for 2014 as compared to 2013 was primarily due to higher average borrowings under our revolving credit facility. At December 31, 2014, the interest rate for outstanding amounts on both the revolving credit facility and term loan agreement was 1.70% compared to 1.72% at December 31, 2013.
The increase in net interest expense for 2013 as compared to 2012 was primarily due to higher average borrowings under our revolving credit facility. At December 31, 2013, the interest rate for outstanding amounts on both the revolving credit facility and term loan agreement was 1.72% compared to 1.75% at December 31, 2012.
31
Effective Income Tax Rate for Continuing Operations
2014 | 2013 | 2012 | |||||||
Effective income tax rate | 31.8 | % | 34.8 | % | 33.6 | % | |||
The effective tax rate for continuing operations represents the combined federal, state and foreign tax effects attributable to pretax earnings for the year. The decrease in the effective rate for 2014 as compared to 2013 was primarily due to adjustments between the provision for taxes for 2013 and the actual returns filed.
The increase in the effective rate for 2013 as compared to 2012 was primarily due to the non-cash non-tax deductible goodwill charge and the reversal in 2012 of a liability for unrecognized tax benefits.
Gain/(Loss) on Disposal of Discontinued Operations, Net of Tax
The Company sold the Distribution segment's Mexican business unit, Delamac, on December 19, 2014. The sale resulted in a net loss on disposal of discontinued operations of $5.3 million for the year ended December 31, 2014.
The Company sold substantially all of the assets and liabilities of our Distribution segment's Canadian operations on December 31, 2012. The sale resulted in a net gain on disposal of discontinued operations of $0.3 million, $0.4 million and $1.3 million for the years ended December 31, 2014, 2013 and 2012, respectively.
More information on these transactions can be found in Note 2, Discontinued Operations, in the Notes to Consolidated Financial Statements included in this Form 10-K.
Other Matters
Information regarding our various environmental remediation activities and associated accruals can be found in Note 16, Commitments and Contingencies, in the Notes to Consolidated Financial Statements included in this Form 10-K.
SEGMENT RESULTS OF OPERATIONS AND FINANCIAL CONDITION
Distribution Segment
Our Strategy
The Distribution segment's strategy is to grow and improve margins both organically and through acquisitions, broaden and improve our product and service offerings in mechanical, electrical and fluid power, expand our geographic footprint in order to enhance our position in the competition for municipal, regional and national accounts, and to improve productivity and customer service through investments in technology and the effective integration of acquisitions.
Results of Operations
The following table presents selected financial data for our Distribution segment:
2014 | 2013 | 2012 | ||||||||||
In thousands | ||||||||||||
Net sales from continuing operations | $ | 1,161,992 | $ | 1,039,954 | $ | 982,573 | ||||||
$ change | 122,038 | 57,381 | 77,794 | |||||||||
% change | 11.7 | % | 5.8 | % | 8.6 | % | ||||||
Operating income | $ | 56,765 | $ | 46,206 | $ | 49,316 | ||||||
$ change | 10,559 | (3,110 | ) | 3,187 | ||||||||
% change | 22.9 | % | (6.3 | )% | 6.9 | % | ||||||
% of net sales | 4.9 | % | 4.4 | % | 5.0 | % | ||||||
32
Net sales from continuing operations
Organic sales per sales day is a metric management uses to evaluate performance trends in its Distribution segment and is calculated by taking total organic sales during a specific period divided by the number of sales days in that period. See Management’s Discussion and Analysis of Financial Condition and Results of Operations - Non-GAAP Financial Measures, in this Form 10-K.
2014 | 2013 | 2012 | ||||||||||
Organic Sales Per Sales Day (in thousands, except numbers of sales days) | ||||||||||||
Current period | ||||||||||||
Net sales from continuing operations | $ | 1,161,992 | $ | 1,039,954 | $ | 982,573 | ||||||
Acquisition sales (a) | 89,388 | 72,578 | 85,272 | |||||||||
Organic sales | $ | 1,072,604 | $ | 967,376 | $ | 897,301 | ||||||
Sales days | 253 | 253 | 253 | |||||||||
Organic sales per sales day for the current period | a | $ | 4,240 | $ | 3,824 | $ | 3,547 | |||||
Prior period | ||||||||||||
Net sales from the prior year | $ | 1,039,954 | $ | 982,573 | $ | 903,153 | ||||||
Sales days in the prior year | 253 | 253 | 253 | |||||||||
Organic sales per sales day from the prior year | b | $ | 4,110 | $ | 3,884 | $ | 3,570 | |||||
% change in organic sales per sales day | (a-b)/b | 3.2 | % | (1.5 | )% | (0.6 | )% | |||||
(a)Sales contributed by an acquisition are included in organic sales beginning with the thirteenth month following the date of acquisition. Prior period information is adjusted to reflect acquisition sales for that period as organic sales when calculating organic sales per sales day.
2014 versus 2013
Net sales from continuing operations for 2014 increased as compared to 2013 due to the contribution of $89.4 million in sales in 2014 from our 2014 and 2013 acquisitions and an increase in organic sales. The Distribution segment's organic sales per sales day increased in 2014 primarily due to higher sales in the machinery manufacturing, transportation equipment manufacturing and paper manufacturing industries, while the demand in computer and electronic product manufacturing partially offset these increases.
2013 versus 2012
Net sales for 2013 increased as compared to 2012 due to the contribution of $72.6 million in sales in 2013 from our 2013 and 2012 acquisitions, offset in part by lower organic sales. The Distribution segment's organic sales per sales day decreased in 2013 primarily due to lower sales in the food and beverage manufacturing markets and fabricated metal product manufacturing industries, while the demand in transportation equipment, non-metallic mineral manufacturing, computer and electronic product manufacturing and chemical manufacturing increased.
Operating Income
2014 versus 2013
Operating income from continuing operations increased during 2014 as compared to 2013 primarily due to the contribution of operating income from 2014 and 2013 acquisitions, incremental gross profit associated with the increase in organic sales, the absence of $2.8 million of restructuring costs, lower pension expense and higher rebate income on our national accounts. These increases were partially offset by increased SG&A costs related to higher employee related incentive costs, and higher salary and wage expense primarily associated with the expansion of our sales force.
33
2013 versus 2012
Operating income from continuing operations decreased during 2013 as compared to 2012 primarily due to higher operating expenses as a result of our 2013 and 2012 acquisitions, lower volume incentives due to the reduced sales volume noted above and $2.8 million of expense associated with the restructuring in the first quarter of 2013. These decreases were partially offset by cost savings of approximately $6.4 million as a result of the restructuring.
Other Matters
Enterprise Resource Planning System ("ERP")
In July 2012, we announced our decision to invest in a new enterprise-wide business system for our Distribution segment. The current anticipated total investment in the new system is approximately $45 million, which will be spread over a number of years. Of the total investment, approximately 75% will be capitalized. Depreciation and amortization of the capitalized cost commenced in 2014 and is expected to increase over the following three to four years. In order to minimize disruptions to our ongoing operations we have developed a project plan that takes a phased approach to implementation. For the years ended December 31, 2014 and 2013, expenses incurred were approximately $0.8 million and $1.3 million, respectively, and capital expenditures were $8.0 million and $9.9 million, respectively. In 2014, the Distribution segment reached a significant milestone when our Minarik Automation & Controls facilities went live on the new system.
Aerospace Segment
Our Strategy
Our strategic goals for the Aerospace segment are built upon four objectives: Depth, Diversity, Differentiation and Development. In order to achieve these objectives, we focus our efforts on improving balance between commercial and defense program content, leveraging our broad capabilities to expand market positions, executing strategic acquisitions and increasing focused investments in our people and infrastructure to increase capabilities and drive continuous improvement. The creation of our “One Kaman” approach combines design and build capabilities to provide customers with global integrated solutions. This approach provides us with the size and strength to address larger, integrated work packages from OEMs and Tier 1 suppliers.
Results of Operations
The following table presents selected financial data for our Aerospace segment:
2014 | 2013 | 2012 | ||||||||||
In thousands | ||||||||||||
Net sales | $ | 632,970 | $ | 613,967 | $ | 580,769 | ||||||
$ change | 19,003 | 33,198 | 33,366 | |||||||||
% change | 3.1 | % | 5.7 | % | 6.1 | % | ||||||
Operating income | $ | 108,697 | $ | 102,573 | $ | 89,142 | ||||||
$ change | 6,124 | 13,431 | 8,718 | |||||||||
% change | 6.0 | % | 15.1 | % | 10.8 | % | ||||||
% of net sales | 17.2 | % | 16.7 | % | 15.3 | % | ||||||
Net Sales
2014 versus 2013
Aerospace segment net sales increased as a result of an $11.6 million increase in sales on our commercial products/programs and a $7.4 million increase in sales on our military programs. The increase in commercial sales is primarily due to increased deliveries on commercial composite structures products/programs and higher commercial bearing product sales. These increases totaled $19.2 million and were partially offset by decreases totaling $7.5 million due to lower sales of engineering design services and a decline in sales volume of composite imaging products.
34
The increase in military sales was primarily attributable to higher sales under the SH-2G(I) contract with New Zealand, increased sales of our JPF to the USG and higher sales volume on the A-10 program. These increases totaled $74.5 million and were largely offset by a $67.7 million decrease in other sales, including lower commercial sales of the JPF to foreign militaries, a decline in shipments on the Sikorsky BLACK HAWK helicopter program, lower military bearing product sales and lower volume under our Boeing CH-47 inlet screen program.
2013 versus 2012
Aerospace segment net sales increased primarily due to a $31.5 million increase in sales on our military programs. The increase in military sales was primarily attributable to the initial recognition of revenue on the SH-2G(I) contract with New Zealand, increased sales on our JPF program, revenue recognized on the AH-1Z program and higher military bearing product sales. These increases totaled $46.7 million and were offset by a $14.9 million decrease in other sales, including a $5.8 million decrease in sales resulting from the cancellation of the blade erosion coating program, a decline in shipments on the Sikorsky BLACK HAWK helicopter program and lower fabrication sales.
Commercial sales increased $1.7 million for 2013 as compared to 2012. This increase was due to higher commercial bearing product sales, an increase in deliveries of various commercial composite and metallic structures products/programs and higher tooling sales. These increases totaled $21.8 million but were substantially offset by a $19.6 million decrease in sales due to lower sales of engineering design services resulting from a reduction in requirements by a major OEM customer, the absence of the $2.5 million of sales recorded in 2012 upon resolution of a program related matter and lower sales of K-MAX® commercial spares.
Operating Income
2014 versus 2013
The increase in operating income for 2014 as compared to 2013 was primarily due to gross profit attributable to the revenue recognized on the SH-2G(I) program, gross margin associated with higher commercial bearing product sales and the absence of the $2.1 million non-cash non-tax deductible goodwill impairment charge recorded in 2013. These increases totaled $18.7 million and were partially offset by a $13.6 million decrease related to lower sales of military bearing products, lower margin on the JPF as a result of lower commercial sales to foreign militaries and lower margins on our tooling sales.
2013 versus 2012
The increase in operating income for 2013 as compared to 2012 was primarily due to gross profit attributable to the revenue recognized on the SH-2G(I) program, higher commercial and military bearing product sales and higher gross profit on our JPF program. Additionally, operating income benefited from the absence of the $3.3 million net loss related to the resolution of a program related matter in 2012. These product/program profit increases totaled $24.7 million. The higher profit contributions were partially offset by a $7.5 million gross profit reduction related to lower sales of engineering design services and Sikorsky BLACK HAWK helicopter cockpits combined with a $2.1 million non-cash non-tax deductible goodwill impairment charge. Additionally, SG&A expense increased $3.6 million, which was partially due to a $2.0 million increase in research and development expense.
Long-Term Contracts
For long-term aerospace contracts, we generally recognize sales and income based on the percentage-of-completion method of accounting, which allows for recognition of revenue as work on a contract progresses. We recognize sales and profit based on either (1) the cost-to-cost method, which results in costs being reported as cost of sales as incurred and sales (and profit) being recorded based upon the ratio of costs incurred to estimated total costs to complete the contract, or (2) the units-of-delivery method, which results in sales being recognized as deliveries are made and cost of sales being computed on the basis of the estimated ratio of total contract cost to total contract sales.
Revenue and cost estimates for all significant long-term contracts for which revenue is recognized using the percentage-of-completion method of accounting are reviewed and reassessed quarterly. Based upon these reviews, we record the effects of adjustments in profit estimates each period. If at any time management determines that in the case of a particular contract total costs will exceed total contract revenue, we record a provision for the entire anticipated contract loss at that time. The net increase in our operating income from changes in contract estimates totaled $1.9 million for the year ended December 31, 2014. The increase in 2014 was primarily a result of improved performance on the New Zealand SH-2G(I) program, the JPF program and a mix of composite programs. These improvements were slightly offset by cost growth on the Sikorsky BLACK
35
HAWK helicopter program. The net decrease in operating income from changes in contract estimates totaled $3.0 million for the year ended December 31, 2013 and $4.7 million for the year ended December 31, 2012. The decrease in 2013 was primarily driven by cost growth on aerostructure assemblies and the decrease in 2012 was due to cost growth on our JPF program.
Backlog
2014 | 2013 | 2012 | ||||||||||
In thousands | ||||||||||||
Backlog | $ | 518,025 | $ | 601,954 | $ | 531,923 | ||||||
The backlog balance decreased from 2013 to 2014, primarily due to work performed on the SH-2G(I) New Zealand program and deliveries of BLACK HAWK helicopter cockpits. These reductions were partially offset by new orders under our JPF program.
The backlog balance increased from 2012 to 2013, primarily due to the $120.6 million contract for the sale of ten SH-2G(I) aircraft, spare parts, a full mission flight simulator, and related logistics support to the New Zealand Ministry of Defence and an increase of $34 million related to our USG JPF program. These increases were partially offset by deliveries of bearing products and fuzes under our JPF program.
Major Programs/Product Lines
Defense Markets
A-10
The segment has contracted with Boeing to produce the wing control surfaces (inboard and outboard flaps, slats and deceleron assemblies) for the U.S. Air Force’s A-10 fleet. This contract has a potential value of over $110.0 million; however, annual quantities will vary, as they are dependent upon the orders Boeing receives from the U.S. Air Force. Initial deliveries under this program began in the third quarter of 2010 and full rate production began during the fourth quarter of 2012. Through December 31, 2014, 104 shipsets have been delivered over the life of the program. The Department of Defense Fiscal Year 2015 Budget has eliminated funding for the A-10 fleet; however, a final determination as to the future of this program has not been made and there is congressional support for its continuation. We continue to monitor the defense budget and understand that the future of this program could be at risk without the continued support of Congress. As of the date of this filing, we believe congressional support remains strong and we have confidence that this program will continue. We received orders for additional shipsets in January 2014, and through the date of this filing we have not received any indication from our customer that this program will be terminated. Tooling and non-recurring costs on this program are being amortized over 242 shipsets, the number of shipsets expected to be delivered under this program. At December 31, 2014, our program backlog was $31.6 million, representing approximately 70 shipsets, and total program inventory was $19.3 million, of which a significant portion may not be recoverable in the event of a contract termination.
Bearings
Our bearings products are included on numerous military platforms manufactured in North America, Asia and Europe. These products are used as original equipment and/or specified as replacement parts by the manufacturers. The most significant portion of our military bearings sales is derived from U.S. military platforms, such as the AH-64 helicopter, Virginia Class submarine and JSF aircraft, and sales in Europe for the Typhoon program. These products are primarily proprietary self-lubricating, ball and roller bearings for aircraft flight controls, turbine engines, and landing gear, and helicopter driveline couplings.
BLACK HAWK
The Sikorsky BLACK HAWK helicopter cockpit program involves the manufacture of cockpits including the installation of all wiring harnesses, hydraulic assemblies, control pedals and sticks, seat tracks, pneumatic lines, and the composite structure that holds the windscreen for most models of the BLACK HAWK helicopter. As a result of lower customer demand, we delivered only 84 cockpits this year as compared to the 114 cockpits delivered in 2013. Included in backlog at December 31, 2014, is $52.2 million for orders on this program. We anticipate delivering 67 cockpits in 2015.
36
AH-1Z
The segment manufactures cabins for the increased capability AH-1Z attack helicopter, which is produced by Bell Helicopter for the U.S. Marine Corps. The cabin is the largest and most complex airframe structure utilized in the final assembly of the AH-1Z helicopter and has not been manufactured new since 1995. The first cabin was delivered in the fourth quarter of 2013. During the first quarter of 2014, Bell conducted the first test flight for the re-designed AH-1Z helicopter. To date, technical issues have precluded us from completing the cabins prior to making delivery; however, we have provided Bell with substantially complete cabins to allow Bell to continue with its production of initial aircraft. Revenue on this program is recognized based upon customer acceptance of delivered cabins. Our total program inventory is $39.3 million at December 31, 2014. We currently have $14.0 million in backlog for orders under this program; however, with potential follow-on options the program value could exceed $200.0 million.
C-17
The segment manufactured structural wing subassemblies for the Boeing C-17. During 2014, we completed deliveries of the final seven shipsets and do not expect to receive any additional orders.
SH-2G Programs
Egypt
During the third quarter of 2014 the segment completed work under a program for depot level maintenance and upgrades for nine Kaman SH-2G(E) helicopters originally delivered to the Egyptian government during the 1990s. We do not anticipate receiving additional funding under this program at this time.
New Zealand
On May 6, 2013, we announced that the New Zealand Ministry of Defence ("MoD") entered into a $120.6 million contract for the purchase of ten SH-2G(I) Super Seasprite aircraft, spare parts, a full mission flight simulator, and related logistics support. The contract calls for the aircraft to be delivered over a period of approximately three years. During the fourth quarter of 2014, the first three upgraded SH-2G(I) aircraft were accepted by the New Zealand MoD.
Peru
During the fourth quarter of 2014, we entered into a contract with General Dynamics Canada to remanufacture and upgrade four Kaman SH-2G Super Seasprite aircraft and provide support for the operation of a fifth aircraft for the Peruvian Navy. The program value to Kaman is expected to exceed $40 million. Total backlog at December 31, 2014, is $8.7 million.
FMU-152 – Joint Programmable Fuze (“JPF”)
We manufacture the JPF, an electro-mechanical bomb safe and arming device, which allows the settings of a weapon to be programmed in flight. During 2014, we were awarded approximately $90.0 million of USAF sales orders under Option 11 of our contract with the US Government, for fuzes to be delivered in 2015 and 2016. Total JPF backlog at December 31, 2014, is $115.2 million.
A total of 6,855 fuzes passed acceptance testing and were delivered to our customers during the fourth quarter of 2014, for a total of 24,333 fuzes delivered in 2014. We occasionally experience lot acceptance test failures due to the complexity of the product and the extreme parameters of the acceptance test. Given the maturity of the product, we now generally experience isolated failures, rather than systematic ones. As a result, identifying a root cause can take longer and result in inconsistent delivery quantities from quarter to quarter. We expect to deliver 20,000 to 26,000 fuzes in 2015.
37
Commercial Markets
777 / 767
In January 2015, we signed a multi-year follow-on contract with Boeing for the production of fixed trailing edge ("FTE") assemblies for the Boeing 777 and 767 commercial aircraft. To date, Kaman has provided more than 1,000 FTE kits and assemblies for each of the 777 and 767 programs since 1995 and 1986, respectively. During 2014, on average we delivered nine ship sets per month on the Boeing 777 platform and one ship set per month on the Boeing 767 platform. For 2015, we estimate deliveries on the 777 program to be eight shipsets per month and on the 767 program to be one and one-half shipsets per month. The total contract value is estimated to be in excess of $75 million; however, annual quantities will vary, as they are dependent upon the orders Boeing receives from its customers.
Airbus
Our U.K. Composites operations provide composite components for many Airbus platforms. The most significant of these are the A320, A330, A340 and A350. Orders for all of these platforms are dependent on the customer’s build rate.
Bearings
Our bearings products are included on commercial airliners and regional/business jets manufactured in North and South America, Europe and Asia and are used as original equipment and/or specified as replacement parts by airlines and aircraft manufacturers. These products are primarily proprietary self-lubricating, ball and roller bearings for aircraft flight controls, turbine engines, landing gear, and helicopter driveline couplings. The most significant portion of our commercial sales is derived from Boeing and Airbus platforms, such as the Boeing 737, 747, 777 and 787 and the Airbus A320, A330, A350 and A380.
Bell Helicopter
In November 2014, we were awarded an extension to our current contract with Bell Helicopter to manufacture skin and skin to core components for several of Bell’s commercial helicopter models. This three-year follow on contract has an expected value in excess of $24.0 million. The components are manufactured at our full-service aerospace innovation and manufacturing support center in Bloomfield, Connecticut. At December 31, 2014, $5.9 million was included in backlog for orders under this program. Annual quantities for this program will vary, as they are dependent upon the orders Bell receives from its customers.
Engineering Design Services
The Company offers engineering design services to Aerospace OEM customers. Engineering design service programs generate revenue primarily through the billing of employees' time spent on customer projects. Our engineers provide value to new aircraft development and product improvement programs. While we have seen a decline in sales levels for these services in recent years, we have sought out expansion opportunities, as evidenced by the opening of our new office in North Charleston, South Carolina during 2014.
Learjet 85
In 2010, our U.K. Composites operation was awarded a contract to manufacture composite passenger entry and over-wing exit doors for the Learjet 85, a mid-sized business jet built primarily from composites and featuring advances in aerodynamics, structures and efficiency. We began delivery during the second quarter of 2013. In April 2014, Bombardier conducted the first test flight for the Learjet 85. However, in January 2015, Bombardier Inc. announced a "pause" of its Learjet 85 business aircraft program. This program is currently in a "stop work" status.
747-8 Wing-to-Body Fairing
The segment has contracted with Boeing Canada Winnipeg to manufacture and assemble two major sections of the 747-8 Wing-to-Body Fairing. Initial production for these components will occur at our Jacksonville facility and upon completion these components will be delivered directly to Boeing's wide-body assembly line in Everett, Washington. The contract has potential value, depending on production rates, in excess of $60.0 million. Initial deliveries under this program began in the second quarter of 2014 and we shipped six shipsets in 2014. We expect to ship 16 shipsets in 2015.
38
K-MAX®
During 2014, we announced that our Aerospace segment is soliciting interest in new K-MAX® aircraft. We believe there is demand for new aircraft to support firefighting, logging or any industry requiring repetitive aerial lift capabilities, and the K-MAX® is extremely well suited for all of these industrial applications. Since our announcement in the first half of the year, several potential customers have expressed interest in acquiring new aircraft.
Other Matters
For a discussion of other matters related to our Aerospace segment see Note 16, Commitments and Contingencies, in the Notes to Consolidated Financial Statements included in this Form 10-K.
LIQUIDITY AND CAPITAL RESOURCES
Discussion and Analysis of Cash Flows
We assess liquidity in terms of our ability to generate cash to fund working capital and investing and financing activities. Significant factors affecting liquidity include: cash flows generated from or used by operating activities, capital expenditures, investments in our business segments and their programs, acquisitions, divestitures, dividends, availability of future credit, adequacy of available bank lines of credit, and factors that might otherwise affect the Company's business and operations generally, as described under the heading “Risk Factors” and “Forward-Looking Statements” in Item 1A of Part I of this Form 10-K.
We continue to rely upon bank financing as an important source of liquidity for our business activities including acquisitions. We believe this, when combined with cash generated from operating activities, will be sufficient to support our anticipated cash requirements for the foreseeable future. However, we may decide to raise additional debt or equity capital to support other business activities including potential future acquisitions. We anticipate our capital expenditures will be approximately $30.0 to $40.0 million in 2015, primarily related to machinery and equipment and information technology infrastructure.
In addition to our working capital requirements, one or more of the following items could have an impact on our liquidity during the next 12 months:
• | the matters described in Note 16, Commitments and Contingencies, in the Notes to Consolidated Financial Statements, including the cost of existing environmental remediation matters and deposits required to be made to the environmental escrow for the Moosup facility sold in 2014; |
• | contributions to our qualified pension plan and Supplemental Employees’ Retirement Plan (“SERP”); |
• | costs associated with the start-up of new aerospace programs; and |
• | the extension of payment terms by our customers. |
However, we do not believe any of these matters will lead to a shortage of capital resources or liquidity that would prevent us from continuing with our business operations as expected.
We regularly monitor credit market conditions to identify potential issues that may adversely affect, or provide opportunities for, the securing and/or pricing of additional financing, if any, that may be necessary to continue with our growth strategy and finance working capital requirements.
Management regularly monitors its pension plan asset performance and the assumptions used in the determination of our benefit obligation, comparing them to actual experience. We continue to believe the assumptions selected are valid due to the long-term nature of our benefit obligation.
In 2013, the Company signed a $120.6 million contract to resell ten of the former Australian SH-2G(A) (now designated SH-2G(I)) aircraft, a full mission flight simulator, and related logistics support to the New Zealand MoD. Pursuant to the terms of the revenue sharing agreement with the Commonwealth of Australia, the Company was to share proceeds from the resale with the Commonwealth on a predetermined basis. During the third quarter of 2014, the Company settled the revenue sharing agreement with the Commonwealth of Australia and made a final payment of $5.3 million. As a result, no further revenue sharing payments will be due to the Commonwealth of Australia as the Company sells the remainder of the SH-2G(I) inventory. Over the course of the revenue sharing agreement, net of the benefits derived from our hedging arrangements, the Company paid approximately $32.1 million to the Commonwealth of Australia.
39
Upon entering into the sales contract with the New Zealand MoD, we agreed to provide unconditional letters of credit for the receipt of advance payments on this program. As we perform under the contract and meet certain predetermined milestones, the letter of credit requirements will be gradually reduced. As of December 31, 2014, the letter of credit balance associated with this program was $54.5 million.
A summary of our consolidated cash flows from continuing operations is as follows:
2014 | 2013 | 2012 | 14 vs. 13 | 13 vs. 12 | ||||||||||||||||
(in thousands) | ||||||||||||||||||||
Total cash provided by (used in): | ||||||||||||||||||||
Operating activities | $ | 109,089 | $ | 64,840 | $ | 85,824 | $ | 44,249 | $ | (20,984 | ) | |||||||||
Investing activities | (100,059 | ) | (61,219 | ) | (116,851 | ) | (38,840 | ) | 55,632 | |||||||||||
Financing activities | (3,538 | ) | (8,115 | ) | 39,640 | 4,577 | (47,755 | ) | ||||||||||||
Free Cash Flow(a) : | ||||||||||||||||||||
Net cash provided by (used in) operating activities | $ | 109,089 | $ | 64,840 | $ | 85,824 | $ | 44,249 | $ | (20,984 | ) | |||||||||
Expenditures for property, plant and equipment | (28,283 | ) | (40,852 | ) | (32,386 | ) | 12,569 | (8,466 | ) | |||||||||||
Free cash flow | $ | 80,806 | $ | 23,988 | $ | 53,438 | $ | 56,818 | $ | (29,450 | ) | |||||||||
(a) Free Cash Flow, a non-GAAP financial measure, is defined as net cash provided by operating activities less expenditures for property plant and equipment, both of which are presented in our consolidated statements of cash flows. See Management’s Discussion and Analysis of Financial Condition and Results of Operations—Non-GAAP Financial Measures, in this Form 10-K.
2014 vs. 2013
Net cash provided by operating activities of continuing operations increased $44.2 million in 2014 compared to 2013, primarily due to proceeds from the sales of SH-2G(I) inventory as we continue to perform under the New Zealand program and JPF program inventories and an increase in earnings from continuing operations, driven by increased operating income at both our segments. These changes are partially offset by the reduction of advances on contracts as we achieve milestones on certain Aerospace segment programs.
Net cash used in investing activities of continuing operations increased $38.8 million due to a $59.5 million increase in cash used for acquisitions, partially offset by a decrease of $12.6 million in cash used for the purchase of property, plant and equipment and $8.9 million in proceeds received from the sale of our Distribution segment's Mexico business unit, Delamac.
Net cash used in financing activities of continuing operations decreased $4.6 million primarily due to the repayment of borrowings under our revolving credit facility due to the significant cash flow generation for the year.
2013 vs. 2012
Net cash provided by operating activities of continuing operations decreased $21.0 million in 2013 compared to 2012, primarily due to an increase in accounts receivable balances at both segments, partially due to approximately $16.0 million of outstanding receivables with foreign customers associated with our Aerospace segment's JPF program which was collected subsequent to year end. Offsetting the decrease in cash provided was a lower use of cash for accounts payable, primarily related to inventory buys made in the fourth quarter.
Net cash used in investing activities of continuing operations decreased $55.6 million due to a $69.5 million decrease in cash used for acquisitions, partially offset by an increase of $8.5 million in cash used for the purchase of property, plant and equipment, including the new ERP system at our Distribution segment and improvements to the Company's corporate facilities.
Net cash used in financing activities of continuing operations for 2013 was $8.1 million, compared to net cash provided by financing activities of continuing operations for 2012 of $39.6 million. This change reflects the proceeds of $100.0 million we received in 2012 from the issuance of long-term debt that did not occur in 2013. This decrease was offset by borrowings under the revolving credit agreement and lower debt repayments.
40
Financing Arrangements
Credit Agreement
On November 20, 2012, we entered into a Credit Agreement (the "Credit Agreement") with JPMorgan Chase Bank, N.A., as Administrative Agent, Bank of America, N.A. and RBS Citizens, N.A. as Co-Syndication Agents, J.P. Morgan Securities LLC (“J.P. Morgan Securities”), Merrill Lynch, Pierce, Fenner & Smith Incorporated (“MLPF&S”) and RBS Citizens, N.A. as Joint Bookrunners and Joint Lead Arrangers, and the other lenders named therein (collectively, the “Lenders”), which expires on July 31, 2017. The Credit Agreement replaced our then existing $275.0 million Amended and Restated Revolving Credit Agreement and $42.5 million Second Amended and Restated Term Loan Credit Agreement.
The Credit Agreement provides a $400.0 million revolving credit facility under which we may issue letters of credit for our benefit and a $100.0 million term loan facility. The term loan commitment requires quarterly payments of principal (which commenced on March 31, 2013) at the rate of $2.5 million per quarter with $55.0 million payable in the final quarter of the facility's term. We may increase the aggregate amount of each of the revolving credit facility and the term loan facility by up to $100.0 million in accordance with the terms of the Credit Agreement.
Interest rates on amounts outstanding under the Credit Agreement are variable. At December 31, 2014 and 2013, the interest rates for the outstanding amounts on the Credit Agreement were 1.70% and 1.72%, respectively. In addition, we are required to pay a quarterly commitment fee on the unused revolving loan commitment amount at a rate ranging from 0.200% to 0.325% per annum, based on the Consolidated Senior Secured Leverage Ratio (as defined in the Credit Agreement). Fees for outstanding letters of credit range from 1.250% to 2.125%, based on the Consolidated Senior Secured Leverage Ratio.
The financial covenants associated with the Credit Agreement include a requirement that (i) the ratio of Consolidated Senior Secured Indebtedness to Consolidated EBITDA, as defined in the Credit Agreement, cannot be greater than 3.50 to 1.00, (ii) the ratio of Consolidated Total Indebtedness to Consolidated EBITDA, as defined in the Credit Agreement, cannot be greater than 4.00 to 1.00, and (iii) the ratio of Consolidated EBITDA to to the sum of (a) all interest, premium payments, debt discounts, fees, charges and related expenses and (b) the portion of rent expense under capital leases that is treated as interest expense, as defined in the Credit Agreement, cannot be less than 4.00 to 1.00. The Company was in compliance with those financial covenants as of and for the quarter ended December 31, 2014, and management does not anticipate noncompliance in the foreseeable future.
Total average bank borrowings under our revolving credit facility and term loan facility during the year ended December 31, 2014, were $214.8 million compared to $188.8 million for the year ended December 31, 2013. As of December 31, 2014 and 2013, there was $248.6 million and $285.6 million available for borrowing, respectively, net of letters of credit. Letters of credit are generally considered borrowings for purposes of calculating available borrowings. A total of $59.2 million and $36.8 million in letters of credit was outstanding as of December 31, 2014 and 2013, respectively. The letter of credit balance related to the SH-2G(I) New Zealand sales contract was $54.5 million at December 31, 2014. We expect the letter of credit balance related to the SH-2G(I) New Zealand sales contract to be released in the second half of 2015.
Convertible Notes
In November 2010, we issued convertible unsecured notes due on November 15, 2017, in the aggregate principal amount of $115.0 million in a private placement offering (the "Convertible Notes"). These notes bear 3.25% interest per annum on the principal amount, payable semiannually in arrears on May 15 and November 15 of each year, beginning on May 15, 2011. Proceeds from the offering were $111.0 million, net of fees and expenses which were capitalized. The proceeds were used to repay $62.2 million of borrowings outstanding on the Company’s Revolving Credit Agreement, make a $25.0 million voluntary contribution to the Qualified Pension Plan and pay $13.2 million for the purchase of call options related to the convertible note offering. See below for further discussion of the call options.
The Convertible Notes will mature on November 15, 2017, unless earlier redeemed, repurchased by the Company or converted. Upon conversion, the Convertible Notes require net share settlement, where the aggregate principal amount of the notes will be paid in cash and remaining amounts due, if any, will be settled in cash, shares of the Company's common stock or a combination of cash and shares of common stock, at the Company's election.
41
The following table illustrates the conversion rate at each date:
December 31, 2014 | December 31, 2013 | |||||||
Convertible Notes | ||||||||
Conversion Rate per $1,000 principal amount (1) | 29.6876 | 29.6292 | ||||||
Conversion Price (2) | $ | 33.68 | $ | 33.75 | ||||
Contingent Conversion Price (3) | $ | 43.79 | $ | 43.88 | ||||
Aggregate shares to be issued upon conversion (4) | 3,414,074 | 3,407,357 | ||||||
(1) Represents the number of shares of Common Stock hypothetically issuable per $1,000 principal amount of Notes, subject to adjustments per the Convertible Note Indenture dated November 19, 2010. At the date the Company issued the Convertible Notes, the conversion rate initially equaled 29.4499 shares of common stock per $1,000 principal amount of notes (which is equivalent to an initial conversion price of approximately $33.96 per share of common stock). The conversion rate is subject to adjustment upon the occurrence of certain specified events, such as an increase in the dividend paid to shareholders.
(2) Represents $1,000 divided by the conversion rate as of such date. The conversion price reflects the strike price of the embedded option within the Convertible Note. Were the Company's share price to exceed the conversion price at conversion the noteholders would be entitled to receive additional consideration either in cash, shares or a combination, the form of which is at the sole discretion of the Company.
(3) Prior to May 15, 2017, the notes are convertible only in the following circumstances: (1) during any fiscal quarter commencing after April 1, 2011, and only during any such fiscal quarter, if the last reported sale price of our common stock was greater than or equal to 130% of the applicable conversion price for at least 20 trading days (whether or not consecutive) during the 30 consecutive trading days ending on the last trading day of the previous fiscal quarter, (2) upon the occurrence of specified corporate transactions, or (3) during the five consecutive business-day period following any five consecutive trading-day period in which, for each day of that period, the trading price for the notes was less than 98% of the product of the last reported sale price of our common stock and the applicable conversion rate on such trading day. On and after May 15, 2017, until the close of business on the second scheduled trading day immediately preceding the maturity date, holders may convert their notes at any time, regardless of the foregoing circumstances. Upon a change in control or termination of trading, holders of the notes may require us to repurchase all or a portion of their notes for cash at a repurchase price equal to 100% of the principal amount, plus any accrued and unpaid interest.
(4) Represents the number of shares hypothetically issuable upon conversion of the principal balance of the Convertible Notes at each date; however, as the terms of the Convertible Notes require net share settlement, the aggregate principal amount of the notes will be paid in cash. Amounts due in excess of the principal, if any, may be settled in cash, shares of the Company's common stock or a combination of cash and shares of common stock, at the Company's election.
Because the embedded conversion option is indexed to the Company’s own stock and would be classified in shareholders’ equity, it does not meet the criterion under FASB Accounting Standards Codification Topic 815 - Derivatives and Hedging ("ASC 815") that would require separate accounting as a derivative instrument.
In connection with the offering, we entered into convertible note hedge transactions with affiliates of the initial purchasers. These transactions are intended to reduce the potential dilution to our Company's shareholders upon any future conversion of the notes. The call options, which cost an aggregate $13.2 million, were recorded as a reduction of additional paid-in capital. The Company also entered into warrant transactions concurrently with the offering, pursuant to which we sold warrants to acquire up to approximately 3.4 million shares of our common stock to the same counterparties that entered into the convertible note hedge transactions. Proceeds received from the issuance of the warrants totaled approximately $1.9 million and were recorded as additional paid-in capital. The convertible note hedge and warrant transactions effectively increased the conversion price of the convertible notes.
The following table illustrates the warrant price at each date:
December 31, 2014 | December 31, 2013 | |||||||
Warrants | ||||||||
Warrant Price | $ | 44.05 | $ | 44.14 | ||||
The note payable principal balance at the date of issuance of $115.0 million was bifurcated into the debt component of $101.7 million and the equity component of $13.3 million. The difference between the note payable principal balance and the
42
value of the debt component is being accreted to interest expense over a period of 7 years. The debt component was recognized at the present value of associated cash flows discounted using a 5.25% discount rate, the borrowing rate at the date of issuance for a similar debt instrument without a conversion feature. We recorded $0.5 million of debt issuance costs as an offset to additional paid-in capital. The balance, $3.1 million, is being amortized over the term of the notes. Total amortization expense for the years ended December 31, 2014, 2013, and 2012 was $0.5 million.
The following table illustrates the dilutive effect of securities issued under the convertible debt and warrants at various theoretical average share prices for our stock as of December 31, 2014:
Theoretical Average Share Price of Kaman Stock | |||||||||||||||
$33.68 | $40.00 | $44.05 | $45.00 | $50.00 | |||||||||||
Dilutive Shares associated with: | |||||||||||||||
Convertible Debt | — | 539,074 | 803,309 | 858,518 | 1,114,074 | ||||||||||
Warrants | — | — | — | 72,196 | 406,384 | ||||||||||
Total dilutive shares | — | 539,074 | 803,309 | 930,714 | 1,520,458 | ||||||||||
Debt Issuance Costs
Total expense associated with the amortization of debt issuance costs for the years ended December 31, 2014, 2013 and 2012, was $1.1 million, $1.1 million and $1.3 million, respectively.
Interest Rate Swaps
During 2013, we entered into interest rate swap agreements for the purposes of hedging the eight quarterly variable-rate Term Loan interest payments due in 2014 and 2015. These interest rate swap agreements were designated as cash flow hedges and intended to manage interest rate risk associated with our variable-rate borrowings and minimize the impact on our earnings and cash flows of interest rate fluctuations attributable to changes in LIBOR rates. For the year ended December 31, 2014, there was $0.4 million of interest expense associated with the interest rate swap agreements. There was no additional interest expense associated with interest rate swap agreements in 2013.
Other Sources/Uses of Capital
Pension
We contributed $10.0 million to the qualified pension plan and $0.8 million to the SERP during 2014. In 2013, we contributed $10.0 million to the qualified pension plan and $2.3 million to the SERP. In 2015, we have contributed $10.0 million to the qualified pension plan (as of the date of this filing) and do not anticipate making any further contributions this year. We expect to contribute $0.5 million to the SERP in 2015.
Acquisitions
The following table illustrates the cash paid for acquisitions:
For the year ended December 31, | |||||||||||
2014 | 2013 | 2012 | |||||||||
In thousands | |||||||||||
Cash paid for acquisitions completed during the year | $ | 70,948 | $ | 17,284 | $ | 74,465 | |||||
Cash paid for holdback payments during the year | 3,060 | 828 | 11,951 | ||||||||
Earnout and other payments during the year | 3,610 | 50 | 1,205 | ||||||||
Total cash paid for acquisitions | $ | 77,618 | $ | 18,162 | $ | 87,621 | |||||
Total consideration for the acquisitions completed in 2014 was $71.9 million, with $1.4 million remaining to be paid to sellers representing holdback provisions. Total consideration for acquisitions completed in 2013 and 2012 was $17.8 million and $76.8 million, respectively. We anticipate that we will continue to identify and evaluate potential acquisition candidates, the purchase of which may require the use of additional capital.
43
Stock Repurchase Plan
In November 2000, our Board of Directors approved a replenishment of our stock repurchase program, providing for repurchase of an aggregate of 1.4 million common shares for use in administration of our stock plans and for general corporate purposes. During 2014, 2013 and 2012, there were no shares repurchased under this program. At December 31, 2014, approximately 1.0 million shares remained authorized for repurchase under this program.
NON-GAAP FINANCIAL MEASURES
Management believes that the non-GAAP measures used in this report on Form 10-K provide investors with important perspectives into our ongoing business performance. We do not intend for the information to be considered in isolation or as a substitute for the related GAAP measures. Other companies may define the measures differently. We define the non-GAAP measures used in this report and other disclosures as follows:
Organic Sales per Sales Day
Organic sales per sales day is defined as GAAP “Net sales of the Distribution segment”, less sales derived from acquisitions completed during the preceding twelve months, divided by the number of sales days in a given period. Sales days are the number of business days that the Distribution segment’s branch locations were open for business and exclude weekends and holidays. Management believes sales per sales day provides an important perspective on how net sales may be impacted by the number of days the segment is open for business. Management uses organic sales per sales day as a measurement to compare periods in which the numbers of sales days differ.
Free Cash Flow
Free cash flow is defined as GAAP “Net cash provided by (used in) operating activities” less “Expenditures for property, plant & equipment”, both of which are presented in our Consolidated Statements of Cash Flows. Management believes free cash flow provides an important perspective on the cash available for dividends to shareholders, debt repayment, and acquisitions after making capital investments required to support ongoing business operations and long-term value creation. Free cash flow does not represent the residual cash flow available for discretionary expenditures as it excludes certain mandatory expenditures such as repayment of maturing debt. Management uses free cash flow internally to assess both business performance and overall liquidity.
CONTRACTUAL OBLIGATIONS AND OFF-BALANCE SHEET ARRANGEMENTS
Contractual Obligations
The following table summarizes certain of the Company’s contractual obligations as of December 31, 2014:
Payments due by period (in millions) | ||||||||||||||||||||
Contractual Obligations | Total | Within 1 year | 1-3 years | 3-5 years | More than 5 years | |||||||||||||||
Long-term debt | $ | 172.0 | $ | 10.0 | $ | 162.0 | $ | — | $ | — | ||||||||||
Convertible notes | 115.0 | — | 115.0 | — | — | |||||||||||||||
Interest payments on debt (a) | 31.4 | 11.5 | 14.8 | 3.3 | 1.8 | |||||||||||||||
Operating leases | 67.0 | 22.4 | 27.2 | 9.1 | 8.3 | |||||||||||||||
Purchase obligations (b) | 131.0 | 99.0 | 30.9 | 1.1 | — | |||||||||||||||
Other long-term obligations (c) | 52.1 | 17.0 | 15.0 | 4.6 | 15.5 | |||||||||||||||
Planned funding of pension and SERP (d) | 19.4 | 10.5 | 3.5 | 1.0 | 4.4 | |||||||||||||||
Total | $ | 587.9 | $ | 170.4 | $ | 368.4 | $ | 19.1 | $ | 30.0 | ||||||||||
Note: For more information refer to Note 11, Debt; Note 16, Commitments and Contingencies; Note 15, Other Long-Term Liabilities; Note 14, Pension Plans, and Note 13, Income Taxes in the Notes to Consolidated Financial Statements included in this Form 10-K.
44
(a) | Interest payments on debt are calculated based on the applicable rate and payment dates for each instrument. For variable-rate instruments, interest rates and payment dates are based on management’s estimate of the most likely scenarios for each relevant debt instrument. |
(b) | This category includes purchase commitments to suppliers for materials and supplies as part of the ordinary course of business, consulting arrangements and support services. Only obligations of at least $50,000 are included. |
(c) | This category includes obligations under the Company's long-term incentive plan, deferred compensation plan, environmental liabilities, acquisition holdbacks and unrecognized tax benefits. |
(d) | This category includes planned funding of the Company’s SERP and qualified pension plan. Projected funding for the qualified pension plan beyond one year has not been included as there are several significant factors, such as the future market value of plan assets and projected investment return rates, which could cause actual funding requirements to differ materially from projected funding. |
Off-Balance Sheet Arrangements
The following table summarizes our off-balance sheet arrangements:
Payments due by period (in millions) | ||||||||||||||||||||
Total | Within 1 year | 1-3 years | 3-5 years | More than 5 years | ||||||||||||||||
Acquisition earn-out (1) | $ | 1.5 | $ | 1.5 | $ | — | $ | — | $ | — | ||||||||||
Total | $ | 1.5 | $ | 1.5 | $ | — | $ | — | $ | — | ||||||||||
(1) | The obligation to pay earn-out amounts depends upon the attainment of specific milestones by an aerospace operating unit acquired in 2002. To date we have paid $18.0 million in earn-outs of the total potential amount of $25.0 million for this acquisition. |
As of December 31, 2014, we had $59.2 million of outstanding standby letters of credit under the Credit Agreement, $54.5 million of which related to the New Zealand sales contract.
45
CRITICAL ACCOUNTING ESTIMATES
Our significant accounting policies are outlined in Note 1 to the Consolidated Financial Statements included in this Form 10-K. The preparation of these financial statements requires us to make estimates and judgments that affect the reported amounts of assets, liabilities, revenues, and expenses and related disclosures based upon historical experience, current trends and other factors that management believes to be relevant. We are also responsible for evaluating the propriety of our estimates, judgments, and accounting methods as new events occur. Actual results could differ from those estimates. Management periodically reviews the Company’s critical accounting policies, estimates, and judgments with the Audit Committee of our Board of Directors. The most significant areas currently involving management judgments and estimates are described below.
Long-Term Contracts | ||||
Methodology | Judgment and Uncertainties | Effect if Actual Results Differ From Assumptions | ||
For long-term aerospace contracts, we generally recognize sales and income based on the percentage-of-completion method of accounting, which allows for recognition of revenue as work on a contract progresses. We recognize sales and profit based upon either (1) the cost-to-cost method, in which sales and profit are recorded based upon the ratio of costs incurred to estimated total costs to complete the contract, or (2) the units-of-delivery method, in which sales are recognized as deliveries are made and cost of sales is computed on the basis of the estimated ratio of total contract cost to total contract sales. Management performs detailed quarterly reviews of all of our significant long-term contracts. Based upon these reviews, we record the effects of adjustments in profit estimates each period. If at any time management determines that in the case of a particular contract total costs will exceed total contract revenue, we record a provision for the entire anticipated contract loss at that time. | The percentage-of-completion method requires that we estimate future revenues and costs over the life of a contract. Revenues are estimated based upon the original contract price, with consideration being given to exercised contract options, change orders and in some cases projected customer requirements. Contract costs may be incurred over a period of several years, and the estimation of these costs requires significant judgment based upon the acquired knowledge and experience of program managers, engineers, and financial professionals. Estimated costs are based primarily on anticipated purchase contract terms, historical performance trends, business base and other economic projections. The complexity of certain programs as well as technical risks and uncertainty as to the future availability of materials and labor resources could affect the Company’s ability to accurately estimate future contract costs. | While we do not believe there is a reasonable likelihood there will be a material change in estimates or assumptions used to calculate our long-term revenues and costs, estimating the percentage of work complete on certain programs is a complex task. As a result, changes to these estimates could have a significant impact on our results of operations. These programs include the SH-2G(I) New Zealand program, the Sikorsky BLACK HAWK program, the JPF program, the Boeing A-10 program, the AH-1Z program and our other Bell Helicopter programs and several other programs. Estimating the ultimate total cost of these programs is challenging due to the complexity of the programs, the increase in production of new programs, the nature of the materials needed to complete these programs, change orders related to the programs and the need to manage our customers’ expectations. These programs are an important element in our continuing strategy to increase operating efficiencies and profitability as well as broaden our business base. Management continues to monitor and update program cost estimates quarterly for these contracts. A significant change in an estimate on one or more of these programs could have a material effect on our financial position and results of operations. The net increase in our operating income from changes in contract estimates totaled $1.9 million for the year ended December 31, 2014. The net decrease in our operating income from changes in contract estimates totaled $3.0 million for the year ended December 31, 2013, and $4.7 million for the year ended December 31, 2012. | ||
46
Allowance for Doubtful Accounts | ||||
Methodology | Judgment and Uncertainties | Effect if Actual Results Differ From Assumptions | ||
The allowance for doubtful accounts represents management’s best estimate of probable losses inherent in the receivable balance. These estimates are based on known past due amounts and historical write-off experience, as well as trends and factors impacting the credit risk associated with specific customers. In an effort to identify adverse trends for trade receivables, we perform ongoing reviews of account balances and the aging of receivables. Amounts are considered past due when payment has not been received within a pre-determined time frame based upon the credit terms extended. For our government and commercial contracts, we evaluate, on an ongoing basis, the amount of recoverable costs. The recoverability of costs is evaluated on a contract-by-contract basis based upon historical trends of payments, program viability and the customer’s credit-worthiness. | Write-offs are charged against the allowance for doubtful accounts only after we have exhausted all collection efforts. Actual write-offs and adjustments could differ from the allowance estimates due to unanticipated changes in the business environment as well as factors and risks associated with specific customers. | As of December 31, 2014 and 2013, our allowance for doubtful accounts was $3.2 million and $3.8 million, respectively. Receivables written off, net of recoveries, in 2014 and 2013 were $1.9 million and $1.0 million, respectively. Currently we do not believe that we have a significant amount of risk relative to the allowance for doubtful accounts. A 10% change in the allowance would have a $0.3 million effect on pre-tax earnings. | ||
47
Inventory Valuation | ||||
Methodology | Judgment and Uncertainties | Effect if Actual Results Differ From Assumptions | ||
We have five types of inventory (a) merchandise for resale, (b) raw materials, (c) contracts in process, (d) other work in process, and (e) finished goods. Merchandise for resale and raw materials are stated at the lower of the cost of the inventory or its fair market value. Contracts in process, other work in process and finished goods are valued at production cost comprised of material, labor and overhead, including general and administrative expenses on certain government contracts. Contracts in process, other work in process, and finished goods are reported at the lower of cost or net realizable value. Raw material includes certain general stock materials but primarily relates to purchases that were made in anticipation of specific programs that have not been started as of the balance sheet date. | The process for evaluating inventory obsolescence or market value often requires the Company to make subjective judgments and estimates concerning future sales levels, quantities and prices at which such inventory will be sold in the normal course of business. We adjust our inventory by the difference between the estimated market value and the actual cost of our inventory to arrive at net realizable value. Changes in estimates of future sales volume may necessitate future write-downs of inventory value. The K-MAX® inventory balance, consisting of work in process and finished goods, was $17.2 million as of December 31, 2014. We believe it is stated at net realizable value, although lack of demand for spare parts in the future could result in additional write-downs of the inventory value. Overall, management believes that our inventory is appropriately valued and not subject to further obsolescence in the near term. On May 8, 2013, we announced that the New Zealand MoD entered into a $120.6 million contract for the purchase of ten SH-2G(I) Super Seasprite aircraft, spare parts, a full mission flight simulator, and related logistics support. Although a substantial portion of the SH-2G(I) inventory will be used in the performance of this new contract, management believes that $21.9 million of the SH-2G(I) inventory will be sold after December 31, 2015, based upon the time needed to prepare the aircraft for sale and the requirements of our customer. Additionally, an estimated $4.1 million of inventory will remain after completion of this program. This balance represents one aircraft and various spare parts. | Inventory valuation at our Distribution segment generally requires less subjective management judgment than the valuation of certain inventory in the Aerospace segment. Management reviews the K-MAX® inventory balance on an annual basis to determine whether any additional write-downs are necessary. If such a write-down were to occur, this could have a significant impact on our operating results. A 10% write-down of the December 31, 2014, inventory balance would have affected pre-tax earnings by approximately $1.7 million in 2014. | ||
48
Goodwill and Other Intangible Assets | ||||
Methodology | Judgment and Uncertainties | Effect if Actual Results Differ From Assumptions | ||
Goodwill and certain intangible assets that have indefinite lives are evaluated at least annually for impairment. The annual evaluation is generally performed during the fourth quarter, using forecast information. All intangible assets are also reviewed for possible impairment whenever changes in conditions indicate that their carrying value may not be recoverable. For reporting units that qualify for a qualitative assessment, management will perform the two-step impairment test after a period of three years has elapsed since its last evaluation. In accordance with generally accepted accounting principles, we test goodwill for impairment at the reporting unit level. The identification and measurement of goodwill impairment involves the estimation of fair value of the reporting unit as compared to its carrying value. In the Distribution segment, this testing is conducted at the segment level as no components represent reporting units. In the Aerospace segment, testing is conducted at a level one level below the segment level, and components are not aggregated for purposes of goodwill testing. During 2014, the Company performed a reevaluation of its reporting units for the purpose of its annual goodwill assessment. The Company reorganized its metallic and composite aerostructures businesses, as well as its engineering design and air, vehicle and maintenance, repair and overhaul businesses, into a new entity called Kaman Aerosystems. An impairment test was performed for all reporting units carrying goodwill prior to the creation of the new reporting unit. The results of this impairment analysis were disclosed in our Annual Report on Form 10-K for the year ended December 31, 2013. Immediately after this test, these reporting units were reorganized into a new reporting unit, Aerosystems, which is the reporting unit used for the purpose of our annual assessment of goodwill for impairment in 2014. | In years that management performs a qualitative assessment we consider the following qualitative factors: general economic conditions in the markets served by the reporting units carrying goodwill, relevant industry-specific performance statistics, changes in the carrying value of the individual reporting units, and assumptions used in the most recent fair value calculation, including forecasted results of operations, the weighted average cost of capital and recent transaction multiples. For step one of the two-step impairment test, management estimated the fair value of the reporting units using an income methodology based on management's estimates of forecasted cash flows, with those cash flows discounted to present value using rates commensurate with the risks associated with those cash flows. In addition, management used a market-based valuation method involving analysis of market multiples of revenues and earnings before interest, taxes, depreciation and amortization (“EBITDA”) for (i) a group of comparable public companies and (ii) recent transactions, if any, involving comparable companies. In estimating the fair value of the reporting units, a weighing of 80% to the income approach and 20% to the market-based valuation method was selected, consistent with prior year. A higher weighting was applied to the estimate derived from the income approach as it is based on Management's assumptions specific for the reporting units, which are the outcome of an internal planning process. While the guideline companies in the market based valuation method have comparability to the reporting units, they may not fully reflect the market share, product portfolio and operations of the reporting units. | For the Aerosystems reporting unit, we performed the Step One test and the percentage by which the fair value exceeded the carrying value was 16%. A decrease of 1% in our terminal growth rate or an increase of 1% in our discount rate would not result in a fair value calculation less than the carrying value. As with all assumptions, there is an inherent level of uncertainty and actual results, to the extent they differ from those assumptions, could have a material impact on fair value. For example, multiples for similar type reporting units could deteriorate due to changes in technology or a downturn in economic conditions. A reduction in customer demand would impact our assumed growth rate resulting in a reduced fair value. Potential events or circumstances could have a negative effect on the estimated fair value. The loss of a major customer or program could have a significant impact on the future cash flows of the reporting unit(s). Advances in technology by our competitors could result in our products becoming obsolete. | ||
continues on next page | ||||
49
Goodwill and Other Intangible Assets (continued) | ||||
Methodology | Judgment and Uncertainties | Effect if Actual Results Differ From Assumptions | ||
The carrying value of goodwill as of December 31, 2014, was $141.6 million and $97.0 million for the Distribution and Aerospace segments, respectively. The Aerospace specific reporting units contributing to the total goodwill balance were as follows: Precision Products Orlando facility ("KPP-Orlando"), $34.4 million; Specialty Bearings RWG Frankenjura-Industrie Flugwerklager GMBH ("RWG"), $6.6 million; and Aerosystems $56.0 million. See Note 9, Goodwill and Other Intangible Assets, Net, in the Notes to Consolidated Financial Statements for additional information regarding these assets. The carrying value of other intangible assets as of December 31, 2014, was $57.3 million and $37.2 million for the Distribution and Aerospace segments, respectively. | In performing our step one test for the Aerosystems reporting unit, we used an assumed terminal growth rate of 3.0%. The discount rate utilized to reflect the risk and uncertainty in the financial markets and specifically in our internally developed earnings projections was 12.0% for this reporting unit. Changes in these estimates and assumptions could materially affect the results of our tests for goodwill impairment. Under Step Two, an impairment loss is recognized for any excess of the carrying amount of the reporting unit’s goodwill over the implied fair value of that goodwill. The implied fair value of goodwill is determined by allocating the fair value of the reporting unit in a manner similar to a purchase price allocation. The residual fair value after this allocation is the implied fair value of the reporting unit goodwill. The results of the Aerosystems Step 1 test indicated that the Company did not need to proceed to Step 2. | We do not currently believe there is a reasonable likelihood that there will be a material change in estimates or assumptions used to test goodwill and other intangible assets for impairment losses. However, if actual results are not consistent with our estimates or assumptions, we may be exposed to an impairment charge that could be material. | ||
50
Long-Term Incentive Programs | ||||
Methodology | Judgment and Uncertainties | Effect if Actual Results Differ From Assumptions | ||
The Company maintains a Stock Incentive Plan, which provides for share-based payment awards, including non-statutory stock options, restricted stock, stock appreciation rights, and long-term incentive program ("LTIP") awards. We determine the fair value of our non-qualified stock option awards at the date of grant using a Black-Scholes model. We determine the fair value of our restricted share awards at the date of grant using an average of the high and low market price of our stock. LTIP awards provide certain senior executives an opportunity to receive award payments, generally in cash. For each performance cycle, the Company’s financial results are compared to the Russell 2000 indices for the same periods based upon the following: (a) average return on total capital, (b) earnings per share growth and (c) total return to shareholders. No awards will be payable unless the Company’s performance is at least in the 25th percentile of the designated indices. The maximum award is payable if performance reaches the 75th percentile of the designated indices. Awards will be paid out at 100% at the 50th percentile. Awards for performance between the 25th and 75th percentiles are determined by straight-line interpolation. In order to estimate the liability associated with LTIP awards, management must make assumptions as to how our current performance compares to current Russell 2000 data based upon the Russell 2000’s historical results. This analysis is performed on a quarterly basis. When sufficient Russell 2000 data for a year is available, which typically will not be until May or June of the following year, management will adjust the liability to reflect its best estimate of the total award. Actual results could differ significantly from management’s estimates. The total estimated liability as of December 31, 2014, was $16.0 million. | Option-pricing models and generally accepted valuation techniques require management to make assumptions and to apply judgment to determine the fair value of our awards. These assumptions and judgments include estimating the future volatility of our stock price, expected dividend yield, future employee turnover rates and future employee stock option exercise behaviors. Changes in these assumptions can materially affect the fair value estimate. Our long-term incentive plan requires management to make assumptions regarding the likelihood of achieving long-term Company goals as well as estimate future Russell 2000 results. | We do not currently believe there is a reasonable likelihood that there will be a material change in the estimates or assumptions we use to determine stock-based compensation expense. However, if actual results are not consistent with our estimates or assumptions, we may be exposed to changes in share-based compensation expense that could be material. If actual results are not consistent with the assumptions used, the share-based compensation expense reported in our financial statements may not be representative of the actual economic cost of the share-based compensation. A 10% change in our share-based compensation expense for the year ended December 31, 2014, would have affected pre-tax earnings by approximately $0.5 million in 2014. Due to the timing of availability of the Russell 2000 data, there is a risk that the amount we have recorded as LTIP expense could be different from the actual payout. A 10.0 percentage point increase in the total performance factor earned for our LTIP would result in a reduction of 2014 pretax earnings of $1.6 million. | ||
51
Pension Plans | ||||
Methodology | Judgment and Uncertainties | Effect if Actual Results Differ From Assumptions | ||
We maintain a qualified defined benefit pension, as well as a non-qualified Supplemental Employees Retirement Plan ("SERP"), for certain key executives. See Note 14, Pension Plans, in the Notes to Consolidated Financial Statements included in this Form 10-K for further discussion of these plans. Expenses and liabilities associated with each of these plans are determined based upon actuarial valuations. Integral to these actuarial valuations are a variety of assumptions including expected return on plan assets and discount rate. We regularly review these assumptions, which are updated at the measurement date, December 31st. In accordance with generally accepted accounting principles, the impact of differences between actual results and the assumptions are accumulated and generally amortized over future periods, which will affect expense recognized in future periods. While reviewing our assumptions, we considered the new mortality data issued by the Society of Actuaries in 2014. We reviewed the size and demographics of the population of the plan and determined the RP-2000 Scale AA Generational based mortality table was best suited to our plan. Additionally, the Company previously used the Citigroup Discount Yield Curve in generating its discount rate assumption. As part of the Company's annual evaluation of it's assumptions, the Citigroup Above Median Double-A Curve was deemed to be a more appropriate basis for generating our discount rate assumption, as the future cash flows of the plan are more closely aligned to the Above Median Double-A Curve. | The discount rate represents the interest rate used to determine the present value of future cash flows currently expected to be required to settle the pension obligation. For 2014, management determined the Citigroup Above Median Double-A Curve to be most appropriate for our discount rate assumptions. This index was designed to provide a market average discount rate to assist plan sponsors in valuing the liabilities associated with postretirement obligations. Additionally, we reviewed the changes in the general level of interest rates since the last measurement date noting that overall rates had decreased when compared to 2013. Based upon this information, we used a 3.80% discount rate as of December 31, 2014, for the qualified defined benefit pension plan. This rate takes into consideration the participants in our pension plan and the anticipated payment stream as compared to the Citigroup Above Median Double-A Curve. For the SERP, we used the same methodology as the pension plan and derived a discount rate of 3.15% in 2014 for the benefit obligation. The difference in the discount rates is primarily due to the expected duration of SERP payments, which is shorter than the anticipated duration of benefit payments to be made to the average participant in the pension plan. The qualified defined benefit pension plan and SERP used discount rates of 4.60% and 3.60% at December 31, 2013, respectively, for purposes of calculating the benefit obligation. The expected long-term rate of return on plan assets represents the average rate of earnings expected on the funds invested to provide for anticipated benefit payments. The expected return on assets assumption is developed based upon several factors. Such factors include current and expected target asset allocation, our historical experience of returns by asset class type, a risk premium and an inflation estimate. | A lower discount rate increases the present value of benefit obligations and increases pension expense. A one percentage point decrease in the assumed discount rate would have increased pension expense in 2014 by $7.0 million. A one percentage point increase in the assumed discount rate would have decreased pension expense in 2014 by $3.4 million. A lower expected rate of return on pension plan assets would increase pension expense. For 2014 and 2013, the expected rate of return on plan assets was 7.5%. A one-percentage point increase/decrease in the assumed return on pension plan assets would have changed pension expense in 2014 by approximately $5.5 million. During 2014, the actual return on pension plan assets of 11.4% was higher than our expected rate of return on pension plan assets of 7.5%. | ||
52
Income Taxes | ||||
Methodology | Judgment and Uncertainties | Effect if Actual Results Differ From Assumptions | ||
Tax laws in certain of our operating jurisdictions require items to be reported for tax purposes at different times than the items are reflected in our financial statements. One example of such temporary differences is depreciation expense. Other differences are permanent, such as expenses that are never deductible on our tax returns, an example being a charge related to the impairment of goodwill. Temporary differences create deferred tax assets and liabilities. Deferred tax assets generally represent items that can be used as tax deductions or credits in our tax returns in future years for which we have already recorded the tax benefit in our financial statements. Deferred tax liabilities generally represent tax expense recognized in our financial statements for which payment is not yet due or the realized tax benefit of expenses we have already reported in our tax returns, but have not yet recognized as expense in our financial statements. As of December 31, 2014, we had recognized $57.2 million of deferred tax assets, net of valuation allowances. A portion of this amount, $2.7 million, is related to a capital loss recorded on the disposition of our Distribution segment’s Mexico operations. The realization of these benefits is dependent in part on future taxable capital gains and tax planning strategies designed to realize the benefit associated with the capital loss. For those U.S. states where the expiration of tax loss or credit carryforwards or the projected operating results indicates that realization is not likely, a valuation allowance is provided. | Management believes that sufficient income will be earned in the future to realize deferred income tax assets, net of valuation allowances recorded. The realization of these deferred tax assets can be impacted by changes to tax laws or statutory tax rates and future taxable income levels. Our effective tax rate on earnings from continuing operations was 31.8% for 2014. Our effective tax rate is based on expected or reported income or loss, statutory tax rates, and tax planning opportunities available to us in the various jurisdictions in which we operate. Significant judgment is required in determining our effective tax rate and in evaluating our tax positions. We establish reserves when, despite our belief that our tax return positions are valid and defensible, we believe that certain positions may not prevail if challenged. We adjust these reserves in light of changing facts and circumstances, such as the progress of a tax audit or changes in tax legislation. Our effective tax rate includes the impact of reserve provisions and changes to reserves that we consider appropriate. This rate is then applied to our quarterly operating results. In the event that there is a significant unusual or one-time item recognized in our operating results, the tax attributable to that item would be separately calculated and recorded at the same time as the unusual or one-time item. | We do not anticipate a significant change in our unrecognized tax benefits within the next twelve months. We file tax returns in numerous U.S. and foreign jurisdictions, with returns subject to examination for varying periods, but generally back to and including 2008. It is our policy to record interest and penalties on unrecognized tax benefits as income taxes. A one percent increase/decrease in our tax rate would affect our 2014 earnings by $1.0 million. | ||
53
Environmental Costs | ||||
Methodology | Judgment and Uncertainties | Effect if Actual Results Differ From Assumptions | ||
Our operations are subject to environmental regulation by federal, state and local authorities in the United States and regulatory authorities with jurisdiction over our foreign operations. As a result, we have established and update, as necessary, policies relating to environmental standards of performance for our operations worldwide. When we become aware of an environmental risk, we perform a site study to ascertain the potential magnitude of contamination and the estimated cost of remediation. We continually evaluate the identified environmental issues to ensure the time to complete the remediation and the total cost of remediation are consistent with our initial estimate. If there is any change in the cost and/or timing of remediation, the accrual is adjusted accordingly. | Environmental costs are accrued when it is probable that a liability has been incurred and the amount can be reasonably estimated. The most likely cost to be incurred is accrued based on an evaluation of currently available facts with respect to each individual site, including existing technology, current laws and regulations and prior remediation experience. Liabilities with fixed or readily determinable payment dates are discounted. We believe that expenditures necessary to comply with the present regulations governing environmental protection will not have a material effect upon our competitive position, consolidated financial position, results of operations or cash flows. | At December 31, 2014, amounts accrued for known environmental remediation costs were $10.6 million. A 10% change in this accrual would have impacted pre-tax earnings by $1.1 million. Further information about our environmental costs is provided in Note 10, Environmental Costs, in the Notes to Consolidated Financial Statements. | ||
54
RECENT ACCOUNTING STANDARDS
A summary of recent accounting standards is included in Note 1, Summary of Significant Accounting Policies, in the Notes to Consolidated Financial Statements, included in Item 8, Financial Statements and Supplementary Data, of this Form 10-K.
SELECTED QUARTERLY FINANCIAL DATA
First | Second | Third | Fourth | Total | ||||||||||||||||
2014 | Quarter | Quarter | Quarter | Quarter | Year | |||||||||||||||
(in thousands, except per share amounts) | ||||||||||||||||||||
Net sales | $ | 407,958 | $ | 453,018 | $ | 456,055 | $ | 477,931 | $ | 1,794,962 | ||||||||||
Gross profit | 114,000 | 128,549 | 129,365 | $ | 136,025 | 507,939 | ||||||||||||||
Earnings from continuing operations | 11,944 | 16,709 | 15,797 | $ | 21,330 | 65,780 | ||||||||||||||
Loss from discontinued operations, net of tax | (487 | ) | (515 | ) | (924 | ) | $ | (998 | ) | (2,924 | ) | |||||||||
Gain (loss) on disposal of discontinued operations, net of tax | — | 379 | (94 | ) | (5,269 | ) | (4,984 | ) | ||||||||||||
Net earnings | $ | 11,457 | $ | 16,573 | $ | 14,779 | $ | 15,063 | $ | 57,872 | ||||||||||
Basic earnings (loss) per share: | ||||||||||||||||||||
From continuing operations | $ | 0.45 | $ | 0.62 | $ | 0.58 | $ | 0.79 | $ | 2.43 | ||||||||||
From discontinued operations | (0.02 | ) | (0.02 | ) | (0.03 | ) | (0.04 | ) | (0.11 | ) | ||||||||||
From disposal of discontinued operations | — | 0.01 | — | (0.19 | ) | (0.18 | ) | |||||||||||||
Basic earnings per share | $ | 0.43 | $ | 0.61 | $ | 0.55 | $ | 0.56 | $ | 2.14 | ||||||||||
Diluted earnings (loss) per share: | ||||||||||||||||||||
From continuing operations | $ | 0.44 | $ | 0.61 | $ | 0.57 | $ | 0.77 | $ | 2.37 | ||||||||||
From discontinued operations | (0.02 | ) | (0.02 | ) | (0.04 | ) | (0.04 | ) | (0.11 | ) | ||||||||||
From disposal of discontinued operations | — | 0.01 | — | (0.19 | ) | (0.18 | ) | |||||||||||||
Diluted earnings per share | $ | 0.42 | $ | 0.60 | $ | 0.53 | $ | 0.54 | $ | 2.08 | ||||||||||
First | Second | Third | Fourth | Total | ||||||||||||||||
2013 | Quarter | Quarter | Quarter | Quarter | Year | |||||||||||||||
(in thousands, except per share amounts) | ||||||||||||||||||||
Net sales | $ | 380,842 | $ | 425,219 | $ | 416,820 | $ | 431,040 | $ | 1,653,921 | ||||||||||
Gross profit | 108,803 | 120,352 | 118,333 | 115,823 | 463,311 | |||||||||||||||
Earnings from continuing operations | 7,284 | 18,590 | 19,685 | 13,507 | 59,066 | |||||||||||||||
Loss from discontinued operations, net of tax | (130 | ) | (698 | ) | (926 | ) | (632 | ) | (2,386 | ) | ||||||||||
Gain on disposal of discontinued operations, net of tax | — | — | 420 | — | 420 | |||||||||||||||
Net earnings | $ | 7,154 | $ | 17,892 | $ | 19,179 | $ | 12,875 | $ | 57,100 | ||||||||||
Basic earnings (loss) per share: | ||||||||||||||||||||
From continuing operations | $ | 0.27 | $ | 0.70 | $ | 0.74 | $ | 0.50 | $ | 2.21 | ||||||||||
From discontinued operations | — | (0.03 | ) | (0.04 | ) | (0.02 | ) | (0.09 | ) | |||||||||||
From disposal of discontinued operations | — | — | 0.02 | — | 0.02 | |||||||||||||||
Basic earnings per share | $ | 0.27 | $ | 0.67 | $ | 0.72 | $ | 0.48 | $ | 2.14 | ||||||||||
Diluted earnings (loss) per share: | ||||||||||||||||||||
From continuing operations | $ | 0.26 | $ | 0.70 | $ | 0.72 | $ | 0.49 | $ | 2.17 | ||||||||||
From discontinued operations | — | (0.03 | ) | (0.04 | ) | (0.02 | ) | (0.09 | ) | |||||||||||
From disposal of discontinued operations | — | — | 0.02 | — | 0.02 | |||||||||||||||
Diluted earnings per share | $ | 0.26 | $ | 0.67 | $ | 0.70 | $ | 0.47 | $ | 2.10 | ||||||||||
55
Included within certain quarterly results are a variety of unusual or significant adjustments that may affect comparability. The most significant of such adjustments are described below as well as within Management’s Discussion and Analysis of Financial Condition and Results of Operations and the Notes to Consolidated Financial Statements. Additionally, due to the nature of the earnings per share calculation, the sum of quarterly earnings per share data may not equal the cumulative earnings per share data for the year. The 2013 quarterly results have been restated to reflect the disposal of Delamac during the current year.
Nonrecurring items within the 2014 quarterly results are as follows: fourth quarter, a $5.3 million loss on disposal of discontinued operations, net of tax related to the sale of Delamac; third quarter, $2.2 million of costs associated with the sale of our Moosup facility.
Nonrecurring items within the 2013 quarterly results are as follows: fourth quarter, a $2.1 million non-cash non-tax deductible charge for the impairment of goodwill related to VT Composites and a $0.4 million gain on discontinued operations due to a favorable tax result versus previous estimates and other activity related to the settlement of the closing balance sheet of the Distribution segment's Canadian operations.
56
ITEM 7A. QUANTITATIVE AND QUALITATIVE DISCLOSURES ABOUT MARKET RISK
We have various market risk exposures that arise from our ongoing business operations. Market risk is the potential economic loss that may result from adverse changes in the fair value of financial instruments. Our financial results are impacted by changes in interest rates, certain foreign currency exchange rates and commodity prices.
Foreign Currencies
We have manufacturing, sales, and distribution facilities in various locations throughout the world. As a result, we make investments and conduct business transactions denominated in various currencies, including the U.S. dollar, the British pound, the European euro, the Mexican peso, and the Australian dollar. Total annual foreign sales from continuing operations, including foreign export sales, averaged approximately $212.9 million over the last three years. More than half of our foreign sales are to Europe. Foreign sales from continuing operations represented 13.6% of consolidated net sales from continuing operations in 2014. We estimate a hypothetical 10% adverse change in foreign currency exchange rates relative to the U.S dollar for 2014 would have had an unfavorable impact of $8.6 million on sales and a $0.1 million unfavorable impact on operating income. We manage foreign currency exposures that are associated with committed foreign currency purchases and sales and other assets and liabilities created in the normal course of business at the subsidiary operations level. Sometimes we may, through the use of forward contracts, hedge the price risk associated with committed and forecasted foreign denominated payments and rates. Historically the use of these forward contracts has been minimal. We do not use derivatives for speculative or trading purposes.
Interest Rates
Our primary exposure to interest rate risk results from our outstanding debt obligations. The level of fees and interest charged on revolving credit commitments and borrowings are based upon leverage levels and market interest rates.
Our principal debt facilities are contained within a variable rate credit agreement that provides a $400.0 million revolving credit facility and a $100.0 million term loan commitment. Both these agreements were entered into on November 20, 2012, and expire on July 31, 2017. Total average bank borrowings for 2014 were $214.8 million. The impact of a hypothetical 100 basis point increase in the interest rates on our average bank borrowings would have resulted in a $2.1 million increase in interest expense.
In November 2010, we issued $115.0 million convertible unsecured senior notes due on November 15, 2017, in a private placement offering. These notes bear 3.25% interest per annum on the principal amount, payable semiannually in arrears on November 15 and May 15 of each year, beginning on May 15, 2011, and have an effective interest rate of 5.25%.
From time to time we will enter into interest rate swap contracts for the purpose of securing a fixed interest rate on our variable interest rate borrowings. These contracts allow us to create certainty related to future cash flows as they relate to fluctuations in LIBOR rates and the impact they have on interest payments on our variable rate debt.
Commodity Prices
We are exposed to volatility in the price of raw materials used in certain manufacturing operations as well as a variety of items procured by our distribution business. These raw materials include, but are not limited to, aluminum, titanium, nickel, copper and other specialty metals. We manage our exposure related to these price changes through strategic procurement practices.
57
ITEM 8. FINANCIAL STATEMENTS AND SUPPLEMENTARY DATA
REPORT OF INDEPENDENT REGISTERED PUBLIC ACCOUNTING FIRM
To the Board of Directors and Shareholders of Kaman Corporation:
In our opinion, the accompanying consolidated balance sheets and the related consolidated statements of operations, of comprehensive income, of shareholders’ equity, and of cash flows present fairly, in all material respects, the financial position of Kaman Corporation and its subsidiaries at December 31, 2014 and December 31, 2013, and the results of their operations and their cash flows for each of the two years in the period ended December 31, 2014 in conformity with accounting principles generally accepted in the United States of America. Also in our opinion, the Company maintained, in all material respects, effective internal control over financial reporting as of December 31, 2014, based on criteria established in Internal Control - Integrated Framework (2013) issued by the Committee of Sponsoring Organizations of the Treadway Commission (COSO). The Company's management is responsible for these financial statements, for maintaining effective internal control over financial reporting and for its assessment of the effectiveness of internal control over financial reporting, included in Management's Report on Internal Control over Financial Reporting appearing under Item 9A. Our responsibility is to express opinions on these financial statements and on the Company's internal control over financial reporting based on our integrated audits. We conducted our audits in accordance with the standards of the Public Company Accounting Oversight Board (United States). Those standards require that we plan and perform the audits to obtain reasonable assurance about whether the financial statements are free of material misstatement and whether effective internal control over financial reporting was maintained in all material respects. Our audits of the financial statements included examining, on a test basis, evidence supporting the amounts and disclosures in the financial statements, assessing the accounting principles used and significant estimates made by management, and evaluating the overall financial statement presentation. Our audit of internal control over financial reporting included obtaining an understanding of internal control over financial reporting, assessing the risk that a material weakness exists, and testing and evaluating the design and operating effectiveness of internal control based on the assessed risk. Our audits also included performing such other procedures as we considered necessary in the circumstances. We believe that our audits provide a reasonable basis for our opinions.
A company’s internal control over financial reporting is a process designed to provide reasonable assurance regarding the reliability of financial reporting and the preparation of financial statements for external purposes in accordance with generally accepted accounting principles. A company’s internal control over financial reporting includes those policies and procedures that (i) pertain to the maintenance of records that, in reasonable detail, accurately and fairly reflect the transactions and dispositions of the assets of the company; (ii) provide reasonable assurance that transactions are recorded as necessary to permit preparation of financial statements in accordance with generally accepted accounting principles, and that receipts and expenditures of the company are being made only in accordance with authorizations of management and directors of the company; and (iii) provide reasonable assurance regarding prevention or timely detection of unauthorized acquisition, use, or disposition of the company’s assets that could have a material effect on the financial statements.
Because of its inherent limitations, internal control over financial reporting may not prevent or detect misstatements. Also, projections of any evaluation of effectiveness to future periods are subject to the risk that controls may become inadequate because of changes in conditions, or that the degree of compliance with the policies or procedures may deteriorate.
As described in Management's Report on Internal Control over Financial Reporting, management has excluded B.W. Rogers Company (the “Acquired Business”) from its assessment of internal control over financial reporting as of December 31, 2014 because it was acquired by the Company through a purchase business combination during 2014. We have also excluded the Acquired Business from our audit of internal control over financial reporting. The Acquired Business is a wholly-owned subsidiary whose total assets and total revenues represent 5% and 4%, respectively, of the related consolidated financial statement amounts as of and for the year ended December 31, 2014.
/s/ PricewaterhouseCoopers LLP
Hartford, Connecticut
February 23, 2015
58
REPORT OF INDEPENDENT REGISTERED PUBLIC ACCOUNTING FIRM
The Board of Directors and Shareholders
Kaman Corporation:
We have audited the accompanying consolidated statements of operations, comprehensive income, shareholders’ equity, and cash flows of Kaman Corporation and subsidiaries for the year ended December 31, 2012. In connection with our audit of the consolidated financial statements, we also have audited financial statement schedule II. These consolidated financial statements and financial statement schedule are the responsibility of Kaman Corporation’s management. Our responsibility is to express an opinion on these consolidated financial statements and financial statement schedule based on our audit.
We conducted our audit in accordance with the standards of the Public Company Accounting Oversight Board (United States). Those standards require that we plan and perform the audit to obtain reasonable assurance about whether the financial statements are free of material misstatement. An audit includes examining, on a test basis, evidence supporting the amounts and disclosures in the financial statements. An audit also includes assessing the accounting principles used and significant estimates made by management, as well as evaluating the overall financial statement presentation. We believe that our audit provides a reasonable basis for our opinion.
In our opinion, the consolidated financial statements referred to above present fairly, in all material respects, the results of operations and the cash flows of Kaman Corporation and subsidiaries for the year ended December 31, 2012, in conformity with U.S. generally accepted accounting principles. Also in our opinion, the related financial statement schedule, when considered in relation to the basic consolidated financial statements taken as a whole, present fairly, in all material respects, the information set forth therein.
/s/ KPMG LLP
Hartford, Connecticut
February 25, 2013
59
CONSOLIDATED BALANCE SHEETS
KAMAN CORPORATION AND SUBSIDIARIES
(In thousands, except share and per share amounts)
December 31, 2014 | December 31, 2013 | |||||||
Assets | ||||||||
Current assets: | ||||||||
Cash and cash equivalents | $ | 12,411 | $ | 10,384 | ||||
Accounts receivable, net | 234,648 | 205,873 | ||||||
Inventories | 359,741 | 390,495 | ||||||
Deferred income taxes | 25,888 | 30,128 | ||||||
Income tax refunds receivable | — | 2,297 | ||||||
Other current assets | 29,568 | 26,028 | ||||||
Total current assets | 662,256 | 665,205 | ||||||
Property, plant and equipment, net of accumulated depreciation of $183,829 and $167,282, respectively | 147,825 | 148,508 | ||||||
Goodwill | 238,581 | 203,923 | ||||||
Other intangible assets, net | 94,491 | 89,449 | ||||||
Deferred income taxes | 34,784 | 10,287 | ||||||
Other assets | 23,268 | 23,259 | ||||||
Total assets | $ | 1,201,205 | $ | 1,140,631 | ||||
Liabilities and Shareholders’ Equity | ||||||||
Current liabilities: | ||||||||
Notes payable | $ | — | $ | 559 | ||||
Current portion of long-term debt | 10,000 | 10,000 | ||||||
Accounts payable – trade | 116,787 | 119,482 | ||||||
Accrued salaries and wages | 42,214 | 33,677 | ||||||
Advances on contracts | 2,406 | 9,470 | ||||||
Other accruals and payables | 47,583 | 54,095 | ||||||
Income taxes payable | 2,734 | 673 | ||||||
Total current liabilities | 221,724 | 227,956 | ||||||
Long-term debt, excluding current portion | 271,232 | 264,655 | ||||||
Deferred income taxes | 3,391 | 3,855 | ||||||
Underfunded pension | 141,546 | 85,835 | ||||||
Other long-term liabilities | 45,647 | 47,038 | ||||||
Commitments and contingencies (Note 16) | ||||||||
Shareholders' equity: | ||||||||
Preferred stock, $1 par value, 200,000 shares authorized; none outstanding | — | — | ||||||
Common stock, $1 par value, 50,000,000 shares authorized; voting; 27,518,226 and 27,189,922 shares issued, respectively | 27,518 | 27,190 | ||||||
Additional paid-in capital | 145,845 | 133,517 | ||||||
Retained earnings | 479,984 | 439,441 | ||||||
Accumulated other comprehensive income (loss) | (126,261 | ) | (81,121 | ) | ||||
Less 385,942 and 330,487 shares of common stock, respectively, held in treasury, at cost | (9,421 | ) | (7,735 | ) | ||||
Total shareholders’ equity | 517,665 | 511,292 | ||||||
Total liabilities and shareholders’ equity | $ | 1,201,205 | $ | 1,140,631 | ||||
See accompanying notes to consolidated financial statements.
60
CONSOLIDATED STATEMENTS OF OPERATIONS
KAMAN CORPORATION AND SUBSIDIARIES
(In thousands, except per share amounts)
For the Year Ended December 31, | ||||||||||||
2014 | 2013 | 2012 | ||||||||||
Net sales | $ | 1,794,962 | $ | 1,653,921 | $ | 1,563,342 | ||||||
Cost of sales | 1,287,023 | 1,190,610 | 1,128,247 | |||||||||
Gross profit | 507,939 | 463,311 | 435,095 | |||||||||
Selling, general and administrative expenses | 397,199 | 357,752 | 343,396 | |||||||||
Goodwill impairment | — | 2,071 | — | |||||||||
Net loss on sale of assets | 233 | 142 | 110 | |||||||||
Operating income from continuing operations | 110,507 | 103,346 | 91,589 | |||||||||
Interest expense, net | 13,382 | 12,294 | 12,113 | |||||||||
Other expense (income), net | 623 | 398 | (219 | ) | ||||||||
Earnings from continuing operations before income taxes | 96,502 | 90,654 | 79,695 | |||||||||
Income tax expense | 30,722 | 31,588 | 26,748 | |||||||||
Earnings from continuing operations | 65,780 | 59,066 | 52,947 | |||||||||
Earnings (loss) from discontinued operations, net of taxes | (2,924 | ) | (2,386 | ) | 755 | |||||||
Gain (loss) on disposal of discontinued operations, net of taxes | (4,984 | ) | 420 | 1,323 | ||||||||
Total earnings (loss) from discontinued operations | (7,908 | ) | (1,966 | ) | 2,078 | |||||||
Net earnings | $ | 57,872 | $ | 57,100 | $ | 55,025 | ||||||
Earnings per share: | ||||||||||||
Basic earnings per share from continuing operations | $ | 2.43 | $ | 2.21 | $ | 2.00 | ||||||
Basic earnings (loss) per share from discontinued operations | (0.11 | ) | (0.09 | ) | 0.03 | |||||||
Basic earnings (loss) per share from disposal of discontinued operations | (0.18 | ) | 0.02 | 0.05 | ||||||||
Basic earnings per share | $ | 2.14 | $ | 2.14 | $ | 2.08 | ||||||
Diluted earnings per share from continuing operations | $ | 2.37 | $ | 2.17 | $ | 1.99 | ||||||
Diluted earnings (loss) per share from discontinued operations | (0.11 | ) | (0.09 | ) | 0.03 | |||||||
Diluted earnings (loss) per share from disposal of discontinued operations | (0.18 | ) | 0.02 | 0.05 | ||||||||
Diluted earnings per share | $ | 2.08 | $ | 2.10 | $ | 2.07 | ||||||
Weighted average shares outstanding: | ||||||||||||
Basic | 27,053 | 26,744 | 26,425 | |||||||||
Diluted | 27,777 | 27,143 | 26,622 | |||||||||
Dividends declared per share | $ | 0.64 | $ | 0.64 | $ | 0.64 | ||||||
See accompanying notes to consolidated financial statements.
61
CONSOLIDATED STATEMENTS OF COMPREHENSIVE INCOME
KAMAN CORPORATION AND SUBSIDIARIES
(In thousands)
For the Year Ended December 31, | ||||||||||||
2014 | 2013 | 2012 | ||||||||||
Net earnings | $ | 57,872 | $ | 57,100 | $ | 55,025 | ||||||
Other comprehensive income, net of tax: | ||||||||||||
Foreign currency translation adjustments | (6,457 | ) | 2,296 | 4,850 | ||||||||
Change in unrealized loss on derivative instruments, net of tax benefit (expense) of ($161), $38, and $33, respectively | 264 | (61 | ) | (54 | ) | |||||||
Pension plan adjustments, net of tax benefit (expense) of $23,583, ($23,933), and $4,967, respectively | (38,947 | ) | 38,234 | (8,440 | ) | |||||||
Total comprehensive income | $ | 12,732 | $ | 97,569 | $ | 51,381 | ||||||
See accompanying notes to consolidated financial statements.
62
CONSOLIDATED STATEMENTS OF SHAREHOLDERS' EQUITY
KAMAN CORPORATION AND SUBSIDIARIES
(In thousands, except share amounts)
Common Stock | Additional Paid-In | Retained | Accumulated Other Comprehensive | Treasury Stock | Total Shareholders' | |||||||||||||||||||||||||
Shares | $ | Capital | Earnings | Income (Loss) | Shares | $ | Equity | |||||||||||||||||||||||
Balance at December 31, 2011 | 26,495,828 | $ | 26,496 | $ | 109,584 | $ | 361,389 | $ | (117,946 | ) | 258,424 | $ | (6,452 | ) | $ | 373,071 | ||||||||||||||
Net earnings | — | — | — | 55,025 | — | — | — | 55,025 | ||||||||||||||||||||||
Other comprehensive income | — | — | — | — | (3,644 | ) | — | — | (3,644 | ) | ||||||||||||||||||||
Dividends | — | — | — | (16,941 | ) | — | — | — | (16,941 | ) | ||||||||||||||||||||
Purchase of treasury shares | — | — | — | — | — | 21,343 | (733 | ) | (733 | ) | ||||||||||||||||||||
Employee stock plans, | ||||||||||||||||||||||||||||||
net of tax expense of $883 | 291,037 | 291 | 7,160 | — | — | (9,571 | ) | 99 | 7,550 | |||||||||||||||||||||
Share-based compensation expense | 94,392 | 94 | 5,778 | — | — | 7,277 | (7 | ) | 5,865 | |||||||||||||||||||||
Balance at December 31, 2012 | 26,881,257 | $ | 26,881 | $ | 122,522 | $ | 399,473 | $ | (121,590 | ) | 277,473 | $ | (7,093 | ) | $ | 420,193 | ||||||||||||||
Net earnings | — | — | — | 57,100 | — | — | — | 57,100 | ||||||||||||||||||||||
Other comprehensive income | — | — | — | — | 40,469 | — | — | 40,469 | ||||||||||||||||||||||
Dividends | — | — | — | (17,132 | ) | — | — | — | (17,132 | ) | ||||||||||||||||||||
Purchase of treasury shares | — | — | — | — | — | 18,468 | (644 | ) | (644 | ) | ||||||||||||||||||||
Employee stock plans, | ||||||||||||||||||||||||||||||
net of tax expense of $543 | 216,510 | 217 | 6,076 | — | — | (3,825 | ) | 40 | 6,333 | |||||||||||||||||||||
Share-based compensation expense | 92,155 | 92 | 4,919 | — | — | 38,371 | (38 | ) | 4,973 | |||||||||||||||||||||
Balance at December 31, 2013 | 27,189,922 | $ | 27,190 | $ | 133,517 | $ | 439,441 | $ | (81,121 | ) | 330,487 | $ | (7,735 | ) | $ | 511,292 | ||||||||||||||
Net earnings | — | — | — | 57,872 | — | — | — | 57,872 | ||||||||||||||||||||||
Other comprehensive income | — | — | — | — | (45,140 | ) | — | — | (45,140 | ) | ||||||||||||||||||||
Dividends | — | — | — | (17,329 | ) | — | — | — | (17,329 | ) | ||||||||||||||||||||
Purchase of treasury shares | — | — | — | — | — | 21,312 | (853 | ) | (853 | ) | ||||||||||||||||||||
Employee stock plans, | ||||||||||||||||||||||||||||||
net of tax expense of $834 | 235,233 | 235 | 6,992 | — | — | 16,352 | (815 | ) | 6,412 | |||||||||||||||||||||
Share-based compensation expense | 93,071 | 93 | 5,336 | — | — | 17,791 | (18 | ) | 5,411 | |||||||||||||||||||||
Balance at December 31, 2014 | 27,518,226 | $ | 27,518 | $ | 145,845 | $ | 479,984 | $ | (126,261 | ) | 385,942 | $ | (9,421 | ) | $ | 517,665 | ||||||||||||||
See accompanying notes to consolidated financial statements.
63
CONSOLIDATED STATEMENTS OF CASH FLOWS
KAMAN CORPORATION AND SUBSIDIARIES
(In thousands)
For the Year Ended December 31, | ||||||||||||
2014 | 2013 | 2012 | ||||||||||
Cash flows from operating activities: | ||||||||||||
Earnings from continuing operations | $ | 65,780 | $ | 59,066 | $ | 52,947 | ||||||
Adjustments to reconcile earnings from continuing operations to net cash provided by (used in) operating activities of continuing operations: | ||||||||||||
Depreciation and amortization | 36,209 | 31,555 | 28,165 | |||||||||
Accretion of convertible notes discount | 1,931 | 1,833 | 1,738 | |||||||||
Provision for doubtful accounts | 853 | 1,286 | 530 | |||||||||
Net loss on sale of assets | 233 | 142 | 110 | |||||||||
Goodwill impairment | — | 2,071 | — | |||||||||
Net gain (loss) on derivative instruments | 1,071 | 178 | (427 | ) | ||||||||
Stock compensation expense | 5,411 | 4,973 | 5,865 | |||||||||
Excess tax (expense) benefit from share-based compensation arrangements | (834 | ) | (543 | ) | (883 | ) | ||||||
Deferred income taxes | 1,434 | 2,938 | (1,125 | ) | ||||||||
Changes in assets and liabilities, excluding effects of acquisitions/divestitures: | ||||||||||||
Accounts receivable | (23,876 | ) | (22,565 | ) | 27,963 | |||||||
Inventories | 30,181 | (19,707 | ) | (18,690 | ) | |||||||
Income tax refunds receivable | 2,292 | (2,297 | ) | 527 | ||||||||
Other current assets | (2,560 | ) | 1,299 | 4,956 | ||||||||
Accounts payable - trade | (3,858 | ) | 12,170 | 211 | ||||||||
Accrued contract losses | (1,899 | ) | (969 | ) | (435 | ) | ||||||
Advances on contracts | (7,065 | ) | 7,570 | (577 | ) | |||||||
Other accrued expenses and payables | 6,746 | (10,187 | ) | (15,806 | ) | |||||||
Income taxes payable | 4,455 | (2,024 | ) | (749 | ) | |||||||
Pension liabilities | (6,380 | ) | (3,118 | ) | 56 | |||||||
Other long-term liabilities | (1,035 | ) | 1,169 | 1,448 | ||||||||
Net cash provided by (used in) operating activities of continuing operations | 109,089 | 64,840 | 85,824 | |||||||||
Net cash provided by (used in) operating activities of discontinued operations | (2,902 | ) | (1,892 | ) | (4,854 | ) | ||||||
Net cash provided by (used in) operating activities | 106,187 | 62,948 | 80,970 | |||||||||
Cash flows from investing activities: | ||||||||||||
Proceeds from sale of assets | 39 | 100 | 333 | |||||||||
Proceeds from sale of discontinued operations | 7,863 | — | 8,743 | |||||||||
Expenditures for property, plant & equipment | (28,283 | ) | (40,852 | ) | (32,386 | ) | ||||||
Acquisition of businesses including earn out adjustments, net of cash received | (77,618 | ) | (18,162 | ) | (87,621 | ) | ||||||
Other, net | (2,060 | ) | (2,305 | ) | (5,920 | ) | ||||||
Cash provided by (used in) investing activities of continuing operations | (100,059 | ) | (61,219 | ) | (116,851 | ) | ||||||
Cash provided by (used in) investing activities of discontinued operations | 3 | (56 | ) | (1,013 | ) | |||||||
Cash provided by (used in) investing activities | (100,056 | ) | (61,275 | ) | (117,864 | ) | ||||||
Cash flows from financing activities: | ||||||||||||
Net borrowings (repayments) under revolving credit agreements | 15,788 | 22,720 | (11,348 | ) | ||||||||
Borrowings under Term Loan Facility | — | — | 100,000 | |||||||||
Debt repayment | (10,000 | ) | (10,000 | ) | (35,000 | ) | ||||||
Book overdraft | 1,568 | (9,878 | ) | (2,698 | ) | |||||||
Proceeds from exercise of employee stock awards | 6,411 | 6,333 | 7,550 | |||||||||
Purchase of treasury shares | (853 | ) | (644 | ) | (733 | ) | ||||||
Dividends paid | (17,286 | ) | (17,091 | ) | (16,882 | ) | ||||||
Debt issuance costs | — | (98 | ) | (2,132 | ) | |||||||
Windfall tax (expense) benefit | 834 | 543 | 883 | |||||||||
Other | — | — | — | |||||||||
Cash provided by (used in) financing activities of continuing operations | (3,538 | ) | (8,115 | ) | 39,640 | |||||||
Cash provided by (used in) financing activities of discontinued operations | — | — | (1,067 | ) | ||||||||
Cash provided by (used in) financing activities | (3,538 | ) | (8,115 | ) | 38,573 | |||||||
Net increase (decrease) in cash and cash equivalents | 2,593 | (6,442 | ) | 1,679 | ||||||||
Effect of exchange rate changes on cash and cash equivalents | (566 | ) | 233 | (71 | ) | |||||||
Cash and cash equivalents at beginning of period | 10,384 | 16,593 | 14,985 | |||||||||
Cash and cash equivalents at end of period | $ | 12,411 | $ | 10,384 | $ | 16,593 | ||||||
See accompanying notes to consolidated financial statements.
64
NOTES TO CONSOLIDATED FINANCIAL STATEMENTS
For the Years Ended December 31, 2014, 2013 and 2012
1. SUMMARY OF SIGNIFICANT ACCOUNTING POLICIES
Kaman Corporation, headquartered in Bloomfield, Connecticut, was incorporated in 1945 and is a diversified company that conducts business in the aerospace and distribution markets. Kaman Corporation reports information for itself and its subsidiaries (collectively, the "Company") in two business segments, Distribution and Aerospace.
Basis of Presentation
The accompanying consolidated financial statements include the accounts of the Company and its subsidiaries. All intercompany balances and transactions have been eliminated in consolidation. Certain amounts in prior year financial statements and notes thereto have been reclassified to conform to current year presentation.
Use of Estimates
The preparation of the consolidated financial statements in accordance with accounting principles generally accepted in the United States of America requires management to make estimates and assumptions that affect the amounts reported in the consolidated financial statements and accompanying notes. Significant items subject to such estimates and assumptions include the carrying amount of property, plant and equipment, goodwill and other intangible assets; valuation allowances for receivables, inventories and income taxes; valuation of share-based compensation; vendor incentives; assets and obligations related to employee benefits; estimates of environmental remediation costs; and accounting for long-term contracts including claims. Actual results could differ from those estimates.
Foreign Currency Translation
The Company has certain operations outside the United States that prepare financial statements in currencies other than the U.S. dollar. For these operations, results of operations and cash flows are translated using the average exchange rate throughout the period. Assets and liabilities are generally translated at end of period rates. The gains and losses associated with these translation adjustments are included as a component of accumulated other comprehensive income (loss) in shareholders’ equity.
Concentration of Credit Risk
Financial instruments that potentially subject the Company to concentrations of credit risk consist principally of trade accounts receivable. The carrying amounts of these items, as well as trade accounts payable and notes payable, approximate fair value due to the short-term maturity of these instruments. At December 31, 2014 and 2013, no individual customer accounted for more than 10% of consolidated accounts receivable or consolidated net sales. Foreign sales associated with continuing operations were approximately 13.6%, 13.9% and 10.5% of the company’s net sales in 2014, 2013 and 2012, respectively, and are concentrated in the United Kingdom, Germany, New Zealand and Asia.
Additional Cash Flow Information
Non-cash investing activities in 2014 include an accrual of $1.5 million for capital leases and $1.5 million in earn-out payments to the former owners of an aerospace acquisition. Non-cash financing activities in 2014 include an adjustment to other comprehensive income related to the underfunding of the pension and SERP plans and changes in the fair value of derivative financial instruments that qualified for hedge accounting. Additionally, non-cash financing activities in 2014 include $4.3 million of dividends declared but not yet paid. The total net adjustment was $38.7 million, net of tax of $23.4 million. Non-cash investing activities in 2013 include an accrual of $0.9 million for purchases of property and equipment and $3.5 million in earn-out payments to the former owners of an aerospace acquisition. Non-cash financing activities in 2013 include an adjustment to other comprehensive income related to the underfunding of the pension and SERP plans and changes in the fair value of derivative financial instruments that qualified for hedge accounting. The total adjustment was $39.0 million, net of tax of $23.6 million. Additionally, non-cash financing activities in 2013 include $4.3 million of dividends declared but not yet paid. Non-cash investing activities in 2012 include an accrual of $3.1 million for purchases of property and equipment. Non-cash financing activities in 2012 include an adjustment to other comprehensive income related to the underfunding of the pension and SERP plans and changes in the fair value of derivative financial instruments that qualified for hedge accounting. The total adjustment was $8.2 million, net of tax of $5.0 million. The Company describes its pension obligations in more detail in Note 14, Pension Plans. Additionally, non-cash financing activities in 2012 include $4.3 million of dividends declared but not yet paid.
65
NOTES TO CONSOLIDATED FINANCIAL STATEMENTS - Continued
For the Years Ended December 31, 2014, 2013 and 2012
1. SUMMARY OF SIGNIFICANT ACCOUNTING POLICIES (CONTINUED)
Revenue Recognition
Sales and estimated profits under long-term contracts are generally recognized using the percentage-of-completion method of accounting, using as a measurement basis either the ratio that costs incurred bear to estimated total costs (after giving effect to estimates of costs to complete based upon most recent information for each contract) or units-of-delivery. Reviews of contracts are made routinely throughout their lives and the impact of revisions in profit estimates are recorded in the accounting period in which the revisions are made. Anticipated contract losses are charged to operations when they are probable. In cases where we have multiple contracts with a single customer, each contract is generally treated as a separate profit center and accounted for as such. Except in the case of contracts accounted for using the cost-to-cost method of percentage of completion accounting, revenues are recognized when the product has been shipped or delivered, depending upon when title and risk of loss have passed. For certain U.S. government contracts delivery is deemed to have occurred when work is substantially complete and acceptance by the customer has occurred by execution of a Material Inspection and Receiving Report, DD Form 250 or Memorandum of Shipment.
Sales contracts are initially reviewed to ascertain if they involve multiple element arrangements. If such an arrangement exists and there is no evidence of stand-alone value for each element of the undelivered items, recognition of sales for the arrangement is deferred until all elements of the arrangement are delivered and risk of loss and title have passed. For elements that do have stand-alone value or contracts that are not considered multiple element arrangements, sales and related costs of sales are recognized as services are performed or when the product has been shipped or delivered depending upon when title and risk of loss have passed.
Pre-contract costs incurred for items such as materials or tooling for anticipated contracts are included in inventory if recovery of such costs is considered probable. Thereafter, if the Company determines it will not be awarded an anticipated contract and the associated pre-contract costs cannot be applied to another program the costs are expensed immediately. Learning or start-up costs incurred in connection with existing or anticipated follow-on contracts are charged to the existing contract unless the terms of the contract permit recovery of these costs over a specific contractual term and provide for reimbursement if the contract is canceled. As of December 31, 2014 and 2013, approximately $1.4 million and $1.3 million, respectively, of pre-contract costs were included in inventory, which, in both cases, represented less than 1% of total inventory.
If it is probable that a claim with respect to change orders will result in additional contract revenue and the amount of such additional revenue can be reliably estimated, then the additional contract revenue is considered in our accounting for the program, but only if the contract provides a legal basis for the claim, the additional costs were unforeseen and not caused by deficiencies in our performance, the costs are identifiable and reasonable in view of the work performed and the evidence supporting the claim is objective and verifiable. If these requirements are met, the claim portion of the program is accounted for separately to ensure revenue from the claim is recorded only to the extent claim related costs have been incurred; accordingly, no profit with respect to such costs is recorded until the change order is formally approved. If these requirements are not met, the forecast of total contract cost at completion (which is used to calculate the gross margin rate) for the basic contract is generally increased to include all incurred and anticipated claim related costs.
Recognition of sales not accounted for under the cost-to-cost method of percentage of completion accounting occurs when the sales price is fixed, collectability is reasonably assured and the product’s title and risk of loss has transferred to the customer. The Company includes freight costs charged to customers in net sales and the correlating expense as a cost of sales. Sales tax collected from customers is excluded from net sales in the accompanying Consolidated Statements of Operations.
Cost of Sales and Selling, General and Administrative Expenses
Cost of sales includes costs of products and services sold (i.e., purchased product, raw material, direct labor, engineering labor, outbound freight charges, depreciation and amortization, indirect costs and overhead charges). Selling expenses primarily consist of advertising, promotion, bid and proposal, employee payroll and corresponding benefits and commissions paid to sales and marketing personnel. General and administrative expenses primarily consist of employee payroll including executive, administrative and financial personnel and corresponding benefits, incentive compensation, independent research and development, consulting expenses, warehousing costs, depreciation and amortization. Legal costs are expensed as incurred and are generally included in general and administrative expenses. The Aerospace segment includes general and administrative expenses as an element of program cost and inventory for certain government contracts.
66
NOTES TO CONSOLIDATED FINANCIAL STATEMENTS - Continued
For the Years Ended December 31, 2014, 2013 and 2012
1. SUMMARY OF SIGNIFICANT ACCOUNTING POLICIES (CONTINUED)
Cost of Sales and Selling, General and Administrative Expenses - continued
Certain inventory related costs, including purchasing costs, receiving costs and inspection costs, for the Distribution segment are not included in cost of sales. For the years ended December 31, 2014, 2013 and 2012, $3.4 million, $3.0 million and $3.0 million, respectively, of such costs are included in general and administrative expenses.
Cash and Cash Equivalents
Cash and cash equivalents include cash on hand, demand deposits and short-term cash investments. These investments are liquid in nature and have original maturities of three months or less. Book overdraft positions, which occur when total outstanding issued checks exceed available cash balances at a single financial institution at the end of a reporting period, are reclassified to accounts payable within the consolidated balance sheets. At December 31, 2014 and 2013, the Company had book overdrafts of $7.3 million and $5.2 million, respectively, included in accounts payable.
Accounts Receivable
The Company has three types of accounts receivable: (a) Trade receivables, which consist of amounts billed and currently due from customers; (b) U.S. Government contracts, which consist of (1) amounts billed, and (2) costs and accrued profit – not billed; and (c) Commercial and other government contracts, which consist of (1) amounts billed, and (2) costs and accrued profit – not billed.
The allowance for doubtful accounts reflects management’s best estimate of probable losses inherent in the trade accounts receivable and billed contracts balance. Management determines the allowance based on known troubled accounts, historical experience, and other currently available evidence.
Inventories
Inventory of merchandise for resale is stated at cost (using the average costing method) or market, whichever is lower. Contracts and other work in process and finished goods are valued at production cost represented by raw material, labor and overhead. For certain government contracts, allowable general and administrative expenses are also included in inventory. Initial tooling and startup costs may be included, where applicable. Contracts and other work in process and finished goods are not reported at amounts in excess of net realizable values. The Company includes raw material amounts in the contracts in process and other work in process balances. Raw material includes certain general stock materials but primarily relates to purchases that were made in anticipation of specific programs for which production has not been started as of the balance sheet date.
Property, Plant and Equipment
Property, plant and equipment is recorded at cost. Depreciation is computed primarily on a straight-line basis over the estimated useful lives of the assets. The estimated useful lives for buildings range from 15 to 40 years and for leasehold improvements range from 1 to 20 years, whereas machinery, office furniture and equipment generally have useful lives ranging from 3 to 15 years. At the time of retirement or disposal, the acquisition cost of the asset and related accumulated depreciation are eliminated and any gain or loss is credited to or charged against income.
Long-lived assets, such as property, plant, and equipment, and purchased intangible assets subject to amortization, are reviewed for impairment whenever events or changes in circumstances indicate the carrying amount of an asset may not be recoverable. If circumstances require a long-lived asset be tested for possible impairment, the Company first compares undiscounted cash flows expected to be generated by an asset to the carrying value of the asset. If the carrying value of the long-lived asset is not recoverable on an undiscounted cash flow basis, impairment is recognized to the extent that the carrying value exceeds its fair value. Fair value is determined through various valuation techniques including discounted cash flow models, quoted market values and third-party independent appraisals, as considered necessary.
Maintenance and repair items are charged against income as incurred, whereas renewals and betterments are capitalized and depreciated.
67
NOTES TO CONSOLIDATED FINANCIAL STATEMENTS - Continued
For the Years Ended December 31, 2014, 2013 and 2012
1. SUMMARY OF SIGNIFICANT ACCOUNTING POLICIES (CONTINUED)
Goodwill and Other Intangible Assets
Goodwill represents the excess of the aggregate purchase price over the fair value of the net assets acquired in a purchase business combination and is reviewed for impairment at least annually.
Accounting Standards Codification Topic 350, "Intangibles - Goodwill and Other", ("ASC 350") permits the assessment of qualitative factors to determine whether events and circumstances lead to the conclusion that it is necessary to perform the two-step goodwill impairment test required under ASC 350. The qualitative assessment management performs takes into consideration the following factors: general economic conditions, industry specific performance, changes in carrying values of the reporting units, the assessment of assumptions used in the previous fair value calculation and changes in transaction multiples.
In the first step of the two-step test, the fair value of the reporting unit is compared with its carrying value (including goodwill). If the fair value of the reporting unit is less than its carrying value, an indication of goodwill impairment exists for the reporting unit and the enterprise must perform step two of the impairment test (measurement). In step two, an impairment loss is recognized for any excess of the carrying amount of the reporting unit’s goodwill over the implied fair value of that goodwill. The implied fair value of goodwill is determined by allocating the fair value of the reporting unit in a manner similar to a purchase price allocation. The residual fair value after this allocation is the implied fair value of the reporting unit goodwill.
Fair value of the reporting unit is determined using an income methodology based on management’s estimates of forecasted cash flows for each business unit, with those cash flows discounted to present value using rates commensurate with the risks associated with those cash flows. In addition, management uses a market-based valuation method involving analysis of market multiples of revenues and earnings before interest, taxes, depreciation and amortization (“EBITDA”) for (i) a group of comparable public companies and (ii) recent transactions, if any, involving comparable companies. If the fair value of the reporting unit exceeds its carrying value, step two need not be performed.
Goodwill and intangible assets with indefinite lives are evaluated annually for impairment in the fourth quarter, based on annual forecast information. Intangible assets with finite lives are amortized using the straight-line method over their estimated period of benefit. Goodwill and other intangible assets are reviewed for possible impairment whenever changes in conditions indicate that the fair value of a reporting unit is more likely than not below its carrying value. See Note 9, Goodwill and Other Intangible Assets, Net, for discussion of the goodwill impairment charge recorded in 2013. No such charges were recorded in 2014 or 2012.
Vendor Incentives
The Company’s Distribution segment enters into agreements with certain vendors providing for inventory purchase incentives that are generally earned upon achieving specified volume-purchasing levels. The Company recognizes rebate income relative to specific rebate programs as a reduction of the cost of inventory based on a systematic and rational allocation of the cash consideration offered to each of the underlying transactions that results in progress toward earning the rebate, provided that the amounts are probable and reasonably estimable. As of December 31, 2014 and 2013, total vendor incentive receivables, included in other current assets, were approximately $17.7 million and $13.9 million, respectively.
Self-Insured Retentions
To limit exposure to losses related to group health, workers’ compensation, auto and product general liability claims, the Company obtains third-party insurance coverage. The Company has varying levels of deductibles for these claims. The total liability/deductible for group health is limited to $0.3 million per claim, workers’ compensation is limited to $0.4 million per claim and for product/general liability and auto liability the limit is $0.3 million per claim. The cost of such benefits is recognized as expense based on claims filed in each reporting period and an estimate of claims incurred but not reported (“IBNR”) during such period. The estimates for the IBNR are based upon historical trends and information provided to us by the claims administrators, and are periodically revised to reflect changes in loss trends. These amounts are included in other accruals and payables on the consolidated balance sheets.
68
NOTES TO CONSOLIDATED FINANCIAL STATEMENTS - Continued
For the Years Ended December 31, 2014, 2013 and 2012
1. SUMMARY OF SIGNIFICANT ACCOUNTING POLICIES (CONTINUED)
Self-Insured Retentions - continued
Liabilities associated with these claims are estimated in part by considering historical claims experience, severity factors and other actuarial assumptions. Projections of future losses are inherently uncertain because of the random nature of insurance claim occurrences and changes that could occur in actuarial assumptions. Such self-insurance accruals will likely include claims for which the ultimate losses will be settled over a period of years.
Research and Development
Government funded research expenditures (which are included in cost of sales) were $1.6 million in 2014, $3.3 million in 2013, and $7.8 million in 2012. Research and development costs not specifically covered by contracts are charged against income as incurred and included in selling, general and administrative expenses. Such costs amounted to $6.7 million, $7.2 million and $5.5 million in 2014, 2013 and 2012, respectively.
Income Taxes
Income taxes are accounted for using the asset and liability method. Deferred tax assets and liabilities are recognized for the future tax consequences attributable to temporary differences between the financial statement carrying amounts of existing assets and liabilities and their respective tax bases and operating loss, capital loss and tax credit carryforwards. Deferred tax assets and liabilities are measured using enacted tax rates expected to apply to taxable income in the years in which those temporary differences are expected to be recovered or settled. The effect on deferred tax assets and liabilities of a change in tax rates is recognized in income in the period that includes the enactment date.
The Company records a benefit for uncertain tax positions in the financial statements only when it determines it is more likely than not that such a position will be sustained upon examination by taxing authorities based on the technical merits of the position. Unrecognized tax benefits represent the difference between the position taken in the tax return and the benefit reflected in the financial statements.
Share-Based Payment Arrangements
The Company records compensation expense for share-based awards based upon an assessment of the grant date fair value of the awards. The fair value of each option award is estimated on the date of grant using the Black-Scholes option valuation model. A number of assumptions are used to determine the fair value of options granted. These include expected term, dividend yield, volatility of the options and the risk free interest rate. See Note 18, Share-Based Arrangements, for further information.
Derivative Financial Instruments
The Company is exposed to certain risks relating to its ongoing business operations, including market risks relating to fluctuations in foreign currency exchange rates and interest rates. Derivative financial instruments are recognized on the consolidated balance sheets as either assets or liabilities and are measured at fair value. Changes in the fair values of derivatives are recorded each period in earnings or accumulated other comprehensive income, depending on whether a derivative is effective as part of a hedged transaction. Gains and losses on derivative instruments reported in accumulated other comprehensive income are subsequently included in earnings in the periods in which earnings are affected by the hedged item. The Company does not use derivative instruments for speculative purposes. See Note 6, Derivative Financial Instruments, for further information.
Pension Accounting
The Company accounts for its defined benefit pension plan by recognizing the overfunded or underfunded status of the plan, calculated as the difference between the plan assets and the projected benefit obligation, as an asset or liability on the balance sheet, with changes in the funded status recognized through comprehensive income in the year in which they occur.
69
NOTES TO CONSOLIDATED FINANCIAL STATEMENTS - Continued
For the Years Ended December 31, 2014, 2013 and 2012
1. SUMMARY OF SIGNIFICANT ACCOUNTING POLICIES (CONTINUED)
Pension Accounting - continued
Expenses and liabilities associated with the plan are determined based upon actuarial valuations. Integral to the actuarial valuations are a variety of assumptions including expected return on plan assets and discount rate. The Company regularly reviews the assumptions, which are updated at the measurement date, December 31st. The impact of differences between actual results and the assumptions are accumulated and generally amortized over future periods, which will affect expense recognized in future periods. See Note 14, Pension Plans, for further information.
Recent Accounting Standards
In January 2015, the FASB issued ASU No. 2015-01, "Income Statement - Extraordinary and Unusual Items (Subtopic 225-20)". The new standard eliminates the concept of extraordinary items and their segregation from the results of ordinary operations and expands presentation and disclosure guidance to include items that are both unusual in nature and occur infrequently. The new standard is effective for fiscal years, and interim periods within those years, beginning after December 15, 2015. The adoption of this standard is not expected to have a material impact to the Company's financial statements.
In August 2014, the FASB issued ASU No. 2014-15, "Presentation of Financial Statements - Going Concern (ASC Subtopic 205-40): Disclosure of Uncertainties about an Entity's Ability to Continue as a Going Concern." The new standard provides guidance regarding management's responsibility to evaluate whether there is substantial doubt about an entity's ability to continue as a going concern and to provide related footnote disclosures. The new standard is effective for fiscal years, and interim periods within those fiscal years, beginning after December 15, 2016. Early adoption is permitted. The adoption of this standard is not expected to have a material impact on the Company's financial statements.
In June 2014, the FASB issued ASU No. 2014-12, "Compensation - Stock Compensation (ASC Topic 718) - Accounting for Share-Based Payments When the Terms of an Award Provide that a Performance Target Could Be Achieved after the Requisite Service Period." The objective of this standard update is to eliminate inconsistent practices with regards to the accounting treatment of share-based payment awards. The provisions of this ASU are effective for interim and annual periods beginning after December 15, 2015. The Company does not expect these changes to have a material impact on its consolidated financial statements.
In May 2014, the FASB issued ASU No. 2014-09, "Revenue from Contracts with Customers (ASC Topic 606)." The objective of this standard update is to remove inconsistent practices with regards to revenue recognition between US GAAP and International Financial Reporting Standards ("IFRS"). The standard intends to improve comparability of revenue recognition practices across entities, industries, jurisdictions and capital markets. The provisions of this ASU are effective for interim and annual periods beginning after December 15, 2016; early adoption is not permitted. The Company is currently assessing the potential impact of this ASU on its consolidated financial statements.
In April 2014, the FASB issued ASU No. 2014-08, "Reporting Discontinued Operations and Disclosures of Disposals of Components of an Entity." This standard update requires that a disposal representing a strategic shift that has (or will have) a major effect on an entity's financial results or a business activity classified as held for sale should be reported as discontinued operations. The standard also expands the disclosures for discontinued operations and requires new disclosures related to individually material disposals that do not meet the definition of a discontinued operation. The provisions of this ASU are effective for interim and annual periods beginning after December 15, 2014. The Company does not expect these changes to have a material impact on its consolidated financial statements.
In July 2013, the FASB issued ASU No. 2013-11, "Income Taxes ("ASC Topic 740") - Presentation of an Unrecognized Tax Benefit When a Net Operating Loss Carryforward, a Similar Tax Loss, or a Tax Credit Carryforward Exists." The objective is to end some inconsistent practices with regard to the presentation on the balance sheet of unrecognized tax benefits.The update was effective for financial statement periods beginning after December 15, 2013. The Company adopted this standard beginning January 1, 2014. There was no material impact on the Company's condensed consolidated balance sheet as of December 31, 2014.
70
NOTES TO CONSOLIDATED FINANCIAL STATEMENTS - Continued
For the Years Ended December 31, 2014, 2013 and 2012
1. SUMMARY OF SIGNIFICANT ACCOUNTING POLICIES (CONTINUED)
Recent Accounting Standards - continued
In March 2013, the FASB issued ASU No. 2013-05, "Foreign Currency Matters ("ASC Topic 830") - Parent's Accounting for the Cumulative Translation Adjustment upon Derecognition of Certain Subsidiaries or Groups of Assets within a Foreign Entity or of an Investment in a Foreign Entity." The objective is to resolve the diversity in practice with regard to whether ASC Subtopic 810-10, Consolidation - Overall or ASC Subtopic 830-30 Foreign Currency Matters - Translation of Financial Statements, applies to the release of the cumulative translation adjustment into net income when a parent either sells a part or all of its investment in a foreign entity or no longer holds a controlling financial interest in a subsidiary or group of assets that is a nonprofit activity or a business (other than a sale of in substance real estate or conveyance of oil and gas mineral rights) within a foreign entity. The update was effective for financial statement periods beginning after December 15, 2013. The Company has adopted this standard beginning January 1, 2014. There was no impact on the Company's condensed consolidated financial statements for the period ended December 31, 2014.
2. DISCONTINUED OPERATIONS
The following table provides information regarding the results of discontinued operations:
For the year ended December 31, | |||||||||||
2014 | 2013 | 2012 | |||||||||
In thousands | |||||||||||
Net sales of discontinued operations | $ | 23,540 | $ | 27,885 | $ | 49,603 | |||||
Income from discontinued operations | (3,806 | ) | (2,886 | ) | 1,341 | ||||||
Other income (expense) from discontinued operations | (353 | ) | (292 | ) | (222 | ) | |||||
Earnings (loss) from discontinued operations before income taxes | (4,159 | ) | (3,178 | ) | 1,119 | ||||||
Income tax benefit/(expense) | 1,235 | 792 | (364 | ) | |||||||
Earnings (loss) from discontinued operations before gain/(loss) on disposal | (2,924 | ) | (2,386 | ) | 755 | ||||||
Gain/(loss) on disposal of discontinued operations | (7,567 | ) | — | 2,645 | |||||||
Income tax benefit/(expense) | 2,583 | 420 | (1,322 | ) | |||||||
Net gain (loss) on disposal of discontinued operations | (4,984 | ) | 420 | 1,323 | |||||||
Earnings (loss) from discontinued operations | $ | (7,908 | ) | $ | (1,966 | ) | $ | 2,078 | |||
Delamac Disposal
On December 19, 2014, the Company sold its Distribution segment's Mexico business unit, Delamac. As a result, the Company has reported the results of operations and consolidated financial position of this component as discontinued operations within the consolidated financial statements for all periods presented. The sale resulted in a net loss on disposal of discontinued operations of $5.3 million for the year ended December 31, 2014.
Canadian Operations Disposal
On December 31, 2012, the Company sold substantially all of the assets and liabilities of the Distribution segment's Canadian operations. As a result, the Company has reported the results of operations and consolidated financial position of this component as discontinued operations within the consolidated financial statements for all periods presented.
During 2014, the Company recorded earnings from discontinued operations of $0.3 million due to a pension settlement that resulted from the 2012 disposal of the Distribution segment's Canadian operations.
71
NOTES TO CONSOLIDATED FINANCIAL STATEMENTS - Continued
For the Years Ended December 31, 2014, 2013 and 2012
3. ACQUISITIONS
The following table illustrates cash paid for acquisitions:
For the year ended December 31, | |||||||||||
2014 | 2013 | 2012 | |||||||||
In thousands | |||||||||||
Cash paid for acquisitions completed during the year | $ | 70,948 | $ | 17,284 | $ | 74,465 | |||||
Cash paid for holdback payments during the year | 3,060 | 828 | 11,951 | ||||||||
Earnout and other payments during the year | 3,610 | 50 | 1,205 | ||||||||
Total cash paid for acquisitions | $ | 77,618 | $ | 18,162 | $ | 87,621 | |||||
2014 Acquisitions
On April 25, 2014, the Company acquired specific assets of B.W. Rogers Company and certain affiliated entities ("B.W. Rogers"). Headquartered in Akron, Ohio, B.W. Rogers operated from twenty-one locations in seven states from the Northeast to the Midwest. The acquisition of B.W. Rogers expands the Company's capabilities in both the fluid power and automation and motion control product areas.
This acquisition was accounted for as a purchase transaction. The assets acquired and liabilities assumed were recorded based on their fair values at the date of acquisition as follows (in thousands):
Cash | $ | 11 | |
Accounts receivable | 13,332 | ||
Inventories | 9,614 | ||
Property, plant and equipment | 850 | ||
Other tangible assets | 784 | ||
Goodwill | 37,804 | ||
Other intangible assets | 16,870 | ||
Liabilities | (7,367 | ) | |
Net assets acquired | 71,898 | ||
Less cash received | (11 | ) | |
Net consideration | $ | 71,887 | |
The goodwill associated with B.W. Rogers is tax deductible and is the result of expected synergies from combining the operations of the acquired business with the Company's operations and intangible assets that do not qualify for separate recognition, such as an assembled workforce. Included in the Consolidated Statements of Operations for the year ended December 31, 2014, is $73.1 million of revenue from this acquisition.
The fair value of the identifiable intangible assets of $16.9 million, consisting primarily of customer relationships, non-compete agreements and trade names, was determined using the income approach. Specifically, the discounted cash flows method was utilized for the customer relationships and non-compete agreements and the relief-from-royalty method was utilized for the trade names. The fair value of the customer relationships ($14.9 million) is broken out into two asset categories, which are amortized on a straight-line basis over periods ranging from 11 to 18 years; the fair value of the non-compete agreements ($1.1 million) is being amortized over periods ranging from 1.5 to 3 years; and the fair value of the trade name ($0.9 million) is being amortized over 8 years, the estimated useful lives of the assets.
During the third quarter of 2014, the Company acquired a small distribution business that operates in the fluid power market as a Parker distributor of pneumatic and hydraulic fluid power and motion control systems. The results of this operation are not material to the results of the Distribution segment.
Proforma results of operations have not been presented because the combined effects of the 2014 acquisitions were not material.
72
NOTES TO CONSOLIDATED FINANCIAL STATEMENTS - Continued
For the Years Ended December 31, 2014, 2013 and 2012
3. ACQUISITIONS (CONTINUED)
2013 Acquisitions
On June 14, 2013, the Company acquired substantially all of the assets of Northwest Hose & Fittings, Inc. ("Northwest Hose"). Northwest Hose, formed in 1995, is an authorized Parker Hannifin distributor of hydraulic hose, fittings and adapters as well as couplers and industrial hose to a diverse group of industries such as the metals, agricultural, industrial machinery and equipment industries. Northwest Hose is headquartered in Spokane, Washington.
On July 31, 2013, the Company acquired substantially all of the assets of Ohio Gear & Transmission of Eastlake, Ohio. Founded in 1973, Ohio Gear & Transmission is a distributor of mechanical power transmission equipment, bearings and electric automation systems as well as a designer and fabricator of specialized gearing products serving a variety of industries including food, packaging, material handling, and general machinery.
On August 15, 2013, the Company acquired Western Fluid Components, Inc. ("Western"). Western is headquartered in Everett, Washington, and has other Washington facilities in Tacoma, Kirkland and Bellingham. Founded in 1975, Western is one of the largest fluid connector distributors in Washington and a full-line distributor for Parker Hannifin’s Fluid Connector Group.
These acquisitions were accounted for as purchase transactions. The assets acquired and liabilities assumed for the 2013 acquisitions were recorded based on their fair value at the date of acquisition as follows (in thousands):
Cash | $ | 143 | |
Accounts receivable, net | 3,122 | ||
Inventories | 3,423 | ||
Property, plant and equipment | 446 | ||
Other tangible assets | 797 | ||
Goodwill | 9,493 | ||
Other intangible assets | 4,788 | ||
Liabilities | (4,248 | ) | |
Total of net assets acquired | 17,964 | ||
Less cash received | (143 | ) | |
Net consideration | $ | 17,821 | |
The goodwill associated with Northwest Hose and Ohio Gear & Transmission is tax deductible. The goodwill for the three acquisitions reflects expected synergies from combining the operations of the acquired businesses with the Company's operations and intangible assets that do not qualify for separate recognition, such as an assembled workforce. There is $28.8 million and $11.1 million of revenue from these acquisitions included in the Consolidated Statement of Operations for the years ended December 31, 2014 and 2013, respectively.
The fair value of the identifiable intangible assets of $4.8 million, consisting primarily of customer lists/relationships, non-compete agreements and trade names, was determined using the income approach. Specifically, the discounted cash flows method was utilized for the customer relationships and non-compete agreements and the relief-from-royalty method was utilized for the trade names. The fair value of the customer relationships ($4.6 million) is being amortized on a straight-line basis over periods ranging from 7 to 10 years; and the fair value of other intangible assets ($0.2 million) is being amortized over periods ranging from 3 to 5 years, the estimated useful lives of the assets.
Proforma results of operations have not been presented because the effect of the acquisitions was not material.
73
NOTES TO CONSOLIDATED FINANCIAL STATEMENTS - Continued
For the Years Ended December 31, 2014, 2013 and 2012
3. ACQUISITIONS (CONTINUED)
Contingency Payments - Aerospace
Included in acquisition costs are contingency payments to the former owners of the Aerospace Orlando facility acquired in 2003. These payments are based on the attainment of certain milestones, and over the term of the agreement could total $25.0 million. These contingency payments are recorded as additional goodwill and totaled $1.5 million, $3.5 million and $0.2 million during 2014, 2013 and 2012, respectively. Through December 31, 2014, the Company has recorded additional goodwill of $18.0 million related to these contingency payments. Payment of the $1.5 million recorded in 2014 will occur in the first quarter of 2015.
4. ACCOUNTS RECEIVABLE, NET
Accounts receivable consist of the following:
At December 31, | ||||||||
2014 | 2013 | |||||||
In thousands | ||||||||
Trade receivables | $ | 141,481 | $ | 125,092 | ||||
U.S. Government contracts: | ||||||||
Billed | 21,909 | 14,364 | ||||||
Costs and accrued profit – not billed | 1,581 | 6,340 | ||||||
Commercial and other government contracts: | ||||||||
Billed | 51,166 | 63,051 | ||||||
Costs and accrued profit – not billed | 21,719 | 853 | ||||||
Less allowance for doubtful accounts | (3,208 | ) | (3,827 | ) | ||||
Total | $ | 234,648 | $ | 205,873 | ||||
The increase in commercial and other government contracts unbilled costs and accrued profit is primarily related to receivables due under the SH-2G(I) New Zealand program.
Accounts receivable, net includes amounts for matters such as contract changes, negotiated settlements and claims for unanticipated contract costs. These amounts are as follows:
At December 31, | ||||||||
2014 | 2013 | |||||||
In thousands | ||||||||
Contract changes, negotiated settlements and claims for unanticipated contract costs | $ | 4,561 | $ | 1,021 | ||||
Total | $ | 4,561 | $ | 1,021 | ||||
74
NOTES TO CONSOLIDATED FINANCIAL STATEMENTS - Continued
For the Years Ended December 31, 2014, 2013 and 2012
5. FAIR VALUE MEASUREMENTS
Fair value is defined as the exchange price that would be received for an asset or paid to transfer a liability (an exit price) in the principal or most advantageous market for the asset or liability in an orderly transaction between market participants at the measurement date.
The Company uses a three-level fair value hierarchy that prioritizes the inputs used to measure fair value. This hierarchy requires us to maximize the use of observable inputs and minimize the use of unobservable inputs. The three levels of inputs used to measure fair value are as follows:
• | Level 1 — Quoted prices in active markets for identical assets or liabilities. |
• | Level 2 — Observable inputs other than quoted prices included in Level 1, such as quoted prices for markets that are not active or other inputs that are observable or can be corroborated by observable market data. |
• | Level 3 — Unobservable inputs that are supported by little or no market activity and are significant to the fair value of the assets or liabilities. This includes certain pricing models, discounted cash flow methodologies and similar techniques that use significant unobservable inputs. |
The following table provides the carrying value and fair value of financial instruments that are not carried at fair value at December 31, 2014 and 2013:
2014 | 2013 | |||||||||||||||
In thousands | Carrying Value | Fair Value | Carrying Value | Fair Value | ||||||||||||
Long-term debt: | ||||||||||||||||
Level 1 | $ | 109,024 | $ | 145,188 | $ | 107,093 | $ | 147,822 | ||||||||
Level 2 | 172,208 | 164,204 | 167,562 | 155,473 | ||||||||||||
Total | $ | 281,232 | $ | 309,392 | $ | 274,655 | $ | 303,295 | ||||||||
The above fair values were computed based on quoted market prices and discounted future cash flows, as applicable. Differences from carrying amounts are attributable to interest rate changes subsequent to when the transaction occurred. The fair values of Cash and cash equivalents, Accounts receivable, net, Notes payable, and Accounts payable - trade approximate their carrying amounts due to the short-term maturities of these instruments.
Recurring Fair Value Measurements
The Company holds derivative instruments for foreign exchange contracts and interest rate swaps that are measured at fair value using observable market inputs such as forward rates and our counterparties’ credit risks. Based on these inputs, the derivative instruments are classified within Level 2 of the valuation hierarchy and have been included in other current assets and other assets on the Consolidated Balance Sheet at December 31, 2014 and 2013. Based on the continued ability to trade and enter into forward contracts and interest rate swaps, we consider the markets for our fair value instruments to be active. These contracts are not material to the Company's Consolidated Financial Statements for the years ended December 31, 2014, 2013 and 2012.
The Company evaluated the credit risk associated with the counterparties to these derivative instruments and determined that as of December 31, 2014, such credit risks have not had an adverse impact on the fair value of these instruments.
Nonrecurring Fair Value Measurements
Goodwill and indefinite-lived intangible assets are tested for possible impairment during the fourth quarter of each year. During 2013, management concluded that the carrying value of goodwill at its VT Composites reporting unit exceeded its fair value and, accordingly, recorded an impairment charge totaling $2.1 million to write down the goodwill to its implied fair value. After the $2.1 million charge there was $16.8 million of goodwill remaining at December 31, 2013, for this reporting unit. See Note 9, Goodwill and Other Intangible Assets, Net, for further discussion.
75
NOTES TO CONSOLIDATED FINANCIAL STATEMENTS - Continued
For the Years Ended December 31, 2014, 2013 and 2012
5. FAIR VALUE MEASUREMENTS (CONTINUED)
Nonrecurring Fair Value Measurements - continued
The nonrecurring fair value measurement for goodwill was developed using significant unobservable inputs (Level 3). For step-one of the impairment analysis, the primary valuation technique used was an income methodology based on management’s estimates of forecasted cash flows for each business unit, with those cash flows discounted to present value using rates commensurate with the risks associated with those cash flows. In addition, management used a market-based valuation method involving analysis of market multiples of revenues and earnings before interest, taxes, depreciation and amortization (“EBITDA”) for a group of comparable public companies. Valuation methods used to determine the fair value of the reporting unit’s assets and liabilities in order to perform a purchase price allocation included the income and market approach depending on the nature of the asset/liability. Assumptions used by management were similar to those that would be used by market participants performing valuations of the reporting unit.
6. DERIVATIVE FINANCIAL INSTRUMENTS
The Company is exposed to certain risks relating to its ongoing business operations, including market risks relating to fluctuations in foreign currency exchange rates and interest rates. Derivative financial instruments are reported on the consolidated balance sheets at fair value. Changes in the fair values of derivatives are recorded each period in earnings or accumulated other comprehensive income, depending on whether a derivative is effective as part of a hedged transaction. Gains and losses on derivative instruments reported in accumulated other comprehensive income are subsequently included in earnings in the periods in which earnings are affected by the hedged item. The Company does not use derivative instruments for speculative purposes.
The Company held forward exchange contracts designed to hedge forecasted transactions denominated in foreign currencies and to minimize the impact of foreign currency fluctuations on the Company’s earnings and cash flows. Some of those contracts were designated as cash flow hedges. The Company will include in earnings amounts currently included in accumulated other comprehensive income upon recognition of cost of sales related to the underlying transaction.
The Company’s Term Loan Facility (“Term Loan”) contains floating rate obligations and is subject to interest rate fluctuations. During 2013, the Company entered into interest rate swap agreements for the purposes of hedging the eight quarterly variable-rate interest payments on its Term Loan due in 2014 and 2015. These interest rate swap agreements were designated as cash flow hedges and intended to manage interest rate risk associated with the Company’s variable-rate borrowings and minimize the impact on the Company's earnings and cash flows of interest rate fluctuations attributable to changes in LIBOR rates. These agreements are not material to the Company's Consolidated Financial Statements for the years ended December 31, 2014, 2013 and 2012.
During the second quarter of 2014, the Company entered into forward exchange contracts designed to hedge forecasted transactions denominated in foreign currencies and to minimize the impact of foreign currency fluctuations on the Company's earnings and cash flows. These contracts were entered into as a result of forecasted foreign currency transactions associated with the New Zealand contract to deliver ten SH-2G(I) aircraft and were designated as cash flow hedges. During the third quarter of 2014, the Company dedesignated these forward contracts, due to a change in the timing of payments. These contracts are not material to the Company's Consolidated Financial Statements for the years ended December 31, 2014, 2013 and 2012.
76
NOTES TO CONSOLIDATED FINANCIAL STATEMENTS - Continued
For the Years Ended December 31, 2014, 2013 and 2012
7. INVENTORIES
Inventories consist of the following:
At December 31, | ||||||||
2014 | 2013 | |||||||
In thousands | ||||||||
Merchandise for resale | $ | 149,837 | $ | 152,194 | ||||
Raw materials | 19,954 | 20,609 | ||||||
Contracts in process: | ||||||||
U.S. Government, net of progress payments of $8,590 and $10,492 in 2014 and 2013, respectively | 106,036 | 105,737 | ||||||
Commercial and other government contracts | 51,348 | 71,044 | ||||||
Other work in process (including certain general stock materials) | 21,618 | 28,439 | ||||||
Finished goods | 10,948 | 12,472 | ||||||
Total | $ | 359,741 | $ | 390,495 | ||||
The decrease in commercial and other government contracts in 2014 is primarily attributable to the sale of SH-2G(I) inventory.
General and administrative costs incurred by the Aerospace segment operations that charged such costs to inventory during 2014 and 2013 were $39.2 million and $37.4 million, respectively. The estimated amounts of general and administrative costs remaining in contracts in process at December 31, 2014 and 2013, are $10.2 million and $5.4 million, respectively. These estimates are based on the ratio of such costs to total costs of production.
The Company had inventory of $7.4 million and $8.0 million as of December 31, 2014 and 2013, respectively, on consignment at customer locations, the majority of which is located with Distribution segment customers.
Inventories include amounts associated with matters such as contract changes, negotiated settlements and claims for unanticipated contract costs, which totaled $13.3 million and $11.6 million at December 31, 2014 and 2013, respectively.
K-MAX® inventory of $17.2 million and $17.0 million as of December 31, 2014 and 2013, respectively, is included in contracts and other work in process inventory and finished goods. Management believes that a significant portion of this K-MAX® inventory will be sold after December 31, 2015, based upon the anticipation of supporting the fleet for the foreseeable future.
At December 31, 2014 and 2013, $23.5 million and $43.8 million, respectively, of SH-2G(I), formerly SH-2G(A), inventory was included on the Company's balance sheet in contracts and other work in process inventory. On May 8, 2013, the Company announced that it had entered into a $120.6 million contract with the New Zealand MoD for the sale of ten SH-2G(I) Super Seasprite aircraft, spare parts, a full mission flight simulator, and related logistics support. Although a substantial portion of the SH-2G(I) inventory will be used in the performance of this new contract, management believes that $4.1 million of the SH-2G(I) inventory will be sold after December 31, 2015, based upon the time needed to prepare the aircraft for sale and the requirements of our customer.
77
NOTES TO CONSOLIDATED FINANCIAL STATEMENTS - Continued
For the Years Ended December 31, 2014, 2013 and 2012
8. PROPERTY, PLANT AND EQUIPMENT, NET
Property, plant and equipment, net is summarized as follows:
At December 31, | ||||||||
2014 | 2013 | |||||||
In thousands | ||||||||
Land | $ | 12,873 | $ | 12,357 | ||||
Buildings | 79,477 | 70,992 | ||||||
Leasehold improvements | 17,341 | 16,480 | ||||||
Machinery, office furniture and equipment | 216,527 | 182,897 | ||||||
Construction in process | 5,436 | 33,064 | ||||||
Total | 331,654 | 315,790 | ||||||
Less accumulated depreciation | (183,829 | ) | (167,282 | ) | ||||
Property, plant and equipment, net | $ | 147,825 | $ | 148,508 | ||||
Depreciation expense was $23.8 million, $20.8 million and $18.8 million for 2014, 2013 and 2012, respectively. Included in machinery, office furniture and equipment and construction in process is $1.5 million of assets purchased under the Company's master leasing agreement with PNC and accounted for as capital leases. These leases have not yet commenced as of December 31, 2014. See Note 16, Commitments and Contingencies, for a discussion on the master leasing agreement.
9. GOODWILL AND OTHER INTANGIBLE ASSETS, NET
Goodwill
The following table sets forth the change in the carrying amount of goodwill for each reportable segment and for the Company:
2014 | 2013 | |||||||||||||||||||||||
Distribution | Aerospace | Total | Distribution | Aerospace | Total | |||||||||||||||||||
In thousands | ||||||||||||||||||||||||
Gross balance at beginning of period | $ | 105,637 | $ | 114,538 | $ | 220,175 | $ | 96,155 | $ | 110,072 | $ | 206,227 | ||||||||||||
Accumulated impairment | — | (16,252 | ) | (16,252 | ) | — | (14,181 | ) | (14,181 | ) | ||||||||||||||
Net balance at beginning of period | 105,637 | 98,286 | 203,923 | 96,155 | 95,891 | 192,046 | ||||||||||||||||||
Additions | 38,033 | 1,532 | 39,565 | 9,493 | 3,527 | 13,020 | ||||||||||||||||||
Change in goodwill due to the disposal of Delamac | (2,014 | ) | — | (2,014 | ) | — | — | — | ||||||||||||||||
Impairments | — | — | — | — | (2,071 | ) | (2,071 | ) | ||||||||||||||||
Foreign currency translation | (44 | ) | (2,849 | ) | (2,893 | ) | (11 | ) | 939 | 928 | ||||||||||||||
Net balance at end of period | $ | 141,612 | $ | 96,969 | $ | 238,581 | $ | 105,637 | $ | 98,286 | $ | 203,923 | ||||||||||||
Accumulated impairment at end of period | $ | — | $ | (16,252 | ) | $ | (16,252 | ) | $ | — | $ | (16,252 | ) | $ | (16,252 | ) | ||||||||
The increase in the goodwill balance at the Company's Distribution segment is primarily due to the acquisition of B.W. Rogers. See Note 3, Acquisitions, for further discussion of this acquisition. The addition to goodwill in the Company's Aerospace segment relates to an earnout payment associated with a previous acquisition.
78
NOTES TO CONSOLIDATED FINANCIAL STATEMENTS - Continued
For the Years Ended December 31, 2014, 2013 and 2012
9. GOODWILL AND OTHER INTANGIBLE ASSETS, NET (CONTINUED)
2014 Analysis
During 2014, the Company performed a reevaluation of its reporting units for the purpose of its annual goodwill assessment. The Company reorganized its metallic and composite aerostructures businesses, as well as its engineering design and air, vehicle and maintenance, repair and overhaul businesses, into a new entity called Kaman Aerosystems. The Company has designated this entity as a reporting unit for purposes of its annual assessment of goodwill for impairment. Since this is the first year the Company assessed goodwill at this reporting unit level, the two-step impairment test was performed.
Upon completion of the qualitative assessment of events and circumstances affecting recorded goodwill as described in Note 1, Summary of Significant Accounting Policies, the Company concluded that other than Aerosystems, no reporting units should be subject to the two-step goodwill impairment test required by ASC 350 at the end of 2014. The qualitative assessment that management performed took into consideration the following factors: general economic conditions, industry specific performance, changes in carrying values of the reporting units, the assessment of assumptions used in the previous fair value calculation and changes in transaction multiples.
The results of the Aerosystems Step 1 test indicated that the Company did not need to proceed to Step 2, as the percentage by which the fair value exceeds the carrying value is 16%. The Company performed a sensitivity analysis relative to the discount rate and growth rate selected and determined a decrease of 1% in the terminal growth rate or an increase of 1% in the discount rate would not result in a fair value calculation less than the carrying value for Aerosystems.
2013 Analysis
During 2013, the Company's legacy VT Composites reporting unit experienced delays on certain programs that were driven by changes in customers' requirements during 2012. The Company anticipated these changes in requirements would shift revenues and related cash flows into 2013 and future periods. The anticipated deferred revenues did not materialize to the levels the Company had projected in 2013, and therefore the results of Step 1 of the impairment analysis resulted in a fair value for the reporting unit below its carrying value. Prior to proceeding to Step 2 of the impairment analysis, management assessed the tangible and intangible assets subject to amortization to determine if they were impaired. Based on this analysis management concluded these assets were not impaired. Upon completion of the Step 2 impairment analysis, the Company recorded a non-cash non-tax deductible goodwill impairment charge of $2.1 million, or 11% of the reporting unit's total goodwill balance, to reduce the carrying value of goodwill to its implied fair value. This charge has been included in the 2013 operating results of the Company's Aerospace segment.
Other Intangible Assets
Other intangible assets consisted of:
At December 31, | At December 31, | |||||||||||||||||
2014 | 2013 | |||||||||||||||||
Amortization Period | Gross Amount | Accumulated Amortization | Gross Amount | Accumulated Amortization | ||||||||||||||
In thousands | ||||||||||||||||||
Customer lists / relationships | 6-21 years | $ | 123,005 | $ | (31,868 | ) | $ | 109,790 | $ | (23,647 | ) | |||||||
Trademarks / trade names | 3-8 years | 3,546 | (2,080 | ) | 2,695 | (1,594 | ) | |||||||||||
Non-compete agreements and other | 1-9 years | 6,719 | (4,948 | ) | 6,133 | (4,055 | ) | |||||||||||
Patents | 17 years | 523 | (406 | ) | 523 | (396 | ) | |||||||||||
Total | $ | 133,793 | $ | (39,302 | ) | $ | 119,141 | $ | (29,692 | ) | ||||||||
The increase in the other intangible assets balance at December 31, 2014, as compared to December 31, 2013, is primarily due to the acquisition of B.W. Rogers. See Note 3, Acquisitions, for further discussion of this acquisition. Intangible asset amortization expense was $10.6 million, $9.2 million and $7.4 million in 2014, 2013 and 2012, respectively.
79
NOTES TO CONSOLIDATED FINANCIAL STATEMENTS - Continued
For the Years Ended December 31, 2014, 2013 and 2012
9. GOODWILL AND OTHER INTANGIBLE ASSETS, NET (CONTINUED)
Other Intangible Assets - continued
Estimated amortization expense for the next five years associated with intangible assets existing as of December 31, 2014, is as follows:
In thousands | |||
2015 | $ | 12,164 | |
2016 | $ | 11,650 | |
2017 | $ | 11,728 | |
2018 | $ | 11,728 | |
2019 | $ | 10,609 | |
In order to determine the useful life of our customer lists/relationships acquired, the Company considered numerous factors, most importantly the industry considerations associated with the acquired entities. The Company determined the amortization period for the customer lists/relationships intangible assets for its Distribution acquisitions in 2014 and 2013 based primarily on an analysis of their historical customer sales attrition information.
10. ENVIRONMENTAL COSTS
The following table displays the activity and balances associated with accruals related to environmental costs included in other accruals and payables and other long-term liabilities:
2014 | 2013 | |||||||
In thousands | ||||||||
Balance at January 1 | $ | 11,531 | $ | 12,818 | ||||
Additions to accrual | 1,865 | 698 | ||||||
Payments | (2,465 | ) | (1,984 | ) | ||||
Other | (307 | ) | — | |||||
Changes in foreign currency exchange rates | (26 | ) | (1 | ) | ||||
Balance at December 31 | $ | 10,598 | $ | 11,531 | ||||
Bloomfield
In August 2008, the Company completed its purchase of the portion of the Bloomfield campus that Kaman Aerospace Corporation had leased from NAVAIR for many years. In connection with the purchase, the Company has assumed responsibility for environmental remediation at the facility as may be required under the Connecticut Transfer Act (the “Transfer Act”) and it continues the effort to define the scope of the remediation that will be required by the Connecticut Department of Environmental Protection (“CTDEP”). The transaction was recorded by taking the undiscounted estimated remediation liability of $20.8 million and discounting it at a rate of 8% to its present value. The fair value of the Navy Property asset, which at that time approximated the discounted present value of the assumed environmental liability of $10.3 million, is included in Property, plant and equipment, net. This remediation process will take many years to complete.
80
NOTES TO CONSOLIDATED FINANCIAL STATEMENTS - Continued
For the Years Ended December 31, 2014, 2013 and 2012
10. ENVIRONMENTAL COSTS (CONTINUED)
The following represents estimated future payments for the undiscounted environmental remediation liability related to the Bloomfield campus as of December 31, 2014:
In thousands | |||
2015 | $ | 1,839 | |
2016 | 902 | ||
2017 | 1,003 | ||
2018 | 403 | ||
2019 | 451 | ||
Thereafter | 5,359 | ||
Total | $ | 9,957 | |
Other
During 2014, the Company sold its former manufacturing facility in Moosup, Connecticut to TD Development, LLC. In connection with the sale, the Company will contribute $4.0 million in cash to an escrow account over a four-year period to fund environmental remediation work that is expected to be performed on the site. The Company currently has $3.2 million accrued representing the unpaid portion of this contribution payable to TD Development.
The Company's environmental accrual also includes estimated environmental remediation costs that the Company expects to incur at the former Music segment’s New Hartford, CT facility and the Aerospace segment’s U.K. Composites facilities. The Company continues to assess the work that may be required at each of these facilities, which may result in a change to this accrual.
For further discussion of these matters, see Note 16, Commitments and Contingencies.
11. DEBT
Long-Term Debt
The Company has long-term debt as follows:
At December 31, | ||||||||
2014 | 2013 | |||||||
In thousands | ||||||||
Revolving credit agreement | $ | 92,208 | $ | 77,562 | ||||
Term loan | 80,000 | 90,000 | ||||||
Convertible notes | 109,024 | 107,093 | ||||||
Total | 281,232 | 274,655 | ||||||
Less current portion | 10,000 | 10,000 | ||||||
Total excluding current portion | $ | 271,232 | $ | 264,655 | ||||
The weighted average interest rate on long-term borrowings outstanding as of December 31, 2014 and 2013, was 2.31%.
81
NOTES TO CONSOLIDATED FINANCIAL STATEMENTS - Continued
For the Years Ended December 31, 2014, 2013 and 2012
11. DEBT (CONTINUED)
The aggregate annual maturities of long-term debt for each of the next five years are approximately as follows:
In thousands | |||
2015 | $ | 10,000 | |
2016 | 10,000 | ||
2017 | 267,208 | ||
2018 | — | ||
2019 | — | ||
Long-Term Debt - continued
In the above table, the total principal of the Convertible Note of $115.0 million is included in the amount due in 2017. The carrying value of the Convertible Notes at December 31, 2014, is $109.0 million.
Revolving Credit and Term Loan Agreements
On November 20, 2012, the Company entered into a Credit Agreement (the "Credit Agreement") with JPMorgan Chase Bank, N.A., as Administrative Agent, Bank of America, N.A. and RBS Citizens, N.A. as Co-Syndication Agents, J.P. Morgan Securities LLC (“J.P. Morgan Securities”), Merrill Lynch, Pierce, Fenner & Smith Incorporated (“MLPF&S”) and RBS Citizens, N.A. as Joint Bookrunners and Joint Lead Arrangers, and the other lenders named therein (collectively, the “Lenders”). The Credit Agreement, which expires on July 31, 2017, replaced the Company's then existing $275.0 million Amended and Restated Revolving Credit Agreement (the "Revolving Credit Agreement") and $42.5 million Second Amended and Restated Term Loan Credit Agreement (the Term Loan Agreement).
The Credit Agreement, provides a $400.0 million revolving credit facility under which we may issue letters of credit for our benefit and a $100.0 million term loan facility. The term loan commitment requires quarterly payments of principal (which commenced on March 31, 2013) at the rate of $2.5 million per quarter with $55.0 million payable in the final quarter of the facility's term. The Company may increase the aggregate amount of each of the revolving credit facility and the term loan facility by up to $100.0 million in accordance with the terms of the Credit Agreement.
The revolving credit facility permits the Company to pay cash dividends. The Lenders have been granted a security interest in substantially all of the Company’s and its domestic subsidiaries’ personal property and other assets (including intellectual property but excluding real estate), including a pledge of 66% of the Company’s equity interest in certain foreign subsidiaries and 100% of the Company’s equity interest in its domestic subsidiaries, as collateral for the Company’s obligations under the Credit Agreement. At December 31, 2014, there was $92.2 million outstanding under the Credit Agreement, excluding letters of credit, with $248.6 million available for borrowing. Letters of credit are considered borrowings for purposes of the Credit Agreement. A total of $59.2 million in letters of credit was outstanding under the Credit Agreement at December 31, 2014, $54.5 million of which related to the New Zealand SH-2G(I) sales contract. At December 31, 2013, there was $77.6 million outstanding under the Revolving Credit Agreement, excluding letters of credit, with $285.6 million available for borrowing. A total of $36.8 million in letters of credit was outstanding under the Revolving Credit Agreement at December 31, 2013, $30.3 million of which related to the New Zealand SH-2G(I) sales contract.
Interest rates on amounts outstanding under the Credit Agreement are variable, and are determined based on the Consolidated Senior Secured Leverage Ratio, as defined in the Credit Agreement. At December 31, 2014, the interest rate for the outstanding amounts on both the revolving credit facility and term loan commitment was 1.70%. At December 31, 2013, the interest rate for the outstanding amounts on both the former Revolving Credit Agreement and former Term Loan Agreement was 1.72%. In addition, the Company is required to pay a quarterly commitment fee on the unused revolving loan commitment amount at a rate ranging from 0.200% to 0.325% per annum, based on the Consolidated Senior Secured Leverage Ratio. Fees for outstanding letters of credit range from 1.250% to 2.125%, based on the Consolidated Senior Secured Leverage Ratio.
82
NOTES TO CONSOLIDATED FINANCIAL STATEMENTS - Continued
For the Years Ended December 31, 2014, 2013 and 2012
11. DEBT (CONTINUED)
Revolving Credit and Term Loan Agreements - continued
The financial covenants associated with the Credit Agreement include a requirement that (i) the ratio of Consolidated Senior Secured Indebtedness to Consolidated EBITDA, as defined in the Credit Agreement, cannot be greater than 3.50 to 1.00, (ii) the ratio of Consolidated Total Indebtedness to Consolidated EBITDA, as defined in the Credit Agreement, cannot be
greater than 4.00 to 1.00, and iii) the ratio of Consolidated EBITDA to the sum of (a) all interest, premium payments, debt discounts, fees, charges and related expenses and (b) the portion of rent expense under capital leases that is treated as interest expense, as defined in the Credit Agreement, cannot be less than 4.00 to 1.00. The Company was in compliance with those financial covenants as of and for the quarter ended December 31, 2014, and management does not anticipate noncompliance in the foreseeable future.
Convertible Notes
In November 2010, the Company issued convertible unsecured notes due on November 15, 2017, in the aggregate principal amount of $115.0 million in a private placement offering (the "Convertible Notes"). These notes bear 3.25% interest per annum on the principal amount, payable semiannually in arrears on May 15 and November 15 of each year, beginning on May 15, 2011. Proceeds from the offering were $111.0 million, net of fees and expenses which were capitalized. The proceeds were used to repay $62.2 million of borrowings outstanding on the Company’s former Revolving Credit Agreement, make a $25.0 million voluntary contribution to the Qualified Pension Plan and pay $13.2 million for the purchase of call options related to the convertible note offering. See below for further discussion of the call options.
The Convertible Notes will mature on November 15, 2017, unless earlier redeemed, repurchased by the Company or converted. Upon conversion, the Convertible Notes require net share settlement, where the aggregate principal amount of the notes will be paid in cash and remaining amounts due, if any, will be settled in cash, shares of the Company's common stock or a combination of cash and shares of common stock, at the Company's election.
83
NOTES TO CONSOLIDATED FINANCIAL STATEMENTS - Continued
For the Years Ended December 31, 2014, 2013 and 2012
11. DEBT (CONTINUED)
Convertible Notes - continued
The following table illustrates the conversion rate at each date:
December 31, 2014 | December 31, 2013 | |||||||
Convertible Notes | ||||||||
Conversion Rate per $1,000 principal amount (1) | 29.6876 | 29.6292 | ||||||
Conversion Price (2) | $ | 33.68 | $ | 33.75 | ||||
Contingent Conversion Price (3) | $ | 43.79 | $ | 43.88 | ||||
Aggregate shares to be issued upon conversion (4) | 3,414,074 | 3,407,357 | ||||||
(1) Represents the number of shares of Common Stock hypothetically issuable per $1,000 principal amount of Notes, subject to adjustments per the Convertible Note Indenture dated November 19, 2010. At the date the Company issued the Convertible Notes, the conversion rate initially equaled 29.4499 shares of common stock per $1,000 principal amount of notes (which is equivalent to an initial conversion price of approximately $33.96 per share of common stock). The conversion rate is subject to adjustment upon the occurrence of certain specified events, such as an increase in the dividend paid to shareholders.
(2) Represents $1,000 divided by the conversion rate as of such date. The conversion price reflects the strike price of the embedded option within the Convertible Note. Were the Company's share price to exceed the conversion price at conversion the noteholders would be entitled to receive additional consideration either in cash, shares or a combination, the form of which is at the sole discretion of the Company.
(3) Prior to May 15, 2017, the notes are convertible only in the following circumstances: (1) during any fiscal quarter commencing after April 1, 2011, and only during any such fiscal quarter, if the last reported sale price of our common stock was greater than or equal to 130% of the applicable conversion price for at least 20 trading days (whether or not consecutive) during the 30 consecutive trading days ending on the last trading day of the previous fiscal quarter, (2) upon the occurrence of specified corporate transactions, or (3) during the five consecutive business-day period following any five consecutive trading-day period in which, for each day of that period, the trading price for the notes was less than 98% of the product of the last reported sale price of our common stock and the applicable conversion rate on such trading day. On and after May 15, 2017, until the close of business on the second scheduled trading day immediately preceding the maturity date, holders may convert their notes at any time, regardless of the foregoing circumstances. Upon a change in control or termination of trading, holders of the notes may require us to repurchase all or a portion of their notes for cash at a repurchase price equal to 100% of the principal amount, plus any accrued and unpaid interest.
(4) This represents the number of shares hypothetically issuable upon conversion of the principal balance of the Convertible Notes at each date; however, as the terms of the Convertible Notes require net share settlement, the aggregate principal amount of the notes will be paid in cash. Amounts due in excess of the principal, if any, may be settled in cash, shares of the Company's common stock or a combination of cash and shares of common stock, at the Company's election.
Because the embedded conversion option is indexed to the Company’s own stock and would be classified in shareholders’ equity, it does not meet the criterion under FASB Accounting Standards Codification Topic 815 - Derivatives and Hedging ("ASC 815") that would require separate accounting as a derivative instrument.
In connection with the offering, we entered into convertible note hedge transactions with affiliates of the initial purchasers. These transactions are intended to reduce the potential dilution to our Company's shareholders upon any future conversion of the notes. The call options, which cost an aggregate $13.2 million, were recorded as a reduction of additional paid-in capital. The Company also entered into warrant transactions concurrently with the offering, pursuant to which we sold warrants to acquire up to approximately 3.4 million shares of our common stock to the same counterparties that entered into the convertible note hedge transactions. Proceeds received from the issuance of the warrants totaled approximately $1.9 million and were recorded as additional paid-in capital. The convertible note hedge and warrant transactions effectively increased the conversion price of the convertible notes.
84
NOTES TO CONSOLIDATED FINANCIAL STATEMENTS - Continued
For the Years Ended December 31, 2014, 2013 and 2012
11. DEBT (CONTINUED)
Convertible Notes - continued
The following table illustrates the warrant price at each date:
December 31, 2014 | December 31, 2013 | |||||||
Warrants | ||||||||
Warrant Price | $ | 44.05 | $ | 44.14 | ||||
ASC 815 provides that contracts are initially classified as equity if (1) the contract requires physical settlement or net-share settlement, or (2) the contract gives the company a choice of net-cash settlement or settlement in its own shares (physical settlement or net-share settlement). The settlement terms of our purchased call options and sold warrant contracts require net-share settlement. Based on the guidance in ASC 815, the purchased call option contracts were recorded as a reduction of equity and the warrants were recorded as an addition to equity as of the trade date. ASC 815 states that a reporting entity shall not consider contracts to be derivative instruments if the contract issued or held by the reporting entity is both indexed to its own stock and classified in shareholders' equity in its Consolidated Balance Sheet. The Company concluded the purchased call option contracts and the warrant contracts should be accounted for in shareholders' equity and are therefore not to be considered derivative instruments.
ASC 470-20 Debt with Conversion and Other Options (“ASC 470-20”), clarifies the accounting for convertible debt instruments that may be settled in cash upon conversion, including partial cash settlement. ASC 470-20 specifies that an issuer of such instruments should separately account for the liability and equity components of the instruments in a manner that reflects the issuer's non-convertible debt borrowing rate which interest costs are to be recognized in subsequent periods. The note payable principal balance at the date of issuance of $115.0 million was bifurcated into the debt component of $101.7 million and the equity component of $13.3 million. The difference between the note payable principal balance and the value of the debt component is being accreted to interest expense over the term of the notes. The debt component was recognized at the present value of associated cash flows discounted using a 5.25% discount rate, the borrowing rate at the date of issuance for a similar debt instrument without a conversion feature. The Company incurred $3.6 million of debt issuance costs in connection with the sale of the Convertible Notes, of which $0.5 million was recorded as an offset to additional paid-in capital. The balance, $3.1 million, is being amortized over the term of the notes. Total amortization expense for each of the years ended December 31, 2014, 2013, and 2012 was $0.5 million.
The carrying amount of the equity component and the principal amount of the liability component, the unamortized discount, and the net carrying amount of the liability are as follows:
December 31, 2014 | December 31, 2013 | ||||||
In thousands | |||||||
Principal amount of liability | $ | 115,000 | $ | 115,000 | |||
Unamortized discount | 5,976 | 7,907 | |||||
Carrying value of liability | $ | 109,024 | $ | 107,093 | |||
Equity component | $ | 13,329 | $ | 13,329 | |||
As of December 31, 2014, the "if converted value" exceeds the principal amount of the Convertible Notes by $21.7 million since the closing price of the Company's Common Stock was $40.09 compared to the conversion price of $33.68 for the Convertible Notes.
85
NOTES TO CONSOLIDATED FINANCIAL STATEMENTS - Continued
For the Years Ended December 31, 2014, 2013 and 2012
11. DEBT (CONTINUED)
Convertible Notes - continued
Interest expense associated with the Convertible Notes consisted of the following:
For the year ended December 31, | |||||||||||
2014 | 2013 | 2012 | |||||||||
In thousands | |||||||||||
Contractual coupon rate of interest | $ | 3,738 | $ | 3,738 | $ | 3,738 | |||||
Accretion of convertible notes discount | 1,931 | 1,833 | 1,738 | ||||||||
Interest expense - convertible notes | $ | 5,669 | $ | 5,571 | $ | 5,476 | |||||
Short-Term Borrowings
The Company also has certain other credit arrangements to borrow funds on a short-term basis with interest at current market rates. There were no material short-term borrowings outstanding under such other credit arrangements as of December 31, 2014. As of December 31, 2013, there were $0.6 million of short-term borrowings outstanding under such other credit arrangements. The weighted average interest rate on short-term borrowings for 2014 and 2013 was 2.5%.
Debt Issuance Costs
In 2012, the Company incurred $2.4 million in debt issuance costs in connection with the Credit Agreement. These costs have been capitalized and will be amortized over the term of the agreement. Total amortization expense for the years ended December 31, 2014 and 2013, was $1.1 million. Total amortization expense for the year ended December 31, 2012, was $1.3 million, including the $0.2 million write-off of capitalized fees related to the former Revolving Credit Agreement and former Term Loan Agreement.
Interest Payments
Cash payments for interest were $11.9 million, $11.3 million and $10.2 million in 2014, 2013 and 2012, respectively.
86
NOTES TO CONSOLIDATED FINANCIAL STATEMENTS - Continued
For the Years Ended December 31, 2014, 2013 and 2012
12. ACCUMULATED OTHER COMPREHENSIVE INCOME (LOSS)
The components of accumulated other comprehensive income (loss) are shown below:
2014 | 2013 | |||||||
In thousands | ||||||||
Foreign currency translation: | ||||||||
Beginning balance | $ | (14,219 | ) | $ | (16,515 | ) | ||
Net gain/(loss) on foreign currency translation | (3,833 | ) | 2,296 | |||||
Reclassification to net income | (2,624 | ) | — | |||||
Other comprehensive income/(loss), net of tax | (6,457 | ) | 2,296 | |||||
Ending balance | $ | (20,676 | ) | $ | (14,219 | ) | ||
Pension and other post-retirement benefits (a): | ||||||||
Beginning balance | $ | (66,317 | ) | $ | (104,551 | ) | ||
Reclassification to net income | ||||||||
Amortization of prior service cost, net of tax expense of $37 and $38, respectively | 61 | 60 | ||||||
Amortization of net loss, net of tax expense of $1,583 and $3,677, respectively | 2,614 | 5,875 | ||||||
Change in net gain, net of tax benefit (expense) of $25,203 and ($20,218), respectively | (41,622 | ) | 32,299 | |||||
Other comprehensive income/(loss), net of tax | (38,947 | ) | 38,234 | |||||
Ending balance | $ | (105,264 | ) | $ | (66,317 | ) | ||
Derivative instruments (b): | ||||||||
Beginning balance | $ | (585 | ) | $ | (524 | ) | ||
Net loss on derivative instruments, net of tax benefit of $162 and $104, respectively | (268 | ) | (172 | ) | ||||
Reclassification to net income, net of tax expense of $323 and $66, respectively | 532 | 111 | ||||||
Other comprehensive income/(loss), net of tax | 264 | (61 | ) | |||||
Ending balance | $ | (321 | ) | $ | (585 | ) | ||
Total accumulated other comprehensive income (loss) | $ | (126,261 | ) | $ | (81,121 | ) | ||
(a) These accumulated other comprehensive income components are included in the computation of net periodic pension cost (see Note 14, Pension Plans for additional information)
(b) See Note 6, Derivative Financial Instruments, for additional information regarding our derivative instruments.
87
NOTES TO CONSOLIDATED FINANCIAL STATEMENTS - Continued
For the Years Ended December 31, 2014, 2013 and 2012
13. INCOME TAXES
The components of income tax expense (benefit) associated with continuing operations are as follows:
For the year ended December 31, | ||||||||||||
2014 | 2013 | 2012 | ||||||||||
In thousands | ||||||||||||
Current: | ||||||||||||
Federal | $ | 26,296 | $ | 21,916 | $ | 25,110 | ||||||
State | (796 | ) | 3,731 | 1,627 | ||||||||
Foreign | 905 | 1,768 | 1,123 | |||||||||
26,405 | 27,415 | 27,860 | ||||||||||
Deferred: | ||||||||||||
Federal | 5,256 | 5,688 | (455 | ) | ||||||||
State | (380 | ) | (270 | ) | 915 | |||||||
Foreign | (559 | ) | (1,245 | ) | (1,572 | ) | ||||||
4,317 | 4,173 | (1,112 | ) | |||||||||
Total | $ | 30,722 | $ | 31,588 | $ | 26,748 | ||||||
The tax effects of temporary differences that give rise to deferred tax assets and liabilities are presented below:
At December 31, | ||||||||
2014 | 2013 | |||||||
In thousands | ||||||||
Deferred tax assets: | ||||||||
Deferred employee benefits | $ | 75,026 | $ | 53,108 | ||||
Inventories | 10,332 | 13,797 | ||||||
Tax loss and credit carryforwards | 9,895 | 7,540 | ||||||
Long-term contracts | 3,477 | 6,345 | ||||||
Accrued liabilities and other items | 11,627 | 11,295 | ||||||
Total deferred tax assets | 110,357 | 92,085 | ||||||
Deferred tax liabilities: | ||||||||
Property, plant and equipment | (15,666 | ) | (17,741 | ) | ||||
Intangibles | (29,693 | ) | (28,798 | ) | ||||
Other items | (3,096 | ) | (4,382 | ) | ||||
Total deferred tax liabilities | (48,455 | ) | (50,921 | ) | ||||
Net deferred tax assets before valuation allowance | 61,902 | 41,164 | ||||||
Valuation allowance | (4,694 | ) | (4,657 | ) | ||||
Net deferred tax assets after valuation allowance | $ | 57,208 | $ | 36,507 | ||||
There was no material net change in the valuation allowance from December 31, 2013, to December 31, 2014, with the balance being $4.7 million at each date. Valuation allowances reduced the deferred tax asset attributable to state loss and credit carryforwards to an amount that, based upon all available information, is more likely than not to be realized. Reversal of the valuation allowance is contingent upon the recognition of future taxable income in the respective jurisdictions or changes in circumstances which cause the realization of the benefits of the carryforwards to become more likely than not.
A portion of the net deferred tax assets, $2.7 million, is related to a capital loss recorded on the disposition of the Company's Distribution segment’s Mexico operations. The realization of these benefits is dependent in part on future taxable capital gains and tax planning strategies designed to realize the benefit associated with the capital loss. All remaining U.S. foreign tax credit carryforwards have been fully utilized as of December 31, 2014. State carryforwards are in numerous jurisdictions with varying lives.
88
NOTES TO CONSOLIDATED FINANCIAL STATEMENTS - Continued
For the Years Ended December 31, 2014, 2013 and 2012
13. INCOME TAXES (CONTINUED)
No valuation allowance has been recorded against the other deferred tax assets because the Company believes that these deferred tax assets will, more likely than not, be realized. This determination is based largely upon the Company's earnings history and its anticipated future taxable income. In addition, the Company has the ability to offset deferred tax assets against deferred tax liabilities created for such items as depreciation and amortization.
Pre-tax income (loss) from foreign operations amounted to $(2.3) million, $(3.0) million and $1.4 million in 2014, 2013 and 2012, respectively. U.S. income taxes have not been provided on $26.6 million of undistributed earnings of foreign subsidiaries since it is the Company’s intention to permanently reinvest such earnings or to distribute them only when it is tax efficient to do so. It is impracticable to estimate the total tax liability, if any, that would be created by the future distribution of these earnings.
The provision for income taxes associated with continuing operations differs from that computed at the federal statutory corporate tax rate as follows:
For the year ended December 31, | ||||||||||||
2014 | 2013 | 2012 | ||||||||||
In thousands | ||||||||||||
Federal tax at 35% statutory rate | $ | 33,776 | $ | 31,729 | $ | 27,893 | ||||||
State income taxes, net of federal benefit | (765 | ) | 2,250 | 1,652 | ||||||||
Tax effect of: | ||||||||||||
Section 199 Manufacturing deduction | (2,000 | ) | (2,200 | ) | (1,400 | ) | ||||||
Other, net | (289 | ) | (191 | ) | (1,397 | ) | ||||||
Income tax expense | $ | 30,722 | $ | 31,588 | $ | 26,748 | ||||||
The Company records a benefit for uncertain tax positions in the financial statements only when it determines it is more likely than not that such a position will be sustained upon examination by taxing authorities. Unrecognized tax benefits represent the difference between the position taken and the benefit reflected in the financial statements. On December 31, 2014, 2013 and 2012 the total liability for unrecognized tax benefits was $2.4 million, $2.3 million and $3.9 million, respectively (including interest and penalties of $0.3 million in 2014 and $0.6 million in 2013 and 2012). The change in the liability for 2014, 2013 and 2012 is explained as follows:
2014 | 2013 | 2012 | ||||||||||
In thousands | ||||||||||||
Balance at January 1 | $ | 2,302 | $ | 3,886 | $ | 4,388 | ||||||
Additions based on current year tax positions | 512 | 364 | 258 | |||||||||
Changes for tax positions of prior years | 33 | (907 | ) | 113 | ||||||||
Settlements | (165 | ) | (264 | ) | (82 | ) | ||||||
Additions due to acquired business | — | 414 | — | |||||||||
Reductions due to lapses in statutes of limitation | (241 | ) | (1,191 | ) | (791 | ) | ||||||
Balance at December 31 | $ | 2,441 | $ | 2,302 | $ | 3,886 | ||||||
Included in unrecognized tax benefits at December 31, 2014, were items approximating $1.7 million that, if recognized, would favorably affect the Company’s effective tax rate in future periods. The Company files tax returns in numerous U.S. and foreign jurisdictions, with returns subject to examination for varying periods, but generally back to and including 2009. During 2014, 2013 and 2012, $0.1 million or less of interest and penalties was recognized each year as a component of income tax expense. It is the Company’s policy to record interest and penalties on unrecognized tax benefits as income taxes.
Cash payments for income taxes, net of refunds, were $22.8 million, $33.1 million, and $26.9 million in 2014, 2013 and 2012, respectively.
89
NOTES TO CONSOLIDATED FINANCIAL STATEMENTS - Continued
For the Years Ended December 31, 2014, 2013 and 2012
14. PENSION PLANS
The Company has a non-contributory qualified defined benefit pension plan (the “Qualified Pension Plan”). On February 23, 2010, the Company’s Board of Directors approved an amendment to the Qualified Pension Plan that, among other things, closed the Qualified Pension Plan to all new hires on or after March 1, 2010, and changed the benefit calculation for existing employees related to pay and years of service. Specifically, changes in pay were taken into account for benefit calculation purposes until the end of calendar year 2010, the benefit formula was improved to use the highest five years out of the last ten years of service up to December 31, 2010, whether consecutive or not, and years of service will continue to be added for purposes of the benefit calculations through December 31, 2015, with no further accrual of benefits for service thereafter except for vesting purposes.
The Company also has a Supplemental Employees’ Retirement Plan (“SERP”), which is considered a non-qualified pension plan. The SERP provides certain key executives, whose compensation is in excess of the limitations imposed by federal law on the qualified defined benefit pension plan, with supplemental benefits based upon eligible earnings, years of service and age at retirement. During 2010, the Company's Board of Directors also approved an amendment to the SERP that made changes consistent with the pension plan amendment except that the SERP already provided for the use of non-consecutive years of service for benefit calculation purposes and there was no provision needed regarding limitations on future participation because executives already had to be approved for SERP participation by the Board's Personnel & Compensation Committee (the "Committee") and the Board of Directors. The Committee and the Board have not approved any new participants to the SERP since February 28, 2010, and do not intend to do so at any time in the future. The measurement date for both these plans is December 31.
Obligations and Funded Status
The changes in the actuarial present value of the projected benefit obligation and fair value of plan assets are as follows:
For the year ended December 31, | ||||||||||||||||
Qualified Pension Plan | SERP | |||||||||||||||
2014 | 2013 | 2014 | 2013 | |||||||||||||
In thousands | ||||||||||||||||
Projected benefit obligation at beginning of year | $ | 641,235 | $ | 706,356 | $ | 9,910 | $ | 12,326 | ||||||||
Service cost | 11,759 | 14,347 | 256 | 340 | ||||||||||||
Interest cost | 28,835 | 25,596 | 342 | 311 | ||||||||||||
Actuarial liability (gain) loss (a) | 84,848 | (78,609 | ) | 660 | (458 | ) | ||||||||||
Benefit payments | (28,398 | ) | (26,455 | ) | (819 | ) | (2,291 | ) | ||||||||
(Curtailment) / Settlement | — | — | — | (318 | ) | |||||||||||
Projected benefit obligation at end of year | $ | 738,279 | $ | 641,235 | $ | 10,349 | $ | 9,910 | ||||||||
Fair value of plan assets at beginning of year | $ | 555,400 | $ | 557,653 | $ | — | $ | — | ||||||||
Actual return on plan assets | 59,731 | 14,202 | — | — | ||||||||||||
Employer contributions | 10,000 | 10,000 | 819 | 2,291 | ||||||||||||
Benefit payments | (28,398 | ) | (26,455 | ) | (819 | ) | (2,291 | ) | ||||||||
Fair value of plan assets at end of year | $ | 596,733 | $ | 555,400 | $ | — | $ | — | ||||||||
Funded status at end of year | $ | (141,546 | ) | $ | (85,835 | ) | $ | (10,349 | ) | $ | (9,910 | ) | ||||
Accumulated benefit obligation | $ | 738,279 | $ | 641,235 | $ | 10,349 | $ | 9,910 | ||||||||
(a) The actuarial liability (gain)/loss amount for the qualified pension plan for 2014 and 2013 is principally due to the effect of changes in the discount rate. Additionally, in 2014 a new set of mortality tables was issued by the Society of Actuaries ("SOA"), which impacted the valuation of the Company's obligations under the qualified pension plan and SERP.
90
NOTES TO CONSOLIDATED FINANCIAL STATEMENTS - Continued
For the Years Ended December 31, 2014, 2013 and 2012
14. PENSION PLANS (CONTINUED)
Obligations and Funded Status - continued
The Company has recorded liabilities related to our qualified pension plan and SERP as follows:
At December 31, | ||||||||||||||||
Qualified Pension Plan | SERP | |||||||||||||||
2014 | 2013 | 2014 | 2013 | |||||||||||||
In thousands | ||||||||||||||||
Current liabilities (a) | $ | — | $ | — | $ | (531 | ) | $ | (819 | ) | ||||||
Noncurrent liabilities | (141,546 | ) | (85,835 | ) | (9,818 | ) | (9,091 | ) | ||||||||
Total | $ | (141,546 | ) | $ | (85,835 | ) | $ | (10,349 | ) | $ | (9,910 | ) | ||||
(a) The current liabilities are included in other accruals and payables on the Consolidated Balance Sheets.
Certain amounts included in accumulated other comprehensive income on the Consolidated Balance Sheets represent costs that will be recognized as components of pension cost in future periods. These consist of:
At December 31, | ||||||||||||||||
Qualified Pension Plan | SERP | |||||||||||||||
2014 | 2013 | 2014 | 2013 | |||||||||||||
In thousands | ||||||||||||||||
Unrecognized (gain) or loss | $ | 167,329 | $ | 105,269 | $ | 1,609 | $ | 1,040 | ||||||||
Unrecognized prior service cost | 57 | 156 | — | — | ||||||||||||
Amount included in accumulated other comprehensive income | $ | 167,386 | $ | 105,425 | $ | 1,609 | $ | 1,040 | ||||||||
The amount of unrecognized loss and prior service cost for the qualified pension plan and the SERP, respectively, that will be amortized from accumulated other comprehensive income into net periodic benefit cost over the next year is estimated to be $9.6 million and $0.2 million.
91
NOTES TO CONSOLIDATED FINANCIAL STATEMENTS - Continued
For the Years Ended December 31, 2014, 2013 and 2012
14. PENSION PLANS (CONTINUED)
Obligations and Funded Status - continued
The pension plan net periodic benefit costs on the Consolidated Statements of Operations and other amounts recognized in other comprehensive income (loss) on the Consolidated Statements of Comprehensive Income and Consolidated Statements of Shareholders’ Equity were computed using the projected unit credit actuarial cost method and included the following components:
For the year ended December 31, | ||||||||||||||||||||||||
Qualified Pension Plan | SERP | |||||||||||||||||||||||
2014 | 2013 | 2012 | 2014 | 2013 | 2012 | |||||||||||||||||||
In thousands | ||||||||||||||||||||||||
Service cost for benefits earned during the year | $ | 11,759 | $ | 14,347 | $ | 14,075 | $ | 256 | $ | 340 | $ | 380 | ||||||||||||
Interest cost on projected benefit obligation | 28,835 | 25,596 | 26,312 | 342 | 311 | 408 | ||||||||||||||||||
Expected return on plan assets | (41,047 | ) | (41,347 | ) | (37,878 | ) | — | — | — | |||||||||||||||
Amortization of prior service cost | 98 | 98 | 98 | — | — | — | ||||||||||||||||||
Recognized net loss | 4,106 | 9,291 | 7,844 | 91 | 261 | 169 | ||||||||||||||||||
Additional amount recognized due to curtailment/settlement | — | — | — | — | 276 | 198 | ||||||||||||||||||
Net pension benefit cost | $ | 3,751 | $ | 7,985 | $ | 10,451 | $ | 689 | $ | 1,188 | $ | 1,155 | ||||||||||||
Change in prior service cost | $ | — | $ | — | $ | — | $ | — | $ | — | $ | — | ||||||||||||
Change in net gain or loss | 66,165 | (51,465 | ) | 20,365 | 660 | (1,052 | ) | 815 | ||||||||||||||||
Amortization of prior service cost | (98 | ) | (98 | ) | (98 | ) | — | — | — | |||||||||||||||
Amortization of net loss | (4,106 | ) | (9,291 | ) | (7,844 | ) | (91 | ) | (261 | ) | (169 | ) | ||||||||||||
Total recognized in other comprehensive income (loss) | $ | 61,961 | $ | (60,854 | ) | $ | 12,423 | $ | 569 | $ | (1,313 | ) | $ | 646 | ||||||||||
Total recognized in net periodic benefit cost and other comprehensive income (loss) | $ | 65,712 | $ | (52,869 | ) | $ | 22,874 | $ | 1,258 | $ | (125 | ) | $ | 1,801 | ||||||||||
The following tables show the amount of the contributions made to the Qualified Pension Plan and SERP during each period and the amount of contributions the Company expects to make during 2015:
Qualified Pension Plan | SERP | |||||||||||||||
2014 | 2013 | 2014 | 2013 | |||||||||||||
In thousands | ||||||||||||||||
Contributions | $ | 10,000 | $ | 10,000 | $ | 819 | $ | 2,291 | ||||||||
Qualified Pension Plan (a) | SERP | |||||||
In thousands | ||||||||
Expected contributions during 2015 | $ | 10,000 | $ | 531 | ||||
(a) As of the date of this report, the Company has already contributed this $10.0 million to the qualified pension plan; no further contributions are expected to be made in 2015.
92
NOTES TO CONSOLIDATED FINANCIAL STATEMENTS - Continued
For the Years Ended December 31, 2014, 2013 and 2012
14. PENSION PLANS (CONTINUED)
Obligations and Funded Status - continued
Expected future benefit payments, which reflect expected future service, are as follows:
Qualified Pension Plan | SERP | |||||||
In thousands | ||||||||
2015 | $ | 30,713 | $ | 531 | ||||
2016 | 32,441 | 522 | ||||||
2017 | 34,053 | 3,014 | ||||||
2018 | 35,470 | 500 | ||||||
2019 | 37,085 | 488 | ||||||
2020-2024 | 206,438 | 4,407 | ||||||
In October 2014, the SOA finalized a new set of mortality tables. Mortality is a key assumption in developing actuarial estimates, and therefore could significantly impact the valuation of the Company's obligations under the qualified pension plan and SERP. The Company reviewed the new mortality data at December 31, 2014. Based on the size and demographics of the plan's participant population, the Company determined RP-2000 Scale AA Generational based mortality table is the most appropriate assumption.
Prior to 2014, the Company used the Citigroup Discount Yield Curve in generating its discount rate assumption. As part of the Company's annual evaluation of its assumptions, the Citigroup Above Median Double-A Curve was deemed to be a more appropriate basis for generating our discount rate assumption, as the future cash flows of the plan are more closely aligned to the Above Median Double-A Curve. The actuarial assumptions used in determining benefit obligations of the pension plans are as follows:
At December 31, | ||||||||||||
Qualified Pension Plan | SERP | |||||||||||
2014 | 2013 | 2014 | 2013 | |||||||||
Discount rate | 3.80 | % | 4.60 | % | 3.15 | % | 3.60 | % | ||||
The actuarial assumptions used in determining the net periodic benefit cost of the pension plans are as follows:
For the year ended December 31, | ||||||||||||
Qualified Pension Plan | SERP | |||||||||||
2014 | 2013 | 2014 | 2013 | |||||||||
Discount rate | 4.60 | % | 3.70 | % | 3.60 | % | 2.85 | % | ||||
Expected return on plan assets | 7.50 | % | 7.50 | % | N/A | N/A | ||||||
Average rate of increase in compensation levels | N/A | N/A | N/A | N/A | ||||||||
93
NOTES TO CONSOLIDATED FINANCIAL STATEMENTS - Continued
For the Years Ended December 31, 2014, 2013 and 2012
14. PENSION PLANS (CONTINUED)
Qualified Pension Plan Assets
The expected return on plan assets rate was determined based upon historical returns adjusted for estimated future market fluctuations. For 2014 and 2013, the expected rate of return on plan assets was 7.5%. During 2014, the actual return on pension plan assets, net of expenses, was 11.4%.
Plan assets are invested in a diversified portfolio consisting of equity and fixed income securities. The investment goals for pension plan assets are to improve and/or maintain the Plan’s funded status by generating long-term asset returns that exceed the rate of growth of the Plan’s liabilities. The Plan invests assets in a manner that seeks to (a) maximize return within reasonable and prudent levels of risk of loss of funded status; and (b) maintain sufficient liquidity to meet benefit payment obligations and other periodic cash flow requirements on a timely basis. The return generation/liability matching asset allocation ratio is currently 48.5%/51.5%. As the plan’s funded status changes, the pension plan’s Administrative Committee (the management committee that is responsible for plan administration) will act through an immediate or gradual process, as appropriate, to reallocate assets.
Under the current investment policy no Investment Manager may invest in investments deemed illiquid by the Investment Manager at the time of purchase, development programs, real estate, mortgages or private equities or securities of Kaman Corporation without prior written authorization from the Finance Committee of the Board of Directors. In addition, with the exception of U.S. Government securities, managers’ holdings in the securities of any one issuer, at the time of purchase, may not exceed 7.5% of the total market value of that manager’s account.
The pension plan assets are valued at fair value. The following is a description of the valuation methodologies used for the investments measured at fair value, including the general classification of such instruments pursuant to the valuation hierarchy.
Short-term Investments – This investment category consists of cash and cash equivalents and futures and options contracts. Cash and cash equivalents are comprised of investments with maturities of three months or less when purchased, including certain short-term fixed-income securities, and are classified as Level 1 investments. Futures contracts and options contracts requiring the investment managers to receive from or pay to the broker an amount of cash equal to daily fluctuations are included in short-term investments and are classified as Level 2 investments.
Corporate Stock – This investment category consists of primarily domestic common stock issued by U.S. corporations. Common shares are traded actively on exchanges and price quotes for these shares are readily available. Holdings of corporate stock are classified as Level 1 investments.
Mutual Funds –Mutual funds are traded actively on public exchanges. The share prices for these mutual funds are published at the close of each business day. Holdings of mutual funds are classified as Level 1 investments.
Common Trust Funds – Common trust funds are comprised of shares or units in commingled funds that are not publicly traded. The values of the commingled funds are not publicly quoted and must trade through a broker. For equity and fixed-income commingled funds traded through a broker, the fund administrator values the fund using the net asset value (“NAV”) per fund share, derived from the value of the underlying assets. The underlying assets in these funds (equity securities, fixed income securities, and commodity-related securities) are publicly traded on exchanges and price quotes for the assets held by these funds are readily available. Holdings of common trust funds are classified as Level 2 investments.
Fixed Income Securities - For fixed income securities, multiple prices and price types are obtained from pricing vendors whenever possible, which enables cross-provider validations. A primary price source is identified based on asset type, class or issue for each security. The fair values of fixed income securities are based on evaluated prices that reflect observable market information, such as actual trade information of similar securities, adjusted for observable differences, and are categorized as Level 2. These securities are primarily investment grade securities.
94
NOTES TO CONSOLIDATED FINANCIAL STATEMENTS - Continued
For the Years Ended December 31, 2014, 2013 and 2012
14. PENSION PLANS (CONTINUED)
Plan Assets for Qualified Pension Plan - continued
The fair values of the Company’s qualified pension plan assets at December 31, 2014 and 2013, are as follows:
Total Carrying Value at December 31, 2014 | Quoted prices in active markets (Level 1) | Significant other observable inputs (Level 2) | Significant unobservable inputs (Level 3) | |||||||||||||
In thousands | ||||||||||||||||
Short-term investments: | ||||||||||||||||
Cash and cash equivalents | $ | 12,063 | $ | 12,063 | $ | — | $ | — | ||||||||
Futures contracts | — | — | — | — | ||||||||||||
Fixed income securities: | ||||||||||||||||
U.S. Government and agency securities (a) | 83,915 | — | 83,915 | — | ||||||||||||
Bonds: | ||||||||||||||||
Corporate fixed income | 112,811 | — | 112,811 | — | ||||||||||||
Foreign fixed income | — | — | — | — | ||||||||||||
Other fixed income (b) | 2,080 | — | 2,080 | — | ||||||||||||
Mutual funds | 93,659 | 93,659 | — | — | ||||||||||||
Common trust funds | 240,438 | — | 240,438 | — | ||||||||||||
Corporate stock | 49,802 | 49,802 | — | — | ||||||||||||
Subtotal | $ | 594,768 | $ | 155,524 | $ | 439,244 | $ | — | ||||||||
Accrued income/expense | 1,965 | 47 | 1,918 | — | ||||||||||||
Total | $ | 596,733 | $ | 155,571 | $ | 441,162 | $ | — | ||||||||
95
NOTES TO CONSOLIDATED FINANCIAL STATEMENTS - Continued
For the Years Ended December 31, 2014, 2013 and 2012
14. PENSION PLANS (CONTINUED)
Plan Assets for Qualified Pension Plan - continued
Total Carrying Value at December 31, 2013 | Quoted prices in active markets (Level 1) | Significant other observable inputs (Level 2) | Significant unobservable inputs (Level 3) | |||||||||||||
In thousands | ||||||||||||||||
Short term investments: | ||||||||||||||||
Cash and cash equivalents | $ | 23,668 | $ | 23,668 | $ | — | $ | — | ||||||||
Futures contracts | (2,196 | ) | — | (2,196 | ) | — | ||||||||||
Fixed income securities: | ||||||||||||||||
US Government and agency securities (a) | 61,592 | — | 61,592 | — | ||||||||||||
Bonds: | ||||||||||||||||
Corporate fixed income | 81,601 | — | 81,601 | — | ||||||||||||
Foreign fixed income | 10,291 | — | 10,291 | — | ||||||||||||
Other fixed income (b) | 3,467 | — | 3,467 | — | ||||||||||||
Mutual funds | 71,244 | 71,244 | — | — | ||||||||||||
Common trust funds | 256,949 | — | 256,949 | — | ||||||||||||
Corporate stock | 47,035 | 47,035 | — | — | ||||||||||||
Subtotal | $ | 553,651 | $ | 141,947 | $ | 411,704 | $ | — | ||||||||
Accrued income | 1,749 | 39 | 1,710 | — | ||||||||||||
Total | $ | 555,400 | $ | 141,986 | $ | 413,414 | $ | — | ||||||||
(a) This category represents investments in debt securities issued by the U.S. Treasury, other U.S. government corporations and agencies, states and municipalities.
(b) This category primarily represents investments in commercial and residential mortgage-backed securities.
Derivatives are primarily used to manage risk and gain asset class exposure while still maintaining liquidity. Derivative instruments mainly consist of equity futures and interest rate futures.
Other Plans
The Company also maintains a Defined Contribution Plan that has been adopted by most of its U.S. subsidiaries. Employees of the adopting employers who meet the eligibility requirements of the plan may participate. Employer matching contributions are made to the plan based on a percentage of each participant’s pre-tax contribution. For each dollar that a participant contributes, up to 5% of compensation, participating subsidiaries make employer contributions of one dollar. Employer contributions to the plan totaled $11.2 million, $10.4 million and $9.3 million in 2014, 2013 and 2012, respectively.
One of the Company’s acquired U.S. subsidiaries maintains a separate defined contribution plan for its eligible employees. Employer matching contributions are made on a discretionary basis. Additionally, one of our foreign subsidiaries maintains a defined benefit plan of its own for its local employees. The net pension liability associated with these plans as of December 31, 2014, of $0.3 million is included in other accruals and payables on the Consolidated Balance Sheet.
96
NOTES TO CONSOLIDATED FINANCIAL STATEMENTS - Continued
For the Years Ended December 31, 2014, 2013 and 2012
15. OTHER LONG-TERM LIABILITIES
Other long-term liabilities consist of the following:
At December 31, | ||||||||
2014 | 2013 | |||||||
In thousands | ||||||||
Supplemental employees' retirement plan ("SERP") | $ | 9,818 | $ | 9,091 | ||||
Deferred compensation | 14,601 | 13,472 | ||||||
Long-term incentive plan | 7,527 | 7,051 | ||||||
Noncurrent income taxes payable | 2,300 | 3,332 | ||||||
Environmental remediation liability | 7,370 | 8,256 | ||||||
Other | 4,031 | 5,836 | ||||||
Total | $ | 45,647 | $ | 47,038 | ||||
Disclosures regarding the assumptions used in the determination of the SERP liabilities are included in Note 14, Pension Plans. Discussions of our environmental remediation liabilities are in Note 10, Environmental Costs, and Note 16, Commitments and Contingencies.
The Company maintains a non-qualified deferred compensation plan for certain of its employees as well as a non-qualified deferred compensation plan for its Board of Directors. Generally, participants in these plans have the ability to defer a certain amount of their compensation, as defined in the agreement. The deferred compensation liability will be paid out either upon retirement or as requested based upon certain terms in the agreements and in accordance with Internal Revenue Code Section 409A.
16. COMMITMENTS AND CONTINGENCIES
Asset Retirement Obligations
The Company has unrecorded Asset Retirement Obligation’s (“AROs”) that are conditional upon certain events. These AROs generally include the removal and disposition of non-friable asbestos. The Company has not recorded a liability for these conditional AROs at December 31, 2014, because the Company does not currently believe there is a reasonable basis for estimating a date or range of dates for major renovation or demolition of these facilities. In reaching this conclusion, the Company considered the historical performance of each facility and has taken into account factors such as planned maintenance, asset replacements and upgrades, which, if conducted as in the past, can extend the physical lives of the facilities indefinitely. The Company also considered the possibility of changes in technology and risk of obsolescence in arriving at its conclusion.
The Company currently leases various properties under leases that give the lessor the right to make the determination as to whether the lessee must return the premises to their original condition, except for normal wear and tear. The Company does not normally make substantial modifications to leased property, and many of the Company's leases either require lessor approval of planned improvements or transfer ownership of such improvements to the lessor at the termination of the lease. Historically we have not incurred significant costs to return leased premises to their original condition.
Operating Leases
Rent commitments under various leases for office space, warehouses, land and buildings expire at varying dates from January 2015 to November 2023. The terms of most of these leases are in the range of 3 to 5 years. Some of the Company’s leases have rent escalations, rent holidays or contingent rent that are recognized on a straight-line basis over the entire lease term. Material leasehold improvements and other landlord incentives are amortized over the shorter of their economic lives or the lease term, including renewal periods, if reasonably assured. Certain annual rentals are subject to renegotiation, with certain leases renewable for varying periods.
Lease periods for machinery and equipment range from 1 to 5 years.
97
NOTES TO CONSOLIDATED FINANCIAL STATEMENTS - Continued
For the Years Ended December 31, 2014, 2013 and 2012
16. COMMITMENTS AND CONTINGENCIES (CONTINUED)
Operating Leases - continued
Substantially all real estate taxes, insurance and maintenance expenses associated with leased facilities are obligations of the Company. It is expected that in the normal course of business leases that expire will be renewed or replaced by leases on other similar property.
The following minimum future rental payments are required under operating leases that have initial or remaining non-cancellable lease terms in excess of one year as of December 31, 2014:
In thousands | |||
2015 | $ | 22,352 | |
2016 | 16,902 | ||
2017 | 10,357 | ||
2018 | 5,206 | ||
2019 | 3,856 | ||
Thereafter | 8,312 | ||
Total | $ | 66,985 | |
Lease expense for all operating leases, including leases with terms of less than one year, amounted to $25.0 million, $24.6 million and $23.6 million for 2014, 2013 and 2012, respectively.
Capital Leases
During 2014, the Company entered into a master leasing agreement with PNC Equipment Finance for financing the purchases of equipment, with total capacity of $5.0 million. Such leases are classified as capital for accounting purposes and are recorded at the present value of the future minimum lease payments at the inception of the lease. Amounts due under capital leases are recorded as liabilities, while assets acquired under capital leases are recorded as equipment. Amortization of assets recorded under capital leases is included in depreciation and amortization expense. As of December 31, 2014, commencement of leases under this program has not yet occurred.
Legal Matters
Wichita Subpoena Matter
As previously disclosed, the U.S. District Court for the District of Kansas issued a grand jury subpoena in 2011 to Plastic Fabricating Company, Inc. (“PlasticFab”), an indirect wholly owned subsidiary of the Company now known as Kaman Composites - Wichita, Inc., regarding a government investigation of record keeping associated with the manufacture of certain composite parts at PlasticFab's facility located in Wichita, Kansas. The subpoena required information related to the period January 1, 2006, through June 30, 2008. On October 21, 2014, the U.S. Attorney's Office for the District of Kansas and PlasticFab entered into a civil settlement agreement pursuant to which PlasticFab, without admitting any wrongdoing, agreed to pay $0.5 million, all of which was previously accrued. The U.S. Attorney's Office for the District of Kansas has also informed PlasticFab that it is closing its files and will conduct no further investigation relating to this matter.
Other Matters
Revenue Sharing Agreement with the Commonwealth of Australia
During the third quarter of 2014, the Company settled its revenue sharing agreement with the Commonwealth of Australia with respect to the eleven Australia SH-2G(A) (now designated SH-2G(I)) aircraft, spare parts, and full mission flight simulator, and made a final payment of $5.3 million. As a result, no further revenue sharing payments will be due to the Commonwealth of Australia as the Company sells the remainder of the SH-2G(I) inventory. Over the course of the revenue sharing agreement, net of the benefits derived from our hedging arrangements, the Company paid approximately $32.1 million to the Commonwealth of Australia.
98
NOTES TO CONSOLIDATED FINANCIAL STATEMENTS - Continued
For the Years Ended December 31, 2014, 2013 and 2012
16. COMMITMENTS AND CONTINGENCIES (CONTINUED)
Other Matters - continued
Moosup
During the third quarter of 2014, the Company sold its former manufacturing facility in Moosup, Connecticut to TD Development, LLC. In connection with the sale, the Company will contribute $4.0 million in cash to an escrow account over a four-year period to fund environmental remediation work that is expected to be performed on the site. The purchase and sale agreement provides that TD Development is responsible for any costs in excess of the $4.0 million contributed by the Company. The first of these payments, $0.8 million, was made at the closing of the transaction. The Company currently has $3.2 million accrued representing the remainder due to TD Development of which $0.8 million is included in other accruals and payables and the balance is included with other long-term environmental remediation liabilities.
New Hartford
In connection with sale of the Company’s Music segment in 2007, the Company assumed responsibility for meeting certain requirements of the Connecticut Transfer Act (the “Transfer Act”) that applied to our transfer of the New Hartford, Connecticut, facility leased by that segment for guitar manufacturing purposes (“Ovation”). Under the Transfer Act, those responsibilities essentially consist of assessing the site's environmental conditions and remediating environmental impairments, if any, caused by Ovation's operations prior to the sale. The site is a multi-tenant industrial park, in which Ovation and other unrelated entities lease space. The environmental assessment, which began in 2008, is still in process.
The Company's estimate of its portion of the cost to assess the environmental conditions and remediate this site is $2.2 million, unchanged from previously reported estimates, all of which has been accrued. The total amount paid to date in connection with these environmental remediation activities is $0.5 million. A portion ($0.5 million) of the accrual related to this property is included in other accruals and payables and the balance is included in other long-term liabilities. The remaining balance of the accrual reflects the total anticipated cost of completing these environmental remediation activities. Although it is reasonably possible that additional costs will be paid in connection with the resolution of this matter, the Company is unable to estimate the amount of such additional costs, if any, at this time.
Bloomfield
In connection with the Company’s 2008 purchase of the portion of the Bloomfield campus that Kaman Aerospace Corporation had leased from NAVAIR, the Company assumed responsibility for environmental remediation at the facility as may be required under the Transfer Act and continues the effort to define the scope of the remediation that will be required by the Connecticut Department of Environmental Protection ("CTDEP"). The assumed environmental liability of $10.3 million was determined by taking the undiscounted estimated remediation liability of $20.8 million and discounting it at a rate of 8%. This remediation process will take many years to complete. The total amount paid to date in connection with these environmental remediation activities is $8.9 million. A portion ($1.7 million) of the accrual related to this property is included in other accruals and payables, and the balance is included in other long-term liabilities. Although it is reasonably possible that additional costs will be paid in connection with the resolution of this matter, the Company is unable to estimate the amount of such additional costs, if any, at this time.
United Kingdom
In connection with the purchase of U.K. Composites, the Company accrued, at the time of acquisition, £1.6 million for environmental compliance at the facilities. The remaining balance of the accrual at December 31, 2014, was £0.1 million, with £1.2 million having been paid to date in connection with these environmental remediation activities and £0.4 million released to income. The U.S. dollar equivalent of the remaining environmental compliance liability as of December 31, 2014, is $0.1 million, which is included in other accruals and payables. The Company continues to assess the work that may be required, which may result in a change to this accrual. Although it is reasonably possible that additional costs will be paid in connection with the resolution of this matter, the Company is unable to estimate the amount of such additional costs, if any, at this time.
99
NOTES TO CONSOLIDATED FINANCIAL STATEMENTS - Continued
For the Years Ended December 31, 2014, 2013 and 2012
17. COMPUTATION OF EARNINGS PER SHARE
The computation of basic earnings per share is based on net earnings divided by the weighted average number of shares of common stock outstanding for each year. The computation of diluted earnings per share includes the common stock equivalency of dilutive options granted to employees under the Stock Incentive Plan.
Excluded from the diluted earnings per share calculation for the years ended December 31, 2014, 2013 and 2012, respectively, are 342,994, 391,717 and 338,248 shares associated with equity awards granted to employees that are anti-dilutive based on the average stock price.
For the years ended December 31, 2014, 2013 and 2012, shares issuable under the Convertible Notes that were dilutive during the period were included in the calculation of earnings per share as the conversion price for the Convertible Notes was less than the average share price of the Company's stock. Excluded from the diluted earnings per share calculation for the years ended December 31, 2014, 2013 and 2012, respectively were 3,411,539, 3,404,626, and 3,396,841 shares, issuable under the warrants sold in connection with the Company’s Convertible Note offering as they would be anti-dilutive. For further information on the Convertible Notes, see Note 11, Debt.
For the Year Ended December 31, | ||||||||||||
2014 | 2013 | 2012 | ||||||||||
In thousands, except per share amounts | ||||||||||||
Earnings from continuing operations | $ | 65,780 | $ | 59,066 | $ | 52,947 | ||||||
Earnings (loss) from discontinued operations, net of tax | (2,924 | ) | (2,386 | ) | 755 | |||||||
Gain (loss) on disposal of discontinued operations, net of tax | (4,984 | ) | 420 | 1,323 | ||||||||
Net earnings | $ | 57,872 | $ | 57,100 | $ | 55,025 | ||||||
Basic: | ||||||||||||
Weighted average number of shares outstanding | 27,053 | 26,744 | 26,425 | |||||||||
Earnings per share from continuing operations | $ | 2.43 | $ | 2.21 | $ | 2.00 | ||||||
Earnings (loss) per share from discontinued operations | (0.11 | ) | (0.09 | ) | 0.03 | |||||||
Earnings (loss) per share from disposal of discontinued operations | (0.18 | ) | 0.02 | 0.05 | ||||||||
Basic earnings per share | $ | 2.14 | $ | 2.14 | $ | 2.08 | ||||||
Diluted: | ||||||||||||
Weighted average number of shares outstanding | 27,053 | 26,744 | 26,425 | |||||||||
Weighted average shares issuable on exercise of dilutive stock options | 147 | 159 | 162 | |||||||||
Weighted average shares issuable on exercise of convertible notes | 577 | 240 | 35 | |||||||||
Total | 27,777 | 27,143 | 26,622 | |||||||||
Earnings per share from continuing operations | $ | 2.37 | $ | 2.17 | $ | 1.99 | ||||||
Earnings (loss) per share from discontinued operations | (0.11 | ) | (0.09 | ) | 0.03 | |||||||
Earnings (loss) per share from disposal of discontinued operations | (0.18 | ) | 0.02 | 0.05 | ||||||||
Diluted earnings per share | $ | 2.08 | $ | 2.10 | $ | 2.07 | ||||||
100
NOTES TO CONSOLIDATED FINANCIAL STATEMENTS - Continued
For the Years Ended December 31, 2014, 2013 and 2012
18. SHARE-BASED ARRANGEMENTS
General
The Company accounts for stock options, restricted stock awards, restricted stock units and performance shares as equity awards and measures the cost of all share-based payments, including stock options, at fair value on the grand date and recognizes this cost in the statement of operations. The Company also has an employee stock purchase plan which is accounted for as a liability award.
Compensation expense for stock options, restricted stock awards and restricted stock units is recognized on a straight-line basis over the vesting period of the awards. Share-based compensation expense recorded for the years ended December 31, 2014, 2013, and 2012 was $5.4 million, $5.0 million, and $5.9 million, respectively.
Stock Incentive Plan
On April 17, 2013, the shareholders of the Company approved the 2013 Management Incentive Plan (the "2013 Plan"), which replaced the 2003 Stock Incentive Plan. The 2013 Plan provides the Company with the ability to use equity-based awards of up to 2,250,000 authorized shares and is designed as a flexible share authorization plan, such that the Company's share authorization is based on the least costly type of award (stock options). Shares issued pursuant to “Full Value Awards” as defined in the 2013 Plan (awards other than stock options or stock appreciation rights which are settled by the issuance of shares, e.g., restricted stock, restricted stock units, performance shares, performance units if settled with stock, or other stock-based awards) count against the 2013 Plan's share authorization at a rate of 3 to 1, while shares issued upon exercise of stock options or stock appreciation rights count against the share authorization at a rate of 1 to 1. This means that every time an option is granted, the authorized pool of shares is reduced by one (1) share and every time a Full Value Award is granted, the authorized pool of shares is reduced by 3 shares. In deriving the valuation ratio used in the 2013 Plan, the Company used the Black Scholes Fair Value model as the basis for determining the approximate value of an option as compared to a "full value share." As of December 31, 2014, there were 1,733,205 shares available for grant under the plan.
LTIP awards provide certain senior executives an opportunity to receive award payments in either stock or cash as determined by the Personnel and Compensation Committee of the Board of Directors in accordance with the Plan, at the end of each performance cycle. For the performance cycle, the Company’s financial results are compared to the Russell 2000 indices for the same periods based upon the following: (a) average return on total capital, (b) earnings per share growth and (c) total return to shareholders. No awards will be payable unless the Company’s performance is at least in the 25th percentile of the designated indices. The maximum award is payable if performance reaches the 75th percentile of the designated indices. Awards are paid out at 100% at the 50th percentile. Awards for performance between the 25th and 75th percentiles are determined by straight-line interpolation. Generally, LTIP awards are paid in cash.
Stock options are granted with an exercise price equal to the average market price of our stock at the date of grant. Stock options and Stock Appreciation Rights ("SARs") granted under the plan generally expire ten years from the date of grant and vest 20% each year over a 5-year period on each of the first five anniversaries of the date of grant. Restricted Stock Awards ("RSAs") are generally granted with restrictions that lapse at the rate of 20% per year over a 5-year period on each of the first five anniversaries of the date of grant. Generally, these awards are subject to forfeiture if a recipient separates from service with the Company.
During the first quarter of 2014, the Company issued stock awards totaling 10,934 shares with market and performance based conditions. The Company measured the cost of these awards based on their fair value at the date of grant to the extent of the probable number of shares to be earned upon vesting. Amortization of this cost will be recorded on a straight-line basis over the requisite service period. Throughout the course of the requisite service period, the Company will monitor the level of achievement compared to the target and adjust the number of shares expected to be earned, and the related compensation expense recorded thereafter, to reflect the updated most probable outcome. Compensation expense for these awards for the year ended December 31, 2014, was not material.
101
NOTES TO CONSOLIDATED FINANCIAL STATEMENTS - Continued
For the Years Ended December 31, 2014, 2013 and 2012
18. SHARE-BASED ARRANGEMENTS (CONTINUED)
Stock Incentive Plan - continued
Stock option activity is as follows:
Options | Weighted average- exercise price | ||||||
Options outstanding at December 31, 2013 | 891,932 | $ | 28.18 | ||||
Granted | 186,885 | 39.22 | |||||
Exercised | (163,245 | ) | 23.21 | ||||
Forfeited or expired | (11,481 | ) | 35.68 | ||||
Options outstanding at December 31, 2014 | 904,091 | $ | 31.26 | ||||
The following table presents information regarding options outstanding as of December 31, 2014:
Weighted-average remaining contractual term - options outstanding (years) | 6.2 | ||
Aggregate intrinsic value - options outstanding (in thousands) | $ | 8,180 | |
Weighted-average exercise price - options outstanding | $ | 31.26 | |
Options exercisable | 415,955 | ||
Weighted-average remaining contractual term - options exercisable (years) | 4.5 | ||
Aggregate intrinsic value - options exercisable (in thousands) | $ | 5,816 | |
Weighted-average exercise price - options exercisable | $ | 26.33 | |
The intrinsic value represents the amount by which the market price of the stock on the measurement date exceeds the exercise price of the option. The intrinsic value of options exercised in 2014, 2013 and 2012 was $2.9 million, $1.9 million and $3.2 million, respectively. The Company currently has an open stock repurchase plan, which would enable the Company to repurchase shares as needed. Since 2008 the Company has generally issued shares related to option exercises and RSAs from its authorized but unissued common stock.
The fair value of each option award is estimated on the date of grant using the Black-Scholes option valuation model. The following table indicates the weighted-average assumptions used in estimating fair value:
2014 | 2013 | 2012 | ||||||||||
Expected option term (years) | 5.1 | 5.2 | 5.4 | |||||||||
Expected volatility | 37.5 | % | 45.5 | % | 46.5 | % | ||||||
Risk-free interest rate | 1.5 | % | 0.9 | % | 0.9 | % | ||||||
Expected dividend yield | 1.7 | % | 2.0 | % | 1.9 | % | ||||||
Per share fair value of options granted | $ | 11.60 | $ | 12.38 | $ | 12.00 | ||||||
The expected term of options granted represents the period of time option grants are expected to be outstanding based upon historical exercise patterns. Forfeitures of options are estimated based upon historical data and are adjusted based upon actual occurrences. The cumulative effect of stock award forfeitures was immaterial. The volatility assumption is based on the historical daily price data of the Company’s stock over a period equivalent to the weighted-average expected term of the options. Management evaluated whether there were factors during that period that were unusual and would distort the volatility figure if used to estimate future volatility and concluded that there were no such factors. The Company relies only on historical volatility since future volatility is expected to be consistent with historical volatility.
The risk-free interest rate assumption is based upon the interpolation of various U.S. Treasury rates determined at the date of option grant. Expected dividends are based upon a historical analysis of our dividend yield over the past year.
102
NOTES TO CONSOLIDATED FINANCIAL STATEMENTS - Continued
For the Years Ended December 31, 2014, 2013 and 2012
18. SHARE-BASED ARRANGEMENTS (CONTINUED)
Stock Incentive Plan - continued
Restricted Stock activity is as follows:
Restricted Stock Awards | Weighted- average grant date fair value | ||||||
Restricted Stock outstanding at December 31, 2013 | 188,647 | $ | 31.23 | ||||
Granted | 111,071 | 39.89 | |||||
Vested | (85,374 | ) | 31.63 | ||||
Forfeited or expired | (17,791 | ) | 33.80 | ||||
Restricted Stock outstanding at December 31, 2014 | 196,553 | $ | 36.29 | ||||
The grant date fair value for restricted stock is the average market price of the unrestricted shares on the date of grant. The total fair value of restricted stock awards vested during 2014, 2013 and 2012 was $4.5 million, $4.6 million and $5.3 million, respectively.
We record a tax benefit and associated deferred tax asset for compensation expense recognized on non-qualified stock options and restricted stock for which we are allowed a tax deduction. For 2014, 2013 and 2012, respectively, we recorded a tax benefit of $1.9 million, $1.7 million and $2.1 million for these two types of compensation expense.
The windfall tax benefit is the tax benefit realized on the exercise of non-qualified stock options and disqualifying dispositions of stock acquired by exercise of incentive stock options and Employee Stock Purchase Plan stock purchases in excess of the deferred tax asset originally recorded. The total windfall tax benefit realized in 2014, 2013, and 2012 was $0.8 million, $0.5 million, and $0.9 million, respectively.
As of December 31, 2014, future compensation costs related to non-vested stock options and restricted stock grants is $8.6 million. The Company anticipates that this cost will be recognized over a weighted-average period of 3.1 years.
Employees Stock Purchase Plan
The Kaman Corporation Employees Stock Purchase Plan (“ESPP”) allows employees to purchase common stock of the Company, through payroll deductions, at 85% of the market value of shares at the time of purchase. The plan provides for the grant of rights to employees to purchase a maximum of 1,500,000 shares of common stock.
During 2014, 76,805 shares were issued to employees at prices ranging from $32.48 to $36.42. During 2013, 85,702 shares were issued to employees at prices ranging from $28.34 to $32.43. During 2012, 90,048 shares were issued to employees at prices ranging from $24.09 to $30.79. At December 31, 2014, there were 388,632 shares available for purchase under the plan.
19. SEGMENT AND GEOGRAPHIC INFORMATION
The Company is organized based upon the nature of its products and services, and is composed of two operating segments each overseen by a segment manager. These segments are reflective of how the Company’s Chief Executive Officer, who is its Chief Operating Decision Maker (“CODM”), reviews operating results for the purposes of allocating resources and assessing performance. The Company has not aggregated operating segments for purposes of identifying reportable segments.
The Distribution segment is a leading power transmission, motion control, and fluid power industrial distributor with operations throughout the United States. Distribution conducts business in the mechanical power transmission and bearings, electrical, automation and control, and fluid power product platforms and provides total solutions from system design and integration to machine parts and value-added services to the national manufacturing industry.
103
NOTES TO CONSOLIDATED FINANCIAL STATEMENTS - Continued
For the Years Ended December 31, 2014, 2013 and 2012
19. SEGMENT AND GEOGRAPHIC INFORMATION (CONTINUED)
The Aerospace segment produces and/or markets widely used proprietary aircraft bearings and components; complex metallic and composite aerostructures for commercial, military and general aviation fixed and rotary wing aircraft; safe and arm solutions for missile and bomb systems for the U.S. and allied militaries; subcontract helicopter work; support for the Company’s SH-2G Super Seasprite maritime helicopters and K-MAX® medium-to-heavy lift helicopters; and engineering services.
Summarized financial information by business segment is as follows:
For the year ended December 31, | ||||||||||||
2014 | 2013 | 2012 | ||||||||||
In thousands | ||||||||||||
Net sales from continuing operations: | ||||||||||||
Distribution | $ | 1,161,992 | $ | 1,039,954 | $ | 982,573 | ||||||
Aerospace (a) | 632,970 | 613,967 | 580,769 | |||||||||
Net sales | $ | 1,794,962 | $ | 1,653,921 | $ | 1,563,342 | ||||||
Operating income: | ||||||||||||
Distribution | $ | 56,765 | $ | 46,206 | $ | 49,316 | ||||||
Aerospace (b) | 108,697 | 102,573 | 89,142 | |||||||||
Net gain (loss) on sale of assets | (233 | ) | (142 | ) | (110 | ) | ||||||
Corporate expense | (54,722 | ) | (45,291 | ) | (46,759 | ) | ||||||
Operating income from continuing operations | 110,507 | 103,346 | 91,589 | |||||||||
Interest expense, net | 13,382 | 12,294 | 12,113 | |||||||||
Other expense (income), net | 623 | 398 | (219 | ) | ||||||||
Earnings before income taxes from continuing operations | 96,502 | 90,654 | 79,695 | |||||||||
Income tax expense | 30,722 | 31,588 | 26,748 | |||||||||
Earnings from continuing operations | $ | 65,780 | $ | 59,066 | $ | 52,947 | ||||||
(a) Net sales by the Aerospace segment under contracts with U.S. Government agencies (including sales to foreign governments through foreign military sales contracts with U.S. Government agencies) totaled $271.7 million, $262.9 million and $303.5 million in 2014, 2013 and 2012, respectively.
(b) Operating income for 2013 includes a 2.1 million non-cash non-tax deductible goodwill impairment charge. Operating income for 2012 includes a $3.3 million loss associated with the resolution of a program related matter.
104
NOTES TO CONSOLIDATED FINANCIAL STATEMENTS - Continued
For the Years Ended December 31, 2014, 2013 and 2012
19. SEGMENT AND GEOGRAPHIC INFORMATION (CONTINUED)
At December 31, | ||||||||||||
In thousands | 2014 | 2013 | 2012 | |||||||||
Identifiable assets (a): | ||||||||||||
Distribution | $ | 547,350 | $ | 480,117 | $ | 449,552 | ||||||
Aerospace | 531,868 | 557,831 | 521,080 | |||||||||
Corporate (b) | 121,987 | 102,683 | 126,361 | |||||||||
Total assets | $ | 1,201,205 | $ | 1,140,631 | $ | 1,096,993 | ||||||
Capital expenditures: | ||||||||||||
Distribution | $ | 12,205 | $ | 12,034 | $ | 10,684 | ||||||
Aerospace | 12,044 | 21,193 | 15,293 | |||||||||
Corporate | 4,034 | 7,625 | 6,409 | |||||||||
Total capital expenditures | $ | 28,283 | $ | 40,852 | $ | 32,386 | ||||||
Depreciation and amortization: | ||||||||||||
Distribution | $ | 14,461 | $ | 11,236 | $ | 9,347 | ||||||
Aerospace | 16,039 | 15,041 | 13,947 | |||||||||
Corporate | 5,709 | 5,278 | 4,871 | |||||||||
Total depreciation and amortization | $ | 36,209 | $ | 31,555 | $ | 28,165 | ||||||
(a) Identifiable assets are year-end assets at their respective net carrying values segregated as to segment and corporate use.
(b) For the periods presented, the corporate identifiable assets are principally comprised of cash, short-term and long-term deferred income tax assets, capitalized debt issuance costs, cash surrender value of life insurance policies and fixed assets.
The following table summarizes total sales of the Company, which are principally derived from the sale of products:
For the year ended December 31, | ||||||||||||
2014 | 2013 | 2012 | ||||||||||
in thousands | ||||||||||||
Bearings and Power Transmission (a) | $ | 630,557 | $ | 622,041 | $ | 622,149 | ||||||
Automation, Control and Energy | 300,861 | 271,465 | 220,999 | |||||||||
Fluid Power | 230,574 | 146,448 | 139,425 | |||||||||
Military and Defense | 391,532 | 384,088 | 346,290 | |||||||||
Commercial Aerospace | 241,438 | 229,879 | 234,479 | |||||||||
Total sales (b) | $ | 1,794,962 | $ | 1,653,921 | $ | 1,563,342 | ||||||
(a) Aerospace bearings are not included in this caption, as they are broken out by Military and Defense and Commercial Aerospace.
(b) Service revenue was not material for the years ended December 31, 2014, 2013 and 2012.
105
NOTES TO CONSOLIDATED FINANCIAL STATEMENTS - Continued
For the Years Ended December 31, 2014, 2013 and 2012
19. SEGMENT AND GEOGRAPHIC INFORMATION (CONTINUED)
Sales are attributed to geographic regions based on the location to which the product is shipped. Geographic distribution of sales recorded by continuing operations is as follows:
For the year ended December 31, | ||||||||||||
2014 | 2013 | 2012 | ||||||||||
In thousands | ||||||||||||
North America | $ | 1,576,041 | $ | 1,442,475 | $ | 1,415,370 | ||||||
Europe | 117,686 | 107,297 | 99,187 | |||||||||
Middle East | 4,378 | 39,357 | 4,023 | |||||||||
Asia | 29,115 | 32,414 | 29,196 | |||||||||
Oceania | 65,122 | 28,892 | 10,249 | |||||||||
Other | 2,620 | 3,486 | 5,317 | |||||||||
Total | $ | 1,794,962 | $ | 1,653,921 | $ | 1,563,342 | ||||||
Geographic distribution of long-lived assets is as follows:
At December 31, | ||||||||
2014 | 2013 | |||||||
In thousands | ||||||||
United States | $ | 419,457 | $ | 373,268 | ||||
United Kingdom | 60,175 | 64,585 | ||||||
Germany | 18,842 | 20,260 | ||||||
Mexico | 1,774 | 2,978 | ||||||
Total | $ | 500,248 | $ | 461,091 | ||||
20. SUBSEQUENT EVENTS
The Company has evaluated subsequent events through the issuance date of these financial statements. There have been no material subsequent events that require disclosure.
106
ITEM 9. | CHANGES IN AND DISAGREEMENTS WITH ACCOUNTANTS ON ACCOUNTING AND FINANCIAL DISCLOSURE |
None.
ITEM 9A. | CONTROLS AND PROCEDURES |
Disclosure Controls and Procedures
The Company has carried out an evaluation, under the supervision and with the participation of our management, including the Chief Executive Officer and the Chief Financial Officer, of the effectiveness of the design and operation of the Company’s disclosure controls and procedures. Based upon that evaluation, the Chief Executive Officer and the Chief Financial Officer have concluded that, as of December 31, 2014, the Company's disclosure controls and procedures were effective.
Management’s Report on Internal Control Over Financial Reporting
The Company’s management is responsible for establishing and maintaining adequate internal control over financial reporting. Internal control over financial reporting is a process designed to provide reasonable assurance regarding the reliability of financial reporting and the preparation of financial statements for external reporting purposes in accordance with U.S. generally accepted accounting principles. Because of its inherent limitations, internal control over financial reporting may not prevent or detect misstatements. Management has assessed the effectiveness of the Company’s internal control over financial reporting as of December 31, 2014.
In making its assessment of the effectiveness of the Company’s internal control over financial reporting as of December 31, 2014, management utilized the criteria set forth by the Committee of Sponsoring Organizations ("COSO") of the Treadway Commission in Internal Control—Integrated Framework (2013). Management concluded that based on its assessment the Company’s internal control over financial reporting was effective as of December 31, 2014. The effectiveness of internal control over financial reporting as of December 31, 2014, has been audited by PricewaterhouseCoopers LLP, an independent registered public accounting firm, as stated in their report, which is included in Item 8 of this Annual Report on Form 10-K.
The scope of management's assessment of the effectiveness of internal control over financial reporting excludes the operations of B.W. Rogers, which the Company acquired through a purchase business combination during the year ended December 31, 2014. The acquired business represented approximately 4% of the Company's consolidated revenues for the year ended December 31, 2014, and assets associated with the acquired businesses represented approximately 5% of the Company's consolidated total assets as of December 31, 2014.
Changes in Internal Control Over Financial Reporting
Management of the Company has evaluated, with the participation of the Company’s Chief Executive Officer and Chief Financial Officer, changes in the Company’s internal controls over financial reporting during 2014.
During the fourth quarter ended December 31, 2014, management made no changes to internal control over financial reporting that materially affected, or are reasonably likely to materially affect, our internal control over financial reporting.
Inherent Limitations of Controls
The Company’s evaluation described in this Item was undertaken acknowledging that there are inherent limitations to the effectiveness of any system of controls, including the possibility of human error and the circumvention or overriding of the controls and procedures. Accordingly, even effective controls can only provide reasonable assurance of achieving their control objectives.
ITEM 9B. | OTHER INFORMATION |
None.
107
PART III
ITEM 10. | DIRECTORS, EXECUTIVE OFFICERS AND CORPORATE GOVERNANCE |
Other than the list of executive officers of the Company set forth in Item 1, Executive Officers of the Registrant, all information under this caption may be found in the Company’s proxy statement to be delivered to stockholders in connection with the Annual Meeting of Shareholders, which is scheduled for April 15, 2015, (the “Proxy Statement”) in the following sections: “Class 3 Director Nominees for Election at the 2015 Annual Meeting,” “Continuing Directors,” “Section 16(a) Beneficial Ownership Reporting Compliance,” “Director Nominees,” and “Audit Committee.” Those portions of the Proxy Statement are incorporated by reference into this Item 10.
ITEM 11. | EXECUTIVE COMPENSATION |
Information about the compensation of Kaman’s named executive officers appears under the captions "Compensation Discussion and Analysis" and "Summary Compensation Table" in the Proxy Statement. Information about the compensation of Kaman’s directors appears under "Non-Employee Director Compensation" in the Proxy Statement. Those portions of the Proxy Statement are incorporated by reference into this Item 11.
ITEM 12. | SECURITY OWNERSHIP OF CERTAIN BENEFICIAL OWNERS AND MANAGEMENT AND RELATED STOCKHOLDER MATTERS |
Information about security ownership of certain beneficial owners and management appears under "Security Ownership of Certain Beneficial Owners and Management" in the Proxy Statement. That portion of the Proxy Statement is incorporated by reference into this Item 12.
ITEM 13. | CERTAIN RELATIONSHIPS AND RELATED TRANSACTIONS, AND DIRECTOR INDEPENDENCE |
Information about certain relationships and related transactions appears under “Transactions With Related Persons” and “Board and Committee Independence Requirements” in the Proxy Statement. Those portions of the Proxy Statement are incorporated by reference into this Item 13.
ITEM 14. | PRINCIPAL ACCOUNTING FEES AND SERVICES |
Information regarding audit fees and all other fees, in addition to the Audit Committee’s pre-approval policies and procedures appears under “Principal Accounting Fees and Services” in the Proxy Statement. That portion of the Proxy Statement is incorporated by reference into this Item 14.
108
PART IV
ITEM 15. | EXHIBITS, FINANCIAL STATEMENT SCHEDULES |
(a)(1) | FINANCIAL STATEMENTS. |
See Item 8 of this Form 10-K setting forth our Consolidated Financial Statements. | |
(a)(2) | FINANCIAL STATEMENT SCHEDULES. |
An index to the financial statement schedule immediately precedes such schedule. | |
(a)(3) | EXHIBITS. |
An index to the exhibits filed or incorporated by reference immediately precedes such exhibits. | |
109
SIGNATURES
Pursuant to the requirements of Section 13 or 15(d) of the Securities Exchange Act of 1934, the registrant has duly caused this Form 10-K to be signed on its behalf by the undersigned, thereunto duly authorized, in the Town of Bloomfield, State of Connecticut, on this 23rd day of February 2015.
KAMAN CORPORATION (Registrant) | ||
By: | /s/ Neal J. Keating | |
Neal J. Keating | ||
Chairman, President, | ||
Chief Executive Officer and Director | ||
Pursuant to the requirements of the Securities Exchange Act of 1934, this report has been signed below by the following persons on behalf of the registrant and in the capacities and on the dates indicated.
Signature | Title: | Date: | ||
/s/ Neal J. Keating | Chairman, President, | February 23, 2015 | ||
Neal J. Keating | Chief Executive Officer and Director | |||
(Principal Executive Officer) | ||||
/s/ Robert D. Starr | Senior Vice President | February 23, 2015 | ||
Robert D. Starr | and Chief Financial Officer | |||
(Principal Financial Officer) | ||||
/s/ John J. Tedone | Vice President – Finance and | February 23, 2015 | ||
John J. Tedone | Chief Accounting Officer | |||
(Principal Accounting Officer) | ||||
/s/ Neal J. Keating | February 23, 2015 | |||
Neal J. Keating | ||||
Attorney-in-Fact for: | ||||
Brian E. Barents | Director | |||
E. Reeves Callaway III | Director | |||
Karen M. Garrison | Director | |||
A. William Higgins | Director | |||
Scott E. Kuechle | Director | |||
Eileen S. Kraus | Director | |||
George E. Minnich | Director | |||
Thomas W. Rabaut | Director | |||
Richard J. Swift | Director | |||
110
KAMAN CORPORATION AND SUBSIDIARIES
Index to Financial Statement Schedule
Report of Independent Registered Public Accounting Firm
Financial Statement Schedule:
Schedule II - Valuation and Qualifying Accounts
111
REPORT OF INDEPENDENT REGISTERED PUBLIC ACCOUNTING FIRM ON FINANCIAL STATEMENT SCHEDULE
To the Board of Directors
of Kaman Corporation:
Our audits of the consolidated financial statements and of the effectiveness of internal control over financial reporting referred to in our report dated February 23, 2015 included under Item 8 in this Annual Report on Form 10-K also included an audit of the financial statement schedule listed in Item 15(a)(2) of this 2014 Form 10-K as of and for the years ended December 31, 2014 and 2013. In our opinion, this financial statement schedule presents fairly, in all material respects, the information set forth therein as of and for the years ended December 31, 2014 and 2013 when read in conjunction with the related consolidated financial statements.
/s/ PricewaterhouseCoopers LLP
Hartford, Connecticut
February 23, 2015
112
KAMAN CORPORATION AND SUBSIDIARIES
SCHEDULE II - VALUATION AND QUALIFYING ACCOUNTS
YEARS ENDED DECEMBER 31, 2014, 2013 AND 2012
(Dollars in Thousands)
Additions | ||||||||||||||||||||
DESCRIPTION | Balance Beginning of Period | Charged to Costs and Expenses | Others (A) | Deductions (B) | Balance End of Period | |||||||||||||||
2014 | ||||||||||||||||||||
Allowance for doubtful accounts | $ | 3,827 | $ | 1,171 | $ | 148 | $ | 1,938 | $ | 3,208 | ||||||||||
2013 | ||||||||||||||||||||
Allowance for doubtful accounts | $ | 3,148 | $ | 1,635 | $ | 56 | $ | 1,012 | $ | 3,827 | ||||||||||
2012 | ||||||||||||||||||||
Allowance for doubtful accounts | $ | 3,294 | $ | 763 | $ | 322 | $ | 1,231 | $ | 3,148 | ||||||||||
(A) | Additions to allowance for doubtful accounts attributable to acquisitions. |
(B) | Write-off of bad debts, net of recoveries. |
Additions (Reductions) | ||||||||||||||||
DESCRIPTION | Balance Beginning of Period | Current Year Provision (Benefit) | Others | Balance End of Period | ||||||||||||
2014 | ||||||||||||||||
Valuation allowance on deferred tax assets | $ | 4,657 | $ | 363 | $ | (326 | ) | $ | 4,694 | |||||||
2013 | ||||||||||||||||
Valuation allowance on deferred tax assets | $ | 5,288 | $ | 531 | $ | (1,162 | ) | $ | 4,657 | |||||||
2012 | ||||||||||||||||
Valuation allowance on deferred tax assets | $ | 3,786 | $ | 469 | $ | 1,033 | $ | 5,288 | ||||||||
113
KAMAN CORPORATION
INDEX TO EXHIBITS
Exhibit 3.1 | Amended and Restated Certificate of Incorporation of the Company (incorporated by reference to Exhibit 3.1 to the Company's Current Report on Form 8-K dated November 4, 2005, File No. 333-66179). | Previously Filed |
Exhibit 3.2 | Amended and Restated Bylaws of the Company, (incorporated by reference to Exhibit 3.1 to the Company's Current Report on Form 8-K dated February 28, 2008, File No. 000-01093). | Previously Filed |
Exhibit 4.1 | Amended and Restated Indenture, dated as of February 23, 2011, by and between the Company and The Bank of New York Mellon Trust Company, as Trustee (incorporated by reference to Exhibit 4.1 to the Company's Annual Report on Form 10-K for the fiscal year ended December 31, 2010, File No. 000-01093). | Previously Filed |
Exhibit 10.1 | Kaman Corporation 2013 Management Incentive Plan (incorporated by reference to Annex A to the Company's Definitive Proxy Statement on Schedule 14A filed with the Securities and Exchange Commission on March 1, 2013, File No. 001-35419).* | Previously Filed |
Exhibit 10.2 | First Amendment to the Kaman Corporation 2013 Management Incentive Plan (incorporated by reference to Exhibit 10.1 to the Company's Current Report on Form 8-K dated February 23, 2015, File No. 001-35419).* | Previously Filed |
Exhibit 10.3 | Form of Nonqualified Stock Option Agreement under the Kaman Corporation 2013 Management Incentive Plan (incorporated by reference to Exhibit 10.1 to the Company's Current Report on Form 8-K dated February 24, 2014, File No. 001-35419).* | Previously Filed |
Exhibit 10.4 | Form of Restricted Share Agreement under the Kaman Corporation 2013 Management Incentive Plan (incorporated by reference to Exhibit 10.2 to the Company's Current Report on Form 8-K dated February 24, 2014, File No. 001-35419).* | Previously Filed |
Exhibit 10.5 | Form of Restricted Stock Unit Agreement under the Kaman Corporation 2013 Management Incentive Plan (incorporated by reference to Exhibit 10.1 to the Company’s Current Report on Form 8-K dated June 6, 2014, File No 001-35419).* | Previously Filed |
Exhibit 10.6 | Form of Long-Term Performance Award Agreement (Payable in Cash) under the Kaman Corporation 2013 Management Incentive Plan (incorporated by reference to Exhibit 10.3 to the Company's Current Report on Form 8-K dated February 24, 2014, File No. 001-35419).* | Previously Filed |
Exhibit 10.7 | Form of Long-Term Performance Award Agreement (Payable in Shares) granted under the Kaman Corporation 2013 Management Incentive Plan (incorporated by reference to Exhibit 10.4 to the Company's Current Report on Form 8-K dated February 24, 2014, File No. 001-35419).* | Previously Filed |
Exhibit 10.8 | Form of Award Agreement for Non-Employee Directors under the Kaman Corporation 2013 Management Incentive Plan.(incorporated by reference to Exhibit 10.6 to the Company’s Annual Report on Form 10-K for the fiscal year ended December 31, 2014, File No. 001-35419).* | Previously Filed |
Exhibit 10.9 | Kaman Corporation 2003 Stock Incentive Plan (incorporated by reference to Exhibit 10(a)(i) to the Company's Quarterly Report on Form 10-Q for the fiscal quarter ended October 2, 2009, File No. 000-01093), as amended by amendments thereto filed with the SEC on April 7, 2010 (incorporated by reference to Exhibit 99.1 to the Company's Current Report on Form 8-K dated April 7, 2010, File No. 000-01093) and November 1, 2010 (incorporated by reference to Exhibit 10(b) to the Company's Quarterly Report on Form 10-Q for the fiscal quarter ended October 1, 2010, File No. 000-01093), and February 22, 2012 (incorporated by reference to Exhibit 99.2 to the Company's Current Report on Form 8-K, dated February 22, 2012, File No. 000-01093).* | Previously Filed |
114
Exhibit 10.10 | Form of Incentive Stock Option Agreement under the Kaman Corporation 2003 Stock Incentive Plan (incorporated by reference to Exhibit 10h(i) to the Company's Annual Report on Form 10-K for the fiscal year ended December 31, 2008, File No. 000-01093).* | Previously Filed |
Exhibit 10.11 | Form of Non-Statutory Stock Option Agreement under the Kaman Corporation 2003 Stock Incentive Plan (incorporated by reference to Exhibit 10h(ii) to the Company's Annual Report on Form 10-K for the fiscal year ended December 31, 2008, File No. 000-01093).* | Previously Filed |
Exhibit 10.12 | Form of Stock Appreciation Rights Agreement under the Kaman Corporation 2003 Stock Incentive Plan (incorporated by reference to Exhibit 10h(iii) to the Company's Annual Report on Form 10-K for the fiscal year ended December 31, 2008, File No. 000-01093).* | Previously Filed |
Exhibit 10.13 | Form of Restricted Stock Agreement under the Kaman Corporation 2003 Stock Incentive Plan (incorporated by reference to Exhibit 10h(iv) to the Company's Form 10-Q for the fiscal quarter ended June 27, 2007, File No. 000-01093).* | Previously Filed |
Exhibit 10.14 | Form of Long Term Performance Award Agreement under the Kaman Corporation 2003 Stock Incentive Plan (incorporated by reference to Exhibit 10h(v) to the Company's Annual Report on Form 10-K for the fiscal year ended December 31, 2011, File No. 001-35419).* | Previously Filed |
Exhibit 10.15 | Form of Restricted Stock Unit Agreement under the Kaman Corporation 2003 Stock Incentive Plan (incorporated by reference to Exhibit 10h(vi) to the Company's Annual Report on Form 10-K for the fiscal year ended December 31, 2009, File No. 000-10093).* | Previously Filed |
Exhibit 10.16 | Kaman Corporation Employees Stock Purchase Plan (incorporated by reference to Exhibit 10(a) to the Company's Quarterly Report on Form 10-Q for the fiscal quarter ended October 1, 2010, File No. 000-01093), as amended by the First Amendment thereto filed with the SEC on February 27, 2012 (incorporated by reference to Exhibit 10b to the Company's Annual Report on Form 10-K for the fiscal year ended December 31, 2011, File No. 001-35419) and the Second Amendment thereto filed with the SEC on February 25, 2013 (incorporated by reference to Exhibit 10.3 to the Company's Annual Report on Form 10-K for the fiscal year ended December 31, 2012, File No. 001-35419).* | Previously Filed |
Exhibit 10.17 | Third Amendment to Kaman Corporation Employees Stock Purchase Plan.(incorporated by reference to Exhibit 10.15 to the Company’s Annual Report on Form 10-K for the fiscal year ended December 31, 2014, File No. 001-35419).* | Previously Filed |
Exhibit 10.18 | Kaman Corporation Supplemental Employees' Retirement Plan (incorporated by reference to Exhibit 10c to the Company's Annual Report on Form 10-K for the fiscal year ended December 31, 2000, File No. 333-66179), as amended by an amendment thereto filed with the SEC on March 5, 2004 (incorporated by reference to Exhibit 10c to the Company's Annual Report on Form 10-K for the fiscal year ended December 31, 2003, File No. 333-66179), and an amendment thereto filed with the SEC on February 26, 2007 (incorporated by reference to Exhibit 10.10 to the Company's Current Report on Form 8-K, dated February 26, 2007, File No. 000-01093).* | Previously Filed |
Exhibit 10.19 | Post-2004 Supplemental Employees' Retirement Plan (incorporated by reference to Exhibit 10.11 to the Company's Current Report on Form 8-K, dated February 26, 2007, File No. 000-01093), as amended by the First Amendment thereto filed with the SEC on February 28, 2008 (incorporated by reference to Exhibit 10.1 to the Company's Current Report on Form 8-K, dated February 28, 2008, File No. 000-01093) and the Second Amendment thereto filed with the SEC on February 25, 2010 (incorporated by reference to Exhibit 10(c)(iii) to the Company's Annual Report on Form 10-K for the fiscal year ended December 31, 2009, File No. 000-01093).* | Previously Filed |
115
Exhibit 10.20 | Kaman Corporation Amended and Restated Deferred Compensation Plan (incorporated by reference to Exhibit 10d to the Company's Annual Report on Form 10-K for the fiscal year ended December 31, 2002, File No. 333-66179), as amended by an amendment thereto filed with the SEC on March 5, 2004 (incorporated by reference to Exhibit 10d to the Company's Annual report on Form 10-K for the fiscal year ended December 31, 2003 File No. 333-66179), and an amendment thereto filed with the SEC on August 3, 2004 (incorporated by reference to Exhibit 10(a) to the Company's Quarterly Report on Form 10-Q for the fiscal quarter ended June 30, 2004, File No. 333-66179).* | Previously Filed |
Exhibit 10.21 | Kaman Corporation Post-2004 Deferred Compensation Plan (incorporated by reference to Exhibit 10.2 to the Company's Current Report on Form 8-K, dated February 28, 2008, File No. 000-01093), as amended by the First Amendment thereto filed with the SEC on February 27, 2012 (incorporated by reference to Exhibit 10d(ii) to the Company's Annual Report on Form 10-K for the fiscal year ended December 31, 2011, File No. 001-35419), the Second Amendment thereto (incorporated by reference to Exhibit 10.20 to the Company’s Annual Report on Form 10-K for the fiscal year ended December 31, 2014, File No. 001-35419), and the Third Amendment thereto (incorporated by reference to Exhibit 10.2 to the Company’s Current Report on Form 8-K dated November 21, 2014, File No. 001-35419). * | Previously Filed |
Exhibit 10.22 | Kaman Corporation Cash Bonus Plan (incorporated by reference to Exhibit 10e(i) to the Company's Annual Report on Form 10-K for the fiscal year ended December 31, 2007, File No. 000-01093), as amended by Amendment No. 1 thereto filed with the SEC on February 28, 2011 (incorporated by reference to Exhibit 10e(i) to the Company's Annual Report on Form 10-K for the fiscal year ended December 31, 2010, File No. 000-01093).* | Previously Filed |
Exhibit 10.23 | Amended and Restated Executive Employment Agreement between Kaman Corporation and Neal J. Keating, originally dated as of August 7, 2007 and amended and restated as of November 11, 2008 (incorporated by reference to Exhibit 10g(xviii) to the Company's Annual Report on Form 10-K for the fiscal year ended December 31, 2008, File No. 000-01093), as amended by Amendment No. 1 thereto dated January 1, 2010 (incorporated by reference to Exhibit 10.1 to the Company's Current Report on Form 8-K, dated February 23, 2010, File No. 000-01093), Amendment No. 2 thereto dated September 17, 2010 (incorporated by reference to Exhibit 10.1 to the Company's Current Report on Form 8-K, dated September 20, 2010, File No. 000-01093), and Amendment No. 3 thereto dated November 18, 2014 (incorporated by reference to Exhibit 10.3 to the Company's Current Report on Form 8-K, dated November 21, 2014, File No. 000-01093).* | Previously Filed |
Exhibit 10.24 | Amended and Restated Change in Control Agreement between Kaman Corporation and Neal J. Keating, originally dated as of August 7, 2007 and amended and restated as of November 11, 2008 (incorporated by reference to Exhibit 10g(xix) to the Company's Annual Report on Form 10-K for the fiscal year ended December 31, 2008, File No. 000-01093), as amended by Amendment No. 1 thereto, dated January 1, 2010 (incorporated by reference to Exhibit 10.2 to the Company's Current Report on Form 8-K dated February 25, 2010, File No. 000-01093), the Second Amendment thereto, dated March 9, 2010 (incorporated by reference to Exhibit 10.1 to the Company's Current Report on Form 8-K, dated March 16, 2010, File No. 000-01093), and the Third Amendment thereto dated as of August 7, 2012 (incorporated by reference to Exhibit 10.1 to the Company's Current Report on Form 8-K dated August 8, 2012, File No. 001-35419).* | Previously Filed |
Exhibit 10.25 | Promotion Letter between Kaman Corporation and Robert D. Starr dated as of June 7, 2013 (incorporated by reference to Exhibit 10.1 to the Company's Current Report on Form 8-K dated April 18, 2013, File No. 001-35419).* | Previously Filed |
Exhibit 10.26 | Executive Employment Agreement between Kaman Corporation and Robert D. Starr, dated as of November 18, 2014 (incorporated by reference to Exhibit 10.1 to the Company's Current Report on Form 8-K dated November 21, 2014, File No. 001-35419).* | Previously Filed |
116
Exhibit 10.27 | Change in Control Agreement between Kaman Corporation and Robert D. Starr dated as of June 7, 2013 (incorporated by reference to Exhibit 10.1 to the Company's Current Report on Form 8-K dated June 7, 2013, File No. 001-35419).* | Previously Filed |
Exhibit 10.28 | Executive Employment Agreement dated as of November 17, 2008 between Kaman Corporation and William C. Denninger (incorporated by reference to Exhibit 10.1 of the Company's Current Report on Form 8-K dated November 13, 2008, File No. 000-01093), as amended by Amendment No. 1 thereto on February 23, 2010 (incorporated by reference to Exhibit 10.3 to the Company's Current Report on Form 8-K dated February 25, 2010, File No. 000-01093), Amendment No. 2 thereto dated November 10, 2010 (incorporated by reference to Exhibit 10.1 to the Company's Current Report on Form 8-K dated November 10, 2010, File No. 000-01093), and the Third Amendment thereto dated November 7, 2012 (incorporated by reference to Exhibit 10.2 to the Company's Current Report on Form 8-K dated November 9, 2012, File No. 001-35419)).* | Previously Filed |
Exhibit 10.29 | Change in Control Agreement between Kaman Corporation and William C. Denninger dated as of November 12, 2008 (incorporated by reference to Exhibit 10.2 of the Company's Current Report on Form 8-K dated November 13, 2008, File No. 000-01093), as amended by Amendment No. 1 thereto dated January 1, 2010 (incorporated by reference to Exhibit 10.4 to the Company's Current Report on Form 8-K dated January 1, 2010, File No. 000-01093), the Second Amendment thereto dated March 8, 2010 (incorporated by reference to Exhibit 10.2 to the Company's Current Report on Form 8-K dated March 16, 2010, File No. 000-01093), the Third Amendment thereto dated November 7, 2012 (incorporated by reference to Exhibit 10.2 to the Company's Current Report on Form 8-K dated November 9, 2012, File No. 001-35419) and the Fourth Amendment thereto dated March 21, 2013 (incorporated by reference to Exhibit 10.1 to the Company's Current Report on Form 8-K dated March 21, 2013, File No. 001-35419).* | Previously Filed |
Exhibit 10.30 | Amended and Restated Executive Employment Agreement between Kaman Aerospace Group, Inc. and Gregory L. Steiner, originally dated as of July 7, 2008 and amended and restated as of November 11, 2008 (incorporated by reference to Exhibit 10g(xx) to the Company's Quarterly Report on Form 10-Q for the fiscal quarter ended April 3, 2009, File No. 000-01093), as amended by Amendment No. 1 thereto, dated June 7, 2011 (incorporated by reference to Exhibit 10.1 to the Company's Current Report on Form 8-K dated June 7, 2011, File No. 000-01093).* | Previously Filed |
Exhibit 10.31 | Amended and Restated Change in Control Agreement between Kaman Aerospace Group, Inc. and Gregory L. Steiner, originally dated as of dated July 7, 2008 and amended and restated as of November 11, 2008 (incorporated by reference to Exhibit 10g(xx) to the Company's Quarterly Report on Form 10-Q for the fiscal quarter ended April 3, 2009, File No. 000-01093), as amended by the First Amendment thereto, dated March 11, 2010 (incorporated by reference to Exhibit 10.3 to the Company's Current Report on Form 8-K, dated March 16, 2010, File No. 000-01093), and the Second Amendment thereto, dated June 4, 2013 (incorporated by reference to Exhibit 10.2 to the Company's Current Report on Form 8-K, dated June 7, 2013, File No. 000-35419).* | Previously Filed |
Exhibit 10.32 | Executive Employment Agreement between Kaman Industrial Technologies Corporation and Steven J. Smidler dated as of September 1, 2010 (incorporated by reference to Exhibit 10.1 to the Company's Current Report on Form 8-K dated September 10, 2010, File No. 000-01093.)* | Previously Filed |
Exhibit 10.33 | Change in Control Agreement between Kaman Industrial Technologies Corporation and Steven J. Smidler dated as of September 1, 2010 (incorporated by reference to Exhibit 10.1 to the Company's Current Report on Form 8-K dated September 10, 2010, File No. 000-01093), as amended by the First Amendment thereto dated November 9, 2011 (incorporated by reference to Exhibit 10.3 to the Company's Current Report on Form 8-K dated November 9, 2011, File No. 000-01093).* | Previously Filed |
117
Exhibit 10.34 | Amended and Restated Executive Employment Agreement between the Company and Ronald M. Galla, originally dated as of January 1, 2007 and amended and restated as of November 11, 2008 (incorporated by reference to Exhibit 10g(v) to the Company's Annual Report on Form 10-K for the fiscal year ended December 31, 2008, File No. 000-01093), as amended by Amendment No. 1 thereto dated December 21, 2010 (incorporated by reference to Exhibit 10.1 to the Company's Current Report on Form 8-K, dated December 21, 2010, File No. 000-01093).* | Previously Filed |
Exhibit 10.35 | Amended and Restated Change in Control Agreement between the Company and Ronald M. Galla, originally dated as of January 1, 2007 and amended and restated as of November 11, 2008 (incorporated by reference to Exhibit 10g(xi) to the Company's Annual Report on Form 10-K for the fiscal year ended December 31, 2008, File No. 000-01093), as amended by the First Amendment thereto, dated March 8, 2010 (incorporated by reference to Exhibit 10.6 to the Company's Current Report on Form 8-K, dated March 16, 2010, File No. 000-01093) and the Second Amendment thereto, dated November 9, 2011 (incorporated by reference to Exhibit 10.2 on to the Company's Current Report on Form 8-K, dated on November 9, 2011, File No. 000-01093).* | Previously Filed |
Exhibit 10.36 | Change in Control Agreement between Kaman Corporation and Philip A. Goodrich dated as of June 10, 2013 (incorporated by reference to Exhibit 10.3 to the Company's Quarterly Report on Form 10-Q for the fiscal quarter ended June 28, 2013, File No. 001-35419).* | Previously Filed |
Exhibit 10.37 | Change in Control Agreement between Kaman Corporation and Shawn G. Lisle dated as of February 4, 2013 (incorporated by reference to Exhibit 10.20 to the Company's Annual Report on Form 10-K for the fiscal year ended December 31, 2012, File No. 001-35419).* | Previously Filed |
Exhibit 10.38 | Change in Control Agreement between Kaman Corporation and Gregory T. Troy dated as of March 26, 2012 (incorporated by reference to Exhibit 10.21 to the Company's Annual Report on Form 10-K for the fiscal year ended December 31, 2012, File No. 001-35419).* | Previously Filed |
Exhibit 10.39 | Deferred Compensation Agreement between Kaman Corporation and Eileen S. Kraus dated August 8, 1995 as amended by First Amendment thereto dated December 8, 2005 (incorporated by reference to Exhibit 10h(vii) to the Company's Annual Report on Form 10-K for the fiscal year ended on December 31, 2005, File No. 000-01093).* | Previously Filed |
Exhibit 10.40 | Purchase Agreement dated November 15, 2010, by and among Kaman Corporation, Merrill Lynch, Pierce, Fenner & Smith Incorporated, and RBS Securities Inc., as representatives of the several Initial Purchasers (incorporated by reference to Exhibit 10.1 to the Company's Current Report on Form 8-K dated November 19, 2010, File No. 000-01093). | Previously Filed |
Exhibit 10.41 | Base Convertible Bond Hedging Transaction Confirmation dated November 15, 2010, by and between Kaman Corporation and The Royal Bank of Scotland plc, acting through RBS Securities Inc., as its agent (incorporated by reference to Exhibit 10.2(a) to the Company's Current Report on Form 8-K dated November 19, 2010, File No. 000-01093). | Previously Filed |
Exhibit 10.42 | Base Convertible Bond Hedging Transaction Confirmation dated November 15, 2010, by and between Kaman Corporation and Goldman, Sachs & Co. (incorporated by reference to Exhibit 10.2(b) to the Company's Current Report on Form 8-K dated November 19, 2010, File No. 000-01093). | Previously Filed |
Exhibit 10.43 | Base Convertible Bond Hedging Transaction Confirmation dated November 15, 2010, by and between Kaman Corporation and Bank of America, N.A. (incorporated by reference to Exhibit 10.2(c) to the Company's Current Report on Form 8-K dated November 19, 2010, File No. 000-01093). | Previously Filed |
Exhibit 10.44 | Confirmation of Base Warrants dated November 15, 2010, by and between Kaman Corporation and The Royal Bank of Scotland plc, acting through RBS Securities Inc., as its agent(incorporated by reference to Exhibit 10.3(a) to the Company's Current Report on Form 8-K dated November 19, 2010, File No. 000-01093). | Previously Filed |
118
Exhibit 10.45 | Confirmation of Base Warrants dated November 15, 2010, by and between Kaman Corporation and Goldman, Sachs & Co. (incorporated by reference to Exhibit 10.3(b) to the Company's Current Report on Form 8-K dated November 19, 2010, File No. 000-01093). | Previously Filed |
Exhibit 10.46 | Confirmation of Base Warrants dated November 15, 2010, by and between Kaman Corporation and Bank of America, N.A., filed as (incorporated by reference to Exhibit 10.3(c) to the Company's Current Report on Form 8-K dated November 19, 2010, File No. 000-01093). | Previously Filed |
Exhibit 10.47 | Additional Convertible Bond Hedging Transaction Confirmation dated November 17, 2010, by and between Kaman Corporation and The Royal Bank of Scotland plc, acting through RBS Securities Inc., as its agent, (incorporated by reference to Exhibit 10.4(a) to the Company's Current Report on Form 8-K dated November 19, 2010, File No. 000-01093). | Previously Filed |
Exhibit 10.48 | Additional Convertible Bond Hedging Transaction Confirmation dated November 17, 2010, by and between Kaman Corporation and Goldman, Sachs & Co. (incorporated by reference to Exhibit 10.4(b) to the Company's Current Report on Form 8-K dated November 19, 2010, File No. 000-01093). | Previously Filed |
Exhibit 10.49 | Additional Convertible Bond Hedging Transaction Confirmation dated November 17, 2010, by and between Kaman Corporation and Bank of America, N.A. (incorporated by reference to Exhibit 10.4(c) to the Company's Current Report on Form 8-K dated November 19, 2010, File No. 000-01093). | Previously Filed |
Exhibit 10.50 | Confirmation of Additional Warrants dated November 17, 2010, by and between Kaman Corporation and The Royal Bank of Scotland plc, acting through RBS Securities Inc., as its agent (incorporated by reference to Exhibit 10.5(a) to the Company's Current Report on Form 8-K dated November 19, 2010, File No. 000-01093). | Previously Filed |
Exhibit 10.51 | Confirmation of Additional Warrants dated November 17, 2010, by and between Kaman Corporation and Goldman, Sachs & Co. (incorporated by reference to Exhibit 10.5(b) to the Company's Current Report on Form 8-K dated November 19, 2010, File No. 000-01093). | Previously Filed |
Exhibit 10.52 | Confirmation of Additional Warrants dated November 17, 2010, by and between Kaman Corporation and Bank of America, N.A. (incorporated by reference to Exhibit 10.5(c) to the Company's Current Report on Form 8-K dated November 19, 2010, File No. 000-01093). | Previously Filed |
Exhibit 10.53 | Credit Agreement dated as of November 20, 2012 among Kaman Corporation, RWG Frankenjura-Industrie Flugwerklager GmbH and Kaman Composites-UK Holdings Limited, as Borrowers, JPMorgan Chase Bank, N.A. as Co-Syndication Agents, and Banc of America Securities LLC, RBS Citizens, N.A, as Administrative Agent, and RBS Citizens, N.A. as Co-Syndication Agents, and J.P. Morgan Securities LLC, RBS Citizens, N.A. as Co-Lead Arrangers and Book Managers, and various Lenders signatory thereto (incorporated by reference to Exhibit 10.1 to the Company's Current Report on Form 8-K dated November 21, 2012, File No. 001-35419.) | Previously Filed |
Exhibit 10.54 | Security Agreement dated as of November 20, 2012 among Kaman Corporation, JPMorgan Chase Bank, N.A., as Administrative Agent and the domestic subsidiary guarantors signatory thereto (incorporated by reference to Exhibit 10.2 to the Company's Current Report on Form 8-K dated November 21, 2012, File No. 001-35419.) | Previously Filed |
Exhibit 14 | Kaman Corporation Code of Business Conduct and Ethics effective as of January 1, 2013 (incorporated by reference to Exhibit 14 to the Company's Current Report on Form 8-K dated November 9, 2012, File No. 001-35419). | Previously Filed |
Exhibit 16.1 | Letter of KPMG dated February 21, 2013 (incorporated by reference to Exhibit 16.1 to the Company's Current Report on Form 8-K dated February 21, 2013, File No. 001-35419). | Previously Filed |
119
Exhibit 16.2 | Letter of KPMG dated February 28, 2013 (incorporated by reference to Exhibit 16.1 to the Company's Current Report on Form 8-K/A Amendment No. 1 dated March 1, 2013, File No. 001-35419). | Previously Filed |
Exhibit 21 | List of Subsidiaries | Filed Herewith |
Exhibit 23.1 | Consent of PricewaterhouseCoopers LLP, the Company’s current independent registered public accounting firm. | Filed Herewith |
Exhibit 23.2 | Consent of KPMG LLP, the Company’s former independent registered public accounting firm. | Filed Herewith |
Exhibit 24 | Power of attorney under which this report was signed on behalf of certain directors | Filed Herewith |
Exhibit 31.1 | Certification of Chief Executive Officer Pursuant to Rule 13a-14 under the Securities and Exchange Act of 1934. | Filed Herewith |
Exhibit 31.2 | Certification of Chief Financial Officer Pursuant to Rule 13a-14 under the Securities and Exchange Act of 1934. | Filed Herewith |
Exhibit 32.1 | Certification of Chief Executive Officer Pursuant to 18 U.S.C. Section 1350, as adopted pursuant to Section 906 of the Sarbanes-Oxley Act of 2002. | Filed Herewith |
Exhibit 32.2 | Certification of Chief Financial Officer Pursuant to 18 U.S.C. Section 1350, as adopted pursuant to Section 906 of the Sarbanes-Oxley Act of 2002. | Filed Herewith |
101.INS | XBRL Instance Document | Filed Herewith |
101.SCH | XBRL Taxonomy Extension Schema | Filed Herewith |
101.CAL | XBRL Taxonomy Extension Calculation Linkbase | Filed Herewith |
101.DEF | XBRL Taxonomy Extension Definition Linkbase | Filed Herewith |
101.LAB | XBRL Taxonomy Extension Label Linkbase | Filed Herewith |
101.PRE | XBRL Taxonomy Extension Presentation Linkbase | Filed Herewith |
* Management contract or compensatory plan
120