Attached files
| file | filename |
|---|---|
| EX-99.1 - EX-99.1 - DANA INC | d848689dex991.htm |
| EX-10.1 - EX-10.1 - DANA INC | d848689dex101.htm |
| 8-K - FORM 8-K - DANA INC | d848689d8k.htm |
 ©
2015 Dana Limited. This presentation contains copyrighted and confidential
information of Dana Holding Corporation and/or its subsidiaries. Those having access to this work
may not copy it, use it, or disclose the information contained within it without
written authorization of Dana Holding Corporation. Unauthorized use may result in prosecution.
Dana Holding Corporation
Deutsche Bank
Global Auto Industry Conference
January 13, 2015
1
Honesty & Integrity
Good Corporate Citizen
Open Communication
Continuous Improvement
Exhibit 99.2 |
 Safe
Harbor Statement 2
©
Dana 2015
Certain statements and projections contained in this presentation are, by their nature,
forward-looking within the meaning of the Private Securities Litigation Reform Act of
1995. These forward-looking statements are based on our current expectations,
estimates and projections about our industry and business, management’s beliefs,
and certain assumptions made by us, all of which are subject to change. Forward-
looking statements can often be identified by words such as “anticipates,”
“expects,” “intends,” “plans,” “predicts,”
“believes,” “seeks,” “estimates,” “may,” “will,” “should,”
“would,” “could,” “potential,” “continue,”
“ongoing,” similar expressions, and variations or negatives of these words.
These forward-looking statements are not guarantees of future results and are subject to
risks, uncertainties and assumptions that could cause our actual results to differ materially
and adversely from those expressed in any forward-looking statement. Dana’s
Annual Report on Form 10-K, subsequent Quarterly Reports on Form 10-Q, recent Current
Reports on Form 8-K, and other Securities and Exchange Commission filings discuss important
risk factors that could affect our business, results of operations and financial
condition. The forward-looking statements in this presentation speak only as of this
date. Dana does not undertake any obligation to revise or update publicly any
forward-looking statement for any reason. |
 Dana
Snapshot 3
Founded in 1904
Based in Maumee, Ohio
2014 preliminary sales: $6.6 billion
Global operations and customers
Over 90 major facilities
26 countries on six continents
Customers in over 125 countries
15 R&D centers
23,000 people |
 Applying Dana’s Expertise
4
End Markets
Business
Segments
Competencies
And
Technologies
Light Vehicle
Driveline
Commercial
Vehicle
Driveline
Off-Highway
Driveline
Power
Technologies
Percent of preliminary
2014 sales
Light Vehicles: 50%
Off-Highway: 20%
Heavy Vehicles: 30%
©
Dana 2015
4
28%
38%
18%
16% |
 ©
Dana 2015
Products and Applications
5
Axles
Driveshafts
Sealing Products
Thermal Products
Light Vehicle
Commercial Vehicle
Off-Highway
Drive Axles
Steer Axles
Driveshafts
Sealing Products
Thermal Products
Axles
Driveshafts
Transmissions & Controls
Sealing Products
Thermal Products
Tire Management
Systems
Central Tire Inflation
Systems |
 ©
Dana 2015
2014 Highlights and Preliminary Results
Strong margin performance overcoming
currency and emerging market demand
challenges
Record
margin
and
6
th
consecutive
year of margin growth
Record margin performance in 3 of
our 4 business units
CV margin impacted by supply chain
initiatives and Brazil market demand
Strong free cash flow including capital
investment for future growth
Significant shareholder return: $260M in
share repurchases in 2014; total of
$1.09B or 51M shares since program
inception
Refinanced $400M of outstanding notes,
lowering interest costs and extending
maturities, and reduced pension liability
by over $150M through voluntary
settlement payments to eligible former
employees. These actions will result in
non-cash charges of ~$55M in Q4 2014
6
See appendix for comments regarding the presentation of non-GAAP
measures LVD
~$2.5B
Sales
~10%
Margin
CVD
~$1.8B
Sales
~9%
Margin
OHD
~$1.2B
Sales
~14%
Margin
PT
~$1.1B
Sales
~15%
Margin
Preliminary
Results
Sales
$6.6 B
Adjusted EBITDA
$745 M
Margin
11.3%
Free Cash Flow
$275
M
Cash
(incl. markt. secur.)
$1.3 B |
 ©
Dana 2015
2015 Expectations
7
New business and market demand offsetting currency effects
Significant new business launches across all of our segments
Capital investment to support future growth
Realize benefits of supply chain initiatives
Continued focus on new product development and introductions
|
 ©
Dana 2015
2015 Market Expectations
Dana Sales Impact vs 2014
8
New Business and Market
Offsetting Currency
Headwinds in S. America
and Europe
North America
Europe
South America
Asia Pacific
LVD
CVD
OH
PT
MKT
New Business
Increasing Sales
LVD
CVD
OH
PT
MKT
Sales
Impacted by FX
LVD
CVD
OH
PT
MKT
Sales Impacted
by FX
LVD
CVD
OH
PT
Key Market Comments
Strong
NA
market
continuing
benefitting all businesses
SA
economic
and
political
uncertainty driving volatility and
weaker demand
EU
expected
to
remain
relatively
flat; Agricultural demand
expected to be lower ~7%
AP
provides
modest
growth
-
India and Thailand
Worldwide mining demand
remains sluggish
MKT |
 ©
Dana 2015
$140
$480
$730
$340
$250
2015
Increment
2016
Increment
2017
$560
$600
$730
2015 -
2017 Sales Backlog Flow by Year
Sales Backlog Continues to Grow
9
2014 -
2016
Backlog
2014 -
2016
Updated
Backlog
2015 -
2017
Backlog
Sales Backlog Comparison
By BU
2014 -
2016 Sales Backlog intact
Additional wins in 2014 and fewer
expected losses offset volume
and currency changes
2015 -
2017 Sales Backlog
accelerating reflecting additional
new business wins
Sales Backlog Providing Top-Line Growth in Excess of Market Factors
Represents new business awards, net of any known losses. Excludes replacement
business wins By Region
By Customer
$730
$730
($ in millions)
Ford
18%
Nissan
14%
Toyota
10%
GM
10%
FCA
6%
JLG
5%
VW
4%
Mahindra
4%
Volvo
4%
Other
25%
NA
40%
EU
28%
SA
5%
AP
27%
LVD
$450
OH
170
PT
100
CVD
10
Total
$730
+$40
+$130 |
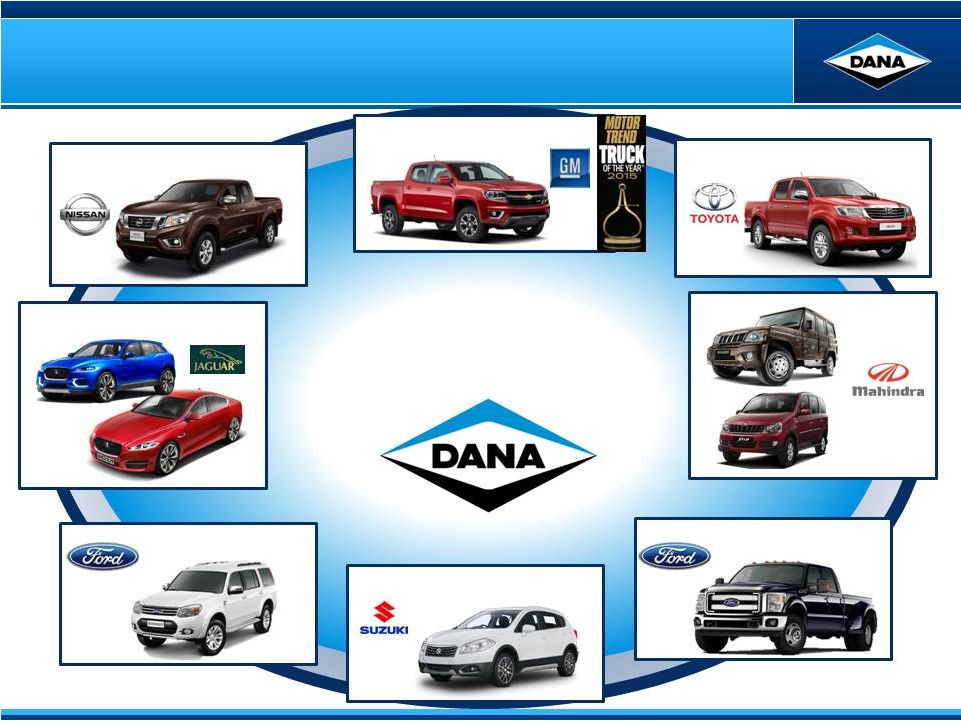 Light Vehicle -
Key Program Launches
10
Jaguar XF & XE
Toyota Hilux
Nissan Navara
GM Colorado/Canyon
Suzuki SX4
Mahindra
Bolero
Mahindra
Xylo Mini
Ford Everest
Ford Super Duty
Represents Annual Sales
of +$300M at Full Run-Rate
©
Dana 2015 |
 Off-Highway –
Key Program Launches
Doosan 5T Excavator
John Deere Final Tier Four
Sany 5T FE Loader
XCMG Motor Grader
JLG Sky Trak 6000 Series
TEREX GTH 6
Represents Annual Sales
of +$110M at Full Run-Rate
11
©
Dana 2015 |
 ©
Dana 2015
2015 Financial Targets
12
*Calculated
based
on
fully
diluted
outstanding
shares
of
168
million
-
excludes
future
impact
of
the
share
repurchase
program
See appendix for comments regarding the presentation of non-GAAP
measures Key Financial Metrics
2015 Targets
Sales
$6.7 –
$6.8 B
Adjusted EBITDA
$760 –
$780 M
Margin
~11.4%
Diluted Adjusted EPS*
$2.10 –
$2.15
Capital Spend
$300 –
$320 M
Free Cash Flow
$190 –
$220 M
Other Cash Flow Items
Depreciation / Amortization
~$190 M / ~$20 M
Cash Taxes
~$100 M
Net Interest
~$90 M
Pension Funding, Net
~$15 M
Cash Restructuring
~$20 M
Euro / USD
1.20
USD / MXN
13.00
USD / BRL
2.50
USD / ARP
10.70
USD / INR
60.00
U.S. GAAP Rate
23%
Cash Tax Rate
22%
Adjusted EPS Rate
22%
Tax Assumptions
Currency Assumptions |
 ©
Dana 2015
See appendix for comments regarding the presentation of non-GAAP
measures 13
Light Vehicle Driveline
~$2.7
B
Sales
~10%
Margin
Commercial Vehicle Driveline
~$1.8 B
Sales
~10%
Margin
Off-Highway Driveline
~$1.2 B
Sales
~13%
Margin
Power Technologies
~$1.1
B
Sales
~15%
Margin
2015 Targets by Business
2015 Sales and Adjusted EBITDA
Sales Progression
Adjusted EBITDA Progression
2014
Prelim.
$6.6B
FX
Adjusted
~$6.3B
Pricing / Recovery
$75M -
$100M
Market / Backlog
$350M
-
$400M-
2015
Target
$6.7B
$6.8B
2014
Prelim.
$745M
FX
Adjusted
~$705M
Volume Mix
$40M -
$50M
Performance
$15M -
$25M
2015
Target
$760M
$780M
+$400 -
500M
+$55 -
75M
FX ~$(40)M
FX ~$(300)M |
 ©
Dana 2015
2016 Sales and Adj. EBITDA Margin Targets Update
~ $8 B
~ $7.4 B
Original
2016
Sales
Target
Revised
2016
Sales
Target
Euro and
Emerging Market
Impacts
Tempered Emerging
Markets and Global
Off-
Highway
Exit Rate
13%
Exit Rate
13% -
14%
Backlog
$40M
FX
$(400)M
Market
$(200)M
2015 Assumption Changes
Sales Backlog solid
FX and market lowering 2016 sales target by $600M
Market impact on operating leverage moving Adjusted EBITDA
margin exit rate to lower end of range
14
+ |
 ©
Dana 2015
Driving Shareholder Value
15
Invest in
Current
Business /
Organic Growth
Protect
Access to
Capital
Inorganic
Growth
Initiatives
Shareholder
Value
Initiatives
Capital Allocation
Focus
Strength
2015 Capital
Spending
Target:
$300-320M
Rating: BB+
Outlook: Stable
M&A Focus:
Bolt-on, adjacent
technology
acquisitions
<$500M
Returned
$1.09B
Since 2012 |
 ©
Dana 2015
The Dana Advantage
16
Trajectory set for profitable growth
$730M+ New business coming on-line through 2017
2016 expected Adjusted EBITDA exit rate of 13%+
Investing for future
Capital investments in 2015 supporting new business growth
Supply chain improvements providing efficiencies
Strong cash flow generation
Pursuing and investing in technology and innovation
Strong balance sheet providing flexibility for continued business
investment and shareholder value initiatives |
 ©
Dana 2015
Appendix
Non-GAAP Financial Information
The preceding slides refer to Adjusted EBITDA, which we’ve defined to be earnings from continuing
and discontinued operations before interest, taxes, depreciation, amortization, equity grant
expense, restructuring expense and other nonrecurring items (gain/loss on debt extinguishment,
pension settlements or divestitures, impairment, etc.). Adjusted EBITDA is a primary driver of
cash flows from operations and a measure of our ability to maintain and continue to invest in
our operations and provide shareholder returns. Adjusted EBITDA should not be considered a
substitute for income (loss) before income taxes, net income (loss) or other results reported in
accordance with GAAP. Adjusted EBITDA may not be comparable to similarly titled
measures reported by other companies. Diluted adjusted EPS is a non-GAAP financial measure which we have defined as adjusted net income
divided by adjusted diluted shares. We define adjusted net income as net income
attributable to the parent company excluding any nonrecurring income tax items, restructuring
and impairment expense, amortization expense and other nonrecurring items (as used in adjusted
EBITDA), net of any associated income tax effects. We define adjusted diluted shares as diluted
shares as determined in accordance with GAAP based on adjusted net income. This measure is
considered useful for purposes of providing investors, analysts and other interested parties
with an indicator of ongoing financial performance that provides enhanced comparability to EPS
reported by other companies. Diluted adjusted EPS is neither intended to represent nor be
an alternative measure to diluted EPS reported under GAAP. Free cash flow is a non-GAAP financial measure which we have defined as cash provided by
(used in) operating activities, less purchases of property, plant and equipment. We
believe this measure is useful to investors in evaluating the operational cash flow of the
company inclusive of the spending required to maintain the operations. Free cash flow is
neither intended to represent nor be an alternative to the measure of net cash provided by (used in)
operating activities reported under GAAP. Free cash flow may not be comparable to
similarly titled measures reported by other companies. Please reference the “Non-GAAP financial information” accompanying our quarterly
earnings conference call presentations on our website at www.dana.com/investors for our
GAAP results and the reconciliations of these measures, where used, to the comparable GAAP
measures. |