Attached files
| file | filename |
|---|---|
| 8-K - CAROLINA FINANCIAL CORP | e00008_caro-8k.htm |

Presentation to KBW Sales Team January 13, 2015

Disclaimer Certain statements in this presentation contain "forward-looking statements" within the meaning of the Private Securities Litigation Reform Act of 1995, such as statements relating to future plans and expectations, and are thus prospective. Such forward-looking statements include but are not limited to statements with respect to plans, objectives, expectations, and intentions and other statements that are not historical facts, and other statements identified by words such as "believes," "expects," "anticipates," "estimates," "intends," "plans," "targets," and "projects," as well as similar expressions. Such statements are subject to risks, uncertainties, and other factors which could cause actual results to differ materially from future results expressed or implied by such forward-looking statements. Although we believe that the assumptions underlying the forward-looking statements are reasonable, any of the assumptions could prove to be inaccurate. Therefore, we can give no assurance that the results contemplated in the forward-looking statements will be realized. The inclusion of this forward-looking information should not be construed as a representation by Carolina Financial Corporation or any person that such future events, plans, or expectations will occur or be achieved. In addition to factors previously disclosed in the registration statement and reports filed by Carolina Financial Corporation with the Securities and Exchange Commission, additional risks and uncertainties may include, but are not limited to: the possibility that the final purchase accounting results for the recently completed branch acquisition could vary materially from those assumed in this presentation; the possibility that any of the anticipated benefits of the branch acquisition will not be realized or will not be realized within the expected time period; the risk that integration of operations with those of Carolina Financial Corporation will be materially delayed or will be more costly or difficult than expected; the potential for customer relationships and operating results to be adversely affected by the branch acquisition. Additional factors that could cause our results to differ materially from those described in the forward-looking statements can be found in the registration statement and reports (such as our Registration Statement on Form 10, Quarterly Reports on Form 10-Q and Current Reports on Form 8-K) filed with the SEC and available at the SEC's Internet site (http://www.sec.gov). All subsequent written and oral forward-looking statements concerning the company or any person acting on its behalf is expressly qualified in its entirety by the cautionary statements above. We do not undertake any obligation to update any forward-looking statement to reflect circumstances or events that occur after the date the forward-looking statements are made. 2

Overview of Carolina Financial Headquartered in Charleston, SC CARO Franchise Founded in 1996 380 employees $1.3 billion in total assets 3rd largest bank headquartered in South Carolina 26 total branches across North and South Carolina Legacy CARO branches: o Charleston market = 8 branches o Myrtle Beach market = 6 branches o Upstate market = 1 loan production office Transaction closed in December 2014 added 12 branches: o 3 South Carolina branches o 9 North Carolina branches Branch o 1 loan production office in Wilmington, NC Loan Production Office Pro Forma Deposits by Market FINANCIAL HIGHLIGHTS Other Total Assets $ 1,258,354 NPAs / Assets (1) 1.10 % 13% Total Loans 730,123 Reserves / NPLs (1) 123.1 Deposits 998,922 Reserves / Loans HFI (1) 1.35 Loans / Deposits 73.1 % Texas Ratio (1) 11.4 YTD ROAA (1) 0.92 % TCE / TA 7.01 % Charleston YTD ROAE (1) 10.10 Leverage Ratio 8.66 52% Myrtle Beach YTD Net Interest Margin (1) 3.42 Tier 1 Capital Ratio 11.91 35% Total Capital Ratio 13.00 Source: FDIC; data as of or for the period ended 9/30/14; deposit by market data as of 6/30/14 Balance sheet, capital ratios, asset quality and branch data pro forma for branch acquisition; NPAs exclude performing restructured loans (1) Profitability and asset quality metrics exclude the impact of branch acquisition 3

Corporate Structure Unconsolidated Subsidiaries: Carolina Financial Corporation (Founded in 1996) Carolina Financial Capital Trust I Carolina Financial Capital Trust II Carolina Services CresCom Bank Corporation of Charleston (Created in 2012 merger) Crescent Mortgage Company (Acquired in 2004) 4

Executive Management Team Over 20 years of experience in senior financial institution management Joined Coastal Financial Corporation in 1995 as EVP and CFO (Company experienced 27% Jerold L. Rexroad compound growth in market price from IPO) Left KPMG LLP in 1995, prior Partner in charge of S.C. Financial Institutions Practice Former President of Carolina First Savings and EVP and Board member of Carolina First David L. Morrow Bank Serves on several Boards and Foundations 27 years of banking experience Founding director and past President, CCO and Secretary of Crescent Bank J. Huggins, III Director of Carolina Financial Corporation from 2001 to 2012 Prior experience with C&S Bank and Carolina First Bank CPA with more than 10 years of experience in financial institutions William A. Gehman III Joined Coastal Financial Corporation as SVP and corporate controller in 2002 Prior Senior Manager with KPMG LLP Certified Mortgage Banker, the highest designation in the mortgage industry Joined Cresent Mortgage Company in 1999 Fowler Williams Prior mortgage loan originator and state representative for a private mortgage insurance company 5

Our Culture and Company Goals Vision: To Be THE Trusted Community Bank of Choice Mission: Offering competitive community banking products and superior service experiencesfor our customers Creating an environment where our team members continually learn, develop and grow Responsibly participating in the growth and well-being of the communities we serve Maximizing the value of our shareholders' investment over both the short and long term Values: Guiding Principles: Leadership Safety and Soundness Integrity Profitability Communication Growth Quality 6

Accolades and Recognition American Banker Magazine Ranks CARO: #1 Most Profitable Community Bank Headquartered in the Southeast #6 Most Profitable Community Bank Headquartered Nationwide America's Most Profitable Community Banks Rank Institution Ticker Headquarters 1 BNCCORP BNCC Bismarck, ND 2 Berkshire Bancorp BERK New York, NY 3 Clarkston Financial Corp. CKFC Waterford, MI 4 First General Bank FGEB Rowland Heights, CA 5 Open Bank OPBK Los Angeles, CA 6 Carolina Financial Corporation CARO Charleston, SC 7 Citizens Financial Services CZFS Mansfield, PA 8 Choice Bancorp CBKW Oshkosh, WI 9 Macatawa MCBC Holland, MI 10 Access National Corp ANCX Reston, VA Source: "Rising Tide: The Top 200 Community Banks"; American Banker; published 4/28/14 Ranked by three-year average ROAE; 848 total banks included in ranking 7
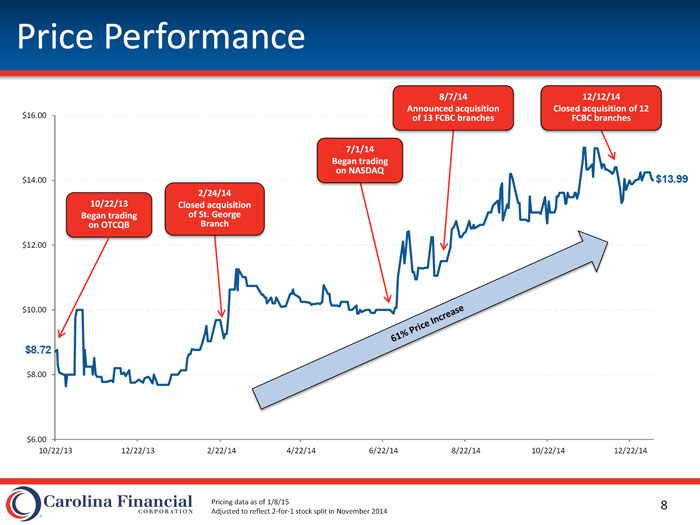
Price Performance 8/7/14 12/12/14 Announced acquisition Closed acquisition of 12 $16.00 of 13 FCBC branches FCBC branches 7/1/14 Began trading on NASDAQ $14.00 $13.99 2/24/14 10/22/13 Closed acquisition Began trading of St. George on OTCQB Branch $12.00 $10.00 $8.72 $8.00 $6.00 10/22/13 12/22/13 2/22/14 4/22/14 6/22/14 8/22/14 10/22/14 12/22/14 Pricing data as of 1/8/15 Adjusted to reflect 2-for-1 stock split in November 2014 8

Recent Major Events 2011 May 16: Consolidation of two bank subsidiaries: 2012 Community FirstBank and Crescent Bank March: CresCom Bank created from merger of Community FirstBank and Crescent Bank 2013 October 9: Listed on OTCQB October 28: Litchfield / Pawleys Island branch opened 2014 February 24: Closed acquisition of St. George branch from First Federal of South Carolina May 6: CresCom University launched June 30: Expanded to Greenville with LPO July 1: Listed on NASDAQ September 1: Opened Cane Bay and Socastee branches December 12: Closed acquisition of 12 FCBC branches 9

Attractive Markets of Operation Charleston, SC #7 City for Jobs in 2015 Top 10 Pro-Business States Home to the Port of Charleston, one of the largest ports in Major Employers the U.S. October 2014 unemployment rate of 5.6%, below South Carolina's of 6.3% Myrtle Beach, SC Major tourist destination with approximately 16 million 2014 2019 Proj. Population Growth (%) visitors annually 10.0% 8.5% 8.3% 7.5% 4.9% 4.6% 5.0% 4.4% 3.5% 2.5% 0.0% Charleston Myrtle Greenville South Southeast US MSA Beach MSA MSA Carolina Source: SNL Financial, Forbes, Pollina Corporate, Myrtle Beach webiste, Charleston City website, Charleston Regional Development Alliance 10
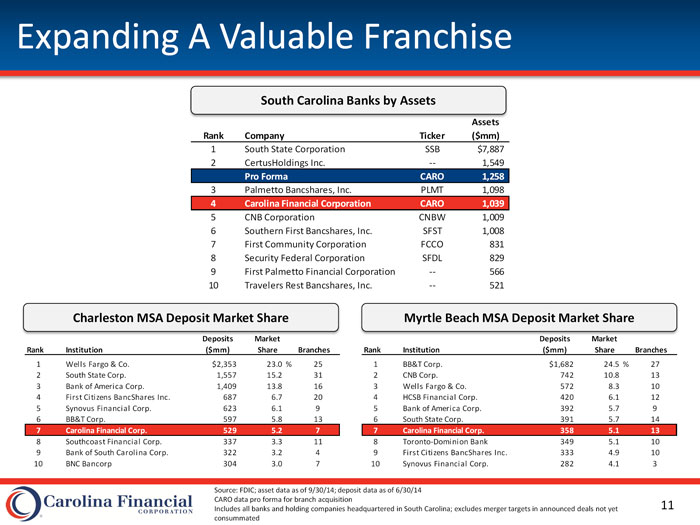
Expanding A Valuable Franchise South Carolina Banks by Assets Assets Rank Company Ticker ($mm) 1 South State Corporation SSB $7,887 2 CertusHoldings Inc. -- 1,549 Pro Forma CARO 1,258 3 Palmetto Bancshares, Inc. PLMT 1,098 4 Carolina Financial Corporation CARO 1,039 5 CNB Corporation CNBW 1,009 6 Southern First Bancshares, Inc. SFST 1,008 7 First Community Corporation FCCO 831 8 Security Federal Corporation SFDL 829 9 First Palmetto Financial Corporation -- 566 10 Travelers Rest Bancshares, Inc. -- 521 Charleston MSA Deposit Market Share Myrtle Beach MSA Deposit Market Share Deposits Market Deposits Market Rank Institution ($mm) Share Branches Rank Institution ($mm) Share Branches 1 Wells Fargo & Co. $2,353 23.0 % 25 1 BB&T Corp. $1,682 24.5 % 27 2 South State Corp. 1,557 15.2 31 2 CNB Corp. 742 10.8 13 3 Bank of America Corp. 1,409 13.8 16 3 Wells Fargo & Co. 572 8.3 10 4 First Citizens BancShares Inc. 687 6.7 20 4 HCSB Financial Corp. 420 6.1 12 5 Synovus Financial Corp. 623 6.1 9 5 Bank of America Corp. 392 5.7 9 6 BB&T Corp. 597 5.8 13 6 South State Corp. 391 5.7 14 7 Carolina Financial Corp. 529 5.2 7 7 Carolina Financial Corp. 358 5.1 13 8 Southcoast Financial Corp. 337 3.3 11 8 Toronto-Dominion Bank 349 5.1 10 9 Bank of South Carolina Corp. 322 3.2 4 9 First Citizens BancShares Inc. 333 4.9 10 10 BNC Bancorp 304 3.0 7 10 Synovus Financial Corp. 282 4.1 3 Source: FDIC; asset data as of 9/30/14; deposit data as of 6/30/14 CARO data pro forma for branch acquisition Includes all banks and holding companies headquartered in South Carolina; excludes merger targets in announced deals not yet consummated 11

2014 Branch Acquisition CARO closed the acquisition of 12 FCBC branches and 1 loan production office, on December 12, 2014 Strategically compelling Raleigh Natural expansion into 4 new counties Charlotte o Top 5 deposit market share in Bladen and Columbus, NC counties Financially attractive Wilmington Cost of deposits of 0.25% Myrtle Beach 69% core deposits Loan Production Office (2) Charleston CARO Branch (14) Low risk FCBC Branch (12) Familiar with markets of operation Management has successful integration track record Deposit market share data as of 6/30/14 Core deposits defined as checking accounts, money market accounts and savings accounts 12

Financially Attractive Transaction Earnings Impact EPS Accretion Double-digit Initial Dilution Less than 5% Tangible Book Value Impact Earnback Period Approximately 2 years Leverage Ratio 8.7% Pro Forma Capital Ratios Total Capital Ratio 13.0% as of 9/30/14 Tangible Common Equity / 7.0% Tangible Assets 13
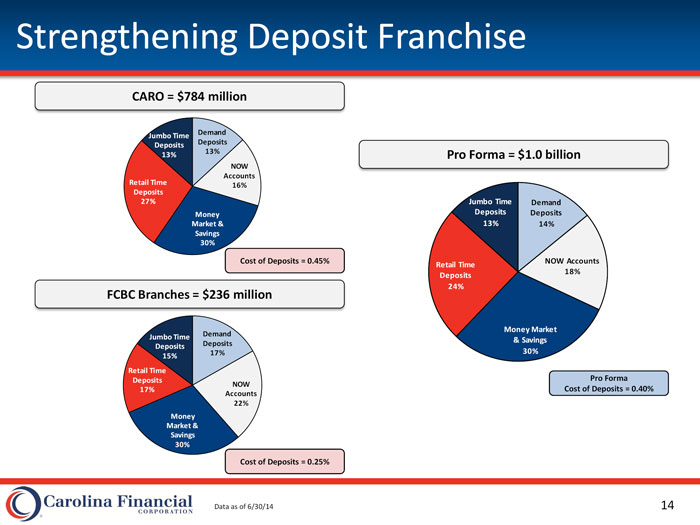
Strengthening Deposit Franchise CARO = $784 million Demand Jumbo Time Deposits Deposits 13% 13% Pro Forma = $1.0 billion NOW Accounts Retail Time 16% Deposits 27% Jumbo Time Demand Money Deposits Deposits Market & 13% 14% Savings 30% Cost of Deposits = 0.45% NOW Accounts Retail Time 18% Deposits 24% FCBC Branches = $236 million Money Market Jumbo Time Demand & Savings Deposits Deposits 17% 30% 15% Retail Time Deposits Pro Forma NOW 17% Cost of Deposits = 0.40% Accounts 22% Money Market & Savings 30% Cost of Deposits = 0.25% Data as of 6/30/14 14

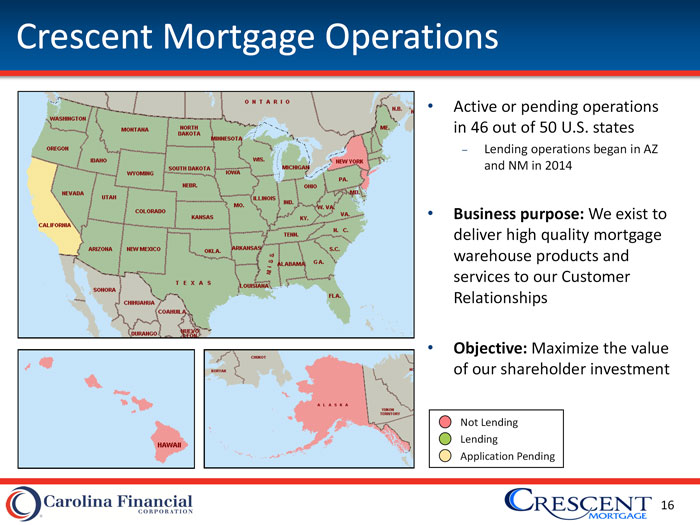
Crescent Mortgage Operations Active or pending operations in 46 out of 50 U.S. states Lending operations began in AZ and NM in 2014 Business purpose: We exist to deliver high quality mortgage warehouse products and services to our Customer Relationships Objective: Maximize the value of our shareholder investment Not Lending Lending Application Pending 16

Mortgage Production Mortgage Loan Production ($bn) $2.5 $2.2 $2.0 $1.6 $1.6 $1.6 $1.5 $1.3 $1.0 $0.8 $0.5 $0.0 2009 2010 2011 2012 2013 2014 YTD 2014 YTD data as of the nine months ended 9/30/14 17

Recent Financial Highlights

Balance Sheet Trends Assets ($mm) Gross Loans ($mm) $1,400 $800 $1,258 $730 $703 $1,200 $700 $1,079 $598 $1,000 $600 $931 $889 $882 $543 $525 $826 $511 $800 $500 $600 $400 2009 2010 2011 2012 2013 Q3 '14 2009 2010 2011 2012 2013 Q3 '14 Deposits ($mm) Loan / Deposit (%) $1,100 100.0% $999 92.4% $950 90.0% 86.7% 84.5% 78.3% 77.9% $800 80.0% $761 $698 73.1% $690 $653 $650 $622 70.0% $500 60.0% 2009 2010 2011 2012 2013 Q3 '14 2009 2010 2011 2012 2013 Q3 '14 Q3 '14 data pro forma for branch acquisition 19

Capital Ratio Trends Tangible Common Equity / Tangible Assets (%) Leverage Ratio (%) 10.00% 12.00% 9.33% 11.15% 7.60% 8.00% 10.50% 7.01% 9.65% 6.00% 9.00% 5.53% 8.66% 5.20% 5.00% 7.94% 7.28% 4.00% 7.50% 6.88% 2.00% 6.00% 2009 2010 2011 2012 2013 Q3 '14 2009 2010 2011 2012 2013 Q3 '14 Tier 1 Capital Ratio (%) Total Risk-Based Capital Ratio (%) 16.00% 18.00% 15.42% 16.82% 14.00% 16.00% 15.52% 13.11% 11.91% 12.00% 14.00% 13.27% 13.00% 10.48% 12.20% 11.86% 10.00% 12.00% 9.19% 9.28% 8.00% 10.00% 2009 2010 2011 2012 2013 Q3 '14 2009 2010 2011 2012 2013 Q3 '14 Q3 '14 data pro forma for branch acquisition 20
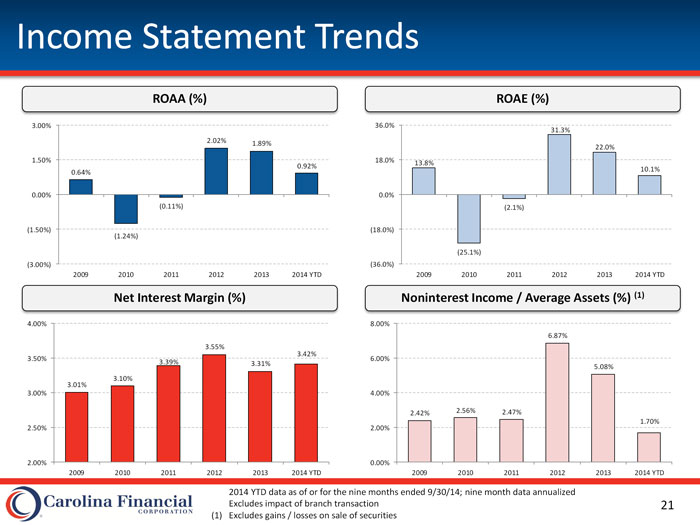
Income Statement Trends ROAA (%) ROAE (%) 3.00% 36.0% 31.3% 2.02% 1.89% 22.0% 1.50% 18.0% 13.8% 0.92% 10.1% 0.64% 0.00% 0.0% (0.11%) (2.1%) (1.50%) (18.0%) (1.24%) (25.1%) (3.00%) (36.0%) 2009 2010 2011 2012 2013 2014 YTD 2009 2010 2011 2012 2013 2014 YTD Net Interest Margin (%) Noninterest Income / Average Assets (%) (1) 4.00% 8.00% 6.87% 3.55% 3.42% 3.50% 6.00% 3.39% 3.31% 5.08% 3.10% 3.01% 3.00% 4.00% 2.42% 2.56% 2.47% 1.70% 2.50% 2.00% 2.00% 0.00% 2009 2010 2011 2012 2013 2014 YTD 2009 2010 2011 2012 2013 2014 YTD 2014 YTD data as of or for the nine months ended 9/30/14; nine month data annualized Excludes impact of branch transaction (1) Excludes gains / losses on sale of securities 21

Asset Quality Trends NPAs / Assets (%) Classified Loans + OREO / Capital + Reserves (%) 8.00% 30.0% 7.32% 26.4% 6.00% 24.0% 4.36% 16.9% 4.00% 18.0% 3.24% 14.3% 2.42% 12.8% 1.97% 10.7% 2.00% 12.0% 1.10% 0.00% 6.0% 2009 2010 2011 2012 2013 Q3 '14 2012 2013 Q1 '14 Q2 '14 Q3 '14 Reserves / Loans HFI (%) NCOs / Average Loans (%) 2.60% 6.00% 2.38% 2.29% 4.06% 2.20% 4.00% 1.85% 1.86% 2.13% 1.80% 2.00% 1.10% 0.85% 1.49% 0.10% 1.35% 1.40% 0.00% (0.14%) 1.00% (2.00%) 2009 2010 2011 2012 2013 Q3 '14 2009 2010 2011 2012 2013 2014 YTD Data as of or for the nine months ended 9/30/14 NPAs exclude performing restructured loans Excludes impact of branch transaction 22

Financial Performance Versus Peers Includes all major exchange traded banks and thrifts headquartered in the Southeast with total assets between $1.25 billion and $4.0 billion YTD ROAA (%) YTD ROAE (%) YTD NIM (%) 1.60% 16.00% 8.00% 12.43% 1.20% 6.19% 1.20% 12.00% 6.50% 0.92% 10.10% 0.80% 8.00% 5.00% 6.21% 0.58% 4.11% 0.40% 4.00% 3.50% 3.42% 3.19% 0.23% 2.03% 0.00% 0.00% 2.00% Peers CARO Peers CARO Peers CARO = Peer Min Max Range = Peer Middle 50% Source: SNL Financial Data as of the nine months ended 9/30/14; CARO data excludes impact of branch acquisition White font denotes group median 23

Capital and Asset Quality Versus Peers Includes all major exchange traded banks and thrifts headquartered in the Southeast with total assets between $1.25 billion and $4.0 billion TCE / TA (%) Leverage Ratio (%) NPAs / Assets (%) 20.00% 18.00% 4.00% 16.40% 3.78% 14.43% 15.00% 15.00% 3.00% 10.00% 12.00% 2.00% 8.94% 7.01% 10.30% 1.14% 1.10% 5.00% 9.00% 1.00% 4.20% 8.66% 6.48% 0.21% 0.00% 6.00% 0.00% Peers CARO Peers CARO Peers CARO = Peer Min Max Range = Peer Middle 50% Source: SNL Financial Data as of 9/30/14; CARO capital ratios pro forma for recent branch acquisition, asset quality excludes impact of branch transaction Note: Peer asset quality ratios exclude loans and OREO covered by the FDIC; NPAs exclude performing restructured loans White font denotes group median 24
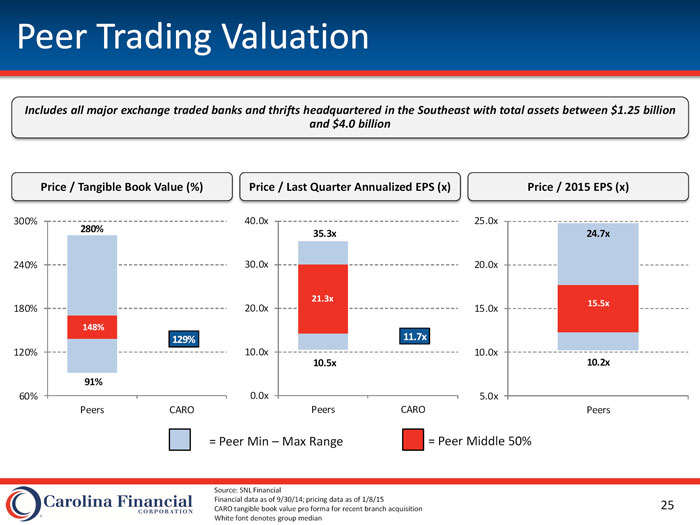
Peer Trading Valuation Includes all major exchange traded banks and thrifts headquartered in the Southeast with total assets between $1.25 billion and $4.0 billion Price / Tangible Book Value (%) Price / Last Quarter Annualized EPS (x) Price / 2015 EPS (x) 300% 40.0x 25.0x 280% 35.3x 24.7x 240% 30.0x 20.0x 21.3x 15.5x 180% 20.0x 15.0x 148% 129% 11.7x 120% 10.0x 10.0x 10.5x 10.2x 91% 60% 0.0x 5.0x Peers CARO Peers CARO Peers = Peer Min Max Range = Peer Middle 50% Source: SNL Financial Financial data as of 9/30/14; pricing data as of 1/8/15 CARO tangible book value pro forma for recent branch acquisition White font denotes group median 25

Appendix I: Branch Detail
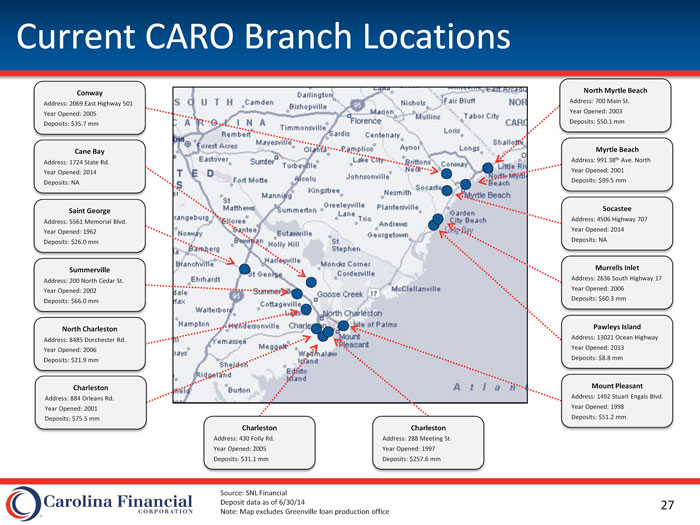
Current CARO Branch Locations Conway North Myrtle Beach Address: 2069 East Highway 501 Address: 700 Main St. Year Opened: 2005 Year Opened: 2003 Deposits: $35.7 mm Deposits: $50.1 mm Cane Bay Myrtle Beach Address: 1724 State Rd. Address: 991 38th Ave. North Year Opened: 2014 Year Opened: 2001 Deposits: NA Deposits: $99.5 mm Saint George Socastee Address: 5561 Memorial Blvd. Address: 4506 Highway 707 Year Opened: 1962 Year Opened: 2014 Deposits: $26.0 mm Deposits: NA Summerville Murrells Inlet Address: 200 North Cedar St. Address: 2636 South Highway 17 Year Opened: 2002 Year Opened: 2006 Deposits: $66.0 mm Deposits: $60.3 mm North Charleston Pawleys Island Address: 8485 Dorchester Rd. Address: 13021 Ocean Highway Year Opened: 2006 Year Opened: 2013 Deposits: $21.9 mm Deposits: $8.8 mm Charleston Mount Pleasant Address: 884 Orleans Rd. Address: 1492 Stuart Engals Blvd. Year Opened: 2001 Year Opened: 1998 Deposits: $75.5 mm Deposits: $51.2 mm Charleston Charleston Address: 430 Folly Rd. Address: 288 Meeting St. Year Opened: 2005 Year Opened: 1997 Deposits: $31.1 mm Deposits: $257.6 mm Source: SNL Financial Deposit data as of 6/30/14 Note: Map excludes Greenville loan production office 27

Acquired FCBC Branch Locations Elizabethtown, NC Shallotte, NC Address: 306 S Poplar St. Address: 200 Smith Ave. Year Opened: 2005 Year Opened: 2007 Heath Springs, NC Deposits: $24.8 mm Deposits: $33.5 mm Southport, NC Address: 202 N. Main St. Address: 4945 Southport-Supply Rd. Year Opened: 1936 Year Opened: 2006 Deposits: $10.0 mm Deposits: $21.2 mm Chadbourn, NC Southport, NC Address: 111 Strawberry Blvd. Address: 115 N Howe St. Year Opened: 1960 Year Opened: 2005 Deposits: $36.4 mm Deposits: $7.4 mm Whiteville, NC Holden Beach, NC Address: 110 N. JK Powell Rd. Address: 3178 Holden Beach Rd. Year Opened: 1997 Year Opened: 2000 Deposits: $35.0 mm Deposits: $16.7 mm Tabor City, NC Ocean Isle Beach, NC Address: 105 Hickman Rd. Address: 7290-17 Beach Dr. SW Year Opened: 1997 Year Opened: 2007 Deposits: $26.6 mm Deposits: $8.8 mm Conway, SC Little River, SC Address: 1230 16th Ave. Address: 1180 Highway 17 Year Opened: 2006 Year Opened: 2008 Deposits: $9.6 mm Deposits: $6.5 mm Deposit data as of 6/30/14 Note: Map excludes Wilmington loan production office 28
Appendix II: Peer Comparison Detail

Peer Comparison Financial Condition Includes all major exchange traded banks and thrifts headquartered in the Southeast with total assets between $1.25 billion and $4.0 billion General Information YTD Profitability Capital Ratios Asset Quality Tang. LTM Com. Eq./ Leverage LLR/ NPAs/ NCOs/ Assets ROAA ROAE NIM Assets Ratio Loans HFI Assets Avg Loans Institution Ticker Headquarters ($mm) (%) (%) (%) (%) (%) (%) (%) (%) (1) Carolina Financial Corporation CARO Charleston, SC 1,258 0.92 10.10 3.42 7.01 8.66 1.35 1.10 (0.09) Ameris Bancorp ABCB Moultrie, GA 3,999 1.02 11.46 4.54 7.27 8.83 0.78 1.43 0.32 Bear State Financial, Inc. BSF Little Rock, AR 1,528 2.78 25.69 4.48 8.84 8.10 1.22 0.98 0.16 C1 Financial, Inc. BNK Saint Petersburg, FL 1,548 0.50 5.01 4.21 11.89 12.32 0.48 3.78 0.37 Capital City Bank Group, Inc. CCBG Tallahassee, FL 2,500 0.38 3.47 3.44 8.22 10.97 1.35 2.61 0.54 CenterState Banks, Inc. CSFL Davenport, FL 3,639 0.23 2.03 4.27 9.85 9.39 0.81 1.15 0.10 CommunityOne Bancorp COB Charlotte, NC 2,016 0.39 8.82 3.41 4.20 6.48 1.63 2.39 0.13 Fidelity Southern Corporation LION Atlanta, GA 2,862 1.15 12.43 3.59 8.89 10.64 1.36 1.58 0.20 First Bancorp FBNC Southern Pines, NC 3,196 0.74 6.27 4.34 7.86 11.39 1.82 1.78 0.64 Home Bancorp, Inc. HBCP Lafayette, LA 1,260 0.78 6.45 4.64 11.67 11.34 0.82 1.13 0.16 HomeTrust Bancshares, Inc. HTBI Asheville, NC 2,214 0.42 2.39 3.99 16.40 14.43 1.44 2.71 0.14 MidSouth Bancorp, Inc. MSL Lafayette, LA 1,892 1.10 10.27 4.65 6.26 9.56 0.76 0.66 0.25 (1) NewBridge Bancorp NBBC Greensboro, NC 2,640 0.57 6.21 3.69 8.38 8.54 1.31 0.39 0.28 Park Sterling Corporation PSTB Charlotte, NC 2,326 0.58 4.69 4.01 10.06 10.09 0.61 0.62 (0.07) (1) Seacoast Banking Corporation of Florida SBCF Stuart, FL 3,039 0.42 4.08 3.19 9.36 10.51 1.26 1.01 (0.02) (1) State Bank Financial Corporation STBZ Atlanta, GA 3,436 1.20 6.98 6.19 13.69 13.81 1.81 0.21 (0.03) (1) Stonegate Bank SGBK Pompano Beach, FL 2,201 0.60 5.36 3.70 8.98 9.59 1.49 0.30 (0.01) Min: 0.23 2.03 3.19 4.20 6.48 0.48 0.21 (0.07) Median: 0.58 6.21 4.11 8.94 10.30 1.29 1.14 0.16 Max: 1.20 12.43 6.19 16.40 14.43 1.82 3.78 0.64 Source: SNL Financial; data as of or for the nine months ended 9/30/14; BSF ROAA and ROAE excluded from min, median and max CARO balance sheet and capital ratios pro forma for branch acquisition; profitability and asset quality ratios exclude impact of branch acquisition Excludes banks headquartered in Kentucky, Virginia and West Virginia; excludes merger targets Asset quality ratios adjusted to exclude loans and OREO covered by the FDIC; NPAs exclude performing restructured loans (1) Pro forma for recent acquisition 30

Peer Comparison Market Performance Includes all major exchange traded banks and thrifts headquartered in the Southeast with total assets between $1.25 billion and $4.0 billion General Information Stock Price Performance Book Value & Earnings Multiples 1/8/15 1-Year 1-Year Price/ Last Quarter Market Closing Price Total Price/ Tang. Annualized Estimate 2015 Estimate 2016 Estimate Value Price Change Return Book Book EPS P/E EPS P/E EPS P/E Institution Ticker ($mm) ($) (%) (%) (%) (%) ($) (X) ($) (X) ($) (X) (1) Carolina Financial Corporation CARO 113 13.99 39.2 39.7 123 129 1.20 11.7 -- -- -- -- Ameris Bancorp ABCB 661 24.70 20.0 20.8 187 231 1.72 14.4 2.01 12.3 2.23 11.1 Bear State Financial, Inc. BSF 289 10.87 39.0 39.0 219 274 2.70 4.0 -- -- -- --C1 Financial, Inc. BNK 266 17.94 11.9 11.9 156 157 0.72 24.9 1.16 15.5 1.69 10.6 Capital City Bank Group, Inc. CCBG 510 15.24 30.7 31.5 94 134 0.48 31.8 0.62 24.7 0.93 16.5 CenterState Banks, Inc. CSFL 236 11.29 11.8 12.2 115 146 0.32 35.3 0.81 13.9 0.95 11.9 CommunityOne Bancorp COB 339 10.86 (9.1) (9.1) 250 280 0.32 33.9 0.50 21.9 0.50 21.9 Fidelity Southern Corporation LION 349 15.89 1.7 3.8 131 133 1.52 10.5 1.29 12.3 1.34 11.9 First Bancorp FBNC 329 17.73 7.7 9.6 111 142 1.08 16.4 1.45 12.2 1.67 10.6 Home Bancorp, Inc. HBCP 187 22.90 21.3 21.7 108 111 1.64 14.0 1.78 12.9 1.86 12.3 HomeTrust Bancshares, Inc. HTBI 329 16.02 0.3 0.3 87 91 0.48 33.4 0.72 22.3 0.84 19.1 MidSouth Bancorp, Inc. MSL 318 16.47 (3.9) (2.0) 113 162 1.48 11.1 1.56 10.6 1.73 9.5 (1) NewBridge Bancorp NBBC 432 8.44 18.5 18.5 133 150 0.56 15.1 0.57 14.9 0.71 11.9 Park Sterling Corporation PSTB 688 7.08 1.0 2.2 117 138 0.24 29.5 0.45 15.8 0.53 13.4 (1) Seacoast Banking Corporation of Florida SBCF 367 13.03 6.8 6.8 139 153 0.48 27.1 0.67 19.5 0.81 16.1 (1) State Bank Financial Corporation STBZ 600 19.66 10.4 11.4 133 145 1.36 14.5 1.26 15.6 1.15 17.0 (1) Stonegate Bank SGBK 362 28.95 27.4 28.2 156 199 1.36 21.3 1.70 17.0 2.07 14.0 Min: 187 (9.1) (9.1) 87 91 10.5 10.6 9.5 Median: 344 11.1 11.6 132 148 21.3 15.5 12.3 Max: 688 39.0 39.0 250 280 35.3 24.7 21.9 Source: SNL Financial; data as of or for the three months ended 9/30/14; pricing data as of 1/8/15; BSF LQA EPS from min, median and max CARO price change and total return since listing on the NASDAQ on 7/1/14; BNK price change and total return since IPO on 8/14/14 Total return includes reinvestment of dividends (1) Pro forma for recent acquisition; CARO book value and tangible book value per share pro forma for recent branch acquisition 31