Attached files
| file | filename |
|---|---|
| 8-K - FORM 8-K - AETNA INC /PA/ | form8k.htm |

© Aetna Inc. 2015 All rights reserved. J.P. Morgan 33rd Annual Healthcare Conference January 13, 2015 Mark Bertolini Chairman and Chief Executive Officer

Aetna Inc. 33rd Annual J.P. Morgan Healthcare Conference | January 13, 2015 2 Cautionary Statement; Additional Information Certain information in this presentation is forward‐looking, including our projections, estimates and expectations as to the future state of health care; our operating revenue growth; our operating earnings per share (EPS) and operating EPS growth and its drivers and components; our amortization of other acquired intangible assets; our weighted average diluted shares; our total shareholder return; our share repurchases; our capital generation and deployment; our operating revenue and its drivers and components; the effectiveness of our strategy; our Medicare Advantage membership growth; our Medicare Star ratings and membership in 4+ star rated plans; our Individual business dynamics; our Medicaid LTSS and dual eligibles premiums; our private exchange membership and opportunity; our other financial and non‐financial projections; and our estimates and views regarding our businesses and the environment in which we operate our businesses. Forward‐looking information is based on management's estimates, assumptions and projections and is subject to significant uncertainties and other factors, many of which are beyond our control. Important risk factors could cause actual future results and other future events to differ materially from those currently estimated by management, including: unanticipated increases in medical costs (including increased intensity or medical utilization as a result of flu or otherwise; changes in membership mix to higher cost or lower‐premium products or membership‐adverse selection; medical cost increases resulting from unfavorable changes in contracting or re‐contracting with providers (including as a result of provider consolidation and/or integration); and increased pharmacy costs (including in our health insurance exchange products)); the implementation of health care reform legislation, including collection of health care reform fees, assessments and taxes through increased premiums; adverse legislative, regulatory and/or judicial changes to or interpretations of existing health care reform legislation and/or regulations; the implementation of health insurance exchanges; the profitability of our public health insurance exchange and Medicare Advantage products, where membership is greater than our initial projections and may have more adverse health status and/or higher medical benefit utilization than we projected; our ability to achieve the synergies and value creation contemplated by the Coventry acquisition; our ability to effectively integrate Coventry's businesses; the diversion of management time on Coventry and/or bSwift integration‐related issues; our ability to offset Medicare Advantage and PDP rate pressures; and changes in our future cash requirements, capital requirements, results of operations, financial condition and/or cash flows. Health care reform will continue to significantly impact our business operations and financial results, including our pricing and medical benefit ratios. Components of the legislation will be phased in over the next several years, with the most significant changes occurring in 2014, and we will be required to dedicate material resources and incur material expenses during that time to implement health care reform. Many significant parts of the legislation, including aspects of public health insurance exchanges, Medicaid expansion, enforcement related reporting for the individual and employer mandates, and reinsurance, risk corridor and risk adjustment, require further guidance and clarification at the federal level and/or in the form of regulations and actions by state legislatures to implement the law. In addition, pending efforts in the U.S. Congress to amend or restrict funding for various aspects of health care reform, and litigation challenging aspects of the law continue to create additional uncertainty about the ultimate impact of health care reform. As a result, many of the impacts of health care reform will not be known for the next several years. Other important risk factors include: adverse changes in health care reform and/or other federal or state government policies or regulations as a result of health care reform or otherwise (including legislative, judicial or regulatory measures that would affect our business model, restrict funding for or amend various aspects of health care reform, limit our ability to price for the risk we assume and/or reflect reasonable costs or profits in our pricing, such as mandated minimum medical benefit ratios, or eliminate or reduce ERISA pre‐emption of state laws (increasing our potential litigation exposure)); adverse and less predictable economic conditions in the U.S. and abroad (including unanticipated levels of, or increases in the rate of, unemployment); our ability to diversify our sources of revenue and earnings (including by expanding our direct‐to‐consumer sales and capabilities and our foreign operations), transform our business model, develop new products and optimize our business platforms; the success of our Healthagen®, Accountable Care Solutions and health information technology initiatives; adverse changes in size, product or geographic mix or medical cost experience of membership; managing executive succession and key talent retention, recruitment and development; failure to achieve and/or delays in achieving desired rate increases and/or profitable membership growth due to regulatory review or other regulatory restrictions, the difficult economy and/or significant competition, especially in key geographic areas where membership is concentrated, including successful protests of business awarded to us; failure to adequately implement health care reform; reputational or financial issues arising from our social media activities, data security breaches, other cybersecurity risks or other causes; the outcome of various litigation and regulatory matters, including audits, challenges to our minimum MLR rebate methodology and/or reports, guaranty fund assessments, intellectual property litigation and litigation concerning, and ongoing reviews by various regulatory authorities of, certain of our payment practices with respect to out‐of‐network providers and/or life insurance policies; our ability to integrate, simplify, and enhance our existing information technology systems and platforms to keep pace with changing customer and regulatory needs; our ability to successfully integrate our businesses (including Coventry, the InterGlobal group, bSwift and other businesses we may acquire in the future) and implement multiple strategic and operational initiatives simultaneously; our ability to manage health care and other benefit costs; adverse program, pricing, funding or audit actions by federal or state government payors, including as a result of sequestration and/or curtailment or elimination of the Centers for Medicare & Medicaid Services' star rating bonus payments; our ability to reduce administrative expenses while maintaining targeted levels of service and operating performance; failure by a service provider to meet its obligations to us; our ability to develop and maintain relationships (including collaborative risk‐sharing agreements) with providers while taking actions to reduce medical costs and/or expand the services we offer; our ability to demonstrate that our products lead to access to quality care by our members; our ability to maintain our relationships with third‐party brokers, consultants and agents who sell our products; increases in medical costs or Group Insurance claims resulting from any epidemics, acts of terrorism or other extreme events; changes in medical cost estimates due to the necessary extensive judgment that is used in the medical cost estimation process, the considerable variability inherent in such estimates, and the sensitivity of such estimates to changes in medical claims payment patterns and changes in medical cost trends; the ability to successfully complete the implementation of our agreement with CVS Caremark Corporation on a timely basis and to achieve projected operating efficiencies for the agreement; a downgrade in our financial ratings; and adverse impacts from any failure to raise the U.S. Federal government's debt ceiling or any sustained U.S. Federal government shut down. For more discussion of important risk factors that may materially affect Aetna, please see the risk factors contained in Aetna's 2013 Annual Report on Form 10‐K ("Aetna's 2013 Annual Report") on file with the Securities and Exchange Commission (the "SEC"). You also should read Aetna’s 2013 Annual Report and Aetna's Quarterly Report on Form 10‐Q for the quarter ended September 30, 2014, on file with the SEC, for a discussion of Aetna’s historical results of operations and financial condition.

Aetna Inc. 33rd Annual J.P. Morgan Healthcare Conference | January 13, 2015 Why Aetna
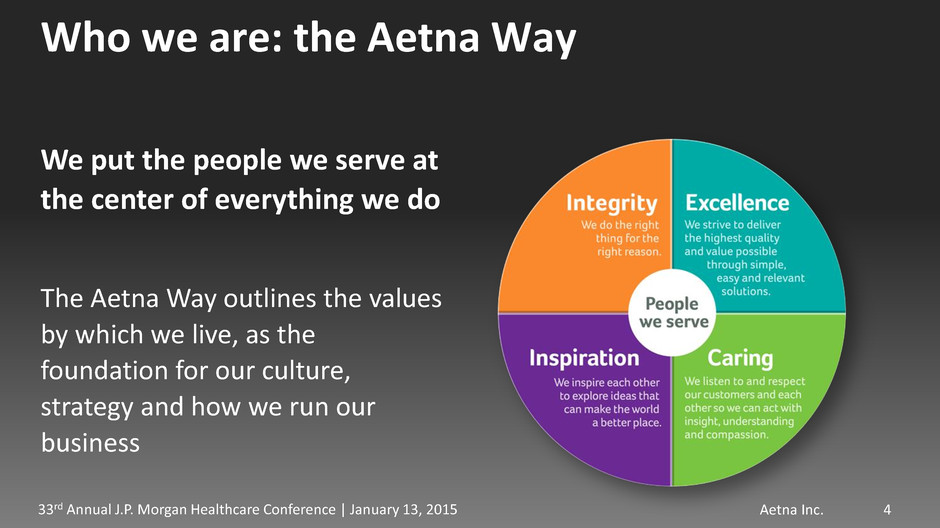
Aetna Inc. 33rd Annual J.P. Morgan Healthcare Conference | January 13, 2015 We put the people we serve at the center of everything we do The Aetna Way outlines the values by which we live, as the foundation for our culture, strategy and how we run our business 4 Who we are: the Aetna Way

Aetna Inc. 33rd Annual J.P. Morgan Healthcare Conference | January 13, 2015 Leading the Future of Healthcare 5 Identifying trends early Growing revenue and generating profit Deploying resources and capital Producing superior performance

Aetna Inc. 33rd Annual J.P. Morgan Healthcare Conference | January 13, 2015 6 Aetna has delivered growth in excess of our peers on the top and bottom line…. Source: Bloomberg consensus estimates used for 2014. Competitors include UNH, ANTM, HUM and CI. C A B D 2% 7% 8% 12% 15% Operating EPS Growth (2010-2014E CAGR) Operating Revenue Growth (2010-2014E CAGR) A B C D 6% 8% 9% 12% 14%
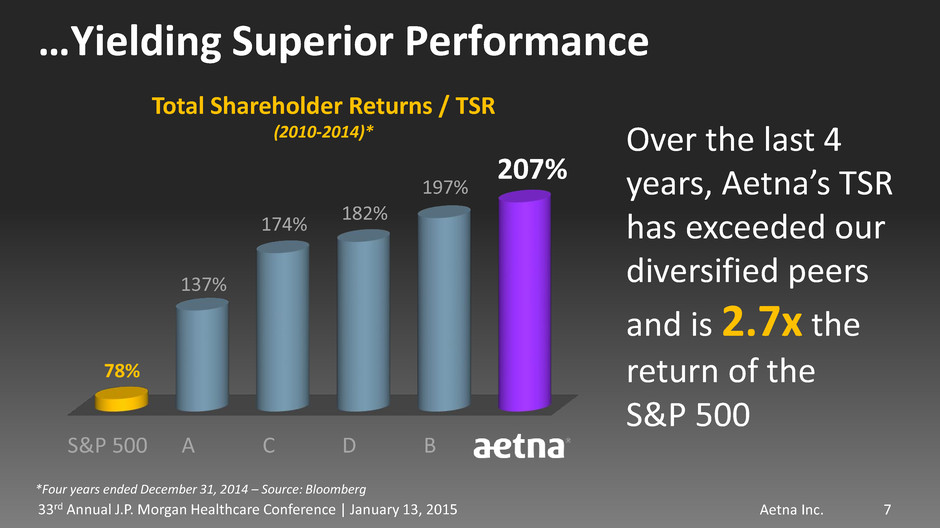
Aetna Inc. 33rd Annual J.P. Morgan Healthcare Conference | January 13, 2015 …Yielding Superior Performance Total Shareholder Returns / TSR (2010-2014)* Over the last 4 years, Aetna’s TSR has exceeded our diversified peers and is 2.7x the return of the S&P 500 7 S&P 500 A C D B 78% 137% 174% 182% 197% 207% *Four years ended December 31, 2014 – Source: Bloomberg
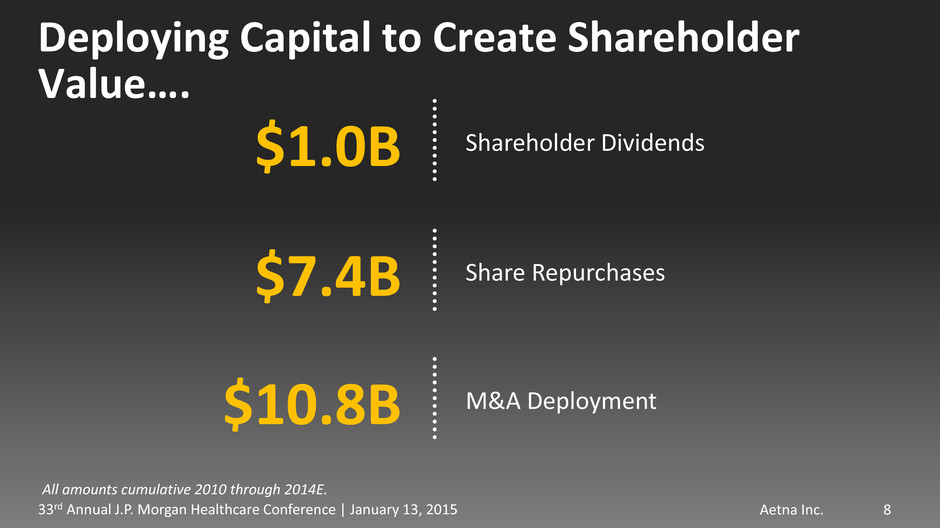
Aetna Inc. 33rd Annual J.P. Morgan Healthcare Conference | January 13, 2015 Deploying Capital to Create Shareholder Value…. 8 $1.0B Shareholder Dividends $7.4B Share Repurchases $10.8B M&A Deployment All amounts cumulative 2010 through 2014E.

Aetna Inc. 33rd Annual J.P. Morgan Healthcare Conference | January 13, 2015 9 Aetna’s Diversified Portfolio: Stability, Growth and Opportunity Large Group Insured Commercial ASC / Fee Group Insurance Government Small Group & Individual 2010 44% 11% 18% 22% 6% Operating Revenue 2010

Aetna Inc. 33rd Annual J.P. Morgan Healthcare Conference | January 13, 2015 10 Aetna’s Diversified Portfolio: Stability, Growth and Opportunity Large Group Insured Commercial ASC / Fee Group Insurance Government Small Group & Individual 32% 8% 18% 38% 4% 2014E Operating Revenue 2014E
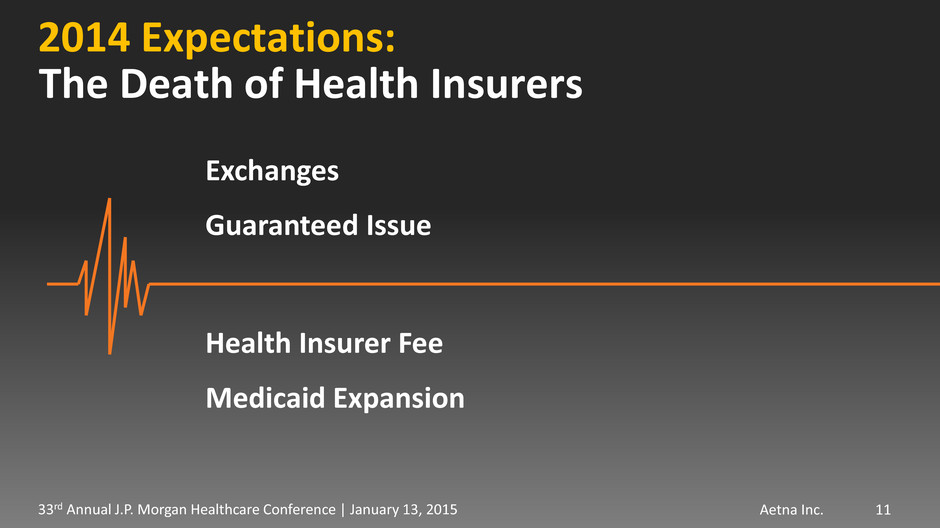
Aetna Inc. 33rd Annual J.P. Morgan Healthcare Conference | January 13, 2015 2014 Expectations: 11 Guaranteed Issue Health Insurer Fee Exchanges Medicaid Expansion The Death of Health Insurers

Aetna Inc. 33rd Annual J.P. Morgan Healthcare Conference | January 13, 2015 2014 Actual: Beat and Raise 12 3Q14 2Q14 1Q14 $1.55 $1.98 $1.60 $1.69 $1.58 $1.79 % Upside 28% 5% 14% Actual Consensus Initial 1Q14 2Q14 3Q14 $6.25 + $6.45 $6.53 2014 Guidance Midpoint 2014 Quarterly Operating EPS(1) Source: Bloomberg consensus estimates / surprise history. $6.60-$6.70(1)

Aetna Inc. 33rd Annual J.P. Morgan Healthcare Conference | January 13, 2015 Aetna’s differentiated strategy

Aetna Inc. 33rd Annual J.P. Morgan Healthcare Conference | January 13, 2015 14 “We cannot solve our problems with the same thinking we used when we created them.” ─ALBERT EINSTEIN
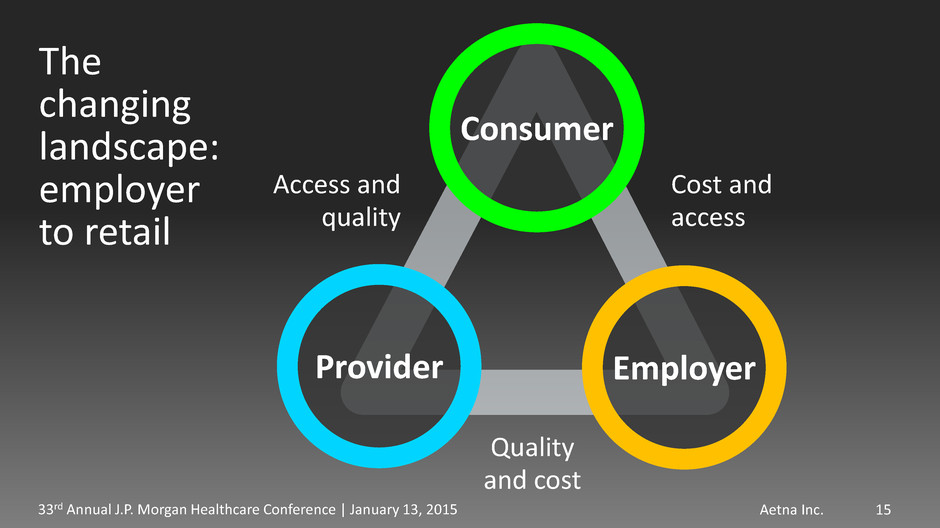
Aetna Inc. 33rd Annual J.P. Morgan Healthcare Conference | January 13, 2015 The changing landscape: employer to retail Cost and access Access and quality Quality and cost Consumer Provider Employer 15

Aetna Inc. 33rd Annual J.P. Morgan Healthcare Conference | January 13, 2015 The changing landscape: employer to retail Access and quality Consumer Provider 16

Aetna Inc. 33rd Annual J.P. Morgan Healthcare Conference | January 13, 2015 17 Our business must evolve Insurance company Managing risk End user an employee or part of a larger population Health care company End user increasingly an individual with personalized care needs Managing health

Aetna Inc. 33rd Annual J.P. Morgan Healthcare Conference | January 13, 2015 18 Consumer Institution By aligning to our customers’ future needs • Manage health care costs • Navigate the health care system • Keep me healthy • Predictable and sustainable costs • Healthy, productive employees / benefits • Deliver “triple aim” • Achieve sustainable economics Customers’ Future Needs
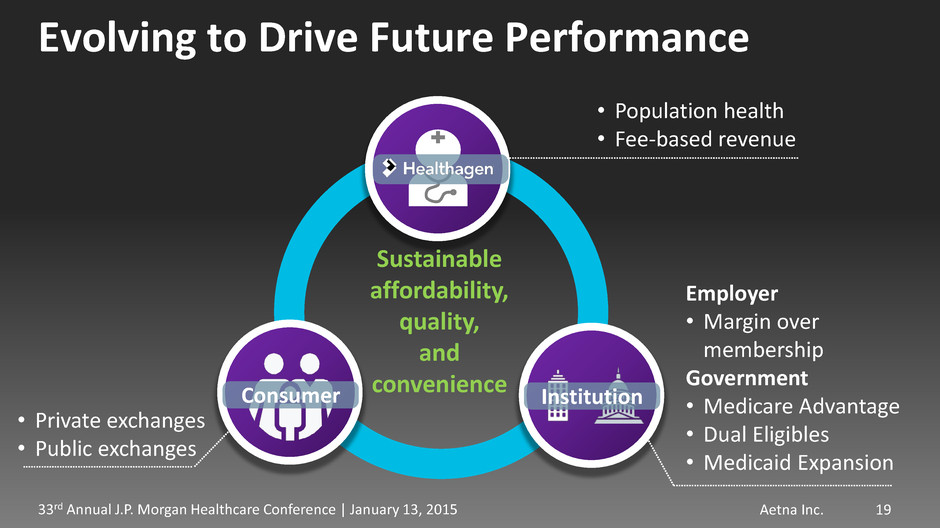
Aetna Inc. 33rd Annual J.P. Morgan Healthcare Conference | January 13, 2015 19 Consumer Institution Sustainable affordability, quality, and convenience Evolving to Drive Future Performance • Private exchanges • Public exchanges Employer • Margin over membership Government • Medicare Advantage • Dual Eligibles • Medicaid Expansion • Population health • Fee-based revenue

Aetna Inc. 33rd Annual J.P. Morgan Healthcare Conference | January 13, 2015 20 Institution Through a new healthcare model… Consumer Sustainable economics from payor / provider partnerships Affordable products “keep my doctor” Drive individuals toward retail marketplaces Retail Marketplaces

Aetna Inc. 33rd Annual J.P. Morgan Healthcare Conference | January 13, 2015 21 Annual shop/buy/enroll for medical product Year-round shop/buy/enroll for non-regulated products and wellness programs Eligibility, billing and enrollment Reporting, data management, HR / payroll integration Consumer Institution A key component of the vision + Investing in capabilities for the move to defined contribution

Aetna Inc. 33rd Annual J.P. Morgan Healthcare Conference | January 13, 2015 Executing our growth strategy

Aetna Inc. 33rd Annual J.P. Morgan Healthcare Conference | January 13, 2015 Capitalizing on multiple growth opportunities 2013 Operating Revenue(2) Annualized Coventry Revenue Organic Revenue Growth 2014E Operating Revenue(2) • Medicare Advantage • Public Exchanges • Duals • Medicaid Expansion • Private Exchanges $47.2B $57-$58B Over half of Aetna’s 2014E top-line growth comes from organic sources 23 ~10% ~11%

Aetna Inc. 33rd Annual J.P. Morgan Healthcare Conference | January 13, 2015 24 Aetna’s Medicare Advantage: a growth engine 2013 2014E 2015P 426 539 618 Aetna Individual MA Counties 2013 2014E 2015P 21% 62% 79% % of Members in 4+ Star Plans 2013 2014E 2015P 968 1,135 ~1,200 Medicare Advantage Members (000s) Aetna Medicare Advantage Membership has grown at a 11.3% CAGR from 2013-2015P Faster than the MA market* * Based on CBO projections, April 2014.
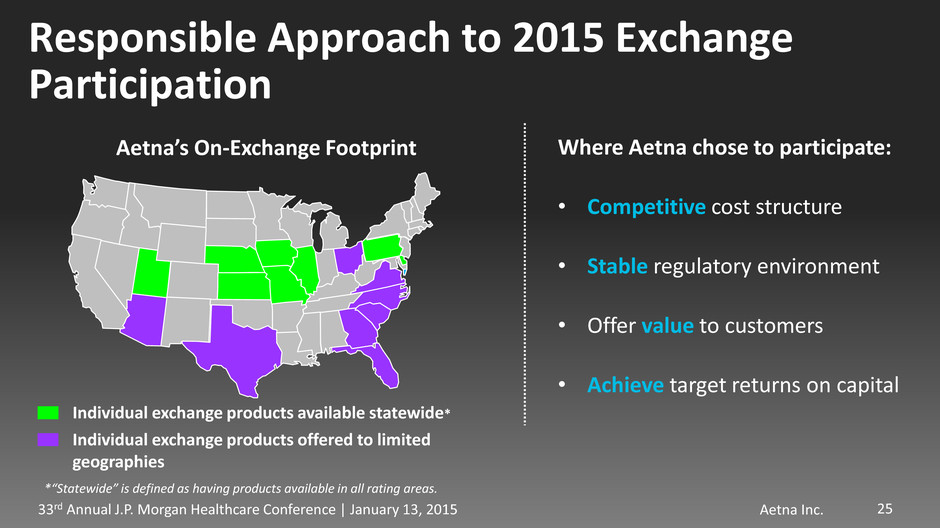
Aetna Inc. 33rd Annual J.P. Morgan Healthcare Conference | January 13, 2015 Responsible Approach to 2015 Exchange Participation 25 Individual exchange products available statewide* Individual exchange products offered to limited geographies *“Statewide” is defined as having products available in all rating areas. Aetna’s On-Exchange Footprint Where Aetna chose to participate: • Competitive cost structure • Stable regulatory environment • Offer value to customers • Achieve target returns on capital
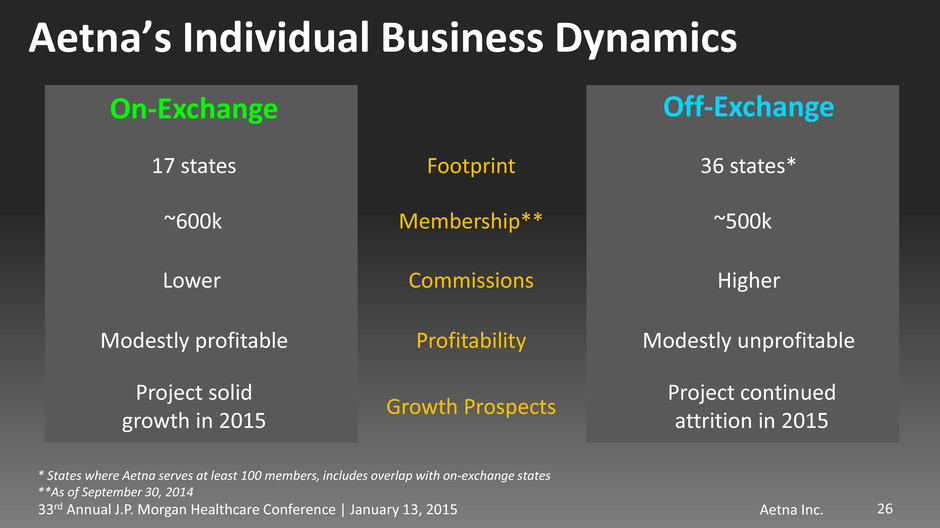
Aetna Inc. 33rd Annual J.P. Morgan Healthcare Conference | January 13, 2015 Aetna’s Individual Business Dynamics 26 On-Exchange Off-Exchange Commissions Footprint Growth Prospects Profitability 17 states 36 states* * States where Aetna serves at least 100 members, includes overlap with on-exchange states **As of September 30, 2014 Lower Higher Project solid growth in 2015 Project continued attrition in 2015 Modestly profitable Modestly unprofitable Membership** ~600k ~500k

Aetna Inc. 33rd Annual J.P. Morgan Healthcare Conference | January 13, 2015 New Growth in High Acuity Populations 27 2014E 2015P LTSS Duals ~$0.8 $2.0+ Focused on complex, high acuity populations Premiums* (billions) *Ohio, Illinois, Michigan, New York, Florida and New Jersey high acuity premiums Ohio Illinois Michigan New York Florida New Jersey

Aetna Inc. 33rd Annual J.P. Morgan Healthcare Conference | January 13, 2015 The Private Exchange Opportunity 28 Industry national account membership Conversion to private exchanges by 2018 Insured penetration Aetna maintains current private exchange position ~45M 50% 40% ~15% Aetna 2018 Private Exchange Opportunity ~$7.5 billion of premium ~$375 million pre-tax operating profit At mid single-digit margin

Aetna Inc. 33rd Annual J.P. Morgan Healthcare Conference | January 13, 2015 Focused on continuing to deliver results

Aetna Inc. 33rd Annual J.P. Morgan Healthcare Conference | January 13, 2015 PYD & Weather 2014E Group Insurance Reset CVH & Cost Leverage Capital Deployment Underlying Business Growth 2015P $6.60-$6.70 At least $6.90 $0.20 $0.25 $0.45 ($0.10) ($0.55) 2015 Operating EPS(1) Outlook Assumes no meaningful changes to ACA or related regulations; see cautionary statement for additional risk factors. 30
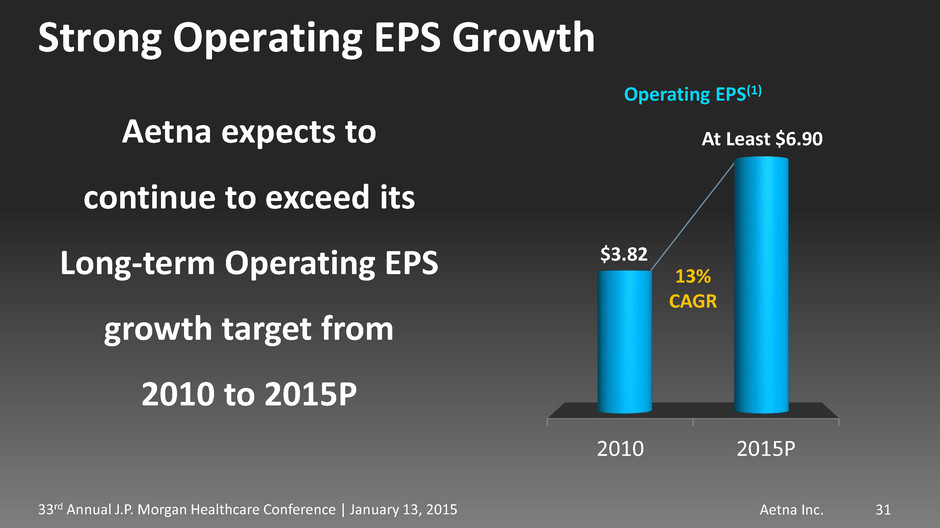
Aetna Inc. 33rd Annual J.P. Morgan Healthcare Conference | January 13, 2015 Strong Operating EPS Growth 31 2010 2015P $3.82 13% CAGR Operating EPS(1) Aetna expects to continue to exceed its Long-term Operating EPS growth target from 2010 to 2015P At Least $6.90

Aetna Inc. 33rd Annual J.P. Morgan Healthcare Conference | January 13, 2015 32 Targeting low-double digit Operating EPS growth on average over time Drive operating earnings • Grow Government Franchise • Retail Marketplaces • Grow fee-based businesses • Price to trend in Commercial Deploy capital effectively • Shareholder dividend • Invest in organic growth • Disciplined M&A • Share repurchases Aetna projects it can return to its targeted Operating EPS growth rate in 2016

Aetna Inc. 33rd Annual J.P. Morgan Healthcare Conference | January 13, 2015 2010 2014E 2018P $34 Operating Revenue Drivers Public / private exchanges Dual eligibles Medicare Advantage Medicaid Aetna Believes At Least $10.00 in Operating EPS is Achievable in 2018 $57-$58 $80+ 2010 2014E 2018P $3.82 $6.60-$6.70 $10.00+ Operating EPS Drivers Top-line growth Operational efficiencies Capital deployment Operating Revenue(2) (billions) Operating EPS(1) 33

Aetna Inc. 33rd Annual J.P. Morgan Healthcare Conference | January 13, 2015 34 Footnotes (1) Projected full-year 2014 operating earnings and projected full-year 2014 operating earnings per share exclude from net income attributable to Aetna net realized capital gains of $52.2 million ($80.6 million pretax), transaction and integration-related costs of $101.9 million ($154.8 million pretax), a loss on early extinguishment of debt of $59.7 million ($91.9 million pretax) and a release of a litigation-related reserve of $67.0 million ($103.0 million pretax), each reported by Aetna for the nine months ended September 30, 2014. Projected full-year 2014 operating earnings and projected full-year 2014 operating earnings per share also exclude from net income attributable to Aetna estimated after-tax amortization of other acquired intangible assets of approximately $158 million ($243 million pretax), which includes amortization of other acquired intangible assets of $119.4 million ($183.6 million pretax) reported by Aetna for the nine months ended September 30, 2014. Projected operating earnings and projected operating earnings per share in all periods also exclude from net income attributable to Aetna projected integration-related costs related to the Coventry Health Care, Inc. (“Coventry”), InterGlobal group (“InterGlobal”) and bSwift, LLC (“bSwift”) acquisitions, any future net realized capital gains or losses, amortization of other acquired intangible assets and other items, if any, that neither relate to the ordinary course of our business nor reflect our underlying business performance. Aetna is not able to project the amount of future net realized capital gains or losses or any such other items (other than projected integration-related costs related to the Coventry, InterGlobal and bSwift acquisitions) and therefore cannot reconcile projected operating earnings to projected net income attributable to Aetna or projected operating earnings per share to projected net income attributable to Aetna per share in any period. Although the excluded items may recur, management believes that operating earnings and operating earnings per share provide a more useful comparison of Aetna's underlying business performance from period to period. After-tax amortization of other acquired intangible assets relates to our acquisition activities, including Coventry, InterGlobal and bSwift. However, this amortization does not directly relate to the underwriting or servicing of products for customers and is not directly related to the core performance of Aetna’s business operations. Net realized capital gains and losses arise from various types of transactions, primarily in the course of managing a portfolio of assets that support the payment of liabilities. However, these transactions do not directly relate to the underwriting or servicing of products for customers and are not directly related to the core performance of Aetna's business operations. In addition, management uses operating earnings to assess business performance and to make decisions regarding Aetna's operations and the allocation of resources among Aetna's businesses. Operating earnings is also the measure reported to the Chief Executive Officer for these purposes. Non-GAAP financial measures we disclose, such as operating earnings, operating earnings per share and operating revenue, should not be considered a substitute for, or superior to, financial measures determined or calculated in accordance with GAAP. Projected operating earnings per share for the full year 2014 and 2015 reflect the low end of a range of 359 million to 360 million weighted average diluted shares and a range of 350 million to 352 million weighted average diluted shares, respectively.

Aetna Inc. 33rd Annual J.P. Morgan Healthcare Conference | January 13, 2015 35 Footnotes (continued) Below is a reconciliation of Aetna’s operating earnings per share to net income attributable to Aetna per share for the quarters ended September 30, 2014, June 30, 2014 and March 31, 2014 and for the year ended December 31, 2010: Year Ended September 30, 2014 June 30, 2014 March 31, 2014 December 31, 2010 Operating earnings 1.79$ 1.69$ 1.98$ 3.82$ Transaction and integration-related costs , net of tax (.06) (.10) (.12) (.10) Loss on early extinguishment of long-term debt, net of tax - - (.16) - Release of l i tigation-related reserve, net of tax - - .18 - Li tigation-related insurance proceeds , net of tax - - - .24 Severance and faci l i ties charge, net of tax - - - (.07) Amortization of other acquired intangible assets , net of tax (.11) (.11) (.11) (.14) Net real ized capita l ga ins , net of tax .05 .04 .05 .43 Net income (GAAP measure) 1.67$ 1.52$ 1.82$ 4.18$ Three Months Ended

Aetna Inc. 33rd Annual J.P. Morgan Healthcare Conference | January 13, 2015 36 Footnotes (continued) (2) Projected full-year 2014 operating revenue excludes from total revenue net realized capital gains of $80.6 million pretax reported by Aetna for the nine months ended September 30, 2014. Projected operating revenue also excludes any future net realized capital gains or losses and other items, if any, from total revenue. Aetna is not able to project the amount of future net realized capital gains or losses or any such other items and therefore cannot reconcile projected operating revenue to projected total revenue in any period. Below is a reconciliation of Aetna’s operating revenue to total revenue for the years ended December 31, 2013 and 2010: (Millions) 2013 2010 Operating revenue (excludes net real ized capita l (losses) gains and other i tems) (A) 47,194.7$ 34,024.5$ Group annuity contract convers ion premium 99.0 - Interest income on proceeds of transaction-related debt 2.5 - Gain on sa le of reinsurance recoverable 7.2 - Net real ized capita l (losses) gains (8.8) 227.5 Total revenue (GAAP measure) (B) 47,294.6$ 34,252.0$
