Attached files
| file | filename |
|---|---|
| 8-K - FORM 8-K - Blue Bird Corp | d849511d8k.htm |
 Hennessy Capital Acquisition Corp.
Acquisition of Blue Bird Corporation
Investor Presentation
January 2015
Exhibit 99.1 |
 2
Important Disclaimers
Use of Projections
The information in this presentation is highly confidential. The distribution of this presentation by
an authorized recipient to any other person is unauthorized. Any photocopying, disclosure,
reproduction or alteration of the contents of this presentation and any forwarding of a copy of this presentation or any portion of this presentation to any person is prohibited.
The recipient of this presentation shall keep this presentation and its contents confidential, shall
not use this presentation and its contents for any purpose other than as expressly authorized
by Hennessy Capital Acquisition Corp. (“HCAC”) and Blue Bird Corporation (“Blue Bird”) and shall be required to return or destroy all copies of this presentation or portions
thereof in its possession promptly following request for the return or destruction of such copies. By
accepting delivery of this presentation, the recipient is deemed to agree to the foregoing
confidentiality requirements. In this
presentation, certain of the above-mentioned projected information has been repeated (in each case, with an indication that the information is an estimate and is subject to the
qualifications presented herein), for purposes of providing comparisons with historical data. The
assumptions and estimates underlying the prospective financial information are inherently
uncertain and are subject to a wide variety of significant business, economic and competitive risks and uncertainties that could cause actual results to differ materially from
those contained in the prospective financial information. Accordingly, there can be no assurance that
the prospective results are indicative of the future performance of Hennessy Capital or Blue
Bird or that actual results will not differ materially from those presented in the prospective financial information. Inclusion of the prospective financial information in this
presentation should not be regarded as a representation by any person that the results contained in
the prospective financial information will be achieved. Confidentiality
This presentation and the preliminary proxy statement referred to below contain financial forecasts
with respect to Blue Bird’s projected net revenues and Adjusted EBITDA for Blue Bird’s
fiscal 2015. Neither Hennessy Capital’s independent auditors, nor the independent registered public accounting firm of Blue Bird, audited, reviewed, compiled, or performed any
procedures with respect to the projections for the purpose of their inclusion in this presentation and
the preliminary proxy statement, and accordingly, neither of them expressed an opinion or
provided any other form of assurance with respect thereto for the purpose of this presentation or the preliminary proxy statement. PricewaterhouseCoopers LLP and KPMG
LLP did not audit, review, compile or perform any procedures with respect to that information and has
not expressed any opinion or any other form of assurance with respect thereto. These projections
should not be relied upon as being necessarily indicative of future results. Reference is made to pages 145-149 of the preliminary proxy statement for a full
description of the limitations associated with these forecasts. |
 3
Important Disclaimers (continued)
Other companies may calculate Adjusted EBITDA and other non-GAAP measures differently, and
therefore our Adjusted EBITDA and other non-GAAP measures and that of Blue Bird may
not be directly comparable to similarly titled measures of other companies. This presentation includes “forward looking statements” within the meaning of
the “safe harbor” provisions of the United States Private Securities Litigation Reform Act of 1995. Forward-looking
statements may be identified by the use of words such as "forecast," "intend,"
"seek," "target," “anticipate,” “believe,” “expect,” “estimate,” “plan,” “outlook,” and “project” and other similar
expressions that predict or indicate future events or trends or that are not statements of
historical matters. Such forward looking statements include projected financial information. Such forward
looking statements with respect to revenues, earnings, performance, strategies, prospects and
other aspects of the businesses of HCAC, Blue Bird and the combined company after completion of
the proposed business combination are based on current expectations that are subject to risks
and uncertainties. A number of factors could cause actual results or outcomes to differ materially
from those indicated by such forward looking statements. These factors include, but are not
limited to: (1) the failure of the parties to consummate the transactions contemplated by the definitive
purchase agreement relating to the proposed business combination (the “Purchase
Agreement”) including the occurrence of any event, change or other circumstances that could give rise to the
termination of the Purchase Agreement; (2) the outcome of any legal proceedings that may be
instituted against Blue Bird or HCAC arising from the announcement of the proposed business
combination and transactions contemplated thereby; (3) the inability to complete the
transactions contemplated by the proposed business combination due to the failure to obtain approval of the
stockholders of HCAC, or the failure to satisfy other conditions to closing in the Purchase
Agreement; (4) the inability to obtain or maintain the listing of the post-combination company’s common
stock on NASDAQ following the business combination; (5) the risk that the proposed business
combination disrupts current plans and operations as a result of the announcement and
consummation of the transactions described herein; (6) the inability to recognize the
anticipated benefits of the business combination, which may be affected by, among other things, competition,
and the ability of the combined business to grow and manage growth profitably; (7) costs related
to the business combination; (8) changes in applicable laws or regulations; (9) the possibility that
Blue Bird or HCAC may be adversely affected by other economic, business, and/or competitive
factors; and (10) other risks and uncertainties indicated from time to time in the proxy statement,
including those under “Risk Factors” therein, and other documents filed or to be filed
with the Securities and Exchange Commission (“SEC”) and delivered to HCAC's stockholders. You are cautioned
not to place undue reliance upon any forward-looking statements, which speak only as of the
date made. HCAC and Blue Bird undertake no commitment to update or revise the forward-looking
statements, whether as a result of new information, future events or otherwise. In most
instances, where third party sources are identified in this presentation, the information has been derived
by Blue Bird management from the source data.
Forward Looking Statements
Blue Bird believes that the use of these non-GAAP financial measures provides an additional
tool for investors to use in evaluating ongoing operating results and trends. Management
of Blue Bird does not consider these non-GAAP measures in isolation or as an alternative to
financial measures determined in accordance with GAAP. We have not reconciled the non-
GAAP forward looking information to their corresponding GAAP measures because we do not provide
guidance for the various reconciling items such as stock-based compensation,
provision for income taxes and depreciation and amortization, as certain items that impact these
measures are out of our control or cannot be reasonably predicted. You should review Blue
Bird’s audited financial statements, which are and will be presented in HCAC's proxy statement filings with the SEC, including the proxy statement to be delivered to HCAC’s
stockholders, and not rely on any single financial measure to evaluate Blue Bird’s
business. Use of Non-GAAP Financial Measures
This presentation includes non-GAAP financial measures, including Adjusted EBITDA, Adjusted
EBITDA Margin and Net Debt. Adjusted EBITDA involves certain adjustments to EBITDA, which
is calculated as earnings before interest, taxes, depreciation and amortization (“EBITDA” ). Adjusted EBITDA includes add-backs for Restructuring costs, Non-recurring
Management Incentive Compensation and other non-recurring expenses. Adjusted EBITDA
Margin is defined as Adjusted EBITDA divided by total revenues. Net Debt is defined as Total
Debt less Cash and Cash Equivalents. You can find the reconciliation of these measures to the
nearest comparable GAAP measures elsewhere in this presentation. Except as otherwise
noted, all references herein to full-year periods refer to Blue Bird’s fiscal year,
which ends on the Saturday closest to September 30. Blue Bird believes that these non-GAAP measures of financial results provide useful
information to management and investors regarding certain financial and business trends relating
to Blue Bird’s financial condition and results of operations. Blue Bird’s management
uses these non-GAAP measures to compare Blue Bird’s performance to that of prior periods for
trend analyses, for purposes of determining management incentive compensation, and for budgeting
and planning purposes. These measures are used in monthly financial reports prepared for
management and Blue Bird’s board of directors. |
 4
Important Disclaimers (continued)
Additional Information
Important
Information
about
the
Warrant
Exchange
Offer
Participants in the Solicitation
The proposed business combination will be submitted to stockholders of HCAC for their consideration.
In connection with that approval, HCAC has filed with the SEC a preliminary proxy statement
containing information about the proposed transaction and the respective businesses of Blue Bird and HCAC. Stockholders are urged to read the preliminary proxy
statement and the definitive proxy statement when it becomes available because they will contain
important information. Stockholders will be able to obtain a free copy of the proxy
statement, as well as other filings containing information about HCAC, without charge, at the
SEC’s Internet site (www.sec.gov). Copies of the proxy statement can also be obtained,
without charge, by directing a request to Charles Lowrey, Executive Vice President & CFO, 700
Louisiana Street, Suite 900, Houston, Texas 77002. HCAC has commenced an exchange offer for HCAC’s outstanding warrants. This presentation is
neither an offer to exchange nor a solicitation of an offer to sell any securities. The
solicitation and the offer to exchange HCAC’s public warrants are being made solely pursuant to
an offer to exchange and related materials that HCAC has filed with the SEC on January 7, 2015,
as exhibits to the HCAC tender offer statement on Schedule TO. The Schedule TO (including an offer to exchange, a related letter of transmittal and other offer
documents) contains important information that should be read carefully and considered before any
decision is made with respect to the exchange offer. These materials are being sent free of
charge to holders of HCAC’s outstanding warrants. In addition, all of these materials (and all other materials filed by HCAC with the SEC) are available at no charge from
the SEC through its website at www.sec.gov. Security holders may also
obtain free copies of the documents filed with the SEC by HCAC by directing a request to: Morrow & Co., LLC,
HCAC’s information agent, at 470 West Avenue, 3rd Floor, Stamford, CT 06902, or by phone at (800)
662-5200 or email at hennessy.info@morrowco.com. Holders of HCAC’s
outstanding warrants are urged to read the exchange offer documents and the other relevant materials
(as they become available) before making any investment decision with respect to the exchange
offer because they contain important information about the exchange offer and the transaction. HCAC and its directors and executive officers and other persons may be deemed to be participants in
the solicitations of proxies from HCAC’s stockholders in respect of the proposed business
combination and the other matters set forth in the proxy statement. Information regarding HCAC’s directors and executive officers and a description of their direct and indirect
interests, by security holdings or otherwise, is contained in the Company’s preliminary proxy
statement for the Business Combination, which has been filed with the SEC.
|
 5
Daniel J. Hennessy
Chairman and CEO, HCAC |
 Hennessy Capital Acquisition Corp.
Hennessy Capital is a special purpose acquisition company
formed in Delaware on September 24, 2013 for the purpose of
effecting a merger, capital stock exchange, asset acquisition,
stock purchase, reorganization or similar business combination
Hennessy Capital’s securities are traded on NASDAQ under the
symbols HCAC, HCACU and HCACW and will convert to BLBD
and BLBDW after the closing of the Business Combination
Cash in trust account at HCAC at September 30, 2014 was $115
million
Hennessy Capital selected Blue Bird from a candidate list of over
125 companies and after interviews with representatives of 19
potential acquisition targets
6 |
 7
HCAC View of Blue Bird
An iconic school bus brand
Engaged and committed leadership team with a proven
ability to drive productivity, growth and free cash flow
Substantial growth opportunities from both domestic
industry recovery and market share gains in existing and
new markets
Attractive valuation that is well positioned relative to
public market comparables
Strong support from a committed sponsor with
significant equity rollover |
 8
Transaction
Overview
Consideration
HCAC will acquire all of the outstanding capital stock of School
Bus
Holdings Inc., the indirect parent company of Blue Bird Corporation
(“Blue Bird”
or the “Company”)
HCAC
stockholders,
including
the
founders,
will
collectively
own
57.6%
of
the
pro forma combined company
(1)
and an affiliate of Cerberus
Capital Management, L.P. will continue to own 42.4% of Blue Bird
equity
(1)
Entity
expected
to
be
listed
on
NASDAQ
post
business
combination
and
take
the
name of Blue Bird Corporation
12,125,000 outstanding HCAC Warrants will be exchanged for 1,212,500
shares of HCAC common stock as part of the transaction
Transaction anticipated to close promptly after the stockholders’
meeting scheduled for February 9
th
Transaction value of $469 million
7.0x FY2014 Adjusted EBITDA of $67 million
6.3x
to
6.5x
FY2015E
Adjusted
EBITDA
of
$72
to
$75
million
(2)
Transaction Overview
(1)
Assumes
no
redemption
of
cash
in
trust
account
and
does
not
include
shares
underlying
Convertible
Preferred
Stock
or
outstanding
warrants,
other
than
the
1,212,500
shares
mentioned
above
(2)
See
“Important
Disclaimers”
for
information
regarding
FY
2015
estimated
information |
 9
Sources and Uses
Note: Assumes no redemption of cash in trust
$
%
HCAC Cash
115
$
41%
Convertible Preferred Stock
40
14%
Reinvestment of Existing Stockholders' Equity
115
41%
Cash from Blue Bird's Balance Sheet
10
4%
Total Sources
280
$
100%
$
%
Cash Purchase Price
140
$
50%
Reinvestment of Existing Stockholders' Equity
115
41%
Transaction Expenses
25
9%
Total Uses
280
$
100%
Sources
Uses
($ in millions) |
 Cash on Balance
Sheet 53
$
Total Debt (incl. Capital Leases)
223
$
Convertible Preferred Stock
40
Market Equity Capitalization
271
Total Capitalization
534
$
Pro Forma Enterprise Value
481
Pro Forma Ent. Value / FY2015E Adj. EBITDA
6.4 - 6.7x
Net Debt / FY2014 Adj. EBITDA
2.5x
10
Pro Forma Capitalization
(1)
(1)
Debt and cash balances as of September 27, 2014, pro forma for closing of
transaction. Assumes no redemption of cash in trust (2)
Market Equity Capitalization based on pro forma share count including issuance of
1,212,500 shares pursuant to the Warrant Exchange Offer and Sponsor Warrant Exchange and $10.00 per share price;
excludes shares underlying all other public and placement warrants
(3)
See “Important Disclaimers”
for information regarding FY 2015 estimated information
(4)
Net debt is defined as total debt ($223 million) less cash and cash equivalents ($53
million), or $170 million (2)
(4)
(3)
($ in millions) |
 11
Pro Forma Ownership
(1)
Assumes no redemption of cash in trust account; figures per proxy statement
(2)
Based on an assumed conversion price of $11.75 per share, which may be adjusted from
time to time (3)
Share count assumes the issuance of 575,000 shares of Hennessy Capital common stock
pursuant to the Public Warrant Exchange Offer; excludes shares underlying all other public warrants
(4)
Share count assumes the Issuance of 637,500 shares of Hennessy Capital common stock
pursuant to the Sponsor Warrant Exchange; excludes shares underlying all other placement warrants
(amounts in millions)
Assumes No Conversion
of Preferred Stock
(1)
Assumes Conversion
of Preferred Stock
(1)(2)
Common
Stock
%
Common
Stock
%
Cerberus Affiliate
11.5
42.4%
11.5
37.7%
HCAC Public Stockholders
(3)
12.1
44.6%
12.1
39.6%
HCAC Founders
(4)
3.5
13.0%
3.5
11.5%
PIPE Investment Investor
0.0
0.0%
3.4
11.2%
Total
27.1
100.0%
30.5
100.0% |
 Directors
Management and Board Experience
Age
Years
Blue Bird
Chan Galbato
Chairman
Cerberus Operations and Advisory Co. (CEO), Invensys (President, Controls Division), The
Home Depot (President, Services Division), Armstrong Floor Products (CEO)
Board: YP Holdings (Chairman), DynCorp, Steward Health Care
51
5
Daniel Hennessy
Vice Chairman
Hennessy Capital (Chairman & CEO), Code Hennessy & Simmons (Founding
Partner) Board: Thermon Group (Chairman), Dura-Line (Chairman)
57
--
Phil Horlock
President & CEO
Ford Motor Company (CFO Asia Pacific & Africa; Chairman & CEO Ford Motor Land
Development; Controller, Corporate Finance; Controller, Global Sales &
Marketing) Board: LoJack Corporation
58
5
Gurminder Bedi
Director
Ford Motor Company (VP of North America Truck)
Board: Compuware (Chairman), KEMET, Actuant
67
--
Kevin Charlton
Director
Hennessy Capital (President & COO), River Hollow Partners (Managing Partner),
Macquarie Capital (Managing Director), Investcorp (Managing Director)
Board: Spirit Realty, FleetPride
48
--
Dennis Donovan
Director
Cerberus Operations and Advisory Co. (Vice Chairman), The Home Depot (EVP HR),
Raytheon (SVP HR), GE
65
6
Dev Kapadia
Director
Cerberus Capital Management (Managing Director), The Carlyle Group
Board: Tower International
43
8
James Marcotuli
Director
Cerberus Operations and Advisory Co. (Senior Operating Executive), North American Bus
Industries (CEO), Lockheed Martin
55
1
Alan Schumacher
Director
American National Can (CFO)
Board: Federal Accounting Standards Advisory Board, Bluelinx, Evertec, Quality
Distribution, Noranda Aluminum Holding Corporation
67
6
12
The New Blue Bird Board of Directors |
 13
Phil Horlock
President and CEO
Blue Bird |
 Blue
Bird Highlights & Agenda 14
Iconic and Fastest Growing School Bus Brand
Bus sales volume (units) up more than 40% since 2010
North American market share up from 23% in 2010 to an estimate of 30-31% in
2014 Undisputed Leader in Alternative Fuel-Powered Bus Sales
Sold approximately 6x more alternative-fuel buses than all competitors combined
since 2010 Proprietary and class-leading propane buses with proven lower
cost per mile than diesel buses
Downside Risk Mitigation
Break-even volume (based on Adj. EBITDA) of 315 units per month in 2014 compared
with 400 in 2010
Strong liquidity and cash flow
Significant Upside Potential
Early stages of school bus industry rebound following trough in 2011
Only ~360 customers have purchased propane to date from potential of ~10,000
Present and future products focus on affordable and exclusive differentiation
Proven track record in reducing costs and growing bus and parts sales
Central and South America and Middle East are new-market growth
opportunities Experienced and committed management team that delivers
results Highlights
Why
Blue Bird
What
We’ve Done
Where
We’re Going
Agenda |
 15
Why
Blue Bird
What
We’ve Done
Where
We’re Going
Why Blue Bird |
 Experienced Management Team
16
Years
Name
Position
Key Prior Experience
Auto
Industry
Blue
Bird
Phil Horlock
President & Chief Executive Officer
37
5
Phil Tighe
Chief Financial Officer
38
2
John Kwapis
Chief Operating Officer
29
5
Dale Wendell
Chief Commercial Officer
38
3
Mike McCurdy
VP HR & External Affairs
15
15
Paul Yousif
VP Legal Affairs & Treasurer
14
7
Dave Whelan
SVP Supply Chain & Quality
12
12
Dennis Whitaker
VP Engineering
35
35
John McKowen
VP Manufacturing
18
8
Bill Landreth
VP Service Parts
40
1
Jeff Terlep
VP Marketing & Product Planning
22
New
Dean Coulson
VP International & Commercial Bus
17
12
Jeff Carpenter
VP North American Sales
30
30
Trey Jenkins
VP Alternative Fuels
22
5 |
 Strong Reputation
Blue Bird is an iconic brand with a track record of innovation
17
Blue Bird is the school bus brand
most likely to be recommended
(1)
Singularly focused on building the
world’s finest school bus
Purpose-built chassis designed
exclusively for safe transportation of
school children
Passionate about safety, quality,
durability and serviceability
Innovation that leads to unique-and-
affordable features
Key Blue Bird Industry Innovations
All Steel-Body School Bus (1937)
All American Forward Engine (1948)
Rear Engine Chassis (1978)
First CNG School Bus (1991)
First Propane School Bus (1992)
First All-Electric School Bus (1994)
Type C on Unique School Bus Chassis (2003)
First OEM-Manufactured Propane Bus (2007)
Ford/Roush CleanTech Propane Bus (2012)
OEM-installed telematics (2014)
(1)
Source: VSA Partners Research 3/22/2013 (study commissioned by Blue Bird)
|
 Product-Focused Company
Focus on translating market wants into sustainable growth
18
Full Product Range
Type A Buses
(Unconsolidated)
Aftermarket
6% Net Sales
(2014)
Specialty Buses
7% Net Sales
(2014)
Expansive & innovative product
cycle plans
Proven product development
process
Leader in alternative fuels
Exclusive engine offerings
Differentiated product features
Research-driven product
enhancements
Extensive aftersales service and
support
Type C Buses
65% Net Sales
(2014)
Type D Buses
22% Net Sales
(2014)
“Build the Best Bus” |
 Product Leadership
Blue Bird viewed as the leader in four of the five top attributes
19
(1)
Checkmarks/Corp. Logo indicate leadership in category
Ranked in Order of
Importance
(1)
Blue
Bird
Competitor A
Competitor B
#1
Safety
--
--
#2 Quality, Reliability &
Durability
--
--
#3 Operating Costs
--
--
#4 Acquisition Cost
--
--
#5 How the Bus Drives
--
--
Source: Freedonia Custom Research, Inc. 9/4/2013 (study commissioned by Blue
Bird) |
 Strong Dealer Network
Customer base is diverse
20
Source: Blue Bird Management
Export
2%
~3,400
Contractors
21%
~10,000 School
Districts
67%
49 U.S. & Canadian
dealers address
~3,400 Contractors &
~10,000 Districts
Blue Bird
North American Dealer Network
GSA
5%
3 Nat’l Fleets
5%
Blue Bird
FY2014 Sales by Customer Type
Note: Many dealers have multiple locations
= Dealer Location
= Service Center |
 Substantial production complexity
Stringent, industry-specific regulatory specifications
Unique customer requirements at both state and district
levels
~14,000 active production parts/bus
Average same-bus order less than 2 units
Labor-intensive production process with high employee
know-how
Significant capital and expertise required
Initial investment in facilities and tooling
Significant engineering to meet Federal and state
regulations
Development of an extensive distribution and service
channel with strong community ties
Conservative customers who demand proven products
Industry with High Barriers to Entry
Industry comprised of three material competitors since 2000
21 |
 22
What We’ve Done
Why
Blue Bird
What
We’ve Done
Where
We’re Going |
 Transformational Initiatives
Goal is sustained profitable growth
23
Reduced product cost and improved quality, cutting warranty claims by 39%
Operational
Commercial
2010
2009
2014
2013
2012
2011
Placed more than 85% of material purchases on long term contracts
Launched several leading and proprietary product features
Cut complexity by reducing body styles from 8 to 3
Increased productivity by reducing assembly plants from 2 to 1
Added 25% more capacity with 5-crew rolling shifts
Replaced 20% of dealer network
Institutionalized robust customer planning process with dealer body
Grew propane bus business with proprietary product offering
Started growing relationships with national fleets
Entered int’l business with Sigma bus for Bogota
Focused marketing on distinct product advantages
Formed JV with industry leader to design, produce and sell Type A bus
|
 Propane Advantage
Blue Bird is the undisputed leader in propane bus sales
24
Blue Bird Propane Sales (units)
“With today's tight school budgets, using a
transportation fuel like propane autogas that saves
taxpayers' money, keeps the environment clean, and
keeps jobs within our national borders is a win-win
for everyone.”
-
William Schofield, Superintendent
Hall County Schools
Gainesville, GA
Blue Bird sold approximately ~6x more
alternative fuel buses than competitors
combined since 2010
Gained first mover advantage in propane
with introduction in 2007
Exclusive
relationships
with
both
Ford
and
Roush CleanTech
Adoption of propane-powered buses is
accelerating; run rate at about 20% of Blue
Bird's mix
Advantages are compelling
Lower fuel and maintenance costs
~$0.20 per mile less expensive than diesel
Better cold weather starting
Less greenhouse exhaust gases
Low cost fueling stations
Quieter and easy to drive
~1,900
Major fleet purchased
over 400 units from
bankrupt Atlantic
Express displacing
planned Blue Bird
propane purchases
430 unit
one-time
fleet order
2,033
1,476
524
426
356
FY2010
FY2011
FY2012
FY2013
FY2014
Cum. # of
Customers
Buying
Propane
118
146
193
281
359 |
 Strong Market Share and Profit Growth
Track record of winning and growing the business
Market Share
25
Actual
Actual
Estimate
Adj. EBITDA
Revenue
$566M
Revenue
$856M
Up 51%
($ in millions)
$14
$17
$50
$67
3%
3%
7%
8%
FY2011
FY2012
FY2013
FY2014
Adjusted EBITDA
% of Revenue
FY2011
FY2012
FY2013
FY2014
FY2010
23%
26%
27%
30%
30%-31% |
 Why
Blue Bird
What
We’ve Done
Where
We’re Going
Where We’re Going
26 |
 Future Growth & Profit Drivers
Build on track record of profitable growth
27
Industry Volume Upside
School Bus Market Recovery
New Markets & Products
International & Commercial Buses
Higher Operating Margins
Drive Productivity
Deliver Parts Growth
Market Share Growth
Increasing Propane Penetration
Continuous Product Enhancements
Dealer Network Improvements
Future
Growth &
Profitability
Long-Term Financial
Objective:
EBITDA 10%
of Sales |
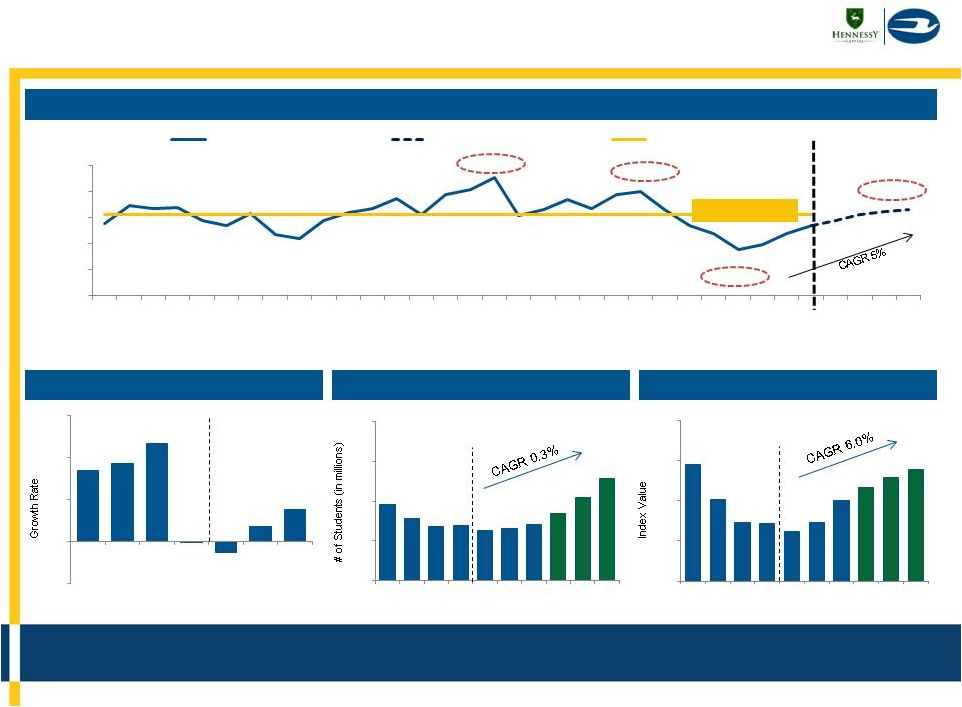 Early
Stages of Industry Recovery Fundamentals support strong industry growth
28
U.S. Aggregate Housing Price Index
U.S. Total Student Enrollment
Source: National Center for Education Statistics
U.S. Property Tax Revenue Recovery
Type C/D School Bus Recovery
Source: U.S. Census Bureau
Source: CoreLogic House Price Index
Mean: 30,550
Source: Historical results are based on RL Polk vehicle registration data, and the
estimated 2014-2016 periods are based on Blue Bird management’s forecast model, which takes into account RL Polk vehicle
registration data, population of school age children forecasts from the National
Center for Education Statistics and bus ridership data collected and published by an industry magazine (School Transportation News)
37,641
34,882
23,822
31,600
15,000
20,000
25,000
30,000
35,000
40,000
1985
1987
1989
1991
1993
1995
1997
1999
2001
2003
2005
2007
2009
2011
2013
2015
2017
Historical Registrations
Projected Registrations
Historical Avg. ('85-'14)
6.8%
7.4%
9.3%
0.0%
(1.0%)
1.4%
3.1%
(4.0%)
0.0%
4.0%
8.0%
12.0%
2007
2008
2009
2010
2011
2012
2013
55.2
55.0
54.8
54.9
54.8
54.8
54.9
55.1
55.3
55.6
54.0
54.6
55.3
55.9
56.5
2007
2008
2009
2010
2011
2012
2013
2014E
2015E
2016E
187.0
161.0
144.0
143.0
137.0
144.0
160.0
170.0
177.0
183.0
100.0
130.0
160.0
190.0
220.0
2007
2008
2009
2010
2011
2012
2013
2014E
2015E
2016E |
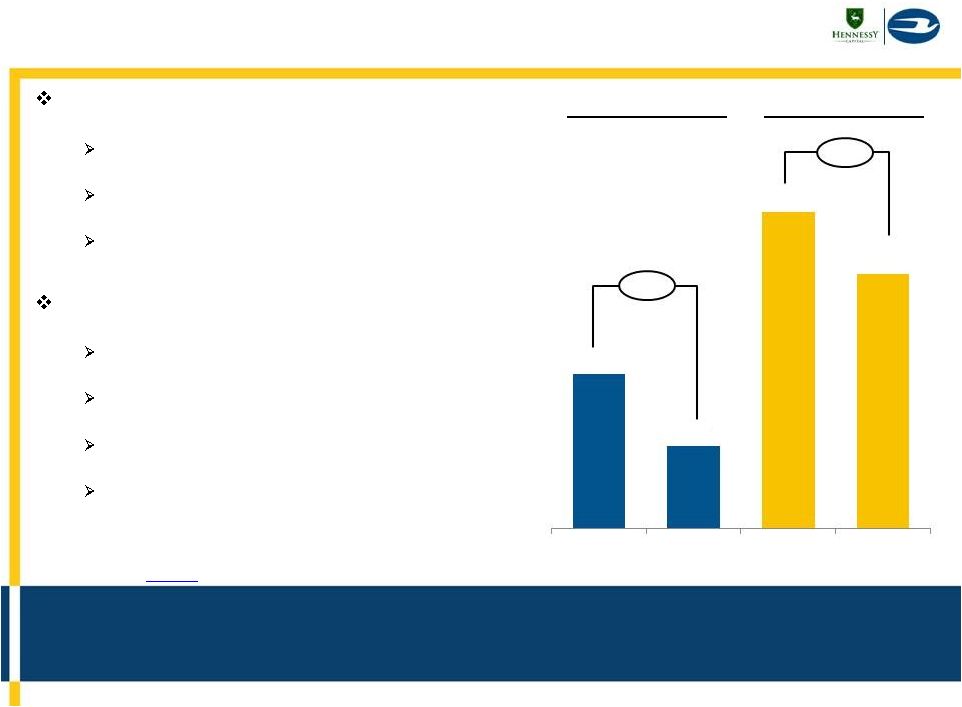 Propane competitiveness is increasing;
Lower diesel fuel costs potentially support higher bus sales
Fuel cost reductions have produced a greater
benefit for propane buses to date
The value proposition for propane buses relative
to diesel has improved considerably
Propane autogas pricing has decreased 47% over
the past year, while diesel has only decreased 20%
Lower propane prices could result in more
converts from diesel to propane
Oil price reductions may have a positive impact
on the school bus business
Fuel costs make up a large portion of school
transportation budgets
Lower fuel prices can translate into lower fuel
spending and budget favorability
Funds that were budgeted for fuel can potentially
be freed up for more school bus purchases
Some school districts enter longer term fuel
contracts that lock in prices over a period of time,
so these districts may not immediately benefit
from price reductions
29
Source
of
fuel
pricing:
www.eia.gov
January
2014
compared
to
January
2015
with
typical
propane
mark-up
over
terminal
price
of
$0.50
per
gallon
-20%
-47%
Diesel
Propane
2014
2015
2014
2015
Business Benefits from Lower Oil Prices
$1.90
$1.01
$3.89
$3.13 |
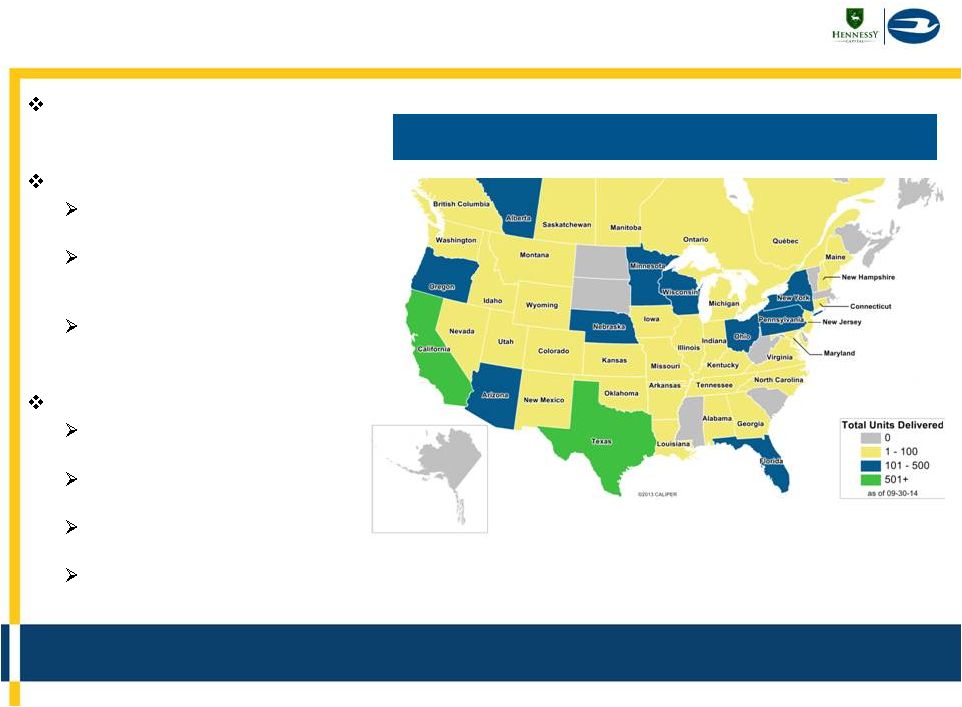 Share
Growth: Propane Opportunity Significant growth potential as many
districts test propane Propane is an effective conquest
tool that drives market share
growth
Early penetration of the market
Only ~360 of ~10,000
customers have tried propane
Customers that buy propane
buses are purchasing more
propane buses
Order sizes are growing as
existing customers come
back for more
Superior product offering
Exclusive contracts with Ford
and ROUSH CleanTech
Proven design with high
customer satisfaction
Only company offering an
extended-range fuel tank
Blue Bird is the undisputed
sales leader in this segment
30
Fewer than 4% of Customers Have Tried Propane |
 Share
Growth: Product & Dealer Initiatives Focus on initiatives designed
to grow market share 31
Dealer network is strong and getting
stronger
Improve or replace underperforming
dealers
School bus focused dealerships
Using data to drive best practices
Enhanced marketing tools
Energized dealers will drive
increased sales penetration
Level of dealer engagement growing
New dealers that have replaced
underperforming dealers are
contributing to growth
Singular focus on buses
Purpose-built school bus chassis
Leading quality, reliability & durability
Outstanding warranty performance
Leadership in propane
Continue to enhance propane package
Leverage differentiators like exclusive
Ford/ROUSH relationship and industry’s
only extended-range propane fuel tank
Steady stream of new products and
industry-first innovations
OEM telematics pre-wiring through
exclusive partnership with Synovia
Industry-leading new E-Z windows
Proprietary powertrain offerings
Other differentiated products, features
and services in the pipeline
Dealer Network Improvements
Continuous Product Enhancements |
 Margin Expansion: Productivity
Identified opportunities to continue enhancing margins
32
Lower Break-Even
Break-even volume (based on Adjusted
EBITDA) was 315 units per month in
2014; down from 400 units per month
in 2010
Continuous improvement
manufacturing mindset
Reduce overhead/unit
Increase labor productivity
Use and control of bulk materials
Reduce complexity
Highly skilled workforce with average
tenure of approximately 14 years
No significant capacity investments
required to support near-term growth
Note: Labor Productivity is Standard Hours per Bus divided by Actual Hours per
Bus 89%
96%
102%
106%
FY2011
FY2012
FY2013
FY2014
Labor Productivity |
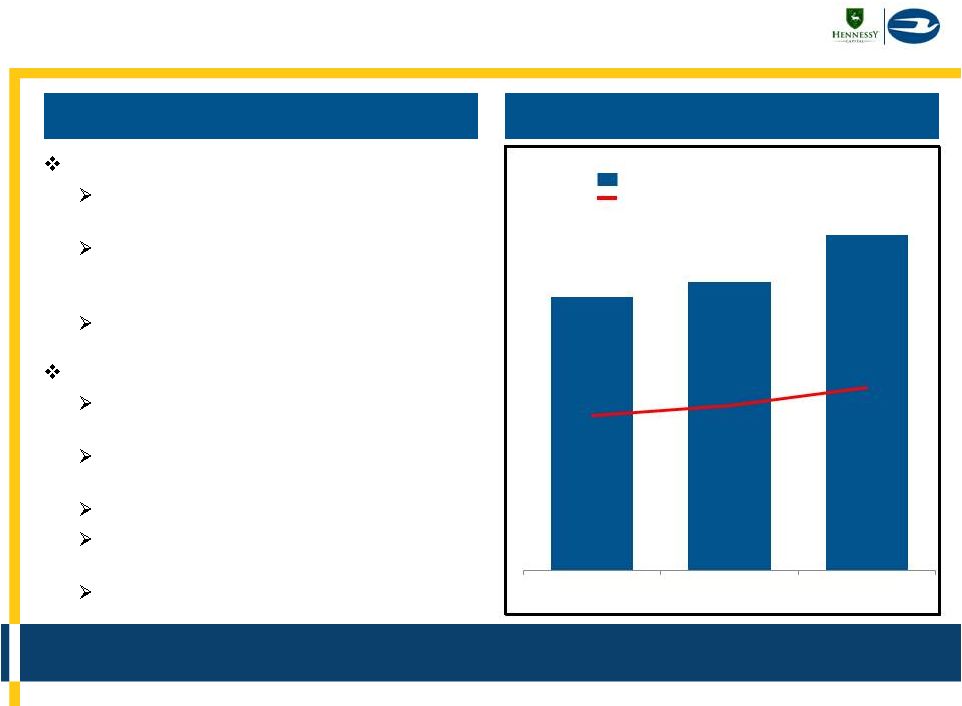 Margin Expansion: Growing Parts Business
Growth in Parts revenue will drive margin expansion
33
2014
Platform for growth
Installed base of ~180,000 buses in
North America
Blue Bird’s dealers maintain ~250
dealer-authorized service locations
across North America
New and experienced leadership
Focus of organic growth
Direct sales to dealer-authorized
service centers
Increased focus on best practices
deployment
Electronic parts catalog
Increased merchandising of high
volume parts
Direct marketing to end-customers
Parts Sales Outlook
Parts Sales Revenue & Gross Margin
Revenue
Gross Profit Margin
($ in millions)
$44
$46
$54
FY2012
FY2013
FY2014
35%
36%
37% |
 New
Markets & Growth Beyond School Buses Will continually explore and pursue
new growth opportunities Continue to grow Sigma Bus sales in Colombia and
expand to other markets
Continue to be preferred vehicle choice for General
Services Administration (GSA)
Grow international Type C & D bus sales through
Bukkehave distributor
Expand commercial bus business in North America
Explore school bus sales opportunities in the Middle
East
Explore long-term service and vehicle refurbishment
contracts
34 |
 35
Phil Tighe
CFO
Blue Bird |
 Substantial Revenue Growth
Consistently driven volume and revenue growth
36
$566
$598
$777
$856
(1) Total does not sum precisely due to rounding
(1)
$80
$80
$84
Memo:
Revenue/Unit
$84
($ in thousands)
($ in millions)
$522
$554
$730
$802
$44
$44
$46
$54
6,525
6,882
8,654
9,604
FY2011
FY2012
FY2013
FY2014
Bus
Parts
Volume |
 Impressive Profit Growth
EBITDA has grown at a faster rate than revenue
37
Note: Numbers have been rounded
9%
9%
12%
Memo:
GP Margin
13%
($ in millions)
$
$17
$50
$67
3%
3%
7%
8%
FY2011
FY2012
FY2013
FY2014
Adjusted EBITDA
% of Revenue
14 |
 Profit Drivers: FY2012 to FY2014
Relentless focus on cost competitiveness
allows us to compete in all markets
38
Note: Total Adj. EBITDA walk does not sum precisely due to rounding
($ in millions)
$17
$67
$(1)
$21
$29
FY2012
Adj. EBITDA
Cost Reductions
Volume & Mix
Other
FY2014
Adj. EBITDA |
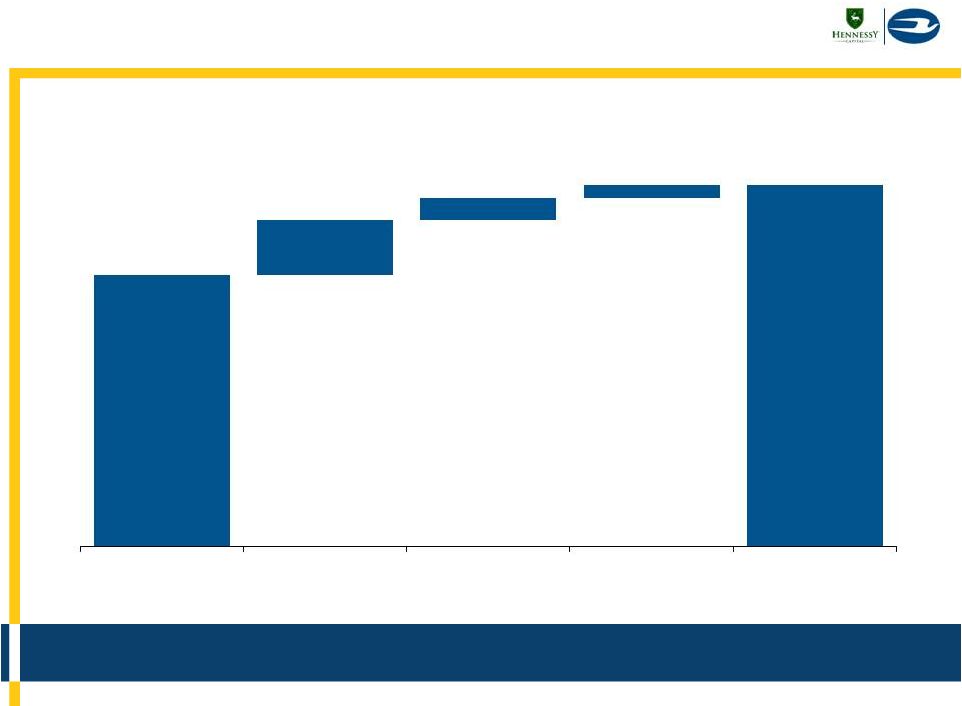 Profit Drivers: FY2013 to FY2014
Continuous improvements from cost reductions and mix
39
($ in millions)
$67
$3
$10
$4
$50
FY2013
Adj. EBITDA
Cost Reductions
Volume & Mix
Other
FY2014
Adj. EBITDA |
 Substantial Free Cash Flow
Strong free cash flow enables optionality
40
(1)
FY2014 Free Cash Flow includes a $24.7 million special compensation payment related
to Blue Bird’s 2014 dividend recapitalization but is not pro forma for interest expense associated with new debt raised nor
future cash taxes
$5
$4
$5
Memo: Capex
$6
($ in millions)
(1)
$15
$12
$31
$32
FY2011
FY2012
FY2013
FY2014
Free Cash Flow
Source: Blue Bird Management
Notes: Free Cash Flow is defined as Cash from Continuing Operations less Capex.
|
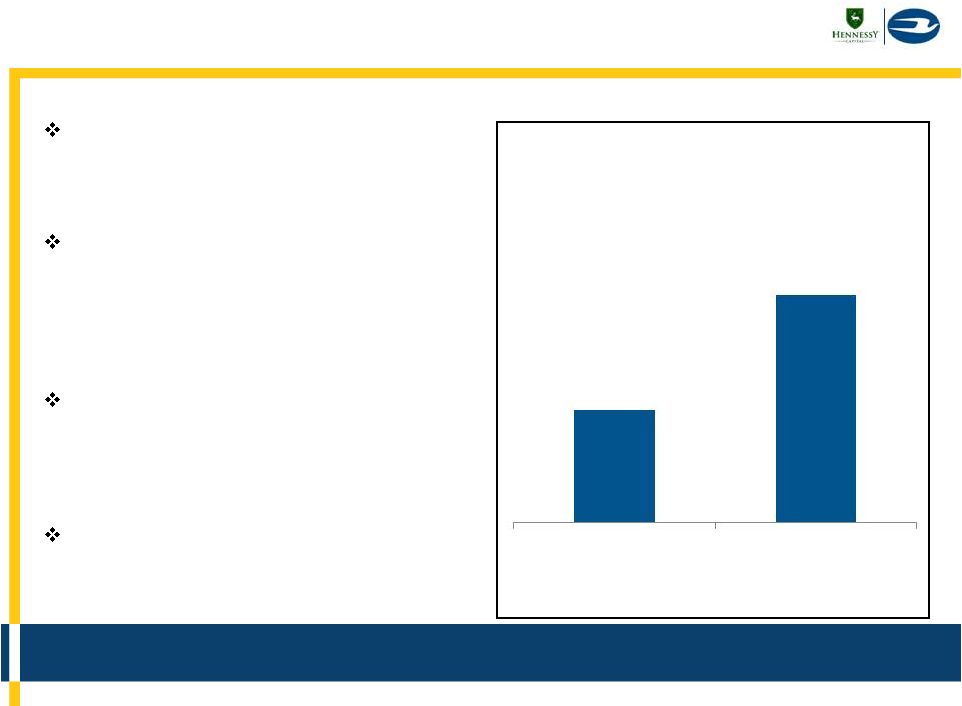 School Bus Business is Highly Seasonal
Seasonality drives higher revenue and earnings in Second Half
R.L. Polk Unit
Registration Seasonality
Based on 3-Year Average
FY2012-FY2014
41
School districts typically purchase
buses for the start of the school
year, driving higher volumes in April
through September
Blue Bird’s quarterly financial
results are impacted by these
seasonal practices; the first fiscal
quarter is the most impacted and we
take planned shutdowns during this
period
Working capital is typically a
significant use of cash during the
first fiscal quarter and a significant
source of cash in the fourth fiscal
quarter
Blue Bird generally operates with
negative working capital
33%
67%
Oct -
Mar
(First Half)
Apr -
Sep
(Second Half) |
 Flexible Capital Structure
42
Pro Forma Capital Structure (9/27/14)
Considerations
Undrawn Revolving Credit Facility
with $60 million of availability
supports working capital
seasonality
Convertible Preferred Stock
dividends are payable in stock or
cash, at the Company’s option
Pension plan has been frozen
since 2006
Pension liability of $40.9 million as
of September 27, 2014
$5.7 million projected 2015E pension
cash contribution
(1)
Reflects $12.1 million of unamortized discount
(2)
Net Debt is defined as Total Debt less Cash and Cash Equivalents
(3)
Liquidity is defined as Cash and Cash Equivalents plus $60 million of availability
under revolving credit facility less $5.3 million of outstanding letters of credit
(4)
Based on FY2014 Adj. EBITDA of $66.8 million
(5)
Reflects $17.0 million of pro forma net interest expense for full-year 2014
assuming approximately $222 million of debt at June 28, 2014 was outstanding as of September 29, 2013
($ in millions)
Cash and Cash Equivalents
$53.0
Revolving Credit Facility
$0.0
Term Loan Facility
(1)
222.9
Total Debt
$222.9
Net Debt
(2)
169.9
Memo:
Liquidity
(3)
$107.7
Convertible Preferred Stock
40.0
Capital Leases
0.2
Metrics based FY2014 Financials
(4)
Total Debt / Adj. EBITDA
3.3x
Net Debt / Adj. EBITDA
2.5x
Adj. EBITDA / PF Net Interest
(5)
3.9x |
 43
Phil Horlock
President and CEO
Blue Bird |
 Summary: Significant Momentum & Upside
Led by an Experienced and Committed
Management Team that Delivers Results
Iconic and Fastest Growing School Bus Brand
Undisputed Leader in Alternative Fuel-Powered Bus Sales
Downside Risk Mitigation
Significant Upside Potential
44 |
 2015
Guidance EBITDA projected to grow 7-12% in FY2015
45
Revenue
$918–$940
Revenue
$856
(1)
Adj. EBITDA
($ in millions)
(1)
See
“Important
Disclaimers”
for
information
regarding
FY
2015
estimated
information
$67
$72 -
$75
FY2014
FY2015
Guidance
Up
7%-12%
Up
7%-10%
Range
Source: Blue Bird Management
Note:
Adjusted
EBITDA
excludes
public
company
costs,
stock
based
compensation,
amounts
payable
under
the
Blue
Bird
Phantom
Award
Plan,
and
transaction
expenses |
 Our
Growth Objectives are Clear Deliver sustained growth and profitability
#1 in North American school bus market
share with highest customer loyalty
Differentiated and proprietary products and
features that customers want and value
Clear leader in affordable, alternative fuel-
powered school buses
Significant growth in parts sales
Significant and ongoing international
business
Growing presence in commercial bus
business
46 |
 47
Appendix |
 Public Company Valuation Benchmarks
FY 2014 EV / EBITDA
FY 2015 EV / EBITDA
Deal Multiple: 7.2x
Deal
Multiple
Range:
6.4
–
6.7x
Mean: 10.8x
Large Cap Branded Industrials
& Specialty Vehicles
Mean: 9.7x
Mean: 9.8x
Mean: 9.1x
Small Cap Branded Industrials
& Specialty Vehicles
Large Cap Branded Industrials
& Specialty Vehicles
Small Cap Branded Industrials
& Specialty Vehicles
24.3x
(1)
(1)
(1)
Deal Multiple calculated as Pro Forma Enterprise Value of $481 million (assuming
issuance of 1,212,500 shares pursuant to the Warrant Exchange Offer and Sponsor Warrant Exchange and no conversion of
Convertible Preferred Stock) divided by Adjusted EBITDA of $67 million for FY2014
and $72 to $75 million for FY2015E (2)
FY2014
multiples
for
Power
Solutions
International,
Inc.
are
not
included
in
mean
and
median
calculations
10.9x
12.8x
12.4x
7.1x
12.7x
9.6x
10.4x
9.7x
10.2x
11.9x
9.6x
8.3x
8.4x
10.0x
5.0x
10.0x
15.0x
8.3x
11.8x
11.5x
6.7x
12.3x
7.7x
10.2x
8.1x
8.7x
9.3x
7.6x
14.3x
7.5x
11.7x
5.9x
5.0x
10.0x
15.0x
Source: SEC Filings, Wall Street Research and First Call Consensus estimates. Blue
Bird company management Note: Multiples exclude Pension Liability from the
calculation of Enterprise Value; multiples have been calendarized to Blue Bird September fiscal year end. Quarterly consensus was used for comparable
companies wherever available
Note: Adj. EBITDA excludes public company costs, stock based compensation and
transaction expenses. Adjusted EBITDA for FY2014 includes add-backs for Restructuring costs, Non-recurring Management
Incentive Compensation and other non-recurring expenses
48 |
 Detailed Comparable Company Benchmarks
49
($ in millions, except per share values)
Source: SEC Filings, Wall Street Research and First Call Consensus estimates
Note: N.M. represents negative multiples, EBITDA multiples greater than 35.0x, EBIT
multiples greater than 25.0x, P/E multiples greater than 65.0x and negative long-term growth rates
Note: Multiples have been calendarized to Blue Bird September fiscal year end.
Quarterly consensus was used for comparable companies wherever available
(1)
FY 2014 multiples for Power Solutions International, Inc. are not included in mean
and median calculations (1)
Stock Price
Market Value
Balance Sheet
Valuation Multiples
Large Cap Branded Industrials
Above
Below
Equity
Ent.
EV / Rev
EV / EBITDA
EV / EBIT
P/E
Price/
& Specialty Vehicles
1/2/15
Low
High
Value
Value
Cash
Debt
FY13
FY14
FY15
FY13
FY14
FY15
FY13
FY14
FY15
FY13
FY14
FY15
Book
Cummins Inc.
146.42
19%
9%
26,663
26,320
2,381
2,038
1.5x
1.4x
1.3x
12.4x
10.9x
8.3x
15.2x
13.3x
9.5x
18.8x
17.0x
14.0x
3.4x
Harley-Davidson, Inc.
65.79
21%
11%
14,193
18,949
688
5,444
3.6x
3.4x
3.2x
14.5x
12.8x
11.8x
16.5x
14.5x
13.5x
19.5x
16.8x
15.5x
4.3x
Allison Transmission Holdings, Inc.
33.85
29%
2%
6,170
8,560
208
2,597
4.5x
4.1x
4.0x
14.7x
12.4x
11.5x
23.5x
17.3x
15.9x
46.2x
27.9x
23.6x
4.6x
Oshkosh Corporation
48.31
22%
20%
3,807
4,388
314
895
0.6x
0.6x
0.7x
6.9x
7.1x
6.7x
8.5x
8.7x
8.5x
11.4x
12.3x
11.8x
1.9x
Generac Holdings Inc.
46.37
20%
26%
3,313
4,252
173
1,112
2.9x
3.0x
2.9x
11.6x
12.7x
12.3x
13.0x
14.1x
12.6x
11.6x
13.6x
13.9x
7.4x
Thor Industries Inc.
55.48
15%
14%
2,962
2,649
314
0
0.8x
0.7x
0.7x
10.4x
9.6x
7.7x
11.5x
10.6x
8.8x
18.5x
16.6x
14.3x
3.0x
The Manitowoc Company, Inc.
21.88
35%
35%
3,006
4,687
75
1,755
1.2x
1.2x
1.2x
10.0x
10.4x
10.2x
12.9x
13.4x
13.4x
18.7x
16.2x
15.9x
3.4x
Mean
2.2x
2.1x
2.0x
11.5x
10.8x
9.8x
14.4x
13.1x
11.7x
20.7x
17.2x
15.6x
4.0x
Median
1.5x
1.4x
1.3x
11.6x
10.9x
10.2x
13.0x
13.4x
12.6x
18.7x
16.6x
14.3x
3.4x
Stock Price
Market Value
Balance Sheet
Valuation Multiples
Small Cap Branded Industrials
Above
Below
Equity
Ent.
EV / Rev
EV / EBITDA
EV / EBIT
P/E
Price/
& Specialty Vehicles
1/2/15
Low
High
Value
Value
Cash
Debt
FY13
FY14
FY15
FY13
FY14
FY15
FY13
FY14
FY15
FY13
FY14
FY15
Book
Briggs & Stratton Corporation
20.27
18%
12%
920
1,083
62
226
0.6x
0.6x
0.6x
8.8x
9.7x
8.1x
15.7x
16.2x
10.6x
22.0x
19.9x
17.5x
1.5x
Federal Signal Corp.
15.34
33%
4%
974
1,014
29
69
1.2x
1.2x
1.1x
13.3x
10.2x
8.7x
16.3x
12.0x
10.1x
22.0x
15.8x
15.0x
2.6x
Astec Industries, Inc.
38.73
13%
16%
888
885
16
13
0.9x
0.9x
0.9x
9.5x
11.9x
9.3x
16.7x
17.6x
12.5x
24.6x
25.9x
18.6x
1.5x
New Flyer Industries Inc.
11.44
30%
5%
641
884
9
252
0.9x
0.6x
0.6x
14.2x
9.6x
7.6x
N.M.
14.9x
12.9x
37.8x
17.2x
15.8x
1.4x
Power Solutions International, Inc.
51.55
18%
42%
553
624
8
78
2.7x
2.0x
1.4x
N.M.
24.3x
14.3x
N.M.
N.M.
15.9x
63.0x
42.4x
23.6x
6.7x
Winnebago Industries, Inc.
21.90
8%
24%
590
562
28
0
0.7x
0.6x
0.6x
11.4x
8.3x
7.5x
12.6x
8.9x
8.0x
18.5x
13.1x
12.3x
3.0x
Douglas Dynamics, Inc.
21.34
51%
14%
476
616
4
144
4.1x
2.2x
2.2x
24.3x
8.4x
11.7x
N.M.
9.5x
12.6x
N.M.
13.6x
20.0x
2.8x
Manitex International, Inc.
12.60
33%
29%
174
224
5
55
0.9x
0.9x
0.6x
11.3x
10.0x
5.9x
14.2x
12.8x
7.7x
18.9x
18.1x
12.2x
1.9x
Mean
1.5x
1.0x
1.0x
13.3x
9.7x
9.1x
15.1x
13.1x
11.3x
29.5x
17.7x
16.9x
2.7x
Median
0.9x
0.9x
0.7x
11.4x
9.7x
8.4x
15.7x
12.8x
11.5x
22.0x
17.2x
16.6x
2.2x |
 Detailed Comparable Company Benchmarks
50
($ in millions)
Source: SEC Filings, Wall Street Research and First Call Consensus estimates
Note: N.M. represents negative multiples, EBITDA multiples greater than 35.0x, EBIT
multiples greater than 25.0x, P/E multiples greater than 65.0x and negative long-term growth rates
Note: Financials have been calendarized to Blue Bird September fiscal year
end. Quarterly consensus was used for comparable companies wherever available
Revenue
Revenue Growth
Margin Analysis
Large Cap Branded Industrials
EBITDA
EBIT
Net Income
& Specialty Vehicles
FY13
FY14
FY15
FY13
FY14
FY15
FY13
FY14
FY15
FY14
FY15
FY13
FY14
FY15
Cummins Inc.
$17,005
$18,719
$20,503
(2%)
10.1%
9.5%
12.5%
12.9%
15.5%
10.6%
13.5%
8.3%
8.4%
9.3%
Harley-Davidson, Inc.
5,237
5,569
5,915
(6%)
6.3%
6.2%
25.0%
26.6%
27.2%
23.4%
23.7%
13.9%
15.2%
15.5%
Allison Transmission Holdings, Inc.
1,923
2,074
2,163
(10%)
7.9%
4.3%
30.3%
33.2%
34.5%
23.8%
24.9%
7.0%
10.7%
12.1%
Oshkosh Corporation
7,665
6,808
6,495
(4%)
(11.2%)
(4.6%)
8.3%
9.1%
10.1%
7.4%
8.0%
4.3%
4.5%
5.0%
Generac Holdings Inc.
1,452
1,433
1,457
23%
(1.3%)
1.7%
25.3%
23.4%
23.7%
21.0%
23.2%
19.6%
17.0%
16.3%
Thor Industries Inc.
3,280
3,647
4,021
19%
11.2%
10.2%
7.8%
7.6%
8.5%
6.9%
7.5%
4.9%
4.9%
5.1%
The Manitowoc Company, Inc.
4,061
3,938
4,027
4%
(3.0%)
2.3%
11.6%
11.4%
11.4%
8.9%
8.7%
4.0%
4.7%
4.7%
Mean
3%
2.9%
4.2%
17.3%
17.7%
18.7%
14.6%
15.7%
8.9%
9.3%
9.7%
Median
(2%)
6.3%
4.3%
12.5%
12.9%
15.5%
10.6%
13.5%
7.0%
8.4%
9.3%
Revenue
Revenue Growth
Margin Analysis
Small Cap Branded Industrials
EBITDA
EBIT
Net Income
& Specialty Vehicles
FY13
FY14
FY15
FY13
FY14
FY15
FY13
FY14
FY15
FY14
FY15
FY13
FY14
FY15
Briggs & Stratton Corporation
1,871
1,834
1,955
(5%)
(1.9%)
6.6%
6.6%
6.1%
6.9%
3.6%
5.2%
2.2%
2.5%
2.7%
Federal Signal Corp.
849
874
949
6%
2.9%
8.7%
9.0%
11.4%
12.3%
9.7%
10.5%
5.2%
7.1%
6.8%
Astec Industries, Inc.
937
960
1,026
0%
2.5%
6.9%
9.9%
7.7%
9.3%
5.2%
6.9%
3.9%
3.6%
4.6%
New Flyer Industries Inc.
1,020
1,406
1,514
18%
37.7%
7.7%
6.1%
6.6%
7.6%
4.2%
4.5%
1.7%
2.6%
2.7%
Power Solutions International, Inc.
229
306
449
13%
33.6%
47.1%
6.8%
8.4%
9.7%
7.2%
8.7%
3.8%
4.3%
5.2%
Winnebago Industries, Inc.
803
945
1,018
25%
17.7%
7.7%
6.1%
7.1%
7.3%
6.7%
6.9%
4.0%
4.8%
4.7%
Douglas Dynamics, Inc.
150
276
286
7%
84.9%
3.4%
16.9%
26.6%
18.5%
23.3%
17.1%
1.6%
12.7%
8.3%
Manitex International, Inc.
236
263
383
15%
11.2%
46.0%
8.4%
8.5%
9.8%
6.7%
7.6%
3.9%
3.7%
3.7%
Mean
10%
23.6%
16.8%
8.7%
10.3%
10.2%
8.3%
8.4%
3.3%
5.1%
4.9%
Median
10%
14.4%
7.7%
7.6%
8.1%
9.5%
6.7%
7.2%
3.8%
4.0%
4.7% |
 51
Blue Bird GAAP/Non-GAAP Reconciliation
(1)
Restructuring
costs
include
expenses
related
to
discontinued
operations
from
the
sale
of
a
business,
management
severance
costs,
a
write-off
of
leasing
software,
certain
plant
assets
and
a
write-down
on
a
note outstanding to a former related party for furniture and fixtures in Blue Bird's
Ohio facility (2)
In fiscal 2011, Blue Bird wrote-off $2.7 million of inventory purchased in
anticipation of orders from a foreign government that were never placed. In fiscal 2012, Blue Bird recorded a partial recovery of the
write-down as proceeds were received from sales of the inventory as scrap
(3)
Represents a payment made under Blue Bird's Phantom Award Plan to Phantom Plan
Participants in connection with Blue Bird's 2014 dividend recapitalization
(4)
Represents the add-back of an out-of-period vacation pay and holiday
bonus expense resulting from a change in policy to accrue throughout the year instead of expensing annually
(5)
Represents incentive compensation paid to officers in excess of a related accrual
(typically recorded at 100% target level) due to over-performance relative to budget. This adjustment excludes the amount of
the accrual above 200% of the target level
(6)
Represents a write-off due to an order for chassis with respect to which the
customer never took delivery of the chassis. The units that were not used or sold to other customers were written off
(7)
Represents costs incurred in redesigning Blue Bird's Type D bus in fiscal 2012. The
costs associated with this redesign related to prototypes, testing and services, engineering personnel, marketing and
consulting fees
(8)
Represents costs incurred in exploring the market potential for sales of school
buses in Asia. The costs related to this market test included sales and marketing expenses, travel, demonstration units and
professional services fees
(9)
Represents the allocated tax expense related to Blue Bird's non-consolidated
affiliate (10)
Represents expenses incurred by School Bus Holdings related to the Business
Combination (11)
Represents out-of-period cost of goods sold incurred by Blue Bird. See Note
1 to Blue Bird's audited consolidated financial statements in the proxy statement
($ in thousands)
Year Ended
Net Income to Adjusted EBITDA Reconciliation
October 1, 2011
September 29, 2012
September 28, 2013
September 27, 2014
Net income
(loss)
($5,224)
($2,998)
$54,208
$2,757
Loss (income) from discontinued operations, net of tax
1,625
328
159
(42)
Income from continuing operations
($3,599)
($2,670)
$54,367
$2,715
Interest expense
2,471
2,480
2,371
6,156
Interest income
(282)
(160)
(214)
(102)
Income tax expense (benefit)
(1,126)
429
(30,380)
10,076
Depreciation and amortization
12,855
13,194
11,808
9,898
Restructuring costs
(1)
1,382
1,946
258
—
Export inventory adjustment
(2)
2,721
(234)
—
—
Special compensation payment
(3)
—
—
—
24,679
Vacation pay adjustment
(4)
—
—
2,296
—
Management incentive compensation
(5)
—
—
5,638
3,271
Chassis write-off
(6)
—
—
1,196
—
Type D redesign
(7)
—
1,207
—
—
Asia market test
(8)
—
885
—
—
Tax expense, non-consolidated affiliate
(9)
—
—
2,836
365
Business combination
(10)
—
—
—
9,236
Out-of-period adjustment
(11)
—
—
—
407
Adjusted EBITDA
$14,422
$17,077
$50,176
$66,791
Adjusted EBITDA margin
2.5%
2.9%
6.5%
7.8% |
 52
Blue Bird Income Statement
(1)
(2)
($ in thousands, except per share values)
Year Ended
September 29, 2012
September 28, 2013
September 27, 2014
Net sales
$598,330
$776,558
$855,735
Cost of goods sold
542,086
684,109
746,362
Gross profit
$56,244
$92,449
$109,373
Operating expenses
Selling, general and administrative expenses
57,418
65,332
91,445
Operating profit (loss)
($1,174)
$27,117
$17,928
Interest expense
(2,480)
(2,371)
(6,156)
Interest income
160
214
102
Other income (expense), net
9
96
72
Income (loss) before income taxes
($3,485)
$25,056
$11,946
Income tax (expense) benefit
(429)
30,380
(10,076)
Equity in net income (loss) of non-consolidated affiliates, net of tax
1,244
(1,069)
845
Income (loss) from continued operations
($2,670)
$54,367
$2,715
Income (loss) from discontinued operations, net of tax
(328)
(159)
42
Net income (loss)
($2,998)
$54,208
$2,757
Defined benefit pension plan (loss) gain
(3)
(7,804)
10,196
(4,150)
Comprehensive income (loss)
($10,802)
$64,404
($1,393)
Weighted average shares outstanding, basic and diluted
100
100
100
Basic and diluted income (loss) per share
Income (loss) from continuing operations
($26,695)
$543,672
$27,152
Income (loss) from discontinuing operations
(3,281)
(1,594)
425
(1)
This income tax benefit resulted primarily from a reduction in valuation reserves
established in prior periods. See Note 11 to Blue Bird’s audited consolidated financial statements in the proxy statement
(2)
Includes
$24.7
million
(approximately
$16.1
million
net
of
tax)
in
special
compensation
payments
related
to
Blue
Bird’s
2014
dividend
recapitalization
and
$9.3
million
(approximately
$7.4
million
net
of
tax)
of
expenses associated with the Business Combination
(3)
Net of tax of $0, $5,709 and $2,036 in 2012, 2013 and 2014 respectively
|
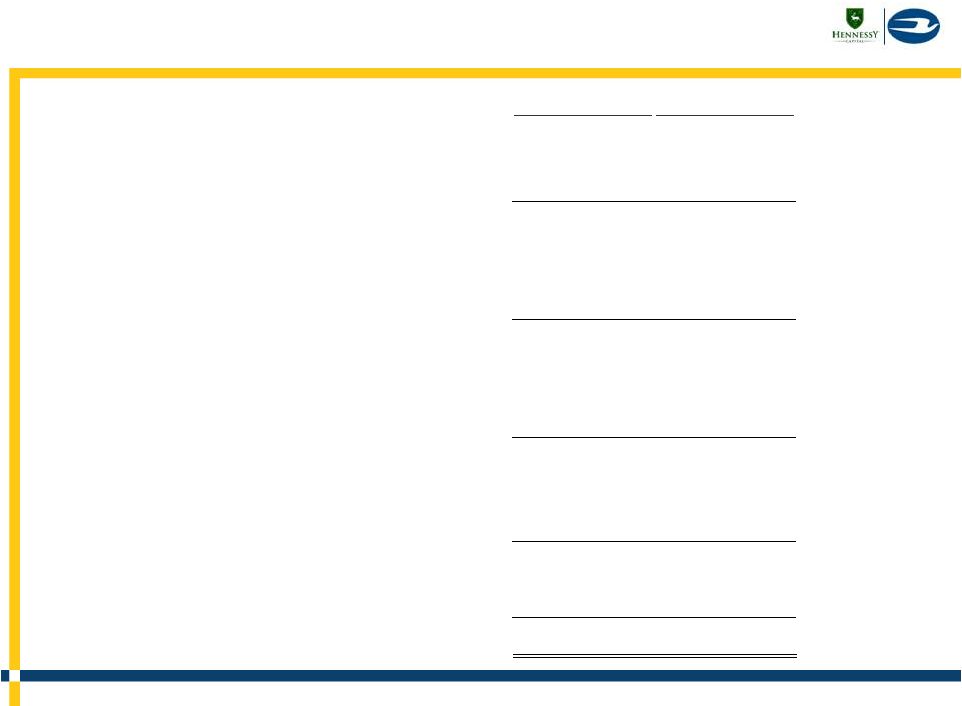 53
Blue Bird Balance Sheet
($ in thousands)
September 28, 2013
September 27, 2014
ASSETS
Cash and cash equivalents
$46,594
$61,137
Accounts receivables, net.
13,493
21,215
Inventories
62,603
71,300
Other current assets
3,125
4,353
Deferred tax asset
3,030
6,057
Total current assets
$128,845
$164,062
Property, plant and equipment, net
31,938
29,949
Goodwill
18,825
18,825
Intangible assets, net
64,103
62,240
Equity investment in affiliate
8,661
9,871
Deferred tax asset
8,001
4,073
Restricted cash
1,206
—
Other assets
1,406
2,912
Total assets
$262,985
$291,932
LIABILITIES AND STOCKHOLDERS’ EQUITY
Accounts payable
$72,960
$94,294
Accrued warranty costs - current portion
5,917
6,594
Accrued expenses
25,133
37,319
Deferred warranty income - current portion
3,767
4,117
Other current liabilities
3,020
5,668
Current portion of senior term debt.
2,979
11,750
Total current liabilities
$113,776
$159,742
Revolving senior credit facility
71
—
Long-term term debt
10,009
211,118
Accrued warranty costs
7,530
8,965
Deferred warranty income
6,976
7,886
Other liabilities
7,502
12,136
Accrued pension liability
37,703
40,881
Total long-term liabilities
$69,791
$280,986
Common stock
1
1
Additional paid-in capital
94,999
—
Retained (deficit) earnings
26,836
(102,229)
Accumulated other comprehensive loss
(42,418)
(46,568)
Total stockholder's (deficit) equity
$79,418
($148,796)
Total liabilities and stockholder's (deficit) equity
$262,985
$291,932 |
 54
Blue Bird Statement of Cash Flows
Year Ended
September 29, 2012
September 28, 2013
September 27, 2014
Cash flows from operating activities
Net income
(loss)
($2,998)
$54,208
$2,757
(Income) loss from discontinued operations, net of
tax
328
159
(42)
Adjustments to reconcile net income (loss) to net cash provided by operating activities
Depreciation and
amortization
13,194
11,808
9,898
Amortization of debt
costs
210
128
1,301
Equity in net income of
affiliate
(1,244)
1,069
(845)
Impairment loss on fixed
assets
117
—
—
(Gain) loss on disposal of fixed
assets
285
36
(67)
Loss on sale of assets held for
sale
688
—
—
Deferred
taxes
375
(30,447)
2,874
Change in uncertain tax
position
—
—
6,390
Provision for bad
debt
193
21
(9)
Non-cash interest
expense
1,473
1,398
—
Amortization of deferred actuarial pension
losses
3,392
4,233
2,804
Changes in assets and
liabilities
Accounts
receivable
83
(4,178)
(7,713)
Inventories
(4,750)
(7,244)
(8,697)
Other
assets
159
1,315
(1,415)
Accounts
payable
10,059
6,889
18,080
Accrued expenses, pension and other
liabilities
(6,064)
(3,414)
12,096
Total
adjustments
$18,170
($18,386)
$34,697
Net cash provided by continuing
operations 15,500
35,981
37,412
Net cash used in discontinued
operations
(678)
(661)
(568)
Total cash provided by operating
activities $14,822
$35,320
$36,844
Cash flows from investing activities
Change in net investment in discounted
leases
863
563
778
Cash paid for fixed
assets
(3,659)
(4,945)
(5,535)
Proceeds from sale of
assets
2,077
—
102
Restricted
cash
—
—
1,206
Total cash used in investing
activities
($719)
($4,382)
($3,449)
Cash flows from financing activities
Borrowings under the senior credit
facility
10,868
63,743
2,862
Payments under the senior credit
facility
(10,938)
(63,672)
(2,933)
Borrowings under the senior term
loan
—
12,988
235,000
Repayments under the subordinated term
loans
(5,000)
(35,000)
(13,000)
Cash paid for capital
leases
(855)
(907)
(535)
Cash paid for debt
costs
(100)
(111)
(12,647)
Cash paid for
dividends
—
—
(226,821)
Change in advances collateralized by discounted
leases
(863)
(563)
(778)
Total cash used in financing
activities
($6,888)
($23,522)
($18,852)
Change in cash and cash
equivalents
7,215
7,416
14,543
Cash and cash equivalents at beginning of
period
31,963
39,178
46,594
Cash and cash equivalents at end of
year
$39,178
$46,594
$61,137
($ in thousands) |
