Attached files
| file | filename |
|---|---|
| 8-K - CUSTOMERS BANCORP,INC. FORM 8-K - Customers Bancorp, Inc. | customers8k.htm |
Highly Focused, Low Risk, Above Average Growth
Bank Holding Company
Analyst Day Presentation
January 7, 2015
NYSE: CUBI

2
Forward-Looking Statements
This presentation as well as other written or oral communications made from time to time by us, may contain certain forward-looking information
within the meaning of the Securities Act of 1933, as amended, and the Securities Exchange Act of 1934, as amended. These statements relate to future
events or future predictions, including events or predictions relating to our future financial performance, and are generally identifiable by the use of
forward-looking terminology such as “believes,” “expects,” “may,” “will,” “should,” “plan,” “intend,” “target,” or “anticipates” or the negative thereof
or comparable terminology, or by discussion of strategy or goals that involve risks and uncertainties. These forward-looking statements are only
predictions and estimates regarding future events and circumstances and involve known and unknown risks, uncertainties and other factors that may
cause our actual results, levels of activity, performance or achievements to be materially different from any future results, levels of activity,
performance or achievements expressed or implied by such forward-looking statements. This information is based on various assumptions by us that
may not prove to be correct. Important factors to consider and evaluate in such forward-looking statements include:
•changes in the external competitive market factors that might impact our results of operations;
•changes in laws and regulations, including without limitation changes in capital requirements under the federal prompt corrective action regulations;
•changes in our business strategy or an inability to execute our strategy due to the occurrence of unanticipated events;
•our ability to identify potential candidates for, and consummate, acquisition or investment transactions;
•the timing of acquisition or investment transactions;
•constraints on our ability to consummate an attractive acquisition or investment transaction because of significant competition for these
opportunities;
opportunities;
•the failure of the Bank to complete any or all of the transactions described herein on the terms currently contemplated;
•local, regional and national economic conditions and events and the impact they may have on us and our customers;
•ability to attract deposits and other sources of liquidity;
•changes in the financial performance and/or condition of our borrowers;
•changes in the level of non-performing and classified assets and charge-offs;
•changes in estimates of future loan loss reserve requirements based upon the periodic review thereof under relevant regulatory and accounting
requirements;
requirements;
•the integration of the Bank’s recent FDIC-assisted acquisitions may present unforeseen challenges;
•inflation, interest rate, securities market and monetary fluctuations;
•the timely development and acceptance of new banking products and services and perceived overall value of these products and services by users;
•changes in consumer spending, borrowing and saving habits;
•technological changes;
•the ability to increase market share and control expenses;

3
Forward-Looking Statements
• continued volatility in the credit and equity markets and its effect on the general economy;
• the effect of changes in accounting policies and practices, as may be adopted by the regulatory agencies, as well as the Public Company
Accounting Oversight Board, the Financial Accounting Standards Board and other accounting standard setters;
Accounting Oversight Board, the Financial Accounting Standards Board and other accounting standard setters;
• the businesses of the Bank and any acquisition targets or merger partners and subsidiaries not integrating successfully or such integration being
more difficult, time-consuming or costly than expected;
more difficult, time-consuming or costly than expected;
• material differences in the actual financial results of merger and acquisition activities compared with expectations, such as with respect to the full
realization of anticipated cost savings and revenue enhancements within the expected time frame;
realization of anticipated cost savings and revenue enhancements within the expected time frame;
• revenues following any merger being lower than expected;
• deposit attrition, operating costs, customer loss and business disruption following the merger, including, without limitation, difficulties in
maintaining relationships with employees being greater than expected.
maintaining relationships with employees being greater than expected.
These forward-looking statements are subject to significant uncertainties and contingencies, many of which are beyond our control. Although we
believe that the expectations reflected in the forward-looking statements are reasonable, we cannot guarantee future results, levels of activity,
performance or achievements. Accordingly, there can be no assurance that actual results will meet expectations or will not be materially lower
than the results contemplated in this presentation. You are cautioned not to place undue reliance on these forward-looking statements, which
speak only as of the date of this document or, in the case of documents referred to or incorporated by reference, the dates of those documents.
We do not undertake any obligation to release publicly any revisions to these forward-looking statements to reflect events or circumstances after
the date of this document or to reflect the occurrence of unanticipated events, except as may be required under applicable law.
This presentation is for discussion purposes only, and shall not constitute any offer to sell or the solicitation of an offer to buy any security, nor is it
intended to give rise to any legal relationship between Customers Bancorp, Inc. (the “Company”) and you or any other person, nor is it a
recommendation to buy any securities or enter into any transaction with the Company. The information contained herein is preliminary and
material changes to such information may be made at any time. If any offer of securities is made, it shall be made pursuant to a definitive offering
memorandum or prospectus (“Offering Memorandum”) prepared by or on behalf of the Company, which would contain material information not
contained herein and which shall supersede, amend and supplement this information in its entirety.
Any decision to invest in the Company’s securities should be made after reviewing an Offering Memorandum, conducting such investigations as the
investor deems necessary or appropriate, and consulting the investor’s own legal, accounting, tax, and other advisors in order to make an
independent determination of the suitability and consequences of an investment in such securities. No offer to purchase securities of the
Company will be made or accepted prior to receipt by an investor of an Offering Memorandum and relevant subscription documentation, all of
which must be reviewed together with the Company’s then-current financial statements and, with respect to the subscription documentation,
completed and returned to the Company in its entirety. Unless purchasing in an offering of securities registered pursuant to the Securities Act of
1933, as amended, all investors must be “accredited investors” as defined in the securities laws of the United States before they can invest in the
Company.

4
Forward-Looking Statements
This presentation also includes estimated guidance regarding our fully diluted earnings per share for the years 2014 and 2015, which
we have previously disclosed and is subject to the assumptions and qualifications included in that previous disclosure. The guidance
consists solely of estimates prepared by management based on currently available information and assumptions of future performance
of the company and the general economy. Our independent registered public accounting firm has not audited, reviewed or performed
any procedures with respect to the guidance and, accordingly, does not express an opinion or any other form of assurance with respect
to this data. Our actual results may differ from the guidance, and any such differences could be material. Accordingly, undue reliance
should not be placed on this information. The factors discussed above should be considered and evaluated with respect to our
guidance.

5
Agenda
1. Business Strategy
• Banking Industry Overview
• Customers Bancorp, Inc. - It’s Strategy
• Customers Bank - High Touch Supported with High Tech for
Businesses
Businesses
• BankMobile - High Tech with High Touch like features for
Consumers
Consumers
2. Shareholder Value Creation Model
3. Our Performance over the Past Five Years
4. Risk Management
• Credit Risk Management Process and Results
• CRA, Fair and Responsible Banking Risk Management Update
5. Financial Performance Model
• Strong revenue generation, strong credit, low efficiency ratio and
sustainable profitability in all interest rate environments
sustainable profitability in all interest rate environments
• Our financial targets for Q4 2014, 2015 & beyond
6. Bank Mobile
7. Questions & Answers
6
Current Banking Environment and
How We are Positioned
How We are Positioned

7
What We See as The Role of CEO and Board …
Especially in this Environment
Especially in this Environment
1. Absolute clarity of your vision, strategy, goals and tactics;
there must be absolute alignment between board and
management
there must be absolute alignment between board and
management
2. Become a master of your internal environment
§ Our authentic internal assessment of strengths,
weaknesses and opportunities
weaknesses and opportunities
3. Be a master of your external environment
§ What is happening with customer trends, technology,
competition, economy, regulatory environment, etc. -
How does this impact us?
competition, economy, regulatory environment, etc. -
How does this impact us?
4. Highest level of integrity and fairness in all we do
5. Passion for continuous improvement
8
Banking Industry Trends……
How Do We Deal with These Issues
Impediments to Growth
External Forces
• Role of traditional bank branches
changing very rapidly
changing very rapidly
• Mobile banking fastest growing channel
• Banks of all sizes revisiting their
business strategies, revenue generation
models and cost structures
business strategies, revenue generation
models and cost structures
• Technology & customer needs, desires
and style changing rapidly
and style changing rapidly
• Traditional CRE lending very difficult to do
• Very little consumer loan growth;
headwinds for consumer credit quality
headwinds for consumer credit quality
• Growth exists only at niche players
• Mortgage banking revenues are
extremely volatile
extremely volatile
• Pressure to reduce or eliminate Overdraft
and other nuisance fees by CFPB
and other nuisance fees by CFPB
• Regulators have no appreciation or
incentive to see banks grow profitability
incentive to see banks grow profitability
Business Issues
Shareholder Expectations
• Start bank and sell at 2 to 3x book no
longer an option - what do shareholders of
small privately held banks do?
longer an option - what do shareholders of
small privately held banks do?
• Equity markets not available to small
banks
banks
• Banks need to earn 10% or more ROE if
they want to remain independent
they want to remain independent
• Consistent ROE of 12% or greater and
ROA of 1% or greater being rewarded well
by market
ROA of 1% or greater being rewarded well
by market
• Slow economic growth
• Low good quality consumer and business
loan demand
loan demand
• Pressure continues on margin. Days of
3.5%-4.0% margin are gone. Banks need
to reduce efficiency ratios
3.5%-4.0% margin are gone. Banks need
to reduce efficiency ratios
• Difficult to attract good talent
• Very difficult and inconsistent regulatory
environment
environment
• Shareholders want 10%+ ROE, consistent
quality growth and strong risk
management infrastructure
quality growth and strong risk
management infrastructure
Issues facing
Boards &
CEO’s
Boards &
CEO’s
What is our unique strategy
for revenue and profitable
growth
for revenue and profitable
growth
How do we attract and retain
best talent?
best talent?
How do we take advantage of
technology?
technology?
How do we deal with growing
compliance burden?
compliance burden?
How do we manage our risks
better than peers?
better than peers?
How do we lower our
efficiency ratios?
efficiency ratios?

9
Our Approach to Developing a Winning Business Model
1. Must focus on both “Relationship” or “High Touch” banking combined with
“Highly Efficient” or “High Tech”. Strategy should be unique as to not be
copied easily
“Highly Efficient” or “High Tech”. Strategy should be unique as to not be
copied easily
2. Attract and retain best high quality talent. Business Bankers / Relationship
Bankers with approximately 15 years+ experience who bring a book of
business with them
Bankers with approximately 15 years+ experience who bring a book of
business with them
3. Compensate leaders based upon profitability with both cash and equity
4. Never deviate from following critical success factors
• Only focus on very strong credit quality niches
• Have very strong risk management culture
• Have significantly lower efficiency ratio than peers to deliver sustainable
strong profitability and growth with lower margin and lower risk profile
strong profitability and growth with lower margin and lower risk profile
• Always attract and retain top quality talent
• Culture of innovation and continuous improvement
10
Our Model
• A business bank with a unique strategy
• Attraction and retention of top quality talent
• Unique Model
• “Very Branch Lite” business model with “High Touch Supported
with High Tech”
with High Tech”
• Highly Efficient
• Focuses only on high quality, growth oriented, although somewhat
lower margin business
lower margin business
• Strong risk management with low efficiency ratio, driving higher
profitability, ROE and growth
profitability, ROE and growth
11
§ Innovator / disruptor / not
branch dependent
branch dependent
§ Differentiated / Unique model
§ Technology savvy
Our Thesis on Current
U.S. Banking Environment
Credit Improving - Though Banks Face a Number of Operational Headwinds
§ Credit Improving
§ Quality Asset Generation Remains A Challenge
4 Banks are starved for interest-earning assets and exploring new asset classes, competing on price and looking into specialty finance business / lending
§ NIM Compression
4 Low rate environment for the foreseeable future will continue to compress NIM
4 Many institutions wither betting on rates or otherwise taking excessive interest rate risk
4 Industry NIM continues to decline
4 Down about 100 bps since 1995
4 Low interest rate environment, competitive pressures likely to prevent return to historical levels
§ Operational leverage
4 Expense management is top of mind as banks try to improve efficiency in light of revenue pressure and increased regulatory / compliance costs
4 Regulatory pressure expected to stay robust
§ New Strategies
4 Yesterdays strategies may not be appropriate tomorrow
Critical to Have a Winning Business Model
§ Heavy branch based delivery
system
system
§ Strong credit quality
§ Core deposits
§ Dependent on OD fees
§ Expense management
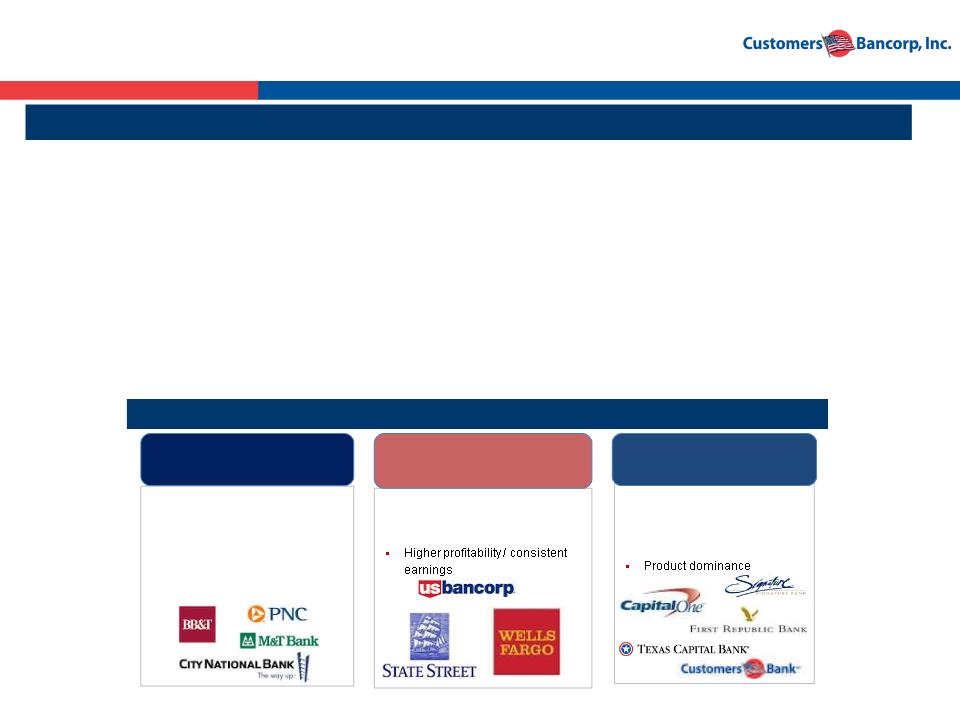
Traditional Banks
§ Diversified revenue sources
§ Cross sell strength
§ Capital efficiency
Fee Income Leaders
Relationship & Innovative
Banks
Banks
Source: SNL Financial.
1Includes data for top 50 U.S. banks by assets.

12
Customers Bank
Executing On Our Unique High Performing
Banking Model
Top Line Growth in 2013 & 2012
13
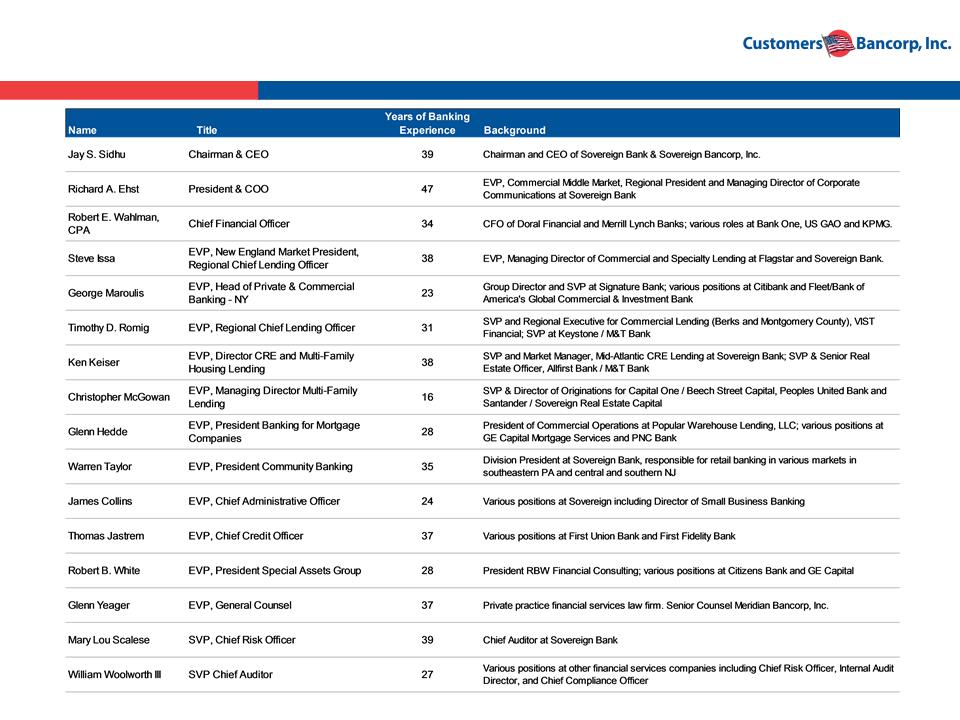
Our Competitive Advantage: A Highly Experienced Management Team

14
Disciplined Model for Increasing Shareholder Value
§ Strong organic revenue growth + scalable infrastructure =
sustainable double digit EPS growth and increased shareholder
value
sustainable double digit EPS growth and increased shareholder
value
§ A very robust risk management driven business strategy
§ Build tangible book value per share each quarter via earnings
§ Any book value dilution from any acquisitions must be overcome
within 1-2 years; otherwise stick with organic growth strategy
within 1-2 years; otherwise stick with organic growth strategy
§ Superior execution through proven management team
Disciplined Model for Superior Shareholder Value Creation
15
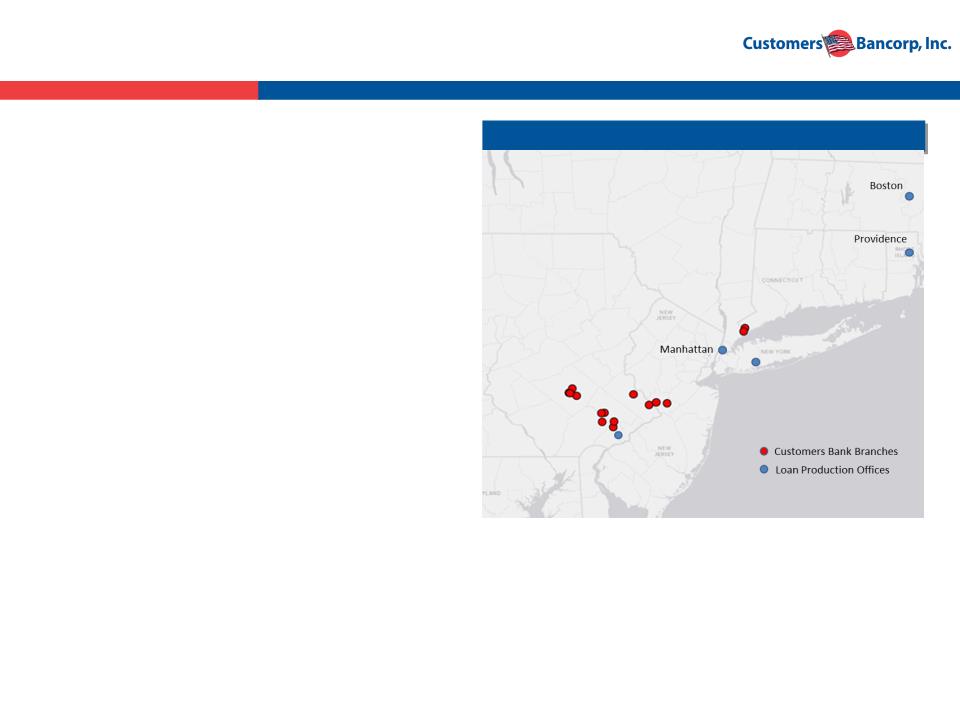
Current Company Overview
Source: SNL Financial and Company data.
Note: Branch proposed in northeastern Philadelphia
~$6.5 bn Business Bank with 19 sales offices with
target market from Boston to Philadelphia
target market from Boston to Philadelphia
Operating in key Mid-Atlantic and Northeast
markets
markets
§ Greater New York City area (Westchester County
Manhattan & Long Island)
Manhattan & Long Island)
§ Philadelphia area (Bucks, Berks, Chester, Delaware
and Philadelphia Counties in southeastern
Pennsylvania and Greater Princeton area in New
Jersey)
and Philadelphia Counties in southeastern
Pennsylvania and Greater Princeton area in New
Jersey)
§ Greater Boston area (Boston and Providence)
“High-touch, supported with high-tech” value
proposition
proposition
§ Very experienced teams using “Single Point of
Contact” model
Contact” model
§ Provides exceptional customer service supported by
state-of-the-art technology support
state-of-the-art technology support
§ Incentive compensation plans based upon P&L by
teams
teams
Branches and Loan Production Offices

16
Investment Proposition
Strong Organic Growth, Well Capitalized, Branch Lite Bank in Attractive Markets
§ $6.5 billion asset bank with only 14 branches and 5 sales offices
§ Well capitalized at 11.2% total risk based capital, 7.1% tier 1 leverage, and 6.5% tangible equity to tangible assets
§ Target market from Boston to Philadelphia along Interstate 95
Strong Profitability & Growth
§ Q3 2014 earnings up 41% over 3Q 2013 with an ROA of .80% and an ROE of 11%
§ YTD through September 2014 net income of $30.0 million up 26.8% over same period last year
§ ROA goal of 1% + and ROE of 12% + within 2-3 years
§ DDA and total deposits compounded annual growth of 100% and 73% respectively since 2009
§ Customers operating efficiencies offset tighter margins and generate sustainable profitability
Strong Credit Quality With Better Than Industry Efficiency Ratio
§ 0.25% non-performing loans (0.05% NPLs on $3.6 billion of loans originated after 2009)
§ No charge-offs on loans originated after 2009
§ Total reserves to non-performing loans of 246.4%
§ Q3 2014 margin was 2.79% and efficiency ratio was 54% - Efficiency ratio will be in the 40’s within 36 months
Attractive Valuation
§ Current share price (18.86)(1) is 12.3x estimated 2014 earnings, and 9.6x estimated 2015 earnings
§ Price/tangible book only 1.0x estimated for 2015 tangible book value
§ Peers, by size, trading at 14x LTM earnings and 1.7x price/tangible book; Peers with unique models trading at much
higher multiples
higher multiples
(1) Share price as of January 5, 2015
17
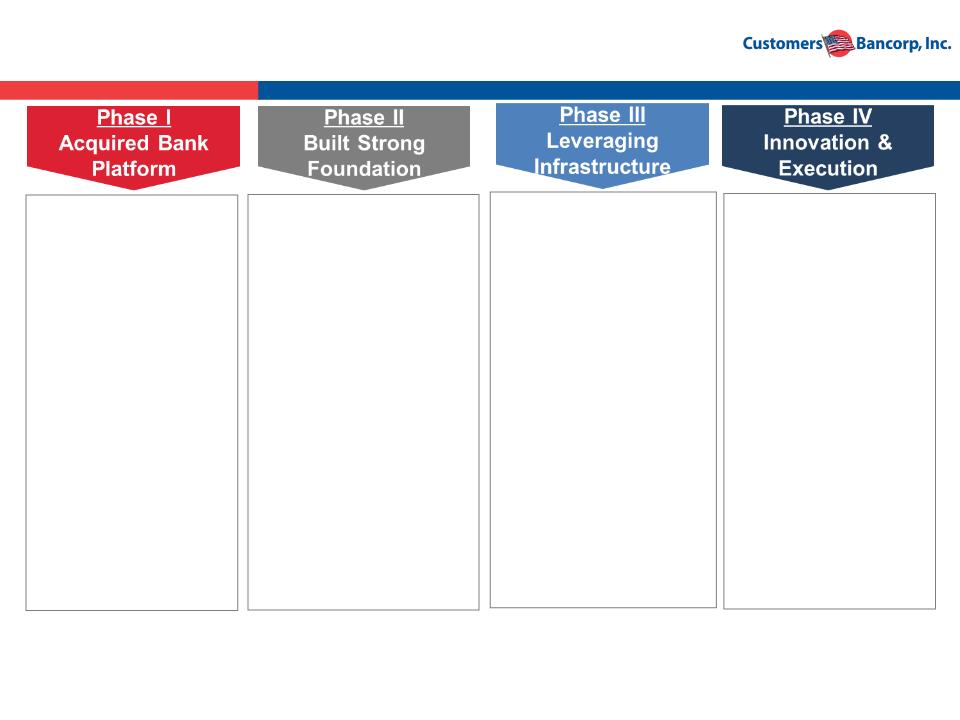
Execution Timeline
§ We invested in and
took control of a $270
million asset
Customers Bank (FKA
New Century Bank)
took control of a $270
million asset
Customers Bank (FKA
New Century Bank)
§ Identified existing
credit problems,
adequately reserved
and recapitalized the
bank
credit problems,
adequately reserved
and recapitalized the
bank
§ Actively worked out
very extensive loan
problems
very extensive loan
problems
§ Recruited experienced
management team
management team
§ Enhanced credit and risk
management
management
§ Developed infrastructure
for organic growth
for organic growth
§ Built out warehouse
lending platform and
doubled deposit and loan
portfolio
lending platform and
doubled deposit and loan
portfolio
§ Completed 3 small
acquisitions:
acquisitions:
– ISN Bank (FDIC-
assisted) ~ $70 mm
assisted) ~ $70 mm
– USA Bank (FDIC-
assisted) ~ $170 mm
assisted) ~ $170 mm
– Berkshire Bancorp
(Whole bank) ~ $85
mm
(Whole bank) ~ $85
mm
§ Recruited proven lending
teams
teams
§ Built out Commercial and
Multi-family lending
platforms
Multi-family lending
platforms
§ De Novo expansion;4-6
sales offices or teams
added each year
sales offices or teams
added each year
§ Continue to show strong
loan and deposit growth
loan and deposit growth
§ Built a “branch lite” high
growth Community Bank
and model for future
growth
growth Community Bank
and model for future
growth
§ Goals to ~12%+ ROE;
~1% ROA
~1% ROA
2009
Assets: $350M
Equity: $22M
2010-2011
Assets: $2.1B
Equity: $148M
2012-2013
Assets: $4.2B
Equity: $400M
3Q 2014
Assets: $6.5B
Equity: $426M
§ Single Point of Contact
Private Banking model
executed - commercial
focus
Private Banking model
executed - commercial
focus
§ Introduce bankmobile -
banking of the future
for consumers
banking of the future
for consumers
§ Continue to show
strong loan and
deposit growth
strong loan and
deposit growth
§ ~12%+ ROE; ~1%
ROA expected within
36 months
ROA expected within
36 months
§ ~$6.5+ billion asset
bank by end of 2014
bank by end of 2014
§ ~$9 billion asset bank
by end of 2019
by end of 2019
18
Banking Strategy
Business Banking Focus - ~95% of revenues come from business
• Loan and deposit business through these segments:
• Banking Privately Held Businesses
• Banking High Net Worth Families
• Banking Mortgage Companies
All Consumer
Products
Products
All Business
Products
Products
All Non-Credit
Products
Products
Client
Makes
One Call
Makes
One Call
Client
Private /
Personal
Bankers
Personal
Bankers
Concierge
Bankers
Bankers
Single Point of Contact
High Touch / High Tech
19
Deposit Strategy - High Touch, High Tech
§ Implementation of
technology suite
allows for unique
product offerings:
technology suite
allows for unique
product offerings:
§ Remote account
opening &
deposit capture
opening &
deposit capture
§ Internet/mobile
banking
banking
§ Free ATM
deployment in
U.S.
deployment in
U.S.
Cost of Funds + Branch Operating Expense - Fees = ALL-IN-Cost < Competitors
CUBI All-in cost of 1.75% is less than competitors all-in cost over the long-term
Technology
§ Low cost banking
model allows for
more pricing
flexibility
model allows for
more pricing
flexibility
§ Significantly lower
overhead costs vs. a
traditional branch
overhead costs vs. a
traditional branch
§ Pricing/profitability
measured across
relationship
measured across
relationship
Pricing
§ Experienced
bankers who own a
portfolio of
customers
bankers who own a
portfolio of
customers
§ Customer
acquisition &
retention strongly
incentivized
acquisition &
retention strongly
incentivized
§ Takes banker to the
customer’s home or
office, 12 hours a
day, 7 days a week
customer’s home or
office, 12 hours a
day, 7 days a week
§ Appointment
banking approach
banking approach
§ Customer access to
private bankers
private bankers
§ “Virtual Branches”
out of sales offices
out of sales offices
Sales Force
Concierge Banking
20
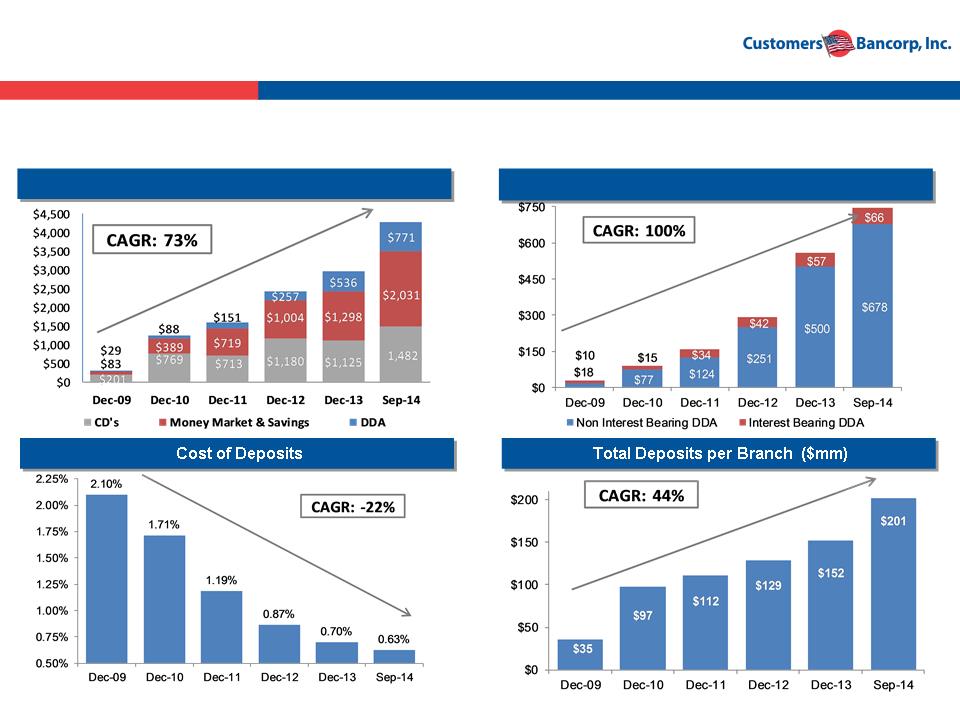
Results of Deposit Growth: Organic Growth with Controlled Costs
Source: Company data.
Total Deposit Growth ($mm)
Average DDA Growth ($mm)
Customers strategies of single point of contact and recruiting known teams in target markets produce
rapid deposit growth with low total cost
rapid deposit growth with low total cost
21
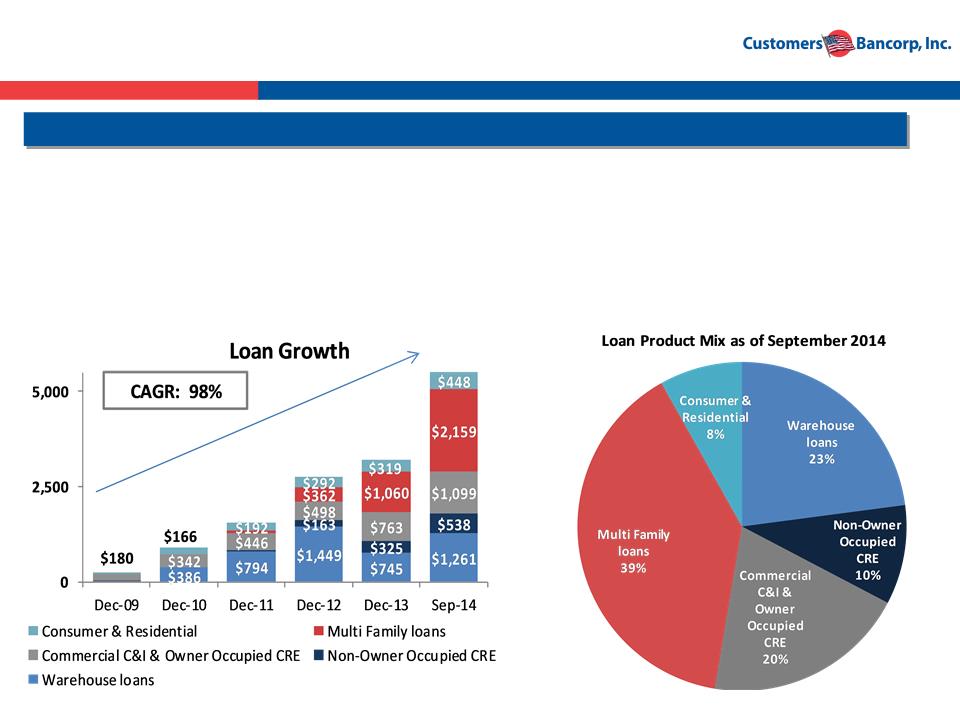
Customers Bank Advantage
Loan Portfolio Mix ($mm)
High Growth with Strong Credit Quality
§Continuous recruitment of high quality teams
§Centralized credit committee approval for all loans
§Loans are stress tested for higher rates and a slower economy
§No losses on loans originated since new management team took over
§Creation of solid foundation for future earnings
Source: Company documents.
22
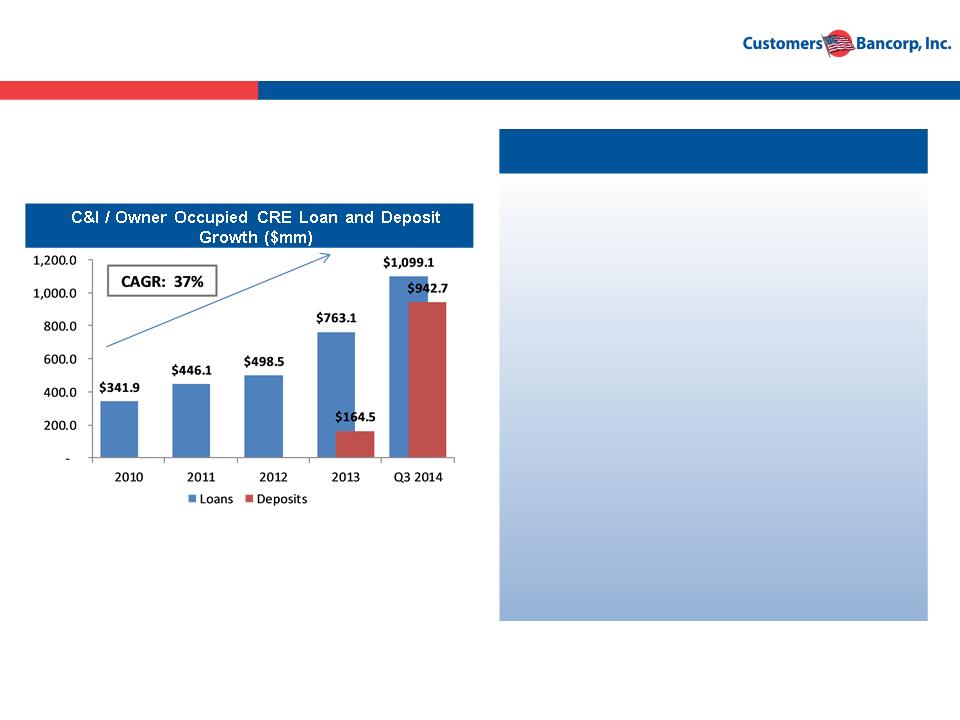
C&I & Owner Occupied CRE Banking Strategy
Private & Commercial Banking
§Target companies with up to $100 million
annual revenues
annual revenues
§Very experienced teams
§Single point of contact
§NE, NY, PA & NJ markets
Small Business
§Target companies with less than $5.0 million
annual revenue
annual revenue
§Principally SBA loans originated by small
business relationship managers or branch
network
business relationship managers or branch
network
§Current focus PA & NJ markets. Expanding
to National Markets
to National Markets
Banking Privately Held Business
Source: Company documents.
23
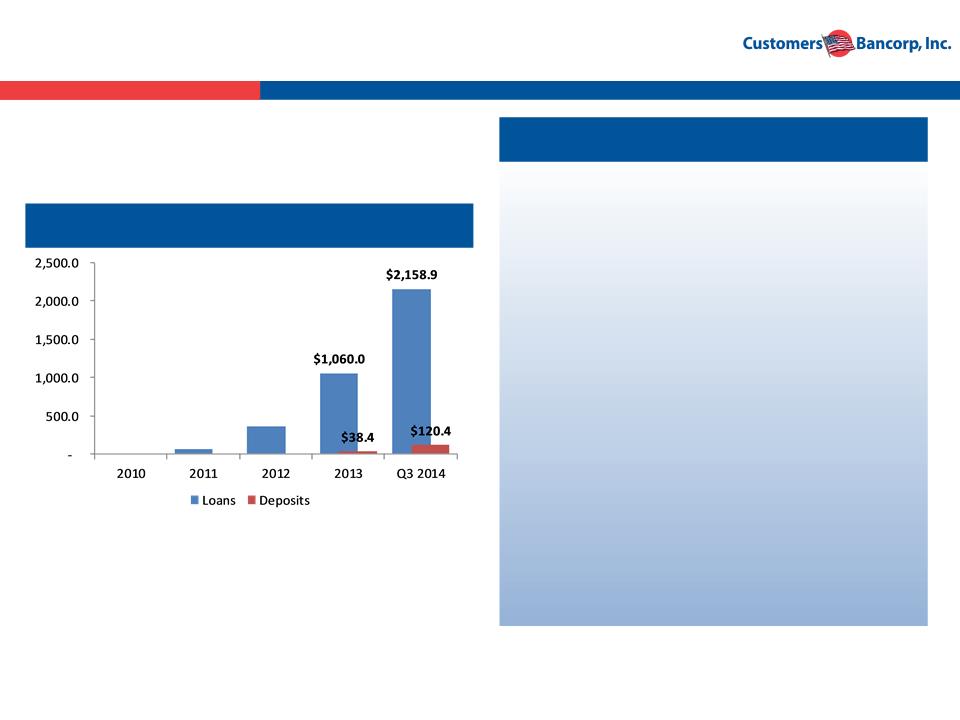
Multi-Family Banking Strategy
Banking High Net Worth Families
Multi-Family Loan and Deposit Growth ($mm)
§ Focus on families that have income
producing real estate in their portfolios
producing real estate in their portfolios
§ Private banking approach
§ Focus Markets: New York & Philadelphia
MSAs
MSAs
§ Average Loan Size: $4.0 - $7.0 million
§ Remote banking for deposits and other
relationship based loans
relationship based loans
§ Portfolio grown organically from a start up
with very experienced teams hired in the
past 3 years
with very experienced teams hired in the
past 3 years
§ Strong credit quality niche
§ Interest rate risk managed actively
Source: Company documents.
24
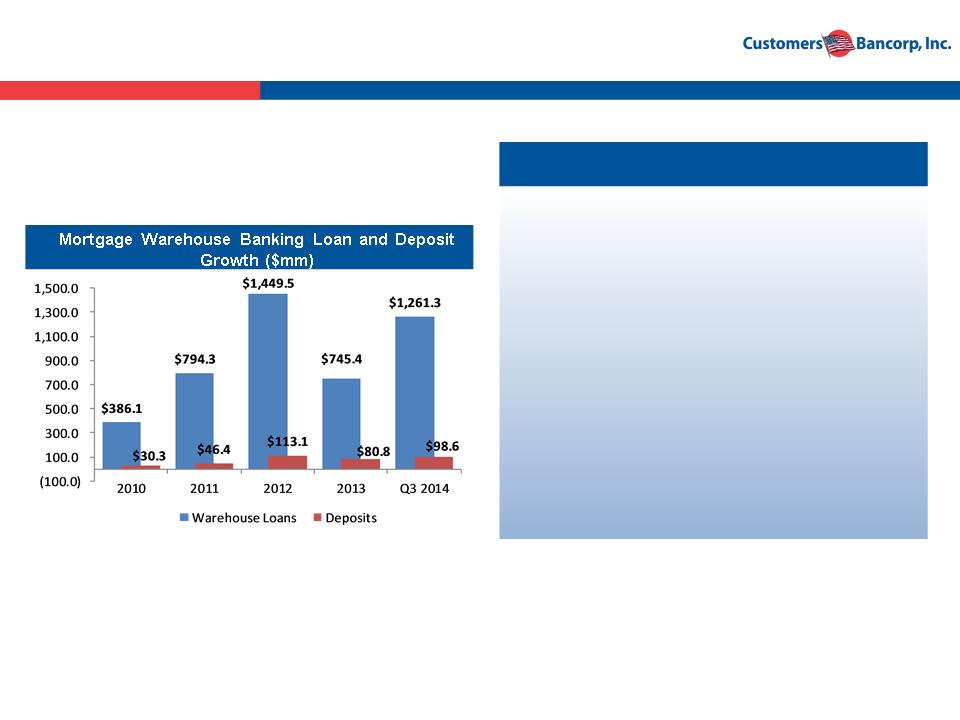
Mortgage Warehouse Banking Strategy
§Private banking focused on mortgage
companies with $5 to $10 million equity
companies with $5 to $10 million equity
§Very strong credit quality relationship
business with good fee income and deposits
business with good fee income and deposits
§~75 strong warehouse clients
§All outstanding loans are variable rate and
classified as held for sale
classified as held for sale
§All deposits are non-interest bearing DDA’s
§Balances rebounding from 2013 low and
expected to stay at this level
expected to stay at this level
Banking Mortgage Companies
Source: Company documents.
25
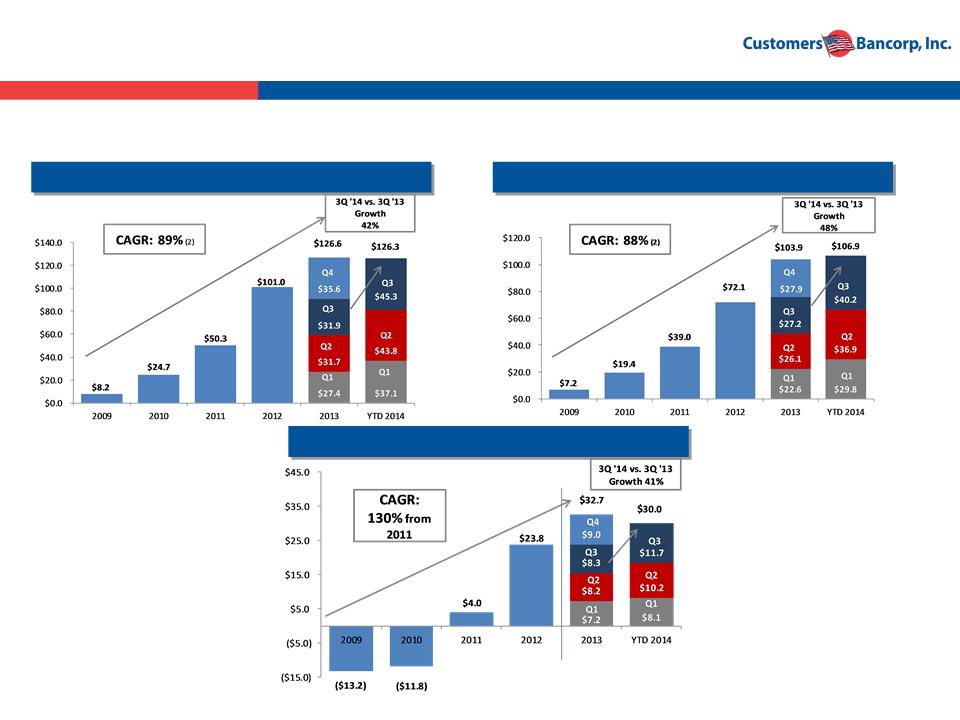
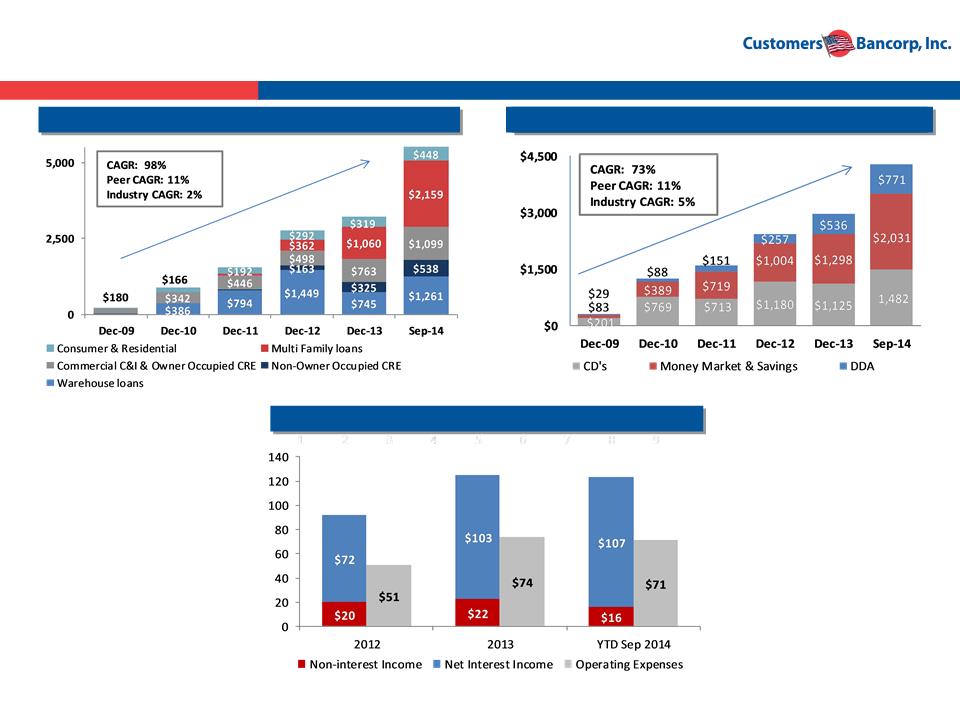
These Deposit and Lending Strategies Results in Disciplined & Profitable Growth
Core Revenue ($mm)
Core Net Income ($mm) (1)
Source: SNL Financial and Company data.
(1)Core income is net income before extraordinary items.
(2)CAGR calculated from Dec-09 to Sep-14 (annualized).
Net Interest Income ($mm)
• Strategy execution has produced superior growth in revenues and earnings
26
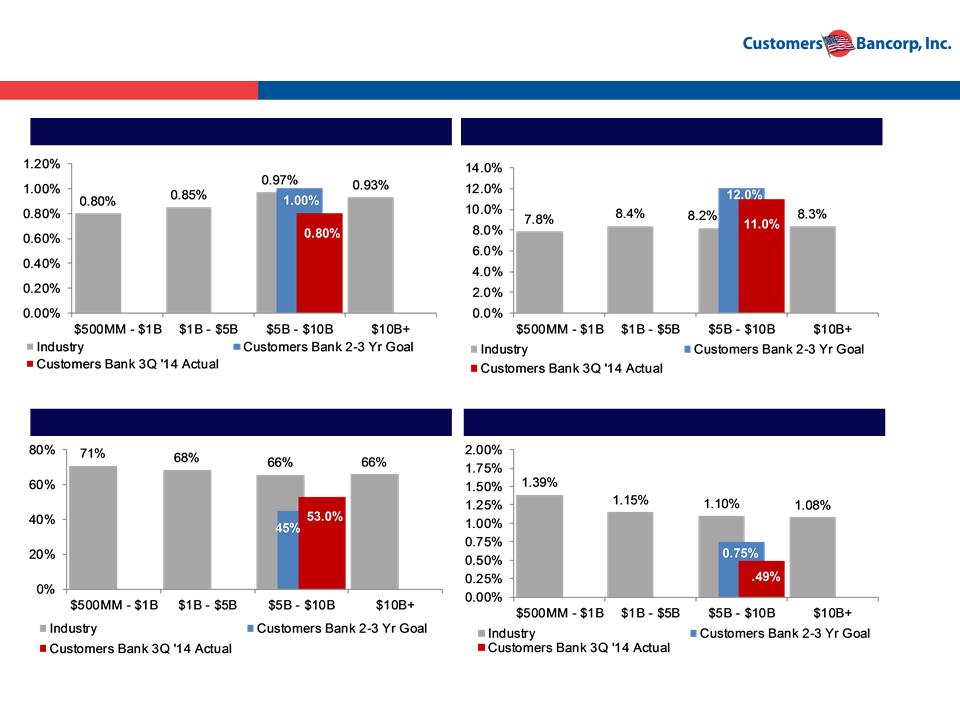
Return on Average Equity
Efficiency Ratio
NPAs / Total Assets
Return on Average Assets
Source: SNL Financial on an LTM basis as of 4Q2013
Note: NPA’s include FDIC covered loans
Customers Bancorp; A Stronger Performer
27
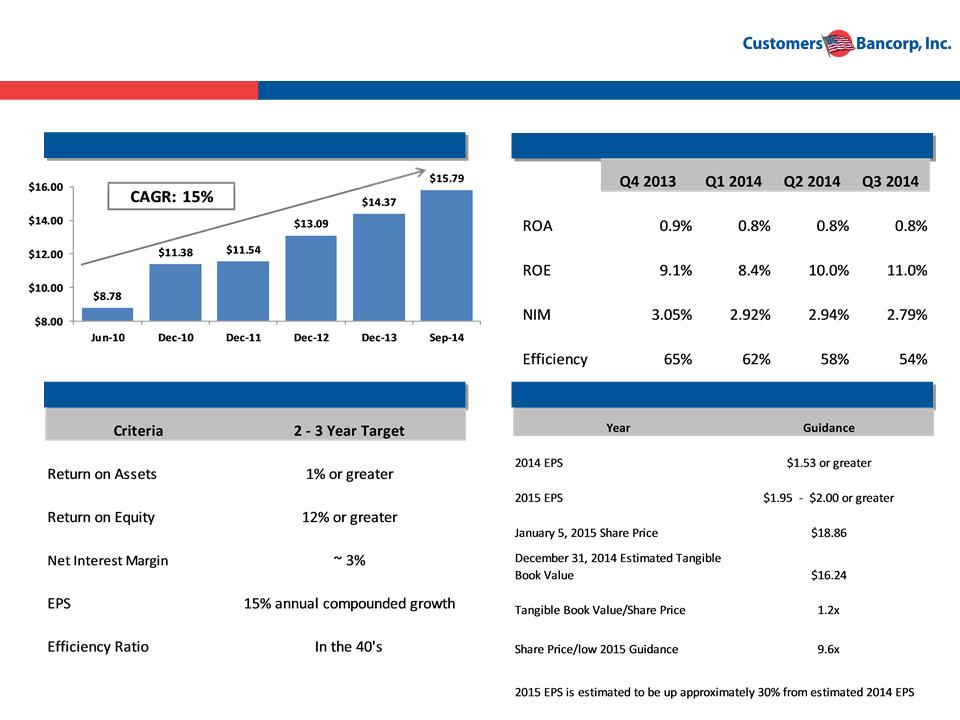
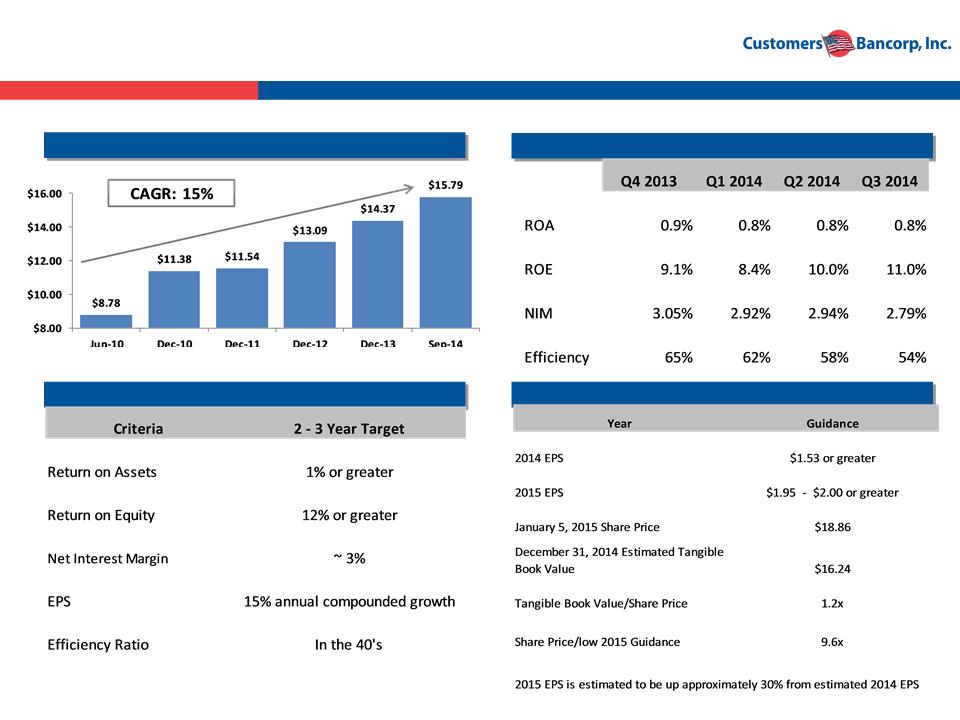
Tangible BV per Share
Source:
We are Building Customers Bank, to Provide Superior Returns to
Investors.
Investors.
Recent Performance Results
Financial Performance Targets
Earnings per Share Guidance
Source: Company documents.

28
Customers Bank
Risk Management
29
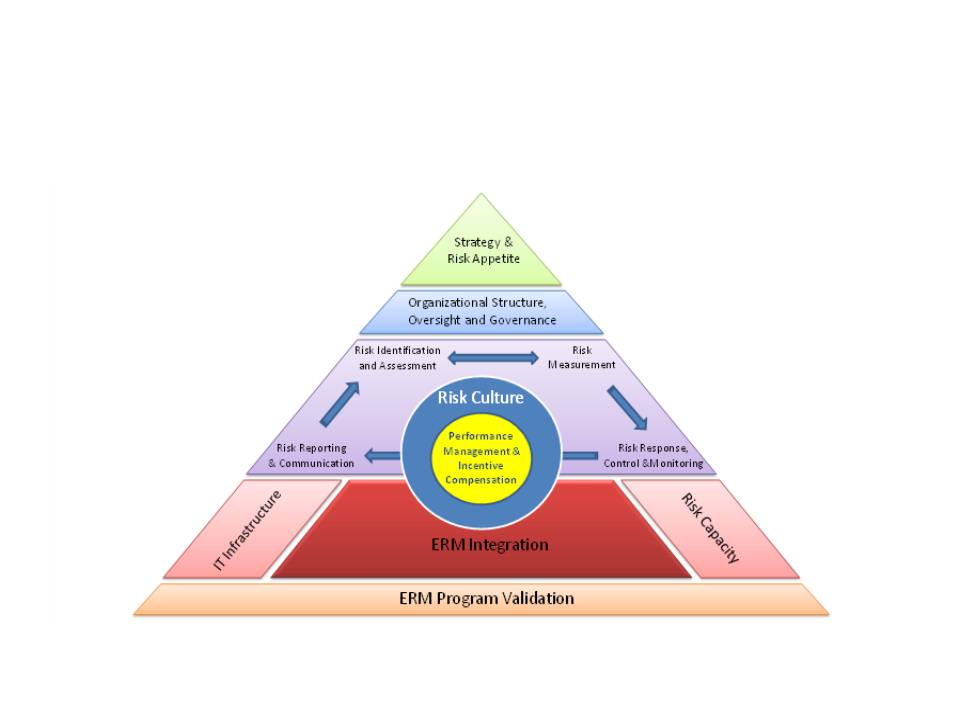
Elements of an Effective Risk
Management Program
Management Program
30
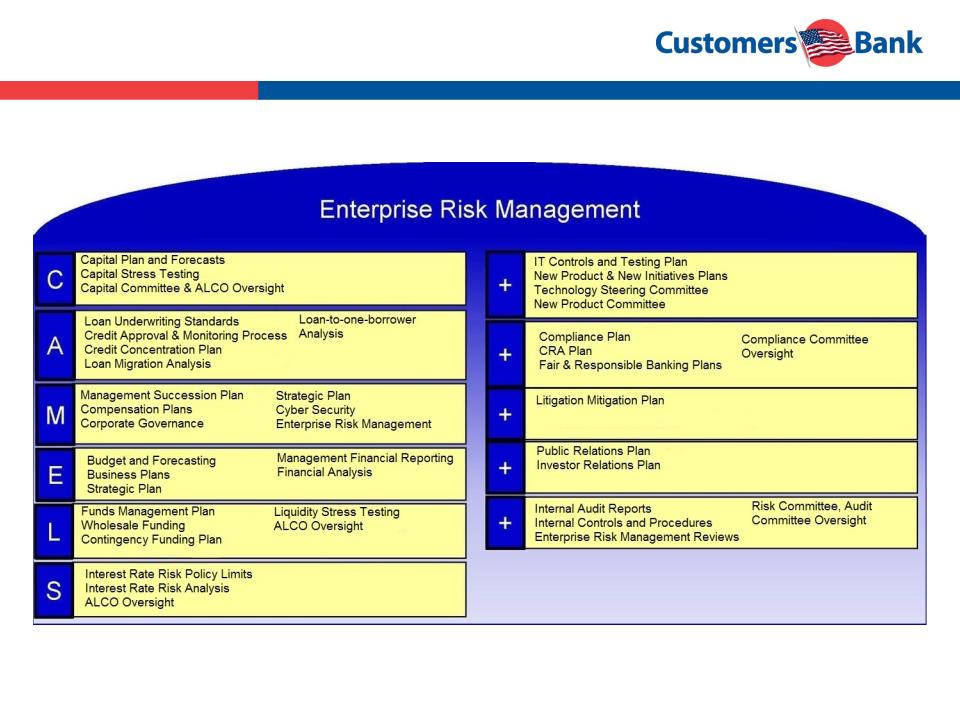
ERM Framework at Customers Bancorp, Inc.
Well Defined ERM Plan - ERM Integration into CAMELS +++++

31
Elements of Risk Management
• Active Board & Senior Management oversight
– Monthly Board, Risk, Audit, Compliance, Risk Management, ALCO, BUR meetings &
special meetings when needed—to Identify, Measure, Monitor and Control All Risks
special meetings when needed—to Identify, Measure, Monitor and Control All Risks
• Adequate and appropriate policies, procedures and limits
– Reviewed at appropriate management committees, significant policies reviewed at
Risk Management Committee, Risk Committee and Board
Risk Management Committee, Risk Committee and Board
• Adequate and appropriate risk-measurement, risk monitoring and
management information systems
management information systems
– Risk & Risk Management Committees - monthly scorecard and standard monthly
reports
reports
– Quarterly Risk Assessment based on a CAMELS+ methodology and Fed’s stress
tests scenarios
tests scenarios
– Management Reports and Board Reports - built a data warehouse and MIS system
that is continuously upgraded
that is continuously upgraded
• Comprehensive and effective internal controls
– Audit Committee, SOX Committee, COSO narratives & control matrices, Sox testing
– Internal Audit performs audits based on a risk focused plan
– Audit Committee reviews the internal audits and other control-review activities such
as SOX
as SOX

32
Credit Risk Management
Customers Bank manages “Credit Risk” through the following fundamental
principles:
principles:
Ø Ongoing maintenance of a comprehensive Loan Policy, that is fully assessed annually
Ø Dual approval authority required on any relationship with > $5.0MM in aggregate exposure
Ø Intra-Function Meetings (i.e. “Line” and “Credit”) and the (CCO and CLO) are held on an
ongoing basis to: 1) Ensure common goals/objectives exist; 2) Potential areas of conflict are
pro-actively addressed; and 3) That all functionally areas with the organization share a
common credit culture
ongoing basis to: 1) Ensure common goals/objectives exist; 2) Potential areas of conflict are
pro-actively addressed; and 3) That all functionally areas with the organization share a
common credit culture
Ø Proven and tested underwriting standards that are consistently applied across the entire
organization regardless of geographic region, credit type, etc…
organization regardless of geographic region, credit type, etc…
Ø Every loan is “Interest Rate Stress Tested” based on a 150 basis point and 300 basis point
scale in order to fully assess the potential ramifications of an escalating rate environment
scale in order to fully assess the potential ramifications of an escalating rate environment
Ø Every CRE Loan is “CAP Rate Stress Tested” based on a 100 basis point and 200 basis point
scale in order to fully assess potential ramifications of declining market values
scale in order to fully assess potential ramifications of declining market values
Ø Reports are provided to each Commercial Business Line Leader and Relationship Manager
denoting current and/or past due financial reporting requirements, covenant tests, annual
reviews, etc…
denoting current and/or past due financial reporting requirements, covenant tests, annual
reviews, etc…
Ø All relationship > $1.0MM are reviewed at least annually
Ø Loan Concentration Monitoring/Reporting to Total Risk Based Capital is performed monthly
with special focus placed on areas of concentration > 75.0% of Total Risk Based Capital (i.e.
Mortgage Warehouse and CRE)
with special focus placed on areas of concentration > 75.0% of Total Risk Based Capital (i.e.
Mortgage Warehouse and CRE)
Ø The Bank’s Chief Credit Officer reports to the Board Risk Committee
Ø Whitepapers are prepared, and updated on an ongoing basis, for any new lines of business
Ø Quarterly Watch List Meetings are held to discuss each and every credit assessed as
“Criticized” or “Classified”
“Criticized” or “Classified”

33
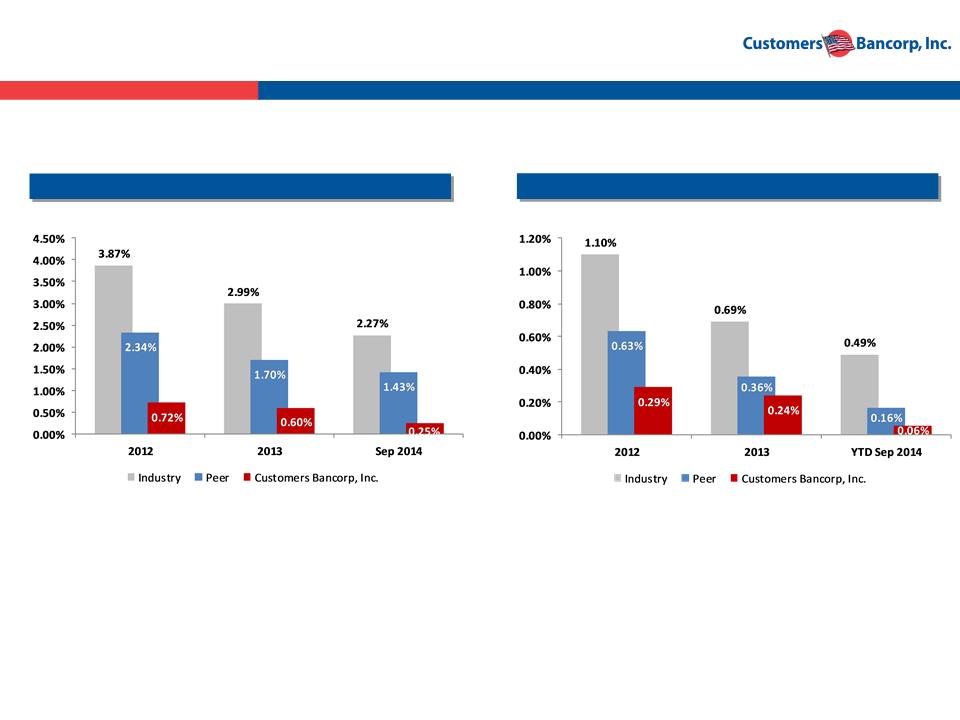
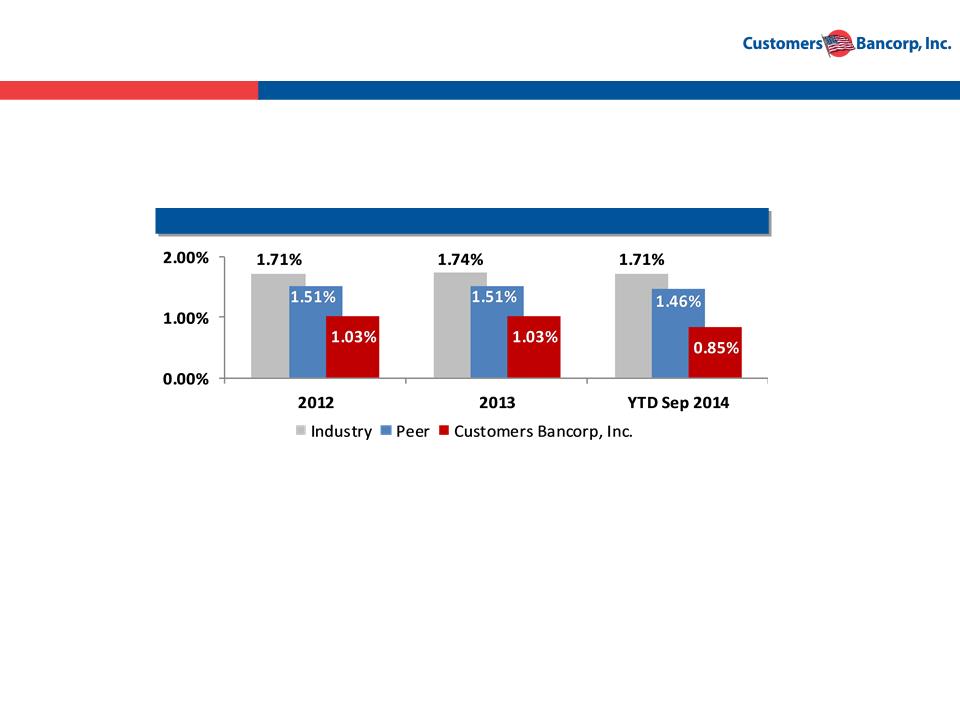
NPL
Source: SNL Financial, Company documents. Peer data consists of Northeast, Southeast, and Mid-Atlantic banks and thrifts with assets between $3.0 billion and $8.0 billion. Industry data includes all FDIC
insured banks.
insured banks.
Customers Credit Risk Management Results
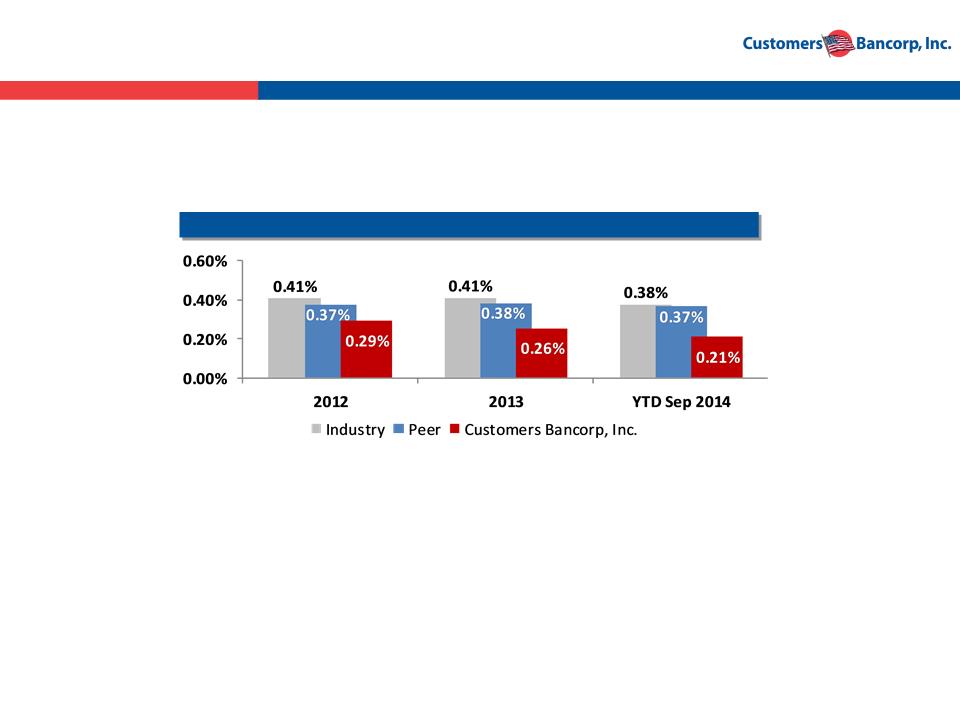
Charge Offs
Customers non-performing loans at September 2014
excluding loans guaranteed by the FDIC were 0.18% of
total loans.
excluding loans guaranteed by the FDIC were 0.18% of
total loans.
Charge-offs excluding FDIC guaranteed loans at
September 2014 were .02% of total loans.
September 2014 were .02% of total loans.
34
CRA and Fair and Responsible Lending
Ø Customers’ spring 2013 CRA examination resulted in an overall “needs to
improve” rating principally due to Federal Reserve referral to Department of
Justice
improve” rating principally due to Federal Reserve referral to Department of
Justice
Ø In August 2014 Department of Justice returned the referral to the Federal
Reserve for their disposition
Reserve for their disposition
– Customers took proactive steps to remediate potential issues identified by the Federal Reserve
and management
and management
Ø Customers’ fall CRA examination results are not final, but Customers’
anticipates a “satisfactory” rating
anticipates a “satisfactory” rating
Ø Customers has a robust compliance and fair and responsible banking group
Ø Customers notes significant improvement in key CRA elements
– Affordable mortgages increased from $4.3 million to $41.1 million
– Community development loans excluding NY increased from $17 million to $133 million
– NY Community Development loans increased from $46 million to $241 million
– Opening of Philadelphia loan origination office in LMI minority geography
– Launching of outreach programs to attract a diversity of customers

35
Customers Bank
Financial Performance Model For Creating
Shareholder Value
Shareholder Value

36
Creating Shareholder Value
Customers’ objective is to create value for our shareholders
§ YTD through September 2014 Net Income up 26.8% and EPS up 12% over the same period
last year
last year
§ Book value has increased 80% to $15.93 since July 2009, a CAGR of 15%
§ Since going public in May 2013, the per share market value has increased from $15.08 (May
16, 2013) to $19.46 (December 31, 2014), a 29% increase
16, 2013) to $19.46 (December 31, 2014), a 29% increase
§ 2014 Shareholder value up 6 % over year end 2013
Our future shareholder value creation strategy optimizes book value and
earnings
earnings
§ Execute our Single Point of Contact model that combines excellent service delivered by very
experienced bankers
experienced bankers
§ Build a high credit quality loan portfolio by marketing to high quality borrowers and
charging them a little less interest rate
charging them a little less interest rate
§ Build a stable core deposit platform by paying a little more to attract DDA and other core
depositors and then WOWing them with service
depositors and then WOWing them with service
§ Operate our businesses at a significantly lower cost with a “branch lite,” high touch strategy
supported by high technology
supported by high technology
§ Use new technologies and products to both disrupt the market and improve our operating
efficiencies
efficiencies
§ Control our risks
§ Resulting in sustainable above average ROE and growth rate in earnings in rising or stable
interest rate environments
interest rate environments
37
NPL
Source: SNL Financial, Company documents. Peer data consists of Northeast, Southeast, and Mid-Atlantic banks and thrifts with assets between $3.0 billion and $8.0 billion. Industry data includes all FDIC
insured banks.
insured banks.
Build a Strong Asset Quality Loan Portfolio
Charge Offs
Customers non-performing loans at September 2014
excluding loans guaranteed by the FDIC were 0.18% of
total loans.
excluding loans guaranteed by the FDIC were 0.18% of
total loans.
Charge-offs excluding FDIC guaranteed loans at
September 2014 were .02% of total loans.
September 2014 were .02% of total loans.
38
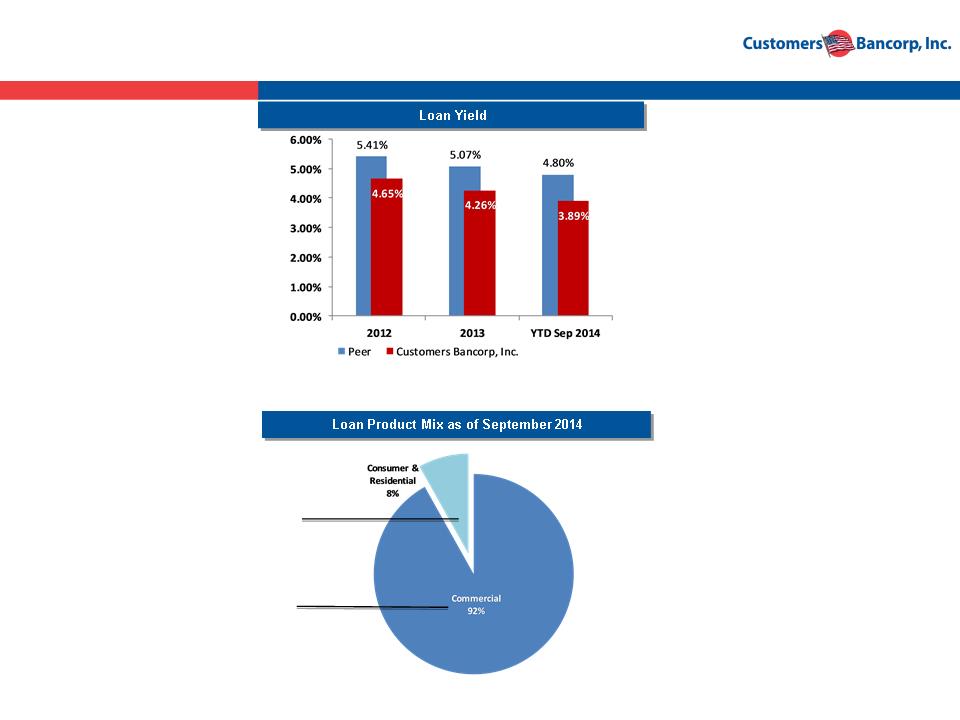
Accept a Little Less Yield from Strong Credit Quality Customers
Loan Product Mix, Duration and Collateral Influences Yield
Source: SNL Financial, Company documents. Peer data consists of Northeast, Southeast, and Mid-Atlantic banks and thrifts with assets between $3.0 billion and $8.0 billion.
Peer: 39%
Peer: 61%
39
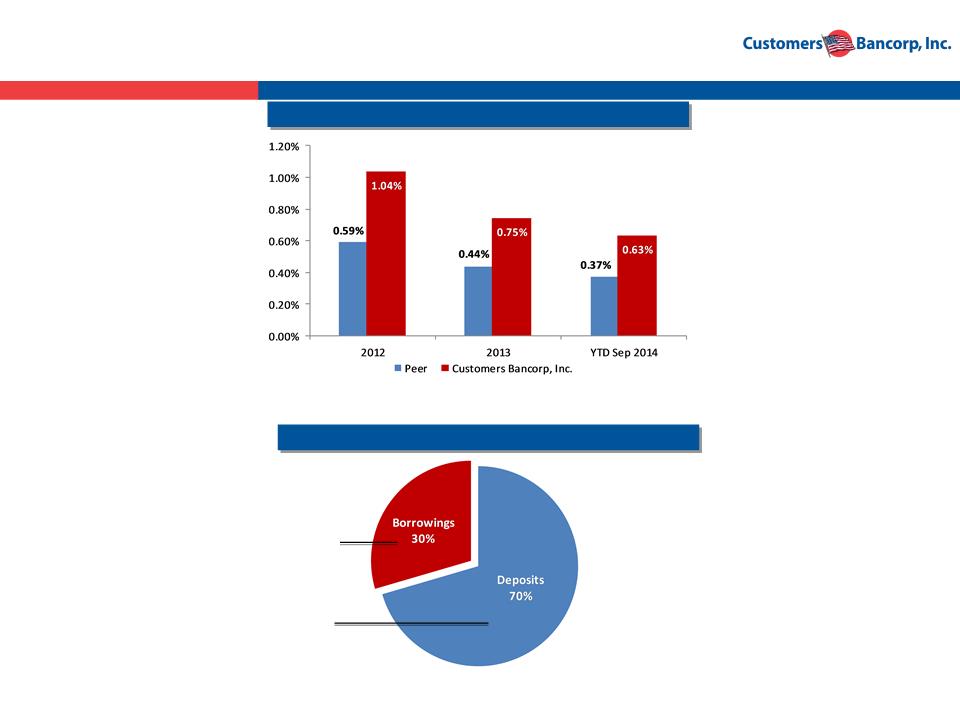
Deposit Rates
Pay a Little More for Core Deposits, Requiring DDA’s from
All Customers
Liability Mix and Duration Influences Interest Expense
Deposit and Borrowing Mix as of September 2014
Source: SNL Financial, Company documents. Peer data consists of Northeast, Southeast, and Mid-Atlantic banks and thrifts with assets between $3.0 billion and $8.0 billion.
Peer: 11%
Peer: 89%
•Borrowings principally fund our Mortgage
Warehouse business and assist in interest rate
risk management
Warehouse business and assist in interest rate
risk management
40
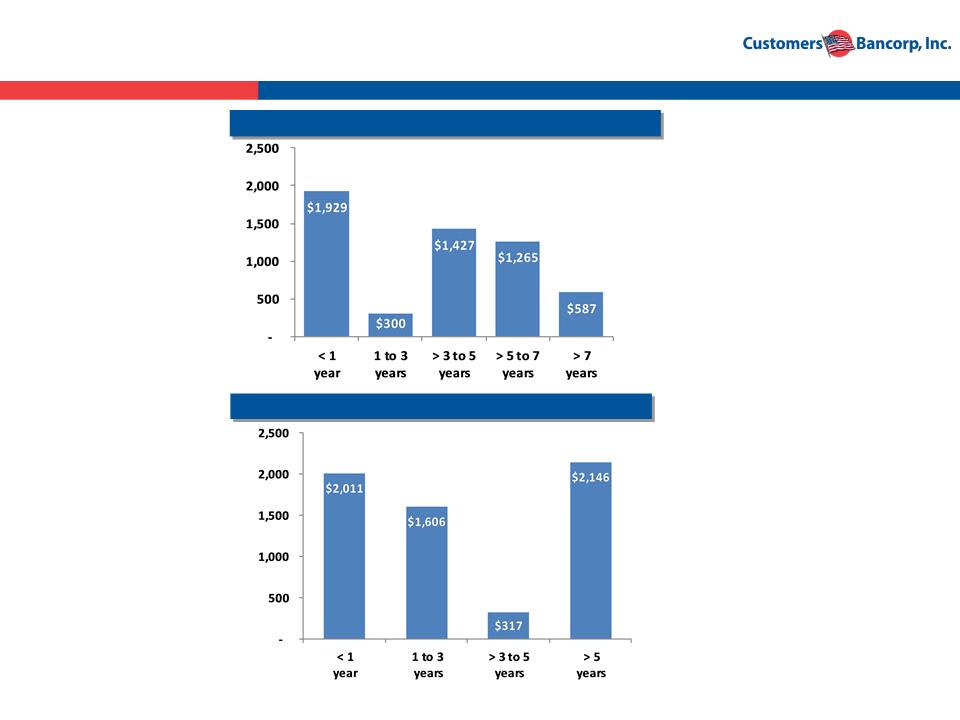
Interest Rate Risk - Balance Sheet Re-pricing
Source: SNL Financial, Company documents. Peer data consists of Northeast, Southeast, and Mid-Atlantic banks and thrifts with assets between $3.0 billion and $8.0 billion.
Deposit and Borrowing Maturities/Avg Lives ($mm)
Loan Maturity/Repricing ($mm)
41
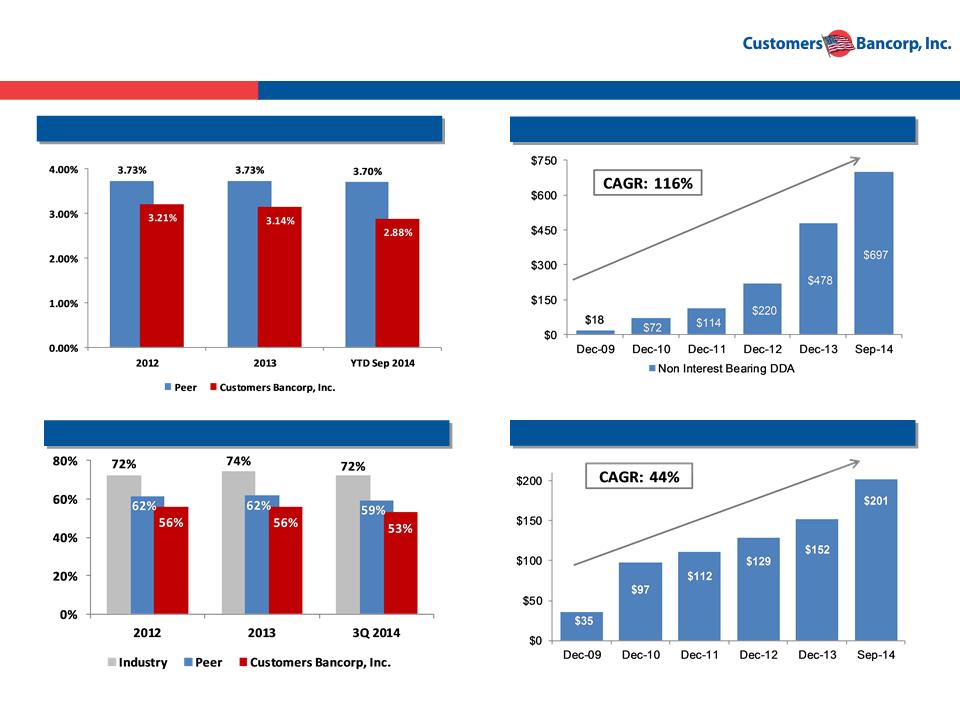
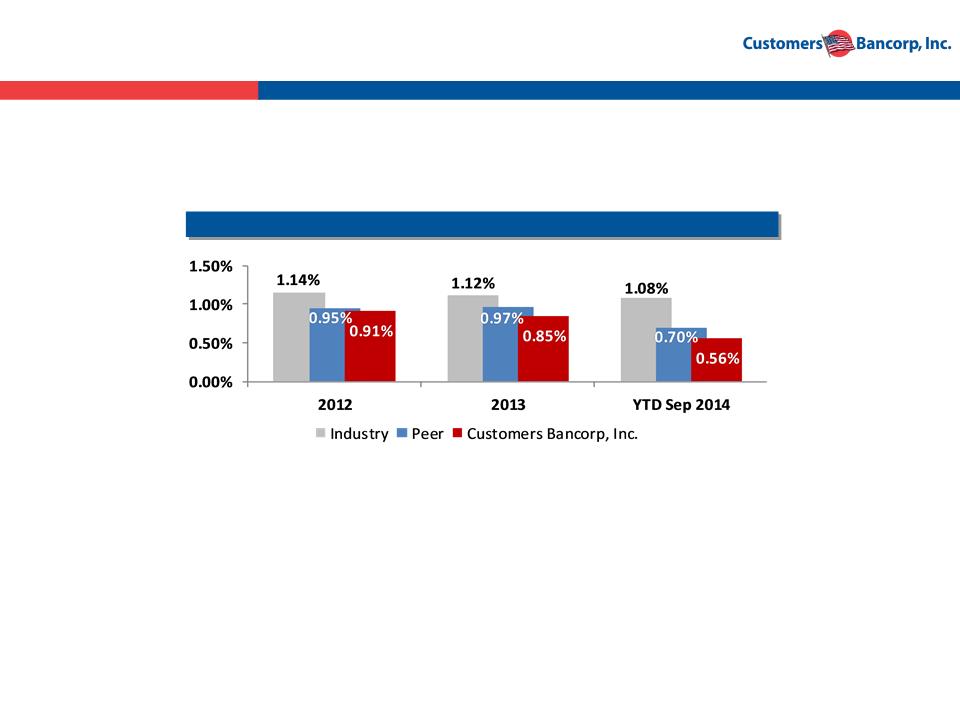
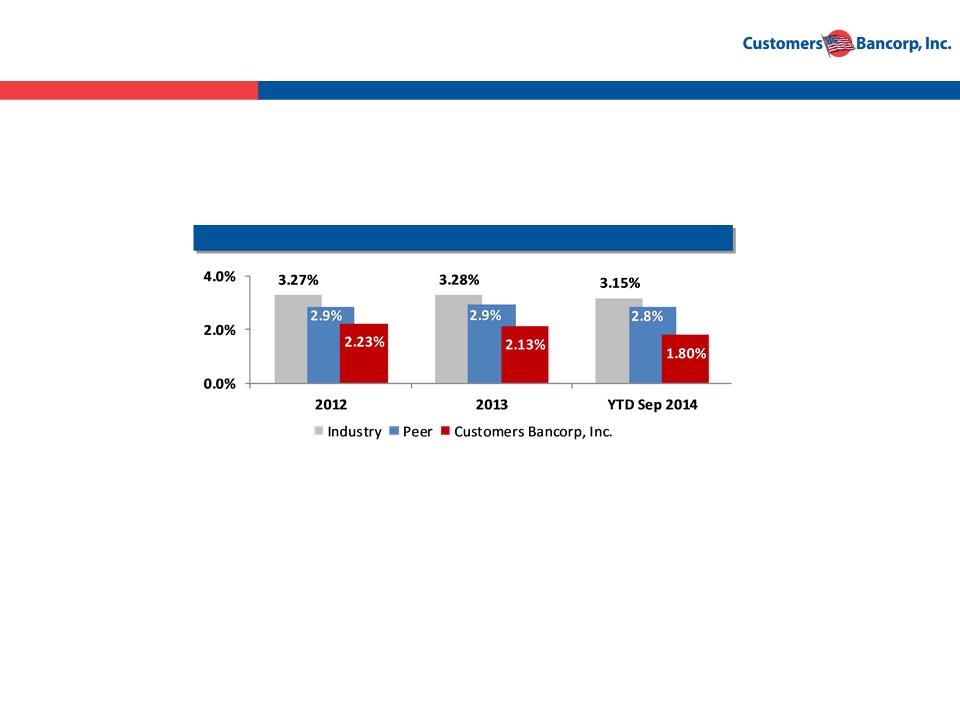
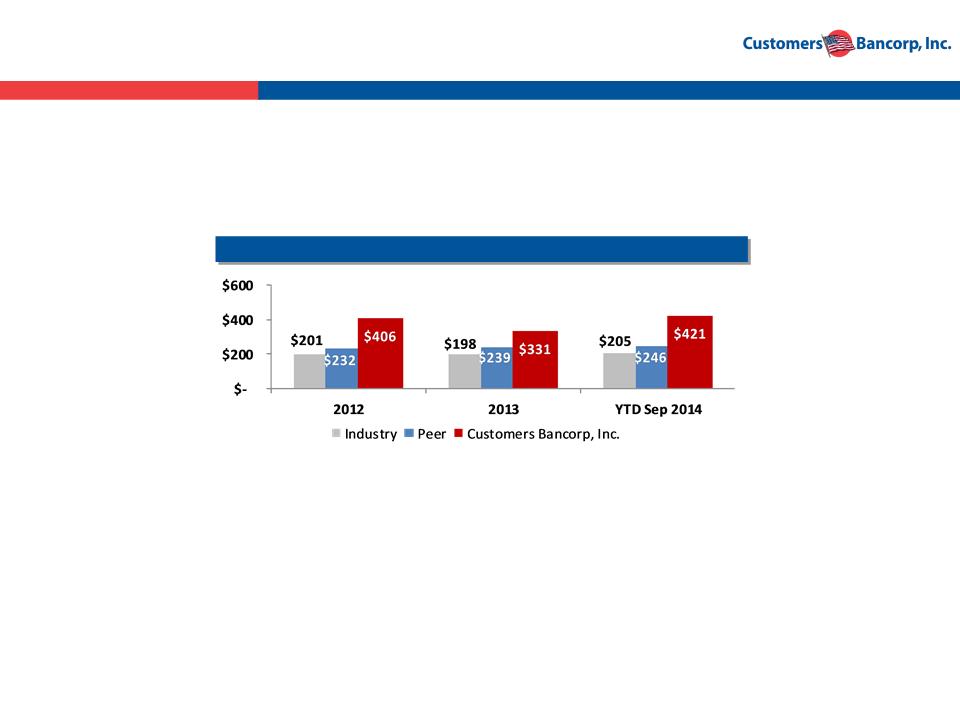
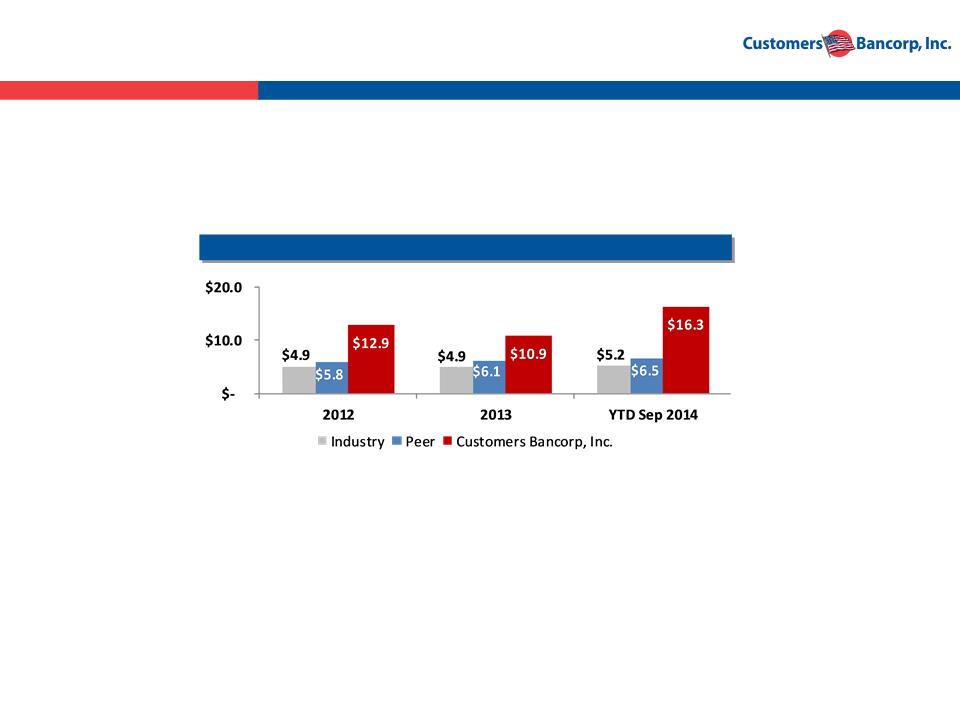
NIM
Lower NIM from Superior Credit Quality Niches is Offset by
Operating Efficiencies
Efficiency Ratio
Deposits Per Branch
Source: SNL Financial, Company documents. Peer data consists of Northeast, Southeast, and Mid-Atlantic banks and thrifts with assets between $3.0 billion and $8.0 billion. Industry data includes all FDIC
insured banks.
insured banks.
Non-Interest DDA Growth
42
Staff Expense Ratio
Building Efficient Operations Will Achieve a 40’s Efficiency Ratio
Source: SNL Financial, Company documents. Peer data consists of Northeast, Southeast, and Mid-Atlantic banks and thrifts with assets between $3.0 billion and $8.0 billion. Industry data includes all FDIC
insured banks.
insured banks.
43
Building Efficient Operations Will Achieve a 40’s Efficiency Ratio
Occupancy Expense Ratio
Source: SNL Financial, Company documents. Peer data consists of Northeast, Southeast, and Mid-Atlantic banks and thrifts with assets between $3.0 billion and $8.0 billion. Industry data includes all FDIC
insured banks.
insured banks.
44
Building Efficient Operations Will Achieve a 40’s Efficiency Ratio
All-Other Expense Ratio
Source: SNL Financial, Company documents. Peer data consists of Northeast, Southeast, and Mid-Atlantic banks and thrifts with assets between $3.0 billion and $8.0 billion. Industry data includes all FDIC
insured banks.
insured banks.
45
Building Efficient Operations Will Achieve a 40’s Efficiency Ratio
Total Costs as a % of Assets
Source: SNL Financial, Company documents. Peer data consists of Northeast, Southeast, and Mid-Atlantic banks and thrifts with assets between $3.0 billion and $8.0 billion. Industry data includes all FDIC
insured banks.
insured banks.
46
Building Efficient Operations Will Achieve a 40’s Efficiency Ratio
Total Revenue per Employee ($000s)
Source: SNL Financial, Company documents. Peer data consists of Northeast, Southeast, and Mid-Atlantic banks and thrifts with assets between $3.0 billion and $8.0 billion. Industry data includes all FDIC
insured banks.
insured banks.
47
Building Efficient Operations Will Achieve a 40’s Efficiency Ratio
Assets per Employee ($mm)
Source: SNL Financial, Company documents. Peer data consists of Northeast, Southeast, and Mid-Atlantic banks and thrifts with assets between $3.0 billion and $8.0 billion. Industry data includes all FDIC
insured banks.
insured banks.
48
Loan Growth ($mm)
Operating Strategy has Resulted in Remarkable Loan, Deposit and
Profitability Growth
Profitability Growth
Income Growth ($mm)
Deposit Growth ($mm)
Source: SNL Financial, Company documents. Peer data consists of Northeast, Southeast, and Mid-Atlantic banks and thrifts with assets between $3.0 billion and $8.0 billion. Industry data includes all FDIC
insured banks.
insured banks.

49
Source:
Capital Strategy Enables the Organic Growth
Elements of Customers’ Capital Allocation & Management Strategy
§Protection and growth of shareholder value
– Disciplined capital raises
– Strong earnings
§Targeted capital levels sufficient to absorb unexpected losses but leverage
enough to optimize shareholder investment:
enough to optimize shareholder investment:
– Tangible common to tangible assets of 6.5% - 7.0%
– CET1 RBC of 7.0% - 7.5%
– Tier 1 leverage ratio of 7.0% - 7.5%
– Tier 1 RBC of 8.5% - 9.0%
– Total RBC of 10.5% - 11%
Source: Company documents.

50
2015 Guidance vs. 2014 Results
|
Business Driver
|
2015 Guidance vs. 2014 Guidance -
EPS Up about 30%
|
|
Investments
|
Unchanged
|
|
Average Loans (including Loans Held for Sale
and Loans Held for Investment) |
Growth slowed to 10 - 15% over year end 2014
|
|
Deposits
|
Steady growth at 20 - 25% over year end 2014
|
|
Net Interest Income
|
Growth in the mid-20’s %, largely built on 2014
asset growth |
|
Net Interest Margin
|
Largely flat with end of 2014 core (excluding
pre-payment penalties) run rate |
|
Net Charge-offs
|
Under 0.05%, with accelerated resolution of
FDIC guaranteed loans a possible exception |
|
Operating Expenses
|
Growth of 15 - 20% over 2014
|
|
Efficiency Ratio
|
Low - mid 50’s % for year, declining during the
year |
Source: Company documents.
51
Tangible BV per Share
Source:
Combined, We have Built Customers Bank, a Bank We Believe will
Provide Superior Returns to Investors.
Provide Superior Returns to Investors.
Recent Performance Results
Financial Performance Targets
Earnings per Share Guidance
Source: Company documents.

52
Summary
§ Strong high performing $6.5 billion bank with significant growth opportunities
§ Very experienced management team delivers strong results
§ Ranked #1 overall by Bank Director Magazine in the 2012 and 2013 Growth
Leader Rankings
Leader Rankings
§ “High touch, high tech” processes and technologies result in superior growth,
returns and efficiencies
returns and efficiencies
§ Shareholder value results from the combination of increasing tangible book
value with strong and consistent earnings growth
value with strong and consistent earnings growth
§ Attractive risk-reward: growing several times faster than industry average but
yet trading at a significant discount to peers
yet trading at a significant discount to peers
§ Introducing the first mobile banking application for account opening in the U.S.
and first full service consumer bank in the palm of your hand in the U.S.
and first full service consumer bank in the palm of your hand in the U.S.
53

54
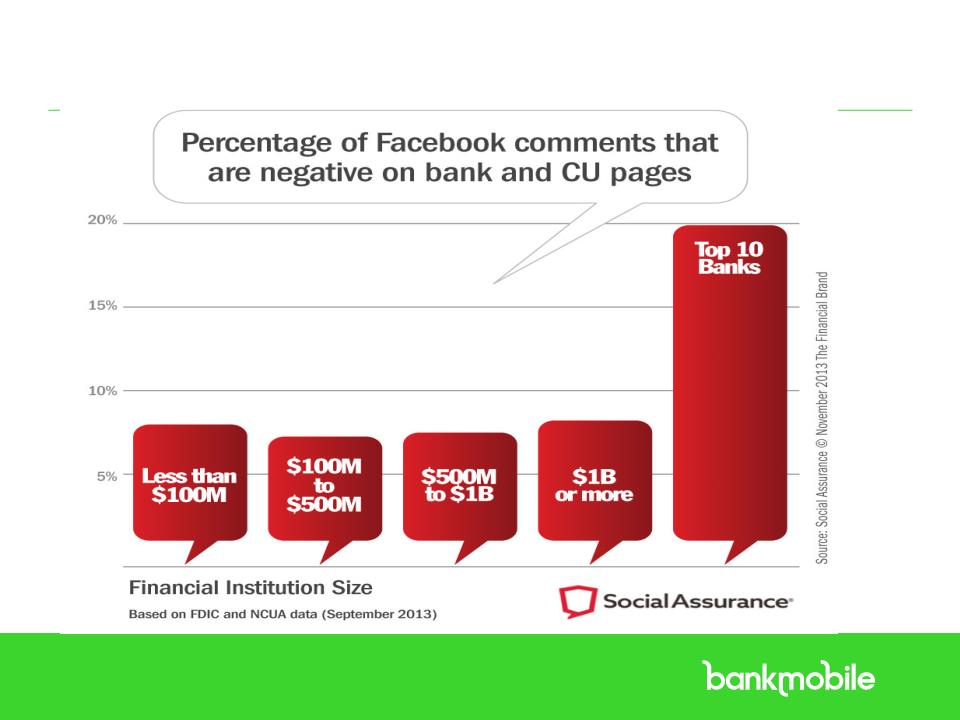
Startling Facts about Banks
§ Banks each year charge $32 billion in overdraft fees - that’s
allowing or creating over 1 billion overdrafts each year….Why??
allowing or creating over 1 billion overdrafts each year….Why??
§ Payday lenders charge consumers another $7 billion in fees
§ That’s more than 3x what America spends on Breast Cancer and
Lung Cancer combined
Lung Cancer combined
§ This is about 50% of all America spends on Food Stamps
§ Some of banking industries most profitable consumer customers
hate banks
hate banks
§ Another estimated 25% consumers are unbanked or under banked
This should not be happening in America
We hope to start, in a small way, a new revolution
to profitably address this problem
to profitably address this problem
55
§ New no fee banking, 25 bps higher interest savings, line of credit, 55,000 ATM’s, Personal
Banker and more, all in the palm of your hand
Banker and more, all in the palm of your hand
§ Marketing Strategy
§ Target technology dependent younger customers; including
underserved/underbanked now and later larger depositors generally >50 years old
segments
underserved/underbanked now and later larger depositors generally >50 years old
segments
§ Capitalize on retaining at least 25% of our ~ one million student customers over a 5
year period
year period
§ Reach markets also through Affinity Banking Groups
§ Revenue generation from debit card interchange and margin from low cost core
deposits
deposits
§ Durbin Amendment a unique opportunity for Bank Mobile
§ Total investment not to exceed about $5.0 million by end of 2015
§ Expected to achieve above average, franchise value, ROA and ROE within 5 years
Creating a Virtual Bank for the Future
56
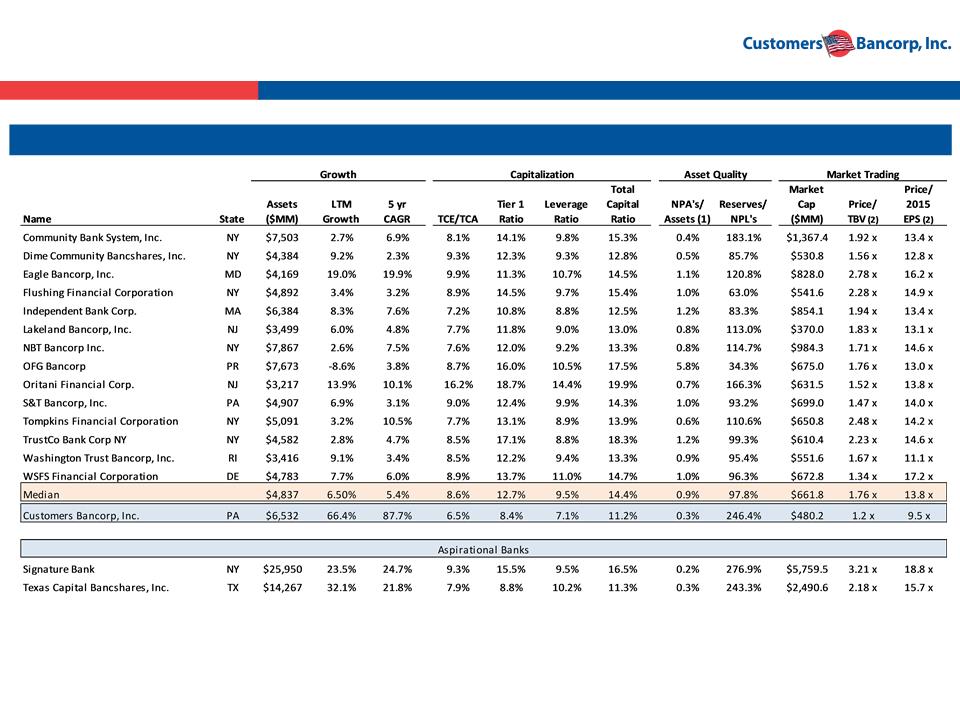
Regional Bank Comparison
High Performance Regional Banks
Source: SNL Financial, Company documents. Market data as of 9/30/2014. Consists of Northeast and Mid-Atlantic banks and thrifts with assets between $3.0 billion and $8.0 billion and most recent quarter core ROAA greater
than 90 bps. Excludes merger targets and MHCs.
than 90 bps. Excludes merger targets and MHCs.
(1)Customers Bancorp NPAs excludes accruing TDRs and loans 90+ days past due and still accruing.
(2)Customers Bancorp Price/TBV and Price/2015 EPS based on share price as of Dec 9, 2014.

57
Contacts
Company:
Robert Wahlman, CFO
Tel: 610-743-8074
rwahlman@customersbank.com
rwahlman@customersbank.com
www.customersbank.com
Jay Sidhu
Chairman & CEO
Tel: 610-301-6476
jsidhu@customersbank.com
jsidhu@customersbank.com
www.customersbank.com
Investor Relations:
Ted Haberfield
President, MZ North America
Tel: 760-755-2716
thaberfield@mzgroup.us
www.mzgroup.us

Appendix

59
Balance Sheet
60
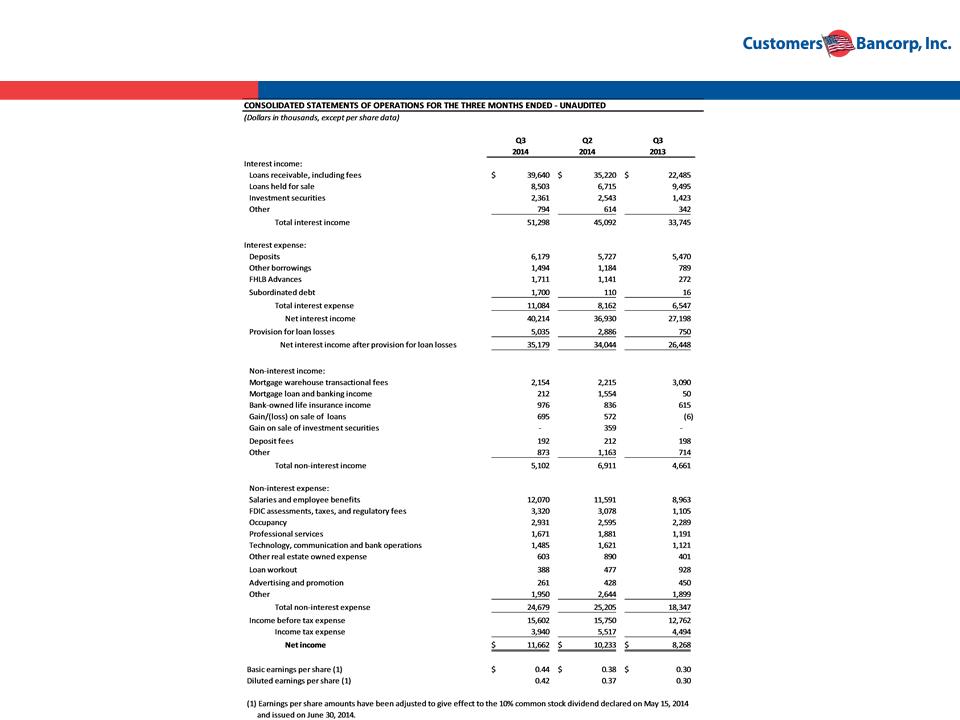
Income Statement
61
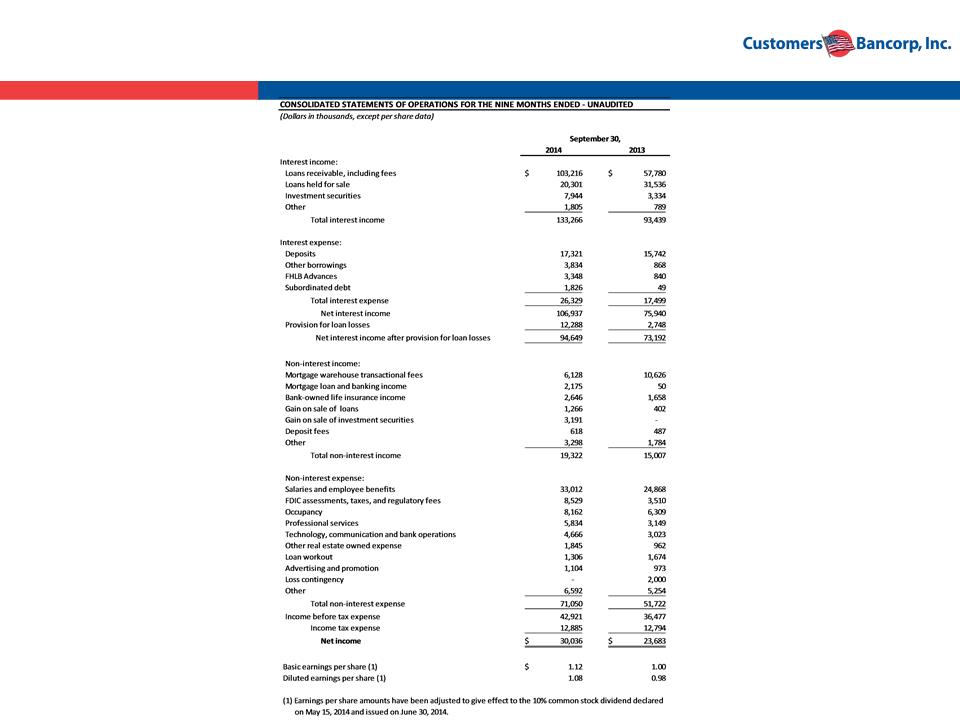
Income Statement
62
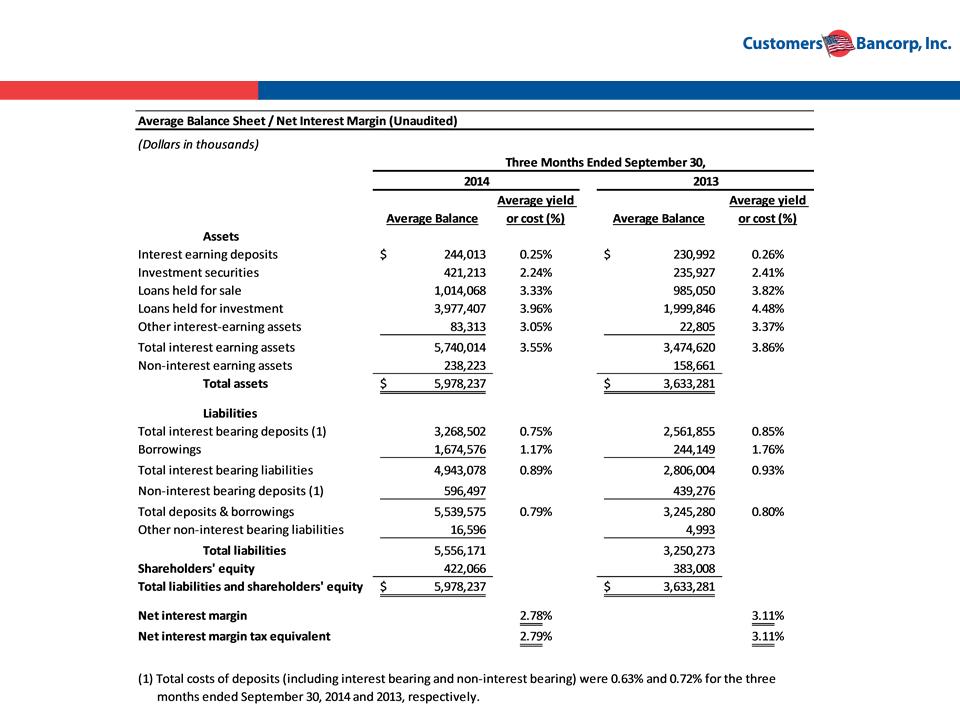
Net Interest Margin
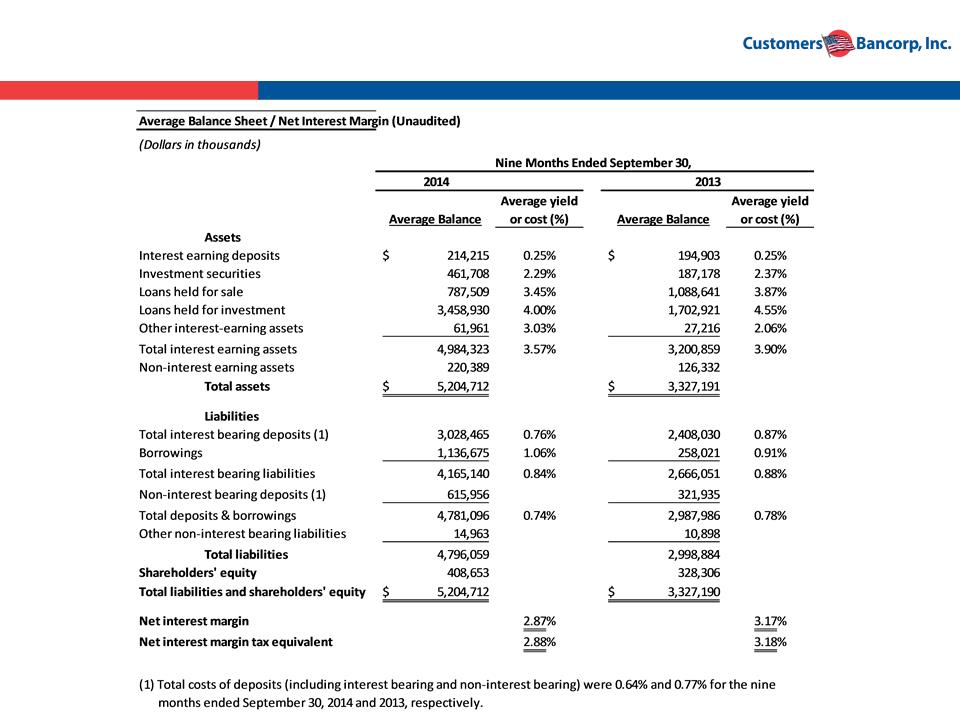
63
Net Interest Margin
64
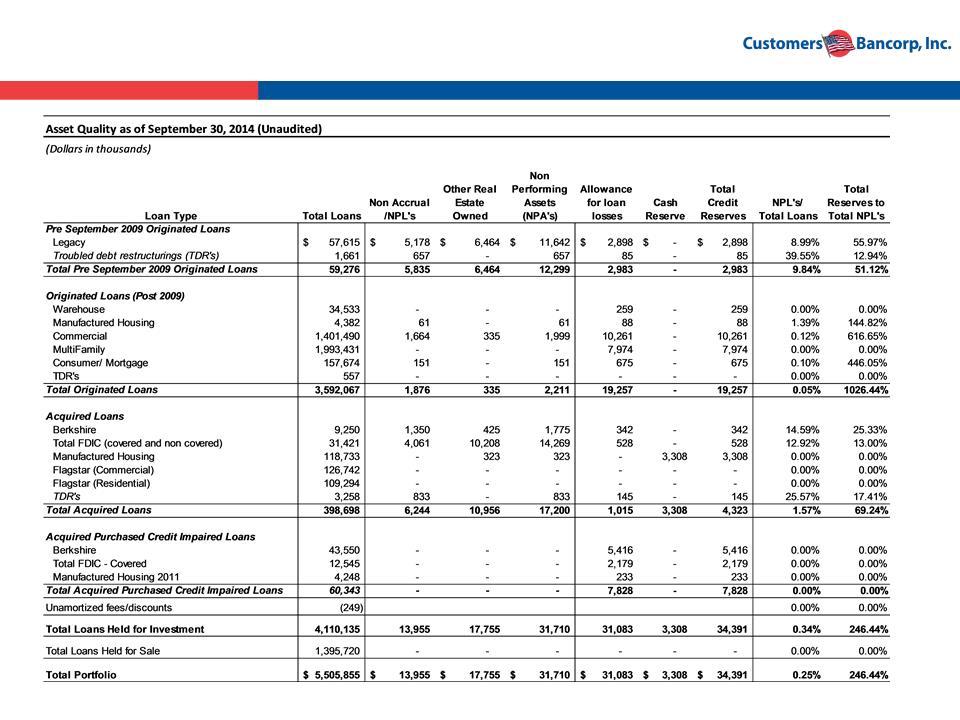
Asset Quality

>> >> >>
WHY BANKMOBILE?
JANUARY 7, 2015
WARREN TAYLOR
PRESIDENT - BANKMOBILE

>>
AGENDA
1. Retail Branch Banking - A Broken
Model?
Model?
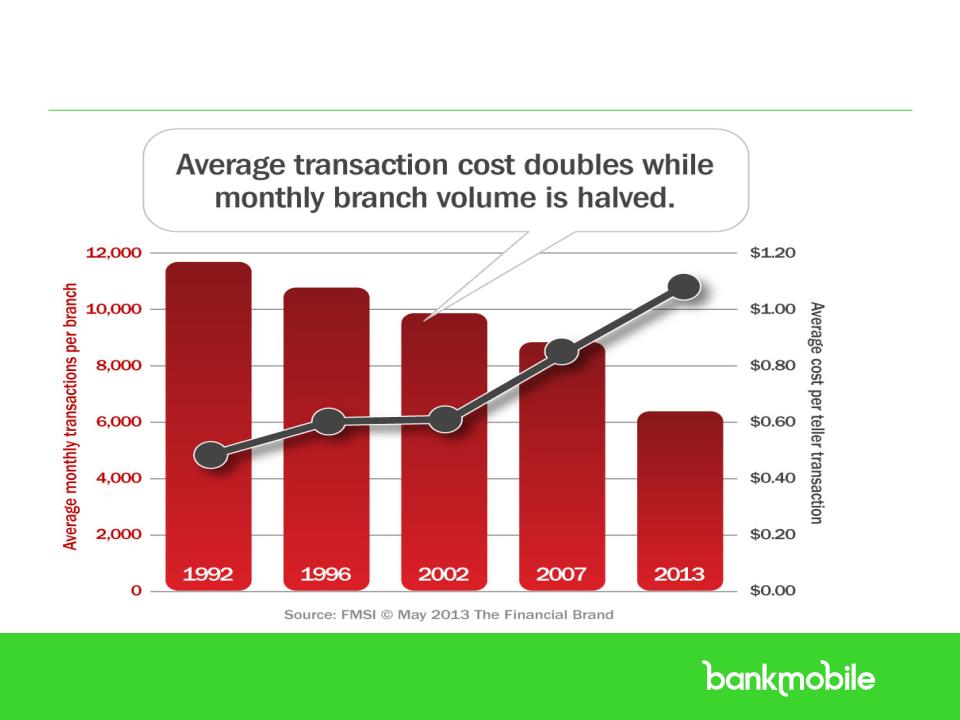
1. BRANCH OVERHEAD IMPLICATIONS
2. BRANCH EFFICIENCY
2. Our Solution - BankMobile
.

>>
A NEW BRANCH MODEL
• Overhead + COD - Fees = All-In Cost
• $1 million OH / $55.7 M deposits* = 1.79%
• $1 million OH / $170 M deposits = 0.59%
• OD fees in 2013 were $32 billion
– A $35 FEE ON A $100 OVERDRAFT FOR 1 WEEK = 1820% APR
– WILL THE CFPB ALLOW THIS “USURY” TO CONTINUE?
* The 2014 Cornerstone Performance Report
ALL-IN COST MODEL

>>
IS THE BRANCH DEAD?
• # of branches in 1970 = 45,337*
• # of branches in 2014 = 94,725*
• Peak in 2009 # of branches = 99,550*
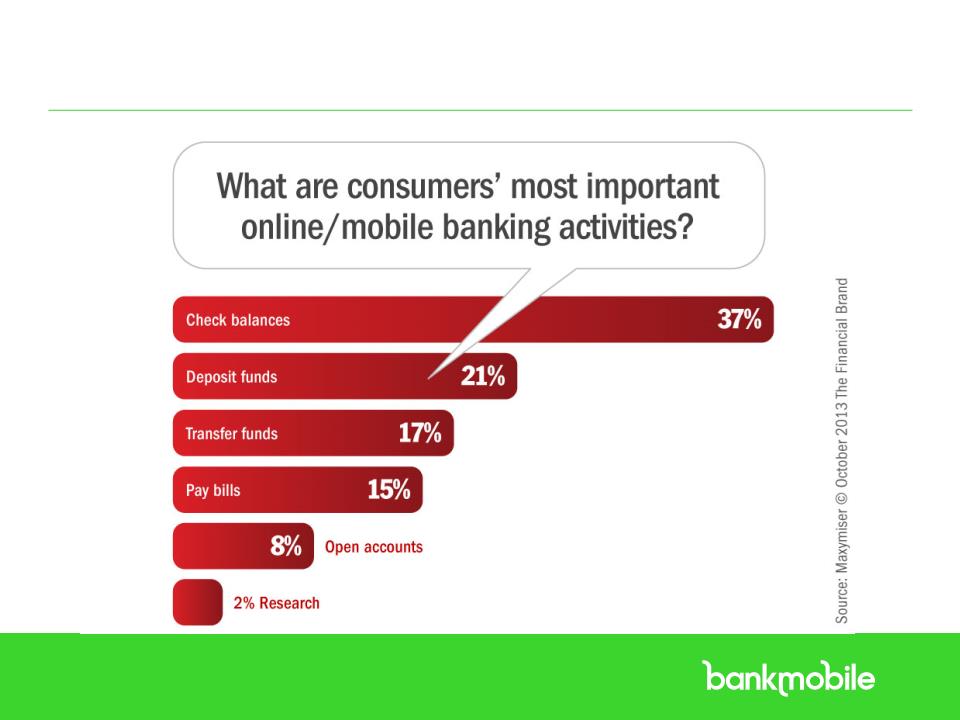
• Consumers preferred delivery channel:**
1. INTERNET BANKING 31%
2. BRANCH BANKING 21%
3. ATMS 14%
4. MOBILE BANKING 10%
* Richard Brown, Chief Economist, FDIC
** American Bankers Assoc. report 2014
.
>>
OVERHEAD COSTS

>>
EFFICIENCY*
• Deposits open/close ratio = 1.07
• Total retail checking accounts per branch = 1,488
• Monthly new checking accounts opened per branch =
17
17
• Deposit accounts serviced per platform FTE = 2,627
– ACTIVE INTERNET BANKING USERS PER INTERNET BANKING
FTE = 15,235
FTE = 15,235
• The old retail branch model is broken!
* The 2014 Cornerstone Performance Report
.
>>
MAIN PRODUCTS
>>
CUSTOMER SERVICE
>>
MOBILE BANKING BASICS
.
>>
CUSTOMER HOT POINTS

>>
FINANCIALS
• Revenue
– INTERCHANGE INCOME
– INTEREST ON LOANS (MINUS RESERVES)
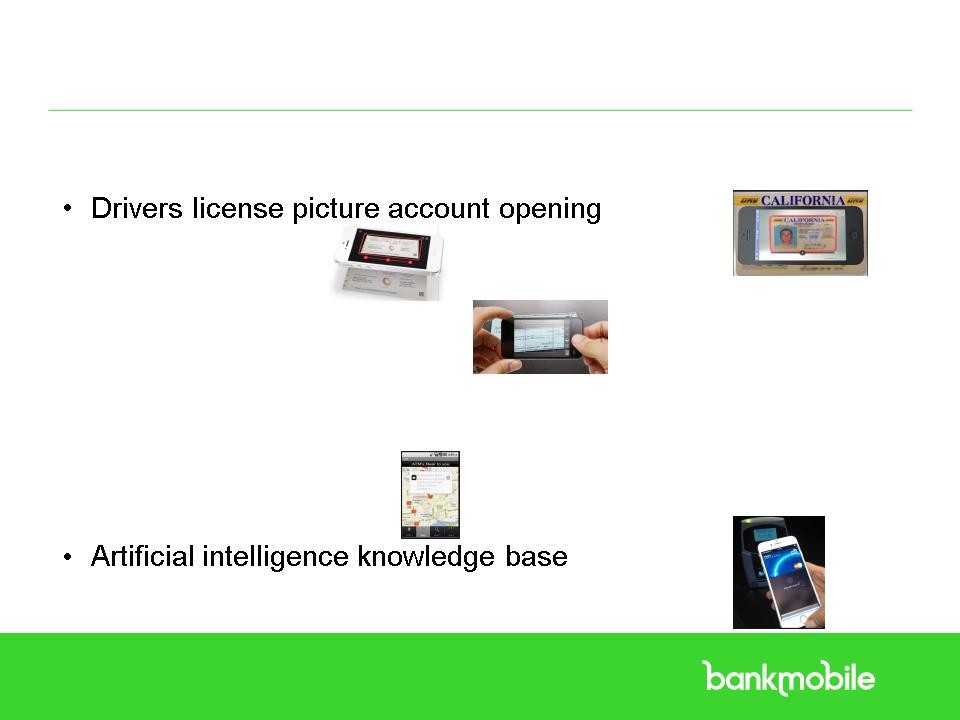
• Expenses
– PHOTO ACCOUNT OPENING
– SECURITY DATABASES
– PHOTO BILL PAY
– PHOTO CHECK DEPOSIT
– PLASTICS
– ATM NETWORK
– FRAUD LOSSES
– MARKETING
– APP DESIGN / MAINTENANCE
– SALARIES / OPS
– VENDOR COSTS
• $5 million allotted to BankMobile
• Profitability in 2-3 years
.
>>
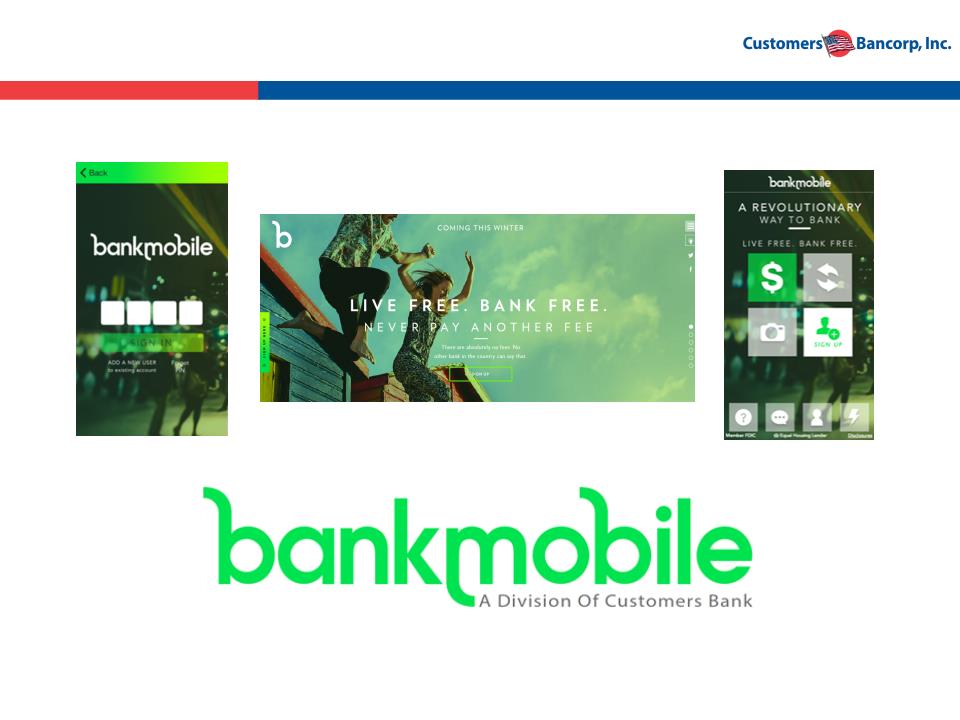
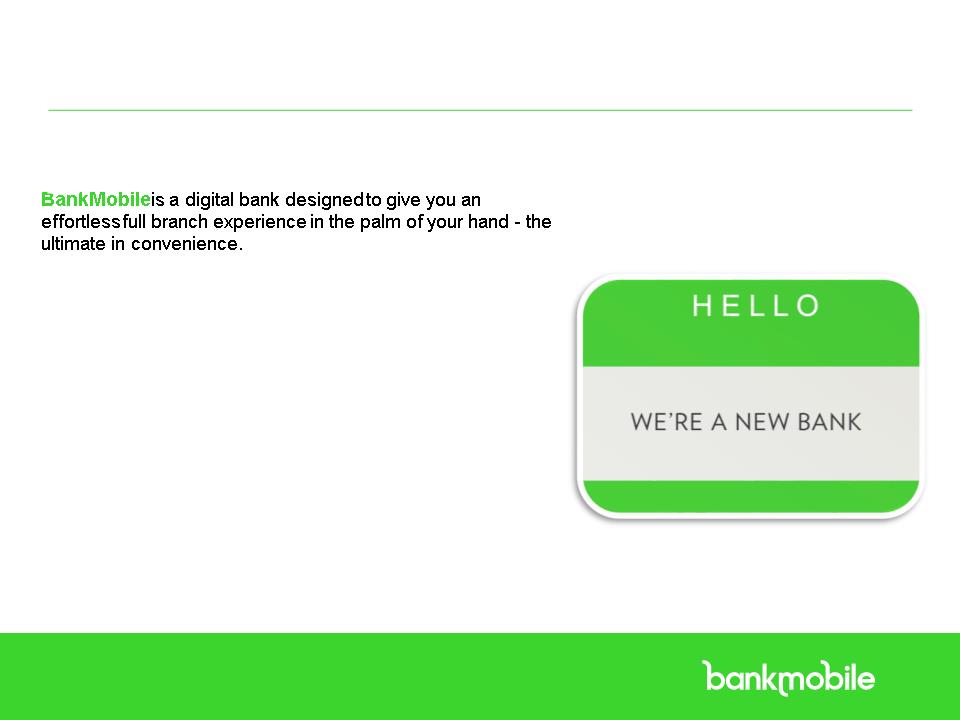
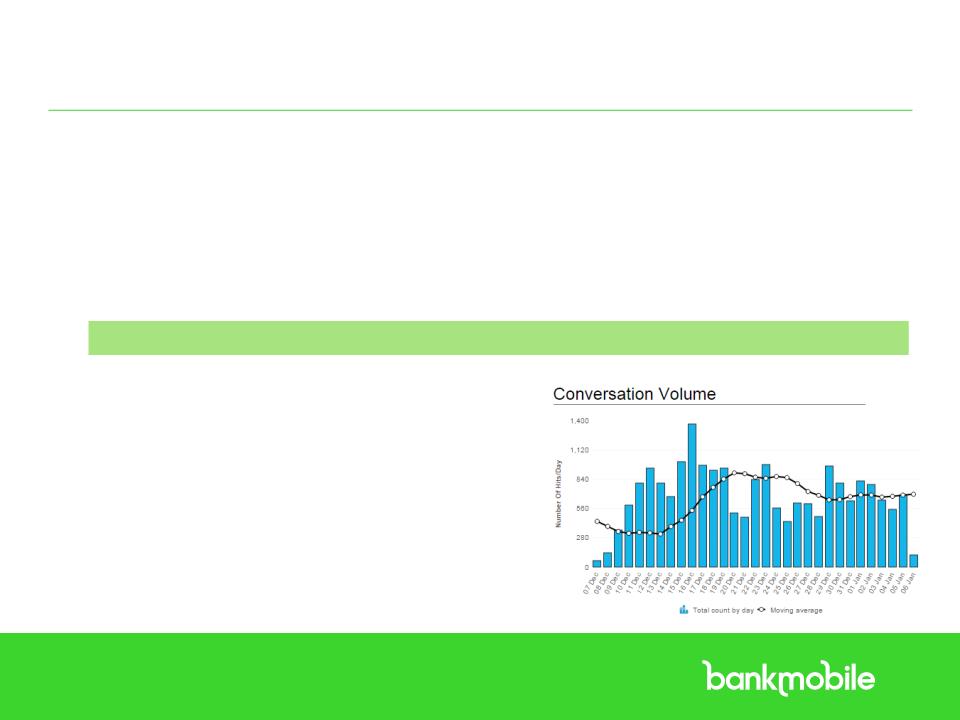
BANKMOBILE OVERVIEW
.
We are creating a banking revolution - on a path to becoming
a disruptive player.
a disruptive player.
Why BankMobile?
1.Leverage our Higher One relationship
2.Improve efficiency, growth and profitability
3.Create a customer base for our future
Bankmobile Pillars
• NO Fees; Guaranteed ¼% Higher Rates
• Effortless banking offering 55,000 free ATMs
combined with exceptional customer service
combined with exceptional customer service
• Financial literacy / empowerment / advisor
BankMobile
Warren Taylor

>> >> >>
A REVOLUTIONARY BANK
JANUARY 7, 2015
LUVLEEN SIDHU
CHIEF STRATEGY & MARKETING OFFICER
>>
THE TIME FOR DISRUPTION IS NOW
Mobile banking increased 40 percent in 2013, Bankrate
says — that’s 40,000 new customers a day.
says — that’s 40,000 new customers a day.
Handling a transaction at a branch can cost 50 times
the same transaction on a mobile phone, or 20 times its
cost on an online platform
the same transaction on a mobile phone, or 20 times its
cost on an online platform
This year, for the first time, U.S. customers interacted
with their banks more through mobile devices than any
other means…Mobile interactions are now 35% of the
total, more than any other type, including traditional
online channels, automated-teller machines and branch
visits
with their banks more through mobile devices than any
other means…Mobile interactions are now 35% of the
total, more than any other type, including traditional
online channels, automated-teller machines and branch
visits
>>
THE TIME FOR DISRUPTION IS NOW
>>
HOW ARE WE DIFFERENT
COMPETITIVE LANDSCAPE
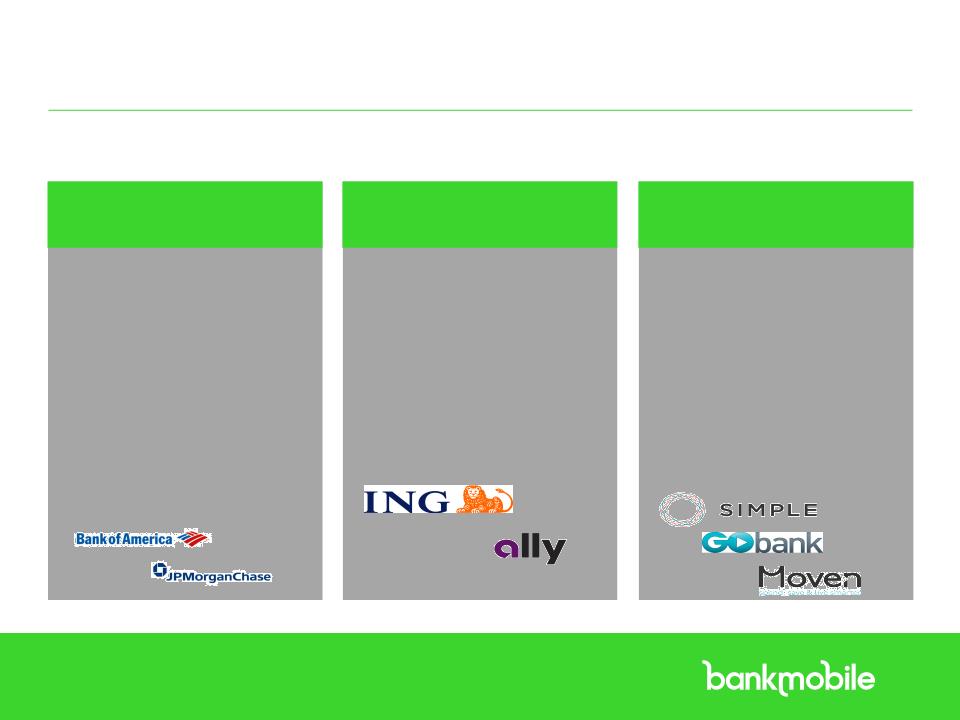
TRADITIONAL BANKS
INTERNET BANKS
NEO BANKS
• Defensive: Mobile apps are not
used to attract new customers;
Only to respond to demand for
mobile with a costly & large
branch network still there
used to attract new customers;
Only to respond to demand for
mobile with a costly & large
branch network still there
• Mobile banking is only an add on
service adding costs
service adding costs
• Low rates & High fees
• Product offering/pricing the same
whether you open an account in a
branch or on mobile device
whether you open an account in a
branch or on mobile device
• Attract age 55+, higher balance,
rate sensitive customer
rate sensitive customer
• Not focused on creating simplistic
mobile experience with innovative
banking features
mobile experience with innovative
banking features
• Do not provide a full suite of
banking products & services. Little
cross-sell capabilities
banking products & services. Little
cross-sell capabilities
• Revenue model built entirely
around interchange fee from debit
or prepaid cards
around interchange fee from debit
or prepaid cards
• Fees (although they say they
have none)
have none)
• Minimal focus on personalization

>>
WHO ARE WE?
A Revolutionary New Way to Bank
– NO FEES
– BRANCH IN THE PALM OF YOUR HAND - MOBILE 1ST STRATEGY
– CHECKING, SAVINGS, LINE OF CREDIT, JOINT ACCOUNTS
– HIGHER SAVINGS RATES THAN THE LARGEST 4 BANKS (AT
LEAST 0.25% APY HIGHER RATE GUARANTEED)
LEAST 0.25% APY HIGHER RATE GUARANTEED)
– 55,000 FEE FREE ATMS (3X MORE THAN BOFA)
– PERSONAL BANKER
– FINANCIAL EDUCATION
LIVE FREE. BANK FREE.
>>
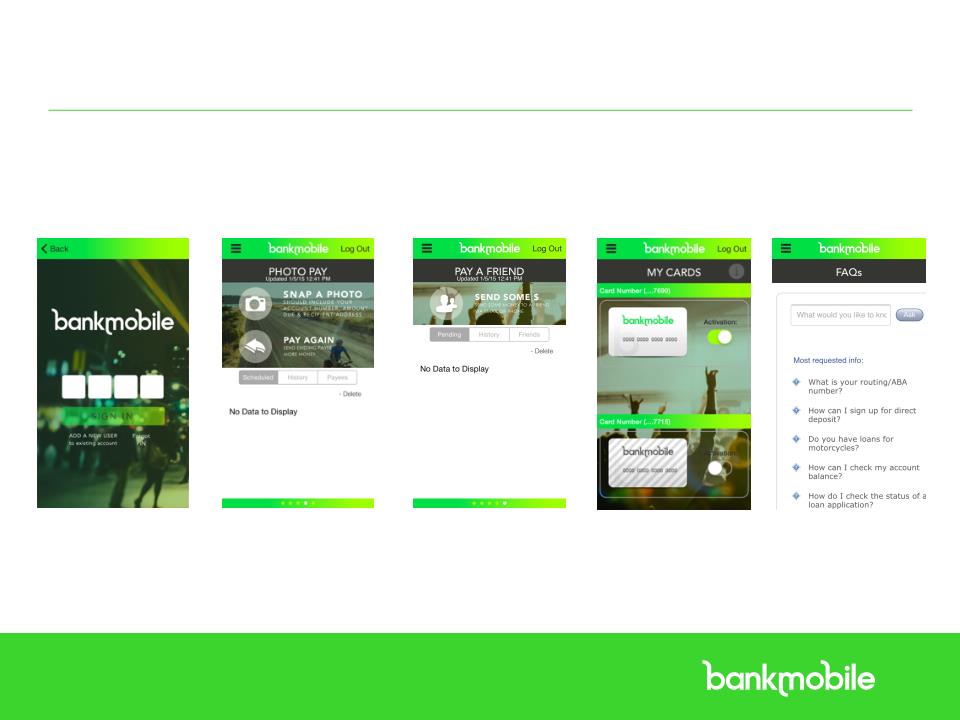
APP FEATURES AT LAUNCH
• Photo bill pay
• P2P payments
• Remote check deposit
• Debit card on/off
• Account balance quick access
• 4 digit password
• ATM Locator
• Part of Apple Pay
PHASE 1
>>
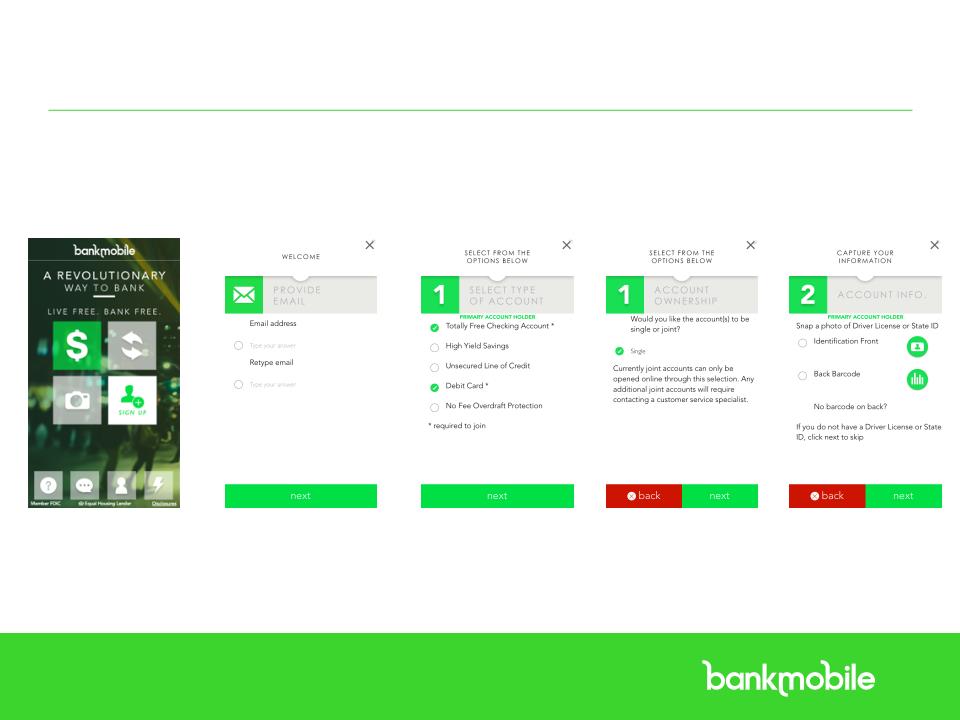
APP SCREENSHOTS
WELCOME SCREEN & ONBOARDING
>>
APP SCREENSHOTS
SOME FEATURES/FUNCTIONALITIES
>>
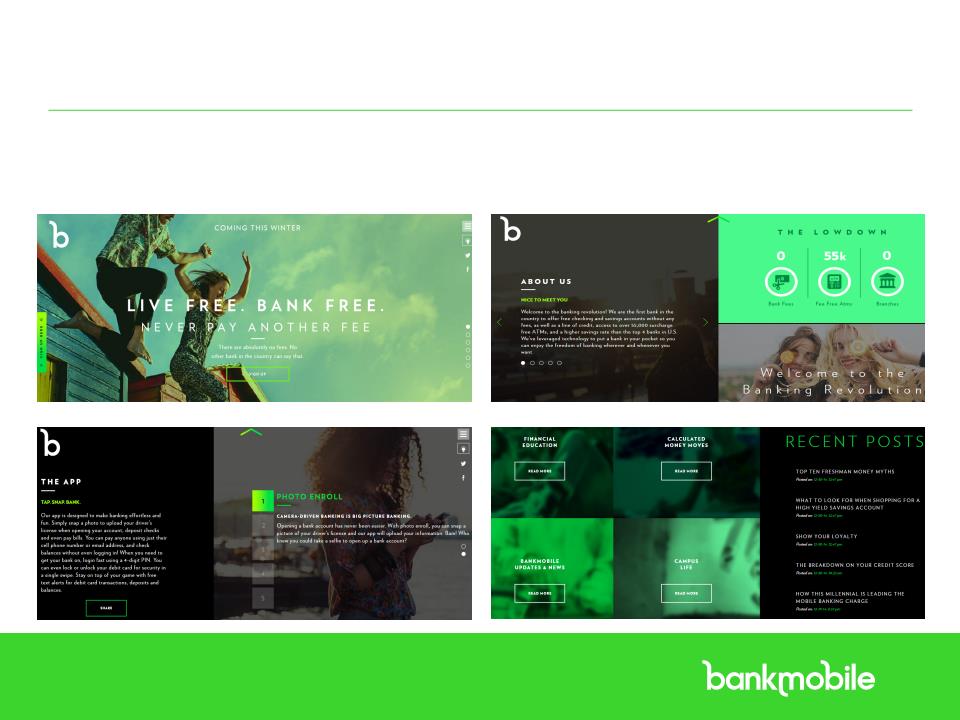
WEBSITE
YOUNG, FUN FEEL!
>>
WHAT IS PHASE 1?
– FOCUS GROUPS
– SOCIAL MEDIA
– EMAIL
– CONTESTS
• Gradually grow customer base at first
– ENSURE OPERATIONS, CALL CENTER, AND
TECHNOLOGY ARE WELL INTEGRATED AND
PREPARED FOR GROWTH
TECHNOLOGY ARE WELL INTEGRATED AND
PREPARED FOR GROWTH
BUILDING A STRONG FOUNDATION
>>
MILLENNIAL STRATEGY
HIGHER ONE
Who are they?
Why are they
attractive?
attractive?
How will we
do it?
do it?
§ Ages 18-35; Largest generation at around 84 million
§ Not just future customers, but influencers
§ Millennials rank the four largest banks among the 10 least loved brands in
America
America
§ Tech savvy, tech dependent, largest group of mobile users
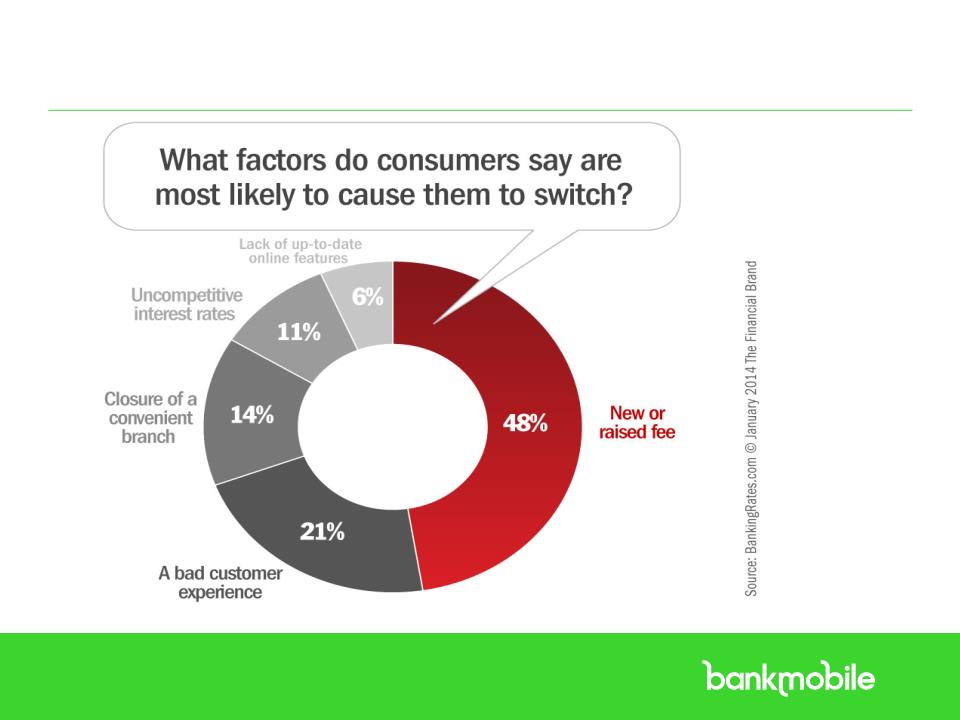
§ 33% say they are switching banks in the next 90 days
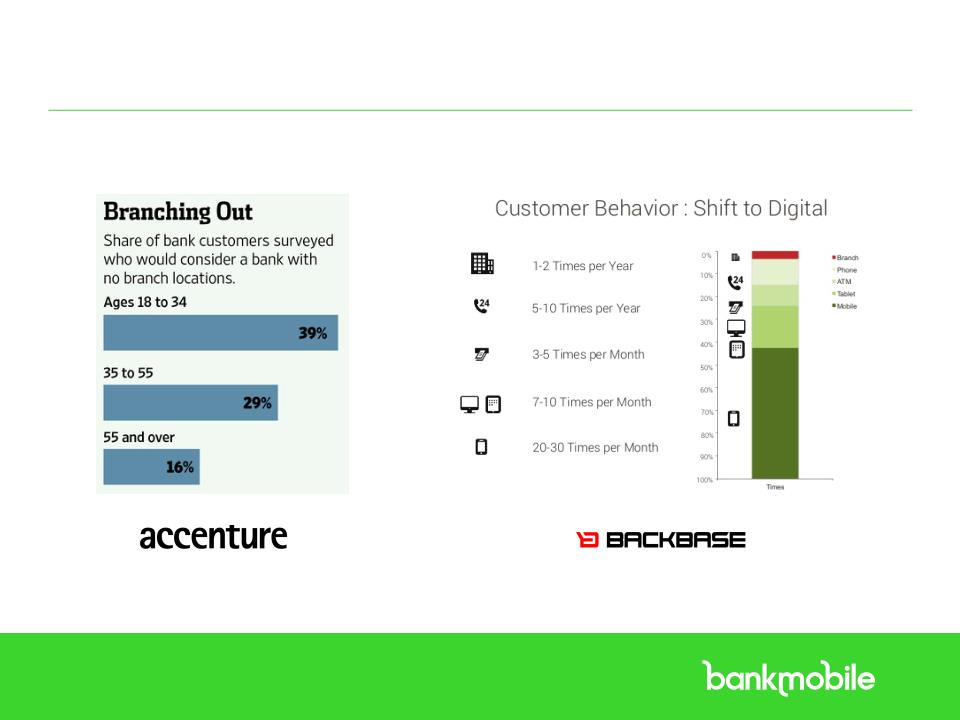
§ 40% of millennials would consider switching to a branchless bank
§ Receiving the largest transfer of wealth in history from baby boomer parents
§ 33% of millennials say main reason to switch banks is excessive fees
§ Partnership with Higher One; access to ~250K graduates each year
§ Create hype and engagement through multiple social media platforms
§ Utilize college students as brand ambassadors
§ Develop & distribute content on financial topics to build loyalty & trust
§ Digital ad campaign

>>
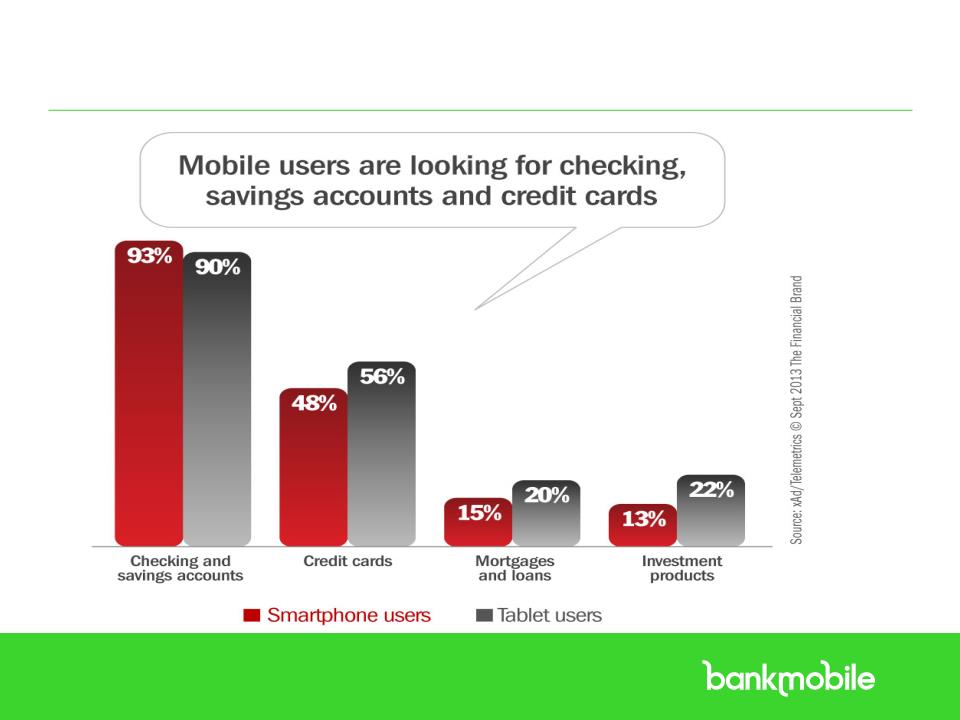
WHAT DO MILLENNIALS WANT FROM THEIR BANK?
VIDEO
>>
AFFINITY STRATEGY
Objective
Partnership
Structure
Structure
Examples
§ Create affinity relationships with not for profits as well as profit generating
organizations
organizations
§ Members, followers, or customers must feel passionate about the
organizations we partner with
organizations we partner with
§ Develop a win/win partnership - Enter into a marketing fee agreement
§ Customers receive a branded banking experience
§ We financially compensate the organization our customers are passionate
about
about
§ We receive loyal banking customers
§ Credit card companies targeting affinity groups in the 80’s
§ USAA & Veterans
§ Bancorp Bank & T Mobile
§ We plan to target alumni associations, foundations, charities, advocacy groups
religious groups etc
religious groups etc

>> >> >>
AFFINITY MARKETING
JONATHAN LEWIS
CHIEF DEVELOPMENT OFFICER

>>
AFFINITY MARKET
• Unions, Associations and Employees of
Businesses with over 1000 employees
Businesses with over 1000 employees
– 17.7 MILLION MEMBERS OF UNIONS
– 100 MILLION MEMBERS OF ASSOCIATIONS
– 54 MILLION EMPLOYEES OF BUSINESSES WITH
OVER 1000 EMPLOYEES
OVER 1000 EMPLOYEES
WHO ARE OUR CUSTOMERS?
HOW BIG IS THE MARKET?

>>
OUR PROGRESS
September of 2014 we set out to contact and build
relations with groups that met our Market Criteria:
relations with groups that met our Market Criteria:
• To date we have spoken with organizations having over 3
million members.
million members.
• We have agreements from 7 organizations with over 400,000
combined members, and are going to begin the on-boarding
process during the next 12 months.
combined members, and are going to begin the on-boarding
process during the next 12 months.
Hired an experienced team in August
We expect to add 2-4 more team members in 2015

>>
GOAL
To Have 1% of All members of our
Affinity groups use Bank Mobile as its
Primary Bank in the first 12 months.
Affinity groups use Bank Mobile as its
Primary Bank in the first 12 months.
• Active Targeted Marketing
• Attending Meetings
• Education of Members
• Participation in Sponsored Events
• Provide financial benefit for the members
SUPPORT OUR MEMBERS,
CREATE VALUE
>>
MARKETING STRATEGY
CUSTOMER ACQUISITION
|
Channel
|
Strategy Detail
|
|
Email Campaign
|
Target 1M+ Higher One students through emails. Conduct
“experiments” to determine most effective messaging/campaigns |
|
Affinity Marketing
|
Reaching out to affinity groups, market to members using emails,
direct mail and newsletters, attending conferences |
|
Social Media
|
FB, Twitter, Instagram, Pinterest, Youtube, Vimeo, Vine presence
|
|
Blog
|
Create unique content on various financial topics
|
|
Gorilla Marketing
|
Street Teams, Bankmobile RV, Green range checking, videos, etc
|
|
PR
|
Target key blogs & publications
|
|
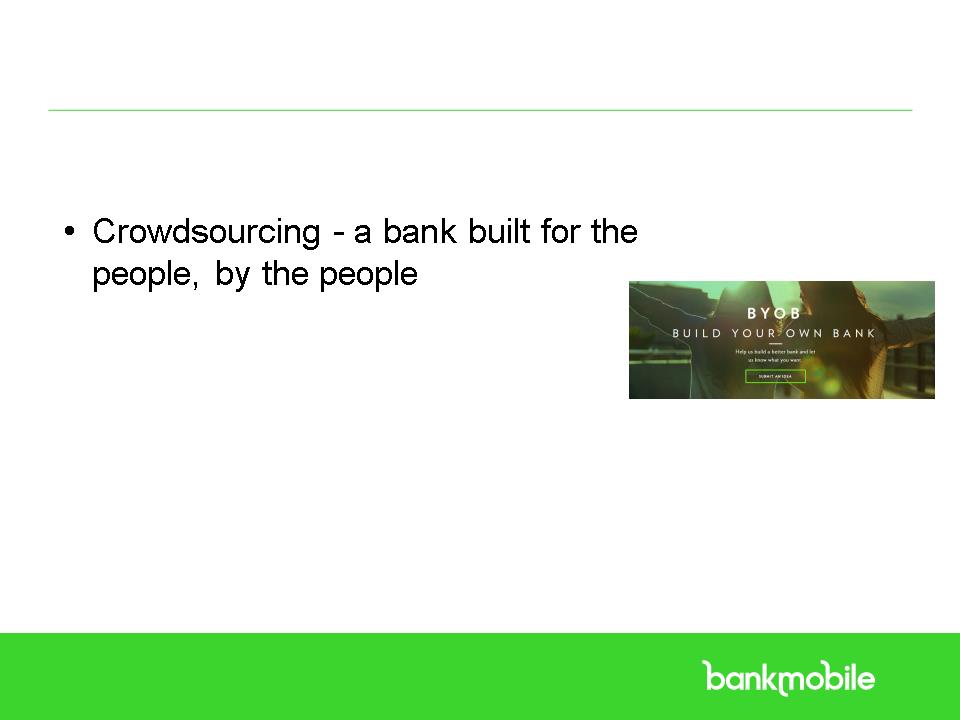
Crowdsourcing
|
Focus groups, social media engagement, email, contests
|
|
Digital Marketing
|
Entire website is optimized (SEO), paid search, social media
advertising, remarketing (cookies) |
>>
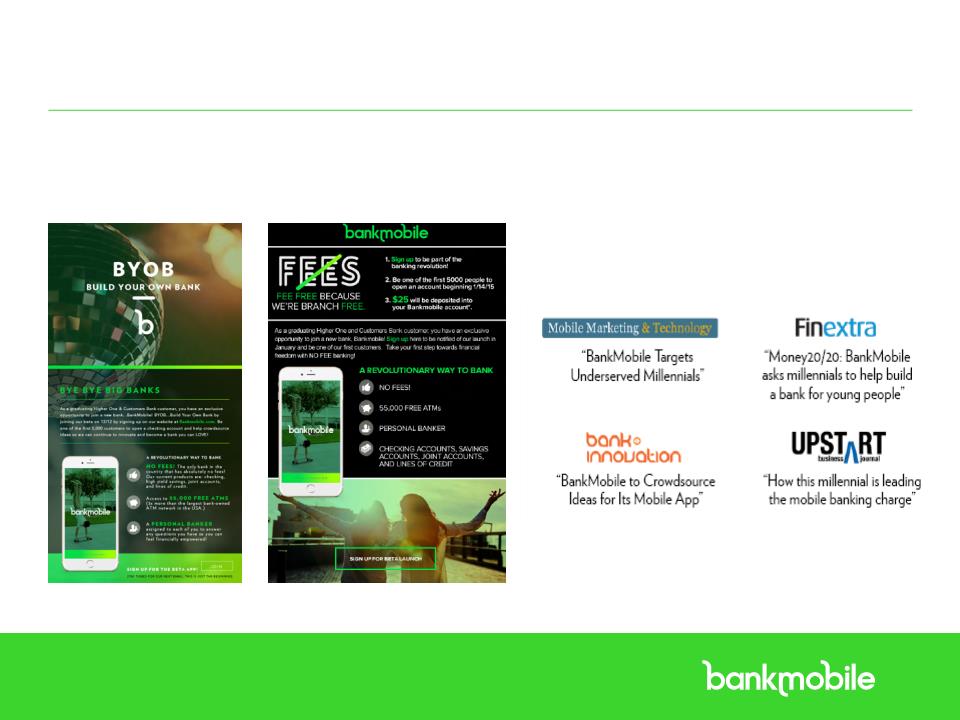
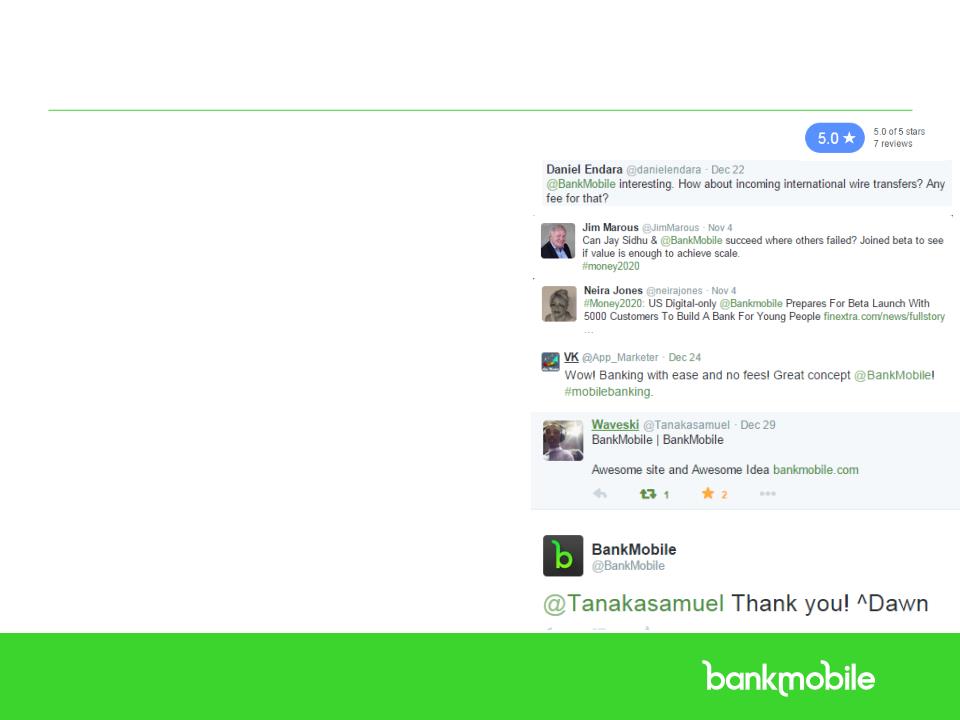
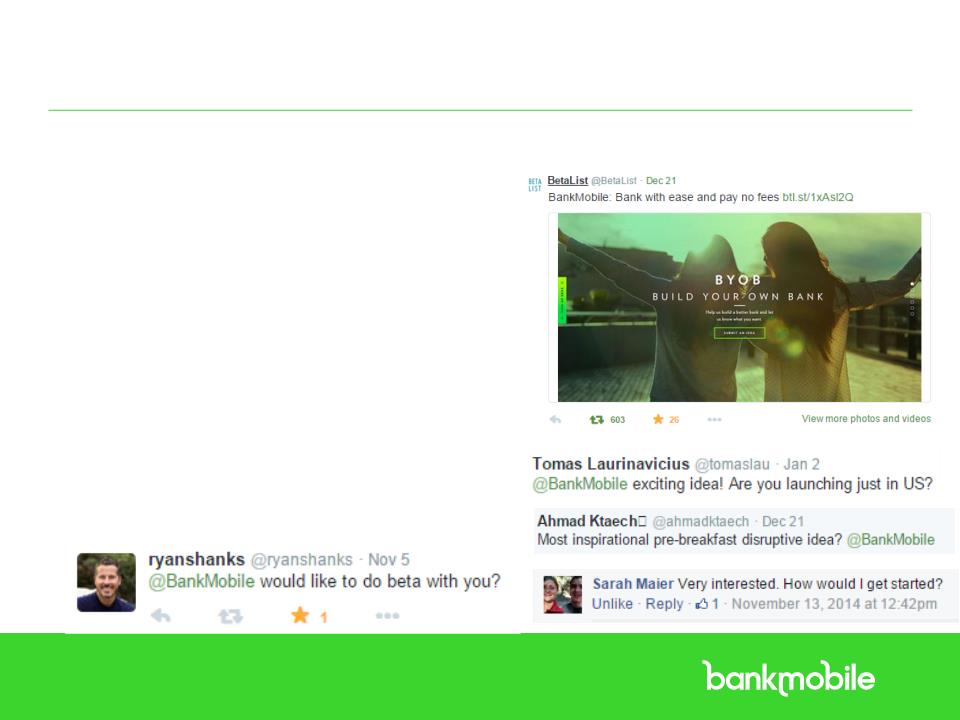
EXAMPLES OF MARKETING
EMAIL CAMPAIGNS AND PR
BankMobile in the News
>>
SOCIAL MEDIA @BANKMOBILE
MILLENNIALS & SOCIAL MEDIA
• 56% more likely to find brand content on social networks than on search engines or other
online news feeds
online news feeds
• 91% would consider a product if a friend recommended it to them
• 60% of Millennials are engaged in rating products and services
• Millennials are 2.5x more likely than Boomers to share a social-media link that references a brand
Millennials are fed up with traditional banks & use social media to find solutions
BankMobile’s Social Media Goals
•Build brand awareness & trust
•Increase consideration
•Drive traffic to website, app and blog
•Build following on social media & blog
•Increase brand loyalty and advocacy
•Amplify media coverage & word of mouth referrals

>>
BANKMOBILE’S BLOG
FINANCIAL EDUCATION, NEWS & UPDATES
Purpose: To educate and inform prospects and customers while increasing awareness, consideration,
loyalty and advocacy
loyalty and advocacy
Blog Pillars & Topics
•Research conducted to identify financial problems during target market’s life stages
•Topics showcase brand pillars and mission with transparency & authenticity
•Content developed to address needs of Millennial consumer in a relevant way
>>
SOCIAL MEDIA @BANKMOBILE
SOCIAL MEDIA STRATEGY
• Provide Superior Customer Service
• Answer questions quickly using our FAQ
database, video tutorials & blog
database, video tutorials & blog
• Listen & Engage to Build Community
• Find & engage those looking for a new bank
• Amplify engagement from press and users
• Create contests, campaigns & incentives
• Create and Publish Shareable Content
• Publish 2-3 blog posts per week
• Participate in Twitter chats to extend reach
• Post mix of helpful/informative posts
frequently
frequently
• Advertise Efficiently to Target Market
• Advertise to Higher One database on
Facebook & Twitter with custom audiences
Facebook & Twitter with custom audiences
• Pixel website visitors to remarket to online
• Advertise to target market to download app
>>
SOCIAL MEDIA @BANKMOBILE
PRE-LAUNCH EARNED MEDIA METRICS
Press Reach
•1.25 billion impressions from digital media
•2.54 billion potential impressions from digital
media
media
Website & Blog (Launched 12/18/14)
•10,012 pageviews on website
•534 visits to blog
Social Media (Launched on 10/28/14)
•200 Facebook fans, 12,844 impressions
•180 Twitter followers
•236 views of pins on Pinterest
•116 visits to website from social media
•Of those visits, 4% signed up for email
>>
PHASE 2 INNOVATIONS
SECOND HALF OF 2015 OR BEFORE
FEATURES
SERVICES
(NEXT 60-90 DAYS)
• Text Chat
• PFM (transaction categorization,
account aggregation, budgeting,
goals)
account aggregation, budgeting,
goals)
• Utilize data analytics for more
personalized banking experience
personalized banking experience
• Ability to search for and purchase
cars in your area. We provide a pre
approved auto loan
cars in your area. We provide a pre
approved auto loan
• Becoming a marketplace where
customers can purchase goods. We
provide financing and insurance
customers can purchase goods. We
provide financing and insurance
• Biometric authentication
• Auto loans
• Credit cards
• Mortgages
• CDs
• Customers who enroll in direct
deposit will become VIP customers
deposit will become VIP customers
• VIP customers will have free access
to a financial advisor
to a financial advisor
• VIP customers will also have access
to fee free ATMs nationwide
to fee free ATMs nationwide
PRODUCTS

>>
SECURITY RISK MITIGANTS
• Retained security experts to provide advice and
implement multi layer security
implement multi layer security
• Experience in security due to HO relationship (1M+
students using HO mobile banking with no security
breaches)
students using HO mobile banking with no security
breaches)
• Educating the customer
WE TAKE SECURITY VERY SERIOUSLY

>>
5 YEAR GOALS
Over a 1 year period, acquire ~25,000 customers
Over a 5 year period, acquire ~250,000
customers
customers
Make 20% plus ROE

>>
ANY QUESTIONS?