Attached files
| file | filename |
|---|---|
| 8-K - 8-K - WESCO INTERNATIONAL INC | outlook8-k.htm |
| EX-99.1 - EXHIBIT 99.1 - WESCO INTERNATIONAL INC | wescoexhibit991.htm |

2014 Financial Update and 2015 Outlook December 17, 2014

2 2015 Outlook Call 12/17/2014 Safe Harbor Statement Note: All statements made herein that are not historical facts should be considered as “forward- looking statements” within the meaning of the Private Securities Litigation Act of 1995. Such statements involve known and unknown risks, uncertainties and other factors that may cause actual results to differ materially. Such risks, uncertainties and other factors include, but are not limited to: adverse economic conditions; increase in competition; debt levels, terms, financial market conditions or interest rate fluctuations; risks related to acquisitions, including the integration of acquired businesses; disruptions in operations or information technology systems; expansion of business activities; litigation, contingencies or claims; product, commodity, labor or other cost fluctuations; exchange rate fluctuations; the timing, and amount of common stock repurchases, if any; and other factors described in detail in the Form 10-K for WESCO International, Inc. for the year ended December 31, 2013 and any subsequent filings with the Securities & Exchange Commission. Any numerical or other representations in this presentation do not represent guidance by management and should not be construed as such. The following presentation includes a discussion of certain non-GAAP financial measures. Information required by Regulation G with respect to such non-GAAP financial measures can be obtained via WESCO’s website, www.wesco.com.

3 2015 Outlook Call 12/17/2014

4 2015 Outlook Call 12/17/2014 2014 Outlook • FY 2014 sales growth of approximately 5% Consolidated and organic sales growth workday adjusted of 5% in October and 8% in November Organic U.S. sales growth of 8% in October and 12% in November Organic Canada sales were flat in October and grew 2% in November • FY 2014 EPS of $5.25 to $5.35 Likely at lower end of the range Continued gross margin pressure partially mitigated by strong cost control • Free cash flow equal to at least 80% of net income …solid operating performance

5 2015 Outlook Call 12/17/2014 Maintain industry-leading cost structure Expand operating profit and margins Generate strong operating cash flow through the cycle Provide superior investor returns Long-Term Financial Objectives …focused on shareholder value creation Grow sales faster than the market and strengthen business through acquisitions 4 15 4 16.1 19.2 19.0 Graybar Rexel NAED 369 445 453 5.7 5.9 5.8 265 308 252 118 117 94 All periods are 2012, 2013 and TTM September 2014 unless otherwise noted. 2012 and 2013 exclude the impact of externally disclosed non-recurring items. See Appendix for non-GAAP reconciliations. 190 77 76 181 139 117 WCC S&P 500 Russell 2000 GWW FAST AXE TSR (1/1/2010 to 9/30/2014) 13.7% WCC CORE GROWTH ACQ GROWTH SG&A% 2013 SG&A% COMP. (%) (%) EBIT ($M) EBIT% FCF ($M) FCF% OF NI 1 2 3 4 5 Flat 3 14.0 13.7 13.7 3

6 2015 Outlook Call 12/17/2014 2009 2010 2011 2012 2013 2014 TTM Long-Term Focus on Profitable Growth EBIT 2.5x TOTAL SALES 1.7x HEADCOUNT 1.5x …operating profit pull through delivering results

7 2015 Outlook Call 12/17/2014 Strong Performance Operating ProfitSales Free Cash Flow to Net IncomeEPS ($ Billions) $ 23% CAGR 98% of Net Income 21% CAGR …throughout this protracted economic recovery period 12% CAGR ($ Millions) 5.1 6.1 6.6 7.5 7.8 2010 2011 2012 2013 TTM Q3 2014 2.50 3.96 4.38 5.02 5.04 2010 2011 2012 2013 TTM Q3 2014 97% 68% 118% 117% 94% 2010 2011 2012 2013 TTM Q3 2014 211 333 369 445 453 2010 2011 2012 2013 TTM Q3 2014 ($) See Appendix for non-GAAP reconciliations.

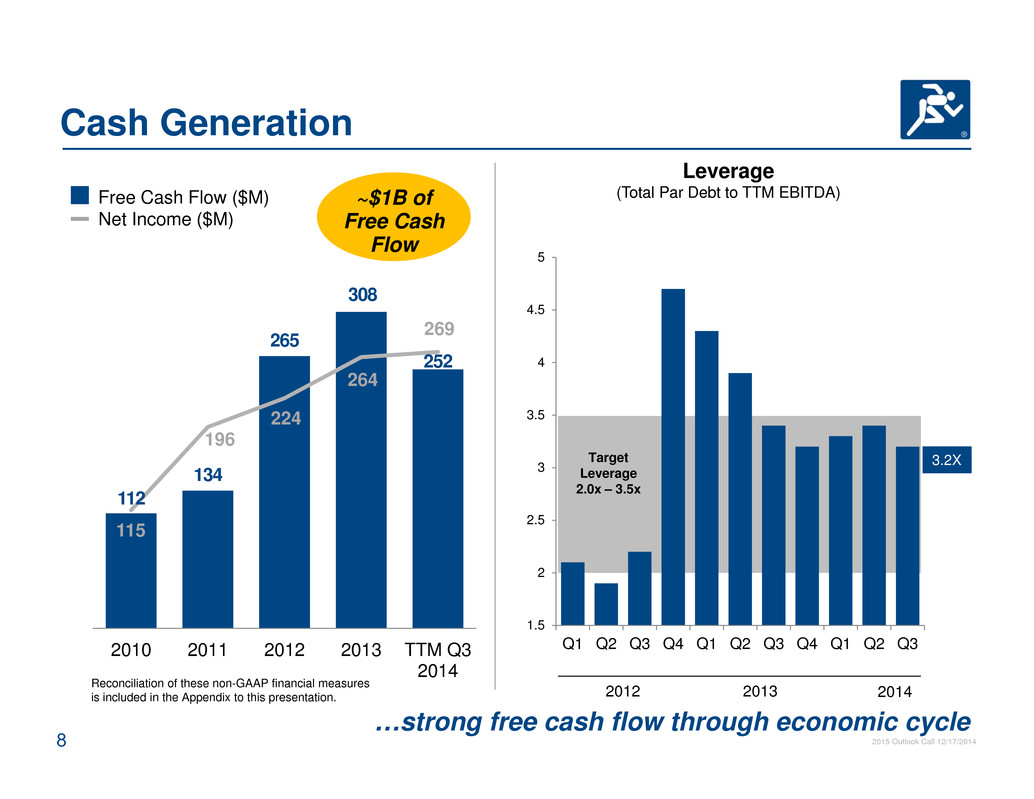
8 2015 Outlook Call 12/17/2014 1.5 2 2.5 3 3.5 4 4.5 5 Q1 Q2 Q3 Q4 Q1 Q2 Q3 Q4 Q1 Q2 Q3 Cash Generation 2012 2013 2014 Target Leverage 2.0x – 3.5x 3.2X Leverage (Total Par Debt to TTM EBITDA) Reconciliation of these non-GAAP financial measures is included in the Appendix to this presentation. …strong free cash flow through economic cycle 112 134 265 308 252 115 196 224 264 269 2010 2011 2012 2013 TTM Q3 2014 Free Cash Flow ($M) Net Income ($M) ~$1B of Free Cash Flow

9 2015 Outlook Call 12/17/2014 Free Cash Flow Management …maintain fiscal discipline while funding growth Fourth Use Share repurchase program of up to $300 million through December 31, 2017 First Use Support organic growth at greater than market rates Third Use Reduce financial leverage Second Use Fund accretive acquisitions to supplement organic + +

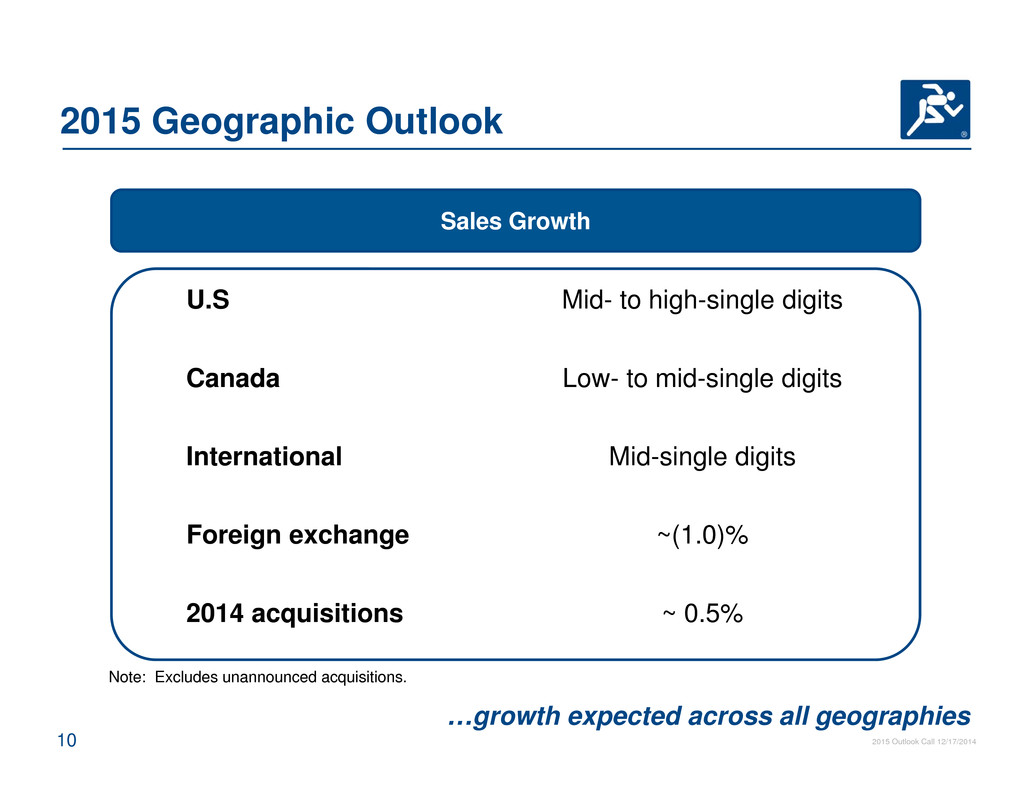
10 2015 Outlook Call 12/17/2014 2015 Geographic Outlook U.S Canada International Foreign exchange 2014 acquisitions Mid- to high-single digits Low- to mid-single digits Mid-single digits ~(1.0)% ~ 0.5% Sales Growth Note: Excludes unannounced acquisitions. …growth expected across all geographies

11 2015 Outlook Call 12/17/2014 30-35% 25-30% 5-10% ~10% Oil and Gas Sales 10-15% 55-60% 55-60% WESCO Sales Oil and Gas Direct Exposure …across MRO, OEM, and Capex spending streams U.S. International CanadaDownstream Midstream Upstream

12 2015 Outlook Call 12/17/2014 Industrial End Market Improving Flat Declining (2.6%) 2.1% 7.0% 5.0% Core Sales Growth versus Prior Year42% Key Market Indicators U.S. industrial production ISM Purchasing Managers’ Index Capacity utilization Canadian industrial production Q2 2014Q1 2014 Q3 2014 • Global Accounts • Integrated Supply • OEM • General Industrial …mid-single digit growth expected in 2015 FY 2013 WESCO Industrial Sales 42%42% YTD Q3 2014 4.7%

13 2015 Outlook Call 12/17/2014 Construction End Market Improving Flat Declining Core Sales Growth versus Prior Year42% Key Market Indicators Architectural Billings Index NEMA electroindustry business confidence index Construction starts and put in place Canadian non-residential construction • Non-Residential • Residential (5.9%) Q2 2014 Q3 2014 Q1 2014 2.3% 3.8% … low- to mid-single digit growth expected in 2015 WESCO Construction Sales FY 2013 (2.5%)31% YTD Q3 2014 0.3%

14 2015 Outlook Call 12/17/2014 13.4% 1.5% 6.1% 10.6% FY 2013 Q1 2014 Q2 2014 Q3 2014 Utility End Market Improving Flat Declining Core Sales Growth versus Prior Year 42% Key Market Indicators Distribution grid maintenance and upgrades Non-residential and residential construction starts Generation MRO, upgrades, expansions Transmission line infrastructure build-out • Investor Owned • Public Power • Utility Contractors … mid- to high-single digit growth expected in 2015 WESCO Utility Sales 14% YTD Q3 2014 6.1%

15 2015 Outlook Call 12/17/2014 (1.0%) 3.3% 5.2% 2.3% CIG End Market Improving Flat Declining Core Sales Growth versus Prior Year42% Key Market Indicators Government spending Communications and security upgrades Education, healthcare, and financial • Commercial • Institutional • Government Q1 2014 Q2 2014 Q3 2014 … low- to mid-single digit growth expected in 2015 WESCO CIG Sales FY 2013 13% YTD Q3 2014 3.6%

16 2015 Outlook Call 12/17/2014 2015 Financial Outlook …continuing organic growth through One WESCO Sales 5.1 6.1 6.6 7.5 7.8 8.0 2010 2011 2012 2013 2014E 2015E EPS 2.50 3.96 4.38 5.02 5.25 5.50 2010 2011 2012 2013 2014E 2015E ($B) 8.4 5.35 5.90 Total sales growth 3% to 6% Free Cash Flow Full year free cash flow equal to at least 80% of net income ($) 7.9 Effective tax rate ~29% Operating margin 6.1% to 6.3% See Appendix for reconciliation of non-GAAP adjusted results.

17 2015 Outlook Call 12/17/2014 2015 Priorities • Continue to build out the new One WESCO organization • Increase market share through One WESCO organic sales growth initiatives plus accretive acquisitions • Expand operating margins through pricing and sourcing initiatives, supplier and product rationalization, and inventory and transportation programs • Utilize Lean to increase productivity and improve customer service and fulfillment • Maintain strong capital structure and free cash flow generation

18 2015 Outlook Call 12/17/2014 Appendix

19 2015 Outlook Call 12/17/2014 WESCO International, Inc. Definitions Appendix • Financial leverage ratio is calculated by dividing total debt, including debt discount, by adjusted EBITDA. Adjusted EBITDA is defined as the trailing twelve months earnings before interest, taxes, depreciation, and amortization excluding the ArcelorMittal litigation recovery. • Free cash flow is calculated by deducting capital expenditures from, and adding non-recurring pension contribution to, cash flow provided by operations. • Total Shareholder Return (TSR) is the total return of a stock to an investor during a period of time, including capital gains and dividends, assuming reinvestment of dividends.

20 2015 Outlook Call 12/17/2014 NON-GAAP Financial Measures This presentation includes certain non-GAAP financial measures. These financial measures include adjusted EBIT, adjusted net income, adjusted diluted EPS, financial leverage ratio, free cash flow, and liquidity. The Company believes that these non- GAAP measures are useful to investors in order to provide a better understanding of the Company's capital structure position and liquidity on a comparable basis. Additionally, certain non-GAAP measures either focus on or exclude transactions of an unusual nature, allowing investors to more easily compare the Company's financial performance from period to period. Management does not use these non-GAAP financial measures for any purpose other than the reasons stated above.

21 2015 Outlook Call 12/17/2014 Non-GAAP Reconciliations FY 2012 FY 2013 TTM 2014 (Dollars in millions except for Diluted EPS) Adjusted Income from operations (Adjusted EBIT): Income from operations (EBIT) 333 481 453 ArcelorMittal litigation charge (recovery) included in SG&A 36 (36) - Adjusted income from operations (Adjusted EBIT) 369 445 453 Percent of adjusted sales 5.7% 5.9% 5.8% Adjusted net income attributable to WESCO International, Inc.: Net income attributable to WESCO International, Inc. 202 276 260 ArcelorMittal litigation charge (recovery), net of tax 22 (22) - Loss on sale of Argentina business - 2 - Loss on debt extinguishment - 13 13 Tax effect of certain non-recurring items - (5) (4) Adjusted net income attributable to WESCO International, Inc. 224 264 269 Adjusted Diluted EPS: Diluted share count 51.1 52.7 53.4 Adjusted Diluted EPS 4.38 5.02 5.04 Free Cash Flow: Cash provided by operations 288 315 275 Less: capital expenditures (23) (28) (23) Add: non-recurring pension contribution - 21 - Free cash flow 265 308 252 Free cash flow as a % of adjusted net income 118% 117% 94%

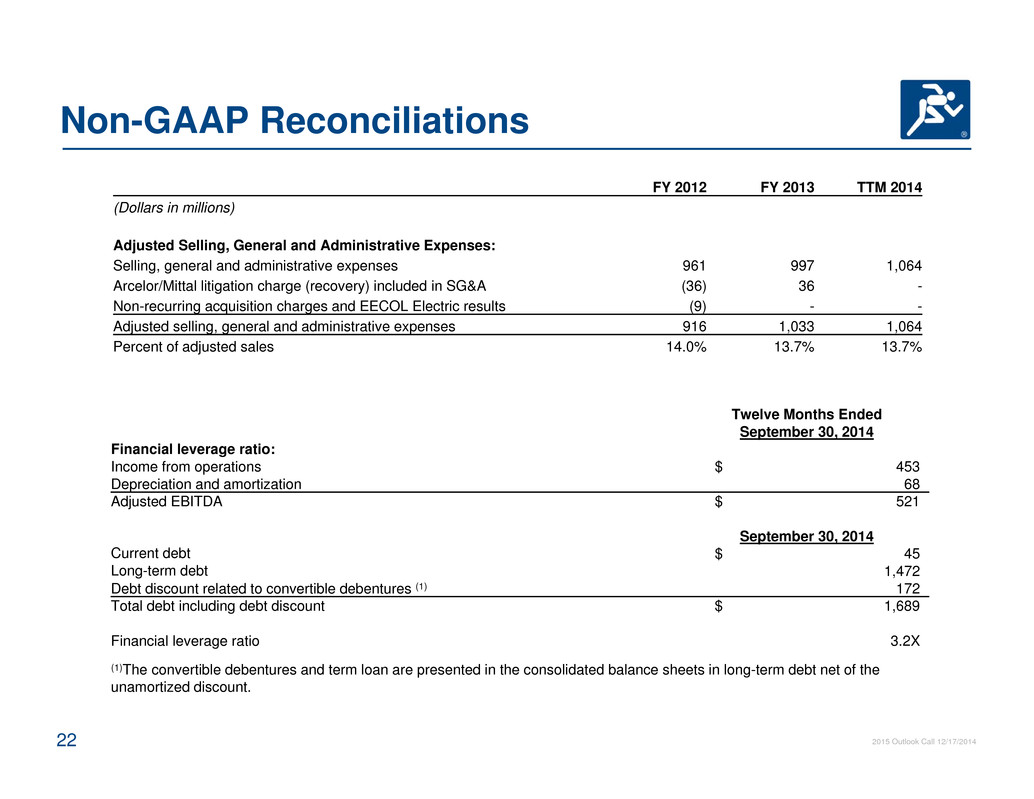
22 2015 Outlook Call 12/17/2014 Non-GAAP Reconciliations Twelve Months Ended September 30, 2014 Financial leverage ratio: Income from operations $ 453 Depreciation and amortization 68 Adjusted EBITDA $ 521 September 30, 2014 Current debt $ 45 Long-term debt 1,472 Debt discount related to convertible debentures (1) 172 Total debt including debt discount $ 1,689 Financial leverage ratio 3.2X (1)The convertible debentures and term loan are presented in the consolidated balance sheets in long-term debt net of the unamortized discount. FY 2012 FY 2013 TTM 2014 (Dollars in millions) Adjusted Selling, General and Administrative Expenses: Selling, general and administrative expenses 961 997 1,064 Arcelor/Mittal litigation charge (recovery) included in SG&A (36) 36 - Non-recurring acquisition charges and EECOL Electric results (9) - - Adjusted selling, general and administrative expenses 916 1,033 1,064 Percent of adjusted sales 14.0% 13.7% 13.7%
