Attached files
| file | filename |
|---|---|
| 8-K - 8-K - REGAL BELOIT CORP | rbc8-k12x15x2014.htm |
| EX-2.1 - EXHIBIT - REGAL BELOIT CORP | exhibit21emerson.htm |
| EX-99.1 - EXHIBIT - REGAL BELOIT CORP | rbcpressreleaseemerson.htm |
December 15, 2014 Acquisition of Power Transmission Solutions Business of Emerson Electric Co. Posted Dec 15, 2014 8:00AM CST
Safe Harbor Statement This presentation contains “forward-looking statements” as defined in the Private Securities Litigation Reform Act of 1995. The following is a cautionary statement made under the Private Securities Litigation Reform Act of 1995: With the exception of historical facts, the statements contained in this press release may be forward looking statements. Forward-looking statements represent our management’s judgment regarding future events. In many cases, you can identify forward-looking statements by terminology such as “may,” “will,” “plan,” “expect,” “anticipate,” “estimate,” “believe,” or “continue” or the negative of these terms or other similar words. Actual results and events could differ materially and adversely from those contained in the forward-looking statements due to a number of factors, including: uncertainties regarding our ability to execute our restructuring plans within expected costs and timing; increases in our overall debt levels as a result of the PTS acquisition or otherwise and our ability to repay principal and interest on our outstanding debt; actions taken by our competitors and our ability to effectively compete in the increasingly competitive global electric motor, power generation and mechanical motion control industries; our ability to develop new products based on technological innovation and the marketplace acceptance of new and existing products; fluctuations in commodity prices and raw material costs; our dependence on significant customers; issues and costs arising from the integration of acquired companies and businesses such as the PTS acquisition, including the ability to realize anticipated synergies and the timing and impact of purchase accounting adjustments; unanticipated costs or expenses we may incur related to product warranty issues; our dependence on key suppliers and the potential effects of supply disruptions; infringement of our intellectual property by third parties, challenges to our intellectual property, and claims of infringement by us of third party technologies; product liability and other litigation, or the failure of our products to perform as anticipated, particularly in high volume applications; economic changes in global markets where we do business, such as reduced demand for the products we sell, currency exchange rates, inflation rates, interest rates, recession, foreign government policies and other external factors that we cannot control; unanticipated liabilities of acquired businesses; cyclical downturns affecting the global market for capital goods; difficulties associated with managing foreign operations; and other risks and uncertainties including but not limited to those described in Item 1A-Risk Factors of the Company’s Annual Report on Form 10-K filed on February 26, 2014 and from time to time in our reports filed with U.S. Securities and Exchange Commission. All subsequent written and oral forward-looking statements attributable to us or to persons acting on our behalf are expressly qualified in their entirety by the applicable cautionary statements. The forward-looking statements included in this presentation are made only as of their respective dates, and we undertake no obligation to update these statements to reflect subsequent events or circumstances. p 2
Non-GAAP Financial Measures p 3 We prepare financial statements in accordance with accounting principles generally accepted in the United States (GAAP). In this presentation, we adjusted diluted earnings per share (EPS), adjusted EBITDA, and free cash flow and free cash flow (collectively, “non-GAAP financial measures”). We use these measures and others in our internal performance reporting and for reports to the Board of Directors. We also periodically disclose certain of these measures in our quarterly earnings releases, on investor conference calls, and in investor presentations and similar events. We believe that these non-GAAP financial measures are useful measures for providing investors with additional insight into our operating performance. This additional information is not meant to be considered in isolation or as a substitute for our results of operations prepared and presented in accordance with GAAP.
Agenda p 4 Transaction Overview Power Transmission Solutions (PTS) Overview Financial Summary Closing Comments Q&A
Transaction Overview p 5 > Acquiring Emerson’s Power Transmission Solutions (PTS) Business > A Premier PT Business with ~$600 Million in Revenue > $1.4 Billion of Cash and $40 Million of Assumed Liabilities > Accretive to EPS and Margins in 2015 and Beyond > Expect $30 Million Of Annual Synergies Within 4 Years > Transaction Expected to Close in the First Quarter 2015 > Integrating PTS with Regal’s Power Transmission Segment Third Transformational Acquisition in a Decade
Strategic Rationale p 6 Meets Strategic Acquisition Objectives Strengthens PT Segment Diversifies Regal > Technology > Expands Global Presence > Margin Improvement > Complete Line of Power Transmission Products > Adds Powerful Industry Leading Brands > Broadens Both Sales and Manufacturing Footprint > Diversifies our End Market Exposure > Over Two-Thirds of PTS Revenue Sold Through Distribution > Balances Regal’s Portfolio Adds Talent > Strong, Experienced Management Team > Proven Operators Driving “Perfect Execution” – Lean Culture > Deep Product and Application Knowledge > Track Record of Executing on Simplification and Acquisitions
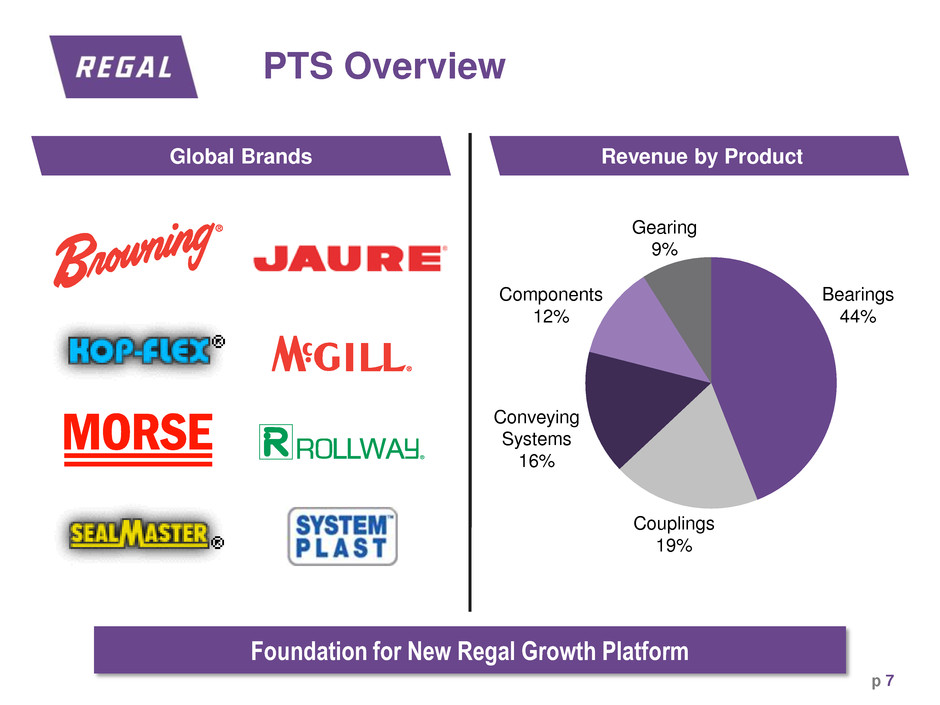
PTS Overview p 7 Couplings 19% Conveying Systems 16% Bearings 44% Components 12% Gearing 9% ® Revenue by Product Global Brands Foundation for New Regal Growth Platform
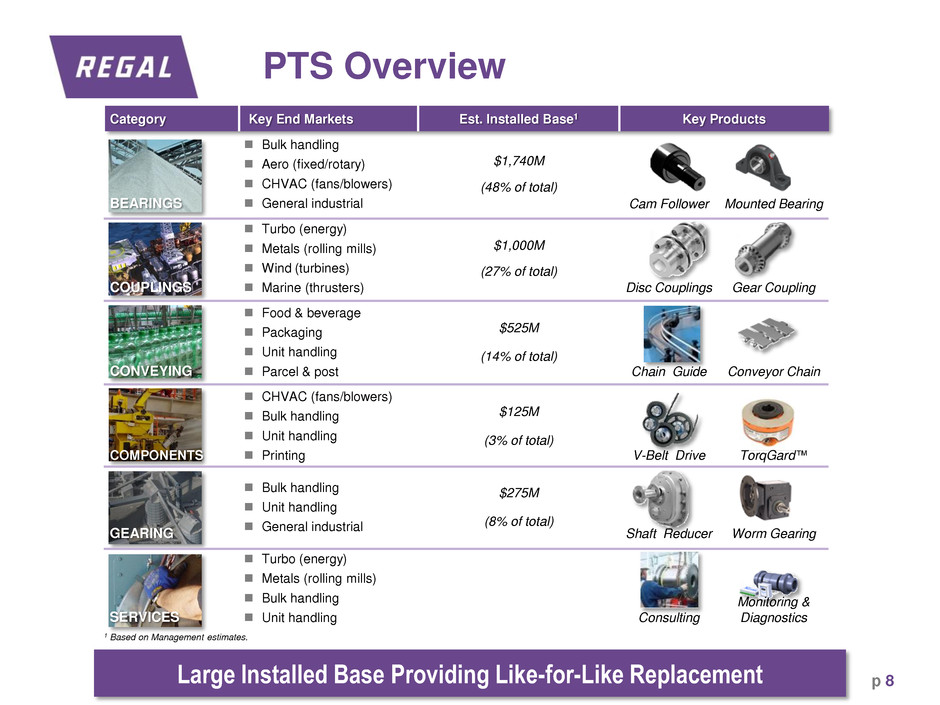
PTS Overview p 8 1 Based on Management estimates. Large Installed Base Providing Like-for-Like Replacement Category Key End Markets Est. Installed Base1 Key Products BEARINGS Bulk handling Aero (fixed/rotary) CHVAC (fans/blowers) General industrial $1,740M (48% of total) Cam Follower Mounted Bearing COUPLINGS Turbo (energy) Metals (rolling mills) Wind (turbines) Marine (thrusters) $1,000M (27% of total) Disc Couplings Gear Coupling CONVEYING Food & beverage Packaging Unit handling Parcel & post $525M (14% of total) Chain Guide Conveyor Chain COMPONENTS CHVAC (fans/blowers) Bulk handling Unit handling Printing $125M (3% of total) V-Belt Drive TorqGard™ GEARING Bulk handling Unit handling General industrial $275M (8% of total) Shaft Reducer Worm Gearing SERVICES Turbo (energy) Metals (rolling mills) Bulk handling Unit handling Consulting Monitoring & Diagnostics
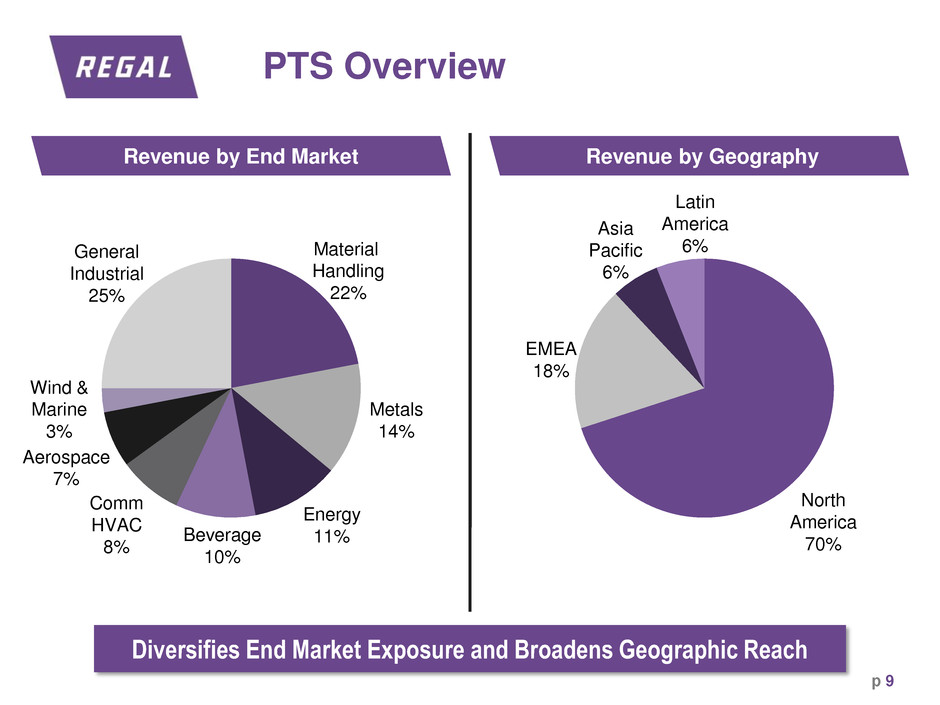
PTS Overview p 9 EMEA 18% North America 70% Asia Pacific 6% Latin America 6% Material Handling 22% Metals 14% Energy 11% Beverage 10% Comm HVAC 8% Aerospace 7% Wind & Marine 3% General Industrial 25% Diversifies End Market Exposure and Broadens Geographic Reach Revenue by Geography Revenue by End Market
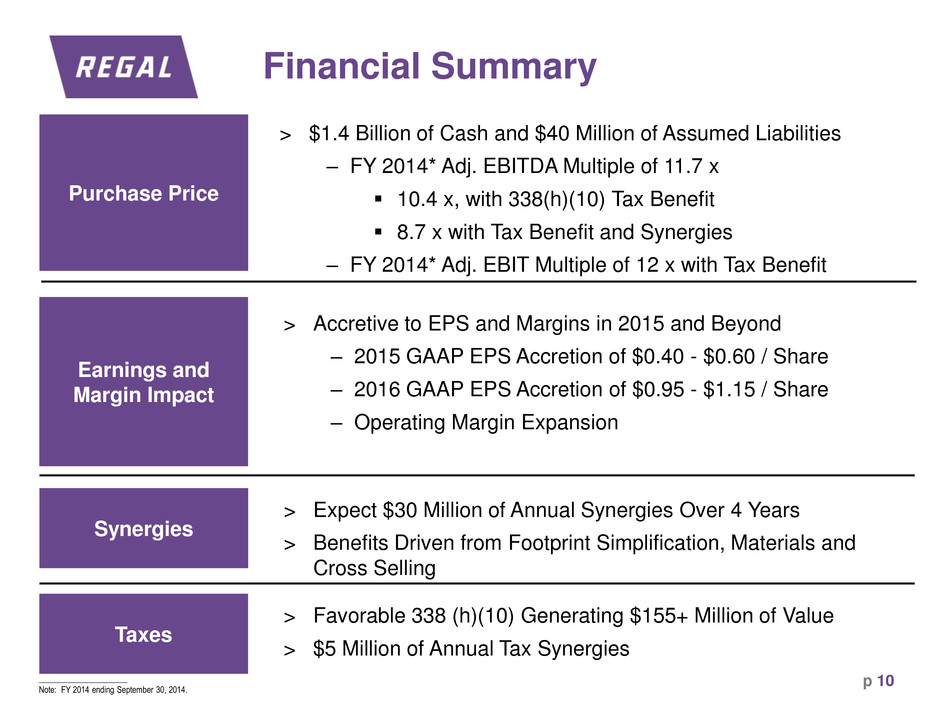
Financial Summary p 10 Purchase Price Taxes Synergies Earnings and Margin Impact > $1.4 Billion of Cash and $40 Million of Assumed Liabilities – FY 2014* Adj. EBITDA Multiple of 11.7 x 10.4 x, with 338(h)(10) Tax Benefit 8.7 x with Tax Benefit and Synergies – FY 2014* Adj. EBIT Multiple of 12 x with Tax Benefit > Favorable 338 (h)(10) Generating $155+ Million of Value > $5 Million of Annual Tax Synergies > Expect $30 Million of Annual Synergies Over 4 Years > Benefits Driven from Footprint Simplification, Materials and Cross Selling > Accretive to EPS and Margins in 2015 and Beyond – 2015 GAAP EPS Accretion of $0.40 - $0.60 / Share – 2016 GAAP EPS Accretion of $0.95 - $1.15 / Share – Operating Margin Expansion _____________________ Note: FY 2014 ending September 30, 2014.
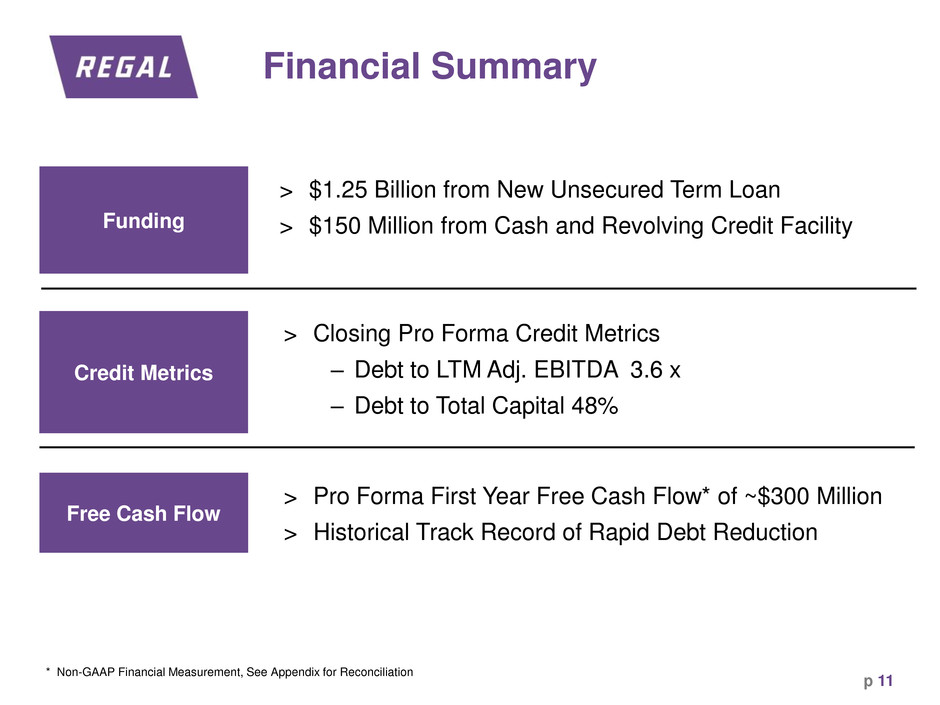
Financial Summary p 11 Funding Free Cash Flow Credit Metrics > $1.25 Billion from New Unsecured Term Loan > $150 Million from Cash and Revolving Credit Facility > Pro Forma First Year Free Cash Flow* of ~$300 Million > Historical Track Record of Rapid Debt Reduction > Closing Pro Forma Credit Metrics – Debt to LTM Adj. EBITDA 3.6 x – Debt to Total Capital 48% * Non-GAAP Financial Measurement, See Appendix for Reconciliation
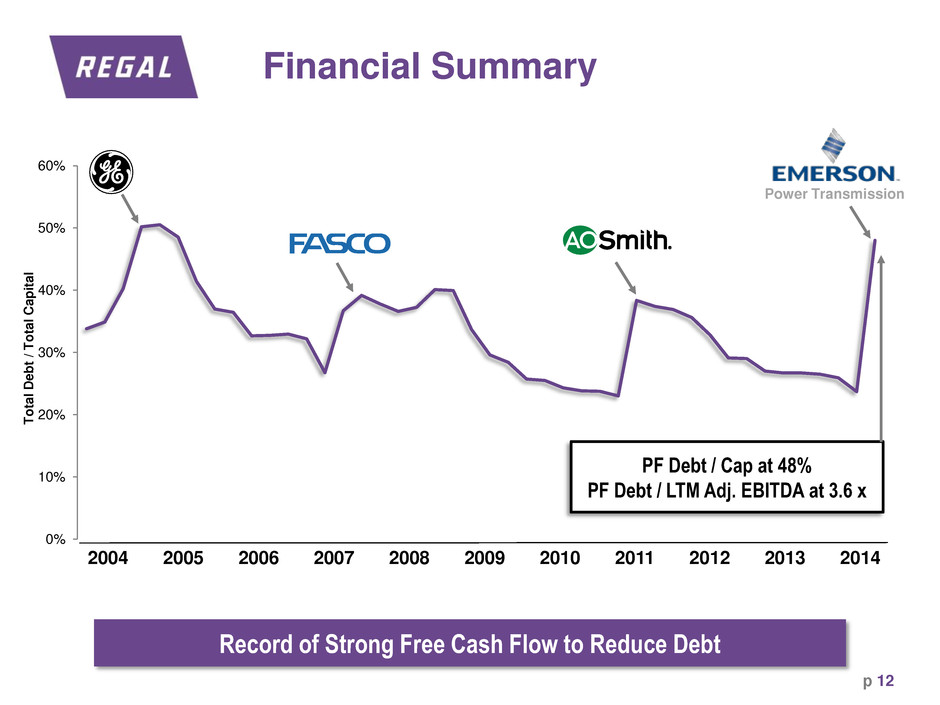
Financial Summary p 12 2005 2006 2007 2008 2009 2010 2011 2012 2004 0% 10% 20% 30% 40% 50% 60% T o tal D e b t / T o tal C a p it a l PF Debt / Cap at 48% PF Debt / LTM Adj. EBITDA at 3.6 x Record of Strong Free Cash Flow to Reduce Debt 2013 2014 Power Transmission
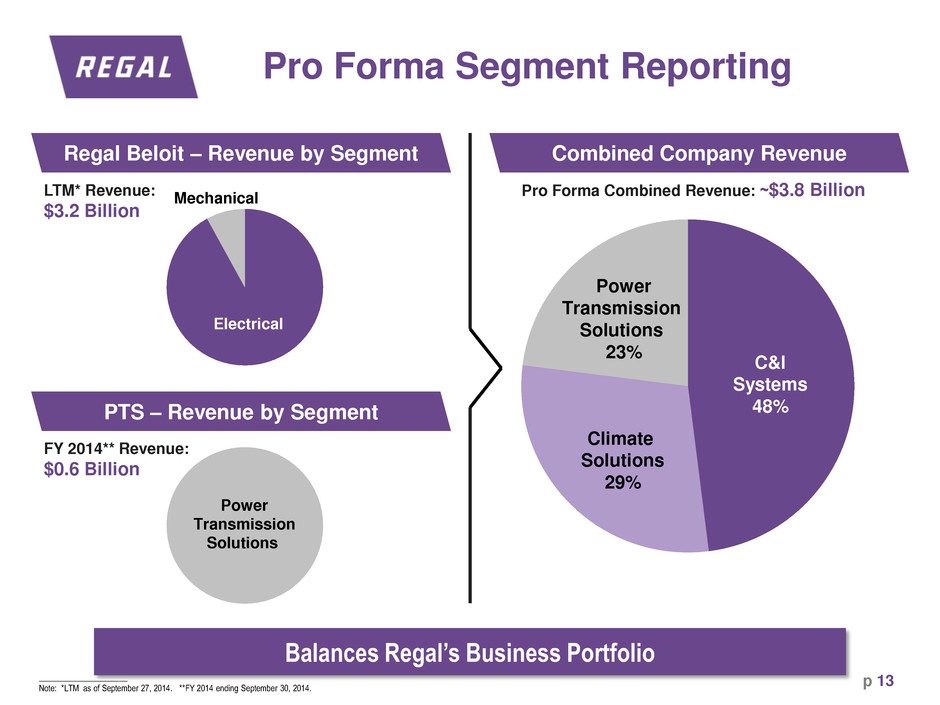
Pro Forma Segment Reporting p 13 Regal Beloit – Revenue by Segment Combined Company Revenue PTS – Revenue by Segment LTM* Revenue: $3.2 Billion FY 2014** Revenue: $0.6 Billion Electrical Mechanical Power Transmission Solutions Pro Forma Combined Revenue: ~$3.8 Billion C&I Systems 48% Power Transmission Solutions 23% Climate Solutions 29% Balances Regal’s Business Portfolio _____________________ Note: *LTM as of September 27, 2014. **FY 2014 ending September 30, 2014.
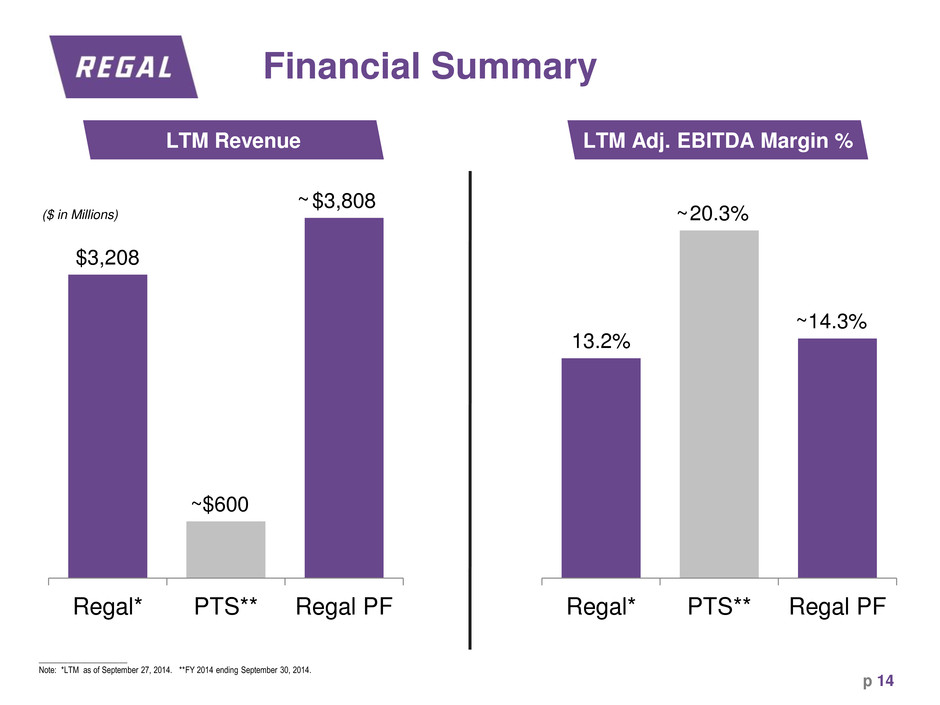
Financial Summary p 14 $3,208 $600 $3,808 Regal* PTS** Regal PF 13.2% 20.3% 14.3% Regal* PTS** Regal PF LTM Revenue ($ in Millions) LTM Adj. EBITDA Margin % _____________________ Note: *LTM as of September 27, 2014. **FY 2014 ending September 30, 2014. ~ ~ ~ ~
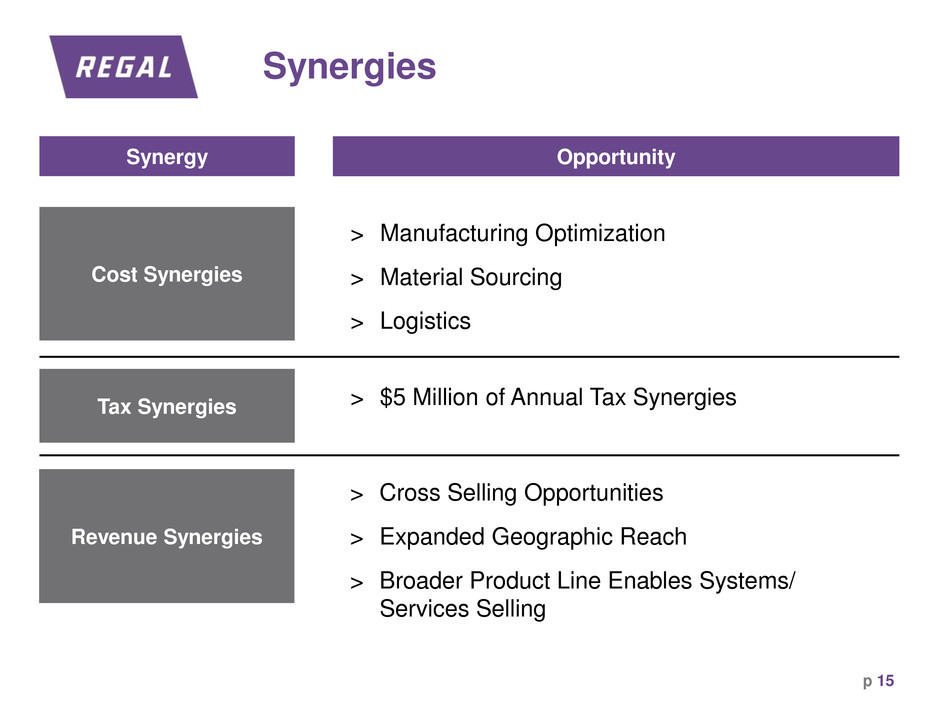
Synergies p 15 Synergy Opportunity Cost Synergies Revenue Synergies > Manufacturing Optimization > Material Sourcing > Logistics > Cross Selling Opportunities > Expanded Geographic Reach > Broader Product Line Enables Systems/ Services Selling Tax Synergies > $5 Million of Annual Tax Synergies
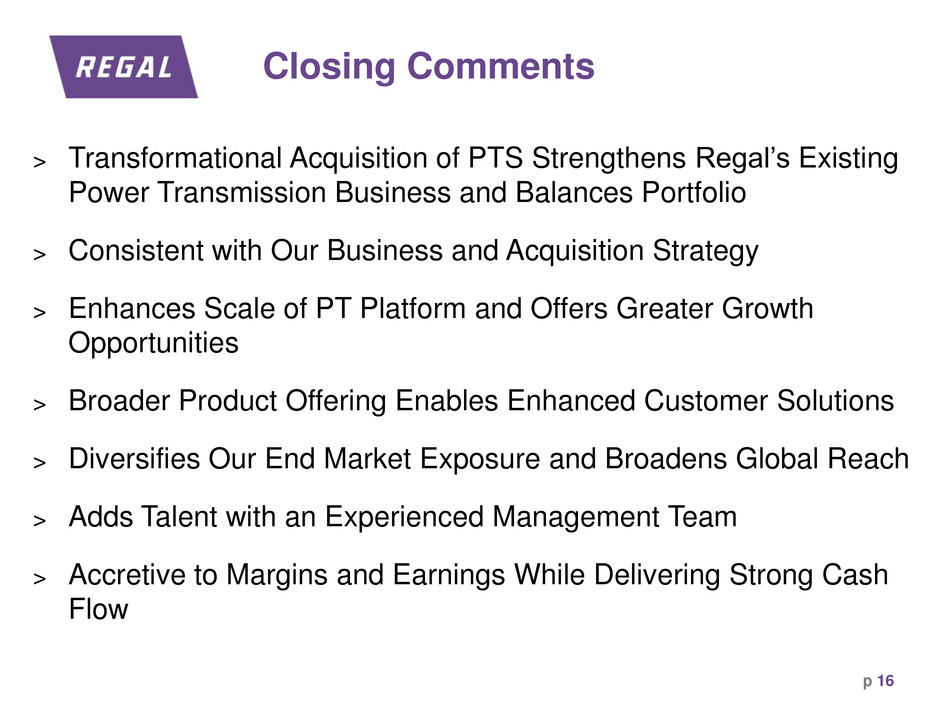
Closing Comments p 16 > Transformational Acquisition of PTS Strengthens Regal’s Existing Power Transmission Business and Balances Portfolio > Consistent with Our Business and Acquisition Strategy > Enhances Scale of PT Platform and Offers Greater Growth Opportunities > Broader Product Offering Enables Enhanced Customer Solutions > Diversifies Our End Market Exposure and Broadens Global Reach > Adds Talent with an Experienced Management Team > Accretive to Margins and Earnings While Delivering Strong Cash Flow

Questions and Answers p 17

Thank You Mark J Gliebe President Chief Executive Officer Chuck Hinrichs Vice President Chief Financial Officer John Perino Vice President Investor Relations Jonathan Schlemmer Chief Operating Officer 16
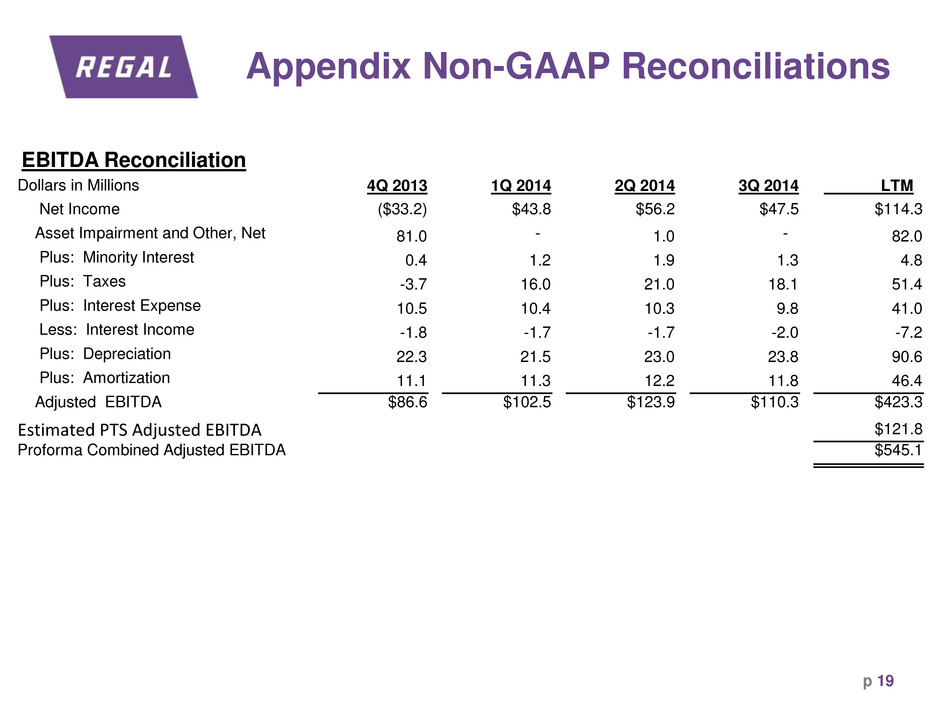
Appendix Non-GAAP Reconciliations EBITDA Reconciliation Dollars in Millions 4Q 2013 1Q 2014 2Q 2014 3Q 2014 LTM Net Income ($33.2) $43.8 $56.2 $47.5 $114.3 Asset Impairment and Other, Net 81.0 - 1.0 - 82.0 Plus: Minority Interest 0.4 1.2 1.9 1.3 4.8 Plus: Taxes -3.7 16.0 21.0 18.1 51.4 Plus: Interest Expense 10.5 10.4 10.3 9.8 41.0 Less: Interest Income -1.8 -1.7 -1.7 -2.0 -7.2 Plus: Depreciation 22.3 21.5 23.0 23.8 90.6 Plus: Amortization 11.1 11.3 12.2 11.8 46.4 Adjusted EBITDA $86.6 $102.5 $123.9 $110.3 $423.3 Estimated PTS Adjusted EBITDA $121.8 Proforma Combined Adjusted EBITDA $545.1 p 19
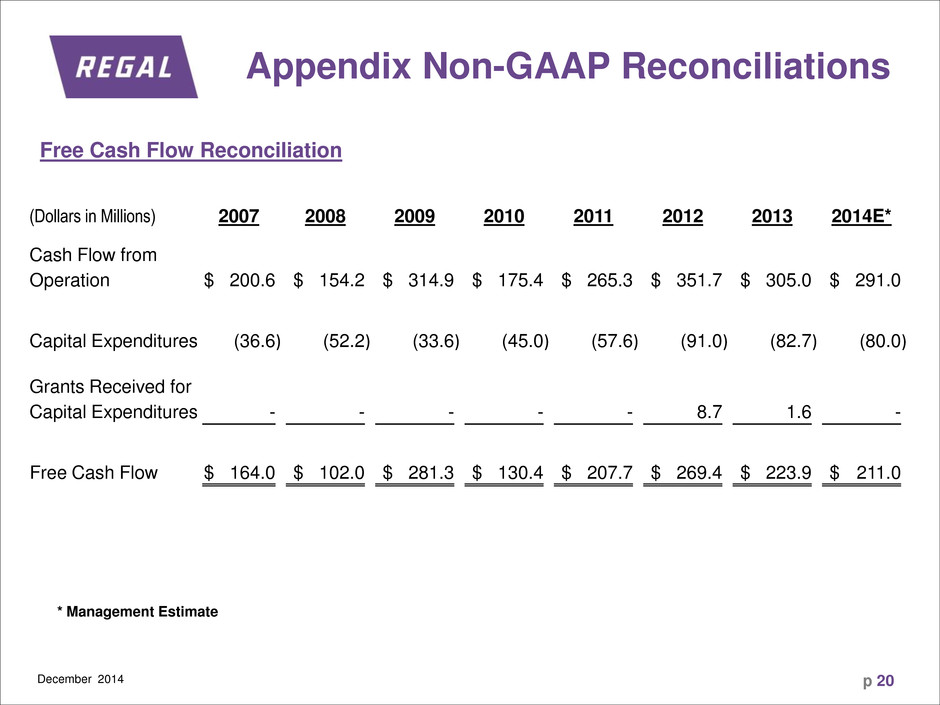
Free Cash Flow Reconciliation Appendix Non-GAAP Reconciliations (Dollars in Millions) 2007 2008 2009 2010 2011 2012 2013 2014E* Cash Flow from Operation $ 200.6 $ 154.2 $ 314.9 $ 175.4 $ 265.3 $ 351.7 $ 305.0 $ 291.0 Capital Expenditures (36.6 ) (52.2 ) (33.6 ) (45.0 ) (57.6 ) (91.0 ) (82.7 ) (80.0 ) Grants Received for Capital Expenditures - - - - - 8.7 1.6 - Free Cash Flow $ 164.0 $ 102.0 $ 281.3 $ 130.4 $ 207.7 $ 269.4 $ 223.9 $ 211.0 * Management Estimate December 2014 p 20
