Attached files
| file | filename |
|---|---|
| 8-K - 8-K - SM Energy Co | a14-25928_18k.htm |
| EX-99.2 - EX-99.2 - SM Energy Co | a14-25928_1ex99d2.htm |
Exhibit 99.1
|
|
Capital One Conference Jay Ottoson President and COO December 11, 2014 |
|
|
2 Forward Looking Statements - Cautionary Language Except for historical information contained herein, statements in this presentation, including information regarding the business of the Company, contain forward looking statements within the meaning of securities laws, including forecasts and projections. The words “anticipate,” “assume,” “believe,” “budget,” “estimate,” “expect,” “forecast,” “intend,” “plan,” “project,” “will” and similar expressions are intended to identify forward looking statements. These statements involve known and unknown risks, which may cause SM Energy's actual results to differ materially from results expressed or implied by the forward looking statements. These risks include factors such as the availability, proximity, and capacity of gathering, processing and transportation facilities; the uncertainty of negotiations to result in an agreement or a completed transaction; the uncertain nature of announced acquisition, divestiture, joint venture, farm down, or similar efforts and the ability to complete any such transactions; the uncertain nature of expected benefits from the actual or expected acquisition, divestiture, joint venture, farm down, or similar efforts; the volatility and level of oil, natural gas, and natural gas liquids prices; uncertainties inherent in projecting future rates of production from drilling activities and acquisitions; the imprecise nature of estimating oil and gas reserves; the availability of additional economically attractive exploration, development, and acquisition opportunities for future growth and any necessary financings; unexpected drilling conditions and results; unsuccessful exploration and development drilling results; the availability of drilling, completion, and operating equipment and services; the risks associated with the Company's commodity price risk management strategy; uncertainty regarding the ultimate impact of potentially dilutive securities; and other such matters discussed in the “Risk Factors” section of SM Energy's 2013 Annual Report on Form 10-K, as such risk factors may be updated from time to time in the Copmany’s other periodic reports filed with the Securties and Exchange Commission. The forward looking statements contained herein speak as of the date of this announcement. Although SM Energy may from time to time voluntarily update its prior forward looking statements, it disclaims any commitment to do so except as required by securities laws. . |

|
|
Strategy and Asset Overview 3 Economic inventory consists of projects achieve at least a 20% rate of return at $70/bbl WTI, $4/mmbtu gas, and expected well costs. Leverage operational efficiencies/scale Utilize industry leading technology to increase well performance Continue to increase the value and quantity of core program inventory Preserve financial strength and flexibility Williston Basin ~90 MMBOE (net) ~ 500 gross locations Eagle Ford ~900 MMBOE (net) ~1,050 gross locations Economic inventory(1) of approx. 1.0 BBOE in operated Eagle Ford and Bakken /Three Forks; nearly 20 times current year corporate production Significant existing development inventory in each core program Focus on debt adjusted per share metrics Provide top quartile debt adjusted production, proved reserve, and EBITDAX growth Maintain low leverage How SM Energy will differentially grow shareholder value Operated Programs |

|
|
Eagle Ford Acreage 4 Dimmit Maverick Webb Mexico SM Operated APC Operated Operated: ~144,000 net acres Non-operated: ~46,000 net acres TEXAS |

|
|
Current type curve Operated Eagle Ford – North 5 Improved completions have enhanced this asset Under current assumptions, SM Energy has identified more than 500 locations on its operated Eagle Ford North area Assumes $4/mmbtu gas, and 40% WTI NGL realizations. Upper band represents 15% reduction in CWC; lower band represents current CWC. Utilizes assumptions from IRR sensitivity using $70/bbl oil and expected well costs. Webb Mexico Dimmit Old type curve 2014 well results Improved Completion(2) Well Cost (8,000’ lateral) $7.4 MM IRR ~35% NPV10 ~$3.6 MM Old Completion(2) Well Cost (4,900’ lateral) $5.7 MM IRR 0% NPV10 $0 MM |

|
|
Operated Eagle Ford – East 6 Strong asset continues to provide top-tier returns Under current assumptions, SM Energy has identified more than 300 locations on its operated Eagle Ford East area Webb Mexico Dimmit Type curve 2014 well results Economics(2) Well Cost (6,500’ lateral) $6.7 MM IRR ~60% NPV10 ~$7.3 MM Assumes $4/mmbtu gas, and 40% WTI NGL realizations. Upper band represents 15% reduction in CWC; lower band represents current CWC. Utilizes assumptions from IRR sensitivity using $70/bbl oil and expected well costs. |

|
|
Operated Eagle Ford – South 7 Wells in southern acreage provide an economic dry gas option Under current assumptions, SM Energy has identified more than 200 locations on its operated Eagle Ford South area Webb Mexico Dimmit Type curve Historical well results Upper band represents 15% reduction in CWC; lower band represents current CWC. Utilizes assumptions from IRR sensitivity using $4.00/mmbtu gas and expected well costs. Economics(2) Well Cost (8,000’ lateral) $7.0 MM IRR ~40% NPV10 ~$5.3 MM |

|
|
TEXAS Opportunity for Stacked Laterals 8 ~400’ UPPER LOWER Buda Austin Chalk SM Energy’s operated and non-op acreage has some of the thickest section of total Eagle Ford (200-400’) across the entire trend Several tests planned and in progress Total Eagle Ford Thickness Stacked Test Non-Operated SM Operated Gamma Ray Resistivity Potential to significantly increase economic inventory Impact: Successful stacked laterals and tighter spacing could double or triple economic inventory of this core asset |

|
|
Williston Basin Acreage 9 Total Williston Basin acreage: ~238,000 net acres Divide Golden Valley Billings Dunn McKenzie Williams Roosevelt Sheridan Richland Wibaux Gooseneck: ~110,000 net acres Raven/Bear Den: ~42,000 net acres |

|
|
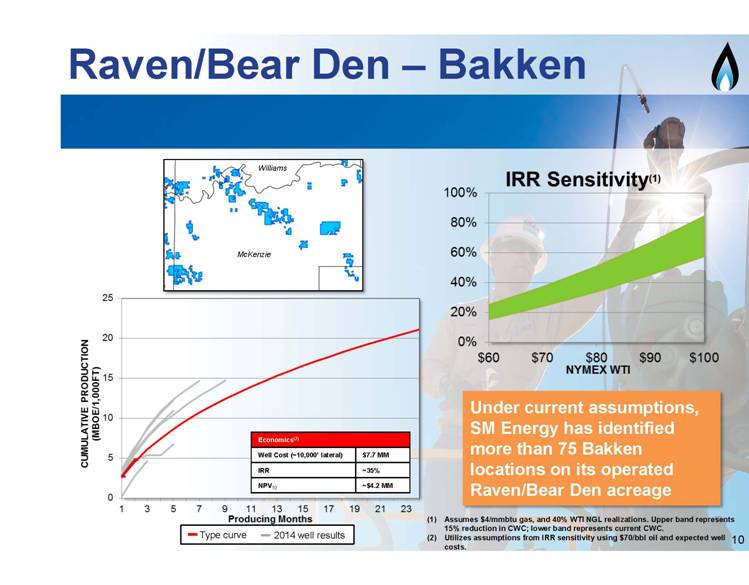
Raven/Bear Den – Bakken 10 Under current assumptions, SM Energy has identified more than 75 Bakken locations on its operated Raven/Bear Den acreage Williams McKenzie Economics(2) Well Cost (~10,000’ lateral) $7.7 MM IRR ~35% NPV10 ~$4.2 MM Assumes $4/mmbtu gas, and 40% WTI NGL realizations. Upper band represents 15% reduction in CWC; lower band represents current CWC. Utilizes assumptions from IRR sensitivity using $70/bbl oil and expected well costs. Type curve 2014 well results |
|
|
Gooseneck – Three Forks 11 Under current assumptions, SM Energy has identified more than 400 Three Forks locations on its operated Gooseneck acreage Divide Williams Substantial remaining inventory in our most economic Williston program Economics(2) Well Cost (~10,000’ lateral) $4.7 MM IRR ~40% NPV10 ~$3.1 MM Assumes $4/mmbtu gas, and 40% WTI NGL realizations. Upper band represents 15% reduction in CWC; lower band represents current CWC. Utilizes assumptions from IRR sensitivity using $70/bbl oil and expected well costs. Type curve 2014 well results |

|
|
First wells D&C’d ~$5.0MM Initial Bakken results are inline with Gooseneck Three Forks type curve Acreage located in a geologically favorable area Gooseneck Bakken Potential 12 Bakken Wells Gooseneck Three Forks Curve Gooseneck Bakken Results Potential to significantly increase economic inventory Impact: Successful Bakken program in Gooseneck could double economic inventory of this core asset |

|
|
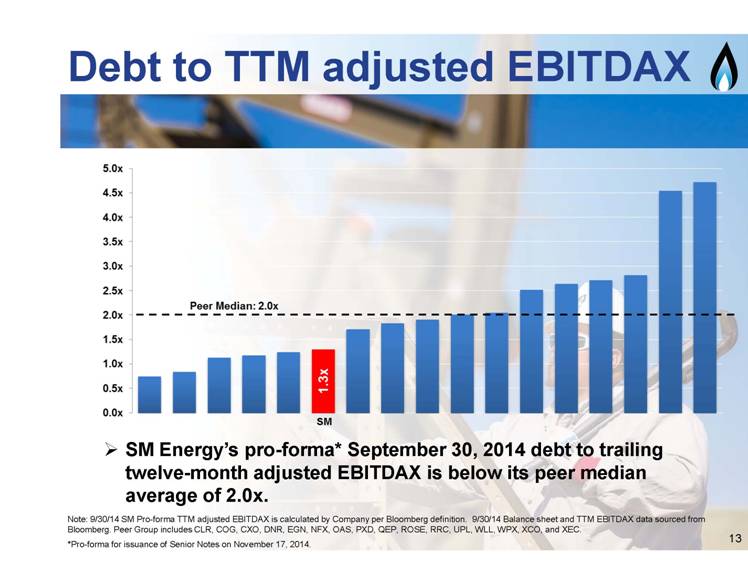
13 Debt to TTM adjusted EBITDAX Note: 9/30/14 SM Pro-forma TTM adjusted EBITDAX is calculated by Company per Bloomberg definition. 9/30/14 Balance sheet and TTM EBITDAX data sourced from Bloomberg. Peer Group includes CLR, COG, CXO, DNR, EGN, NFX, OAS, PXD, QEP, ROSE, RRC, UPL, WLL, WPX, XCO, and XEC. SM Energy’s pro-forma* September 30, 2014 debt to trailing twelve-month adjusted EBITDAX is below its peer median average of 2.0x. SM *Pro-forma for issuance of Senior Notes on November 17, 2014. |
|
|
Pro-Forma* Financial Position 14 Revolving Credit Facility Senior Notes due 2019 Senior Notes due 2021 Strong balance sheet with ample liquidity First debt maturity is in 2019 The Company recently amended its credit facility: Matures in 2019 Borrowing base remains at $2.4 billion Commitments increased to $1.5 billion Senior Notes due 2022 Senior Notes due 2023 Senior Notes due 2024 2019 *Pro-forma for issuance of Senior Notes on November 17, 2014 and amended credit facility dated December 10, 2014. |

|
|
Strong balance sheet, supported by solid hedge book Minimal commitments to new venture activities Flexible rig programs 15 2015 Budgeting Process Well positioned entering 2015: 2015 thoughts: Focus on returns – push on costs Protect the balance sheet Continue our peer leading performance EXPECT 2015 CAPITAL AND PRODUCTION GUIDANCE IN EARLY 2015 |

|
|
16 Takeaways Well positioned financially with strong balance sheet and significant liquidity Deep inventory of economic projects 10 years of drilling inventory in each core development program Current inventory equates to nearly 20 times current year production Focus on Shareholder Value |

|
|
17 Appendix |

|
|
18 Oil Derivative Position* Oil Swaps - NYMEX Equivalent Bbls $/Bbl 2014 Q4 631,000 $ 95.54 2014 Total 631,000 2015 Q1 1,711,000 $ 91.96 Q2 1,639,000 $ 91.26 Q3 1,254,000 $ 90.78 Q4 1,137,000 $ 90.15 2015 Total 5,741,000 2016 Q1 1,868,000 $ 86.93 Q2 1,752,000 $ 86.73 Q3 1,170,000 $ 90.29 Q4 780,000 $ 90.05 2016 Total 5,570,000 Grand Total 11,942,000 *As of 12/8/14 Oil Collars - NYMEX Equivalent Ceiling Floor Bbls $/Bbl $/Bbl 2014 Q4 303,000 $ 102.64 $ 85.00 2014 Total 303,000 2015 Q1 882,000 $ 99.53 $ 85.00 Q2 709,000 $ 94.06 $ 85.00 Q3 906,000 $ 91.25 $ 85.00 Q4 869,000 $ 92.19 $ 85.00 2015 Total 3,366,000 Grand Total 3,669,000 |

|
|
19 Gas Derivative Position* Natural Gas Swaps - NYMEX Equivalent Natural Gas Collars - NYMEX Equivalent Ceiling Floor MMBTU $/MMBTU MMBTU $/MMBTU $/MMBTU 2014 2014 Q4 7,095,000 $ 4.11 Q4 - 2014 Total 7,095,000 2014 Total - 2015 2015 Q1 23,548,000 $ 4.27 Q1 2,525,000 $ 4.31 $ 4.01 Q2 15,985,000 $ 3.93 Q2 2,296,000 $ 4.30 $ 3.99 Q3 14,950,000 $ 4.05 Q3 2,005,000 $ 4.30 $ 3.99 Q4 13,570,000 $ 4.03 Q4 6,176,000 $ 4.32 $ 3.99 2015 Total 68,053,000 2015 Total 13,002,000 2016 Q1 18,158,000 $ 4.23 Grand Total 13,002,000 Q2 9,130,000 $ 4.00 Q3 7,004,000 $ 4.07 Q4 14,603,000 $ 4.01 2016 Total 48,895,000 2017 Q1 14,334,000 $ 4.12 Q2 5,974,000 $ 4.10 Q3 5,712,000 $ 4.09 Q4 11,394,000 $ 4.12 2017 Total 37,414,000 2018 Q1 9,343,000 $ 4.26 Q2 8,974,000 $ 4.11 Q3 8,615,000 $ 4.11 Q4 8,309,000 $ 4.17 2018 Total 35,241,000 2019 Q1 8,021,000 $ 4.39 Q2 7,759,000 $ 4.11 Q3 7,506,000 $ 4.17 Q4 4,873,000 $ 4.23 2017 Total 28,159,000 Grand Total 224,857,000 *As of 12/8/14 |

|
|
20 NGL Derivative Position* Natural Gas Liquid Swaps - Mont. Belvieu Bbls $/Bbl 2014 Q4 314,000 $ 61.55 2014 Total 314,000 2015 Q1 781,000 $ 55.42 2015 Total 781,000 Grand Total 1,095,000 *As of 12/8/14 |
