Attached files
| file | filename |
|---|---|
| 8-K - 8-K - HD Supply Holdings, Inc. | a14-25762_18k.htm |
| EX-99.1 - EX-99.1 - HD Supply Holdings, Inc. | a14-25762_1ex99d1.htm |
Exhibit 99.2
|
|
2014 Third-Quarter Performance December 9, 2014 Financial Results and Company Highlights |

|
|
Disclaimers Forward-Looking Statements This presentation includes “forward-looking statements” within the meaning of Section 27A of the Securities Act and Section 21E of the Exchange Act. Forward-looking statements are subject to known and unknown risks and uncertainties, many of which may be beyond our control. We caution you that the forward-looking information presented herein is not a guarantee of future events, and that actual events may differ materially from those made in or suggested by the forward-looking information contained in this presentation. In addition, forward-looking statements generally can be identified by the use of forward-looking terminology such as “may,” “plan,” “seek,” “comfortable with,” “will,” “expect,” “intend,” “estimate,” “anticipate,” “believe” or “continue” or the negative thereof or variations thereon or similar terminology. A number of important factors could cause actual events to differ materially from those contained in or implied by the forward-looking statements, including those factors discussed in our filings with the U.S. Securities & Exchange Commission’s (the “SEC”), including our annual report on Form 10-K, as amended, for the year ended February 2, 2014, which can be found at the SEC’s website www.sec.gov. Any forward-looking information presented herein is made only as of the date of this presentation, and we do not undertake any obligation to update or revise any forward-looking information to reflect changes in assumptions, the occurrence of unanticipated events, or otherwise. Non-GAAP Financial Measures HD Supply supplements its reporting net income (loss) with non-GAAP measurements, including Adjusted EBITDA, Adjusted net income (loss) and Adjusted net income (loss) per share. This supplemental information should not be considered in isolation or as a substitute for the GAAP measurements. Additional information regarding Adjusted EBITDA, Adjusted net income (loss) and Adjusted net income (loss) per share referred to in this presentation is included at the end of this presentation under “Reconciliation of Non-GAAP Measures.” |

|
|
Q3’14 Performance Highlights Strong Organic Sales, Operating Leverage and Earnings Growth +9% Sales Growth Versus Prior Year (VPY) +17% Adjusted EBITDA Growth VPY +41% Adjusted Net Income per Diluted Share Growth VPY +600 Basis Points Versus Market Estimate1 1.8x Operating Leverage2 +10 Basis Points Gross Margin Improvement VPY Focused Strategic Execution 1 Management estimate; market estimate is management estimate of the growth of our markets based on multiple quantitative and qualitative inputs 2 Operating Leverage is defined as Adjusted EBITDA growth divided by total Net sales growth Note: “VPY” denotes Versus Prior Year |

|
|
Focused Execution – Q3’14 Examples Get Better and Faster Every Day Invested in Five (5) Growth Plays $16M in Q3’14 Sell More to Existing Customers (i.e., Share of Wallet) Introduce New Products and Services Expand the Channels to Reach Our Customers (e.g., Internet, Catalog, Mobility) Acquire New Customers Enter New Geographies (i.e., Open New Locations) Simplified Portfolio Mix Expected Hardware Solutions Sale Enhanced Capital Structure $36M Annual Interest Expense Savings Continued to Evolve as a Public Company |

|
|
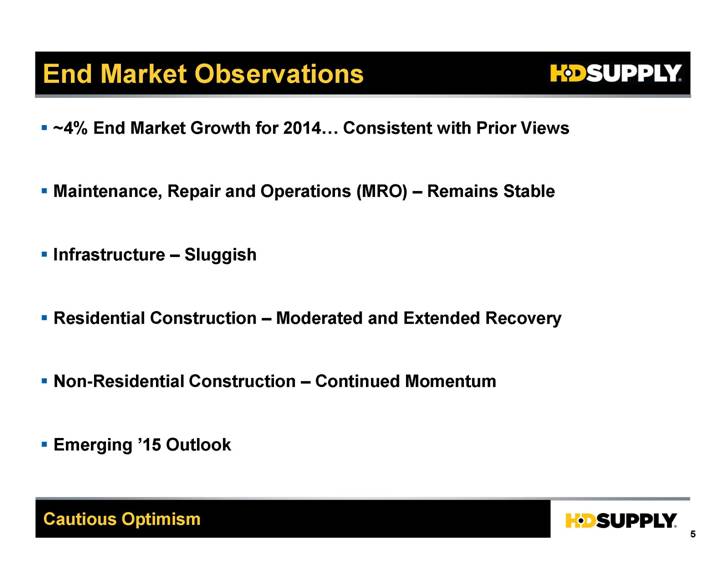
End Market Observations Cautious Optimism ~4% End Market Growth for 2014 Consistent with Prior Views Maintenance, Repair and Operations (MRO) – Remains Stable Infrastructure – Sluggish Residential Construction – Moderated and Extended Recovery Non-Residential Construction – Continued Momentum Emerging ’15 Outlook |
|
|
Q3’14 Financial Results $2,273M $2,488M +9% Gross Profit Gross Margin % Operating Income Adj. EBITDA % Op. Income % $662M $726M 29.1% 29.2% $226M $265M $160M $202M 9.9% 10.7% 8.1% +10% +10 BPs +80 BPs +17% +9% Net Sales Growth; +17% Adjusted EBITDA Growth in Q3’14 ($ in millions, except per share data) $76M $111M +46% +600 BPs of Growth in Excess of Estimated Market Growth3 in Q3’14 Q3’14 Net Sales Growth From: $133M of Growth Initiatives $80M of End Market Growth ($6M) of FX Impact 1.8x Q3’14 Operating Leverage4 +26% Net Sales 1 During the fourth quarter of fiscal 2013, the company decided to dispose of its Litemor business, a specialty lighting distributor included within the HD Supply Canada business. The results of operations for third quarter 2013 have been revised to reflect the Litemor operations as discontinued operations. 2 See appendix slides 33 and 34 for a reconciliation of Adjusted EBITDA and Adjusted Net Income (Loss) to Net Income (Loss) 3 Management estimate; market estimate is management estimate of the growth of our markets based on multiple quantitative and qualitative inputs 4 Operating Leverage is defined as Adjusted EBITDA growth divided by total Net sales growth Note: “VPY” denotes Versus Prior Year Q3’131 Adj. EBITDA2 VPY Adj. Net Income (Loss)2 7.0% +110 BPs Q3’14 $0.39 $0.55 +$0.16 Per Diluted Share $215M |

|
|
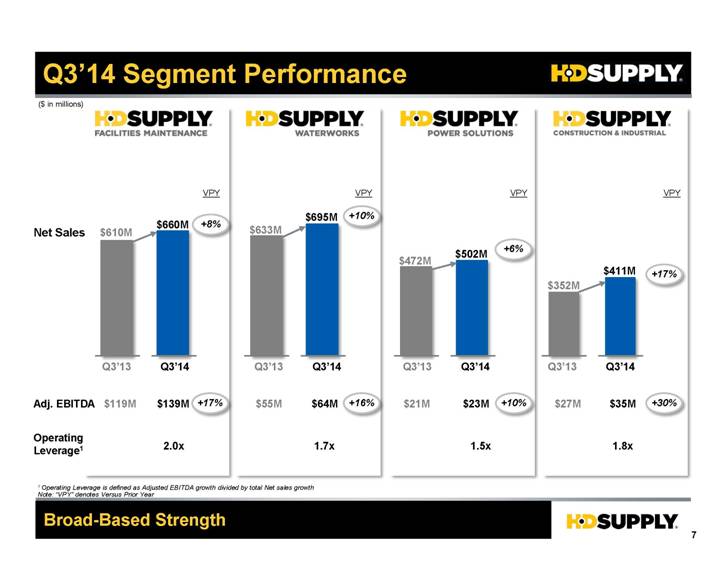
Q3’14 Segment Performance Q3’14 $660M $695M $502M $411M Adj. EBITDA $139M $64M $23M $35M Operating Leverage1 2.0x 1.7x 1.5x 1.8x Net Sales ($ in millions) Broad-Based Strength Q3’13 $610M $633M $472M $352M $119M $55M +10% $21M +6% VPY +8% +17% VPY VPY VPY +16% +10% +17% +30% $27M 1 Operating Leverage is defined as Adjusted EBITDA growth divided by total Net sales growth Note: “VPY” denotes Versus Prior Year Q3’14 Q3’13 Q3’14 Q3’13 Q3’14 Q3’13 |
|
|
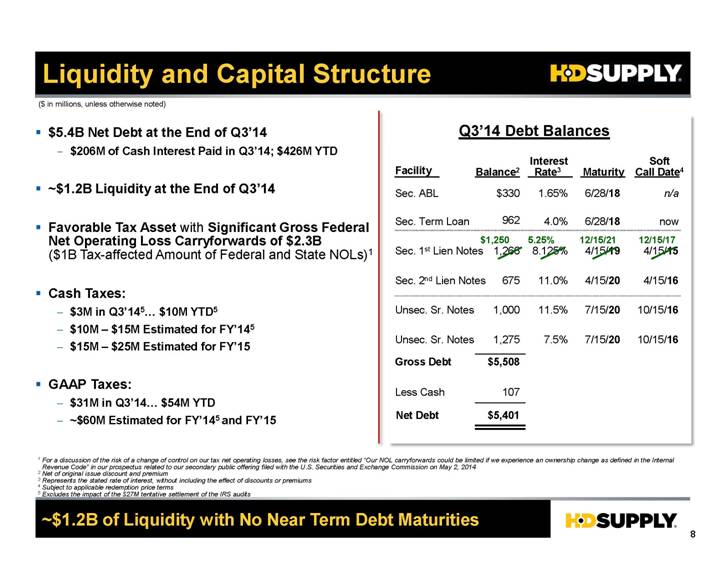
Liquidity and Capital Structure Q3’14 Debt Balances Sec. ABL Sec. Term Loan Sec. 1st Lien Notes Sec. 2nd Lien Notes Unsec. Sr. Notes Unsec. Sr. Notes $330 1,266 675 1,000 1,275 6/28/18 6/28/18 4/15/19 4/15/20 7/15/20 7/15/20 Gross Debt Less Cash Net Debt $5,401 107 $5,508 Facility Balance2 Maturity 1 For a discussion of the risk of a change of control on our tax net operating losses, see the risk factor entitled “Our NOL carryforwards could be limited if we experience an ownership change as defined in the Internal Revenue Code” in our prospectus related to our secondary public offering filed with the U.S. Securities and Exchange Commission on May 2, 2014 2 Net of original issue discount and premium 3 Represents the stated rate of interest, without including the effect of discounts or premiums 4 Subject to applicable redemption price terms 5 Excludes the impact of the $27M tentative settlement of the IRS audits ~$1.2B of Liquidity with No Near Term Debt Maturities ($ in millions, unless otherwise noted) 1.65% 4.0% 8.125% 11.0% 11.5% 7.5% Interest Rate3 962 n/a now 4/15/15 4/15/16 10/15/16 10/15/16 Soft Call Date4 $5.4B Net Debt at the End of Q3’14 $206M of Cash Interest Paid in Q3’14; $426M YTD ~$1.2B Liquidity at the End of Q3’14 Favorable Tax Asset with Significant Gross Federal Net Operating Loss Carryforwards of $2.3B ($1B Tax-affected Amount of Federal and State NOLs)1 Cash Taxes: $3M in Q3’145 $10M YTD5 $10M – $15M Estimated for FY’145 $15M – $25M Estimated for FY’15 GAAP Taxes: $31M in Q3’14 $54M YTD ~$60M Estimated for FY’145 and FY’15 $1,250 5.25% 12/15/21 12/15/17 |
|
|
Refinancing Overview and Impact Opportunistically Enhance Capital Structure ~$36M Annual Interest Expense Savings Issued $1.25B of new 5¼% First Lien Senior Secured Notes Due 2021 (Effective December 4th) Called $1.25B of existing 81/8% First Lien Senior Secured Notes Due 2019 (Effective December 19th) $106M Cost to Refinance1 $73M Call Premium + $33M of Make Whole Premium Extended Maturity 2½ Years to December 2021 ~$36M of Annual Interest Expense Savings 1 Excludes Associated Transaction Fees (~$18M) |

|
|
Hardware Solutions Transaction Simplify and Focus Portfolio Mix Strategic Rationale Financial Implications ~98% of Hardware Solutions’ Sales to The Home Depot Strategic Purchasing Agreement Expires in January 2020 Buyer is Natural Owner Consistent with HD Supply Focus on Differentiated, Large Business Units ~$200M of Gross Proceeds Proceeds Used to Invest in Business and/or Pay Down Asset Based Lending Facility Hardware Solutions will be Reflected as a Discontinued Operation Beginning in Q4’14 See Pages 23 – 25 in the Appendix for Additional Disclosure |

|
|
6.1% Q3’14 Monthly Organic Average Daily Sales (%) HD Supply Average Daily Sales Growth VPY2 +9% Q3’14 Sales Growth Versus Prior Year 1 Includes Hardware Solutions’ November Revenue 2 Adjusted for Acquisitions and Divestitures Note: “VPY” denotes Versus Prior Year 8.4% 10.3% 2.5% 16.9% 6.5% Nov.1 7.5% 7.4% (0.7%) 16.2% 7.2% ’14 Selling Days 25 18 19 9.1% 10.9% 16.3% ’13 Selling Days 25 18 19 Facilities Maintenance Waterworks Power Solutions Construction & Industrial (Preliminary) 10.1% 10.0% 8.6% 9.2% 10.2% 7.4% 16.8% 20 20 5.8% 7.5% 8.6% ~5% Aug. Sep. Oct. 2014 2013 Avg. of Dec. ’13 and Jan. ’14 $953M $668M $750M ’14 HD Supply Net Sales $785M |

|
|
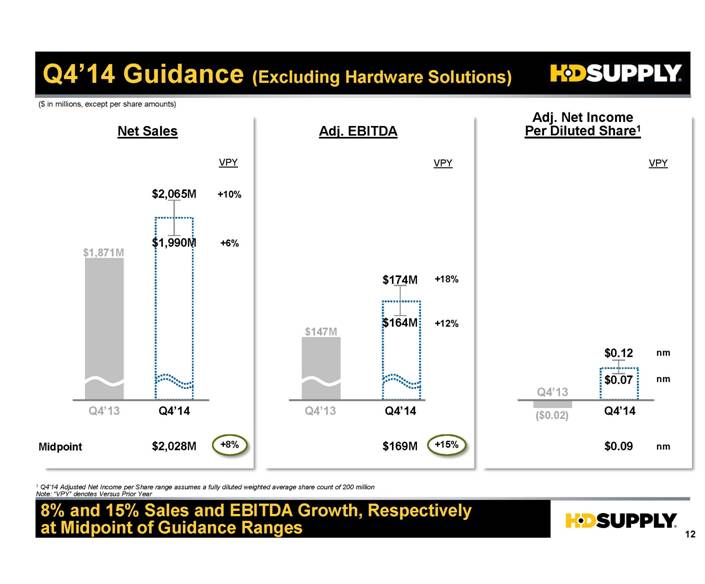
+18% +12% +10% +6% Q4’14 Guidance (Excluding Hardware Solutions) 8% and 15% Sales and EBITDA Growth, Respectively at Midpoint of Guidance Ranges $2,065M $1,990M $147M $1,871M $174M $164M VPY Q4’13 Q4’14 Q4’13 Q4’14 Q4’14 Net Sales Adj. EBITDA Adj. Net Income Per Diluted Share1 VPY 1 Q4’14 Adjusted Net Income per Share range assumes a fully diluted weighted average share count of 200 million Note: “VPY” denotes Versus Prior Year $0.12 $0.07 VPY ($ in millions, except per share amounts) ($0.02) . . . . Q4’13 nm nm Midpoint $2,028M +8% $169M +15% $0.09 nm |
|
|
Q4’14 Guidance “Reconciliation” Consistent with Previous FY’14 Outlook Adjusted for Expected Hardware Solutions Sale Sales Adjusted EBITDA 1 Q4’14 Adjusted Net Income per Share range assumes a fully diluted weighted average share count of 200 million Adj. Net Income Per Diluted Share1 Q4’14 Including Hardware Solutions Q4’14 Excluding Hardware Solutions $2,050M – $2,125M $170M – $180M $1,990M – $2,065M $164M – $174M $0.08 – $0.13 $0.07 – $0.12 Hardware Solutions Estimated Q4’14 $60M $6M $0.01 - = - = - = ($ in millions, except per share amounts) = – |

|
|
Implied FY’14 Midpoint Estimates “Reconciliation” Consistent with Previous FY’14 Outlook Adjusted for Expected Hardware Solutions Sale VPY Net Sales Adj. EBITDA Adj. Net Income Per Diluted Share1 1 FY’14 Adjusted Net Income per Share range assumes a fully diluted weighted average share count of 200 million Note: “VPY” denotes Versus Prior Year ($ in millions, except per share amounts) . . +8% Including Hardware Solutions . . Excluding Hardware Solutions $9,184M $8,905M ($279M) +8% VPY . . +16% Including Hardware Solutions . . Excluding Hardware Solutions $888M $851M ($37M) +16% Including Hardware Solutions Excluding Hardware Solutions $1.37 $1.24 ($0.13) |

|
|
FY’14 Operating Leverage Framework Consistent with Previous FY’14 Outlook Commentary HDS Market Growth1 Illustrative ~4% + Above Market Growth2 300 BPs = End Market Growth Controllable Execution Annual Sales Growth Illustrative Adj. EBITDA Growth Adjusted EBITDA Growth 14.0% HDS Market Growth 10.5% 7% 2.0x 1.5x Operating Leverage Target2,3 1 Management estimates 2 Long-term average growth target based on management estimates and aspirations; modifications to framework for FY’14 only 3 Operating Leverage defined as the percentage change in Adjusted EBITDA divided by the percentage change in Net sales; target based on management estimates and aspirations Note: These objectives are forward-looking, are subject to significant business, economic, regulatory and competitive uncertainties and contingencies, many of which are beyond the control of the Company and its management, and are based upon assumptions with respect to future decisions, which are subject to change. Actual results will vary and those variations may be material. For discussion of some of the important factors that could cause these variations, please consult the “Risk Factors” section of our Form 10-K, as amended, for the fiscal year ended February 2, 2014. Nothing in this presentation should be regarded as a representation by any person that these objectives will be achieved and the Company undertakes no duty to update its objectives. 400 BPs 16.0% 12.0% 8% Above Market Growth |

|
|
FY’15 End Market Preliminary Outlook ~4% to 5% End Market Growth Preliminary View Residential Infrastructure & Other MRO Municipal Power 1 Management estimates (~20%) (~80%) (~25%) (~50%) (~25%) (~25%) (~75%) (~100%) (Approximate End Market Exposure1) FY’15 End Markets Primary End Market Mid- to High-Single Digit Flat to Up Low Single-digit +1% to +2% Non- Residential Preliminary Perspective1 Mid-Single Digit ~4% to ~5% |

|
|
FY’15 Operating Leverage Framework 1.5x – 2.0x FY’15 Operating Leverage Target; 12% – 16% Implied FY’15 Adjusted EBITDA Growth HDS Market Growth1 Illustrative ~4% to ~5% + Above Market Growth2 300 BPs = End Market Growth Controllable Execution Annual Sales Growth Illustrative Adj. EBITDA Growth Adjusted EBITDA Growth 16.0% HDS Market Growth 12.0% ~8% 2.0x 1.5x Operating Leverage Target2 1 Management estimates 2 Long-term average growth target based on management estimates and aspirations 3 Operating Leverage defined as the percentage change in Adjusted EBITDA divided by the percentage change in Net sales; target based on management estimates and aspirations Note: These objectives are forward-looking, are subject to significant business, economic, regulatory and competitive uncertainties and contingencies, many of which are beyond the control of the Company and its management, and are based upon assumptions with respect to future decisions, which are subject to change. Actual results will vary and those variations may be material. For discussion of some of the important factors that could cause these variations, please consult the “Risk Factors” section of our Form 10-K, as amended, for the year ended February 2, 2014. Nothing in this presentation should be regarded as a representation by any person that these objectives will be achieved and the Company undertakes no duty to update its objectives. Above Market Growth |

|
|
FY’15 Free Cash Flow Framework Reduce Debt and Fuel Growth Illustrative 1 Management estimates 2 Long-term average growth target based on management estimates and aspirations 3 Operating Leverage defined as the percentage change in Adjusted EBITDA divided by the percentage change in Sales; target based on management estimates and aspirations Note: These objectives are forward-looking, are subject to significant business, economic, regulatory and competitive uncertainties and contingencies, many of which are beyond the control of the Company and its management, and are based upon assumptions with respect to future decisions, which are subject to change. Actual results will vary and those variations may be material. For discussion of some of the important factors that could cause these variations, please consult the “Risk Factors” section of our Form 10-K, as amended, for the year ended February 2, 2014. Nothing in this presentation should be regarded as a representation by any person that these objectives will be achieved and the Company undertakes no duty to update its objectives. Annual Sales Growth1 Illustrative Adj. EBITDA Growth Adjusted EBITDA Growth 16.0% HDS Market Growth 12.0% ~8% 2.0x 1.5x Operating Leverage Target2,3 Above Market Growth ’15 Adjusted EBITDA Less: ∆ in Trade NWC Capex Cash Interest Cash Taxes Free Cash Flow ~15% of Annual Sales ~1.5% of Annual Sales ~$400M $15M – $25M $250M - $300M |

|
|
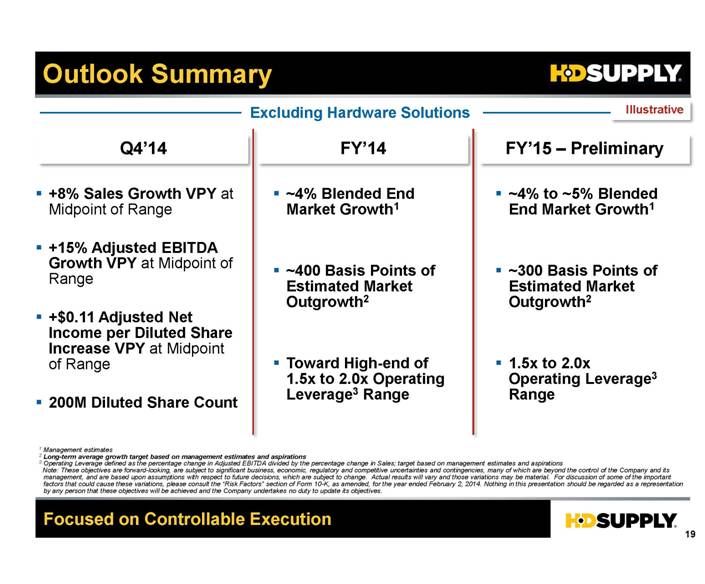
Outlook Summary Focused on Controllable Execution Q4’14 FY’14 +8% Sales Growth VPY at Midpoint of Range +15% Adjusted EBITDA Growth VPY at Midpoint of Range +$0.11 Adjusted Net Income per Diluted Share Increase VPY at Midpoint of Range 200M Diluted Share Count ~4% Blended End Market Growth1 ~400 Basis Points of Estimated Market Outgrowth2 Toward High-end of 1.5x to 2.0x Operating Leverage3 Range 1 Management estimates 2 Long-term average growth target based on management estimates and aspirations 3 Operating Leverage defined as the percentage change in Adjusted EBITDA divided by the percentage change in Sales; target based on management estimates and aspirations Note: These objectives are forward-looking, are subject to significant business, economic, regulatory and competitive uncertainties and contingencies, many of which are beyond the control of the Company and its management, and are based upon assumptions with respect to future decisions, which are subject to change. Actual results will vary and those variations may be material. For discussion of some of the important factors that could cause these variations, please consult the “Risk Factors” section of Form 10-K, as amended, for the year ended February 2, 2014. Nothing in this presentation should be regarded as a representation by any person that these objectives will be achieved and the Company undertakes no duty to update its objectives. FY’15 – Preliminary ~4% to ~5% Blended End Market Growth1 ~300 Basis Points of Estimated Market Outgrowth2 1.5x to 2.0x Operating Leverage3 Range Excluding Hardware Solutions Illustrative |
|
|
Q&A We Supply the Products and Services to Build Your City and Keep it Running |

|
|
Concluding Remarks Solid Q3’14 Performance +9% Sales Growth VPY +17% Adjusted EBITDA Growth VPY +41% Adjusted Net Income per Diluted Share Growth VPY Execution to Deliver Profitable Growth in Excess of Market Growth Estimate Drive Operating Leverage Category Management and Cost Discipline Opportunistically Enhance Capital Structure End Market Momentum Continues Remain Cautiously Optimistic Focus on Controllable Execution Note: “VPY” Denotes Versus Prior Year |

|
|
Appendix |
|
|
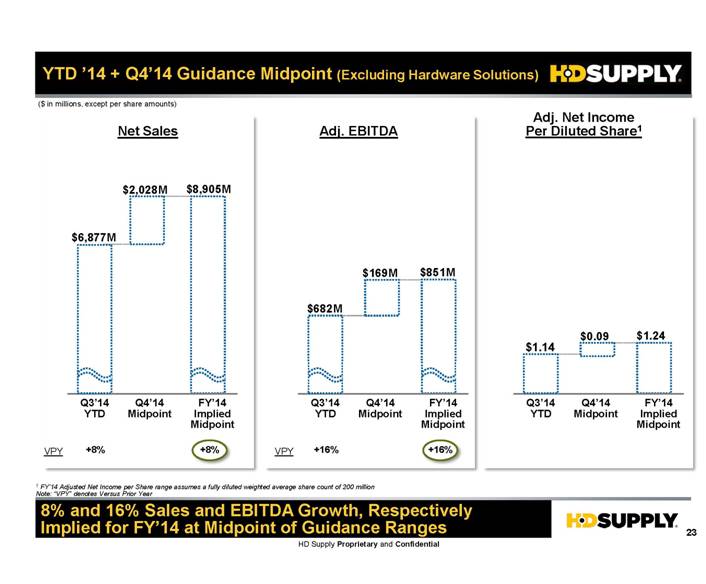
YTD ’14 + Q4’14 Guidance Midpoint (Excluding Hardware Solutions) 8% and 16% Sales and EBITDA Growth, Respectively Implied for FY’14 at Midpoint of Guidance Ranges VPY Net Sales Adj. EBITDA Adj. Net Income Per Diluted Share1 1 FY’14 Adjusted Net Income per Share range assumes a fully diluted weighted average share count of 200 million Note: “VPY” denotes Versus Prior Year ($ in millions, except per share amounts) . . +8% Q3’14 YTD . . FY’14 Implied Midpoint $6,877M $2,028M +8% VPY . . +16% Q3’14 YTD . . FY’14 Implied Midpoint $682M $851M $169M +16% Q3’14 YTD FY’14 Implied Midpoint $1.14 $1.24 $0.09 Q4’14 Midpoint Q4’14 Midpoint Q4’14 Midpoint $8,905M |
|
|
FY’14 YTD Results Adjusted for Hardware Solutions ($ in millions, except per share amounts) Q1-14 Q2-14 Q3-14 YTD Q1-14 Q2-14 Q3-14 YTD Q1-14 Q2-14 Q3-14 YTD Net Sales 2,161 $ 2,447 $ 2,488 $ 7,096 $ (67) $ (79) $ (73) $ (219) $ 2,094 $ 2,368 $ 2,415 $ 6,877 $ Cost of sales 1,530 1,725 1,762 5,017 (39) (43) (39) (121) 1,491 1,682 1,723 4,896 Gross Profit 631 722 726 2,079 (28) (36) (34) (98) 603 686 692 1,981 Gross margin 29.2% 29.5% 29.2% 29.3% -40 bps -50 bps -50 bps -50 bps 28.8% 29.0% 28.7% 28.8% Operating expenses: Selling, general and administrative 447 468 467 1,382 (21) (24) (23) (68) 426 444 444 1,314 Depreciation and amortization 62 64 57 183 (4) (3) (4) (11) 58 61 53 172 Restructuring 3 4 - 7 - - - - 3 4 - 7 Total operating expenses 512 536 524 1,572 (25) (27) (27) (79) 487 509 497 1,493 Operating Income 119 186 202 507 (3) (9) (7) (19) 116 177 195 488 Interest expense 116 116 115 347 - - - - 116 116 115 347 Loss on extinguishment of debt 2 - - 2 - - - - 2 - - 2 Other (income) expense, net 1 - (4) (3) - - - - 1 - (4) (3) Income (Loss) from Continuing Operations Before Provision (Benefit) for Income Taxes - 70 91 161 (3) (9) (7) (19) (3) 61 84 142 Provision (benefit) for income taxes 1 22 31 54 - (3) (1) (4) 1 19 30 50 Income (Loss) from Continuing Operations (1) 48 60 107 (3) (6) (6) (15) (4) 42 54 92 Income (loss) from discontinued operations, net of tax (11) - - (11) 3 6 6 15 (8) 6 6 4 Net Income (Loss) (12) $ 48 $ 60 $ 96 $ - $ - $ - $ - $ (12) $ 48 $ 60 $ 96 $ Adjusted EBITDA 190 $ 258 $ 265 $ 713 $ (7) $ (12) $ (12) $ (31) $ 183 $ 246 $ 253 $ 682 $ Adjusted net income 39 $ 102 $ 111 $ 252 $ (5) $ (11) $ (8) $ (24) $ 34 $ 91 $ 103 $ 228 $ Diluted shares outstanding 198.9 200.5 200.2 199.7 - - - - 198.9 200.5 200.2 199.7 Adjusted net income per diluted share 0.20 $ 0.51 $ 0.55 $ 1.26 $ (0.03) $ (0.05) $ (0.04) $ (0.12) $ 0.17 $ 0.45 $ 0.51 $ 1.14 $ AS REPORTED REVISION FOR HARDWARE SOLUTIONS REVISED |

|
|
FY’13 Results Adjusted for Hardware Solutions ($ in millions, except per share amounts) AS REPORTED REVISION FOR HARDWARE SOLUTIONS REVISED Q1-13 Q2-13 Q3-13 Q4-13 YTD Q1-13 Q2-13 Q3-13 Q4-13 YTD Q1-13 Q2-13 Q3-13 Q4-13 YTD Net Sales 2,048 $ 2,237 $ 2,273 $ 1,929 $ 8,487 $ (65) $ (70) $ (66) $ (58) $ (259) $ 1,983 $ 2,167 $ 2,207 $ 1,871 $ 8,228 $ Cost of sales 1,455 1,580 1,611 1,369 6,015 (37) (39) (37) (32) (145) 1,418 1,541 1,574 1,337 5,870 Gross Profit 593 657 662 560 2,472 (28) (31) (29) (26) (114) 565 626 633 534 2,358 Gross margin 29.0% 29.4% 29.1% 29.0% 29.1% -50 bps -50 bps -40 bps -50 bps -40 bps 28.5% 28.9% 28.7% 28.5% 28.7% Operating expenses: Selling, general and administrative 433 444 441 415 1,733 (22) (21) (21) (20) (84) 411 423 420 395 1,649 Depreciation and amortization 59 61 61 61 242 (3) (4) (3) (4) (14) 56 57 58 57 228 Restructuring - - - 9 9 - - - - - - - - 9 9 Total operating expenses 492 505 502 485 1,984 (25) (25) (24) (24) (98) 467 480 478 461 1,886 Operating Income 101 152 160 75 488 (3) (6) (5) (2) (16) 98 146 155 73 472 Interest expense 147 145 117 119 528 - - - (1) (1) 147 145 117 118 527 Loss on extinguishment of debt 41 46 - - 87 - - - - - 41 46 - - 87 Other (income) expense, net - 20 - - 20 - - - - - - 20 - - 20 Income (Loss) from Continuing Operations Before Provision (Benefit) for Income Taxes (87) (59) 43 (44) (147) (3) (6) (5) (1) (15) (90) (65) 38 (45) (162) Provision (benefit) for income taxes 43 12 (8) 15 62 (7) 1 3 (1) (4) 36 13 (5) 14 58 Income (Loss) from Continuing Operations (130) (71) 51 (59) (209) 4 (7) (8) - (11) (126) (78) 43 (59) (220) Income (loss) from discontinued operations, net of tax (1) (1) - (7) (9) (4) 7 8 - 11 (5) 6 8 (7) 2 Net Income (Loss) (131) $ (72) $ 51 $ (66) $ (218) $ - $ - $ - $ - $ - $ (131) $ (72) $ 51 $ (66) $ (218) $ Adjusted EBITDA 165 $ 219 $ 226 $ 154 $ 764 $ (6) $ (9) $ (8) $ (7) $ (30) $ 159 $ 210 $ 218 $ 147 $ 734 $ Adjusted net income (14) $ 37 $ 76 $ - $ 99 $ (5) $ (7) $ (6) $ (3) $ (21) $ (19) $ 30 $ 70 $ (3) $ 78 $ Diluted shares outstanding 130.6 157.8 197.4 191.9 171.8 - - - - - 130.6 157.8 197.4 191.9 171.8 Adjusted net income (loss) per diluted share (0.11) $ 0.23 $ 0.39 $ - $ 0.58 $ (0.04) $ (0.04) $ (0.03) $ (0.02) $ (0.12) $ (0.15) $ 0.19 $ 0.35 $ (0.02) $ 0.45 $ |

|
|
Controllable Execution +300 Basis Points Above Market Estimate 1 Long-term average growth target based on management estimates and aspirations +200 BPs to +500 BPs +300 BPs Long-term Growth Above Market Estimate Targets1 +200 BPs to +500 BPs +200 BPs to +500 BPs +0 BPs to +200 BPs (BPs Above BU End Market Estimate) Sell More to Existing Customers (i.e., Share of Wallet) Introduce New Products and Services Expand the Channels to Reach Our Customers (e.g., Internet, Catalog, Mobility) Acquire New Customers Enter New Geographies (i.e., Open New Locations) Five Growth “Plays” |

|
|
’14 End Market Outlook No Change to FY’14 Outlook Residential Infrastructure & Other MRO Municipal Power 1 Management estimates (~20%) (~80%) (~25%) (~50%) (~25%) (~25%) (~75%) (~100%) (Approximate End Market Exposure1) FY’14 End Markets Primary End Market +1% to +2% Non- Residential Mid Single-digit Previous View1 as of Sep. ’14 Mid Single-digit Flat +1% to +2% Revision None Current View1 as of Dec. ’14 Mid Single-digit Mid Single-digit Flat None None None |

|
|
Monthly Average Daily Sales Growth – Organic (%) HD Supply Organic Average Daily Sales Growth VPY1 9% Organic Average Daily Sales Growth in Q3’14 ’14 Selling Days ’13 Selling Days ’12 Selling Days (VPY%) 1 Adjusted for Acquisitions, Divestitures, Crown Bolt Contract Amendment and Selling Days 2 Includes Hardware Solutions November Revenue Note: “VPY” denotes Versus Prior Year FY 2013 FY 2014 Facil. Maint. Waterworks Power Solutions Const. & Ind. 18 18 19 19 24 24 18 20 28 20 20 20 20 20 20 25 25 25 19 19 20 20 20 19 24 24 24 -2.0% 8.6% Nov. Dec. 11.5% Jan. Feb. 4.1% Apr. May Mar. 4.2% 7.5% 9.6% (Preliminary) Jul. Jun. 10.1% 8.6% 8.1% 9.7% 7.4% 9.2% 0.6% -7.5% -2.8% 2.3% 10.6% 6.0% 10.4% 19.9% 9.8% 2.2% -3.9% 9.4% 8.1% 7.0% -6.7% 9.8% 5.7% 6.2% 8.5% 12.8% 8.6% 12.3% 6.4% 13.7% 7.6% 13.2% 6.8% 15.1% 6.6% 7.3% 7.2% 18.2% 20 20 20 Aug. 10.1% 9.2% 10.2% 7.4% 16.8% 18 18 18 Nov.2 6.5% 7.5% 7.4% -0.7% 16.2% 25 25 25 Oct. 8.6% 8.4% 10.3% 2.5% 16.9% 19 19 19 Sep. 10.0% 7.2% 9.1% 10.9% 16.3% |

|
|
Monthly Average Daily Sales Growth (%) 9% Average Daily Sales Growth in Q3’14 ’14 Selling Days ’13 Selling Days ’12 Selling Days (VPY%) FY 2013 FY 2014 Facil. Maint. Waterworks Power Solutions Const. & Ind. 18 18 19 19 24 24 18 20 28 20 20 20 20 20 20 25 25 25 19 19 20 20 20 19 24 24 24 -2.2% 9.3% Nov. Dec. 8.6% Jan. Feb. 4.1% Apr. May Mar. 4.2% 7.5% 9.6% (Preliminary) Jul. Jun. 10.1% 8.6% 8.1% 13.7% 7.4% 9.2% 0.6% -7.5% -2.8% 2.3% 10.6% 6.0% 10.4% 19.9% 9.8% 2.2% -3.9% 9.4% 8.1% 7.0% -6.7% 9.8% 5.7% 6.2% 8.5% 12.8% 8.6% 12.3% 6.4% 13.7% 7.6% 13.2% 6.8% 15.1% 6.6% 7.3% 7.2% 18.2% 20 20 20 Aug. 10.1% 9.2% 10.2% 7.4% 16.8% 18 18 18 Nov.1 7.5% 7.4% -0.7% 16.2% 25 25 25 Oct. 8.6% 8.4% 10.3% 2.5% 16.9% 19 19 19 Sep. 10.0% 7.2% 9.1% 10.9% 16.3% HD Supply Average Daily Sales Growth VPY 1 Includes Hardware Solutions November Revenue Note: “VPY” Denotes Versus Prior Year 6.5% |

|
|
Monthly Net Sales ($) HD Supply Net Sales $668M November ’14 Preliminary Sales ($ in millions) ’14 Selling Days ’13 Selling Days ’12 Selling Days Facil. Maint. Waterworks Power Solutions Const. & Ind. (Preliminary) Nov. Dec. Jan. Feb. $162 $163 $145 $95 $153 $139 $134 $88 $207 $168 $174 $112 $176 $146 $134 $96 $609M $627M $571M $731M 18 18 19 19 24 24 18 20 28 20 20 20 Mar. Apr. May $184 $168 $140 $106 $244 $237 $187 $142 $195 $197 $142 $113 $712M $893M 20 20 20 25 25 25 19 19 20 $659M Jul. Aug. Jun. 20 20 20 $790M $218 $945M $273 $217 $218 $250 $222 $157 $189 $151 $125 $151 $127 20 20 19 24 24 24 $785M FY 2013 FY 2014 Oct. Nov.1 Sep. 18 18 18 $750M $197 $953M $246 $211 $262 $151 $200 $122 $162 $175 $176 $144 $110 19 19 19 25 25 25 $668M 1 Includes Hardware Solutions November Revenue Note: “VPY” Denotes Versus Prior Year |

|
|
Average Daily
Sales Growth – Organic 9% Organic Average Daily Sales Growth in Q3’14 Q1
Organic Average Daily Sales Growth VPY1 1 Adjusted for Acquisitions, Crown
Bolt Contract Amendment, and Selling Days Note: “VPY” Denotes Versus Prior
Year |

|
|
Operating Leverage 1.8x Operating Leverage in Q3’14 Q1 Operating Leverage1 (VPY%) Q2 Q3 Q4 1.2x 1.5x 0.7x 1.3x nm 1.3x 2.5x 3.6x 1.2x 0.6x 1.2x (6.6x) nm nm 12.2x nm 6.6x 2.9x 1.9x 2.2x 1.1x 2.8x 0.2x nm 2.7x 1.3x 1.2x 1.6x 1.3x 1.7x 2.9x 1.0x 1.8x 3.3x 7.2x 2.6x 10.5x nm 7.7x 4.7x nm 2.7x 2.4x 2.4x 3.1x 1.4x 1.7x 5.1x 12.5x 2.6x FY 1.4x 2.7x 2.5x 4.5x 2.2x 2.7x 3.7x 4.6x 9.2x 4.4x 1.3x 2.0x (2.8x) 3.5x 1.7x 1.6x 2.1x - 2.1x 1.9x 1.6x 2.4x 1.6x 3.7x 2.3x 1.2x 1.5x - 5.2x 2.8x 1 Operating Leverage is Defined as Adjusted EBITDA Growth Divided by Adjusted Net Sales Growth. Adjustments Comprise the 53rd Week in fiscal 2012 and the Crown Bolt Amended Agreement. Not Meaningful (“nm”) when Sales Growth is Negative and when Prior Period Adjusted EBITDA is Negative. Note: “VPY” Denotes Versus Prior Year 1.5x 1.3x 2.4x 2.4x 1.9x 2011 Facil. Maintenance Waterworks Power Solutions Construction & Industrial HD Supply 2012 Facil. Maintenance Waterworks Power Solutions Construction & Industrial HD Supply 2013 Facil. Maintenance Waterworks Power Solutions HD Supply Construction & Industrial 2014 Facil. Maintenance Waterworks Power Solutions HD Supply Construction & Industrial HD Supply 2.0x 1.7x 1.5x 1.8x 1.8x |

|
|
Reconciliation of Non-GAAP Measures: Net Income to Adjusted EBITDA ($ in millions) November 2, 2014 November 3, 2013 Three Months Ended Net income (loss) Interest expense Depreciation and amortization1 Provision from income taxes Stock-based compensation Costs related to public offerings2 Other Adjusted EBTIDA 1 Depreciation and amortization includes amounts recorded within Cost of sales in the Consolidated Statements of Operations 2 Represents the costs expensed in connection with the company’s secondary public offerings in Fiscal Year 2014 $60 115 58 31 3 1 (3) $265 $51 117 62 (8) 4 - - $226 |

|
|
Reconciliation of Non-GAAP Measures: Net Income to Adjusted Net Income ($ in millions, except share and per share amounts) Weighted average common shares outstanding (in thousands) Basic 194,288 191,750 Diluted 200,151 197,392 Adjusted Net Income (Loss) Per Share - Basic $0.57 $0.40 Adjusted Net Income (Loss) Per Share - Diluted $0.55 $0.39 Three Months Ended Net income (loss) Plus: Provision (benefit) for income taxes Less: Cash income taxes Plus: Amortization of acquisition-related intangible assets1 (other than software) Plus: Costs related to public offerings2 Other Adjusted net income (loss) $60 31 (3) 27 1 (5) $111 $51 (8) (1) 34 - - $76 1 Estimated Amortization of acquisition-related intangible assets (other than software) for the remainder of FY’14 is expected to be ~$8M in Q4’14 after reflecting Hardware Solutions as a discontinued operation 2 Represents the costs expensed in connection with the company’s secondary public offerings in Fiscal Year 2014. November 2, 2014 November 3, 2013 |

|
|
Reconciliation of Non-GAAP Measures: Net Income to Adjusted EBITDA and Net Income to Adjusted Net Income 1 Depreciation and amortization includes amounts recorded within Cost of sales in the Consolidated Statements of Operations 2 Represents the costs expensed in connection with the company’s initial public offering, including approximately $18 million paid to the Equity Sponsors for termination of the consulting agreements AS REPORTED REVISION FOR HARDWARE SOLUTIONS REVISED Q1-13 Q2-13 Q3-13 Q4-13 YTD Q1-13 Q2-13 Q3-13 Q4-13 YTD Q1-13 Q2-13 Q3-13 Q4-13 YTD Net income (loss) (131) $ (72) $ 51 $ (66) $ (218) $ - $ - $ - $ - $ - $ (131) $ (72) $ 51 $ (66) $ (218) $ Less Income (loss) from discontinued operations, net of tax (1) (1) - (7) (9) (4) 7 8 - 11 (5) 6 8 (7) 2 Income (loss) from continuing operations (130) (71) 51 (59) (209) 4 (7) (8) - (11) (126) (78) 43 (59) (220) Interest expense 147 145 117 119 528 - - - (1) (1) 147 145 117 118 527 Provision (benefit) for income taxes 43 12 (8) 15 62 (7) 1 3 (1) (4) 36 13 (5) 14 58 Depreciation & Amortization1 60 61 62 62 245 (3) (3) (4) (3) (13) 57 58 58 59 232 Restructuring - - - 12 12 - - - - - - - - 12 12 Stock-based compensation 3 5 4 4 16 - - - - - 3 5 4 4 16 Plus: Loss on extinguishment & modification of debt 41 46 - - 87 - - - - - 41 46 - - 87 Plus: Costs related to Holdings' public offerings2 - 20 - - 20 - - - - - - 20 - - 20 Management fee & related expenses paid to Equity Sponsors 1 1 - - 2 - - - - - 1 1 - - 2 Other - - - 1 1 - - 1 (2) (1) - - 1 (1) - Adjusted EBITDA 165 $ 219 $ 226 $ 154 $ 764 $ (6) $ (9) $ (8) $ (7) $ (30) $ 159 $ 210 $ 218 $ 147 $ 734 $ Net income (loss) (131) $ (72) $ 51 $ (66) $ (218) $ - $ - $ - $ - $ - $ (131) $ (72) $ 51 $ (66) $ (218) $ Less Income (loss) from discontinued operations, net of tax (1) (1) - (7) (9) (4) 7 8 - 11 (5) 6 8 (7) 2 Income (loss) from continuing operations (130) (71) 51 (59) (209) 4 (7) (8) - (11) (126) (78) 43 (59) (220) Plus: Provision (benefit) for income taxes 43 12 (8) 15 62 (7) 1 3 (1) (4) 36 13 (5) 14 58 Less: Cash income taxes (2) (3) (1) (2) (8) - - - - - (2) (3) (1) (2) (8) Plus: Amortization of acquisition-related intangible assets (other than software) 34 33 34 34 135 (2) (1) (1) (2) (6) 32 32 33 32 129 Plus: Loss on extinguishment & modification of debt 41 46 - - 87 - - - - - 41 46 - - 87 Plus: Restructuring - - - 12 12 - - - - - - - - 12 12 Plus: Costs related to Holdings' public offerings2 - 20 - - 20 - - - - - - 20 - - 20 Adjusted net income (loss) (14) $ 37 $ 76 $ - $ 99 $ (5) $ (7) $ (6) $ (3) $ (21) $ (19) $ 30 $ 70 $ (3) $ 78 $ ($ in millions) |

|
|
Reconciliation of Non-GAAP Measures: Net Income to Adjusted EBITDA and Net Income to Adjusted Net Income ($ in millions) AS REPORTED REVISION FOR HARDWARE SOLUTIONS REVISED Q1-14 Q2-14 Q3-14 YTD Q1-14 Q2-14 Q3-14 YTD Q1-14 Q2-14 Q3-14 YTD Net income (loss) (12) $ 48 $ 60 $ 96 $ - $ - $ - $ - $ (12) $ 48 $ 60 $ 96 $ Less Income (loss) from discontinued operations, net of tax (11) - - (11) 3 6 6 15 (8) 6 6 4 Income (loss) from continuing operations (1) 48 60 107 (3) (6) (6) (15) (4) 42 54 92 Interest expense 116 116 115 347 - - - - 116 116 115 347 Provision (benefit) for income taxes 1 22 31 54 - (3) (1) (4) 1 19 30 50 Depreciation & Amortization1 63 66 58 187 (4) (4) (4) (12) 59 62 54 175 Restructuring 3 4 - 7 - - - - 3 4 - 7 Stock-based compensation 5 4 3 12 - - - - 5 4 3 12 Loss on extinguishment & modification of debt 2 - - 2 - - - - 2 - - 2 Costs related to Holdings' public offerings2 1 - 1 2 - - - - 1 - 1 2 Other - (2) (3) (5) - 1 (1) - - (1) (4) (5) Adjusted EBITDA 190 $ 258 $ 265 $ 713 $ (7) $ (12) $ (12) $ (31) $ 183 $ 246 $ 253 $ 682 $ Net income (loss) (12) $ 48 $ 60 $ 96 $ - $ - $ - $ - $ (12) $ 48 $ 60 $ 96 $ Less Income (loss) from discontinued operations, net of tax (11) - - (11) 3 6 6 15 (8) 6 6 4 Income (loss) from continuing operations (1) 48 60 107 (3) (6) (6) (15) (4) 42 54 92 Plus: Provision (benefit) for income taxes 1 22 31 54 - (3) (1) (4) 1 19 30 50 Less: Cash income taxes3 (1) (6) (3) (10) - - - - (1) (6) (3) (10) Plus: Amortization of acquisition-related intangible assets (other than software) 34 34 27 95 (2) (2) (1) (5) 32 32 26 90 Plus: Loss on extinguishment & modification of debt 2 - - 2 - - - - 2 - - 2 Plus: Restructuring 3 4 7 - - - - 3 4 - 7 Plus: Costs related to Holdings' public offerings 1 - 1 2 - - - - 1 - 1 2 Other - - (5) (5) - - - - - - (5) (5) Adjusted net income 39 $ 102 $ 111 $ 252 $ (5) $ (11) $ (8) $ (24) $ 34 $ 91 $ 103 $ 228 $ 1 Depreciation and amortization includes amounts recorded within Cost of sales in the Consolidated Statements of Operations 2 Represents the costs expensed in connection with the company’s secondary public offerings in Fiscal Year 2014 3 Cash income taxes paid in third quarter 2014 and year-to-date 2014 exclude a $27 million payment for the tentative settlement of the IRS's audit of the Company's U.S. federal income tax returns filed for the tax years ended February 3, 2008 and February 1, 2009. |
