Attached files
| file | filename |
|---|---|
| EX-32.1 - CERTIFICATION - Keyuan Petrochemicals, Inc. | f10q0914ex32i_keyuanpetro.htm |
| EX-32.2 - CERTIFICATION - Keyuan Petrochemicals, Inc. | f10q0914ex32ii_keyuanpetro.htm |
| EX-10.2 - TRANSLATION COPY OF LOAN CONTRACT BY AND BETWEEN NINGBO KEYUAN PLASTICS CO., LTD AND PING AN BANK., NING BO BRANCH - Keyuan Petrochemicals, Inc. | f10q0914ex10ii_keyuanpetro.htm |
| EX-31.1 - CERTIFICATION - Keyuan Petrochemicals, Inc. | f10q0914ex31i_keyuanpetro.htm |
| EX-31.2 - CERTIFICATION - Keyuan Petrochemicals, Inc. | f10q0914ex31ii_keyuanpetro.htm |
| EXCEL - IDEA: XBRL DOCUMENT - Keyuan Petrochemicals, Inc. | Financial_Report.xls |
| EX-10.1 - TRANSLATION COPY OF CIRCULATING FUND LOAN CONTRACT BY AND BETWEEN NINGBO KEYUAN PLASTICS CO., LTD AND BANK OF NINGBO., BAIZHANG BRANCH - Keyuan Petrochemicals, Inc. | f10q0914ex10i_keyuan.htm |
U.S. SECURITIES AND EXCHANGE COMMISSION
WASHINGTON, D.C. 20549
FORM 10-Q
(Mark One)
x QUARTERLY REPORT PURSUANT TO SECTION 13 OR 15(d) OF THE SECURITIES EXCHANGE ACT OF 1934
For the quarterly period ended September 30, 2014
o TRANSITION REPORT PURSUANT TO SECTION 13 OR 15(d) OF THE SECURITIES EXCHANGE ACT OF 1934
For the transition period from _______________ to _______________
Commission File Number
Keyuan Petrochemicals, Inc.
(Exact name of registrant as specified in its charter)
| Nevada | 45-0538522 | |
|
(State or other jurisdiction of incorporation or organization) |
(IRS Employer Identification No.) |
Qingshi Industrial Park
Ningbo Economic & Technological Development Zone
Ningbo, Zhejiang Province
P.R. China 315803
(86) 574-8623-2955
(Issuer's telephone number)
(Former address)
Check whether the issuer (1) filed all reports required to be filed by Section 13 or 15(d) of the Exchange Act of 1934 during the past 12 months (or for such shorter period that the registrant was required to file such reports), and (2) has been subject to such filing requirements for the past 90 days. Yes x No o
Indicate by check mark whether the registrant has submitted electronically and posted on its corporate Web site, if any, every Interactive Data File required to be submitted and posted pursuant to Rule 405 of Regulation S-T (Sec. 232.405 of this chapter) during the preceding 12 months (or for such shorter period that the registrant was required to submit and post such files). Yes x No o
Indicate by check mark whether the registrant is a large accelerated filer, an accelerated filer or a non-accelerated filer. See definition of “accelerated filer and large accelerated filer” in Rule 12b-2 of the Exchange Act. (Check one)
| Large Accelerated Filer | o | Accelerated Filer | o |
| Non-accelerated filer | o | Smaller reporting company | x |
Indicate by check mark whether the registrant is a shell company (as defined in Rule 12b-2 of the Securities Exchange Act of 1934) Yes o No x
As of December 3, 2014, the Registrant has 57,335,736 shares of common stock outstanding and 5,333,340 shares of Series B Preferred Stock outstanding.
TABLE OF CONTENTS
| PART I – FINANCIAL INFORMATION | ||
| Item 1. | Financial Statements | 4 |
| Condensed Consolidated Balance Sheets | 4 | |
| Condensed Consolidated Statements of Comprehensive Income (Loss) | 5 | |
| Condensed Consolidated Statements of Cash Flows | 6 | |
| Notes to Condensed Consolidated Financial Statements | 7 -17 | |
| Item 2. | Management’s Discussion and Analysis or Plan of Operation | 18 |
| Item 3. | Quantitative and Qualitative Disclosures About Market Risk | 34 |
| Item 4. | Controls and Procedures | 35 |
| PART II – OTHER INFORMATION | 36 | |
| Item 1. | Legal Proceedings | 36 |
| Item 1A. | Risk Factors | 36 |
| Item 2. | Unregistered Sales of Equity Securities And Use Of Proceeds | 37 |
| Item 3. | Defaults Upon Senior Securities | 37 |
| Item 4. | Mine Safety Disclosures | 37 |
| Item 5. | Other Information | 37 |
| Item 6. | Exhibits | 38 |
INTRODUCTORY NOTE
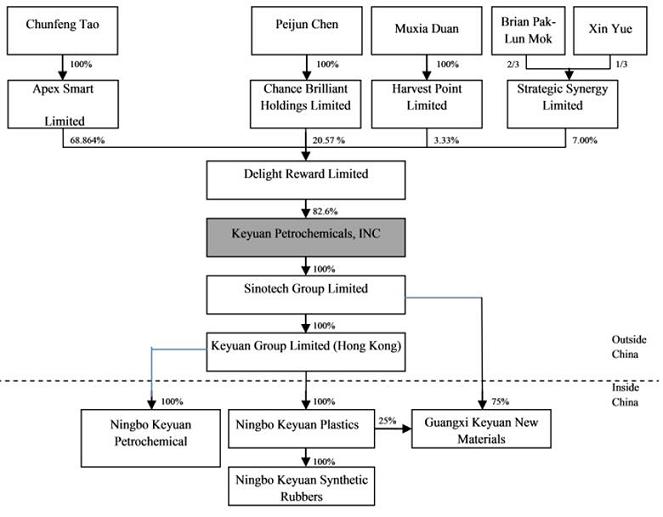
Except as otherwise indicated by the context, references in this Quarterly Report on Form 10-Q (this “Form 10-Q”) to the “Company,” “Keyuan” “we,” “us” or “our” are references to the combined business of Keyuan Petrochemicals, Inc. and its consolidated subsidiaries. References to “Sinotech Group” are references to our wholly-owned subsidiary, Sinotech Group Limited, previously known as Keyuan International Group Limited”; references to “Keyuan HK” are references to our wholly-owned subsidiary, Keyuan Group Limited; references to “Ningbo Keyuan” are references to our wholly-owned subsidiary, Ningbo Keyuan Plastics Co., Ltd.; references to “Ningbo Keyuan Petrochemicals” are to our wholly-owned subsidiary, Ningbo Keyuan Petrochemicals Co., Ltd; references to “Keyuan Synthetic Rubbers” are references to our wholly-owned subsidiary, Ningbo Keyuan Synthetic Rubbers Co., Ltd.; references to “Guangxi Keyuan” are references to our wholly-owned subsidiary, Guangxi Keyuan New Materials Co., Ltd. References to “China” or “PRC” are references to the People’s Republic of China. References to “RMB” are to Renminbi, the legal currency of China, and all references to “$” and dollar are to the U.S. dollar, the legal currency of the United States.
Special Note Regarding Forward-Looking Statements
This report contains forward-looking statements and information that are based on the beliefs of our management as well as assumptions made by and information currently available to us. Such statements should not be unduly relied upon. When used in this report, forward-looking statements include, but are not limited to, the words “anticipate,” “believe,” “estimate,” “expect,” “intend,” “plan” and similar expressions, as well as statements regarding new and existing products, technologies and opportunities, statements regarding market and industry segment growth and demand and acceptance of new and existing products, any projections of sales, earnings, revenue, margins or other financial items, any statements of the plans, strategies and objectives of management for future operations, any statements regarding future economic conditions or performance, uncertainties related to conducting business in China, any statements of belief or intention, and any statements or assumptions underlying any of the foregoing. These statements reflect our current view concerning future events and are subject to risks, uncertainties and assumptions. There are important factors that could cause actual results to vary materially from those described in this report as anticipated, estimated or expected, including, but not limited to: competition in the industry in which we operate and the impact of such competition on pricing, revenues and margins, volatility in the securities market due to the general economic downturn; Securities and Exchange Commission (the “SEC”) regulations which affect trading in the securities of “penny stocks,” and other risks and uncertainties. Except as required by law, we assume no obligation to update any forward-looking statements publicly, or to update the reasons actual results could differ materially from those anticipated in any forward- looking statements, even if new information becomes available in the future. Depending on the market for our stock and other conditional tests, a specific safe harbor under the Private Securities Litigation Reform Act of 1995 may be available. Notwithstanding the above, Section 27A of the Securities Act of 1933, as amended (the “Securities Act”) and Section 21E of the Securities Exchange Act of 1934, as amended (the “Exchange Act”) expressly state that the safe harbor for forward-looking statements does not apply to companies that issue penny stock. Because we may from time to time be considered to be an issuer of penny stock, the safe harbor for forward-looking statements may not apply to us at certain times.
PART I – FINANCIAL INFORMATION
KEYUAN PETROCHEMICALS, INC. AND SUBSIDIAIRES
CONDENSED CONSOLIDATED BALANCE SHEETS
(Amounts in thousands, except share data)
| Note | September 30, 2014 | December 31, 2013 | ||||||||
| (Unaudited) | ||||||||||
| ASSETS | ||||||||||
| Current assets: | ||||||||||
| Cash | $ | 2,129 | $ | 12,309 | ||||||
| Pledged bank deposits | 449,555 | 336,363 | ||||||||
| Bills receivable | 81 | 25 | ||||||||
| Accounts receivable | 366 | 7,517 | ||||||||
| Inventories | 3 | 78,282 | 69,914 | |||||||
| Prepayments to suppliers | 27,391 | 33,842 | ||||||||
| Consumption tax recoverable | 4 | 9,521 | 46,072 | |||||||
| Amounts due from related parties | 14 | 44 | 43 | |||||||
| Other current assets | 5 | 78,303 | 65,189 | |||||||
| Deferred income tax assets | 8 | 3,960 | 2,641 | |||||||
| Total current assets | 649,632 | 573,915 | ||||||||
| Property, plant and equipment, net | 326,923 | 285,506 | ||||||||
| Intangible assets, net | 869 | 986 | ||||||||
| Land use rights | 10,236 | 10,663 | ||||||||
| Long-term prepayment | 10,049 | 3,012 | ||||||||
| Total assets | $ | 997,709 | $ | 874,082 | ||||||
| LIABILITIES AND STOCKHOLDERS’ EQUITY | ||||||||||
| Current Liabilities: | ||||||||||
| Short-term bank borrowings | 6 | $ | 601,091 | $ | 424,436 | |||||
| Bills payable | 235,929 | 261,524 | ||||||||
| Accounts payable | 28,244 | 59,043 | ||||||||
| Amounts due to related parties | 14 | 21 | - | |||||||
| Advances from customers | 16,492 | 10,820 | ||||||||
| Accrued expenses and other payables | 32,764 | 23,767 | ||||||||
| Income tax payable | 8 | 562 | 1,849 | |||||||
| Dividends payable | 2,382 | 2,382 | ||||||||
| Total liabilities, all current | 917,485 | 783,821 | ||||||||
| Series B convertible preferred stock: | ||||||||||
| Par value: $0.001; Authorized: 8,000,000 shares issued and outstanding: 5,333,340 shares, liquidation preference $20,250 | | 16,868 | 16,868 | |||||||
| Commitments and contingencies | 7 | - | - | |||||||
| Stockholders’ equity: | ||||||||||
| Common stock: | ||||||||||
| Par value: $0.001; Authorized: 100,000,000 shares Issued 57,646,160; outstanding: 57,335,736 and 57,520,012 shares, as at September 30, 2014 and December 31, 2013, respectively | | 58 | 58 | |||||||
| Additional paid-in capital | 51,555 | 51,555 | ||||||||
| Statutory reserve | 5,749 | 5,749 | ||||||||
| Accumulated other comprehensive income | 9,793 | 10,245 | ||||||||
| Retained earnings | (3,489 | ) | 5,929 | |||||||
| Treasury stock, at cost, 310,424 and 126,148 shares at September 30, 2014 and December 31, 2013, respectively | (310 | ) | (143 | ) | ||||||
| Total stockholders’ equity | 63,356 | 73,393 | ||||||||
| Total liabilities and stockholders’ equity | $ | 997,709 | $ | 874,082 | ||||||
See accompanying notes to the consolidated financial statements.
| 4 |
KEYUAN PETROCHEMICALS, INC. AND SUBSIDIARIES
CONDENSED CONSOLIDATED STATEMENTS OF COMPREHENSIVE INCOME (LOSS) (UNAUDITED)
(Amounts in thousands, except share and per share data)
| Three Months Ended September 30, | Nine Months Ended September 30, | |||||||||||||||
| 2014 | 2013 | 2014 | 2013 | |||||||||||||
| Sales | $ | 135,678 | $ | 150,286 | $ | 522,108 | $ | 453,775 | ||||||||
| Cost of sales | 132,000 | 140,030 | 501,596 | 432,389 | ||||||||||||
| Gross profit | 3,678 | 10,256 | 20,512 | 21,386 | ||||||||||||
| Selling expenses | 405 | 466 | 1,031 | 869 | ||||||||||||
| General and administration expenses | 3,121 | 3,397 | 9,868 | 8,988 | ||||||||||||
| Total operating expenses | 3,526 | 3,863 | 10,899 | 9,857 | ||||||||||||
| Income from operations | 152 | 6,393 | 9,613 | 11,529 | ||||||||||||
| Other income (expense): | ||||||||||||||||
| Interest income | 3,344 | 2,461 | 9,225 | 6,363 | ||||||||||||
| Interest expense | (7,791 | ) | (4,481 | ) | (19,378 | ) | (14,601 | ) | ||||||||
| Foreign exchange (loss) gain, net | (396 | ) | 1,044 | (4,534 | ) | 7,249 | ||||||||||
| Other expense, net | (1,554 | ) | (1,342 | ) | (4,420 | ) | (2,437 | ) | ||||||||
| Total other expense | (6,397 | ) | (2,318 | ) | (19,107 | ) | (3,426 | ) | ||||||||
| (Loss) income before income taxes | (6,245 | ) | 4,075 | (9,494 | ) | 8,103 | ||||||||||
| Income tax (benefit) expense | (586 | ) | 1,284 | (76 | ) | 2,891 | ||||||||||
| Net (loss) income attributable to Keyuan Petrochemicals Inc. stockholders | (5,659 | ) | 2,791 | (9,418 | ) | 5,212 | ||||||||||
| Dividends to Series B convertible preferred stockholders | - | 548 | - | 548 | ||||||||||||
| Net (loss) income attributable to Keyuan Petrochemicals Inc. common stockholders | $ | (5,659 | ) | $ | 2,243 | $ | (9,418 | ) | $ | 4,664 | ||||||
| Net (loss) income attributable to Keyuan Petrochemicals Inc. stockholders | $ | (5,659 | ) | $ | 2,791 | $ | (9,418 | ) | $ | 5,212 | ||||||
| Other comprehensive income: | ||||||||||||||||
| Foreign currency translation adjustment | 8 | 538 | (451 | ) | 2,170 | |||||||||||
| Comprehensive (loss) income | $ | (5,651 | ) | $ | 3,329 | $ | (9,869 | ) | $ | 7,382 | ||||||
| (Loss) earnings per share: | ||||||||||||||||
| Attributable to common stock: | ||||||||||||||||
| -Basic | $ | (0.10 | ) | $ | 0.05 | $ | (0.16 | ) | $ | 0.09 | ||||||
| -Diluted | $ | (0.10 | ) | $ | 0.04 | $ | (0.16 | ) | $ | 0.08 | ||||||
| Weighted average number of shares of common stock used in calculation: | ||||||||||||||||
| -Basic | 57,367,715 | 57,646,160 | 57,381,027 | 57,646,160 | ||||||||||||
| -Diluted | 57,367,715 | 62,979,500 | 57,381,027 | 62,579,500 | ||||||||||||
See accompanying notes to the consolidated financial statements.
| 5 |
KEYUAN PETROCHEMICALS, INC. AND SUBSIDIARIES
CONDENSED CONSOLIDATED STATEMENTS OF CASH FLOWS (UNAUDITED)
(Amounts in thousands, except share data)
| Nine months ended September 30, | ||||||||
| 2014 | 2013 | |||||||
| Cash flows from operating activities: | ||||||||
| Net (loss) income | $ | (9,418 | ) | $ | 5,212 | |||
| Adjustments to reconcile net (loss) income to net cash used in operating activities: | ||||||||
| Depreciation | 10,265 | 8,865 | ||||||
| Amortization | 111 | 85 | ||||||
| Land use rights amortization | 349 | 344 | ||||||
| Deferred income tax (benefit) expense | (1,339 | ) | 726 | |||||
| Share-based compensation expense | - | 871 | ||||||
| Changes in operating assets and liabilities: | ||||||||
| Bills receivable | (57 | ) | (5,191 | ) | ||||
| Accounts receivable | 7,144 | 1,735 | ||||||
| Inventories | (8,895 | ) | (14,496 | ) | ||||
| Prepayments to suppliers | (857 | ) | (27,494 | ) | ||||
| Consumption tax refund receivable | 36,261 | 21,397 | ||||||
| Other current assets | (13,301 | ) | (1,892 | ) | ||||
| Accounts payable | (30,060 | ) | (48,482 | ) | ||||
| Accounts payable – related parties | (332 | ) | (1,537 | ) | ||||
| Advances from (to) customers | 5,722 | 8,424 | ||||||
| Income taxes payable | (1,275 | ) | (1,356 | ) | ||||
| Accrued expenses and other payables | 3,511 | (4,202 | ) | |||||
| Net cash used in operating activities | (2,171 | ) | (56,991 | ) | ||||
| Cash flows from investing activities: | ||||||||
| Purchase of property, plant and equipment | (48,337 | ) | (44,765 | ) | ||||
| Net cash used in investing activities | (48,337 | ) | (44,765 | ) | ||||
| Cash flow from financing activities: | ||||||||
| Pledged bank deposits used for bank borrowings | (115,814 | ) | (144,593 | ) | ||||
| Proceeds from short-term bank borrowings | 1,044,794 | 860,430 | ||||||
| Repayment of short-term bank borrowings | (864,785 | ) | (780,146 | ) | ||||
| Proceeds from bank notes | 502,882 | 340,186 | ||||||
| Repayments of bank notes | (526,592 | ) | (173,839 | ) | ||||
| Repurchase of treasury stock | (168 | ) | - | |||||
| Net cash provided by financing activities | 40,317 | 102,038 | ||||||
| Effect of foreign currency exchange rate changes on cash | 11 | (46 | ) | |||||
| Net decrease in cash | (10,180 | ) | 236 | |||||
| Cash at beginning of period | 12,309 | 23,378 | ||||||
| Cash at end of period | $ | 2,129 | $ | 23,614 | ||||
| Supplemental disclosure of cash flow information: | ||||||||
| Income tax paid | $ | 2,596 | $ | 3,521 | ||||
| Interest paid, net of capitalized interest | $ | 15,166 | $ | 15,497 | ||||
| Non cash investing and financing activities: | ||||||||
| Payable for purchase of property, plant and equipment (net of VAT) | $ | 5,302 | $ | 8,938 | ||||
See accompanying notes to the consolidated financial statements.
| 6 |
| 1 | ORGANIZATION AND NATURE OF BUSINESS, RECENT EVENTS, AND GOING CONCERN AND MANAGEMENT’S PLANS |
(a) Organization and Nature of business
Keyuan Petrochemicals, Inc. (the “Company”) was incorporated in the State of Texas on May 4, 2004 in the former name of Silver Pearl Enterprises, Inc. The Company, through its wholly-owned subsidiary, Sinotech Group Limited (“Sinotech”) and its indirect subsidiaries, Keyuan Group Limited (“Keyuan HK”), Ningbo Keyuan Plastics Co., Ltd. (“Ningbo Keyuan”), Ningbo Keyuan Petrochemicals Co., Ltd. (Ningbo Keyuan Petrochemicals), Ningbo Keyuan Synthetic Rubbers Co., Ltd. (“Ningbo Keyuan Synthetic Rubbers”), and Guangxi Keyuan New Materials Co., Ltd. (“Guangxi Keyuan”) (collectively referred herein below as “the Group” ) are engaged in the manufacture and sale of petrochemical and rubber products in the People’s Republic of China (“PRC”).
(b) Other Events
On July 2, 2013, the United District Court for the District of Columbia issued a final judgment approving a settlement reached between the Company and the Securities and Exchange Commission (“SEC”). The settlement was reached on February 28, 2013 in a case filed by the SEC in the United States District Court for the District of Columbia against the Company, alleging it violated Sections 17(a)(2) and 17(a)(3) of the Securities Act of 1933, Sections 13(a), 13(b)(2)(A) and 13(b)(2)(B) of the Securities Exchange Act of 1934, and Rules 12b-20 and 13a-13 thereunder. Under the terms of the settlement, the Company, without admitting or denying the allegation of the complaint, paid a civil penalty of $1million and was permanently enjoined from violating certain securities law.
(c) Going concern and management’s plans
The consolidated financial statements have been prepared assuming that the Company will continue as a going concern. The Company reported a net loss and cash flows used in operations of approximately $9.4 million and $2.2 million, respectively, for the nine months ended September 30, 2014 and net income and cash flows used in operations of approximately $4.1 million and $53.1 million, respectively, for the year ended December 31, 2013. At September 30, 2014 and December 31, 2013, the Company had a working capital deficit of approximately $268 million and $210 million, respectively. These factors raise substantial doubt about the Company’s ability to continue as a going concern. The accompanying consolidated financial statements do not include any adjustments relating to the recoverability or classification of assets, or the amounts and classification of liabilities that may result should the Company be unable to continue as a going concern.
The Company continues to finance its operations primarily through short-term bank borrowings. Short-term bank borrowings and bills payable amounted to approximately $837 million at September 30, 2014. Management expects that short-term bank financing will continue to be available through at least September 30, 2015.
The Company continues to benefit from favorable PRC tax policies related to consumption tax (Note 4) of which approximately $9.5 million was refundable at September 30, 2014. Approximately $4.5 million was refunded in October and November 2014, and management expects that approximately $5 million will be deductible against future consumption tax obligations. In addition, management expects VAT of $30 million to be refunded in late 2014.
The ability of the Company to continue as a going concern is dependent upon management’s ability to implement its strategic plan, obtain additional capital and generate net income and positive cash flows from operations. There can be no assurance that these plans will be sufficient or that additional financing will be available in amounts or terms acceptable to the Company, if at all.
| 7 |
| 2 | BASIS OF PRESENTATION |
The accompanying unaudited condensed consolidated financial statements have been prepared in accordance with U.S. generally accepted accounting principles (U.S. GAAP) and include the financial statements of the Company and its subsidiaries. All intercompany balances and transactions are eliminated in consolidation. The financial statements have been prepared in accordance with U.S. GAAP applicable to interim financial information and the requirements of Form 10-Q and Article 10 of Regulation S-X of the Securities and Exchange Commission. Accordingly, they do not include all of the information and disclosures required by accounting principles generally accepted in the United States of America for complete financial statements. These interim financial statements should be read in conjunction with the audited financial statements for the years ended December 31, 2013 and 2012, as not all disclosures required by generally accepted accounting principles for annual financial statements are presented. The interim financial statements follow the same accounting policies and methods of computation as the audited financial statements for the years ended December 31, 2013 and 2012. Interim results are not necessarily indicative of results for a full year. In the opinion of management, all adjustments, consisting of normal recurring adjustments, considered necessary for a fair presentation of the financial position and the results of operations and cash flows for the interim periods have been included.
| 3 | INVENTORIES |
Inventories consist of the following:
| September 30, | December 31, | |||||||
| 2014 | 2013 | |||||||
| ($’000) | ($’000) | |||||||
| (Unaudited) | ||||||||
| Raw materials | $ | 45,648 | $ | 37,747 | ||||
| Finished goods | 30,748 | 30,823 | ||||||
| Work-in-process | 1,886 | 1,344 | ||||||
| Total | $ | 78,282 | $ | 69,914 | ||||
| 4 | CONSUMPTION TAX REFUND RECEIVABLE |
The PRC government enacted regulations pursuant to which domestically purchased heavy oil to be used for producing ethylene and aromatics products was exempted from consumption tax. In addition, the consumption tax paid for imported heavy oil is to be refunded if it is used for producing ethylene and aromatics products. Given all the Group’s purchased heavy oils are, or are to be, used for producing ethylene and aromatics products, the Group recognizes a consumption tax recoverable when a consumption tax for heavy oils has been paid and the relevant heavy oils have been used for production of ethylene and aromatics products. At September 30, 2014 and December 31, 2013, the Group recorded an estimated consumption tax recoverable amounting to approximately $9.5 million and $46.1 million, respectively.
In October and November 2014, a refund of approximately $4.5 million was received. In addition, management expects that approximately $5 million will be deductible against future consumption tax obligations.
| 8 |
| 5 | OTHER CURRENT ASSETS |
Other current assets consist of the following:
| September 30, | December 31, | |||||||
| 2014 | 2013 | |||||||
| ($’000) | ($’000) | |||||||
| (Unaudited) | ||||||||
| VAT recoverable | $ | 65,574 | $ | 56,667 | ||||
| Customs deposits for imported inventories | 6,395 | 3,680 | ||||||
| Other | 6,334 | 4,842 | ||||||
| $ | 78,303 | $ | 65,189 | |||||
Management estimates the deductible input VAT using vendor contracts, engineering and other estimates, as well as historical experience. Approximately $2.4 million was included in non-current assets as of September 30, 2014 and December 31, 2013, respectively. Management expects that VAT of $30 million will be refunded in late 2014.
Customs deposits for imported inventories represent amounts paid to the local customs office in connection with the import of raw materials inventories. Upon approval by the customs authorities, these amounts become refundable by the local tax authority and are reclassified as consumption tax refund receivable (Note 4).
| 6 | SHORT-TERM BANK BORROWINGS |
As of September 30, 2014, short−term bank borrowings outstanding carried a weighted average interest rate of 6.18% (2013: 6.25%) for bank loans in RMB; and a weighted average interest rate of 3.62% (2013: 2.52%) for bank loans in USD, and had maturity terms ranging from two to twelve months and interest rates ranging from 1.96% to 6.72% (2013: 1.0% to 7.2%).
| 9 |
Short-term bank borrowings consist of the following:
| September 30, | December 31, | |||||||||||||||
| 2014 | 2013 | |||||||||||||||
| SHORT-TERM BANK BORROWINGS | PLEDGED BANK DEPOSITS | SHORT-TERM BANK BORROWINGS | PLEDGED BANK DEPOSITS | |||||||||||||
| ($’000) | ($’000) | ($’000) | ($’000) | |||||||||||||
| (Unaudited) | (Unaudited) | |||||||||||||||
| China Construction Bank | $ | 156,848 | $ | 101,865 | $ | 102,995 | $ | 43,000 | ||||||||
| Shanghai Pudong Development Bank | 46,180 | 28,845 | 32,529 | 9,000 | ||||||||||||
| Agricultural Bank of China | 42,890 | 24,098 | 32,770 | 20,000 | ||||||||||||
| Pingan Bank | 35,061 | 35,694 | 21,635 | 23,000 | ||||||||||||
| Bank of Ningbo | 29,974 | 18,029 | 30,052 | 1,000 | ||||||||||||
| Bank of Communication | 31,149 | 13,658 | 24,416 | 3,000 | ||||||||||||
| Bank of China | 178,704 | 106,367 | 137,309 | 78,000 | ||||||||||||
| China Merchant Bank | 38,955 | 18,411 | 33,249 | 23,000 | ||||||||||||
| Ningbo Commerce Bank | 16,151 | 16,689 | 4,990 | 5,000 | ||||||||||||
| Bank of Hangzhou | 4,758 | 23 | - | - | ||||||||||||
| China Minsheng Bank | 13,422 | 11,223 | - | - | ||||||||||||
| Export-Import Bank of China | 6,999 | - | - | - | ||||||||||||
| China Guangfa Bank | - | - | 4,491 | 5,000 | ||||||||||||
| Bank deposits pledged for bills payable | - | 74,653 | - | 126,363 | ||||||||||||
| Total | $ | 601,091 | $ | 449,555 | $ | 424,436 | $ | 336,363 | ||||||||
Among the Group's short-term borrowings as of September 30, 2014, $254 million was guaranteed by related party and third-party entities and individuals.
| 7 | SERIES B CONVERTIBLE PREFERRED STOCK AND WARRANTS EXTENSION |
On September 9, 2014, the Company and Dragon State International Limited (“Dragon State”) agreed to amend certain terms in the Certificate of Designations, Preferences and Rights of the Series B Convertible Preferred Stock, Series C Warrant and Series D Warrant (the “Amendments”), which were issued pursuant to the Securities Purchase Agreement dated September 28, 2010.
Pursuant to the Amendments, i) the date of Maturity (a.k.a. the date of Mandatory Conversion) of the Series B Convertible Preferred Stock was extended from September 28, 2014 to October 31, 2014; ii) the term of the Series C Warrant was extended from September 28, 2014 to October 31, 2014; and iii) the term of the Series D Warrant was extended from September 28, 2014 to October 31, 2014.
The Company considered the fair value of the Series B Convertible Preferred Stock, the Series C Warrants and the Series D Warrants immediately before and after the Amendments and determined that the Amendments constitute modification of the Series B Convertible Preferred Stock, the Series C Warrants and the Series D Warrants, resulting in the transfer of value from the Company’s common shareholders to the Series B Preferred shareholders. The estimated fair value of the value transferred was not significant.
The fair value was estimated using the Black Scholes option-pricing model utilizing the following assumptions: stock price of $1.00 per share; no dividends; a risk free rate of 0.1%, which equals the one -year yield on Treasury bonds at constant (or fixed); and volatility of 140.38%.
| 8 | COMMITMENTS AND CONTINGENCIES |
(a) Operating commitments
The Group had outstanding Letters of Credit as of September 30, 2014 of approximately $114 million.
(b) Capital commitments
As of September 30, 2014, the Group had contractual capital commitments of approximately $8.8 million for purchases of equipment. The capital commitments relate primarily to manufacturing equipment enhancements.
(c) Contingency
The Company, with its PRC legal counsel, evaluated the matters identified in a 2010 Independent Investigation to determine the extent to which the Company may be exposed to fines and penalties in China. The Independent Investigation was conducted by the Audit Committee, and identified, among other matters, possible violations of PRC or U.S. laws. The Company has concluded that the extent to which it may be exposed to fines and penalties in the PRC is limited, and to date, has not received any PRC governmental or regulatory communication or inquiry related to these matters. However, management is currently unable to determine the final outcome of these matters and their possible effects on the consolidated financial statements.
| 10 |
| 9 | INCOME TAXES |
The provision for income taxes is recorded at the end of each interim period based on the Company’s best estimate of its effective income tax rate expected to be applicable for the full fiscal year. The Company’s expected effective tax rate for 2014 is approximately 10%. The lower effective rate for the nine months ended September 30, 2014 is primarily due to losses in non-PRC jurisdictions, the benefit of which is not expected to be realized. The Company paid income taxes of approximately $0.7 million and $2.6 million, respectively during the three months and nine months ended September 30, 2014.
| 10 | EARNING (LOSS) PER SHARE |
The following table sets forth the computation of basic net income per share:
| Three months ended September 30 | Nine months ended September 30 | |||||||||||||||
| 2014 | 2013 | 2014 | 2013 | |||||||||||||
| ($’000) | ($’000) | ($’000) | ($’000) | |||||||||||||
| (Unaudited) | (Unaudited) | (Unaudited) | (Unaudited) | |||||||||||||
| Basic earnings per share: | ||||||||||||||||
| Net (loss) income attributable to Keyuan | ||||||||||||||||
| Petrochemicals, Inc. stockholders | $ | (5,659 | ) | $ | 2,243 | $ | (9,418 | ) | $ | 4,664 | ||||||
| Fixed dividends to Series B convertible | ||||||||||||||||
| Preferred stockholders | - | 548 | - | 548 | ||||||||||||
| Net (loss) income contributable to Keyuan | ||||||||||||||||
| Petrochemicals Inc. common stockholders | $ | (5,659 | ) | $ | 2,791 | $ | (9,418 | ) | $ | 5,212 | ||||||
| Weighted average common share | ||||||||||||||||
| (Denominator for basic income per share) | 57,367,715 | 57,646,160 | 57,381,027 | 57,646,160 | ||||||||||||
| Effect of diluted securities: | ||||||||||||||||
| -Series B convertible preferred stock | - | 5,333,340 | 5,333,340 | |||||||||||||
| -Warrants | - | - | - | - | ||||||||||||
| -Options | - | - | - | - | ||||||||||||
| 57,367,715 | 62,979,500 | 57,381,027 | 62,979,500 | |||||||||||||
| Basic net income (loss) per share: | $ | (0.10 | ) | $ | 0.05 | $ | (0.16 | ) | $ | 0.09 | ||||||
| Diluted net income (loss) per share: | $ | (0.10 | ) | $ | 0.04 | $ | (0.16 | ) | $ | 0.08 | ||||||
The following table represents the warrants and options excluded from the calculation of diluted earnings per share:
| September 30, 2014 | September 30, 2013 | |||||||
| Warrants | 4,394,468 | 4,396,118 | ||||||
| Options | 3,490,000 | 3,490,000 | ||||||
| 11 | STOCK REPURCHASE PROGRAM |
On September 22, 2014, the Board of Directors authorized the termination of a repurchase program that was commenced on December 31, 2012 to repurchase of up to $2 million of its common stock at a price of up to $1.50 per share. The Company purchased 425,110 shares of common stock through the stock repurchase program.
| 11 |
| 12 | FAIR VALUE MEASUREMENTS |
The Company did not have any assets and liabilities that are measured at fair value on a recurring basis as of September 30, 2014 and 2013.
The fair values of cash, bills receivable, accounts receivable, bills payable, and accounts payable approximate their respective carrying amounts due to their short-term nature. The fair value of pledged bank deposits and short-term bank borrowings approximate their carrying amount because of their varying interest rates and/or their short maturities. Amounts due to related parties are not practicable to estimate due to the related party nature of the underlying transactions.
| 13 | SIGNIFICANT CONCENTRATIONS AND RISKS |
At September 30, 2014 and December 31, 2013, the Group held cash and pledged bank deposits in financial institutions of approximately $451 million and $349 million, respectively. They were primarily held in major financial institutions located in mainland China and the Hong Kong Special Administrative Region, which management believes have high credit ratings.
During the nine months ended September 30, 2014 and the three and nine months ended September 30 2013, no sales to individual customers exceeded 10% of the Group’s total net revenue. During the three months ended September 30, 2014, sales to major customers, which individually exceeded 10% of the Group’s total net revenue, were as follows:
Three months ended September 30, 2014 | ||||||||
| Largest Customers | Amount of Sales | % Total Sales | ||||||
| ($’000) | ||||||||
| (Unaudited) | (Unaudited) | |||||||
| Customer A | $ | 26,760 | 20 | % | ||||
| Customer B | $ | 14,503 | 11 | % | ||||
The Group currently buys a majority of its heavy oil, an important component of its products, from one supplier. Although there are a limited number of suppliers of the particular heavy oil used in production, management believes that other suppliers could provide similar heavy oil on comparable terms. A change in suppliers, however, could cause a delay in manufacturing and a possible loss of sales, which would affect operating results adversely. The Company’s largest supplier accounted for approximately $73 million and $79.8 million, or 49% and 61% of total purchases for the three months ended September 30, 2014 and 2013, respectively. The Company’s largest supplier accounted for approximately $315 million and $265.7 million, or 62% and 61% of total purchases for the nine months ended September 30, 2014 and 2013, respectively.
The Company commenced trading of heavy oil in April 2013, whereby the Company functions as an agent on behalf of a Hong-Kong based customer. For the three months ended September 30, 2014 and 2013, the trading of heavy oil consists of purchases of approximately $102.6 million and $142.3 million, respectively, and sales of approximately $101.8 million and $141.7 million, respectively, resulting in a loss of $0.8 million and $0.6 million, respectively, that has been included in cost of sales in the condensed consolidated statements of comprehensive income. For the nine months ended September 30, 2014, the trading of heavy oil consists of purchases of approximately $272.6 million, and sales of approximately $270.7 million, resulting in a loss of $1.9 million, that has been included in cost of sales in the condensed consolidated statement of comprehensive income.
The Group’s operations are carried out in the PRC. Accordingly, the Group’s business, financial condition and results of operations may be influenced by the political, economic and legal environments in the PRC, as well as by the general state of the PRC’s economy. The business may be influenced by changes in governmental policies with respect to laws and regulations, anti-inflationary measures, currency conversion and remittances abroad, and rates and methods of taxation, among other things.
| 12 |
| 14 | RELATED PARTY TRANSACTIONS AND RELATIONSHIPS AND TRANSACTIONS WITH CERTAIN OTHER PARTIES |
(A) Related Party Transactions
The Company considers all transactions with the following parties to be related party transactions.
| Name of parties | Relationship | |
| Mr. Chunfeng Tao | Majority stockholder | |
| Mr. Jicun Wang | Principal stockholder | |
| Mr. Peijun Chen | Principal stockholder | |
| Ms. Sumei Chen | Member of the Company’s Board of Supervisors and spouse of Mr. Wang | |
| Ms. Yushui Huang | Vice President of Administration, Ningbo Keyuan | |
| Ningbo Pacific Ocean Shipping Co., Ltd (Ningbo Pacific) | 100% ownership by Mr. Wang | |
| Ningbo Xinhe Logistic Co., Ltd (Ningbo Xinhe) | 10% ownership by Ms. Huang |
Related party transactions and amounts outstanding with the related parties as of and for the three and nine months ended September 30, 2014 and 2013, are summarized as follows:
| Three months ended September 30 | Nine months ended September 30 | |||||||||||||||
| 2014 | 2013 | 2014 | 2013 | |||||||||||||
| ($’000) | ($’000) | ($’000) | ($’000) | |||||||||||||
| (Unaudited) | (Unaudited) | (Unaudited) | (Unaudited) | |||||||||||||
| Purchase of transportation services (a) | $ | 423 | $ | - | $ | 2,327 | $ | 1,045 | ||||||||
| Loan guarantee fee (b) | $ | - | $ | 43 | $ | - | $ | 85 | ||||||||
| September, 2014 | December 31, 2013 | |||||||
| ($’000) | ($’000) | |||||||
| (Unaudited) | ||||||||
| Amounts due to related parties (c) | $ | 21 | $ | 369 | ||||
| Advance payments to these parties (d) | $ | 44 | $ | 55 | ||||
(a) The Group purchased transportation services of approximately $0.4 million and nil from Ningbo Xinhe during the three months ended September 30, 2014 and 2013, respectively. The Group purchased transportation services of $2.3 million and $1.0 million from Ningbo Xinhe during the nine months ended September 30, 2014 and 2013, respectively.
| 13 |
(b) Guarantees for Bank Loans
Beginning in 2011, loan guarantee fees of 0.3% of the loan principal guaranteed are to be paid quarterly. During the three months ended September 30, 2014 and 2013, loan guarantee fees were approximately nil and $0.04 million for Ningbo Pacific, respectively. During the nine months ended September 30, 2014 and 2013, loan guarantee fees were nil and $0.09 million for Ningbo Pacific, respectively.
(c) Amounts due to related parties consist of the following.
| September 30, 2014 | December 31, 2013 | |||||||
| ($’000) | ($’000) | |||||||
| (Unaudited) | ||||||||
| Ningbo Xinhe (Transportation expenses) | $ | 21 | $ | 369 | ||||
(d) Advance payments to these parties consist of the following.
| September 30, 2014 | December 31, 2013 | |||||||
| ($’000) | ($’000) | |||||||
| (Unaudited) | (Unaudited) | |||||||
| Ningbo Xinhe | $ | - | $ | 12 | ||||
| Mr. Tao | 44 | 43 | ||||||
| Total | $ | 44 | $ | 55 | ||||
(B) Relationships and transactions with certain other parties
The Group has following relationships and transactions with certain other parties:
| Name of parties | Relationship | |
| Ningbo Litong Petrochemical Co., Ltd (Ningbo Litong) | Former 12.75% nominee shareholder of Ningbo Keyuan | |
| Ningbo Anqi Petrochemical Co., Ltd (Ningbo Anqi) | A related party through September 2011 when control transferred | |
| Ningbo Lide Investment Co., Ltd. (Ningbo Lide) | A related party through September 2011 when control transferred | |
| Ningbo Kunde Petrochemical Co, Ltd. (Ningbo Kunde) | A related party through September 2011 when control transferred |
Transactions and amounts outstanding with these parties for the three and nine months ended September 30, 2014 and 2013 are summarized as follows:
| Three months ended September 30 | Nine months ended September 30 | |||||||||||||||
| 2014 | 2013 | 2014 | 2013 | |||||||||||||
| ($’000) | ($’000) | ($’000) | ($’000) | |||||||||||||
| (Unaudited) | (Unaudited) | (Unaudited) | (Unaudited) | |||||||||||||
| Sales of products (e) | $ | 7,706 | $ | 8,892 | $ | 20,107 | $ | 59,324 | ||||||||
| Purchase of raw materials (f) | $ | 27,476 | $ | 10,118 | $ | 63,437 | $ | 44,968 | ||||||||
| Guarantee for bank borrowings (g) | $ | 32,544 | $ | 65,526 | $ | 140,650 | $ | 159,511 | ||||||||
| Loan guarantee fees (g) | $ | 643 | $ | 643 | $ | 1,965 | $ | 1,728 | ||||||||
| 14 |
| September 30, 2013 | December 31, 2013 | |||||||
| ($’000) | ($’000) | |||||||
| (Unaudited) | ||||||||
| Advances received from these parties (h) | $ | 2,155 | $ | - | ||||
| Advance payments to these parties (i) | $ | 4,517 | $ | 11,043 | ||||
| Accounts receivable from these parties (j) | $ | - | $ | 218 | ||||
(e)The Group sold finished products of approximately $3.8 million and $5.0 million to Ningbo Litong during the three months ended September 30, 2014 and 2013, respectively. The Group sold finished products of approximately $3.9 million and $0.2 million to Ningbo Lide during the three months ended September 30, 2014 and 2013, respectively. The Group sold finished products of nil and approximately $3.8 million to Ningbo Kunde during the three months ended September 30, 2014 and 2013, respectively. The Group sold finished products of approximately $16 million and $17.1 million to Ningbo Litong, during the nine months ended September 30, 2014 and 2013, respectively. The Group sold finished products of approximately $4.1 million and $0.2 million to Ningbo Lide during the nine months ended September 30, 2014 and 2013, respectively. The Group sold finished products of nil and approximately $42 million to Ningbo Kunde during the nine months ended September 30, 2014 and 2013, respectively.
(f) During the three months ended September 30, 2014, the Group purchased raw materials of approximately $27.1 million and $0.4 million from Ningbo Litong and Ningbo Lide, respectively. During the three months ended September 30, 2013, the Group purchased raw materials of approximately $0.01 million and $10 million from Ningbo Kunde and Ningbo Lide, respectively. During the nine months ended September 30, 2014, the Group purchased raw materials of approximately $54.2 million and $9.2 million from Ningbo Litong and Ningbo Lide, respectively. During the nine months ended September 30, 2013, the Group purchased raw materials of approximately $2.7 million and $42.3 million from Ningbo Kunde and Ningbo Lide, respectively.
(g) Guarantees for Bank Loans
| Guarantee provided during the three months ended September 30, | Guarantee provided during the nine months ended September 30, | |||||||||||||||
| 2014 | 2013 | 2014 | 2013 | |||||||||||||
| ($’000) | ($’000) | ($’000) | ($’000) | |||||||||||||
| (Unaudited) | (Unaudited) | (Unaudited) | (Unaudited) | |||||||||||||
| Ningbo Litong | $ | - | $ | 54,768 | $ | 75,562 | $ | 116,696 | ||||||||
| Ningbo Lide | 32,544 | 10,758 | 65,088 | 42,815 | ||||||||||||
| Total | $ | 32,544 | $ | 65,526 | $ | 140,650 | $ | 159,511 | ||||||||
| Bank loans Guaranteed as of | ||||||||
| September 30, 2014 | December 31, 2013 | |||||||
| ($’000) | ($’000) | |||||||
| (Unaudited) | ||||||||
| Ningbo Litong | $ | 142,220 | $ | 109,618 | ||||
| Ningbo Lide | 170,182 | 75,405 | ||||||
| Total | $ | 312,402 | $ | 185.023 | ||||
| 15 |
Beginning in January 2011, loan guarantee fees of 0.3% of the loan principal guaranteed are to be paid quarterly. In the three months ended September 30, 2014, loan guarantee fees were $0.26 million and $0.38 million to Ningbo Litong and Ningbo Lide, respectively. In the nine months ended September 30, 2014, loan guarantee fees were $0.76 million and $1.2 million for Ningbo Litong and Ningbo Lide, respectively.
(h) At September 30, 2014, advances received from these parties consist of amounts due payable to Ningbo Litong and Ningbo Lide of $2.13 million and $0.02 million, respectively.
(i) At September 30, 2014, advance payments to these parties consist of payments to Ningbo Lide of $4.5 million.
| 15 | Consolidated Segment Data |
Segment information is consistent with how management reviews the business, makes investing and resource allocation decisions and assesses operating performance. The segment data presented reflects this segment structure. The Company reports financial and operating information in the following two segments:
(a) Petrochemicals Segment: Manufacturing and sales of mixed light aromatics, mixed heavy aromatics, fine propylene, propane, butane, liquefied petroleum gas (LPG), methyl tert-butyl ether, styrene, etc.
(b) Rubber Segment: Manufacturing and sales of various rubber products.
Segment information for the three and nine months ended September 30, 2014 and 2013 is as follows:
| Three Months Ended September 30 | ||||||||||||||||||||||||
| 2014 | 2013 | |||||||||||||||||||||||
| Petrochemical | Rubber | Total | Petrochemical | Rubber | Total | |||||||||||||||||||
| ($'000) | ($'000) | ($'000) | ($'000) | ($'000) | ($'000) | |||||||||||||||||||
| (Unaudited) | (Unaudited) | (Unaudited) | (Unaudited) | (Unaudited) | (Unaudited) | |||||||||||||||||||
| Revenue | $ | 127,525 | $ | 8,153 | $ | 135,678 | $ | 128,542 | $ | 21,744 | $ | 150,286 | ||||||||||||
| Income (loss) from operations | $ | 1,889 | $ | (1,737 | ) | $ | 152 | $ | 5,467 | $ | 926 | $ | 6,393 | |||||||||||
| Total assets | $ | 901,187 | $ | 96,522 | $ | 997,709 | $ | 777,449 | $ | 108,582 | $ | 886,031 | ||||||||||||
| Nine Months Ended September 30 | ||||||||||||||||||||||||
| 2014 | 2013 | |||||||||||||||||||||||
| Petrochemical | Rubber | Total | Petrochemical | Rubber | Total | |||||||||||||||||||
| ($'000) | ($'000) | ($'000) | ($'000) | ($'000) | ($'000) | |||||||||||||||||||
| (Unaudited) | (Unaudited) | (Unaudited) | (Unaudited) | (Unaudited) | (Unaudited) | |||||||||||||||||||
| Revenue | $ | 503,584 | $ | 18,524 | $ | 522,108 | $ | 388,301 | $ | 65,474 | $ | 453,775 | ||||||||||||
| Income (loss) from operations | $ | 13,869 | $ | (4,256 | ) | $ | 9,613 | $ | 3,011 | $ | 8,518 | $ | 11,529 | |||||||||||
| Total assets | $ | 901,187 | $ | 96,522 | $ | 997,709 | $ | 777,449 | $ | 108,582 | $ | 886,031 | ||||||||||||
| 16 |
| 16 | SUBSEQUENT EVENTS |
On October 30, 2014, in connection with a motion for a temporary restraining order and preliminary injunction filed by Dragon State International Limited (the “Dragon State”) against the Company and Mr. Chunfeng Tao, a Consent Order was issued by the District Court for the Southern District of New York whereby the Company and Mr. Chunfeng Tao agree that, notwithstanding anything contained in the certificate of Designations, Preferences and Rights of the Series B Convertible Preferred Stock to the contrary, the 5,333,334 shares of Series B Preferred Stock held by Dragon State have not been, and shall not be, automatically converted into shares of Company’s common stock, or any other security prior to the resolution of the above mentioned action; and the expiration of Series C and Series D warrants shall be tolled pending the resolution of the above mentioned action as well.
In connection with an industrial accident that occurred on September 20, 2014 and which resulted in one death and two injuries, Ningbo Keyuan paid a settlement of RMB1.3million (approximately $0.2 million) to the decedent’s family who has agreed not to seek any additional monetary damages. Ningbo Keyuan has also paid, as of December 3, 2014, approximately RMB 896,000 (approximately $0.15 million) for the medial expenses for the two injured employees and expects that additional amounts may be payable. The Company is currently unable to estimate any additional amounts payable. During the nine months ended September 30, 2014, the Company also paid RMB1.2million (approximately $0.2 million) in connection with an accident that occurred in May 2014. No additional monetary damages are expected to be paid in connection with the May 2014 accident that resulted in one fatality. The Company has taken all necessary measures to prevent such accidents and does not believe it will materially impact its operation or its ability to obtain financings, including bank loans, going forward.
| 17 |
Item 2. MANAGEMENT’S DISCUSSION AND ANALYSIS OF FINANCIAL CONDITION AND RESULTS OF OPERATIONS
The following discussion and analysis of our financial condition and result of operations contains forward-looking statements and involves numerous risks and uncertainties, including, but not limited to, those described in the "Risk Factors" section of the other reports we file with the Securities and Exchange Commission. Actual results may differ materially from those contained in any forward-looking statements.
The following discussion and analysis of financial condition and results of operations relates to the operations and financial condition reported in the financial statements of Keyuan for the three and nine months ended September 30, 2014 and 2013 and should be read in conjunction with such financial statements and related notes included in this report and the Company’s Annual Report on Form 10-K for the year ended December 31, 2013.
Overview
Operating through our wholly-owned subsidiaries, Ningbo Keyuan, Ningbo Keyuan Petrochemicals, Keyuan Synthetic Rubbers and Guangxi Keyuan, our operations include (i) a production facility with an annual petrochemical production capacity of 720,000 metric tons (MT) of a variety of petrochemical products, (ii) a Styrene-Butadience-Styrene (the “SBS”) production facility with a designed annual production capacity of 70,000 MT, (iii) facilities for the storage and loading of raw materials and finished goods and (iv) manufacturing technologies that can support our manufacturing process with relatively low raw material costs and high utilization and yields, all of which are led by a management team consisting of petrochemical experts with proven track records from some of China’s largest state-owned enterprises in the petrochemical industry.
In January 2012, we signed a cooperation agreement with Fangchenggang City to build a new petrochemicals production facility for the Guangxi Project. According to the cooperation agreement, the government of Fangchenggang City is responsible for providing the land use rights for the facility. This new production facility, as a part of our expansion plan, will improve our competitive position by extending and expanding our supply chain and manufacturing base. Once the facility is fully operational, it is expected to have an annual production capacity of 400,000 metric tons of ABS. In August 2013, we commenced engineering and facility construction. We have completed the land leveling at the end of August 2014, and we are currently in the process of site fencing and enclosure, which process is expected to be completed by the end of 2014. However, our schedule is subject to further adjustment pending the status of financing. The total investment amount to construct this new production facility is approximately USD $300 million. We plan to fund the construction and operation of the new production facility through outside financing. If such financing is not available on terms acceptable to us, construction of this facility will be delayed until appropriate financing is available.
| 18 |
Our organization chart is as follows:
Our Facility and Equipment
Facility
As of September 30, 2014, we have invested a total of approximately $110.9 million in the construction and improvement of our production facility. Our current production facility encompasses approximately 1.3 million square feet, including 594,000 square feet for production and 19,500 square feet for laboratories and offices. We also acquired the land use right of an additional 1.2 million square feet of land in August 2010 for our expansion.
We increased our total storage capacity from 100,000 MT to 134,000 MT in October 2014, which currently consists of 84,000 MT of storage capacity for raw materials and 50,000 MT for finished products. As a part of our expansion plan, we intend to add another 16,000 MT of new storage capacity in late 2015 to increase our total storage capacity to 150,000 MT,
We have an on-site ocean shipping dock with 5,000 MT of shipping capacity and a 10-truck loading facility. Approximately 90% of our feedstock and finished products use this shipping dock. We also have adjacent access to another shipping dock with an additional shipping capacity of 50,000 MT. During the first three months of 2014, we commenced an application to the local government in Ningbo to upgrade the classification of our own dock so that we can unload foreign cargo vessels under the capacity of 50,000 MT to our dock directly. We expect that the upgrade will be completed and approved by the end of 2016 and will enable us to save additional logistics costs and storage fees.
| 19 |
Equipment
Our major processing equipment includes the following:
| ● | Heavy oil catalytic pyrolysis processing equipment- risers/generators/precipitators, fuel gas boilers, fractionating tower, absorbing, re-absorbing, and desorbing towers, heat exchangers, pumps, a stabilizing tower; |
| ● | Gas fractionation processing equipment- de-propanizing tower, refining propylene tower, de-ethanizination tower, heat exchangers, pumps; |
| ● | Ethylbenzene processing equipment- alkylation reactor, anti-alkylation reactor, dehydrogenation reactor, propylene absorbing tower, de-ethylene tower, ethylbenzene recovering tower, heating furnace for benzene, heating furnace for gas, steam overheating furnace, tail gas compressor, washing tower; and |
| ● | Liquefied petroleum gas (LPG) and sulfur recovery process- LPG desulfurization extraction tower, dry gas desulfurization tower, regenerating tower, LPG de-mecaptan extraction tower. |
Our Products
We manufacture and supply a variety of petrochemical products, including BenzeneToluene-Xylene Aromatics (BTX Aromatics), propylene, styrene, liquid petroleum gas (LPG), Methyl Tertiary Butyl Ether (MTBE), SBS and other petrochemicals, each of which is described below:
| ● | BTX Aromatics: consisting of benzene, toluene, xylene and other chemical components for further processing into plastics, gasoline and solvents materials widely used in paint, ink, construction coating and pesticide. |
| ● | Propylene: a chemical intermediate as one of the building blocks for an array of chemical and plastic products that are commonly used to produce polypropylene, acrylonitrile, oxo alcohols, propylene oxide, cumene, isopropyl alcohol, acrylic acid and other chemicals for paints, household detergents, automotive brake fluids, indoor/outdoor carpeting, textile, insulating materials, auto parts and electrical appliances. |
| 20 |
| ● | Styrene: a precursor to polystyrene and several copolymers widely used for packaging materials, construction materials, electronic parts, home appliances, household goods, home furnishings, toys, sporting goods and others. |
| ● | LPG: a mixture of hydrocarbon gases used as fuel in heating appliances and vehicles. A replacement for chlorofluorocarbons as an aerosol propellant and a refrigerant which reduces damage to the ozone layer. |
| ● | MTBE & Other Chemicals: MTBE, oil slurry, sulphur and others are used for a variety of applications including fuel components, refrigeration systems, fertilizers, insecticides and fungicides, etc. |
| ● | SBS: consisting of Styrene and butadiene, widely used for waterproofing building material, asphalt modification, furniture, shoe sole material, tubes, tape, auto parts and electrical applicances. |
In order to improve our operational results and financial situation, we recently adjusted our product portfolio to include Styrene-Ethylene-Butylene-Styrene (“SEBS”) which we believe will yield a higher gross margin than some of our current products. SEBS is a product similar to SBS but with more durable product features, and can be produced by our current SBS facility. In order to achieve a stable production value, we started trial production of approximately 200-300 MT per month in March 2013. The lab analysis shows the trial production of SEBS has achieved a stable condition since April 2014. However, the SEBS price has decreased significantly due to stagnant market conditions since the end of 2013. In response, we decided to produce only pursuant to customers’ orders, which resulted in a production of approximately 300 MT from January to June 2014, approximately 150 MT per month from the end of June 2014. We expect to increase the production volume when the market recovers.
Production Capacity and Expansion
Our annual designed manufacturing capacity is 720,000 MT of a variety of petrochemical products. Our SBS production facility is capable of producing up to 70,000 MT of SBS in full load condition without interruption (100% of utilization rate in ideal conditions). Additionally, we have a total of 134,000 MT of storage capacity, consisting of 84,000 MT of storage capacity for raw materials and 50,000 MT for finished products.
Our SBS facility achieved a 41% utilization rate in 2012, the first full year of production, and generated approximately $71 million in sales and $5.9 million in profits in 2012. We achieved, in accordance with our annual plan of 63,000 MT of SBS, a 63% utilization rate in 2013; and generated approximately $78 million in sales and $5.6 million in profits. Although we planned to produce 63,000 MT of SBS in 2014, production in the nine months ended September 30, 2014 was 13,027 MT and resulted in revenue of approximately $18.5 million. The significant decrease in production of SBS during the nine months ended September 30, 2014 as compared to planned production was because the SBS market has been stagnant since the end of 2013. Accordingly, we decided to reduce SBS production to approximately 20% of capacity until the market recovers. In addition, our SBS cost per unit for the nine months ended September 30, 2014 increased from $1,839 to $2,067 as compared to the same period in 2013. Thus, we incurred a loss of $4.3 million in the nine months ended September 30, 2014.
| 21 |
The following chart depicts our main product’s production capacity for the nine months ended September 30, 2014:
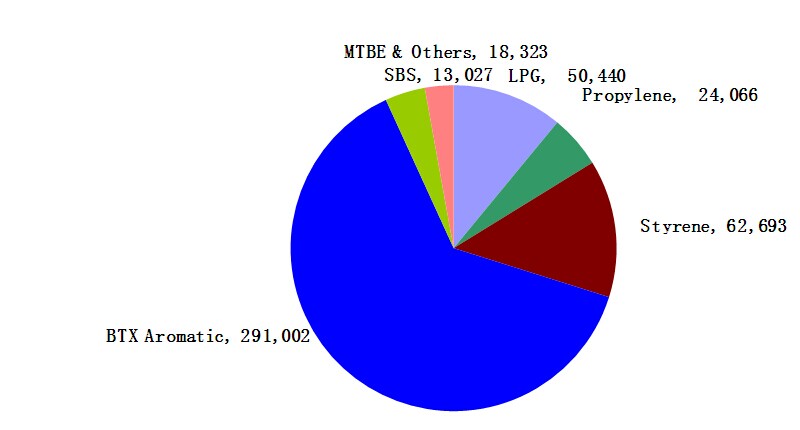
Other than the utilization rate for SBS facility discussed above, the utilization rates for our other facilities are as follows:
| ● | styrene production: 90 %; |
| ● | propylene: 98%; |
| ● | LPG: 93%; |
| ● | BTX Aromatic: 94%; and |
| ● | MTBE & others: 92% |
Most of our facilities have been operating since 2009, so the current utilization rates for each product (except for the newly developed SBS) has been optimized to achieve stable output, less raw material cost and less equipment maintenance. We also made slight adjustments to the utilization rate for the BTX Aromatic facility to reduce the output to achieve more stable production conditions. We have been working on existing equipment upgrades to achieve increased stabilized production. However, in order to develop our business to meet increasing customer demands, optimizing the utilization rates for our current facilities is not adequate to achieve our goals. More specifically, the increasing market demand in tire and auto parts has resulted in increasing market demand for styrene, ABS and SSBR; and higher requirements related to environmental protection imposed by the PRC government has led to higher demand for transformer oil and catalytic cracking oil. Based on these market trends, rather than focusing on optimizing our current utilization rates for our different facilities, we have been focusing on the following improvements to our infrastructure to expand our manufacturing capacity:
| a) | an ABS production facility in Guangxi Province, which will have an annual production capacity of 400,000 MT of ABS. The Company began pre-construction activities in February 2012. We completed the land leveling at the end of August 2014, and we are currently in the process of site fencing and enclosure, which process is expected to be completed by the end of 2014. |
| 22 |
| b) | an oil catalytic cracking processing facility as an extension of our catalytic pyrolysis processing equipment, as well as the feed way of the main raw materials to produce synthetic rubber. This facility can reduce production costs and the market risk in the purchase of raw materials, and improve the stability and efficiency of project production to 200,000 MT of heavy oil per year. The facility was completed in October 2014, and it is currently in trial production. We expect to start production after stable quality conditions of products are achieved. |
| c) | an increased annual design capacity of our ethylene-styrene facility from 80,000 MT to 200,000 MT, of which 120,000 MT can be used for producing synthetic materials and 80,000 MT can be sold to downstream petrochemical companies. This facility can be considered the bridge between original products and high-value added products and will complete the integration of internal resources; |
|
d)
|
a transformer oil facility using hydrogen from the ethylene-styrene facility to complete a double hydrogenation process on original products (BTX Aromatic) for refining transformer oil, and producing high value transformer oil, with a design capability of 100,000 MT per year; We have completed facility construction and have submitted a report to the local environmental department for their inspection and approval. An initial onsite inspection was performed by the local environmental department in September 2014 which inspection requires that a hydrogenation facility be installed (with an estimated cost of approximately $48,000) to improve environmental protection. A follow up review is expected after the installation of the hydrogenation facility prior to the local environmental department’s approval. We are currently evaluating this requirement and preparing the design for the facility; |
| e) | an SSBR (Solution Polymerized Styrene Butadiene Rubber) production facility with a design capability of 150,000 MT per year, that will use its own production process technology in synthetic rubber, combining styrene and butadiene, to produce SSBR. This product can be used as raw materials for tires, instead of imported hexakis (methoxymethy) melamine (“HMMM”). |
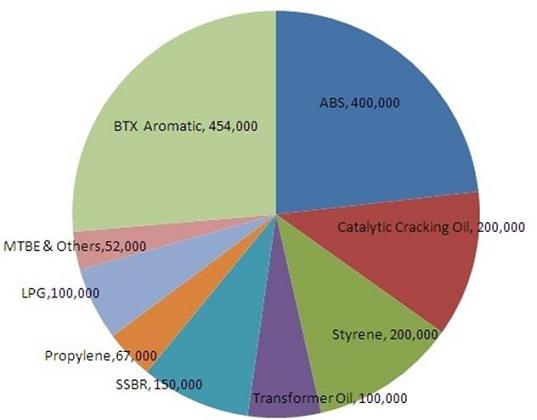
The total estimated cost of processing equipment for product refinement and the SSBR production facility is approximately $149.3 million, including $49.8 million for processing equipment and $99.5 million for the SSBR production facility. We have completed the land leveling of ABS production facility (Guangxi Project) at the end of August 2014, and we are currently in the process of site fencing and enclosure, which is expected to be completed by the end of 2014. The total investment amount to construct the ABS production facility is approximately USD $300 million. Upon full completion of our expansion, our total production capacity will reach 1,723,000 MT per year including, but not limited to, our current petrochemical production of 720,000 MT, styrene of 200,000 MT, catalytic cracking oil of 200,000 MT, ABS of 400,000 MT, SSBR of 150,000 MT and transformer oil of 100,000 MT. The following chart depicts the breakdown of our planned production capacity of 1,723,000 MT.
| 23 |
We are currently evaluating the timeline for our expansion projects. Our current estimate is as follows:
| Expansion Project | Expected Completion Date | |||||
| Oil Catalytic Processing Facility | End of Q4, 2014 | |||||
| Ethylene-Styrene Facility | End of Q2, 2015 | |||||
| Transformer Oil Facility | End of Q2, 2015 | |||||
| SSBR production facility | End of Q4, 2015 | |||||
| ABS Production Facility | End of Q4, 2016 | |||||
| New storage capacity of 16,000 MT | End of Q4, 2015 |
Manufacturing and Sales
Our total production of finished products was 111,204 MT for the three months ended September 30, 2014, and we generated $136 million in revenue based on the sale of 124,070 MT of petrochemical products.
Our total production of finished products was 459,551 MT for the nine months ended September 30, 2014, and we generated $522 million in revenue based on the sale of 480,587 MT of petrochemical products.
Results of Operations
The following table sets forth information from our statements of comprehensive income for the three and nine months ended September 30, 2014 and 2013.
| 24 |
Comparison of the three and nine months ended September 30, 2014 and 2013 (in thousands)
| For the three months | Year to Year Comparison | For the nine months | Year to Year Comparison | |||||||||||||||||||||||||||||
| Ended September 30, | Increase | Percentage | Ended September 30, | Increase | Percentage | |||||||||||||||||||||||||||
| 2014 | 2013 | /(Decrease) | change | 2014 | 2013 | /(Decrease) | change | |||||||||||||||||||||||||
| Sales | $ | 135,678 | 150,286 | (14,608 | ) | (10 | )% | 522,108 | 453,775 | 68,333, | 15 | % | ||||||||||||||||||||
| Cost of sales | 132,000 | 140,030 | (8,030 | ) | (6 | )% | 501,595 | 432,389 | 69,207 | 16 | % | |||||||||||||||||||||
| Gross profit | 3,678 | 10,256 | (6,773 | ) | (64 | )% | 20,512 | 21,386 | (1,069 | ) | (4 | )% | ||||||||||||||||||||
| Operating expenses | ||||||||||||||||||||||||||||||||
| Selling expenses | 405 | 466 | (61 | ) | (13 | )% | 1,031 | 869 | 162 | 19 | % | |||||||||||||||||||||
| General and administrative expenses | 3,121 | 3,397 | (276 | ) | (8 | )% | 9,868 | 8,988 | 880 | 10 | % | |||||||||||||||||||||
| Total operating expenses | 3,526 | 3,863 | (337 | ) | (9 | )% | 10,899 | 9,857 | 1,042 | 11 | % | |||||||||||||||||||||
| Income from operations | (152 | ) | 6,393 | (6,241 | ) | (98 | )% | 9,613 | 11,529 | (1,916 | ) | (17 | )% | |||||||||||||||||||
| Other income (expenses): | ||||||||||||||||||||||||||||||||
| Interest income: | 3,344 | 2,461 | 883 | 36 | % | 9,225 | 6,363 | 2,862 | 45 | % | ||||||||||||||||||||||
| Interest expense | (7,791 | ) | (4,481 | ) | (3,310 | ) | 74 | % | (19,378 | ) | (14,601 | ) | (4,777 | ) | 33 | % | ||||||||||||||||
| Foreign exchange gain (loss), net | (396 | ) | 1,044 | (1,440 | ) | (138 | )% | (4,534 | ) | 7,249 | (11,783 | ) | (163 | )% | ||||||||||||||||||
| Non-operating income (expenses) | (1,554 | ) | (1,342 | ) | (212 | ) | (16 | )% | (4,420 | ) | (2,437 | ) | (1,983 | ) | 81 | % | ||||||||||||||||
| Total other (expenses) Income | (6,397 | ) | (2,318 | ) | (4,079 | ) | 176 | % | (19,107 | ) | (3,426 | ) | (15,681 | ) | 458 | % | ||||||||||||||||
| Income (loss) before income taxes | (6,245 | ) | 4,075 | (10,320 | ) | (253 | )% | (9,494 | ) | 8,103 | (17,597 | ) | (217 | )% | ||||||||||||||||||
| Income tax expense | (586 | ) | 1,284 | (1,870 | ) | (146 | )% | (76 | ) | 2,891 | (2,967 | ) | (103 | )% | ||||||||||||||||||
| Net Income(Loss) | (5,659 | ) | 2,791 | (8,450 | ) | (303 | )% | (9,418 | ) | 5,212 | (14,630 | ) | (281 | )% | ||||||||||||||||||
| Other comprehensive income | ||||||||||||||||||||||||||||||||
| Foreign currency translation adjustment | 8 | 538 | (530 | ) | (99 | )% | (451 | ) | 2,170 | (2,621 | ) | (121 | )% | |||||||||||||||||||
| Comprehensive income (loss) | $ | (5,651 | ) | $ | 3,329 | $ | (8,980 | ) | (270 | )% | $ | (9,869 | ) | $ | 7,382 | $ | (17,251 | ) | (234 | )% | ||||||||||||
| 25 |
Sales: Our sales for the three months ended September 30, 2014 were approximately $136 million, compared to $150 million for the three months ended September 30, 2013, a decrease of $15 million, or 10%. The decrease was mainly due to lower sale quantities of SBS rubber products as the market continues to be stagnant in the three months ended September 30, 2014. We sold 119,945 tons of petrochemical and 4,124 tons of rubber products at an average price of $1,063 and $1,974 per metric ton, respectively, in the three months ended September 30, 2014, compared to 120,086 metric tons of petrochemical products and 11,519 tons of rubber products at an average price of $1,070 and $1,888 per metric ton, respectively, in the three months ended September 30, 2013. The average selling price for petrochemical products during the three months ended September 30, 2014 decreased slightly by 0.67% compared to the same period in 2013. Although the average sales price for SBS products for the three months ended September 30, 2014 increased by approximately 4.6 % compared to the same period of 2013, the quantity of SBS products sold decreased by 64% resulting in a decrease in total sales for the three months ended September 30, 2014.
Sales for the nine months ended September 30, 2014 were approximately $522 million, compared to $454 million for the nine months ended September 30, 2013, an increase of $68 million, or 15%. We incurred a 40-day production interruption for routine facilities inspection and maintenance in the quarter ended June 30, 2013. There was no production interruption in 2014. We sold 470,636 tons of petrochemical and 9,950 tons of rubber products at an average price of $1,070 and $1,862 per metric ton, respectively, in the nine months ended September 30, 2014, compared to 371,662 metric tons of petrochemical products and 30,563 tons of rubber products at an average price of $1,045 and $2,142 per metric ton, respectively, in the nine months ended September 30, 2013. For the nine months ended September 30, 2014, sales in the petrochemical segment accounted for approximately 96% of total revenue. There were no significant changes in the average selling prices for petrochemical products during the nine months ended September 30, 2014.
Cost of Sales: Our overall cost of sales was approximately $132 million for the three months ended September 30, 2014, or 97% of sales, as compared to approximately $140 million, or 93% of sales for the three months ended September 30, 2013. Our cost of sales is primarily composed of the costs of direct raw materials (mainly heavy oil, benzene, butadiene and carbinol), labor, depreciation and amortization of manufacturing equipment and facilities, and other overhead. The decrease in the cost of sales was mainly due to the lower sales quantities of SBS products.
Our overall cost of sales was approximately $502 million for the nine months ended September 30, 2014, or 96% of sales, as compared to approximately $432 million, or 95% of sales for the nine months ended September, 30, 2013. In the nine months ended September 30, 2014, our average cost of finished products was $1,019 per metric ton for petrochemical products, as compared to $1,010 per metric ton in the nine months ended September 30, 2013, an increase of 0.89 %. Our average cost of rubber products in 2014 was $2,067 per metric ton, as compared to $1,834 per metric ton in the nine months ended September 30, 2013, an increase of 12%. The increased cost of sales and increased unit costs were due to the lower sales quantity of our SBS products in the quarter ended September 30, 2014, without significant changes in our fixed costs.
Energy required for production of our products consists of water, electricity and steam, the costs of which are attributed to cost of sales rather than operating expense. The supply prices of these energy sources in China have historically been very stable as a result of PRC government policy. Accordingly, the potential impact of changing energy costs to our production is minimal. The following are the costs for water, electricity and stream for the nine months ended September 30, 2014 and 2013 (amounts in thousands):
| For the Nine Months Ended September 30 | ||||||||
| 2014 (Unaudited) | 2013 (Unaudited) | |||||||
| Water | 1,029 | 1,035 | ||||||
| Electricity | 7,855 | 9,855 | ||||||
| Steam | 2,440 | 1,506 | ||||||
Total energy cost was approximately $11,324 for the nine months ended September 30, 2014, which constitutes approximately 2.17 % of sales. Total energy cost was approximately $12,396 for the nine months ended September 30, 2013, which constitutes approximately 2.73% of sales.
Gross Profit: Gross profit for the three months ended September 30, 2014 for the petrochemical segment was approximately $4.5 million and a gross loss of $0.8 million for the rubber segment, as compared to $9.1 million and $1.2 million for petrochemicals and rubber, respectively, for the comparable period in 2013, a total decrease of approximately $6.6 million, or 64%. The decrease was due to decreases in the sales quantity of rubber products by 7,395 metric tons for the three months ended September 30, 2014 as compared to the same period in 2013
| 26 |
Gross profit for the nine months ended September 30, 2014 for the petrochemical segment was approximately $22.5 million and a gross loss of $2 million for the rubber segment, as compared to $12.1 million and $9.3 million for petrochemicals and rubber, respectively, for the comparable period in 2013. Our total gross margin decreased from 4.7% for the nine months ended September 30, 2013 to 3.9 % for the nine months ended September 30, 2014. The main reason for the decrease in the gross margin is the decrease in sales volume discussed above.
Operating Expenses: Operating expenses, including selling expenses, and general and administrative expenses, were approximately $3.5 million, or 2.59% of sales for the three months ended September 30, 2014, as compared to $3.9 million, or 2.57% of sales for the comparable period in 2013, a decrease of $0.4 million or 9%. The decrease was mainly due to decrease in entertainment expense of $0.2 million and publicity expense of $0.2 million.
Operating expenses, including selling expenses, and general and administrative expenses, were approximately $11 million, or 2.1 % of sales for the nine months ended September 30, 2014, as compared to $10 million, or 2.2 % of sales for the comparable period in 2013, an increase of $1 million or 11 %. The increase was mainly due to increases of $0.3 million in guarantee fees and general increases in consultant fees.
Interest Income/Expense (net): For the three months ended September 30, 2014, interest income and interest expense were approximately $3.3 million and $7.8 million, respectively; as compared to interest income and interest expense of approximately $2.5 million and $4.5 million, respectively, for the comparable period in 2013. The increase in interest income was mainly due to increased deposits as collateral for bank loans, and the increase in interest expense was mainly due to increased borrowings in the period.
For the nine months ended September 30, 2014, interest income and interest expense were approximately $9.2 million and $19.4 million, respectively; as compared to interest income and interest expense of approximately $6.4 million and $14.6 million, respectively, for the comparable period in 2013. The increase in interest income and expense was mainly due to increased deposits and borrowings.
Net Income(Loss): Net Loss was approximately $5.6 million for the three months ended September 30, 2014, as compared to net income of approximately $2.8 million in the same period in 2013, a decrease of $8.4 million, or 303%. This decrease was mainly due to the lower gross profit and higher interest expenses, as well as a foreign exchange loss of $0.4 million for the three months ended September 30, 2014 as a result of the depreciation of the RMB, compared to an exchange gain of $1 million in the same period of 2013.
Net Loss was approximately $9.4 million for the nine months ended September 30, 2014, as compared to a net income of approximately $5.2 million in the same period in 2013, a decrease of $14.6 million, or 281%. This decrease was primarily due to the decrease in both selling prices and sales quantities for SBS products during the nine months ended September 30, 2014 compared to the same period in 2013, as well as a foreign exchange loss of $4.5 million in the first nine months of 2014, compared to a foreign exchange gain of $7.2 million in the same period of 2013. The exchange rate for USD to RMB appreciated from 6.31 to 1 on January 1, 2013, to 6.15 to 1 on September 30, 2013, however, the exchange rate for USD to RMB depreciated from 6.11 to 1 on January 1, 2014, to 6.15 to 1 on September 30, 2014.
Foreign Currency Translation Adjustment: Our reporting currency is the U.S. dollar. Our local currency, Renminbi (RMB), is our functional currency. Results of operations and cash flow are translated at average exchange rates during the period, and assets and liabilities are translated at the unified exchange rate as quoted by the People’s Bank of China at the end of the period. Translation adjustments resulting from this process are included in accumulated other comprehensive income in the statement of shareholders’ equity. Transaction gains and losses that arise from exchange rate fluctuations on transactions denominated in a currency other than the functional currency are included in the results of operations as incurred.
Currency translation adjustments resulting from this process are included in accumulated other comprehensive loss and amounted to $0.4 million for the three months ended September 30, 2014. The balance sheet amounts at September 30, 2014 and 2013, with the exception of equity, were translated at RMB 6.1538 and RMB 6.2127 to 1.00 U.S. dollar respectively. The equity accounts were translated at their historical rates. The average translation rates applied to income statement accounts for the three months ended September 30, 2014 and 2013 were RMB 6.1455 and RMB 6.1414, respectively, to 1.00 U.S. dollar.
| 27 |
Liquidity and Capital Resources
The following table sets forth a summary of our cash flows for the periods indicated:
| For the Nine Months Ended September 30, | ||||||||
| 2014 (Unaudited) | 2013 (Unaudited) | |||||||
| Net cash used in operating activities | (2,171 | ) | (56,991 | ) | ||||
| Net cash used in investing activities | (48,337 | ) | (44,765 | ) | ||||
| Net cash provided by financing activities | 40,317 | 102,038 | ||||||
Net cash used in operating activities was approximately $2 million for the nine months ended September 30, 2014, as compared to approximately $57 million for the same period in 2013. The reasons for the decrease is primarily due to increased collections of accounts receivable and receipts of consumption tax refunds in a more timely manner in 2014. In addition we established stricter control over prepayments to suppliers and streamlined our inventories in 2014 as compared to 2013.
Net cash used in investing activities was approximately $48 million and $44 million for the nine months ended September 30, 2014 and 2013, respectively. The net cash used in investing activities is primarily due to our increasing investments in the construction of our infrastructures and facilities in accordance with our expansion plan.
Net cash provided by financing activities amounted to approximately $40 million for the nine months ended September 30, 2014, compared with approximately $102 million for the same period in 2013. For the nine months ended September 30, 2014, net cash provided by financing activities was primarily through bank borrowings. The decrease resulted primarily from increases in cash available from operations during the nine months ended September 30, 2014 as compared to the same period in 2013.
The Company commenced trading of heavy oil in April 2013, whereby the Company functions as an agent on behalf of a Hong-Kong based customer. For the three months ended September 30, 2014 and 2013, the trading of heavy oil consists of purchases of approximately $102.6 million and $142.3 million, respectively, and sales of approximately $101.8 million and $141.7 million, respectively, resulting in a loss of $0.8 million and $0.6 million, respectively, which has been included in cost of sales in the condensed consolidated statement of comprehensive income. For the nine months ended September 30, 2014, the trading of heavy oil consists of purchases of approximately $272.6 million, and sales of approximately $270.7 million, resulting in a loss of $1.9 million, which has been included in cost of sales in the condensed consolidated statement of comprehensive income.
Consumption Tax Refund
The PRC government enacted a regulation pursuant to which domestically purchased heavy oil to be used for producing ethylene and aromatics products was exempted from consumption tax. In addition, the consumption tax paid for imported heavy oil is to be refunded if it is used for producing ethylene and aromatics products. Given all the Group’s purchased heavy oils are, or are to be, used for producing ethylene and aromatics products, the Group recognizes a consumption tax recoverable when a consumption tax for heavy oils has been paid and the relevant heavy oils have been used for production of ethylene and aromatics products. At September 30, 2014 and December 31, 2013, the Group recorded an estimated consumption tax recoverable amounting to approximately $9.5 million and $46.1 million, respectively.
In October and November 2014, refunds of approximately $4.5 million were received. In addition, management expects approximately $5 million will be deductible against future consumption tax obligations.
| 28 |
Bank Loans
We have entered into loan agreements with our primary lenders, Bank of China, China Construction Bank, Agricultural Bank of China, etc. under which we have term loans. As of December 3, 2014, we had an aggregate principal amount of approximately $536 million in bank loans outstanding under the loan agreements, with maturity dates from November 2014 to December 2015 and interest rates from 1.1% to 7.2% per annum.
Before we enter into loan agreements with a lender, the lender will approve a comprehensive credit line which is the maximum amount of the loans we can obtain from the lender within a certain time period. The comprehensive credit line is usually secured by one or more third party guaranties or liens on our property and equipment, or a security deposit. Once the comprehensive credit line is approved, we will enter into an individual loan agreement with the lender each time we obtain a loan from the lender under the credit line. Therefore, we typically have multiple loan agreements under one comprehensive credit line with one lender as long as the credit limit has not been reached. Though different lenders have different forms for loan agreements, loan agreements usually contain similar material terms such as the amount of a loan, the term of a loan, interest rate, etc. In addition, some loan agreements specify the purposes of loans, and lenders are permitted to monitor the use of loans and our business. The loan agreements generally do not require us to maintain specific ratios or working capital requirements. In the event that lenders observe abnormal use of a loan or a substantial loss in our business or other event that could potentially have a substantial negative impact on our ability to repay the loans on time, they can either amend or terminate the loan agreements, or request additional financial covenants to secure the loans. If we fail to repay loans in a timely manner, or fail to obtain written consent from the lenders regarding extension/renewal applications, we may be subject to default interest or the loans may be canceled. Historically, we have no record of default on any of our loans and, as a result, we do not anticipate that our loans will not be renewed when their terms expire. However, we cannot guarantee that one or more of our loans will not be renewed or extended at the end of their terms, which could have a material negative impact upon our liquidity which could impact our ability to purchase raw materials, make upgrades and improvements to our infrastructure or otherwise negatively impact our business and operations.
As of September 30, 2014, 42% of our bank loans (approximately USD $254 million) were guaranteed by our related and certain other parties. Usually, a guaranty agreement is executed among a third party, a lender and us pursuant to a credit line approved by the lender. Though different lenders use different forms for loan guaranty agreements, loan guaranty agreements usually contain substantially similar terms. According to a loan guaranty agreement, the guarantor is jointly liable for all our debts to the lender under the corresponding loan agreements and the lender can bring legal action against the guarantor for damages in the event there is a default or breach of any loan agreement under the credit line. The guaranty is independent of any loan agreement under the credit line and irrevocable. In addition, if the credit line is extended or renewed, a written consent from the guarantor is required. Otherwise, the guarantor is only liable for loans under loan agreements that were executed during the original term of the credit line. Beginning in January 2011, certain individual loan guarantors, some of whom are related parties, were paid a monthly fee of approximately 0.3% of the outstanding loan balances as compensation for their guarantees. Through December 31, 2010, no compensation was paid in respect of these guarantees. During the three and nine months ended September 30, 2014 and 2013, expenses related to loan guarantee fees were approximately $0.7 million and $ 2 million, and $0.69 million and $1.83 million, respectively. As of September 30, 2014, there was $1.9 million of accrued and unpaid guarantee fees. Historically, all debts have been repaid by the Company in a timely manner. All short-term bank loans are revolving loans whose terms (at the due date of payment) are generally extended by the lender. As of September 30, 2014, we were in compliance with the terms of our loan agreements. As such, management expects most unpaid loan balances will be extended at their due dates. Depending on our capital needs, the Company evaluates whether to apply for additional long-term bank loans. The Company currently has sufficient lines of credit with its banks for both short-term and long-term borrowings.
| 29 |
Related Party Transactions
The Company considers all transactions with the following parties to be related party transactions.
| Name of parties | Relationship | |
| Mr. Chunfeng Tao | Majority stockholder | |
| Mr. Jicun Wang | Principal stockholder | |
| Mr. Peijun Chen | Principal stockholder | |
| Ms. Sumei Chen |
Member of the Company’s Board of Supervisors and spouse of Mr. Wang | |
|
Ms. Yushui Huang
|
Vice President of Administration, Ningbo Keyuan | |
|
Ningbo Pacific Ocean Shipping Co., Ltd (Ningbo Pacific) |
100% ownership by Mr. Wang | |
|
Ningbo Xinhe Logistic Co., Ltd (Ningbo Xinhe) |
10% ownership by Ms. Huang |
| 30 |
Related party transactions and amounts outstanding with the related parties as of and for the three and nine months ended September 30, 2014 and 2013, are summarized as follows:
| Three months ended September 30 | Nine months ended September 30 | |||||||||||||||
| 2014 | 2013 | 2014 | 2013 | |||||||||||||
| ($’000) | ($’000) | ($’000) | ($’000) | |||||||||||||
| (Unaudited) | (Unaudited) | (Unaudited) | (Unaudited) | |||||||||||||
| Purchase of transportation services (a) | $ | 423 | $ | - | $ | 2,327 | $ | 1,045 | ||||||||
| Loan guarantee fee (b) | $ | - | $ | 43 | $ | - | $ | 85 | ||||||||
| September, 2014 | December 31, 2013 | |||||||
| ($’000) | ($’000) | |||||||
| (Unaudited) | ||||||||
| Amounts due to related parties (c) | $ | 21 | $ | 369 | ||||
| Advance payments to these parties (d) | $ | 44 | $ | 55 | ||||
(a) The Group purchased transportation services of approximately $0.4 million and nil from Ningbo Xinhe during the three months ended September 30, 2014 and 2013, respectively. The Group purchased transportation services of $2.3 million and $1.0 million from Ningbo Xinhe during the nine months ended September 30, 2014 and 2013, respectively.
(b) Guarantees for Bank Loans
Beginning in 2011, loan guarantee fees of 0.3% of the loan principal guaranteed are to be paid quarterly. During the three months ended September 30, 2014 and 2013, loan guarantee fees were approximately nil and $0.04 million for Ningbo Pacific, respectively. During the nine months ended September 30, 2014 and 2013, loan guarantee fees were nil and $0.09 million for Ningbo Pacific, respectively.
(c) Amounts due to related parties consist of the following.
| September 30, 2014 | December 31, 2013 | |||||||
| ($’000) | ($’000) | |||||||
| (Unaudited) | ||||||||
| Ningbo Xinhe (Transportation expenses) | $ | 21 | $ | 369 | ||||
| 31 |
(d) Advance payments to these parties consist of the following.
| September 30, 2014 | December 31, 2013 | |||||||
| ($’000) | ($’000) | |||||||
| (Unaudited) | (Unaudited) | |||||||
| Ningbo Xinhe | $ | - | $ | 12 | ||||
| Mr. Tao | 44 | 43 | ||||||
| Total | $ | 44 | $ | 55 | ||||
Relationships and transactions with certain other parties
The Group has following relationships and transactions with certain other parties:
| Name of parties | Relationship | |
|
Ningbo Litong Petrochemical Co., Ltd (Ningbo Litong) |
Former 12.75% nominee shareholder of Ningbo Keyuan | |
|
Ningbo Anqi Petrochemical Co., Ltd (Ningbo Anqi) |
A related party through September 2011 when control transferred | |
|
Ningbo Lide Investment Co., Ltd. (Ningbo Lide) |
A related party through September 2011 when control transferred | |
|
Ningbo Kunde Petrochemical Co, Ltd. (Ningbo Kunde) |
A related party through September 2011 when control transferred |
| 32 |
Transactions and amounts outstanding with these parties for the three and nine months ended September 30, 2014 and 2013 are summarized as follows:
| Three months ended September 30 | Nine months ended September 30 | |||||||||||||||
| 2014 | 2013 | 2014 | 2013 | |||||||||||||
| ($’000) | ($’000) | ($’000) | ($’000) | |||||||||||||
| (Unaudited) | (Unaudited) | (Unaudited) | (Unaudited) | |||||||||||||
| Sales of products (e) | $ | 7,706 | $ | 8,892 | $ | 20,107 | $ | 59,324 | ||||||||
| Purchase of raw materials (f) | $ | 27,476 | $ | 10,118 | $ | 63,437 | $ | 44,968 | ||||||||
| Guarantee for bank borrowings (g) | $ | 32,544 | $ | 65,526 | $ | 140,650 | $ | 159,511 | ||||||||
| Loan guarantee fees (g) | $ | 643 | $ | 643 | $ | 1,965 | $ | 1,728 | ||||||||
| September 30, 2013 | December 31, 2013 | |||||||
| ($’000) | ($’000) | |||||||
| (Unaudited) | ||||||||
| Advances received from these parties (h) | $ | 2,155 | $ | - | ||||
| Advance payments to these parties (i) | $ | 4,517 | $ | 11,043 | ||||
| Accounts receivable from these parties (j) | $ | - | $ | 218 | ||||
(e) The Group sold finished products of approximately $3.8 million and $5.0 million to Ningbo Litong during the three months ended September 30, 2014 and 2013, respectively. The Group sold finished products of approximately $3.9 million and $0.2 million to Ningbo Lide during the three months ended September 30, 2014 and 2013, respectively. The Group sold finished products of nil and approximately $3.8 million to Ningbo Kunde during the three months ended September 30, 2014 and 2013, respectively. The Group sold finished products of approximately $16 million and $17.1 million to Ningbo Litong, during the nine months ended September 30, 2014 and 2013, respectively. The Group sold finished products of approximately $4.1 million and $0.2 million to Ningbo Lide during the nine months ended September 30, 2014 and 2013, respectively. The Group sold finished products of nil and approximately $42 million to Ningbo Kunde during the nine months ended September 30, 2014 and 2013, respectively.
(f) During the three months ended September 30, 2014, the Group purchased raw materials of approximately $27.1 million and $0.4 million from Ningbo Litong and Ningbo Lide, respectively. During the three months ended September 30, 2013, the Group purchased raw materials of approximately $0.01 million and $10 million from Ningbo Kunde and Ningbo Lide, respectively. During the nine months ended September 30, 2014, the Group purchased raw materials of approximately $54.2 million and $9.2 million from Ningbo Litong and Ningbo Lide, respectively. During the nine months ended September 30, 2013, the Group purchased raw materials of approximately $2.7 million and $42.3 million from Ningbo Kunde and Ningbo Lide, respectively.
(g) Guarantees for Bank Loans
| Guarantee provided during the three months ended September 30, | Guarantee provided during the nine months ended September 30, | |||||||||||||||
| 2014 | 2013 | 2014 | 2013 | |||||||||||||
| ($’000) | ($’000) | ($’000) | ($’000) | |||||||||||||
| (Unaudited) | (Unaudited) | (Unaudited) | (Unaudited) | |||||||||||||
| Ningbo Litong | $ | - | $ | 54,768 | $ | 75,562 | $ | 116,696 | ||||||||
| Ningbo Lide | 32,544 | 10,758 | 65,088 | 42,815 | ||||||||||||
| Total | $ | 32,544 | $ | 65,526 | $ | 140,650 | $ | 159,511 | ||||||||
| 33 |
| Bank loans Guaranteed as of | ||||||||
| September 30, 2014 | December 31, 2013 | |||||||
| ($’000) | ($’000) | |||||||
| (Unaudited) | ||||||||
| Ningbo Litong | $ | 142,220 | $ | 109,618 | ||||
| Ningbo Lide | 170,182 | 75,405 | ||||||
| Total | $ | 312,402 | $ | 185.023 | ||||
Beginning in January 2011, loan guarantee fees of 0.3% of the loan principal guaranteed are to be paid quarterly. In the three months ended September 30, 2014, loan guarantee fees were $0.26 million and $0.38 million to Ningbo Litong and Ningbo Lide, respectively. In the nine months ended September 30, 2014, loan guarantee fees were $0.76 million and $1.2 million for Ningbo Litong and Ningbo Lide, respectively.
(h) At September 30, 2014, advances received from these parties consist of amounts due payable to Ningbo Litong and Ningbo Lide of $2.13 million and $0.02 million, respectively.
(i) At September 30, 2014, advance payments to these parties consist of payments to Ningbo Lide of $4.5 million.
Going concern and management’s plans
The consolidated financial statements have been prepared assuming that the Company will continue as a going concern. The Company reported net loss and cash flows used in operations of approximately $8.4 million and $2.2 million, respectively, for the nine months ended September 30, 2014 and net income and cash flows used in operations of approximately $4.1 million and $53.1 million, respectively, for the year ended December 31, 2013. At September 30, 2014 and December 31, 2013, the Company had a working capital deficit of approximately $259 million and $210 million, respectively. These factors raise substantial doubt about the Company’s ability to continue as a going concern. The accompanying consolidated financial statements do not include any adjustments relating to the recoverability or classification of assets, or the amounts and classification of liabilities that may result should the Company be unable to continue as a going concern.
The Company continues to finance its operations primarily through short-term bank borrowings. Short-term bank borrowings and bills payable amounted to approximately $837 million at September 30, 2014. Management expects that short-term bank financing will continue to be available through at least September 30, 2015.
The Company continues to benefit from favorable PRC tax policies related to consumption tax of which approximately $9.5 million was refundable at September 30, 2014. Approximately $4.5 million was refunded in October and November 2014, and management expects that approximately $5 million will be deductible against future consumption tax obligations. In addition, management expects VAT of $30 million to be refunded in late 2014.
The ability of the Company to continue as a going concern is dependent upon management’s ability to implement its strategic plan, obtain additional capital and generate net income and positive cash flows from operations. There can be no assurance that these plans will be sufficient or that additional financing will be available in amounts or terms acceptable to the Company, if at all.
ITEM 3. QUANTITATIVE AND QUALITATIVE DISCLOSURES ABOUT MARKET RISK
Not applicable to smaller reporting companies.
| 34 |
ITEM 4. CONTROLS AND PROCEDURES
| (a) Evaluation of Disclosure Controls and Procedures |
Our management maintains disclosure controls and procedures designed to provide reasonable assurance that material information required to be disclosed by us in the reports we file or submit under the Securities Exchange Act of 1934 is recorded, processed, summarized and reported within the time periods specified in the SEC’s rules and forms, and that the information is accumulated and communicated to our management, including our Chief Executive Officer and Chief Financial Officer, as appropriate to allow timely decisions regarding required disclosure. We performed an evaluation, under the supervision and with the participation of our management, including our Chief Executive Officer and Chief Financial Officer, of the effectiveness of the design and operation of our disclosure controls and procedures as of the end of the period covered by this report. Based on this evaluation, our Chief Executive Officer and our Chief Financial Officer have concluded that our disclosure controls and procedures were ineffective in ensuring that information required to be disclosed in reports filed under the Securities Exchange Act of 1934, as amended, is recorded, processed, summarized and reported within the time periods specified by the Securities and Exchange Commission, and were ineffective in providing reasonable assurance that information required to be disclosed by the Company in such reports is accumulated and communicated to the Company’s management, including its Chief Executive Officer and Chief Financial Officer, as appropriate to allow timely decisions regarding required disclosure.
We do not expect that our disclosure controls and procedures will prevent all errors and all instances of fraud. Disclosure controls
and procedures, no matter how well conceived and operated, can provide only reasonable, not absolute, assurance that the objectives
of the disclosure controls and procedures are met. Further, the design of disclosure controls and procedures must reflect the fact
that there are resource constraints, and the benefits must be considered relative to their costs. Because of the inherent limitations
in all disclosure controls and procedures, no evaluation of disclosure controls and procedures can provide absolute assurance that
we have detected all our control deficiencies and instances of fraud, if any. The design of disclosure controls and procedures
also is based partly on certain assumptions about the likelihood of future events, and there can be no assurance that any design
will succeed in achieving its stated goals under all potential future conditions.
| (b) Changes in Internal Control over Financial Reporting |
In connection with the
preparation of our financial statements for the fiscal year ended December 31, 2013, the management determined that our internal
control environment is not properly designed due to the existence of certain material weaknesses and that it did not operate effectively
to ensure that the Company’s financial statements (and related financial statement disclosures) were prepared in accordance
with US generally accepted accounting principles (US GAAP). We have established a number of remediation measures, which we believe
will remediate the material weaknesses identified, if such measures are effectively implemented and maintained. As of the end of
the period covered by the report, we continue the process of implementing and maintaining the remediation measures, but we cannot
assure when or if we will be able to successfully implement these remedial measures. For more information regarding our controls
and procedures, please refer to Item 9A. Controls and Procedures in our Annual Report on Form 10-K for fiscal year ended
December 31, 2013, filed with the SEC on May 22, 2014.
There were no changes in our internal control over financial reporting (as such term is defined in Rules 13a-15(f) and 15d-15(f) under the Exchange Act) during the fiscal quarter covered by this report that has materially affected, or are reasonably likely to materially affect, our internal control over financial reporting.
| 35 |
PART II - OTHER INFORMATION
ITEM 1. Legal Proceedings
We may from time to time become a party to various legal or administrative proceedings arising in the ordinary course of our business.
On November 15, 2011, the Rosen Law Firm filed a class action suit, alleging we had violated federal securities laws by issuing materially false and misleading statements and omitting material facts with regard to disclosure of related party transactions and effectiveness of internal controls in past public filings. The case is currently at the discovery stage, located in the United States District Court for the Central District of California, and we believe there is no basis to the suit filed by the Rosen Law Firm and intend to contest the case vigorously.
On February 13, 2014, the Brown Law Firm filed a derivative action suit on behalf of the Company, alleging certain and former current officers and directors of the Company had violated their fiduciary duties between at least April 22, 2010 to October 20, 2011. All proceedings and discovery in the derivative action is currently stayed by the United States District Court for the Southern District of New York, and the parties are waiting for the Court to schedule a conference in the matter. . Management intends to contest the case vigorously or alternatively to settle the matter in an appropriate manner.
On April 8, 2014, YiNuo Co.ltd filed a law suit in Ningbo Beilun District People’s Court against Ningbo Keyuan Synthetic Rubbers Co., Ltd in a dispute related to product quality, and allegd a claim for damages of RMB 10 million. The hearing was held on August 18, 2014 and the court accepted our counter claim. A second hearing was held on November 7, 2014, and as of the date of this filing, we are still waiting for the issuance of the verdict.
On May 7, 2014, Eastwell International Co.Ltd filed a law suit in Nanjin Intermediate People’s Court against Ningbo Keyuan Synthetic Rubbers Co., Ltd for a breach of contract and disputing product quality and alleged a claim for damages of RMB 21.05 million. We filed a counter claim and plan to contest the suit vigorously. The first hearing at the Court was held on June 18, 2014 and the second hearing was held on July 4, 2014. In the second hearing, Eastwell International Co.Ltd proposed to reduce the claim amount to RMB 14.05 million. We declined the proposal and asked for the third hearing to be held. The third hearing was held on August 19, 2014, and the court ruled against Ningbo Keyuan Synthetic Rubbers Co., Ltd for damages of RMB 2.4 million. We plan to appeal to Jiangsu Province Supreme Court in December 2014.
In connection with two industrial accidents that occurred on May 18, 2014 and September 20, 2014, and which resulted in two deaths and two injuries, we paid a total of RMB 2.5 million (approximately $0.2 million) to settle with the decedents’ families who have agreed not to seek any additional monetary damages from us. We have also paid, as of December 3, 2014, approximately RMB 896,000 (approximately $0.15 million) for the medial expenses for two injured employees and expect that additional amounts may be payable. We have taken all necessary measures to prevent such accidents and do not believe they will materially impact our operation or ability to obtain financings, including bank loans going forward.
On October 28, 2014, Dragon State International Limited (the “Dragon Sate”), the shareholder of Series B preferred stock, filed a complaint alleging, among others, we were in breach of a securities purchase agreement dated September 28, 2010 between Dragon State and us, and seeking rescission of the securities purchase agreement and the return of $20 million, and in the alternative, seeking monetary damages to be determined at trial but not less than $20 million (the “Dragon State Complaint”). We intend to contest the case vigorously or alternatively to settle the matter in an appropriate manner.
On October 30, 2014, in connection with a motion for a temporary restraining order and preliminary injunction filed by Dragon State against the Company and Mr. Chunfeng Tao, a consent order was issued by the District Court for the Southern District of New York whereby the Company and Mr. Chunfeng Tao agree that, notwithstanding anything contained in the certificate of Designations, Preferences and Rights of the Series B Convertible Preferred Stock to the contrary ,the 5,333,334 shares of Series B preferred stock held by Dragon State have not been , and shall not be, automatically converted into shares of Company’s common stock, or any other security prior to the resolution of Dragon State Complaint; and the expiration of Series C and Series D warrants shall be tolled until that time as well.
Other than as set forth herein, we are currently not a party to any material legal or administrative proceedings and are not aware of any pending or threatened legal or administrative proceedings against us.
Item 1A. Risk Factors
Not applicable to smaller reporting companies.
| 36 |
ITEM 2. Unregistered Sales of Equity Securities and Use of Proceeds
(a) Not Applicable.
(b) Not Applicable.
(c ) Not Applicable
ITEM 3. Defaults upon Senior Securities
(a) Not Applicable.
(b) Not Applicable.
ITEM 4. Mine Safety Disclosures
Not applicable.
ITEM 5. OTHER INFORMATION
(a) Not applicable.
(b) Not applicable.
ITEM 6. EXHIBITS
(a) The following exhibits are filed as part of this report.
| 2.1 | Share Exchange Agreement dated April 22, 2010 (incorporated by reference to Exhibit 2.1 of the Registrant’s Form 8-K filed on April 28, 2010) | |
| 2.2 | Agreement and Plan of Merger (incorporated by reference to Exhibit 2.1 of the Registrant’s Form 8-K filed on May 19, 2010) | |
| 3.1 | Amended Articles of Incorporation of Keyuan Petrochemicals, Inc. (f/k/a Silver Pearls, Inc.), filed with the Secretary of State of Nevada (incorporated by reference to Exhibit 3.1 of the Registrant’s Form S-1 filed on December 29, 2010). | |
| 3.2 | Articles of Merger (incorporated by reference to Exhibit 3.1 of the Registrant’s Form 8-K filed on May 19, 2010) | |
| 3.3 | Amended Bylaws of Keyuan Petrochemicals, Inc. dated June 29, 2010 (incorporated by reference to Exhibit 3.1 of the Registrant’s Form 8-K filed on July 7, 2010) | |
| 4.1 | Certificate of Designation of Rights and Preferences of Series A Preferred Stock (incorporated by reference to Exhibit 4.1 of the Registrant’s Form 8-K filed on April 28, 2010) | |
| 4.2 | Certificate of Designation of Rights and Preferences of Series M Preferred Stock (incorporated by reference to Exhibit 4.2 of the Registrant’s Form 8-K filed on April 28, 2010) | |
| 4.3 | Certificate of Designation of Rights and Preference of Series B Preferred Stock (incorporated by reference to Exhibit 3.1 of the Registrant’s Form 8-K filed on September 30, 2010) | |
| 10.1 * | Translation copy of circulating Fund Loan contract by and between Ningbo Keyuan Plastics Co., Ltd and Bank of Ningbo., Baizhang Branch dated August 28, 2014 | |
| 10.2 * | Translation copy of loan contract by and between Ningbo Keyuan Plastics Co., Ltd and Ping An Bank., Ning Bo Branch dated August 29, 2014 | |
| 31.1 * | Certification of Chief Executive Officer required by Rule 13a-14/15d-14(a) under the Exchange Act | |
| 31.2 * | Certification of Chief Financial Officer required by Rule 13a-14/15d-14(a) under the Exchange Act | |
| 32.1 *+ | Certification of Chief Executive Officer pursuant to 18 U.S.C. Section 1350, as adopted pursuant to Section 906 of the Sarbanes-Oxley Act of 2002. | |
| 32.2 *+ | Certification of Chief Financial Officer pursuant to 18 U.S.C. Section 1350, as adopted pursuant to Section 906 of the Sarbanes-Oxley Act of 2002. |
* Filed herewith.
+ This exhibit shall not be deemed “filed” for purposes of Section 18 of the Securities Exchange Act of 1934 or otherwise subject to the liabilities of that section, nor shall it be deemed incorporated by reference in any filing under the Securities Act of 1933 of the Securities Exchange Act of 1934, whether made before or after the date hereof and irrespective of any general incorporation language in any filings.
| 37 |
SIGNATURES
In accordance with the requirements of the Exchange Act, the registrant caused this report to be signed on its behalf by the undersigned, thereunto duly authorized.
| Date: December 3, 2014 | Keyuan Petrochemicals, Inc. | |
| By: | /s/ Chunfeng Tao | |
| Chunfeng Tao | ||
| Chief Executive Officer & President | ||
| By: | /s/ Baojun Zheng | |
|
Baojun Zheng Acting Chief Financial Officer/Vice President of Accounting |
||
38