Attached files
| file | filename |
|---|---|
| 8-K - CURRENT REPORT OF MATERIAL EVENTS OR CORPORATE CHANGES - DAWSON GEOPHYSICAL CO | a14-25444_18k.htm |
Exhibit 99.1
|
|
TGC Industries, Inc. 1 Cowen and Company Ultimate Energy Conference December 2014 NASDAQ: TGE |

|
|
SAFE HARBOR STATEMENT In addition to historical information, this presentation contains forward-looking statements. These statements relate to future events or our future financial performance. These statements are only predictions and involve known and unknown risks, uncertainties, and other factors. The following factors, among others, could cause our actual results and performance to differ materially the results and performance projected in, or implied by, the forward-looking statements: the possibility that the proposed business combination transaction with Dawson Geophysical Company (“Dawson”) does not close when expected or at all because required shareholder or other approvals and other conditions to closing are not received or satisfied on a timely basis or at all; the risk that the benefits from the transaction may not be fully realized or may take longer to realize than expected; the ability to promptly and effectively integrate the businesses of TGC and Dawson; the reaction of the companies’ customers, employees and counterparties to the transaction; diversion of management time on transaction-related issues; our history of losses and possibility of further losses; the effect of poor operating results on our company; fluctuations in operating results from period to period; the effect of growth on our infrastructure, resources, and existing sales; our ability to expand our operations in both new and existing markets; dependence upon energy industry spending for seismic data acquisition services; the unpredictable nature of forecasting weather; the potential for contract delay or cancellation; the potential for fluctuations in oil and natural gas prices; the impact of litigation; our ability to raise capital and the availability of capital resources; our ability to fully utilize and retain executives; the impact of federal, state, or local government regulations; labor shortages or increases in labor costs; economic and political conditions generally; and the effect of competition in the seismic data acquisition industry. We assume no obligation to publicly update or revise these forward-looking statements for any reason, or to update the reasons actual results could differ materially from those anticipated in, or implied by, these forward-looking statements, even if new information becomes available in the future. Although the Company believes the expectations reflected in such forward looking statements are reasonable, it can give no assurance that such expectations will prove to be correct. 2 |
|
|
This presentation does not constitute an offer to sell or the solicitation of an offer to buy any securities or a solicitation of any vote or approval. The transactions contemplated by the merger agreement, including, with respect to Dawson, the proposed merger and, with respect to TGC, the proposed issuance of TGC common stock in the merger and an amendment to TGC’s certificate of formation, will, as applicable, be submitted to the shareholders of Dawson and TGC for their consideration. On November 6, 2014, TGC filed with the Securities and Exchange Commission (SEC) a registration statement on Form S-4 that included a joint proxy statement of Dawson and TGC that also constitutes a prospectus of TGC. After the registration statement has been declared effective and subject to the terms of the merger agreement, Dawson and TGC will mail the joint proxy statement/prospectus to their respective shareholders. Dawson and TGC also plan to file other documents with the SEC regarding the proposed transaction. INVESTORS AND SECURITY HOLDERS OF DAWSON AND TGC ARE URGED TO READ THE JOINT PROXY STATEMENT/PROSPECTUS AND OTHER RELEVANT DOCUMENTS THAT WILL BE FILED WITH THE SEC CAREFULLY AND IN THEIR ENTIRETY WHEN THEY BECOME AVAILABLE BECAUSE THEY WILL CONTAIN IMPORTANT INFORMATION ABOUT THE PROPOSED TRANSACTION. Investors and shareholders may obtain free copies of the joint proxy statement/prospectus filed on November 6, 2014, and will be able to obtain free copies of any amendments to the joint proxy statement/prospectus and other documents containing important information about Dawson and TGC, once such documents are filed with the SEC, through the website maintained by the SEC at www.sec.gov. Dawson and TGC make available free of charge at www.dawson3d.com and www.tgcseismic.com, respectively (in the “Investor Relations” section), copies of materials they file with, or furnish to, the SEC, or investors and shareholders may contact Dawson at (432) 684-3000 or TGC at (972) 881-1099 or c/o Dennard-Lascar Associates at (713) 529-6600 to receive copies of documents that each company files with or furnishes to the SEC. 3 IMPORTANT INFORMATION FOR INVESTORS AND SHAREHOLDERS PARTICIPANTS IN THE MERGER SOLICITATION TGC and certain of its directors and officers may be deemed to be participants in the solicitation of proxies from the shareholders of Dawson and TGC in connection with the proposed transactions. Information about the directors and officers of TGC is set forth in the joint proxy statement/prospectus. These documents can be obtained free of charge from the sources indicated above. Other information regarding the participants in the proxy solicitation and a description of their direct and indirect interests, by security holdings or otherwise, will be contained in the joint proxy statement/prospectus and other relevant materials to be filed with the SEC when they become available. |
|
|
COMPANY OVERVIEW A leading provider of onshore seismic data acquisition services in the U.S. and Canada Over 46 years of experience in seismic data acquisition Eagle Canada is a leading provider of seismic data acquisition services to the Canadian energy industry TGC acquires geophysical data using the most advanced three-dimensional (3-D) survey techniques – utilizing both cable and nodal technologies Current capacity: 17 seismic data acquisition crews in U.S. and Canada 9 ARAM systems, 7 Geospace nodal systems, 1 INOVA Hawk nodal system Total channel count approximately 145,000 (ARAM, Geospace, INOVA) Field offices strategically located in key customer centers Houston – Midland – Oklahoma City – Calgary Dedicated to safety - with safety personnel at each work location Experienced management team 4 |
|
|
FULL RANGE OF SEISMIC DATA ACQUISITION SERVICES Permitting Acquire land permits for clients Surveying Survey crews equipped with the latest Trimble GPS receivers for accurate and dependable field operations Survey crews deploy source and receiver points and complete ground operations Utilize the latest mapping software Vibroseis Projects Complete array of vibroseis vehicles 73 vibration vehicles, from large all terrain buggies to urban-friendly Enviro-Vibe mini-buggies Equipped with advanced electronics Drilling for Shot-Hole Work TGC has its own fleet of rugged, all-terrain shot-hole drill rigs Reduces third party costs, improves crew availability, equipment quality, crew expertise and productivity All rigs staffed by Tidelands’ employees, with experienced project management and support Data Acquisition Experienced crews / Crew managers have 20+ years experience Seismic crews, comprised of 40 to 80 people, deploy geophysical equipment in field Crews deployed to diverse environments and terrains in locations throughout the U.S. and Canada 5 We help customers reduce finding costs and increase exploration and development productivity. |
|
|
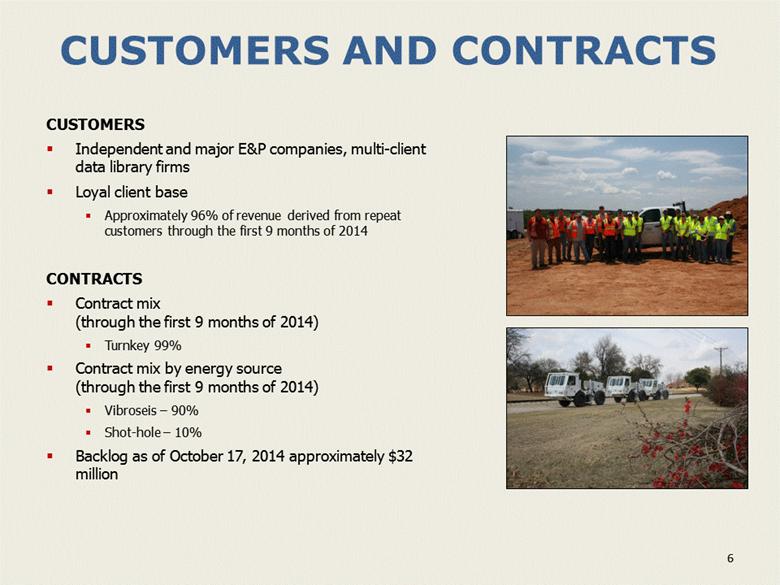
CUSTOMERS AND CONTRACTS CUSTOMERS Independent and major E&P companies, multi-client data library firms Loyal client base Approximately 96% of revenue derived from repeat customers through the first 9 months of 2014 CONTRACTS Contract mix (through the first 9 months of 2014) Turnkey 99% Contract mix by energy source (through the first 9 months of 2014) Vibroseis – 90% Shot-hole – 10% Backlog as of October 17, 2014 approximately $32 million 6 |
|
|
TGC FINANCIALS 7 |

|
|
REVENUES 8 86,770 $ in thousands |
|
|
DILUTED EARNINGS PER SHARE 9 Per share amounts adjusted to reflect the 5% stock dividends paid in 2008, 2009, 2010, 2012, and 2013. 2008 2009 2010 2011 2012 2013 9Mos2014 |
|
|
EBITDA 10 EBITDA is a non-GAAP financial measure. For a definition of EBITDA and a reconciliation of EBITDA to our net income (loss), see Slide 17. $ in thousands |
|
|
STRONG CAPITALIZATION 11 $ in thousands 9/30/2014 12/31/2013 12/31/2012 12/31/2011 Cash, cash equivalents 25,064 16,130 8,614 15,746 Short-term debt 10,152 9,858 12,576 7,139 Long-term debt 6,677 7,385 16,298 6,956 Shareholders’ equity 63,990 69,131 77,986 63,720 Total assets 95,956 98,302 142,028 99,881 |
|
|
FINANCIAL HIGHLIGHTS 12 Per share amounts adjusted to reflect the 5% stock dividends paid in 2008, 2009, 2010, 2012, and 2013. EBITDA is a non-GAAP financial measure. For a definition of EBITDA and a reconciliation of EBITDA to our net income (loss), see Slide 17. EBITDA Margin is computed by dividing EBITDA by revenues for the period. $ in thousands except EPS and percentages 2008 2009 2010 2011 2012 2013 9 Mos 2014 Revenues 86,770 90,432 108,319 151,029 196,317 134,535 93,133 D&A Expense 13,911 14,621 15,344 19,214 25,503 24,644 14,640 % of Revenue 16.0% 16.2% 14.2% 12.7% 13.0% 18.3% 15.7% Income (loss) from Ops 12,455 4,908 148 18,165 26,779 (7,378) (5,210) Diluted EPS 0.32 0.09 (0.06) 0.50 0.72 (0.29) (0.17) EBITDA 26,366 19,529 15,491 37,379 52,282 17,266 9,430 EBITDA Margin 30.4% 21.6% 14.3% 24.7% 26.6% 12.8% 10.1% |
|
|
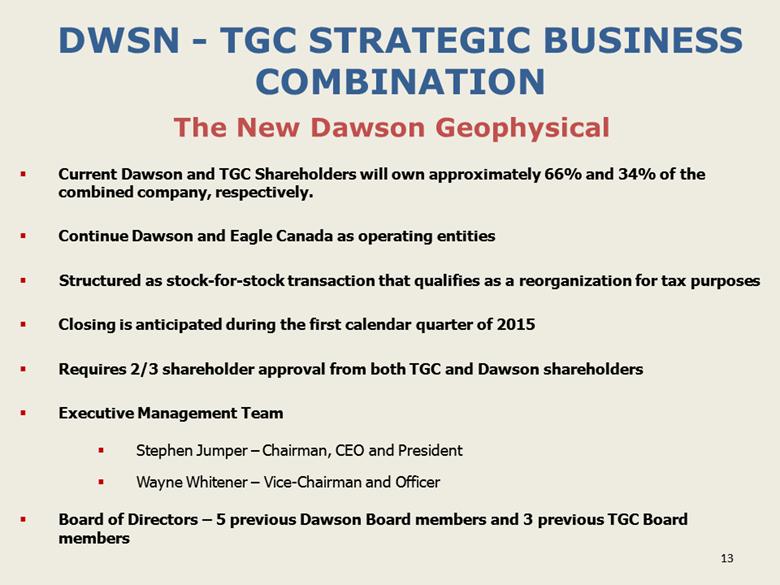
DWSN - TGC STRATEGIC BUSINESS COMBINATION Current Dawson and TGC Shareholders will own approximately 66% and 34% of the combined company, respectively. Continue Dawson and Eagle Canada as operating entities Structured as stock-for-stock transaction that qualifies as a reorganization for tax purposes Closing is anticipated during the first calendar quarter of 2015 Requires 2/3 shareholder approval from both TGC and Dawson shareholders Executive Management Team Stephen Jumper – Chairman, CEO and President Wayne Whitener – Vice-Chairman and Officer Board of Directors – 5 previous Dawson Board members and 3 previous TGC Board members 13 The New Dawson Geophysical |
|
|
THE NEW DAWSON GEOPHYSICAL Expanded Geographic Presence Will operate in every major basin in the US Eagle Canada provides strong Canadian presence Combined Equipment Base Increases utilization Lowers cost Drives value for clients, shareholders and employees Combined Order Book Strength Improves utilization rates Lowers costs Strengthened Balance Sheet with Improved Financial Flexibility 14 |

|
|
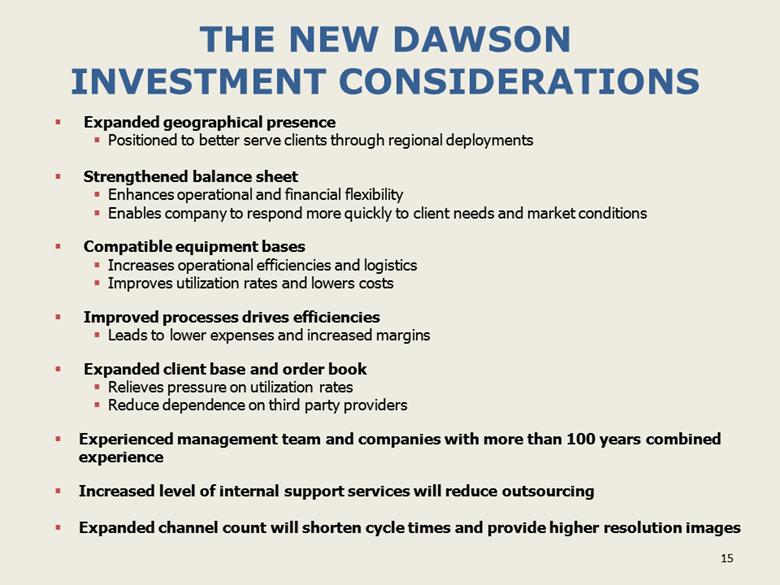
THE NEW DAWSON INVESTMENT CONSIDERATIONS Expanded geographical presence Positioned to better serve clients through regional deployments Strengthened balance sheet Enhances operational and financial flexibility Enables company to respond more quickly to client needs and market conditions Compatible equipment bases Increases operational efficiencies and logistics Improves utilization rates and lowers costs Improved processes drives efficiencies Leads to lower expenses and increased margins Expanded client base and order book Relieves pressure on utilization rates Reduce dependence on third party providers Experienced management team and companies with more than 100 years combined experience Increased level of internal support services will reduce outsourcing Expanded channel count will shorten cycle times and provide higher resolution images 15 |
|
|
THE NEW DAWSON 16 $ in thousands except EPS Pro Forma Income Statement Data Dawson TGE Pro Forma Combined Crew counts * 10 5 15 Total channels * 178,000 145,000 323,000 * Active during the quarter ended September 30, 2014 Nine Months Ended Year Ended June 30, 2014 September 30, 2013 Operating revenue $297,171 $451,512 Income (loss) from operations (15,390) 19,565 Income (loss) before income tax (16,262) 17,863 Net income (loss) (11,941) 8,314 Basic income (loss) per common share ($0.55) $0.38 Diluted income (loss) per common share ($0.55) $0.38 |
|
|
APPENDIX 17 |

|
|
EBITDA RECONCILIATION EBITDA is a non-GAAP financial measure. We define EBITDA as net income (loss) plus depreciation and amortization expense, interest expense and income tax expense. We use EBITDA as a supplemental financial measure to assess: (i) the financial performance of our assets without regard to financing methods, capital structures, taxes, or historical cost basis; (ii) our liquidity and operating performance over time and in relation to other companies that own similar assets and that we believe calculate EBITDA in a manner similar to us; and (iii) the ability of our assets to generate cash sufficient for us to pay potential interest costs. We also understand that such data is used by investors to assess our performance. However, EBITDA is not a measure of operating income, operating performance, or liquidity presented in accordance with generally accepted accounting principles. When assessing our operating performance or our liquidity, investors should not consider this data in isolation or as a substitute for our net income, cash flow from operating activities, or other cash flow data calculated in accordance with generally accepted accounting principles. EBITDA excludes some, but not all, items that affect net income and operating income, and these measures may vary among other companies. Therefore, EBITDA as presented above may not be comparable to similarly titled measures of other companies. Further, the results presented by EBITDA cannot be achieved without incurring the costs that the measure excludes: depreciation and amortization expense, interest expense and income tax expense. 18 The following table reconciles our EBITDA to our net income (loss). 2008 2009 2010 2011 2012 2013 9 Mos Ended Sept. 30, 2014 Net Income (loss) $6,898,442 $1,879,619 ($1,222,682) $10,833,215 $15,671,879 ($6,316,041) ($3,761,777) Depreciation and Amortization Expense 13,911,124 14,621,237 15,343,804 19,214,069 25,502,597 24,644,190 14,639,933 Interest Expense 929,656 1,020,681 790,417 784,425 1,222,454 1,091,476 506,296 Income Tax Expense (Benefit) 4,626,569 2,007,811 579,900 6,547,250 9,885,078 (2,153,509) (1,954,251) ___________ ___________ ___________ ___________ ___________ ___________ ___________ EBITDA $26,365,791 $19,529,348 $15,491,439 $37,378,959 $52,282,008 $17,266,116 $9,430,201 |
|
|
TGC Industries, Inc. Thank you for your interest. 19 |