Attached files
| file | filename |
|---|---|
| EX-31.2 - EX-31.2 - DAWSON GEOPHYSICAL CO | dwsn-20191231ex3127ecd62.htm |
| EX-32.2 - EX-32.2 - DAWSON GEOPHYSICAL CO | dwsn-20191231ex322bb7845.htm |
| EX-32.1 - EX-32.1 - DAWSON GEOPHYSICAL CO | dwsn-20191231ex321bb3a33.htm |
| EX-31.1 - EX-31.1 - DAWSON GEOPHYSICAL CO | dwsn-20191231ex31123eb2c.htm |
| EX-23.1 - EX-23.1 - DAWSON GEOPHYSICAL CO | dwsn-20191231ex231b15cb5.htm |
| EX-21.1 - EX-21.1 - DAWSON GEOPHYSICAL CO | dwsn-20191231ex211f43b84.htm |
| EX-4.2 - EX-4.2 - DAWSON GEOPHYSICAL CO | dwsn-20191231ex4211b3e03.htm |
UNITED STATES
SECURITIES AND EXCHANGE COMMISSION
Washington, D.C. 20549
Form 10-K
☒ANNUAL REPORT PURSUANT TO SECTION 13 OR 15(d) OF THE SECURITIES EXCHANGE ACT OF 1934
For the Fiscal Year Ended December 31, 2019
☐TRANSITION REPORT PURSUANT TO SECTION 13 OR 15(d) OF THE SECURITIES EXCHANGE ACT OF 1934
For the Transition Period From to
Commission File No. 001-32472
DAWSON GEOPHYSICAL COMPANY
(Exact name of registrant as specified in its charter)
|
Texas |
|
74-2095844 |
|
(State or other jurisdiction of |
|
(I.R.S. Employer |
|
incorporation or organization) |
|
Identification No.) |
508 West Wall, Suite 800, Midland, Texas 79701
(Address of Principal Executive Office) (Zip Code)
Registrant’s Telephone Number, including area code: 432-684-3000
Securities registered pursuant to Section 12(b) of the Act:
|
Title of Each Class |
Trading Symbol(s) |
Name of Exchange on Which Registered |
|
Common Stock, $0.01 par value |
DWSN |
The NASDAQ Stock Market |
Securities registered pursuant to Section 12(g) of the Act: None
Indicate by check mark if the registrant is a well-known seasoned issuer, as defined in Rule 405 of the Securities Act. Yes ☐ No ☒
Indicate by check mark if the registrant is not required to file reports pursuant to Section 13 or Section 15(d) of the Act. Yes ☐ No ☒
Indicate by check mark whether the registrant: (1) has filed all reports required to be filed by Section 13 or 15(d) of the Securities Exchange Act of 1934 during the preceding 12 months (or for such shorter period that the registrant was required to file such reports) and (2) has been subject to such filing requirements for the past 90 days. Yes ☒ No ☐
Indicate by check mark whether the registrant has submitted electronically every Interactive Data File required to be submitted pursuant to Rule 405 of Regulation S-T (§ 232 405 of the chapter) during the preceding 12 months (or for such shorter period that the registrant was required to submit such files). Yes ☒ No ☐
Indicate by check mark whether the registrant is a large accelerated filer, an accelerated filer, a non-accelerated filer, a smaller reporting company, or an emerging growth company. See the definitions of “large accelerated filer,” “accelerated filer,” “smaller reporting company,” and “emerging growth company” in Rule 12b-2 of the Exchange Act.
|
Large accelerated filer ☐ |
Accelerated filer ☒ |
Non-accelerated filer ☐ |
Smaller reporting company ☒ |
Emerging growth company ☐ |
If an emerging growth company, indicate by check mark if the registrant has elected not to use the extended transition period for complying with any new or revised financial accounting standards provided pursuant to section 13(a) of the Exchange Act. ☐
Indicate by check mark whether the registrant is a shell company (as defined in Rule 12b-2 of the Act). Yes ☐ No ☒
As of June 28, 2019, the aggregate market value of Dawson Geophysical Company common stock, par value $0.01 per share, held by non-affiliates (based upon the closing transaction price on Nasdaq) was approximately $54,112,000.
On March 4, 2020, there were 23,287,410 shares of Dawson Geophysical Company common stock, $0.01 par value outstanding.
As used in this report, the terms “we,” “our,” “us,” “Dawson” and the “Company” refer to Dawson Geophysical Company unless the context indicates otherwise.
DOCUMENTS INCORPORATED BY REFERENCE
Portions of the Registrant’s Proxy Statement for its 2020 Annual Meeting of Shareholders are incorporated by reference into Part III of this Annual Report on Form 10-K.
1
DAWSON GEOPHYSICAL COMPANY
FORM 10‑K
For the Year Ended December 31, 2019
DISCLOSURE REGARDING FORWARD‑LOOKING STATEMENTS
Statements other than statements of historical fact included in this Form 10‑K that relate to forecasts, estimates or other expectations regarding future events, including without limitation, statements under “Management’s Discussion and Analysis of Financial Condition and Results of Operations” and “Business” regarding technological advancements and our financial position, business strategy, and plans and objectives of our management for future operations, may be deemed to be forward‑looking statements within the meaning of Section 27A of the Securities Act and Section 21E of the Securities Exchange Act of 1934, as amended (the “Exchange Act”). When used in this Form 10‑K, words such as “anticipate,” “believe,” “estimate,” “expect,” “intend” and similar expressions, as they relate to us or our management, identify forward‑looking statements. Such forward‑looking statements are based on the beliefs of our management, as well as assumptions made by and information currently available to management. Actual results could differ materially from those contemplated by the forward‑looking statements as a result of certain factors, including, but not limited to, dependence upon energy industry spending; the volatility of oil and natural gas prices; changes in economic conditions; the potential for contract delays; reductions or cancellations of service contracts; limited number of customers; credit risk related to our customers; reduced utilization; high fixed costs of operations and high capital requirements; operational disruptions; industry competition; external factors affecting the Company’s crews such as weather interruptions and inability to obtain land access rights of way; whether the Company enters into turnkey or day rate contracts; crew productivity; the availability of capital resources; and disruptions in the global economy. See “Risk Factors” for more information on these and other factors. These forward‑looking statements reflect our current views with respect to future events and are subject to these and other risks, uncertainties and assumptions relating to our operations, results of operations, growth strategies and liquidity. The cautionary statements made in this Form 10‑K should be read as applying to all related forward‑looking statements wherever they appear in this Form 10‑K. All subsequent written and oral forward‑looking statements attributable to us or persons acting on our behalf are expressly qualified in their entirety by this paragraph. We assume no obligation to update any such forward‑looking statements.
2
General
Dawson Geophysical Company, a Texas corporation (the “Company”), is a leading provider of North American onshore seismic data acquisition services with operations throughout the continental United States (“U.S.”) and Canada. We acquire and process 2‑D, 3‑D and multi‑component seismic data for our clients, ranging from major oil and gas companies to independent oil and gas operators as well as providers of multi‑client data libraries. Our principal business office is located at 508 West Wall, Suite 800, Midland, Texas 79701 (Telephone: 432‑684‑3000), and our internet address is www.dawson3d.com. We make available free of charge on our website our annual reports on Form 10‑K, quarterly reports on Form 10‑Q, and current reports on Form 8‑K as soon as reasonably practicable after filing or furnishing such information with the Securities and Exchange Commission (“SEC”).
On February 11, 2015, the Company, which was formerly known as TGC Industries, Inc. (“Legacy TGC”), consummated a strategic business combination with Dawson Operating Company, which was formerly known as Dawson Geophysical Company (“Legacy Dawson”), pursuant to which a wholly‑owned subsidiary of Legacy TGC merged with and into Legacy Dawson, with Legacy Dawson continuing after the merger as the surviving entity and a wholly‑owned subsidiary of Legacy TGC (the “Merger”). In connection with the Merger, Legacy Dawson changed its name to “Dawson Operating Company” and Legacy TGC changed its name to “Dawson Geophysical Company.” Legacy TGC was formed in 1980. Legacy Dawson was formed in 1952.
Except as otherwise specifically noted herein, references herein to the “Company,” “we,” “us” or “our” refer to post‑combination Dawson Geophysical Company and its consolidated subsidiaries, including Legacy Dawson.
We provide our seismic data acquisition services primarily to providers of multi‑client data libraries for use in the onshore drilling and production of oil and natural gas in the continental U.S. and Canada, as well as directly to onshore oil and natural gas exploration and development companies. The main factors influencing demand for seismic data acquisition services in our industry are the level of drilling and completion activity by oil and natural gas companies and the size of such companies’ exploration and development budgets, which, in turn, depend largely on current and anticipated future crude oil and natural gas prices and production levels and depletion rates of the companies’ oil and natural gas reserves.
Our seismic crews supply seismic data primarily to companies engaged in the exploration and development of oil and natural gas on land and in land‑to‑water transition areas. Seismic acquisition services of our wholly‑owned subsidiary, Eagle Canada Seismic Services, ULC (“Eagle Canada”), are also used by the potash mining industry in Canada, and Eagle Canada has particular expertise through its heliportable capabilities. Our clients rely on seismic data to identify areas where subsurface conditions are favorable for the accumulation of existing hydrocarbons, to optimize the development and production of hydrocarbon reservoirs, to better delineate existing oil and natural gas fields, and to augment reservoir management techniques. In addition, seismic data are sometimes utilized in unconventional reservoirs to identify geo-hazards (such as subsurface faults) for drilling purposes, aid in geo-steering of a horizontal well bore and rock property identification for high grading of well locations and hydraulic fracturing. The majority of our current activity is in areas of unconventional reservoirs.
We acquire geophysical data using the latest in 3‑D seismic survey techniques. We introduce acoustic energy into the ground by using vibration equipment or dynamite detonation, depending on the surface terrain, area of operation, and subsurface requirements. The reflected energy, or echoes, are received through geophones, converted into a digital signal at a multi‑channel recording unit, and then transmitted to a central recording vehicle. Subsurface requirements dictate the number of channels necessary to perform our services. We generally use tens of thousands of recording channels in our 3-D seismic surveys. Additional recording channels enhance the resolution of the seismic survey through increased imaging analysis and provide improved operational efficiencies for our clients. With our state‑of‑the‑art seismic equipment, including computer technology and multiple channels, we acquire, on an efficient basis, immense volumes of seismic data that, when processed and interpreted, produce precise images of the earth’s subsurface. Our clients then use our seismic
3
data to generate 3‑D geologic models that help reduce drilling risks, finding and development costs, and improve recovery rates from existing fields.
In addition to conventional 2‑D and 3‑D seismic surveys, we provide what the industry refers to as multi‑component seismic data surveys. Multi‑component surveys involve the recording of alternative seismic waves known as shear waves. Shear waves can be recorded as wave conversion of conventional energy sources (3‑C converted waves) or from horizontal vibrator energy source units (shear wave vibrators). Multi‑component data are utilized in further analysis of subsurface rock type, fabric and reservoir characterization. We own equipment required for onshore multi‑component surveys. The majority of the projects in Canada require multi‑component recording equipment. We have operated one to two multi‑component equipped crews in the U.S. routinely over the past few years. The use of multi‑component seismic data could increase in North America over the next few years if industry conditions improve and potentially require capital expenditures for additional equipment.
In recent years, we have begun providing surface‑recorded microseismic services utilizing equipment we own. Microseismic monitoring is used by clients who use hydraulic fracturing to extract hydrocarbon deposits to monitor their hydraulic fracturing operations.
We market and supplement our services in the continental U.S. from our headquarters in Midland, Texas and from additional offices in three other cities in Texas (Denison, Houston and Plano) as well as two additional states, Oklahoma (Oklahoma City) and Colorado (Denver). In addition, we market and supplement our services in Canada from our facilities in Calgary, Alberta.
The Industry
Technological advances in seismic equipment and computing allow the seismic industry to acquire and process, on an efficient basis, immense volumes of seismic data which produce precise images of the earth’s subsurface. The latest accepted method of seismic data acquisition, processing, and the subsequent interpretation of the processed data is the 3‑D seismic method. Geophysicists use computer workstations to interpret 3‑D data volumes, identify subsurface anomalies, and generate a geologic model of subsurface features. In contrast with the 3‑D method, the 2‑D method involves the collection of seismic data in a linear fashion, thus generating a single plane of subsurface seismic data. Over recent years, the size of our surveys and density of recording channels and vibrator energy source units has increased resulting in an increase in required recording channels and energy source units to perform such surveys.
3‑D seismic data are used in the exploration and development of new reserves and enable oil and natural gas companies to better delineate existing fields and to augment their reservoir management techniques. Benefits of incorporating high resolution 3‑D seismic surveys into exploration and development programs include reducing drilling risk, decreasing oil and natural gas finding costs, and increasing the efficiencies of reservoir location, delineation, and management. In order to meet the requirements necessary to fully realize the benefits of 3‑D seismic data, there is an increasing demand for improved data quality with greater subsurface resolution with increased density of recording channels and vibrator energy source units.
Currently, the North American seismic data acquisition industry is made up of a number of companies divided into two groups. The first group is made up of publicly‑traded companies which includes us and SAExploration Holdings, Inc. (“SAE”). The second group is made up of Echo Seismic Ltd. (“ECHO”), Breckenridge Geophysical Inc. (“Breckenridge”), and Paragon Geophysical Services, Inc. (“Paragon”), along with smaller companies which generally run one or two small channel count seismic crews and often specialize in specific regions or types of operations.
Equipment and Crews
In recent years, we have experienced continued increases in recording channel capacity and vibrator energy source units on a per crew or project basis. This increase in channel count and energy source unit demand is driven by client needs and is necessary in order to produce higher resolution images, increase crew efficiencies and undertake larger scale projects. Due to the increase in demand for higher channel counts, we have continued our investments in additional channels. In response to project‑based channel requirements, we routinely deploy a variable number of channels on a variable number of crews in an effort to maximize asset utilization and meet client needs. While the number of recording systems we own may exceed the number utilized in the field at any given time, we maintain the excess equipment to provide additional operational flexibility and to allow us to quickly deploy additional recording channels and energy source
4
units as needed to respond to client demand and desire for improved data quality with greater subsurface images. We believe we will realize the benefit of increased channel counts and flexibility of deployment through increased crew efficiencies, higher revenues and margins with improved conditions.
In recent years, we have purchased or leased a significant number of cableless recording channels. We utilize this equipment primarily as stand‑alone recording systems. As a result of the introduction of cableless recording systems, we have realized increased crew efficiencies and increased channels on projects using this equipment. We believe we will experience continued demand for cableless recording systems and increased channel count in the future.
As of December 31, 2019, we operate 117 vibrator energy source units and approximately 268,000 recording channels. The recording channels consist of 93,000 single-channel GSR boxes, 45,500 three-channel GSR boxes, 3,600 four-channel GSR boxes and 8,000 three-channel INOVA Hawk boxes. Each crew consists of approximately 40 to 100 technicians with associated vehicles, geophones, a seismic recording system, energy sources, cables, and a variety of other equipment. The GSR and INOVA Hawk crews utilize a recorder to manage the data acquisition while the individual system captures and holds the data until they are placed in the Data Transfer Module. The data is then transferred to various data storage media, which are delivered to a data processing center selected by the client.
Equipment Acquisition and Capital Expenditures
We monitor and evaluate advances in geophysical technology and commit capital funds to purchase the equipment we deem most effective to maintain our competitive position. Purchasing and updating seismic equipment and technology involves a commitment to capital spending. We also tie our capital expenditures closely to demand for our services. Beginning in 2014, we adopted a maintenance capital expenditures program due to the belief that our equipment base was sufficient to meet current demand; however, our Board of Directors may increase the capital budget in response to strategic opportunities to acquire seismic recording equipment. Our Board of Directors approved a maintenance capital expenditure budget of $10,000,000 for 2019 of which we utilized $3,590,000 during the 12 months ended December 31, 2019. Our Board of Directors has approved an initial maintenance capital expenditure budget of $5,000,000 for 2020.
Clients
Our services are marketed by supervisory and executive personnel who contact clients to determine geophysical needs and respond to client inquiries regarding the availability of crews or processing schedules. These contacts are based principally upon professional relationships developed over a number of years.
Our clients range from major oil and gas companies to small independent oil and gas operators and also providers of multi‑client data libraries. The services we provide to our clients vary according to the size and needs of each client. During the twelve months ended December 31, 2019, sales to four clients represented approximately 60% of our revenues. We anticipate that sales to these clients will represent a smaller percentage of our overall revenues during 2020. The remaining balance of our revenues were derived from varied clients and none represented 10% or more of our revenues.
We do not acquire seismic data for our own account or for future sale, maintain multi‑client seismic data libraries, or participate in oil and gas ventures. The results of seismic surveys conducted for a client belong to that client. It is also our policy that none of our officers, directors or employees actively participate in oil and natural gas ventures. All of our clients’ information is maintained in the strictest confidence.
Domestic and Foreign Operations
We derive our revenue from domestic and foreign sources. Total revenues for the twelve months ended December 31, 2019 were approximately $145,773,000, of which $129,452,000 was earned in the U.S. and $16,321,000 was earned in Canada. Total revenues for the twelve months ended December 31, 2018 were approximately $154,156,000, of which $137,101,000 was earned in the U.S. and $17,055,000 was earned in Canada.
Net property and equipment as of December 31, 2019 was approximately $53,549,000, of which $45,653,000 was located in the U.S. and $7,896,000 was located in Canada. Net right-of-use assets as of December 31, 2019 were approximately $6,605,000, of which $5,893,000 was located in the U.S. and $712,000 was located in Canada. Net property and equipment as of December 31, 2018 was approximately $71,541,000, of which $62,033,000 was located in the U.S. and $9,508,000 was located in Canada.
5
Contracts
Our contracts are obtained either through competitive bidding or as a result of client negotiations. Our services are conducted under general service agreements for seismic data acquisition services which define certain obligations for us and for our clients. A supplemental agreement setting forth the terms of a specific project, which may be canceled by either party on short notice, is entered into for every project. We currently operate under supplemental agreements that are either “turnkey” agreements providing for a fixed fee to be paid to us for each unit of data acquired or “term” agreements providing for a fixed hourly, daily, or monthly fee during the term of the project or projects.
Currently, as in recent years, most of our projects are operated under turnkey agreements. Turnkey agreements generally provide us more profit potential, but involve more risks because of the potential of crew downtime or operational delays. We attempt to negotiate on a project‑by‑project basis some level of weather downtime protection within the turnkey agreements. Under the term agreements, we forego an increased profit potential in exchange for a more consistent revenue stream with improved protection from crew downtime or operational delays.
Competition
The acquisition of seismic data for the oil and natural gas industry is a highly competitive business. Contracts for such services generally are awarded on the basis of price quotations, crew experience, and the availability of crews to perform in a timely manner, although factors other than price, such as crew safety, performance history, and technological and operational expertise, are often determinative. Our competition includes publicly traded competitors, such as SAE. Our other major competitors include ECHO, Breckenridge, and Paragon. In addition to these previously named companies, we also compete for projects from time to time with smaller seismic companies which operate in local markets with only one or two small channel count crews. Further, the barriers to entry in the seismic industry are not prohibitive, and it would not be difficult for seismic companies outside of the U.S. to enter the domestic market and compete with us.
Employees
As of December 31, 2019, we employed 455 full‑time employees, of which 72 consisted of management, sales, and administrative personnel with the remainder being crew and crew support personnel. Our employees are not represented by a labor union. We believe we have good relations with our employees.
See “Item 2. Properties” for a description of the material properties utilized in our business.
An investment in our common stock is subject to a number of risks, including those discussed below. You should carefully consider these discussions of risk and the other information included in this Form 10‑K. These risk factors could affect our actual results and should be considered carefully when evaluating us. Although the risks described below are the risks that we believe are material, they are not the only risks relating to our business, our industry and our common stock. Additional risks and uncertainties, including those that are not yet identified or that we currently believe are immaterial, may also adversely affect our business, financial condition or results of operations. If any of the events described below occur, our business, financial condition or results of operations could be materially adversely affected.
We derive substantially all of our revenues from providers of multi-client data libraries and companies in the oil and natural gas exploration and development industry. The oil and natural gas industry is a historically cyclical industry with levels of activity that are significantly affected by the levels and volatility of oil and natural gas prices.
Demand for our services depends upon the level of expenditures by oil and natural gas companies for exploration, production, development and field management activities, which depend primarily on oil and natural gas prices. Significant fluctuations in domestic oil and natural gas exploration activities and commodity prices have affected, and will continue to affect, demand for our services and our results of operations. We could be adversely impacted if the level of such exploration activities and the prices for oil and natural gas were to significantly decline in the future. In addition to the market prices of oil and natural gas, the willingness of our clients to explore, develop and produce depends largely upon prevailing industry conditions that are influenced by numerous factors over which our management has no control, including general economic conditions and the availability of credit. Any prolonged reduction in the overall level of
6
exploration and development activities, whether resulting from changes in oil and natural gas prices or otherwise, could adversely impact us in many ways by negatively affecting:
|
· |
our revenues, cash flows, and profitability; |
|
· |
our ability to maintain or increase our borrowing capacity; |
|
· |
our ability to obtain additional capital to finance our business and the cost of that capital; and |
|
· |
our ability to attract and retain skilled personnel whom we would need in the event of an upturn in the demand for our services. |
Worldwide political, economic, and military events have contributed to oil and natural gas price volatility and are likely to continue to do so in the future. Depending on the market prices of oil and natural gas, oil and natural gas exploration and development companies may cancel or curtail their capital expenditure and drilling programs, thereby reducing demand for our services, or may become unable to pay, or have to delay payment of, amounts owed to us for our services. Oil and natural gas prices have been highly volatile historically and, we believe, will continue to be so in the future. Many factors beyond our control affect oil and natural gas prices, including:
|
· |
the cost of exploring for, producing, and delivering oil and natural gas; |
|
· |
the discovery rate of new oil and natural gas reserves; |
|
· |
the rate of decline of existing and new oil and natural gas reserves; |
|
· |
available pipeline and other oil and natural gas transportation capacity; |
|
· |
the ability of oil and natural gas companies to raise capital and debt financing; |
|
· |
actions by OPEC (the Organization of Petroleum Exporting Countries); |
|
· |
political instability in the Middle East and other major oil and natural gas producing regions; |
|
· |
economic conditions in the U.S. and elsewhere; |
|
· |
domestic and foreign tax policy; |
|
· |
domestic and foreign energy policy including increased emphasis on alternative sources of energy; |
|
· |
weather conditions in the U.S., Canada and elsewhere; |
|
· |
the pace adopted by foreign governments for the exploration, development, and production of their national reserves; |
|
· |
the price of foreign imports of oil and natural gas; and |
|
· |
the overall supply and demand for oil and natural gas. |
We, and our clients, may be adversely affected by an economic downturn.
An economic downturn could have a material adverse effect on our financial results and proposed plan of operations and could lead to further significant fluctuations in the demand for and pricing of oil and gas. Reduced demand and pricing pressures could adversely affect the financial condition and results of operations of our clients and their ability to purchase our services. We are not able to predict the timing, extent, and duration of the economic cycles in the markets in which we operate.
7
A limited number of clients operating in a single industry account for a significant portion of our revenues, and the loss of one of these clients could adversely affect our results of operations.
We derive a significant amount of our revenues from a relatively small number of oil and gas exploration and development companies and providers of multi‑client data libraries. During the twelve months ended December 31, 2019, our four largest clients accounted for approximately 60% of our revenues. If these clients, or any of our other significant clients, were to terminate their contracts or fail to contract for our services in the future because they are acquired, alter their exploration or development strategy, experience financial difficulties or for any other reason, our results of operations could be adversely affected.
Our clients could delay, reduce or cancel their service contracts with us on short notice, which may lead to lower than expected demand and revenues.
Our order book reflects client commitments at levels we believe are sufficient to maintain operations on our existing crews for the indicated periods. However, our clients can delay, reduce or cancel their service contracts with us on short notice. If the oil and natural gas industry incurs a downturn, it may result in an increase in delays, reductions or cancellations by our clients. In addition, the timing of the origination and completion of projects and when projects are awarded and contracted for is also uncertain. As a result, our order book as of any particular date may not be indicative of actual demand and revenues for any succeeding period.
Our revenues, operating results and cash flows can be expected to fluctuate from period to period.
Our revenues, operating results and cash flows may fluctuate from period to period. These fluctuations are attributable to the level of new business in a particular period, the timing of the initiation, progress or cancellation of significant projects, higher revenues and expenses on our dynamite contracts, and costs we incur to train new crews we may add in the future to meet increased client demand. Fluctuations in our operating results may also be affected by other factors that are outside of our control such as permit delays, weather delays and crew productivity. Oil and natural gas prices have continued to be volatile and have resulted in significant demand fluctuations for our services. There can be no assurance of future oil and gas price levels or stability. Our operations in Canada are also seasonal as a result of the thawing season and we have historically experienced limited Canadian activity during the second and third quarters of each year. The demand for our services would be adversely affected by a significant reduction in oil and natural gas prices and by climate change legislation or material changes to U.S. energy policy. Because our business has high fixed costs, the negative effect of one or more of these factors could trigger wide variations in our operating revenues, cash flows, EBITDA, margin, and profitability from quarter‑to‑quarter, rendering quarter‑to‑quarter comparisons unreliable as an indicator of performance. Due to the factors discussed above, you should not expect sequential growth in our quarterly revenues and profitability.
We extend credit to our clients without requiring collateral, and a default by a client could have a material adverse effect on our operating revenues.
We perform ongoing credit evaluations of our clients’ financial conditions and, generally, require no collateral from our clients. It is possible that one or more of our clients will become financially distressed, especially in light of the recent downturn in the oil and natural gas industry and fluctuations in commodity prices, which could cause them to default on their obligations to us and could reduce the client’s future need for seismic services provided by us. Our concentration of clients may also increase our overall exposure to these credit risks. A default in payment from one of our large clients could have a material adverse effect on our operating results for the period involved.
We incur losses.
We incurred net losses of $15,213,000 for the twelve months ended December 31, 2019 and $24,407,000 for the twelve months ended December 31, 2018.
Our ability to be profitable in the future will depend on many factors beyond our control, but primarily on the level of demand for land‑based seismic data acquisition services by oil and natural gas exploration and development companies. Even if we do achieve profitability, we may not be able to sustain or increase profitability on a quarterly or annual basis.
8
The high fixed costs of our operations could result in continuing or increasing operating losses.
Companies within our industry are typically subject to high fixed costs which consist primarily of depreciation (a non‑cash item) and maintenance expenses associated with seismic data acquisition and equipment and crew costs. In addition, ongoing maintenance capital expenditures, as well as new equipment investment, can be significant. As a result, any extended periods of significant downtime or low productivity caused by reduced demand, weather interruptions, equipment failures, permit delays, or other causes could result in continuing or increasing operating losses.
We have indebtedness from time to time under credit facilities with a commercial bank, and certain of our accounts receivable and restricted CDARS accounts are pledged as collateral for these obligations. Our ability to borrow may be limited if our accounts receivable decreases.
From time to time, we may have indebtedness under credit facilities with a commercial bank. We maintain certain restricted CDARS accounts with our commercial bank which can be used as collateral against future borrowings. If we are unable to repay all secured borrowings when due, whether at maturity or if declared due and payable following a default, our lenders have the right to proceed against the deposit pledged to secure the indebtedness and may liquidate the CDARS account in order to repay those borrowings, which could materially harm our business, financial condition and results of operations. Our ability to borrow funds under our revolving line of credit is tied to the value of our collateral account with our commercial bank as well as the amount of our eligible accounts receivable. If our accounts receivable decrease materially for any reason, including delays, reductions or cancellations by clients or decreased demand for our services, our ability to borrow to fund operations or other obligations may be limited.
Our financial results could be adversely affected by asset impairments.
We periodically review our portfolio of equipment and our intangible assets for impairment. Future events, including our financial performance, sustained decreases in oil and natural gas prices, reduced demand for our services, our market valuation or the market valuation of comparable companies, loss of a significant client’s business, or strategic decisions, could cause us to conclude that impairment indicators exist and ultimately that the asset values associated with our equipment or our intangibles were to be impaired. If we were to impair our equipment or intangibles, these non-cash asset impairments could negatively affect our financial results in a material manner in the period in which they are recorded, and the larger the amount of any impairment that may be taken, the greater the impact such impairment may have on our financial results.
Our profitability is determined, in part, by the utilization level and productivity of our crews and is affected by numerous external factors that are beyond our control.
Our revenues are determined, in part, by the contract price we receive for our services, the level of utilization of our data acquisition crews and the productivity of these crews. Crew utilization and productivity is partly a function of external factors, such as client cancellation or delay of projects, operating delays from inclement weather, obtaining land access rights and other factors, over which we have no control. If our crews encounter operational difficulties or delays on any data acquisition survey, our results of operations may vary, and in some cases, may be adversely affected.
In recent years, most of our projects have been performed on a turnkey basis for which we were paid a fixed price for a defined scope of work or unit of data acquired. The revenue, cost and gross profit realized under our turnkey contracts can vary from our estimates because of changes in job conditions, variations in labor and equipment productivity or because of the performance of our subcontractors. Turnkey contracts may also cause us to bear substantially all of the risks of business interruption caused by external factors over which we may have no control, such as weather, obtaining land access rights, crew downtime or operational delays. These variations, delays and risks inherent in turnkey contracts may result in reducing our profitability.
We face intense competition in our business that could result in downward pricing pressure and the loss of market share.
The seismic data acquisition services industry is a highly competitive business in the continental U.S. and Canada. Additionally, the seismic data acquisition business is extremely price competitive and has a history of periods in which seismic contractors bid jobs below cost and, therefore, adversely affected industry pricing. Many contracts are awarded on a bid basis, which may further increase competition based primarily on price. Further, the barriers to entry in the seismic
9
industry are not prohibitive, and it would not be difficult for seismic companies outside of the U.S. to enter the domestic market and compete with us.
Inclement weather may adversely affect our ability to complete projects and could, therefore, adversely affect our results of operations.
Our seismic data acquisition operations could be adversely affected by inclement weather conditions. Delays associated with weather conditions could adversely affect our results of operations. For example, weather delays could affect our operations on a particular project or an entire region and could lengthen the time to complete data acquisition projects. In addition, even if we negotiate weather protection provisions in our contracts, we may not be fully compensated by our clients for delays caused by inclement weather.
Our operations are subject to delays related to obtaining land access rights of way from third parties which could affect our results of operations.
Our seismic data acquisition operations could be adversely affected by our inability to obtain timely right of way usage from both public and private land and/or mineral owners. We cannot begin surveys on property without obtaining permits from governmental entities as well as the permission of the private landowners who own the land being surveyed. In recent years, it has become more difficult, costly and time‑consuming to obtain access rights of way as drilling activities have expanded into more populated areas. Additionally, while landowners generally are cooperative in granting access rights, some have become more resistant to seismic and drilling activities occurring on their property. In addition, governmental entities do not always grant permits within the time periods expected. Delays associated with obtaining such rights of way could negatively affect our results of operations.
Capital requirements for our operations are large. If we are unable to finance these requirements, we may not be able to maintain our competitive advantage.
Seismic data acquisition and data processing technologies historically have progressed steadily, and we expect this trend to continue. In order to remain competitive, we must continue to invest additional capital to maintain, upgrade and expand our seismic data acquisition capabilities. Our working capital requirements remain high, primarily due to the expansion of our infrastructure in response to client demand for cableless recording systems and more recording channels, which has increased as the industry strives for improved data quality with greater subsurface resolution images. Our sources of working capital are limited. We have historically funded our working capital requirements primarily with cash generated from operations, cash reserves and, from time to time, borrowings from commercial banks. In recent years, we have funded some of our capital expenditures through equipment term loans and finance leases. In the past, we have also funded our capital expenditures and other financing needs through public equity offerings. If we were to expand our operations at a rate exceeding operating cash flow, if current demand or pricing of geophysical services were to decrease substantially, or if technical advances or competitive pressures required us to acquire new equipment faster than our cash flow could sustain, additional financing could be required. If we were not able to obtain such financing or renew our existing revolving line of credit when needed, our failure could have a negative impact on our ability to pursue expansion and maintain our competitive advantage.
Technological change in our business creates risks of technological obsolescence and requirements for future capital expenditures. If we are unable to keep up with these technological advances, we may not be able to compete effectively.
Seismic data acquisition technologies historically have steadily improved and progressed, and we expect this progression to continue. We are in a capital intensive industry, and in order to remain competitive, we must continue to invest additional capital to maintain, upgrade and expand our seismic data acquisition capabilities. However, we may have limitations on our ability to obtain the financing necessary to enable us to purchase state‑of‑the‑art equipment, and certain of our competitors may be able to purchase newer equipment when we may not be able to do so, thus affecting our ability to compete.
We rely on a limited number of key suppliers for specific seismic services and equipment.
We depend on a limited number of third parties to supply us with specific seismic services and equipment. From time to time, increased demand for seismic data acquisition services has decreased the available supply of new seismic equipment, resulting in extended delivery dates on orders of new equipment. Any delay in obtaining equipment could
10
delay our deployment of additional crews and restrict the productivity of existing crews, adversely affecting our business and results of operations. In addition, any adverse change in the terms of our suppliers’ arrangements could affect our results of operations.
Some of our suppliers may also be our competitors. If competitive pressures were to become such that our suppliers would no longer sell to us, we would not be able to easily replace the technology with equipment that communicates effectively with our existing technology, thereby impairing our ability to conduct our business.
We are dependent on our management team and key employees, and inability to retain our current team or attract new employees could harm our business.
Our continued success depends upon attracting and retaining highly skilled professionals and other technical personnel. A number of our employees are highly skilled scientists and highly trained technicians. The loss, whether by death, departure or illness, of our senior executives or other key employees or our failure to continue to attract and retain skilled and technically knowledgeable personnel could adversely affect our ability to compete in the seismic services industry. We may experience significant competition for such personnel, particularly during periods of increased demand for seismic services. A limited number of our employees are under employment contracts, and we have no key man insurance.
We are subject to Canadian foreign currency exchange rate risk.
We conduct business in Canada which subjects us to foreign currency exchange rate risk. Currently, we do not hold or issue foreign currency forward contracts, option contracts or other derivative financial instruments to mitigate the currency exchange rate risk. Our results of operations and our cash flows could be impacted by changes in foreign currency exchange rates.
Our common stock has experienced, and may continue to experience, price volatility and low trading volume.
Our stock price is subject to significant volatility. Overall market conditions, including a decline in oil and natural gas prices and other risks and uncertainties described in this “Risk Factors” section and in our other filings with the SEC, could cause the market price of our common stock to fall. Our high and low sales prices of our common stock for the twelve months ended December 31, 2019 were $4.28 and $1.90, respectively. Further, the high and low sales prices of our common stock for the twelve months ended December 31, 2018 were $8.40 and $3.04, respectively.
Our common stock is listed on The NASDAQ Stock Market LLC (“NASDAQ”) under the symbol “DWSN.” However, daily trading volumes for our common stock are, and may continue to be, relatively small compared to many other publicly traded securities. For example, during 2019 our daily trading volume was as low as 5,000 shares. It may be difficult for you to sell your shares in the public market at any given time at prevailing prices, and the price of our common stock may, therefore, be volatile.
Our common stock traded below $5.00 per share for the past year, and when it trades below $5.00 per share it may be considered a low‑priced stock and may be subject to regulations that limit or restrict the potential market for the stock.
Our common stock may be considered a low-priced stock pursuant to rules promulgated under the Exchange Act, if it continues to trade below a price of $5.00 per share. Under these rules, broker-dealers participating in transactions in low-priced securities must first deliver a risk disclosure document which describes the risks associated with such stock, the broker-dealer’s duties, the client’s rights and remedies, and certain market and other information, and make a suitability determination approving the client for low-priced stock transactions based on the client’s financial situation, investment experience and objectives. Broker-dealers must also disclose these restrictions in writing and provide monthly account statements to the client, and obtain specific written consent of the client. With these restrictions, the likely effect of designation as a low-price stock would be to decrease the willingness of broker-dealers to make a market for our common stock, to decrease the liquidity of the stock, and to increase the transaction costs of sales and purchases of such stocks compared to other securities. Our common stock traded below a price of $5.00 per share for the duration of 2019 and we cannot guarantee that our common stock will trade at a price greater than $5.00 per share.
11
We do not expect to pay cash dividends on our common stock for the foreseeable future, and, therefore, only appreciation of the price of our common stock may provide a return to shareholders.
While there are currently no restrictions prohibiting us from paying cash dividends to our shareholders, our Board of Directors, after consideration of economic and market conditions affecting the energy industry in general, and the oilfield services business in particular, determined that we would not pay a cash dividend in respect of our common stock for the foreseeable future. Payment of any cash dividends in the future will be at the discretion of our board and will depend on our financial condition, results of operations, capital and legal requirements, and other factors deemed relevant by the board.
Certain provisions of our amended and restated certificate of formation may make it difficult for a third party to acquire us in the future or may adversely impact your ability to obtain a premium in connection with a future change of control transaction.
Our amended and restated certificate of formation contains provisions that require the approval of holders of 80% of our issued and outstanding shares before we may merge or consolidate with or into another corporation or entity or sell all, or substantially all, of our assets to another corporation or entity. Additionally, if we increase the size of our board to nine directors, we could, by resolution of the Board of Directors, stagger the directors’ terms, and our directors could not be removed without approval of holders of 80% of our issued and outstanding shares. These provisions could discourage or impede a tender offer, proxy contest or other similar transaction involving control of us.
In addition, our Board of Directors has the right to issue preferred stock upon such terms and conditions as it deems to be in our best interest. The terms of such preferred stock may adversely impact the dividend and liquidation rights of our common shareholders without the approval of our common shareholders.
We may be subject to liability claims that are not covered by our insurance.
Our business is subject to the general risks inherent in land‑based seismic data acquisition activities. Our activities are often conducted in remote areas under dangerous conditions, including the detonation of dynamite. These operations are subject to risk of injury to personnel and damage to equipment. Our crews are mobile, and equipment and personnel are subject to vehicular accidents. These risks could cause us to experience equipment losses, injuries to our personnel, and interruptions in our business.
In addition, we could be subject to personal injury or real property damage claims in the normal operation of our business. Such claims may not be covered under the indemnification provisions contained in our general service agreements to the extent that the damage is due to our negligence or intentional misconduct.
Our general service agreements require us to have specific amounts of insurance. However, we do not carry insurance against certain risks that could cause losses, including business interruption resulting from equipment maintenance or weather delays. Further, there can be no assurance, however, that any insurance obtained by us will be adequate to cover all losses or liabilities or that this insurance will continue to be available or available on terms which are acceptable to us. Liabilities for which we are not insured, or which exceed the policy limits of our applicable insurance, could have a materially adverse effect on us.
We may be held liable for the actions of our subcontractors.
We often work as the general contractor on seismic data acquisition surveys and, consequently, engage a number of subcontractors to perform services and provide products. While we obtain contractual indemnification and insurance covering the acts of these subcontractors and require the subcontractors to obtain insurance for our benefit, we could be held liable for the actions of these subcontractors. In addition, subcontractors may cause injury to our personnel or damage to our property that is not fully covered by insurance.
We operate under hazardous conditions that subject us to risk of damage to property or personnel injuries and may interrupt our business.
Our business is subject to the general risks inherent in land‑based seismic data acquisition activities. Our activities are often conducted in remote areas under extreme weather and other dangerous conditions, including the use of dynamite as an energy source. These operations are subject to risk of injury to our personnel and third parties and damage to our
12
equipment and improvements in the areas in which we operate. In addition, our crews often operate in areas where the risk of wildfires is present and may be increased by our activities. Since our crews are mobile, equipment and personnel are subject to vehicular accidents. We use diesel fuel which is classified by the U.S. Department of Transportation as a hazardous material. These risks could cause us to experience equipment losses, injuries to our personnel and interruptions in our business. Delays due to operational disruptions such as equipment losses, personnel injuries and business interruptions could adversely affect our profitability and results of operations.
Loss of our information and computer systems could adversely affect our business.
We are heavily dependent on our information systems and computer‑based programs, including our seismic information, electronic data processing and accounting data. If any of such programs or systems were to fail or create erroneous information in our hardware or software network infrastructure, or if we were subject to cyberspace breaches or attacks, possible consequences include our loss of communication links, loss of seismic data and inability to automatically process commercial transactions or engage in similar automated or computerized business activities. Any such consequence could have a material adverse effect on our business.
Our business could be negatively impacted by security threats, including cyber‑security threats and other disruptions.
We face various security threats, including cyber‑security threats to gain unauthorized access to sensitive information or to render data or systems unusable, threats to the safety of our employees, threats to the security of our facilities and infrastructure, and threats from terrorist acts. Cyber‑security attacks in particular are evolving and include, but are not limited to, malicious software, attempts to gain unauthorized access to data and other electronic security breaches that could lead to disruptions in critical systems, unauthorized release of confidential or otherwise protected information and corruption of data. Although we utilize various procedures and controls to monitor and protect against these threats and to mitigate our exposure to such threats, there can be no assurance that these procedures and controls will be sufficient in preventing security threats from materializing. If any of these events were to materialize, they could lead to losses of sensitive information, critical infrastructure, personnel or capabilities essential to our operations and could have a material adverse effect on our reputation, financial position, results of operations or cash flows.
Our business is subject to government regulation that may adversely affect our future operations.
Our operations are subject to a variety of federal, state, provincial and local laws and regulations, including laws and regulations relating to the protection of the environment and archeological sites and those that may result from climate change legislation. Canadian operations have been historically cyclical due to governmental restrictions on seismic acquisition during certain periods. As a result, there is a risk that there will be a significant amount of unused equipment during those periods. We are required to expend financial and managerial resources to comply with such laws and related permit requirements in our operations, and we anticipate that we will continue to be required to do so in the future. Although such expenditures historically have not been material to us, the fact that such laws or regulations change frequently makes it impossible for us to predict the cost or impact of such laws and regulations on our future operations. The adoption of laws and regulations that have the effect of reducing or curtailing exploration and development activities by energy companies could also adversely affect our operations by reducing the demand for our services.
Current and future legislation or regulation relating to climate change could negatively affect the exploration and production of oil and gas and adversely affect demand for our services.
In response to concerns suggesting that emissions of certain gases, commonly referred to as “greenhouse gases” (“GHG”) (including carbon dioxide and methane), may be contributing to global climate change, legislative and regulatory measures to address the concerns are in various phases of discussion or implementation at the national and state levels. Many states, either individually or through multi‑state regional initiatives, have already taken legal measures intended to reduce GHG emissions, primarily through the planned development of GHG emission inventories and/or GHG cap and trade programs. Although various climate change legislative measures have periodically been introduced in the U.S. Congress, and there has been a wide-ranging policy debate both in the United States and internationally regarding the impact of these gases and possible means for their regulation, it is not possible at this time to predict whether or when Congress may act on climate change legislation. However, future actions that require substantial reductions in carbon emissions could be costly and difficult to implement.
The U.S. Environmental Protection Agency (the “EPA”) has promulgated a series of regulations that require monitoring and reporting of GHG emissions on an annual basis, including extensive GHG monitoring and reporting
13
requirements. While these rules do not control GHG emission levels from any facilities, they can cause covered facilities to incur monitoring and reporting costs. Moreover, lawsuits have been filed seeking to require individual companies to reduce GHG emissions from their operations. These and other lawsuits relating to GHG emissions may result in decisions by state and federal courts and agencies that could impact our operations.
In addition, the United States was actively involved in the United Nations Conference on Climate Change in Paris, which led to the creation of the Paris Agreement. In April 2016, the United States signed the Paris Agreement, which requires countries to review and “represent a progression” in their nationally determined contributions, which set emissions reduction goals, every five years. In November 2019, the State Department formally informed the United Nations of the United States’ withdrawal from the Paris Agreement. Due to the Paris Agreement’s protocol, the earliest the United States will be able to withdraw is November 2020. However, additional legislation or regulation by states and regions, the EPA, and/or any international agreements to which the United States may become a party that control or limit GHG emissions or otherwise seek to address climate change could adversely affect our operations.
The increasing governmental focus on GHG emissions may result in new environmental laws or regulations that may negatively affect us, our suppliers and our clients. This could cause us to incur additional direct costs in complying with any new environmental regulations, as well as increased indirect costs resulting from our clients, suppliers or both incurring additional compliance costs that get passed on to us. Moreover, passage of climate change legislation, other federal or state legislative or regulatory initiatives, or international agreements that regulate or restrict emissions of GHG may curtail production and demand for fossil fuels such as oil and gas in areas where our clients operate and, thus, adversely affect future demand for our services. Reductions in our revenues or increases in our expenses as a result of climate control initiatives could have adverse effects on our business, financial position, results of operations and cash flows.
New regulation or legislation that limits or prohibits hydraulic fracturing could negatively affect the exploration and production of oil and gas and adversely affect demand for our services.
Hydraulic fracturing is an important and commonly used process in the completion of oil and gas wells. Hydraulic fracturing involves the injection of water, sand and chemical additives under pressure into rock formations to stimulate gas production. Several political and regulatory authorities and governmental bodies have studied hydraulic fracturing and considered potential regulations, and certain environmental and other groups have devoted resources to campaigns aimed at restricting or eradicating hydraulic fracturing.
Due to public concerns raised regarding potential impacts of hydraulic fracturing on groundwater quality, legislative and regulatory efforts at the federal level and in some states have been initiated to require or make more stringent the permitting and compliance requirements for hydraulic fracturing operations. For example, EPA issued a final report in December 2016, concluding that hydraulic fracturing activities have the potential to impact drinking water resources, particularly when involving water withdrawals, spills, fracturing into wells with inadequate mechanical integrity, fracturing directly into such resources, underground migration of liquids and gases, and inadequate treatment, disposal, storage and discharge of wastewater. The final report also listed the data gaps and uncertainties that limited the EPA’s ability to fully assess the potential impacts of hydraulic fracturing on drinking water resources. The EPA has asserted federal regulatory authority over hydraulic fracturing using fluids that contain “diesel fuel” under the Safe Drinking Water Act (“SDWA”) Underground Injection Control Program and has released a revised guidance regarding the process for obtaining a permit for hydraulic fracturing involving diesel fuel. In May 2014, the EPA issued an Advanced Notice of Proposed Rulemaking, seeking comment on the development of regulations under the Toxic Substances Control Act to require companies to disclose information regarding the chemicals used in hydraulic fracturing. The EPA has not yet finalized this rule. In June 2016, the EPA published final pretreatment standards for disposal of wastewater produced from shale gas operations to publicly owned treatment works. These regulatory initiatives could each spur further action toward federal and/or state legislation and regulation of hydraulic fracturing activities. Certain states have also adopted or are considering disclosure legislation and/or regulations. Additional regulation could materially reduce our business opportunities and revenues if our customers decrease their levels of activity in response to such regulation.
Some parties also believe that there is a correlation between hydraulic fracturing and other oilfield related activities and the increased occurrence of seismic activity. When caused by human activity, such seismic activity is called induced seismicity. The extent of this correlation, if any, is the subject of studies of both state and federal agencies. In addition, a number of lawsuits have been filed against other industry participants alleging damages and regulatory violations in connection with such activity. These and other ongoing or proposed studies could spur initiatives to further
14
regulate hydraulic fracturing under the SDWA and other aspects of the oil and gas industry. In light of concerns about induced seismicity, some state regulatory agencies have already modified their regulations or issued orders to address induced seismicity.
The adoption of any future federal, state, foreign, regional or local laws that impact permitting requirements for, result in reporting obligations on, or otherwise limit or ban, the hydraulic fracturing process could make it more difficult to perform hydraulic fracturing. This could reduce demand for our services. Regulation that significantly restricts or prohibits hydraulic fracturing, or that requires hydraulic fracturing operations to meet permitting and financial assurance requirements, adhere to certain construction specifications, fulfill monitoring, reporting, and recordkeeping obligations, and meet plugging and abandonment requirements, could have a material adverse impact on our business. Additionally, legislation that requires the reporting and public disclosure of chemicals used in the fracturing process could make it easier for third parties opposing the hydraulic fracturing process to initiate legal proceedings based on allegations that specific chemicals used in the fracturing process could adversely affect groundwater.
These legislative and regulatory initiatives imposing additional reporting obligations on, or otherwise limiting, the hydraulic fracturing process could make it more difficult or costly to complete natural gas wells. Shale gas cannot be economically produced without extensive fracturing. In the event such legislation is enacted, demand for our seismic acquisition services may be adversely affected.
We are subject to the requirements of Section 404 of the Sarbanes‑Oxley Act (“Section 404”). If we are unable to maintain compliance with Section 404, or if the costs related to maintaining compliance are significant, our profitability, stock price, results of operations and financial condition could be materially adversely affected.
If we are unable to maintain adequate internal controls in accordance with Section 404, as such standards are amended, supplemented, or modified from time to time, we may not be able to ensure that we have effective internal controls over financial reporting on an ongoing basis in accordance with Section 404. Failure to achieve and maintain effective internal controls could have a material adverse effect on our stock price. In addition, a material weakness in the effectiveness of our internal control over financial reporting could result in an increased chance of fraud and the loss of clients, reduce our ability to obtain financing, and/or require additional expenditures to comply with these requirements, each of which could negatively impact our business, profitability and financial condition.
Item 1B. UNRESOLVED STAFF COMMENTS
None.
Our headquarters are located in a 34,570 square foot leased property in Midland, Texas. We have two properties in Midland that we own, including a 61,402 square foot property we use as a field office, equipment and fabrication facility, and maintenance and repair shop, along with a 6,600 square foot property that we use as an inventory field office and storage facility.
We also have additional offices in three other cities in Texas: Denison, Houston and Plano. Our Denison warehouse facility consists of one 5,000 square foot building, two 10,000 square foot adjacent buildings and an outdoor storage area of approximately 60,500 square feet. Our Houston sales office is in an 8,161 square foot facility. Our office in Plano, Texas consists of 7,797 square feet of office space.
We lease an 1,801 square foot facility in Denver, Colorado as a sales office. We also lease a 7,480 square foot facility in Oklahoma City, Oklahoma as a sales office.
We lease a 15,020 square foot facility in Calgary, Alberta consisting of office, warehouse and shop space.
We believe that our existing facilities are being appropriately utilized in line with past experience and are well maintained, suitable for their intended use, and adequate to meet our current and future operating requirements.
15
For a discussion of certain contingencies and legal proceedings affecting the Company, please refer to Note 16, “Commitments and Contingencies,” to the Consolidated Financial Statements incorporated by reference herein.
Item 4. MINE SAFETY DISCLOSURES
Not applicable.
Item 5. MARKET FOR OUR COMMON EQUITY AND RELATED STOCKHOLDER MATTERS
Our common stock trades on the NASDAQ under the symbol “DWSN.” The table below represents the high and low sales prices per share for the periods shown.
|
Three Months Ended |
|
High |
|
Low |
|
||
|
March 29, 2018 |
|
$ |
6.78 |
|
$ |
4.64 |
|
|
June 29, 2018 |
|
$ |
8.40 |
|
$ |
5.38 |
|
|
September 28, 2018 |
|
$ |
8.28 |
|
$ |
5.50 |
|
|
December 31, 2018 |
|
$ |
6.57 |
|
$ |
3.04 |
|
|
March 29, 2019 |
|
$ |
4.28 |
|
$ |
2.88 |
|
|
June 28, 2019 |
|
$ |
3.20 |
|
$ |
2.01 |
|
|
September 30, 2019 |
|
$ |
2.75 |
|
$ |
1.90 |
|
|
December 30, 2019 |
|
$ |
2.88 |
|
$ |
1.93 |
|
As of March 4, 2020, the market price for our common stock was $1.88 per share, and we had 110 common stockholders of record, as reported by our transfer agent.
The Board of Directors approved a 5% stock dividend (or 0.05 share for each share outstanding) on the outstanding shares of our common stock on May 1, 2018. The stock dividend was paid on May 29, 2018 to shareholders of record on May 14, 2018. All comparative financial statement presentations have been retroactively adjusted to reflect the dividend.
No dividends were paid in 2019. While there are currently no restrictions prohibiting us from paying dividends to our shareholders, our Board of Directors, after consideration of economic and market conditions affecting the energy industry in general, and the oilfield services business in particular, determined that we would not pay a dividend in respect of our common stock for the foreseeable future. Payment of any dividends in the future will be at the discretion of our board and will depend on our financial condition, results of operations, capital and legal requirements, and other factors deemed relevant by the board.
16
The following table summarizes certain information regarding securities authorized for issuance under our equity compensation plans as of December 31, 2019. See information and definitions regarding material features of the plans in Note 8, “Stock‑Based Compensation,” to the Consolidated Financial Statements incorporated by reference herein.
Equity Compensation Plan Information
|
|
|
Number of |
|
|
|
|
|
|
|
|
|
Securities to be |
|
|
|
|
Number of Securities |
|
|
|
|
Issued Upon |
|
|
|
|
Remaining Available |
|
|
|
|
Exercise or |
|
Weighted Average |
|
for Future Issuance |
|
|
|
|
|
Vesting of |
|
Exercise Price |
|
Under the Equity |
|
|
|
|
|
Outstanding |
|
of Outstanding |
|
Compensation Plan |
|
|
|
|
|
Options, |
|
Options, |
|
(Excluding Securities |
|
|
|
|
|
Warrants and |
|
Warrants and |
|
Reflected in |
|
|
|
Plan Category |
|
Rights |
|
Rights |
|
Column (a)) |
|
|
|
|
|
(a) |
|
|
|
|
|
|
|
2016 Plan |
|
|
|
|
|
|
|
|
|
Equity compensation plan approved by security holders |
|
410,100 |
|
$ |
— |
(1) |
330,861 |
|
|
Equity compensation plans not approved by security holders |
|
— |
|
|
— |
|
— |
|
|
Total |
|
410,100 |
|
$ |
— |
|
330,861 |
|
|
(1) |
Restricted stock unit awards have no exercise price. |
17
PERFORMANCE GRAPH
The following graph matches Dawson Geophysical Company’s cumulative five year total shareholder return on common stock with the cumulative total returns of the S&P 500 index and the PHLX Oil Service Sector index. The graph tracks the performance of a $100 investment in our common stock and in each index (with the reinvestment of all dividends) from December 31, 2014 to December 31, 2019.
COMPARISON OF 5 YEAR CUMULATIVE TOTAL RETURN*
Among Dawson Geophysical Company, the S&P 500 Index
and the PHLX Oil Service Sector Index
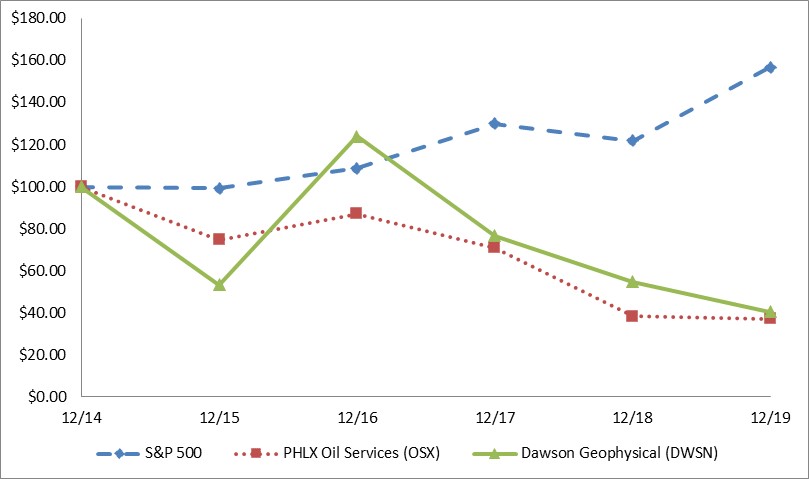
*$100 invested on December 31, 2014 in stock or index, including reinvestment of dividends.
Year ended December 31.
|
|
|
12/14 |
|
12/15 |
|
12/16 |
|
12/17 |
|
12/18 |
|
12/19 |
|
|
Dawson Geophysical Company |
|
100.00 |
|
53.40 |
|
124.07 |
|
76.70 |
|
54.77 |
|
40.51 |
|
|
S&P 500 |
|
100.00 |
|
99.27 |
|
108.74 |
|
129.86 |
|
121.76 |
|
156.92 |
|
|
PHLX Oil Service Sector |
|
100.00 |
|
74.80 |
|
87.16 |
|
70.92 |
|
38.22 |
|
37.13 |
|
The stock price performance included in this graph is not necessarily indicative of future stock price performance.
18
Item 6. SELECTED FINANCIAL DATA
The following selected financial data should be read in conjunction with Item 7, “Management’s Discussion and Analysis of Financial Condition and Results of Operations,” and the Company’s consolidated financial statements and related notes included in Item 8, “Financial Statements and Supplementary Data.” Amounts below are in thousands, except per share amounts.
|
|
Year Ended December 31, |
|||||||||||||
|
|
2019 |
|
2018 |
|
2017 |
|
2016 |
|
2015 |
|||||
|
Operating revenues |
$ |
145,773 |
|
$ |
154,156 |
|
$ |
156,532 |
|
$ |
137,640 |
|
$ |
234,685 |
|
Net loss (1) |
$ |
(15,213) |
|
$ |
(24,407) |
|
$ |
(31,790) |
|
$ |
(38,333) |
|
$ |
(26,279) |
|
Basic loss per share of common stock |
$ |
(0.66) |
|
$ |
(1.07) |
|
$ |
(1.40) |
|
$ |
(1.69) |
|
$ |
(1.21) |
|
Weighted average equivalent common shares outstanding |
|
23,179 |
|
|
22,912 |
|
|
22,779 |
|
|
22,692 |
|
|
21,732 |
|
Total assets |
$ |
127,608 |
|
$ |
150,685 |
|
$ |
167,919 |
|
$ |
190,455 |
|
$ |
247,787 |
|
Revolving line of credit |
$ |
— |
|
$ |
— |
|
$ |
— |
|
$ |
— |
|
$ |
— |
|
Current maturities of notes payable, finance leases, and operating lease liabilities |
$ |
5,262 |
|
$ |
6,683 |
|
$ |
2,712 |
|
$ |
2,357 |
|
$ |
8,585 |
|
Notes payable, finance leases, and operating lease liabilities, net of current maturities |
$ |
6,036 |
|
$ |
6,097 |
|
$ |
5,153 |
|
$ |
— |
|
$ |
2,106 |
|
Stockholders’ equity |
$ |
103,165 |
|
$ |
117,016 |
|
$ |
141,318 |
|
$ |
171,474 |
|
$ |
209,718 |
|
(1) |
Net loss for the year ended December 31, 2015 includes transaction costs associated with the Merger of $3,314,000. |
Item 7. MANAGEMENT’S DISCUSSION AND ANALYSIS OF FINANCIAL CONDITION AND RESULTS OF OPERATIONS
The following discussion and analysis should be read in conjunction with our financial statements and related notes thereto included elsewhere in this Form 10‑K. Portions of this document that are not statements of historical or current fact are forward‑looking statements that involve risk and uncertainties, such as statements of our plans, business strategy, objectives, expectations and intentions. This discussion contains forward‑looking statements that involve risks and uncertainties. Please see “Business,” “Disclosure Regarding Forward‑Looking Statements” and “Risk Factors” elsewhere in this Form 10‑K. Discussions of the year ended December 31, 2017 and year-to-year comparisons of the year ended December 31, 2018 and the year ended December 31, 2017 can be found in “Management’s Discussion and Analysis of Financial Condition and the Results of Operations” in Part II, Item 7 of the Company’s Annual Report on Form 10-K for the year ended December 31, 2018.
You should read this discussion in conjunction with the financial statements and notes thereto included elsewhere in this Form 10‑K. Unless the context requires otherwise, all references in this Item 7 to the “Company,” “we,” “us” or “our” refer to Dawson Geophysical Company and its consolidated subsidiaries.
Overview
We are a leading provider of North American onshore seismic data acquisition services with operations throughout the continental U.S. and Canada. Substantially all of our revenues are derived from the seismic data acquisition services we provide to our clients. Our clients consist of major oil and gas companies, independent oil and gas operators, and providers of multi-client data libraries. In recent years, our primary customer base has consisted of providers of multi-client data libraries. Demand for our services depends upon the level of spending by these companies for exploration, production, development and field management activities, which depends, in a large part, on oil and natural gas prices. Significant fluctuations in domestic oil and natural gas exploration and development activities related to commodity prices, as we have recently experienced, have affected, and will continue to affect, demand for our services and our results of operations, and such fluctuations continue to be the single most important factor affecting our business and results of operations.
19
During the early part of the fourth quarter of 2019, we operated a peak of four crews in the U.S., primarily in the Permian Basin region, including three large channel count crews. Crew activity in Canada was minimal during the fourth quarter of 2019. The fourth quarter and early part of the first quarter in the U.S. historically has been challenging due to shorter work days and the holiday season. The winter season in Canada concludes at the end of the first quarter of 2020. Upon completion of the Canadian season, equipment will redeploy to the lower 48 in the second quarter of 2020. As in recent quarters, the majority of our projects are on behalf of multi-client data companies in the U.S., with some activity directly for exploration and production companies.
While fourth quarter 2019 results were below those of our third quarter, our fourth quarter results showed significant improvement compared to the fourth quarter of 2018. We believe that our ability to successfully field large scale deployments is a contributing factor to our success as the industry continues to transition toward a channel and energy source business model and away from the traditional crew count model. Despite this improvement, our fourth quarter 2019 results were negatively impacted by the completion of several large projects early in the quarter, client delays that have moved the start of new projects into the first quarter of 2020, and lower utilization of recording channels and energy source units. Utilization was suppressed into the early part of the first quarter of 2020.
During fiscal year 2019, we experienced a general increase in recording channels and energy source unit requirements per 3-D project and believe that trend will continue into next year. The increase in recording channels and energy source units allowed us to perform larger 3D surveys with increased density, which aids in improving subsurface resolution and allows for increased crew productivity and efficiency. As we moved to more of a recording channel and energy source model as opposed to a crew model during the year, we were able to increase crew efficiency, improve utilization on a per crew basis and reduce crew level operating cost. However, due to various factors during the year, overall utilization was inconsistent from period to period as we experienced project readiness delays, client delays and completion of project timing issues. While we are confident in our demand visibility in the early part of 2020, we anticipate similar issues could exist in 2020.
The oil service markets remain challenging as the capital spending levels of exploration and production companies remain somewhat constrained and unpredictable. Utilization visibility into the second half of 2020 remains unclear. As of the middle part of the first quarter, we are near full utilization with three large crews operating in the U.S., primarily the Permian Basin region, and three crews operating in Canada. Based on currently available information, we anticipate the same level of activity through the end of the first quarter of 2020 with the three large crews in the U.S. operating well into the second quarter of 2020. While the seismic market remains challenging, conversations with our clients, primarily providers of multi-client data libraries, are positive for continued levels of activity through 2020.
While our revenues are mainly affected by the level of client demand for our services, our revenues are also affected by the pricing for our services that we negotiate with our clients and the productivity and utilization level of our data acquisition crews. Factors impacting productivity and utilization levels include client demand, commodity prices, whether we enter into turnkey or dayrate contracts with our clients, the number and size of crews, the number of recording channels per crew, crew downtime related to inclement weather, delays in acquiring land access permits, agricultural or hunting activity, holiday schedules, short winter days, crew repositioning and equipment failure. To the extent we experience these factors, our operating results may be affected from quarter to quarter. Consequently, our efforts to negotiate more favorable contract terms in our supplemental service agreements, mitigate permit access delays and improve overall crew productivity may contribute to growth in our revenues.
The majority of our revenues were derived from turnkey contracts for the years ending December 31, 2019 and 2018. While turnkey contracts allow us to capitalize on improved crew productivity, we also bear more risks related to weather and crew downtime. We expect the majority of our contracts to be turnkey as we continue our operations in the mid-continent, western and southwestern regions of the U.S. in which turnkey contracts are more common.
Over time, we have experienced continued increases in recording channel capacity on a per-crew or project basis and high utilization of cableless and multicomponent equipment. This increase in channel count demand is driven by client needs and is necessary in order to produce higher resolution images, increase crew efficiencies and undertake larger scale projects. In response to project-based channel requirements, we routinely deploy a variable number of channels on a variable number of crews in an effort to maximize asset utilization and meet client needs.
While the markets for oil and natural gas have been very volatile and are likely to continue to be so in the future, and we can make no assurances as to future levels of domestic exploration or commodity prices, we believe opportunities
20
exist for us to enhance our market position by responding to our clients’ continuing desire for higher resolution subsurface images. If economic conditions continue to weaken such that our clients continue to reduce their capital expenditures or if the sustained drop in oil and natural gas prices worsens, it could continue to result in diminished demand for our seismic services, could cause downward pressure on the prices we charge and would affect our results of operations.
Results of Operations
Year Ended December 31, 2019 versus Year Ended December 31, 2018
Operating Revenues. Operating revenues for the year ended December 31, 2019 were $145,773,000 compared to $154,156,000 for the same period of 2018. The decrease in revenue totals for the year ended December 31, 2019 compared to the same period of 2018 was primarily a result of decreased equipment and crew utilization, and project startup delays resulting from larger projects.
Operating Expenses. Operating expenses for the year ended December 31, 2019 decreased to $123,024,000 compared to $132,937,000 for the same period of 2018. The decrease in operating expenses was mainly due to an overall decrease in crew production and utilization.
General and Administrative Expenses. General and administrative expenses were 11.8% of revenues in the year ended December 31, 2019 compared to 10.6% of revenues in the same period of 2018. General and administrative expenses increased to $17,169,000 during the year ended December 31, 2019 from $16,287,000 during the same period of 2018. The primary factors for the increase in general and administrative expenses are related to severance and retirement costs due to headcount reductions and executive retirements that occurred in 2019.
Depreciation Expense. Depreciation for the year ended December 31, 2019 was $21,826,000 compared to $29,959,000 for the same period of 2018. The decrease in depreciation expense is a result of limiting capital expenditures to necessary maintenance capital requirements in recent years. Our depreciation expense is expected to remain flat during 2020 primarily due to limited capital expenditures to maintain our existing asset base.
Our total operating costs for the year ended December 31, 2019 were $162,019,000, representing a 9.6% decrease from the corresponding period of 2018. This change was primarily due to the factors described above.
Income Taxes. Income tax benefit was $239,000 for the year ended December 31, 2019 compared to $798,000 for the same period of 2018. The effective tax benefit rates for the years ended December 31, 2019 and 2018 were approximately 1.5% and 3.1%, respectively. Our effective tax rates decreased compared to the corresponding period from the prior year primarily due to the fuel tax and the AMT credits. Our effective tax rates differ from the statutory federal rate of 21% for certain items such as state and local taxes, valuation allowances, non‑deductible expenses and discrete items.
Use of EBITDA (Non‑GAAP measure)
We define EBITDA as net income (loss) plus interest expense, interest income, income taxes, and depreciation and amortization expense. Our management uses EBITDA as a supplemental financial measure to assess:
|
· |
the financial performance of our assets without regard to financing methods, capital structures, taxes or historical cost basis; |
|
· |
our liquidity and operating performance over time in relation to other companies that own similar assets and that we believe calculate EBITDA in a similar manner; and |
|
· |
the ability of our assets to generate cash sufficient for us to pay potential interest costs. |
We also understand that such data are used by investors to assess our performance. However, the term EBITDA is not defined under generally accepted accounting principles (“GAAP”), and EBITDA is not a measure of operating income, operating performance or liquidity presented in accordance with GAAP. When assessing our operating performance or liquidity, investors and others should not consider this data in isolation or as a substitute for net income (loss), cash flow from operating activities or other cash flow data calculated in accordance with GAAP. In addition, our EBITDA may not be comparable to EBITDA or similarly titled measures utilized by other companies since such other
21
companies may not calculate EBITDA in the same manner as us. Further, the results presented by EBITDA cannot be achieved without incurring the costs that the measure excludes: interest, taxes, and depreciation and amortization.
The reconciliation of our EBITDA to our net loss and net cash provided by (used in) operating activities, which are the most directly comparable GAAP financial measures, are provided in the following tables (in thousands):
|
|
|
Year Ended December 31, |
|
|||||||
|
|
|
2019 |
|
2018 |
|
2017 |
|
|||
|
Net loss |
|
$ |
(15,213) |
|
$ |
(24,407) |
|
$ |
(31,790) |
|
|
Depreciation and amortization |
|
|
21,826 |
|
|
29,959 |
|
|
39,235 |
|
|
Interest (income) expense, net |
|
|
(113) |
|
|
8 |
|
|
(148) |
|
|
Income tax benefit |
|
|
(239) |
|
|
(798) |
|
|
(5,314) |
|
|
EBITDA |
|
$ |
6,261 |
|
$ |
4,762 |
|
$ |
1,983 |
|
|
|
|
Year Ended December 31, |
|
|||||||
|
|
|
2019 |
|
2018 |
|
2017 |
|
|||
|
Net cash provided by (used in) operating activities |
|
$ |
9,480 |
|
$ |
12,871 |
|
$ |
(6,703) |
|
|
Changes in working capital and other items |
|
|
(812) |
|
|
(6,741) |
|
|
9,662 |
|
|
Non-cash adjustments to net loss |
|
|
(2,407) |
|
|
(1,368) |
|
|
(976) |
|
|
EBITDA |
|
$ |
6,261 |
|
$ |
4,762 |
|
$ |
1,983 |
|
Liquidity and Capital Resources
Introduction. Our principal sources of cash are amounts earned from the seismic data acquisition services we provide to our clients. Our principal uses of cash are the amounts used to provide these services, including expenses related to our operations and acquiring new equipment. Accordingly, our cash position depends (as do our revenues) on the level of demand for our services. Historically, cash generated from our operations along with cash reserves and borrowings from commercial banks have been sufficient to fund our working capital requirements and, to some extent, our capital expenditures.
Cash Flows. The following table shows our sources and uses of cash (in thousands) for the years ended December 31, 2019, 2018 and 2017:
|
|
|
Year Ended December 31, |
|
|||||||
|
|
|
2019 |
|
2018 |
|
2017 |
|
|||
|
Net cash provided by (used in) |
|
|
|
|
|
|
|
|
|
|
|
Operating activities |
|
$ |
9,480 |
|
$ |
12,871 |
|
$ |
(6,703) |
|
|
Investing activities |
|
|
4,185 |
|
|
(8,596) |
|
|
16,788 |
|
|
Financing activities |
|
|
(11,256) |
|
|
2,517 |
|
|
(3,420) |
|
|
Effect of exchange rate changes on cash, cash equivalents and restricted cash |
|
|
133 |
|
|
(76) |
|
|
724 |
|
|
Net change in cash, cash equivalents and restricted cash |
|
$ |
2,542 |
|
$ |
6,716 |
|
$ |
7,389 |
|
Year Ended December 31, 2019 versus Year Ended December 31, 2018
Net cash provided by operating activities was $9,480,000 and $12,871,000 for the years ended December 31, 2019 and 2018, respectively. The decrease in cash provided by operating activities was primarily due to a decrease in our operating level of deferred revenue as of December 31, 2019.
Net cash provided by investing activities was $4,185,000 for the year ended December 31, 2019 and includes $8,233,000 of proceeds from maturities of short-term investments that were not reinvested offset by cash capital expenditures of $4,396,000. Net cash used in investing activities was $8,596,000 for the year ended December 31, 2018 and includes $6,000,000 of proceeds from maturities of short-term investments that were not reinvested offset by cash capital expenditures of $15,745,000.
22
Net cash used in financing activities was $11,256,000 for the year ended December 31, 2019 and includes principal payments of $8,165,000 on our notes and $2,855,000 on our finance leases, and outflows of $236,000 associated with taxes related to stock vesting. Net cash provided by financing activities was $2,517,000 for the year ended December 31, 2018 and includes proceeds from notes payable used to purchase seismic data acquisition equipment of $6,518,000 offset by principal payments of $1,180,000 on our notes and $2,699,000 on our finance leases, and outflows of $121,000 associated with taxes related to stock vesting.
We continually strive to supply our clients with technologically advanced 3-D data acquisition recording services and data processing capabilities. We maintain equipment in and out of service in anticipation of increased future demand for our services.
Capital Resources. Historically, we have primarily relied on cash generated from operations, cash reserves and borrowings from commercial banks to fund our working capital requirements and, to some extent, our capital expenditures. Recently, we have funded some of our capital expenditures through finance leases and equipment term loans. From time to time in the past, we have also funded our capital expenditures and other financing needs through public equity offerings.
Dominion Credit Facility. On September 30, 2019, we entered into a new Loan and Security Agreement (the “Loan Agreement”) with Dominion Bank (the “Lender”). The Loan Agreement provides for a revolving credit facility (the “Revolving Credit Facility”) in an amount up to the lesser of (i) $15,000,000 or (ii) a sum equal to (a) 80% of our eligible accounts receivable plus 100% of the amount on deposit with the Lender in our collateral account, consisting of a restricted CDARS account of $5,000,000 (the “Deposit”).
Under the Revolving Credit Facility, interest will accrue at an annual rate equal to the lesser of (i) 6.00% and (ii) the greater of (a) the prime rate as published from time to time in The Wall Street Journal or (b) 3.50%. We will pay a commitment fee of 0.10% per annum on the difference of (a) $15,000,000 minus the Deposit minus (b) the daily average usage of the Revolving Credit Facility. The Loan Agreement contains customary covenants for credit facilities of this type, including limitations on disposition of assets. We are also obligated to meet certain financial covenants under the Loan Agreement, including maintaining a tangible net worth of $75,000,000 and specified ratios with respect to current assets and liabilities and debt to tangible net worth. Our obligations under the Loan Agreement are secured by a security interest in the collateral account (including the Deposit) with the Lender and future accounts receivable and related collateral. As of December 31, 2019, we have not borrowed any amounts under the Revolving Credit Facility. The maturity date of the Loan Agreement is September 30, 2020.
We do not currently have any notes payable under the Revolving Credit Facility.
Veritex Credit Agreement. On September 30, 2019, our line of credit (the “Veritex Line of Credit”) under the Amended and Restated Loan and Security Agreement (as amended, the “Veritex Loan Agreement”) by and between us and Veritex Community Bank (“Veritex”) matured pursuant to its terms. No amounts were borrowed under the Veritex Line of Credit. In connection with the maturity of the Veritex Line of Credit and entry into the Loan Agreement with Dominion Bank, we paid off all amounts owed pursuant to the term loan under the Veritex Loan Agreement of $4,355,665.
Veritex Letters of Credit. As of December 31, 2019, Veritex has issued two letters of credit under the Veritex Loan Agreement. The first letter of credit is in the amount of $1,767,000 to support payment of our insurance obligations. The second letter of credit is in the amount of $583,000 to support our workers compensation insurance. Each of the letters of credit are secured by a certificate of deposit with Veritex.
Other Indebtedness. As of December 31, 2019, we have two notes payable to a finance company for various insurance premiums totaling $1,746,000.
In addition, we lease certain seismic recording equipment and vehicles under leases classified as finance leases. Our Consolidated Balance Sheet as of December 31, 2019 includes finance leases of $2,412,000.
Contractual Obligations. We believe that our capital resources, including our short‑term investments, cash flow from operations, and funds available under our Revolving Credit Facility, will be adequate to meet our current operational needs. We believe that we will be able to finance our 2020 capital expenditures through cash flow from operations, borrowings from commercial lenders, and the funds available under our Revolving Credit Facility. However, our ability to satisfy working capital requirements, meet debt repayment obligations, and fund future capital requirements will depend
23
principally upon our future operating performance, which is subject to the risks inherent in our business, and will also depend on the extent to which the current economic climate adversely affects the ability of our customers, and/or potential customers, to promptly pay amounts owing to us under their service contracts with us.
The following table summarizes payments due in specific periods related to our contractual obligations with initial terms exceeding one year as of December 31, 2019 (in thousands):
|
|
|
|
Payments Due by Period (in thousands) |
|
|||||||||||||
|
|
|
|
|
|
|
Within |
|
|
|
|
|
|
|
After |
|
||
|
Contractual Obligations |
|
|
Total |
|
1 Year |
|
2-3 Years |
|
4-5 Years |
|
5 Years |
|
|||||
|
Operating lease (right-of-use) obligations |
|
|
$ |
7,140 |
|
$ |
1,200 |
|
$ |
2,008 |
|
$ |
2,044 |
|
$ |
1,888 |
|
|
Finance lease obligations |
|
|
|
2,412 |
|
|
2,316 |
|
|
89 |
|
|
7 |
|
|
— |
|
|
Debt obligations |
|
|
|
1,746 |
|
|
1,746 |
|
|
— |
|
|
— |
|
|
— |
|
|
Total |
|
|
$ |
11,298 |
|
$ |
5,262 |
|
$ |
2,097 |
|
$ |
2,051 |
|
$ |
1,888 |
|
Off‑Balance Sheet Arrangements
As of December 31, 2019, we had no off‑balance sheet arrangements.
Critical Accounting Policies
The preparation of our financial statements in conformity with GAAP requires that certain assumptions and estimates be made that affect the reported amounts of assets and liabilities at the date of our financial statements and the reported amounts of revenues and expenses during the reporting periods. Because of the use of assumptions and estimates inherent in the reporting process, actual results could differ from those estimates.
Allowance for Doubtful Accounts. We prepare our allowance for doubtful accounts receivable based on our review of past-due accounts, our past experience of historical write-offs and our current client base. While the collectability of outstanding client invoices is continually assessed, the inherent volatility of the energy industry’s business cycle can cause swift and unpredictable changes in the financial stability of our clients. Our allowance for doubtful accounts was $250,000 at December 31, 2019, 2018 and 2017.
Notes Receivable. Our notes receivable consist of one note receivable from the purchaser of certain dynamite energy source drilling equipment. This note receivable is stated at the unpaid principal balance. An allowance for note losses was not deemed necessary at December 31, 2019. Interest is recognized over the term of the note and is calculated using the simple-interest method. Amounts payable to us under the note receivable are fully collateralized by the specific dynamite energy source drilling equipment sold to the note payor.
Impairment of Long‑Lived Assets. We review long‑lived assets for impairment when triggering events occur suggesting deterioration in the assets’ recoverability or fair value. Recognition of an impairment charge is required if future expected undiscounted net cash flows are insufficient to recover the carrying value of the assets, and the fair value of the assets is below the carrying value of the assets. Our forecast of future cash flows used to perform impairment analysis includes estimates of future revenues and expenses based on our anticipated future results while considering anticipated future oil and gas prices, which is fundamental in assessing demand for our services. If the carrying amounts of the assets exceed the estimated expected undiscounted future cash flows, we measure the amount of possible impairment by comparing the carrying amount of the asset to its fair value. No impairment charges were recognized for the years ended December 31, 2019, 2018 and 2017.
Leases. We lease certain vehicles, seismic recording equipment, real property and office equipment under lease agreements. We evaluate each lease to determine its appropriate classification as an operating lease or finance lease for financial reporting purposes. We are the lessee in a lease contract when we obtain the right to control the asset. The majority of our operating leases are non-cancelable operating leases for office, shop and warehouse space in Midland, Plano, Denison, Houston, Denver, Oklahoma City and Calgary, Alberta.
24
The assets and liabilities under finance leases are recorded at the lower of the present value of the minimum lease payments or the fair market value of the related assets. Assets under finance leases are amortized using the straight‑line method over the initial lease term. Amortization of assets under finance leases is included in depreciation expense.
In February 2016, the Financial Accounting Standards Board (“FASB”) issued Accounting Standards Update (“ASU”) No. 2016-02, Leases (“Topic 842”) requiring organizations that lease assets to recognize on the balance sheet the assets and liabilities for the rights and obligations created by those leases. Topic 842 also requires qualitative and quantitative disclosures to help investors and other financial statement users better understand the amount, timing and uncertainty of cash flows arising from leases.
On January 1, 2019, we adopted Topic 842 using the optional cumulative-effect transition method of adoption, under which the new standards were applied prospectively rather than restating the prior periods presented. As a result, certain accounts lack a comparable value for the same period of 2018 and 2017, specifically accounts and values associated with operating leases and right-of-use (“ROU”) assets. As a result of adopting the new standard, we recorded ROU assets and operating lease liabilities of approximately $7,769,000 and $8,252,000, respectively, on the consolidated balance sheet for 2019. The ROU assets equaled the operating lease liabilities, excluding the impact of reclassifying prepaid rent and deferred rent of approximately $14,000 and $497,000, respectively. These amounts were previously recorded in prepaid expenses and other current assets and other accrued liabilities, respectively. The new standard did not materially impact our results of operation or cash flows.
In addition, we made an accounting policy election not to recognize leases with an initial term of 12 months or less and not to separate lease and non-lease components. We elected the practical expedients package, which among other things, allowed us to carry forward the historical lease classification. We did not elect the hindsight or land easement practical expedients.
Several of our leases include options to renew, with renewal terms that can extend from one to 10 years or more. The exercise of lease renewal options is primarily at our discretion. To measure operating lease recognition, we evaluated our lease agreements to determine if they had economic incentives for renewal or options to purchase. We deem leasehold improvements as one of the few economic incentives that would entice us to renew a lease and all of our leasehold improvements are currently fully amortized.
Where readily determinable, we use the implicit interest rate in determining the present value of future minimum lease payments. In the absence of an implicit rate, we use our incremental borrowing rate based on the information available at the lease commencement date. We give consideration to our outstanding debt, as well as publicly available data for instruments with similar characteristics when calculating our incremental borrowing rates. Our ROU assets are amortized to operating lease cost over the lease terms on a straight-line basis.
Revenue Recognition. Our services are provided under cancelable service contracts which usually have an original expected duration of one year or less. These contracts are either “turnkey” or “term” agreements. Under both types of agreements, we recognize revenue as the services are performed. Revenue is generally recognized based on square miles of data recorded compared to total square miles anticipated to be recorded on the survey using the total estimated revenue for the service contract. In the case of a cancelled service contract, the client is billed and revenue is recognized for any third party charges and square miles of data recorded up to the date of cancellation.
We also receive reimbursements for certain out-of-pocket expenses under the terms of the service contracts. The amounts billed to clients are included at their gross amount in the total estimated revenue for the service contract.
Clients are billed as permitted by the service contract. Contract assets and contract liabilities are the result of timing differences between revenue recognition, billings and cash collections. If billing occurs prior to the revenue recognition or billing exceeds the revenue recognized, the amount is considered deferred revenue and a contract liability. Conversely, if the revenue recognition exceeds the billing, the excess is considered an unbilled receivable and a contract asset. As services are performed, those contract liabilities and contract assets are recognized as revenue and expense, respectively.
In some instances, third-party permitting, surveying, drilling, helicopter, equipment rental and mobilization costs that directly relate to the contract are utilized to fulfill the contract obligations. These fulfillment costs are capitalized in
25
other current assets and amortized based on the total square miles of data recorded compared to total square miles anticipated to be recorded on the survey using the total estimated fulfillment costs for the service contract.
Estimates for total revenue and total fulfillment cost on any service contract are based on significant qualitative and quantitative judgments. Management considers a variety of factors such as whether various components of the performance obligation will be performed internally or externally, cost of third party services, and facts and circumstances unique to the performance obligation in making these estimates.
In May 2014, the FASB issued new guidance related to revenue recognition in which an entity should recognize revenue when promised goods or services are transferred to customers in an amount that reflects the consideration to which the entity expects to be entitled in exchange for those goods or services. Codified as Topic 606, this new guidance also required disclosures sufficient to enable users to understand the nature, amount, timing and uncertainty of revenue and cash flows arising from contracts with customers.
We adopted Topic 606 effective January 1, 2018, using the full retrospective method, which required us to adjust our consolidated financial statements from amounts previously reported for each prior reporting period presented. We recognized the cumulative effect of adopting the guidance as an adjustment to our opening balance of retained earnings as of January 1, 2016. We elected several ongoing and transitional practical expedients including (i) to ignore the financing component when estimating the transaction price for service contracts completed within one year, (ii) to exclude sales tax collected from the customer when determining the transaction price, (iii) to expense incremental costs to obtain a customer contract if the amortization period for those costs would otherwise be one year or less, (iv) to not restate contracts that begin and end within the same annual reporting period, (v) to use the transaction price at the completion of the contract to retrospectively apply the new guidance, and (vi) to not disclose the remaining performance obligations for the reporting periods presented before the date of initial application. The most significant impact to us of the adoption of Topic 606 relates to the deferred recognition of revenues and expenses to fulfill contracts with customers until data recording has begun.
Income Taxes. We account for our income taxes with the recognition of amounts of taxes payable or refundable for the current year and by using an asset and liability approach in recognizing the amount of deferred tax liabilities and assets for the future tax consequences of events that have been recognized in our financial statements or tax returns. We determine deferred taxes by identifying the types and amounts of existing temporary differences, measuring the total deferred tax asset or liability using the applicable tax rate in effect for the year in which those temporary differences are expected to be recovered or settled. The effect of a change in tax rates of deferred tax assets and liabilities is recognized in income in the year of an enacted rate change. The deferred tax asset is reduced by a valuation allowance if, based on available evidence, it is more likely than not that some portion or all of the deferred tax assets will not be realized. Our methodology for recording income taxes requires judgment regarding assumptions and the use of estimates, including determining our annual effective tax rate and the valuation of deferred tax assets, which can create a variance between actual results and estimates and could have a material impact on our provision or benefit for income taxes. Due to our recent operating losses and valuation allowances, we may recognize reduced or no tax benefits on future losses on the Consolidated Statements of Operations and Comprehensive Loss. Our effective tax rates differ from the statutory federal rate of 21% for certain items such as state and local taxes, valuation allowances, non‑deductible expenses and discrete items.
Recently Issued Accounting Pronouncements
In December 2019, the FASB issued ASU No. 2019-12, Income Taxes (“Topic 740”): Simplifying the Accounting for Income Taxes, which simplifies the accounting for income taxes by eliminating certain exceptions to the general principles in Topic 740 and by clarifying and amending existing guidance to improve consistent application. This ASU is effective for the annual period beginning after December 15, 2020, including interim periods within that annual period. Certain amendments within this ASU are required to be applied on a retrospective basis for all periods presented; others are to be applied using a modified retrospective approach with a cumulative-effect adjustment to retained earnings, if any, as of the beginning of the first reporting period in which the guidance is adopted; and yet others are to be applied using either basis. All other amendments not specified in the ASU should be applied on a prospective basis. Early adoption is permitted. An entity that elects to early adopt in an interim period should reflect any adjustments as of the beginning of the annual period that includes that interim period. Additionally, an entity that elects early adoption must adopt all the amendments in the same period. We are currently evaluating the new guidance to determine the impact it will have on our consolidated financial statements.
26
In June 2016, the FASB issued ASU No. 2016-13, Financial Instruments – Credit Losses (Topic 326): Measurement of Credit Losses on Financial Instruments, which requires entities to measure expected credit losses for certain financial assets using a new, forward-looking current expected credit loss model (“CECL”) that will result in the earlier recognition of allowances for losses. CECL is based on historical experience, adjusted for current conditions and reasonable and supportable forecasts. This ASU is effective for the annual period beginning after December 15, 2019, including interim periods within that annual period using a modified retrospective approach with a cumulative-effect adjustment to retained earnings for additional loss allowances, if any, as of the beginning of the first reporting period in which the guidance is adopted. Our financial instruments within the scope of this guidance primarily includes trade receivables, and we do not expect a material impact on our consolidated financial statements.
In June 2018, the FASB issued ASU No. 2018-07, Compensation – Stock Compensation (“Topic 718”): Improvements to Nonemployee Share-Based Payment Accounting, which expands the scope of Topic 718 to include share-based payment transactions for acquiring goods and services from nonemployees except for certain circumstances. Any transition impact will be a cumulative-effect adjustment to retained earnings as of the beginning of the year of adoption. We adopted this guidance in the first quarter of 2019 and it did not have a material impact on our consolidated financial statements.
In August 2018, the FASB issued ASU No. 2018-13, Fair Value Measurement (Topic 820): Disclosure Framework – Changes to the Disclosure Requirements for Fair Value Measurement, which modifies the disclosure requirements on fair value measurement by removing, modifying and adding certain disclosures. This ASU is effective for the annual period beginning after December 15, 2019, including interim periods within that annual period. The adoption of this guidance will not have a material impact on our consolidated financial statements.
In August 2018, the SEC adopted amendments to simplify certain disclosure requirements, as set forth in Securities Act Release No. 33-10532, Disclosure Update and Simplification, which includes a requirement for entities to present the changes in shareholders’ equity in the interim financial statements in quarterly reports on Form 10-Q. This amendment is effective for all filings made on or after November 5, 2018. In light of the timing of effectiveness of the amendment and proximity to the filing date for most filers’ quarterly reports, the SEC has allowed for a filer’s first presentation of the changes in shareholders’ equity to be included in its Form 10-Q for the quarter that begins after the effective date. We adopted the SEC’s amendment to interim disclosures in the first quarter of 2019 and have presented the changes in shareholders’ equity on an interim basis.
Item 7A. QUANTITATIVE AND QUALITATIVE DISCLOSURES ABOUT MARKET RISK
We are exposed to certain market risks arising from the use of financial instruments in the ordinary course of business. These risks arise primarily as a result of potential changes to operating concentration of credit risk and changes in interest rates. We have not entered into any hedge arrangements, commodity swap agreements, commodity futures, options or other derivative financial instruments. We also conduct business in Canada, which subjects our results of operations and cash flows to foreign currency exchange rate risk.
Concentration of Credit Risk. Our principal market risks include fluctuations in commodity prices, which affect demand for and pricing of our services, and the risk related to the concentration of our clients in the oil and natural gas industry. Since all of our clients are involved in the oil and natural gas industry, there may be a positive or negative effect on our exposure to credit risk because our clients may be similarly affected by changes in economic and industry conditions. As an example, changes to existing regulations or the adoption of new regulations may unfavorably impact us, our suppliers or our clients. In the normal course of business, we provide credit terms to our clients. Accordingly, we perform ongoing credit evaluations of our clients and maintain allowances for possible losses. Our historical experience supports our allowance for doubtful accounts of $250,000 at December 31, 2019. This does not necessarily indicate that it would be adequate to cover a payment default by one large or several smaller clients.
We generally provide services to certain key clients that account for a significant percentage of our accounts receivable at any given time. Our key clients vary over time. We extend credit to various companies in the oil and natural gas industry, including our key clients, for the acquisition of seismic data, which results in a concentration of credit risk. This concentration of credit risk may be affected by changes in the economic or other conditions of our key clients and may accordingly impact our overall credit risk. If any of these significant clients were to terminate their contracts or fail to contract for our services in the future because they are acquired, alter their exploration or development strategy, or for
27
any other reason, our results of operations could be affected. Because of the nature of our contracts and clients’ projects, our largest clients can change from year to year, and the largest clients in any year may not be indicative of the largest clients in any subsequent year. During the twelve months ended December 31, 2019, our four largest clients accounted for approximately 60% of revenue. The remaining balance of our revenue derived from varied clients and none represented more than 10% of revenue.
Interest Rate Risk. From time to time, we are exposed to the impact of interest rate changes on the outstanding indebtedness under our Loan Agreement.
We generally have cash in the bank which exceeds federally insured limits. Historically, we have not experienced any losses in such accounts; however, volatility in financial markets may impact our credit risk on cash and short‑term investments. At December 31, 2019, cash and cash equivalents totaled $26,271,000.
For further information, see “Item 7. Management’s Discussion and Analysis of Financial Condition and Results of Operations,” and “Item 1A. Risk Factors.”
Item 8. FINANCIAL STATEMENTS AND SUPPLEMENTARY DATA
The information required by this item appears on pages F‑1 through F‑24 hereof and are incorporated herein by reference.
Item 9. CHANGES IN AND DISAGREEMENTS WITH ACCOUNTANTS ON ACCOUNTING AND FINANCIAL DISCLOSURE
None.
Item 9A. CONTROLS AND PROCEDURES
Management’s Evaluation of Disclosure Controls and Procedures
We carried out an evaluation, under the supervision and with the participation of our management, including our principal executive, financial and accounting officers, of the effectiveness of our disclosure controls and procedures pursuant to Rule 13a‑15(e) and 15d‑15(e) under the Exchange Act as of the end of the period covered by this report. Based upon that evaluation, our President and Chief Executive Officer, and our Executive Vice President, Chief Financial Officer, Secretary, and Treasurer concluded that, as of December 31, 2019, our disclosure controls and procedures were effective, in all material respects, with regard to the recording, processing, summarizing and reporting, within the time periods specified in the SEC’s rules and forms, for information required to be disclosed by us in the reports that we file or submit under the Exchange Act. Our disclosure controls and procedures include controls and procedures designed to ensure that information required to be disclosed in reports filed or submitted under the Exchange Act is accumulated and communicated to our management, including our President and Chief Executive Officer, and our Executive Vice President, Chief Financial Officer, Secretary, and Treasurer, as appropriate, to allow timely decisions regarding required disclosure.
Management’s Report on Internal Control over Financial Reporting
Our management is responsible for establishing and maintaining adequate internal control over financial reporting. Our internal control over financial reporting is designed to provide reasonable assurance regarding the reliability of financial reporting and the preparation of financial statements for external purposes in accordance with GAAP. Because of its inherent limitations, internal control over financial reporting may not prevent or detect misstatements. Also, projections of any evaluation of effectiveness to future periods are subject to the risk that controls may become inadequate because of changes in conditions, or that the degree of compliance with the policies or procedures may deteriorate. Under the supervision and with the participation of management, including our President and Chief Executive Officer, and Executive Vice President, Chief Financial Officer, Secretary, and Treasurer, we evaluated the effectiveness of our internal controls over financial reporting as of December 31, 2019 using the criteria set forth in Internal Control — Integrated Framework issued by the Committee of Sponsoring Organizations of the Treadway Commission (2013 framework). Based on this evaluation, we have concluded that, as of December 31, 2019, our internal control over financial reporting was effective. Our internal control over financial reporting as of December 31, 2019 has been audited by RSM US LLP, the
28
independent registered public accounting firm who also audited our financial statements. Their attestation report appears on page F‑2.
Changes in Internal Control over Financial Reporting
There have not been any changes in our internal control over financial reporting (as defined in Rule 13a‑15(f) and 15d‑15(f) of the Exchange Act) during the quarter ended December 31, 2019 that have materially affected or are reasonably likely to materially affect our internal control over financial reporting.
None.
Item 10. DIRECTORS, EXECUTIVE OFFICERS AND CORPORATE GOVERNANCE
The information required by Item 10 of Form 10‑K is hereby incorporated by reference from the earlier filed of: (i) an amendment to this annual report on Form 10‑K or (ii) the Company’s definitive proxy statement which will be filed pursuant to Regulation 14A within 120 days after the Company’s year-end for the year covered by this report.
Item 11. EXECUTIVE COMPENSATION
The information required by Item 11 of Form 10‑K is hereby incorporated by reference from the earlier filed of: (i) an amendment to this annual report on Form 10‑K or (ii) the Company’s definitive proxy statement which will be filed pursuant to Regulation 14A within 120 days after the Company’s year-end for the year covered by this report.
Item 12. SECURITY OWNERSHIP OF CERTAIN BENEFICIAL OWNERS AND MANAGEMENT AND RELATED STOCKHOLDER MATTERS
The information required with respect to our equity compensation plans is set forth in Item 5 of this Form 10‑K. Other information required by Item 12 of Form 10‑K is hereby incorporated by reference from the earlier filed of: (i) an amendment to this annual report on Form 10‑K or (ii) the Company’s definitive proxy statement which will be filed pursuant to Regulation 14A within 120 days after the Company’s year-end for the year covered by this report.
Item 13. CERTAIN RELATIONSHIPS AND RELATED TRANSACTIONS AND DIRECTOR INDEPENDENCE
The information required by Item 13 of Form 10‑K is hereby incorporated by reference from the earlier filed of: (i) an amendment to this annual report on Form 10‑K or (ii) the Company’s definitive proxy statement which will be filed pursuant to Regulation 14A within 120 days after the Company’s year-end for the year covered by this report.
Item 14. PRINCIPAL ACCOUNTING FEES AND SERVICES
The information required by Item 14 of Form 10‑K is hereby incorporated by reference from the earlier filed of: (i) an amendment to this annual report on Form 10‑K or (ii) the Company’s definitive proxy statement, which will be filed pursuant to Regulation 14A within 120 days after the Company’s year-end for the year covered by this report.
29
Item 15. EXHIBITS AND FINANCIAL STATEMENT SCHEDULES
(a)The following documents are filed as part of this report:
(1)Financial Statements.
The following consolidated financial statements of the Company appear on pages F‑1 through F‑24 and are incorporated by reference into Part II, Item 8:
Reports of Independent Registered Public Accounting Firm
Consolidated Statements of Operations and Comprehensive Loss
Consolidated Statements of Stockholders’ Equity
Consolidated Statements of Cash Flows
Notes to the Consolidated Financial Statements
(2)Financial Statement Schedules.
All schedules are omitted because they are either not applicable or the required information is shown in the financial statements or notes thereto.
(3)Exhibits.
The information required by this item 15(a)(3) is set forth in the Index to Exhibits accompanying this Annual Report on Form 10‑K and is hereby incorporated by reference.
30
|
EXHIBIT NO. |
|
DESCRIPTION |
|
|
|
|
| 2.1 |
|
|
|
|
|
|
| 3.1 |
|
|
|
|
|
|
| 3.2 |
|
|
|
|
|
|
| 4.1 |
|
|
|
|
|
|
|
*4.2 |
|
|
|
|
|
|
|
+10.1 |
|
|
|
|
|
|
|
+10.2 |
|
|
|
|
|
|
|
+10.3 |
|
|
|
|
|
|
|
+10.4 |
|
|
|
|
|
|
|
+10.5 |
|
|
|
|
|
|
|
+10.6 |
|
|
|
|
|
|
|
+10.7 |
|
|
|
|
|
|
|
+10.8 |
|
|
|
|
|
|
|
+10.9 |
|
31
|
EXHIBIT NO. |
|
DESCRIPTION |
|
|
|
|
|
|
|
|
|
+10.10 |
|
|
|
|
|
|
|
+10.11 |
|
|
|
|
|
|
|
+10.12 |
|
|
|
|
|
|
|
+10.13 |
|
|
|
|
|
|
|
+10.14 |
|
|
|
|
|
|
|
+10.15 |
|
|
|
|
|
|
|
+10.16 |
|
|
|
|
|
|
|
+10.17 |
|
|
|
|
|
|
|
+10.18 |
|
|
|
|
|
|
|
+10.19 |
|
|
|
|
|
|
|
+10.20 |
|
|
|
|
|
|
|
+10.21 |
|
|
|
|
|
|
32
|
EXHIBIT NO. |
|
DESCRIPTION |
|
|
|
|
|
+10.22 |
|
|
|
|
|
|
|
+10.23 |
|
|
|
|
|
|
|
+10.24 |
|
|
|
|
|
|
| 10.25 |
|
|
|
|
|
|
| 10.26 |
|
|
|
|
|
|
|
+10.27 |
|
|
|
|
|
|
|
+10.28 |
|
|
|
|
|
|
| 10.29 |
|
|
|
|
|
|
|
*21.1 |
|
|
|
|
|
|
|
*23.1 |
|
|
|
|
|
|
|
*31.1 |
|
|
|
|
|
|
|
*31.2 |
|
|
|
|
|
|
|
*32.1 |
|
|
|
|
|
|
|
*32.2 |
|
|
|
|
|
|
|
101.INS* |
|
XBRL Instance Document. |
|
|
|
|
33
|
EXHIBIT NO. |
|
DESCRIPTION |
|
|
|
|
|
101.SCH* |
|
XBRL Taxonomy Extension Schema Document. |
|
|
|
|
|
101.CAL* |
|
XBRL Taxonomy Extension Calculation Linkbase Document. |
|
|
|
|
|
101.DEF* |
|
XBRL Taxonomy Extension Definition Linkbase Document. |
|
|
|
|
|
101.LAB* |
|
XBRL Taxonomy Extension Labels Linkbase Document. |
|
|
|
|
|
101.PRE* |
|
XBRL Taxonomy Extension Presentation Linkbase Document. |
|
|
|
|
* Filed herewith.
+ Management contract or compensatory plan or arrangement.
34
Pursuant to the requirements of Section 13 or 15(d) of the Exchange Act, the registrant has duly caused this report to be signed on its behalf by the undersigned, thereunto duly authorized, in the City of Midland, and the State of Texas, on the 6th day of March, 2020.
|
|
|
DAWSON GEOPHYSICAL COMPANY |
|
|
|
|
|
|
|
|
|
|
|
|
|
|
By: |
/s/ Stephen C. Jumper |
|
|
|
|
Stephen C. Jumper |
|
|
|
|
Chairman of the Board of Directors |
|
|
|
|
President and Chief Executive Officer |
Pursuant to the requirements of the Exchange Act, this report has been signed below by the following persons on behalf of the registrant and in the capacities and on the dates indicated.
|
Signature |
|
Title |
|
Date |
|
|
|
|
|
|
|
/s/ Stephen C. Jumper Stephen C. Jumper |
|
President, Chief Executive Officer and Chairman of the Board of Directors |
|
03-06-20 |
|
|
|
|
|
|
|
|
|
|
|
|
|
/s/ William J. Barrett William J. Barrett |
|
Director |
|
03-06-20 |
|
|
|
|
|
|
|
|
|
|
|
|
|
/s/ Craig W. Cooper Craig W. Cooper |
|
Director |
|
03-06-20 |
|
|
|
|
|
|
|
|
|
|
|
|
|
/s/ Gary M. Hoover Gary M. Hoover |
|
Director |
|
03-06-20 |
|
|
|
|
|
|
|
|
|
|
|
|
|
/s/ Michael L. Klofas Michael L. Klofas |
|
Director |
|
03-06-20 |
|
|
|
|
|
|
|
|
|
|
|
|
|
/s/ Ted R. North Ted R. North |
|
Director |
|
03-06-20 |
|
|
|
|
|
|
|
|
|
|
|
|
|
/s/ Mark A. Vander Ploeg Mark A. Vander Ploeg |
|
Director |
|
03-06-20 |
|
|
|
|
|
|
|
|
|
|
|
|
|
/s/ James K. Brata James K. Brata |
|
Executive Vice President, Chief Financial Officer, Secretary, and Treasurer |
|
03-06-20 |
|
|
|
|
|
|
|
|
|
|
|
|
35
INDEX TO CONSOLIDATED FINANCIAL STATEMENTS
|
Consolidated Financial Statements of Dawson Geophysical Company |
|
Page |
||
|
|
F‑2 |
|||
|
Consolidated Balance Sheets as of December 31, 2019 and 2018 |
|
F‑4 |
||
|
|
F‑5 |
|||
|
Consolidated Statements of Stockholders’ Equity for the years ended December 31, 2019, 2018 and 2017 |
|
F‑6 |
||
|
Consolidated Statements of Cash Flows for the years ended December 31, 2019, 2018 and 2017 |
|
F‑7 |
||
|
|
F‑8 |
|||
F-1
Report of Independent Registered Public Accounting Firm
To the Board of Directors and Stockholders
Dawson Geophysical Company
Opinion on the Internal Control Over Financial Reporting
We have audited Dawson Geophysical Company's (the Company) internal control over financial reporting as of December 31, 2019, based on criteria established in Internal Control — Integrated Framework issued by the Committee of Sponsoring Organizations of the Treadway Commission in 2013. In our opinion, the Company maintained, in all material respects, effective internal control over financial reporting as of December 31, 2019, based on criteria established in Internal Control — Integrated Framework issued by the Committee of Sponsoring Organizations of the Treadway Commission in 2013.
We have also audited, in accordance with the standards of the Public Company Accounting Oversight Board (United States) (PCAOB), the consolidated balance sheets as of December 31, 2019 and 2018, the related consolidated statements of operations and comprehensive loss, stockholders' equity and cash flows for each of the three years in the period ended December 31, 2019 of the Company and our report dated March 6, 2020 expressed an unqualified opinion.
Basis for Opinion
The Company’s management is responsible for maintaining effective internal control over financial reporting and for its assessment of the effectiveness of internal control over financial reporting in the accompanying Management’s Report on Internal Control over Financial Reporting. Our responsibility is to express an opinion on the Company’s internal control over financial reporting based on our audit. We are a public accounting firm registered with the PCAOB and are required to be independent with respect to the Company in accordance with U.S. federal securities laws and the applicable rules and regulations of the Securities and Exchange Commission and the PCAOB.
We conducted our audit in accordance with the standards of the PCAOB. Those standards require that we plan and perform the audit to obtain reasonable assurance about whether effective internal control over financial reporting was maintained in all material respects. Our audit included obtaining an understanding of internal control over financial reporting, assessing the risk that a material weakness exists, and testing and evaluating the design and operating effectiveness of internal control based on the assessed risk. Our audit also included performing such other procedures as we considered necessary in the circumstances. We believe that our audit provides a reasonable basis for our opinion.
Definition and Limitations of Internal Control Over Financial Reporting
A company's internal control over financial reporting is a process designed to provide reasonable assurance regarding the reliability of financial reporting and the preparation of financial statements for external purposes in accordance with generally accepted accounting principles. A company's internal control over financial reporting includes those policies and procedures that (1) pertain to the maintenance of records that, in reasonable detail, accurately and fairly reflect the transactions and dispositions of the assets of the company; (2) provide reasonable assurance that transactions are recorded as necessary to permit preparation of financial statements in accordance with generally accepted accounting principles, and that receipts and expenditures of the company are being made only in accordance with authorizations of management and directors of the company; and (3) provide reasonable assurance regarding prevention or timely detection of unauthorized acquisition, use or disposition of the company's assets that could have a material effect on the financial statements.
Because of its inherent limitations, internal control over financial reporting may not prevent or detect misstatements. Also, projections of any evaluation of effectiveness to future periods are subject to the risk that controls may become inadequate because of changes in conditions, or that the degree of compliance with the policies or procedures may deteriorate.
/s/ RSM US LLP
Houston, Texas
March 6, 2020
F-2
Report of Independent Registered Public Accounting Firm
To the Board of Directors and Stockholders
Dawson Geophysical Company
Opinion on the Financial Statements
We have audited the accompanying consolidated balance sheets of Dawson Geophysical Company and its subsidiaries (the Company) as of December 31, 2019 and 2018, the related consolidated statements of operations and comprehensive loss, stockholders' equity and cash flows for each of the years in the three year period ended December 31, 2019, and the related notes to the consolidated financial statements (collectively, the financial statements).
In our opinion, the financial statements present fairly, in all material respects, the financial position of the Company as of December 31, 2019 and 2018, and the results of their operations and their cash flows for each of the three years in the period ended December 31, 2019, in conformity with accounting principles generally accepted in the United States of America.
We have also audited, in accordance with the standards of the Public Company Accounting Oversight Board (United States) (PCAOB), the Company's internal control over financial reporting as of December 31, 2019, based on criteria established in Internal Control — Integrated Framework issued by the Committee of Sponsoring Organizations of the Treadway Commission in 2013, and our report dated March 6, 2020 expressed an unqualified opinion on the effectiveness of the Company's internal control over financial reporting.
Basis for Opinion
These financial statements are the responsibility of the Company’s management. Our responsibility is to express an opinion on the Company’s consolidated financial statements based on our audits. We are a public accounting firm registered with the PCAOB and are required to be independent with respect to the Company in accordance with U.S. federal securities laws and the applicable rules and regulations of the Securities and Exchange Commission and the PCAOB.
We conducted our audits in accordance with the standards of the PCAOB. Those standards require that we plan and perform the audits to obtain reasonable assurance about whether the consolidated financial statements are free of material misstatement, whether due to error or fraud. Our audits included performing procedures to assess the risks of material misstatement of the financial statements, whether due to error or fraud, and performing procedures that respond to those risks. Such procedures included examining, on a test basis, evidence regarding the amounts and disclosures in the financial statements. Our audits also included evaluating the accounting principles used and significant estimates made by management, as well as evaluating the overall presentation of the financial statements. We believe that our audits provide a reasonable basis for our opinion.
/s/ RSM US LLP
We have served as the Company's auditor since 2016.
Houston, Texas
March 6, 2020
F-3
DAWSON GEOPHYSICAL COMPANY
(amounts in thousands, except share data)
|
|
|
December 31, |
|
December 31, |
|
||
|
|
|
2019 |
|
2018 |
|
||
|
Assets |
|
|
|
|
|
|
|
|
Current assets: |
|
|
|
|
|
|
|
|
Cash and cash equivalents |
|
$ |
26,271 |
|
$ |
28,729 |
|
|
Restricted cash |
|
|
5,000 |
|
|
— |
|
|
Short-term investments |
|
|
2,350 |
|
|
10,583 |
|
|
Accounts receivable, net of allowance for doubtful accounts of $250 at December 31, 2019 and 2018 |
|
|
24,356 |
|
|
25,338 |
|
|
Current maturities of notes receivable |
|
|
66 |
|
|
64 |
|
|
Prepaid expenses and other current assets |
|
|
7,575 |
|
|
12,311 |
|
|
Total current assets |
|
|
65,618 |
|
|
77,025 |
|
|
Property and equipment |
|
|
284,647 |
|
|
293,948 |
|
|
Less accumulated depreciation |
|
|
(231,098) |
|
|
(222,407) |
|
|
Property and equipment, net |
|
|
53,549 |
|
|
71,541 |
|
|
Right-of-use assets |
|
|
6,605 |
|
|
— |
|
|
Notes receivable, net of current maturities |
|
|
1,394 |
|
|
1,447 |
|
|
Intangibles, net |
|
|
385 |
|
|
379 |
|
|
Long-term deferred tax assets, net |
|
|
57 |
|
|
293 |
|
|
Total assets |
|
$ |
127,608 |
|
$ |
150,685 |
|
|
Liabilities and Stockholders' Equity |
|
|
|
|
|
|
|
|
Current liabilities: |
|
|
|
|
|
|
|
|
Accounts payable |
|
$ |
3,952 |
|
$ |
5,427 |
|
|
Accrued liabilities: |
|
|
|
|
|
|
|
|
Payroll costs and other taxes |
|
|
1,963 |
|
|
1,034 |
|
|
Other |
|
|
3,599 |
|
|
3,643 |
|
|
Deferred revenue |
|
|
3,481 |
|
|
10,501 |
|
|
Current maturities of notes payable and finance leases |
|
|
4,062 |
|
|
6,683 |
|
|
Current maturities of operating lease liabilities |
|
|
1,200 |
|
|
— |
|
|
Total current liabilities |
|
|
18,257 |
|
|
27,288 |
|
|
Long-term liabilities: |
|
|
|
|
|
|
|
|
Notes payable and finance leases, net of current maturities |
|
|
96 |
|
|
6,097 |
|
|
Operating lease liabilities, net of current maturities |
|
|
5,940 |
|
|
— |
|
|
Deferred tax liabilities, net |
|
|
— |
|
|
134 |
|
|
Other accrued liabilities |
|
|
150 |
|
|
150 |
|
|
Total long-term liabilities |
|
|
6,186 |
|
|
6,381 |
|
|
Operating commitments and contingencies |
|
|
— |
|
|
— |
|
|
Stockholders’ equity: |
|
|
|
|
|
|
|
|
Preferred stock-par value $1.00 per share; 4,000,000 shares authorized, none outstanding |
|
|
— |
|
|
— |
|
|
Common stock-par value $0.01 per share; 35,000,000 shares authorized, |
|
|
|
|
|
|
|
|
23,335,855 and 23,018,441 shares issued, and 23,287,410 and 22,969,996 |
|
|
|
|
|
|
|
|
shares outstanding at December 31, 2019 and 2018, respectively |
|
|
233 |
|
|
230 |
|
|
Additional paid-in capital |
|
|
154,235 |
|
|
153,268 |
|
|
Retained deficit |
|
|
(49,731) |
|
|
(34,518) |
|
|
Treasury stock, at cost; 48,445 shares |
|
|
— |
|
|
— |
|
|
Accumulated other comprehensive loss, net |
|
|
(1,572) |
|
|
(1,964) |
|
|
Total stockholders’ equity |
|
|
103,165 |
|
|
117,016 |
|
|
Total liabilities and stockholders’ equity |
|
$ |
127,608 |
|
$ |
150,685 |
|
See accompanying notes to the consolidated financial statements.
F-4
DAWSON GEOPHYSICAL COMPANY
CONSOLIDATED STATEMENTS OF OPERATIONS AND COMPREHENSIVE LOSS
(amounts in thousands, except share and per share data)
|
|
|
Year Ended December 31, |
|
|||||||
|
|
|
2019 |
|
2018 |
|
2017 |
|
|||
|
Operating revenues |
|
$ |
145,773 |
|
$ |
154,156 |
|
$ |
156,532 |
|
|
Operating costs: |
|
|
|
|
|
|
|
|
|
|
|
Operating expenses |
|
|
123,024 |
|
|
132,937 |
|
|
139,072 |
|
|
General and administrative |
|
|
17,169 |
|
|
16,287 |
|
|
16,189 |
|
|
Depreciation and amortization |
|
|
21,826 |
|
|
29,959 |
|
|
39,235 |
|
|
|
|
|
162,019 |
|
|
179,183 |
|
|
194,496 |
|
|
|
|
|
|
|
|
|
|
|
|
|
|
Loss from operations |
|
|
(16,246) |
|
|
(25,027) |
|
|
(37,964) |
|
|
|
|
|
|
|
|
|
|
|
|
|
|
Other income (expense): |
|
|
|
|
|
|
|
|
|
|
|
Interest income |
|
|
548 |
|
|
400 |
|
|
306 |
|
|
Interest expense |
|
|
(435) |
|
|
(408) |
|
|
(158) |
|
|
Other income (expense) |
|
|
681 |
|
|
(170) |
|
|
712 |
|
|
Loss before income tax |
|
|
(15,452) |
|
|
(25,205) |
|
|
(37,104) |
|
|
|
|
|
|
|
|
|
|
|
|
|
|
Income tax benefit (expense) |
|
|
|
|
|
|
|
|
|
|
|
Current |
|
|
216 |
|
|
41 |
|
|
6,077 |
|
|
Deferred |
|
|
23 |
|
|
757 |
|
|
(763) |
|
|
|
|
|
239 |
|
|
798 |
|
|
5,314 |
|
|
|
|
|
|
|
|
|
|
|
|
|
|
Net loss |
|
|
(15,213) |
|
|
(24,407) |
|
|
(31,790) |
|
|
|
|
|
|
|
|
|
|
|
|
|
|
Other comprehensive income (loss): |
|
|
|
|
|
|
|
|
|
|
|
Net unrealized income (loss) on foreign exchange rate translation, net |
|
|
392 |
|
|
(1,141) |
|
|
816 |
|
|
|
|
|
|
|
|
|
|
|
|
|
|
Comprehensive loss |
|
$ |
(14,821) |
|
$ |
(25,548) |
|
$ |
(30,974) |
|
|
|
|
|
|
|
|
|
|
|
|
|
|
Basic loss per share of common stock |
|
$ |
(0.66) |
|
$ |
(1.07) |
|
$ |
(1.40) |
|
|
|
|
|
|
|
|
|
|
|
|
|
|
Diluted loss per share of common stock |
|
$ |
(0.66) |
|
$ |
(1.07) |
|
$ |
(1.40) |
|
|
|
|
|
|
|
|
|
|
|
|
|
|
Weighted average equivalent common shares outstanding |
|
|
23,179,257 |
|
|
22,912,217 |
|
|
22,779,377 |
|
|
|
|
|
|
|
|
|
|
|
|
|
|
Weighted average equivalent common shares outstanding - assuming dilution |
|
|
23,179,257 |
|
|
22,912,217 |
|
|
22,779,377 |
|
See accompanying notes to the consolidated financial statements.
F-5
DAWSON GEOPHYSICAL COMPANY
CONSOLIDATED STATEMENTS OF STOCKHOLDERS’ EQUITY
(amounts in thousands, except share data)
|
|
|
|
|
|
|
|
|
|
|
|
|
|
Accumulated |
|
|
|
|
|
|
|
|
Common Stock |
|
Additional |
|
Retained |
|
Other |
|
|
|
|
||||||
|
|
|
Number |
|
|
|
Paid-in |
|
Earnings |
|
Comprehensive |
|
|
|
|
||||
|
|
|
Of Shares |
|
Amount |
|
Capital |
|
(Deficit) |
|
(Loss) Income |
|
Total |
|
|||||
|
Balance December 31, 2016 |
|
22,795,039 |
|
$ |
228 |
|
$ |
151,185 |
|
$ |
21,657 |
|
$ |
(1,596) |
|
$ |
171,474 |
|
|
Impact of adopting ASU 2016-09 |
|
|
|
|
|
|
|
20 |
|
|
(20) |
|
|
|
|
|
— |
|
|
Net loss (as adjusted) |
|
|
|
|
|
|
|
|
|
|
(31,790) |
|
|
|
|
|
(31,790) |
|
|
Unrealized income on foreign exchange rate translation |
|
|
|
|
|
|
|
|
|
|
|
|
|
1,091 |
|
|
|
|
|
Income tax expense |
|
|
|
|
|
|
|
|
|
|
|
|
|
(275) |
|
|
|
|
|
Other comprehensive income |
|
|
|
|
|
|
|
|
|
|
|
|
|
816 |
|
|
816 |
|
|
Issuance of common stock under stock compensation plans |
|
92,448 |
|
|
1 |
|
|
(1) |
|
|
|
|
|
|
|
|
— |
|
|
Stock-based compensation expense |
|
|
|
|
|
|
|
656 |
|
|
|
|
|
|
|
|
656 |
|
|
Issuance of common stock as compensation |
|
67,498 |
|
|
— |
|
|
320 |
|
|
|
|
|
|
|
|
320 |
|
|
Shares exchanged for taxes on stock-based compensation |
|
(28,180) |
|
|
— |
|
|
(158) |
|
|
|
|
|
|
|
|
(158) |
|
|
Balance December 31, 2017 |
|
22,926,805 |
|
|
229 |
|
|
152,022 |
|
|
(10,153) |
|
|
(780) |
|
|
141,318 |
|
|
Impact of adopting ASU 2018-02 |
|
|
|
|
|
|
|
|
|
|
43 |
|
|
(43) |
|
|
— |
|
|
Cash in lieu of fractional shares for stock dividend |
|
(101) |
|
|
|
|
|
|
|
|
(1) |
|
|
|
|
|
(1) |
|
|
Net loss |
|
|
|
|
|
|
|
|
|
|
(24,407) |
|
|
|
|
|
(24,407) |
|
|
Unrealized loss on foreign exchange rate translation |
|
|
|
|
|
|
|
|
|
|
|
|
|
(1,141) |
|
|
|
|
|
Income tax benefit |
|
|
|
|
|
|
|
|
|
|
|
|
|
— |
|
|
|
|
|
Other comprehensive loss |
|
|
|
|
|
|
|
|
|
|
|
|
|
(1,141) |
|
|
(1,141) |
|
|
Issuance of common stock under stock compensation plans |
|
51,384 |
|
|
1 |
|
|
(1) |
|
|
|
|
|
|
|
|
— |
|
|
Stock-based compensation expense |
|
|
|
|
|
|
|
1,037 |
|
|
|
|
|
|
|
|
1,037 |
|
|
Issuance of common stock as compensation |
|
59,284 |
|
|
— |
|
|
331 |
|
|
|
|
|
|
|
|
331 |
|
|
Shares exchanged for taxes on stock-based compensation |
|
(18,931) |
|
|
— |
|
|
(121) |
|
|
|
|
|
|
|
|
(121) |
|
|
Balance December 31, 2018 |
|
23,018,441 |
|
|
230 |
|
|
153,268 |
|
|
(34,518) |
|
|
(1,964) |
|
|
117,016 |
|
|
Net loss |
|
|
|
|
|
|
|
|
|
|
(15,213) |
|
|
|
|
|
(15,213) |
|
|
Unrealized income on foreign exchange rate translation |
|
|
|
|
|
|
|
|
|
|
|
|
|
504 |
|
|
|
|
|
Income tax expense |
|
|
|
|
|
|
|
|
|
|
|
|
|
(112) |
|
|
|
|
|
Other comprehensive income |
|
|
|
|
|
|
|
|
|
|
|
|
|
392 |
|
|
392 |
|
|
Issuance of common stock under stock compensation plans |
|
263,459 |
|
|
2 |
|
|
(2) |
|
|
|
|
|
|
|
|
— |
|
|
Stock-based compensation expense |
|
|
|
|
|
|
|
909 |
|
|
|
|
|
|
|
|
909 |
|
|
Issuance of common stock as compensation |
|
119,556 |
|
|
1 |
|
|
296 |
|
|
|
|
|
|
|
|
297 |
|
|
Shares exchanged for taxes on stock-based compensation |
|
(65,601) |
|
|
— |
|
|
(236) |
|
|
|
|
|
|
|
|
(236) |
|
|
Balance December 31, 2019 |
|
23,335,855 |
|
$ |
233 |
|
$ |
154,235 |
|
$ |
(49,731) |
|
$ |
(1,572) |
|
$ |
103,165 |
|
See accompanying notes to the consolidated financial statements.
F-6
DAWSON GEOPHYSICAL COMPANY
CONSOLIDATED STATEMENTS OF CASH FLOWS
(amounts in thousands)
|
|
|
Year Ended December 31, |
|
|||||||
|
|
|
2019 |
|
2018 |
|
2017 |
|
|||
|
Cash flows from operating activities: |
|
|
|
|
|
|
|
|
|
|
|
Net loss |
|
$ |
(15,213) |
|
$ |
(24,407) |
|
$ |
(31,790) |
|
|
Adjustments to reconcile net loss to net cash provided by (used in) operating activities: |
|
|
|
|
|
|
|
|
|
|
|
Depreciation and amortization |
|
|
21,826 |
|
|
29,959 |
|
|
39,235 |
|
|
Operating lease cost |
|
|
1,201 |
|
|
— |
|
|
— |
|
|
Non-cash compensation |
|
|
1,206 |
|
|
1,368 |
|
|
976 |
|
|
Deferred income tax (benefit) expense |
|
|
(23) |
|
|
(757) |
|
|
763 |
|
|
Change in other accrued long-term liabilities |
|
|
— |
|
|
— |
|
|
(1,489) |
|
|
(Gain) loss on disposal of assets |
|
|
(86) |
|
|
16 |
|
|
(1,714) |
|
|
Remeasurement and other |
|
|
(139) |
|
|
— |
|
|
(91) |
|
|
Change in operating assets and liabilities: |
|
|
|
|
|
|
|
|
|
|
|
Decrease (increase) in accounts receivable |
|
|
1,118 |
|
|
6,744 |
|
|
(16,465) |
|
|
Decrease (increase) in prepaid expenses and other current assets |
|
|
6,983 |
|
|
(2,664) |
|
|
278 |
|
|
(Decrease) increase in accounts payable |
|
|
(579) |
|
|
(798) |
|
|
1,207 |
|
|
Increase (decrease) in accrued liabilities |
|
|
1,356 |
|
|
(777) |
|
|
1,458 |
|
|
Decrease in operating lease liabilities |
|
|
(1,150) |
|
|
— |
|
|
— |
|
|
(Decrease) increase in deferred revenue |
|
|
(7,020) |
|
|
4,187 |
|
|
929 |
|
|
Net cash provided by (used in) operating activities |
|
|
9,480 |
|
|
12,871 |
|
|
(6,703) |
|
|
|
|
|
|
|
|
|
|
|
|
|
|
Cash flows from investing activities: |
|
|
|
|
|
|
|
|
|
|
|
Capital expenditures, net of non-cash capital expenditures summarized below |
|
|
(4,396) |
|
|
(15,745) |
|
|
(8,675) |
|
|
Proceeds from maturity of short-term investments |
|
|
33,075 |
|
|
55,000 |
|
|
61,250 |
|
|
Acquisition of short-term investments |
|
|
(24,842) |
|
|
(49,000) |
|
|
(37,583) |
|
|
Proceeds from disposal of assets |
|
|
297 |
|
|
437 |
|
|
1,325 |
|
|
Proceeds from flood insurance claims |
|
|
— |
|
|
687 |
|
|
375 |
|
|
Proceeds from notes receivable |
|
|
51 |
|
|
25 |
|
|
96 |
|
|
Net cash provided by (used in) investing activities |
|
|
4,185 |
|
|
(8,596) |
|
|
16,788 |
|
|
|
|
|
|
|
|
|
|
|
|
|
|
Cash flows from financing activities: |
|
|
|
|
|
|
|
|
|
|
|
Proceeds from notes payable |
|
|
— |
|
|
6,518 |
|
|
— |
|
|
Principal payments on notes payable |
|
|
(8,165) |
|
|
(1,180) |
|
|
(2,186) |
|
|
Principal payments on finance leases |
|
|
(2,855) |
|
|
(2,699) |
|
|
(1,076) |
|
|
Tax withholdings related to stock-based compensation awards |
|
|
(236) |
|
|
(121) |
|
|
(158) |
|
|
Cash in lieu of stock dividend paid |
|
|
— |
|
|
(1) |
|
|
— |
|
|
Net cash (used in) provided by financing activities |
|
|
(11,256) |
|
|
2,517 |
|
|
(3,420) |
|
|
|
|
|
|
|
|
|
|
|
|
|
|
Effect of exchange rate changes on cash, cash equivalents and restricted cash |
|
|
133 |
|
|
(76) |
|
|
724 |
|
|
Net increase in cash, cash equivalents and restricted cash |
|
|
2,542 |
|
|
6,716 |
|
|
7,389 |
|
|
Cash, cash equivalents and restricted cash at beginning of period |
|
|
28,729 |
|
|
22,013 |
|
|
14,624 |
|
|
Cash, cash equivalents and restricted cash at end of period |
|
$ |
31,271 |
|
$ |
28,729 |
|
$ |
22,013 |
|
|
|
|
|
|
|
|
|
|
|
|
|
|
Supplemental cash flow information: |
|
|
|
|
|
|
|
|
|
|
|
Cash paid for interest |
|
$ |
440 |
|
$ |
408 |
|
$ |
143 |
|
|
Cash paid for income taxes |
|
$ |
40 |
|
$ |
14 |
|
$ |
— |
|
|
Cash received for income taxes |
|
$ |
55 |
|
$ |
— |
|
$ |
4,791 |
|
|
|
|
|
|
|
|
|
|
|
|
|
|
Non-cash operating, investing and financing activities: |
|
|
|
|
|
|
|
|
|
|
|
(Decrease) increase in accrued purchases of property and equipment |
|
$ |
(927) |
|
$ |
353 |
|
$ |
(907) |
|
|
Finance leases incurred |
|
$ |
121 |
|
$ |
— |
|
$ |
8,542 |
|
|
Increase in right-of-use assets and operating lease liabilities |
|
$ |
8,252 |
|
$ |
— |
|
$ |
— |
|
|
Decrease in right-of-use assets for accrued rent |
|
$ |
(497) |
|
$ |
— |
|
$ |
— |
|
|
Increase in right-of-use assets for prepaid rent |
|
$ |
14 |
|
$ |
— |
|
$ |
— |
|
|
Financed insurance premiums |
|
$ |
2,256 |
|
$ |
2,317 |
|
$ |
248 |
|
|
Equipment sales financed for buyer |
|
$ |
— |
|
$ |
— |
|
$ |
(1,500) |
|
|
Sales tax on equipment sales financed for buyer |
|
$ |
— |
|
$ |
— |
|
$ |
(132) |
|
See accompanying notes to the consolidated financial statements.
F-7
DAWSON GEOPHYSICAL COMPANY
NOTES TO CONSOLIDATED FINANCIAL STATEMENTS
1. Summary of Significant Accounting Policies
Organization and Nature of Operations
The Company is a leading provider of onshore seismic data acquisition and processing services. Founded in 1952, the Company acquires and processes 2-D, 3-D and multi-component seismic data for its clients, ranging from major oil and gas companies to independent oil and gas operators as well as providers of multi-client data libraries. The Company operates in the lower 48 states of the U.S. and in Canada.
Principles of Consolidation
The consolidated financial statements include the accounts of the Company and its wholly-owned subsidiaries, Dawson Operating LLC, Eagle Canada, Inc., Dawson Seismic Services Holdings, Inc., Eagle Canada Seismic Services ULC and Exploration Surveys, Inc. All significant intercompany balances and transactions have been eliminated in consolidation.
Cash Equivalents
For purposes of the financial statements, the Company considers demand deposits, certificates of deposit, overnight investments, money market funds and all highly liquid debt instruments purchased with an initial maturity of three months or less to be cash equivalents.
Allowance for Doubtful Accounts
Management determines the need for any allowance for doubtful accounts receivable based on its review of past-due accounts, its past experience of historical write-offs and its current client base. While the collectability of outstanding client invoices is continually assessed, the inherent volatility of the energy industry’s business cycle can cause swift and unpredictable changes in the financial stability of the Company’s clients.
Property and Equipment
Property and equipment is capitalized at historical cost or the fair value of assets acquired in a business combination and is depreciated over the useful life of the asset. Management’s estimation of this useful life is based on circumstances that exist in the seismic industry and information available at the time of the purchase of the asset. As circumstances change and new information becomes available, these estimates could change.
Depreciation is computed using the straight-line method. When assets are retired or otherwise disposed of, the cost and related accumulated depreciation are removed from the balance sheet, and any resulting gain or loss is reflected in the results of operations for the period.
Impairment of Long-Lived Assets
Long-lived assets are reviewed for impairment when triggering events occur suggesting deterioration in the assets’ recoverability or fair value. Recognition of an impairment charge is required if future expected undiscounted net cash flows are insufficient to recover the carrying value of the assets, and the fair value of the assets is below the carrying value of the assets. Management’s forecast of future cash flows used to perform impairment analysis includes estimates of future revenues and expenses based on the Company’s anticipated future results, while considering anticipated future oil and natural gas prices which is fundamental in assessing demand for the Company’s services. If the carrying amounts of the assets exceed the estimated expected undiscounted future cash flows, the Company measures the amount of possible impairment by comparing the carrying amount of the assets to the fair value. No impairment charges were recognized for the years ended December 31, 2019, 2018 and 2017.
F-8
Leases
The Company leases certain vehicles, seismic recording equipment, real property and office equipment under lease agreements. The Company evaluates each lease to determine its appropriate classification as an operating lease or finance lease for financial reporting purposes. The Company is the lessee in a lease contract when we obtain the right to control the asset. The majority of our operating leases are non-cancelable operating leases for office, shop and warehouse space in Midland, Plano, Denison, Houston, Denver, Oklahoma City and Calgary, Alberta.
The assets and liabilities under finance leases are recorded at the lower of the present value of the minimum lease payments or the fair market value of the related assets. Assets under finance leases are amortized using the straight-line method over the initial lease term. Amortization of assets under finance leases is included in depreciation expense.
In February 2016, the FASB issued ASU No. 2016-02, Leases (Topic 842) requiring organizations that lease assets to recognize on the balance sheet the assets and liabilities for the rights and obligations created by those leases. Topic 842 also requires qualitative and quantitative disclosures to help investors and other financial statement users better understand the amount, timing and uncertainty of cash flows arising from leases.
On January 1, 2019, the Company adopted Topic 842 using the optional cumulative-effect transition method of adoption, under which the new standards were applied prospectively rather than restating the prior periods presented. As a result, certain accounts lack a comparable value for the same period of 2018 and 2017, specifically accounts and values associated with operating leases and ROU assets. As a result of adopting the new standard, the Company recorded ROU assets and operating lease liabilities of approximately $7,769,000 and $8,252,000, respectively, on the consolidated balance sheet for 2019. The ROU assets equaled the operating lease liabilities, excluding the impact of reclassifying prepaid rent and deferred rent of approximately $14,000 and $497,000, respectively. These amounts were previously recorded in prepaid expenses and other current assets and other accrued liabilities, respectively. The new standard did not materially impact the Company’s results of operation or cash flows.
In addition, the Company made an accounting policy election not to recognize leases with an initial term of 12 months or less and not to separate lease and non-lease components. The Company elected the practical expedients package, which among other things, allowed the Company to carry forward the historical lease classification. The Company did not elect the hindsight or land easement practical expedients.
Several of the Company’s leases include options to renew, with renewal terms that can extend from one to 10 years or more. The exercise of lease renewal options is primarily at the Company’s discretion. To measure operating lease recognition, the Company evaluated its lease agreements to determine if they had economic incentives for renewal or options to purchase. The Company deems leasehold improvements as one of the few economic incentives that would entice the Company to renew a lease and all of its leasehold improvements are currently fully amortized.
Where readily determinable, the Company uses the implicit interest rate in determining the present value of future minimum lease payments. In the absence of an implicit rate, the Company uses its incremental borrowing rate based on the information available at the lease commencement date. The Company gives consideration to its outstanding debt, as well as publicly available data for instruments with similar characteristics when calculating its incremental borrowing rates. The Company’s ROU assets are amortized to operating lease cost over the lease terms on a straight-line basis.
Intangibles
The Company has intangible assets consisting primarily of trademarks/tradenames (which are not amortized) resulting from a business combination. The Company tests for impairment on an annual basis during the fourth quarter, and between annual tests if an event occurs or circumstances change that would more likely than not reduce the fair value of the reporting unit below its carrying amount. No impairment charges were recognized for the years ended December 31, 2019, 2018 and 2017.
Revenue Recognition
Services are provided under cancelable service contracts which usually have an original expected duration of one year or less. These contracts are either “turnkey” or “term” agreements. Under both types of agreements, the Company recognizes revenues as the services are performed. Revenue is generally recognized based on square miles of data recorded
F-9
compared to total square miles anticipated to be recorded on the survey using the total estimated revenue for the service contract. In the case of a cancelled service contract, the client is billed and revenue is recognized for any third party charges and square miles of data recorded up to the date of cancellation.
The Company receives reimbursements for certain out-of-pocket expenses under the terms of the service contracts. The amounts billed to clients are included at their gross amount in the total estimated revenue for the service contract.
Clients are billed as permitted by the service contract. Contract assets and contract liabilities are the result of timing differences between revenue recognition, billings and cash collections. If billing occurs prior to the revenue recognition or billing exceeds the revenue recognized, the amount is considered deferred revenue and a contract liability. Conversely, if the revenue recognition exceeds the billing, the excess is considered an unbilled receivable and a contract asset. As services are performed, those deferred revenue amounts are recognized as revenue.
In some instances, third-party permitting, surveying, drilling, helicopter, equipment rental and mobilization costs that directly relate to the contract are utilized to fulfill the contract obligations. These fulfillment costs are capitalized in other current assets and amortized based on the total square miles of data recorded compared to total square miles anticipated to be recorded on the survey using the total estimated fulfillment costs for the service contract.
Estimates for total revenue and total fulfillment cost on any service contract are based on significant qualitative and quantitative judgments. Management considers a variety of factors such as whether various components of the performance obligation will be performed internally or externally, cost of third party services, and facts and circumstances unique to the performance obligation in making these estimates.
In May 2014, the FASB issued new guidance related to revenue recognition in which an entity should recognize revenue when promised goods or services are transferred to customers in an amount that reflects the consideration to which the entity expects to be entitled in exchange for those goods or services. Codified as Topic 606, this new guidance also required disclosures sufficient to enable users to understand the nature, amount, timing and uncertainty of revenue and cash flows arising from contracts with customers.
The Company adopted Topic 606 effective January 1, 2018, using the full retrospective method, which required us to adjust our consolidated financial statements from amounts previously reported for each prior reporting period presented. The Company recognized the cumulative effect of adopting the guidance as an adjustment to its opening balance of retained earnings as of January 1, 2016. The Company elected several ongoing and transitional practical expedients including (i) to ignore the financing component when estimating the transaction price for service contracts completed within one year, (ii) to exclude sales tax collected from the customer when determining the transaction price, (iii) to expense incremental costs to obtain a customer contract if the amortization period for those costs would otherwise be one year or less, (iv) to not restate contracts that begin and end within the same annual reporting period, (v) to use the transaction price at the completion of the contract to retrospectively apply the new guidance, and (vi) to not disclose the remaining performance obligations for the reporting periods presented before the date of initial application. The most significant impact to the Company of the adoption of Topic 606 relates to the deferred recognition of revenues and expenses to fulfill contracts with customers until data recording has begun.
Stock-Based Compensation
The Company measures all stock-based compensation awards, which include stock options, restricted stock, restricted stock units and common stock awards, using the fair value method and recognizes compensation expense, net of actual forfeitures, as operating or general and administrative expense, as appropriate, in the Consolidated Statements of Operations and Comprehensive Loss on a straight-line basis over the vesting period of the related awards.
Foreign Currency Translation
The U.S. Dollar is the reporting currency for all periods presented. The functional currency of the Company’s foreign subsidiaries is generally the local currency. Any transactions denominated in a currency other than the functional currency are remeasured with the resulting unrealized gain or loss recognized in the Consolidated Statements of Operations and Comprehensive Loss as other income (expense). All assets and liabilities in the functional currency are then translated into U.S. Dollars at the exchange rate on the balance sheet date. Income and expenses are translated using the exchange
F-10
rate applicable to each transaction. Equity transactions are translated using historical exchange rates. Adjustments resulting from translation are recorded as a separate component of accumulated other comprehensive income (loss) in the Consolidated Balance Sheets. Realized foreign currency transaction gains (losses) are included in the Consolidated Statements of Operations and Comprehensive Loss as other income (expense).
Income Taxes
The Company accounts for income taxes by recognizing amounts of taxes payable or refundable for the current year, and by using an asset and liability approach in recognizing the amount of deferred tax assets and liabilities for the future tax consequences of events that have been recognized in the Company’s financial statements or tax returns. Management determines deferred taxes by identifying the types and amounts of existing temporary differences, measuring the total deferred tax asset or liability using the applicable tax rate in effect for the year in which those temporary differences are expected to be recovered or settled. The effect of a change in tax rates of deferred tax assets and liabilities is recognized in income in the year of an enacted rate change. The deferred tax asset is reduced by a valuation allowance if, based on available evidence, it is more likely than not that some portion or all of the deferred tax asset will not be realized. Management’s methodology for recording income taxes requires judgment regarding assumptions and the use of estimates, including determining the annual effective tax rate and the valuation of deferred tax assets, which can create variances between actual results and estimates and could have a material impact on the Company’s provision or benefit for income taxes. Due to recent operating losses and valuation allowances, the Company may recognize reduced or no tax benefits on future losses on the Consolidated Statements of Operations and Comprehensive Loss. The Company’s effective tax rates differ from the statutory federal rate of 21% for certain items such as state and local taxes, valuation allowances, non-deductible expenses and discrete items.
Use of Estimates in the Preparation of Financial Statements
Preparation of the accompanying financial statements in conformity with GAAP requires management to make estimates and assumptions that affect the reported amounts of assets and liabilities and disclosure of contingent assets and liabilities at the date of the financial statements and the reported amounts of revenues and expenses during the reporting period. Because of the use of assumptions and estimates inherent in the reporting process, actual results could differ from those estimates.
Reclassifications
Certain reclassifications have been made to the year ended December 31, 2017 consolidated financial statements to conform to the 2019 presentation. These reclassifications had no impact on the consolidated financial statements.
2.Short-Term Investments
The Company had short-term investments at December 31, 2019 and 2018 consisting of certificates of deposit with original maturities greater than three months but less than a year. Certificates of deposits with any given banking institution did not exceed the FDIC insurance limit at December 31, 2019 or 2018.
3. Fair Value of Financial Instruments
At December 31, 2019 and 2018, the Company’s financial instruments included cash and cash equivalents, short-term investments in certificates of deposit, accounts receivable, notes receivable, other current assets, accounts payable, other current liabilities, notes payable and finance leases. At December 31, 2019 the Company’s financial instruments also included restricted cash and operating leases. Due to the short-term maturities of cash and cash equivalents, restricted cash, accounts receivable, other current assets, accounts payable and other current liabilities, the carrying amounts approximate fair value at the respective balance sheet dates. The carrying value of the notes receivable, notes payable, finance leases and operating leases approximate their fair value based on a comparison with the prevailing market interest rates. Due to the short-term maturities of the Company’s investments in certificates of deposit, the carrying amounts approximate fair value at the respective balance sheet dates. The fair values of the Company’s notes receivable, notes payable, finance leases, operating leases and investments in certificates of deposit are level 2 measurements in the fair value hierarchy.
F-11
4. Property and Equipment
Property and equipment (in thousands), together with the related estimated useful lives at December 31, 2019 and 2018, were as follows:
|
|
|
December 31, |
|
|
|
||||
|
|
|
2019 |
|
2018 |
|
Useful Lives |
|||
|
Land, building and other |
|
$ |
16,611 |
|
$ |
15,164 |
|
|
3 to 40 years |
|
Recording equipment |
|
|
163,564 |
|
|
171,514 |
|
|
5 to 10 years |
|
Vibrator energy sources |
|
|
78,626 |
|
|
79,168 |
|
|
5 to 15 years |
|
Vehicles |
|
|
25,845 |
|
|
28,101 |
|
|
1.5 to 10 years |
|
|
|
|
284,647 |
|
|
293,948 |
|
|
|
|
Less accumulated depreciation |
|
|
(231,098) |
|
|
(222,407) |
|
|
|
|
Property and equipment, net |
|
$ |
53,549 |
|
$ |
71,541 |
|
|
|
5. Supplemental Consolidated Financial Statement Information
Other current liabilities (in thousands) consist of the following at December 31, 2019 and 2018:
|
|
|
December 31, |
|
||||
|
|
|
2019 |
|
2018 |
|
||
|
Accrued self-insurance reserves |
|
$ |
2,771 |
|
$ |
2,423 |
|
|
Other accrued expenses and current liabilities |
|
|
828 |
|
|
1,220 |
|
|
Other current liabilities |
|
$ |
3,599 |
|
$ |
3,643 |
|
Disaggregated Revenues
The Company has one line of business, acquiring and processing seismic data in North America. Our chief operating decision maker (President, CEO, and Chairman of the Board) makes operating decisions and assesses performance based on the Company as a whole. Accordingly, the Company is considered to be in a single reportable segment. The following table presents the Company’s operating revenues (unaudited and in thousands) disaggregated by geographic region:
|
|
|
Year Ended December 31, |
|||||||
|
|
|
|
2019 |
|
|
2018 |
|
|
2017 |
|
Operating Revenues |
|
|
|
|
|
|
|
|
|
|
United States |
|
$ |
129,452 |
|
$ |
137,101 |
|
$ |
134,442 |
|
Canada |
|
|
16,321 |
|
|
17,055 |
|
|
22,090 |
|
Total |
|
$ |
145,773 |
|
$ |
154,156 |
|
$ |
156,532 |
Deferred Costs (in thousands)
Deferred costs were $6,994 and $2,991 at January 1, 2019 and 2018, respectively. The Company’s prepaid expenses and other current assets at December 31, 2019 and 2018 included deferred costs incurred to fulfill contracts with customers of $2,525 and $6,994, respectively.
Deferred costs at December 31, 2019 compared to January 1, 2019 decreased primarily as a result of the completion of several projects for clients with significant deferred fulfillment costs at January 1, 2019. Deferred cost at December 31, 2018 compared to January 1, 2018 increased primarily as a result of new projects for clients with significant deferred fulfillment costs at December 31, 2018.
The amount of total deferred costs amortized for the years ended December 31, 2019 and 2018 was $38,468 and $36,615, respectively. There were no material impairment losses incurred during these periods.
F-12
Deferred Revenue (in thousands)
Deferred revenue was $10,501 and $6,314 at January 1, 2019 and 2018, respectively. The Company’s deferred revenue at December 31, 2019 and 2018 was $3,481 and $10,501, respectively.
Deferred revenue at December 31, 2019 compared to January 1, 2019 decreased primarily as a result of completing multiple large projects for clients throughout the year. Deferred revenue at December 31, 2018 compared to January 1, 2018 increased primarily as a result of new projects for clients with large third party reimbursables where data has not yet been recorded.
Revenue recognized for the year ended December 31, 2019 that was included in the contract liability balance at the beginning of 2019 was $10,501. Revenue recognized for the year ended December 31, 2018 that was included in the contract liability balance at the beginning of 2018 was $5,945. Deferred revenue not recognized during either year relates to projects that have not yet started or were cancelled.
6. Debt
On September 30, 2019, the Company entered into a new Loan Agreement with Dominion Bank. The Loan Agreement provides for a Revolving Credit Facility in an amount up to the lesser of (i) $15,000,000 or (ii) a sum equal to (a) 80% of the Company’s eligible accounts receivable plus 100% of the amount on deposit with the Lender in the Company’s collateral account, consisting of a restricted CDARS account of $5,000,000.
Dominion Loan Agreement
Under the Revolving Credit Facility, interest will accrue at an annual rate equal to the lesser of (i) 6.00% and (ii) the greater of (a) the prime rate as published from time to time in The Wall Street Journal or (b) 3.50%. The Company will pay a commitment fee of 0.10% per annum on the difference of (a) $15,000,000 minus the Deposit minus (b) the daily average usage of the Revolving Credit Facility. The Loan Agreement contains customary covenants for credit facilities of this type, including limitations on disposition of assets. The Company is also obligated to meet certain financial covenants under the Loan Agreement, including maintaining a tangible net worth of $75,000,000 and specified ratios with respect to current assets and liabilities and debt to tangible net worth. The Company’s obligations under the Loan Agreement are secured by a security interest in the collateral account (including the Deposit) with the Lender and future accounts receivable and related collateral. As of December 31, 2019, the Company has not borrowed any amounts under the Revolving Credit Facility. The maturity date of the Loan Agreement is September 30, 2020.
The Company does not currently have any notes payable under the Revolving Credit Facility.
Veritex Credit Agreement
On September 30, 2019, the Company’s Veritex Line of Credit under the Veritex Loan Agreement by and between the Company and Veritex matured pursuant to its terms. No amounts were borrowed under the Veritex Line of Credit. In connection with the maturity of the Veritex Line of Credit and entry into the Loan Agreement with Dominion Bank, the Company paid off all amounts owed pursuant to the term loan under the Veritex Loan Agreement of $4,355,665.
Veritex Letters of Credit
As of December 31, 2019, Veritex has issued two letters of credit under the Veritex Loan Agreement. The first letter of credit is in the amount of $1,767,000 to support payment of the Company’s insurance obligations. The second letter of credit is in the amount of $583,000 to support the Company’s workers compensation insurance. Each of the letters of credit are secured by a certificate of deposit with Veritex.
Other Indebtedness
As of December 31, 2019, the Company has two notes payable to a finance company for various insurance premiums totaling $1,746,000.
F-13
In addition, the Company leases certain seismic recording equipment and vehicles under leases classified as finance leases. The Company’s Consolidated Balance Sheets as of December 31, 2019 and 2018 include finance leases of $2,412,000 and $5,125,000, respectively.
Maturities of Debt
The Company’s aggregate principal amount (in thousands) of outstanding notes payable and the interest rates and monthly payments as of December 31, 2019 and 2018 are as follows:
|
|
|
|
|
|
|
||
|
|
|
December 31, 2019 |
|
December 31, 2018 |
|
||
|
Notes payable to commercial banks |
|
|
|
|
|
|
|
|
Aggregate principal amount outstanding |
|
$ |
— |
|
$ |
5,975 |
|
|
Interest rate |
|
|
— |
|
|
5.00% |
|
|
|
|
December 31, 2019 |
|
December 31, 2018 |
|
||
|
Notes payable to finance company for insurance |
|
|
|
|
|
|
|
|
Aggregate principal amount outstanding |
|
$ |
1,746 |
|
$ |
1,680 |
|
|
Interest rate |
|
|
4.05% - 4.99% |
|
|
3.80% |
|
The Company’s aggregate maturities of finance leases (in thousands) at December 31, 2019 are as follows:
|
January 2020 - December 2020 |
|
|
|
|
$ |
2,316 |
|
|
January 2021 - December 2021 |
|
|
|
|
|
53 |
|
|
January 2022 - December 2022 |
|
|
|
|
|
36 |
|
|
January 2023 - December 2023 |
|
|
|
|
|
7 |
|
|
Finance lease obligations |
|
|
|
|
$ |
2,412 |
|
Interest rates on these leases ranged from 4.65% to 5.37%.
7. Leases
The Company leases certain vehicles, seismic recording equipment, real property and office equipment under lease agreements. The Company evaluates each lease to determine its appropriate classification as an operating lease or finance lease for financial reporting purposes. The Company is the lessee in a lease contract when we obtain the right to control the asset. The majority of our operating leases are non-cancelable operating leases for office, shop and warehouse space in Midland, Plano, Denison, Houston, Denver, Oklahoma City and Calgary, Alberta.
On January 1, 2019, the Company adopted Topic 842 using the optional cumulative-effect transition method of adoption, under which the new standards were applied prospectively rather than restating the prior periods presented. As a result, certain accounts lack a comparable value for the same period of 2018 and 2017, specifically accounts and values associated with operating leases and ROU assets.
F-14
The components of lease cost (in thousands) for the years ended December 31, 2019, 2018 and 2017 was as follows:
|
|
|
Year Ended December 31, |
|||||||
|
|
|
2019 |
|
2018 |
|
2017 |
|||
|
Finance lease cost |
|
|
|
|
|
|
|
|
|
|
Amortization of right-of-use assets |
|
$ |
1,424 |
|
$ |
1,429 |
|
$ |
506 |
|
Interest on lease liabilities |
|
|
177 |
|
|
303 |
|
|
123 |
|
Total finance lease cost |
|
|
1,601 |
|
|
1,732 |
|
|
629 |
|
|
|
|
|
|
|
|
|
|
|
|
Operating lease cost |
|
|
1,586 |
|
|
1,607 |
|
|
1,716 |
|
|
|
|
|
|
|
|
|
|
|
|
Short-term lease cost |
|
|
— |
|
|
— |
|
|
— |
|
Total lease cost |
|
$ |
3,187 |
|
$ |
3,339 |
|
$ |
2,345 |
Supplemental cash flow information related to leases (in thousands) for the years ended December 31, 2019, 2018 and 2017 was as follows:
|
|
|
Year Ended December 31, |
|||||||
|
|
|
2019 |
|
2018 |
|
2017 |
|||
|
Cash paid for amounts included in the measurement of lease liabilities |
|
|
|
|
|
|
|
|
|
|
Operating cash flows from operating leases |
|
$ |
(1,505) |
|
$ |
(1,594) |
|
$ |
(1,534) |
|
Operating cash flows from finance leases |
|
$ |
(184) |
|
$ |
(308) |
|
$ |
(108) |
|
Financing cash flows from finance leases |
|
$ |
(2,855) |
|
$ |
(2,699) |
|
$ |
(1,076) |
|
Right-of-use assets obtained in exchange for lease obligations |
|
|
|
|
|
|
|
|
|
|
Operating leases |
|
$ |
8,252 |
|
$ |
— |
|
$ |
— |
|
Finance leases |
|
$ |
121 |
|
$ |
— |
|
$ |
— |
F-15
Supplemental balance sheet information related to leases (in thousands) as of December 31, 2019 and 2018 was as follows:
|
|
|
December 31, |
||||
|
|
|
2019 |
|
2018 |
||
|
Operating leases |
|
|
|
|
|
|
|
Operating lease right-of-use assets |
|
$ |
6,605 |
|
$ |
— |
|
|
|
|
|
|
|
|
|
Operating lease liabilities - current |
|
$ |
1,200 |
|
$ |
— |
|
Operating lease liabilities - long-term |
|
|
5,940 |
|
|
— |
|
Total operating lease liabilities |
|
$ |
7,140 |
|
$ |
— |
|
|
|
|
|
|
|
|
|
Finance leases |
|
|
|
|
|
|
|
Property and equipment, at cost |
|
$ |
8,663 |
|
$ |
8,542 |
|
Accumulated depreciation |
|
|
(3,297) |
|
|
(1,922) |
|
Property and equipment, net |
|
$ |
5,366 |
|
$ |
6,620 |
|
|
|
|
|
|
|
|
|
Finance lease liabilities - current |
|
$ |
2,316 |
|
$ |
2,830 |
|
Finance lease liabilities - long-term |
|
|
96 |
|
|
2,295 |
|
Total finance lease liabilities |
|
$ |
2,412 |
|
$ |
5,125 |
|
|
|
|
|
|
|
|
|
Weighted average remaining lease term |
|
|
|
|
|
|
|
Operating leases |
|
|
6.3 years |
|
|
7.3 years |
|
Finance leases |
|
|
0.8 years |
|
|
1.8 years |
|
|
|
|
|
|
|
|
|
Weighted average discount rate |
|
|
|
|
|
|
|
Operating leases |
|
|
5.04% |
|
|
— |
|
Finance leases |
|
|
4.67% |
|
|
4.65% |
Maturities of lease liabilities (in thousands) at December 31, 2019 are as follows:
|
|
|
Operating Leases |
|
Finance Leases |
||
|
January 2020 - December 2020 |
|
$ |
1,531 |
|
$ |
2,367 |
|
January 2021 - December 2021 |
|
|
1,348 |
|
|
56 |
|
January 2022 - December 2022 |
|
|
1,157 |
|
|
37 |
|
January 2023 - December 2023 |
|
|
1,168 |
|
|
8 |
|
January 2024 - December 2024 |
|
|
1,175 |
|
|
— |
|
Thereafter |
|
|
2,001 |
|
|
— |
|
Total payments under lease agreements |
|
|
8,380 |
|
|
2,468 |
|
|
|
|
|
|
|
|
|
Less imputed interest |
|
|
(1,240) |
|
|
(56) |
|
|
|
|
|
|
|
|
|
Total lease liabilities |
|
$ |
7,140 |
|
$ |
2,412 |
8. Stock-Based Compensation
Since the date of its effectiveness on May 5, 2016, the Company issues new grants of stock-based awards pursuant to the Dawson Geophysical Company 2016 Stock and Performance Incentive Plan (the “2016 Plan”). All of the Company’s prior plans have expired pursuant to their terms and no awards previously granted under prior plans remain outstanding. The awards outstanding and available under the 2016 Plan and their associated accounting treatment are discussed below.
In 2016, the Company adopted the 2016 Plan, which provides for the issuance of up to 1,000,000 shares of authorized Company common stock. As of December 31, 2019, there were approximately 330,861 shares available for future issuance. The 2016 Plan provides for the issuance of stock-based compensation awards, including stock options, common stock, restricted stock, restricted stock units and other forms. Stock option grant prices awarded under the 2016
F-16
Plan may not be less than the fair market value of the common stock subject to such option on the grant date, and the term of stock options shall extend no more than ten years after the grant date. The 2016 Plan terminates May 5, 2026.
Historically, the Company’s employees and officers that held unvested restricted stock were entitled to dividends when the Company paid dividends. The Company’s employees and officers that hold unvested restricted stock awarded during 2016 or thereafter are not entitled to dividends when the Company pays dividends.
Impact of Stock-Based Compensation
The following table summarizes stock-based compensation expense (in thousands), which is included in operating or general and administrative expense, as appropriate, in the Consolidated Statements of Operations and Comprehensive Loss for the years ended December 31, 2019, 2018 and 2017:
|
|
|
Year Ended December 31, |
|
|||||||
|
|
|
2019 |
|
2018 |
|
2017 |
|
|||
|
Restricted stock awards |
|
$ |
893 |
|
$ |
915 |
|
$ |
495 |
|
|
Restricted stock unit awards |
|
|
15 |
|
|
122 |
|
|
161 |
|
|
Common stock awards |
|
|
297 |
|
|
331 |
|
|
320 |
|
|
Total compensation expense |
|
$ |
1,205 |
|
$ |
1,368 |
|
$ |
976 |
|
Stock Options
A summary of the outstanding stock options as of December 31, 2019 as well as activity during the year then ended is as follows:
|
|
|
Number of Stock Options |
|
Weighted Average Exercise Price |
|
Weighted Average Remaining Contractual Term in Years |
|
|||
|
Balance as of December 31, 2018 |
|
|
87,497 |
|
$ |
11.23 |
|
|
|
|
|
Forfeited |
|
|
— |
|
$ |
— |
|
|
|
|
|
Expired |
|
|
(87,497) |
|
$ |
11.23 |
|
|
|
|
|
Balance as of December 31, 2019 |
|
|
— |
|
$ |
— |
|
|
— |
|
|
Exercisable as of December 31, 2019 |
|
|
— |
|
$ |
— |
|
|
— |
|
Stock options issued under prior plans were a combination of incentive stock options and non-qualified stock options. For incentive stock options, no tax deduction is recorded when options are awarded. If an exercise and sale of vested options results in a disqualifying disposition, a tax deduction for the Company occurs.
Outstanding options at December 31, 2018 expired in July 2019. There were no unrecognized compensation costs related to stock options as of December 31, 2019.
There were no options granted or vested and no excess tax benefits from disqualifying dispositions during the years ended December 31, 2019, 2018 and 2017. No options were exercised during the years ended December 31, 2019, 2018 and 2017. No cash was received from option exercises during the years ended December 31, 2019, 2018 and 2017.
Restricted Stock Awards
There were no restricted stock grants in the years ended December 31, 2019, 2018 and 2017. The fair value of restricted stock awards equals the market price of the Company’s stock on the grant date and the awards generally vest in one to three years or in annual increments over three years.
F-17
A summary of the status of the Company’s nonvested restricted stock awards as of December 31, 2019 and activity during the year then ended is as follows:
|
|
|
Number of Restricted Stock Awards |
|
Weighted Average Grant Date Fair Value |
|
||
|
Nonvested as of December 31, 2018 |
|
|
65,974 |
|
$ |
3.65 |
|
|
Vested |
|
|
(65,974) |
|
$ |
3.65 |
|
|
Nonvested as of December 31, 2019 |
|
|
— |
|
$ |
— |
|
As of December 31, 2019, there are no unrecognized compensation costs related to nonvested restricted stock awards.
The aggregate vesting date fair value of restricted stock for the years ended December 31, 2019, 2018 and 2017 was $255,000, $48,000 and $84,000, respectively.
Restricted Stock Unit Awards
The Company did not grant any restricted stock units for the year ended December 31, 2019. The Company granted 268,000 and 238,350 restricted stock unit awards during the years ended December 31, 2018 and 2017, respectively, with a weighted average grant date fair value of $7.14 and $3.96, respectively. The fair value of restricted stock unit awards equals the market price of the Company’s stock on the grant date and the awards generally vest in one to three years or in annual increments over three years.
A summary of the Company’s nonvested restricted stock unit awards as of December 31, 2019 and activity during the year then ended is as follows:
|
|
|
Number of Restricted Stock Unit Awards |
|
Weighted Average Grant Date Fair Value |
|
||
|
Nonvested as of December 31, 2018 |
|
|
627,085 |
|
$ |
5.03 |
|
|
Granted |
|
|
— |
|
$ |
— |
|
|
Vested |
|
|
(197,485) |
|
$ |
3.74 |
|
|
Forfeited |
|
|
(19,500) |
|
$ |
5.41 |
|
|
Nonvested as of December 31, 2019 |
|
|
410,100 |
|
$ |
5.64 |
|
As of December 31, 2019, there were approximately $871,000 of unrecognized compensation costs related to nonvested restricted stock unit awards. These costs are expected to be recognized over a weighted average period of 1.00 years.
The aggregate vesting date fair value of restricted stock units for the years ended December 31, 2019, 2018 and 2017 was $710,000, $273,000 and $422,000, respectively.
Common Stock Awards
The Company granted common stock awards with immediate vesting to outside directors and employees during the years ended December 31, 2019, 2018 and 2017 as follows:
|
|
|
Number of Common Stock Awards |
|
Weighted Average Grant Date Fair Value |
|
||
|
Year ended December 31, 2019 |
|
|
119,556 |
|
$ |
2.48 |
|
|
Year ended December 31, 2018 |
|
|
59,284 |
|
$ |
5.59 |
|
|
Year ended December 31, 2017 |
|
|
67,498 |
|
$ |
4.74 |
|
9. Dividends
The Company did not issue any stock dividends during calendar years 2019 or 2017. The Board of Directors approved a 5% stock dividend (or 0.05 share for each share outstanding) on the outstanding shares of our common stock on May 1, 2018. The stock dividend was paid on May 29, 2018 to shareholders of record on May 14, 2018.
F-18
The Company has not paid cash dividends during calendar years 2019, 2018 and 2017. While there are currently no restrictions prohibiting the Company from paying cash dividends, the Board of Directors, after consideration of economic and market conditions affecting the energy industry in general, and the oilfield services business in particular, determined that the Company would not pay a cash dividend in respect of the Company’s common stock for the foreseeable future. Payment of any type of dividends in the future will be at the discretion of the Company’s board and will depend on our financial condition, results of operations, capital and legal requirements, and other factors deemed relevant by the board.
10. Employee Benefit Plans
The Company provides a 401(k) plan as part of its employee benefits package in order to retain quality personnel. The Company elected to match 100% of the employee contributions up to a maximum of 6% of the participant’s applicable compensation under its 401(k) plan for the years ended December 31, 2019, 2018 and 2017. The Company’s matching contributions under its 401(k) plan for the years ended December 31, 2019, 2018 and 2017 were approximately $1,340,000, $1,505,000 and $1,480,000, respectively.
11. Advertising Costs
Advertising costs are charged to expense as incurred. Advertising costs for the years ended December 31, 2019, 2018 and 2017 totaled $351,000, $498,000 and $371,000, respectively.
12. Income Taxes
The Company’s components of loss before income tax (in thousands) are as follows:
|
|
|
Year Ended December 31, |
|
|||||||
|
|
|
2019 |
|
2018 |
|
2017 |
|
|||
|
Domestic |
|
$ |
(14,097) |
|
$ |
(20,577) |
|
$ |
(32,238) |
|
|
Foreign |
|
|
(1,355) |
|
|
(4,628) |
|
|
(4,866) |
|
|
Loss before income tax |
|
$ |
(15,452) |
|
$ |
(25,205) |
|
$ |
(37,104) |
|
The Company’s components of income tax benefit (in thousands) are as follows:
|
|
|
Year Ended December 31, |
|
|||||||
|
|
|
2019 |
|
2018 |
|
2017 |
|
|||
|
Current federal benefit |
|
$ |
285 |
|
$ |
55 |
|
$ |
40 |
|
|
Current state (expense) benefit |
|
|
(69) |
|
|
(14) |
|
|
3,545 |
|
|
Current foreign benefit |
|
|
— |
|
|
— |
|
|
2,492 |
|
|
Deferred federal expense |
|
|
(251) |
|
|
(274) |
|
|
(51) |
|
|
Deferred state benefit |
|
|
127 |
|
|
344 |
|
|
697 |
|
|
Deferred foreign benefit (expense) |
|
|
147 |
|
|
687 |
|
|
(1,409) |
|
|
Income tax benefit |
|
$ |
239 |
|
$ |
798 |
|
$ |
5,314 |
|
The 2017 Tax Cuts and Jobs Act was enacted on December 22, 2017 resulting in significant changes to the Internal Revenue Code. This reform changed the U.S. Statutory tax rate from 35% to 21% for tax years beginning after December 31, 2017. The Company was required to recognize the effect of the tax law changes in the period of enactment, such as remeasuring the domestic deferred tax assets and liabilities as well as reassessing the net realizability of deferred tax assets and liabilities. Due to the Company’s current loss position and valuation allowances, the tax reform did not have a material impact on its consolidated financial statements.
In December 2017, the SEC staff issued Accounting Bulletin No. 118, Income Tax Accounting Implications of the Tax Cuts and Jobs Act (“SAB 118”), which allows companies to record provisional amounts during a measurement period not to extend beyond one year from the enactment date. The Tax Cuts and Jobs act was enacted in late fourth quarter of 2017 and provisional amounts were recorded. Subsequent guidance was received throughout the year and the accounting of deferred tax remeasurement was completed in accordance with SAB 118. Adjustments did not have a material impact
F-19
on the Company’s consolidated financial statements due to the domestic loss position and the associated valuation allowances on the domestic deferred tax assets.
The income tax provision (in thousands) differs from the amount computed by applying the statutory federal income tax rate to loss before income tax as follows:
|
|
|
Year Ended December 31, |
|
|||||||
|
|
|
2019 |
|
2018 |
|
2017 |
|
|||
|
Tax benefit computed at statutory rate of 21% and 35% (1) |
|
$ |
3,245 |
|
$ |
5,293 |
|
$ |
12,986 |
|
|
Change in valuation allowance |
|
|
(5,744) |
|
|
(5,811) |
|
|
(4,747) |
|
|
State income tax benefit, net of federal tax |
|
|
46 |
|
|
260 |
|
|
2,757 |
|
|
Foreign loss |
|
|
2,827 |
|
|
1,319 |
|
|
1,593 |
|
|
Tax reform impact to deferred tax balances (2) |
|
|
— |
|
|
— |
|
|
(7,590) |
|
|
Other |
|
|
(135) |
|
|
(263) |
|
|
315 |
|
|
Income tax benefit |
|
$ |
239 |
|
$ |
798 |
|
$ |
5,314 |
|
|
(1) |
Statutory rate of 21% for years ended December 31, 2019 and 2018 and 35% for year ended December 31, 2017. |
|
(2) |
Due to the Tax Cuts and Jobs Act enacted on December 22, 2017, the Company’s domestic deferred tax assets and liabilities were remeasured from 35% to 21% as of December 31, 2017. The change in tax rate resulted in a decrease to the gross domestic deferred tax asset which is offset by a corresponding decrease to the valuation allowance. |
The principal components of the Company’s net deferred tax assets (liabilities) (in thousands) are as follows:
|
|
|
December 31, |
|
||||
|
|
|
2019 |
|
2018 |
|
||
|
Deferred tax assets: |
|
|
|
|
|
|
|
|
Federal tax net operating loss ("NOL") carryforward |
|
$ |
25,921 |
|
$ |
24,848 |
|
|
Foreign tax NOL carryforward |
|
|
6,418 |
|
|
5,298 |
|
|
State tax NOL carryforward |
|
|
1,692 |
|
|
2,134 |
|
|
Other comprehensive income |
|
|
379 |
|
|
490 |
|
|
Deferred revenue |
|
|
351 |
|
|
697 |
|
|
Restricted stock and restricted stock unit awards |
|
|
316 |
|
|
320 |
|
|
Foreign deferred taxes |
|
|
242 |
|
|
466 |
|
|
Right-of-use assets |
|
|
193 |
|
|
— |
|
|
Canadian start-up costs |
|
|
122 |
|
|
137 |
|
|
Self-insurance |
|
|
106 |
|
|
111 |
|
|
Workers’ compensation |
|
|
96 |
|
|
60 |
|
|
Alternative Minimum Tax ("AMT") credit carryforward |
|
|
79 |
|
|
315 |
|
|
Other |
|
|
90 |
|
|
92 |
|
|
Gross deferred tax assets |
|
|
36,005 |
|
|
34,968 |
|
|
Less valuation allowances |
|
|
(28,299) |
|
|
(22,806) |
|
|
Net deferred tax assets |
|
|
7,706 |
|
|
12,162 |
|
|
Deferred tax liabilities: |
|
|
|
|
|
|
|
|
Property and equipment |
|
|
(7,649) |
|
|
(12,003) |
|
|
Net deferred tax assets (liabilities) |
|
$ |
57 |
|
$ |
159 |
|
|
Domestic deferred tax assets |
|
$ |
57 |
|
$ |
293 |
|
|
Foreign deferred tax liabilities |
|
|
— |
|
|
(134) |
|
|
Net deferred tax assets (liabilities) |
|
$ |
57 |
|
$ |
159 |
|
At December 31, 2019, the Company had a NOL for U.S. federal income tax purposes of approximately $123,434,000. This NOL will begin to expire in 2027. Losses incurred after the year ended December 31, 2017 have no expiration. The Company will carry forward the tax benefits related to federal NOL of approximately $25,921,000. The
F-20
Company also had state NOL’s that will affect state taxes of approximately $1,692,000 at December 31, 2019. State NOL’s began to expire in 2015. The Company also had a Canadian NOL of $24,683,000 that will begin to expire in 2037.
In evaluating the possible sources of taxable income during 2019, the Company determined it is more likely than not that the remaining deferred tax assets will not be realizable. As a result, the Company recorded full valuation allowance against foreign deferred tax assets and its federal and state deferred tax assets with the exception of its trademark intangible and the remaining AMT credit which will be refundable within the next three years.
At December 31, 2019 and 2018, the Company did not have any uncertain tax positions. The Company’s policy is to recognize interest and penalties related to uncertain tax position in income tax expense.
13. Net Loss per Share
Basic net loss per share is computed by dividing the net loss by the weighted average shares outstanding. Diluted loss per share is computed by dividing the net loss by the weighted average diluted shares outstanding.
The computation of basic and diluted loss per share (in thousands, except share and per share data) is as follows:
|
|
|
Year Ended December 31, |
|
|||||||
|
|
|
2019 |
|
2018 |
|
2017 |
|
|||
|
|
|
|
|
|
|
|
|
|
|
|
|
Net loss |
|
$ |
(15,213) |
|
$ |
(24,407) |
|
$ |
(31,790) |
|
|
Weighted average common shares outstanding |
|
|
|
|
|
|
|
|
|
|
|
Basic |
|
|
23,179,257 |
|
|
22,912,217 |
|
|
22,779,377 |
|
|
Dilutive common stock options, restricted stock unit awards and restricted stock awards |
|
|
— |
|
|
— |
|
|
— |
|
|
Diluted |
|
|
23,179,257 |
|
|
22,912,217 |
|
|
22,779,377 |
|
|
Basic loss per share of common stock |
|
$ |
(0.66) |
|
$ |
(1.07) |
|
$ |
(1.40) |
|
|
Diluted loss per share of common stock |
|
$ |
(0.66) |
|
$ |
(1.07) |
|
$ |
(1.40) |
|
The Company had a net loss in the years ended December 31, 2019, 2018 and 2017. As a result, all stock options, restricted stock unit awards, and restricted stock awards were anti-dilutive and excluded from weighted average shares used in determining the diluted loss per share of common stock for the respective periods.
The following weighted average numbers of stock options, restricted stock unit awards, and restricted stock awards, in each case as adjusted for the 5% stock dividend paid to shareholders on May 29, 2018, have been excluded from the calculation of diluted loss per share of common stock, as their effect would be anti-dilutive for the years ended December 31, 2019, 2018 and 2017:
|
|
|
Year Ended December 31, |
|
|||||||
|
|
|
2019 |
|
2018 |
|
2017 |
|
|||
|
Stock options |
|
|
50,580 |
|
|
240,700 |
|
|
355,264 |
|
|
Restricted stock units |
|
|
456,817 |
|
|
552,458 |
|
|
348,826 |
|
|
Restricted stock awards |
|
|
8,133 |
|
|
67,052 |
|
|
76,960 |
|
|
Total |
|
|
515,530 |
|
|
860,210 |
|
|
781,050 |
|
F-21
14. Major Clients
The Company operates in only one business segment, contract seismic data acquisition and processing services. Sales to these clients, as a percentage of operating revenues that exceeded 10%, were as follows:
|
|
|
Year Ended December 31, |
|||||||
|
|
|
|
2019 |
|
|
2018 |
|
|
2017 |
|
A |
|
|
18% |
|
|
— |
|
|
— |
|
B |
|
|
16% |
|
|
— |
|
|
— |
|
C |
|
|
15% |
|
|
10% |
|
|
— |
|
D |
|
|
11% |
|
|
— |
|
|
— |
|
E |
|
|
— |
|
|
22% |
|
|
17% |
|
F |
|
|
— |
|
|
— |
|
|
10% |
15. Areas of Operation
The U.S. and Canada are the only countries of operation for the Company.
Revenues for the year ended December 31, 2019 were approximately $145,773,000, of which $129,452,000 was earned in the U.S. and $16,321,000 was earned in Canada. Revenues for the year ended December 31, 2018 were approximately $154,156,000, of which $137,101,000 was earned in the U.S. and $17,055,000 was earned in Canada. Revenues for the year ended December 31, 2017 were approximately $156,532,000, of which $134,442,000 was earned in the U.S. and $22,090,000 was earned in Canada.
Net property and equipment as of December 31, 2019 was approximately $53,549,000, of which $45,653,000 was located in the U.S. and $7,896,000 was located in Canada. Net right-of-use assets as of December 31, 2019 were approximately $6,605,000, of which $5,893,000 was located in the U.S. and $712,000 was located in Canada. Net property and equipment as of December 31, 2018 was approximately $71,541,000, of which $62,033,000 was located in the U.S. and $9,508,000 was located in Canada.
16. Commitments and Contingencies
From time to time, the Company is a party to various legal proceedings arising in the ordinary course of business. Although the Company cannot predict the outcomes of any such legal proceedings, management believes that the resolution of pending legal actions will not have a material adverse effect on the Company’s financial condition, results of operations or liquidity, as the Company believes it is adequately indemnified and insured.
We are also party to the following legal proceeding: On April 1, 2019, Weatherford International, LLC and Weatherford U.S., L.P. (collectively, “Weatherford”) filed a petition in state district court for Midland County, Texas, in which the Company and eighteen other parties were named as defendants, alleging the Company and/or the other named defendants contributed to or caused contamination of groundwater at and around property owned by Weatherford. Weatherford is seeking declaratory judgment, recovery and contribution for past and future costs incurred in responding to or correcting the contamination at and around the property from each defendant. The Company disputes Weatherford’s allegations with respect to the Company and intends to vigorously defend itself in this case. Subsequent to the filing of the petition, Weatherford filed for bankruptcy protection on July 1, 2019. While the outcome and impact of this legal proceeding on the Company cannot be predicted with certainty, based on currently available information, management believes that the resolution of this proceeding will not have a material adverse effect on our financial condition, results of operations or liquidity.
Additionally, the Company experiences contractual disputes with its clients from time to time regarding the payment of invoices or other matters. While the Company seeks to minimize these disputes and maintain good relations with its clients, the Company has experienced in the past, and may experience in the future, disputes that could affect its revenues and results of operations in any period.
As of December 31, 2019, Veritex has issued two letters of credit under the Veritex Loan Agreement. The first letter of credit is in the amount of $1,767,000 to support payment of certain insurance obligations of the Company. The
F-22
second letter of credit is in the amount of $583,000 to support the Company’s workers compensation insurance. Each of the letters of credit are secured by a certificate of deposit with Veritex.
17. Recently Issued Accounting Pronouncements
In December 2019, the FASB issued ASU No. 2019-12, Income Taxes (“Topic 740”): Simplifying the Accounting for Income Taxes, which simplifies the accounting for income taxes by eliminating certain exceptions to the general principles in Topic 740 and by clarifying and amending existing guidance to improve consistent application. This ASU is effective for the annual period beginning after December 15, 2020, including interim periods within that annual period. Certain amendments within this ASU are required to be applied on a retrospective basis for all periods presented; others are to be applied using a modified retrospective approach with a cumulative-effect adjustment to retained earnings, if any, as of the beginning of the first reporting period in which the guidance is adopted; and yet others are to be applied using either basis. All other amendments not specified in the ASU should be applied on a prospective basis. Early adoption is permitted. An entity that elects to early adopt in an interim period should reflect any adjustments as of the beginning of the annual period that includes that interim period. Additionally, an entity that elects early adoption must adopt all the amendments in the same period. The Company is currently evaluating the new guidance to determine the impact it will have on its consolidated financial statements.
In June 2016, the FASB issued ASU No. 2016-13, Financial Instruments – Credit Losses (Topic 326): Measurement of Credit Losses on Financial Instruments, which requires entities to measure expected credit losses for certain financial assets using a new, forward-looking current expected credit loss model (“CECL”) that will result in the earlier recognition of allowances for losses. CECL is based on historical experience, adjusted for current conditions and reasonable and supportable forecasts. This ASU is effective for the annual period beginning after December 15, 2019, including interim periods within that annual period using a modified retrospective approach with a cumulative-effect adjustment to retained earnings for additional loss allowances, if any, as of the beginning of the first reporting period in which the guidance is adopted. The Company’s financial instruments within the scope of this guidance primarily includes trade receivables, and the Company does not expect a material impact on its consolidated financial statements.
In June 2018, the FASB issued ASU No. 2018-07, Compensation – Stock Compensation (“Topic 718”): Improvements to Nonemployee Share-Based Payment Accounting, which expands the scope of Topic 718 to include share-based payment transactions for acquiring goods and services from nonemployees except for certain circumstances. Any transition impact will be a cumulative-effect adjustment to retained earnings as of the beginning of the year of adoption. This ASU is effective for the annual period beginning after December 15, 2018, including interim periods within that annual period and early adoption is permitted. The Company adopted this guidance in the first quarter of 2019 and it did not have a material impact on its consolidated financial statements.
In August 2018, the FASB issued ASU No. 2018-13, Fair Value Measurement (Topic 820): Disclosure Framework – Changes to the Disclosure Requirements for Fair Value Measurement, which modifies the disclosure requirements on fair value measurement by removing, modifying, and adding certain disclosures. This ASU is effective for the annual period beginning after December 15, 2019, including interim periods within that annual period. The adoption of this guidance will not have a material impact on the Company’s consolidated financial statements.
In August 2018, the SEC adopted amendments to simplify certain disclosure requirements, as set forth in Securities Act Release No. 33-10532, Disclosure Update and Simplification, which includes a requirement for entities to present the changes in shareholders’ equity in the interim financial statements in quarterly reports on Form 10-Q. This amendment is effective for all filings made on or after November 5, 2018. In light of the timing of effectiveness of the amendment and proximity to the filing date for most filers’ quarterly reports, the SEC allowed for a filer’s first presentation of the changes in shareholders’ equity to be included in its Form 10-Q for the quarter that begins after the effective date. The Company adopted the SEC’s delayed implementation option and began presenting the changes in shareholders’ equity on an interim basis in the first quarter of 2019.
18. Concentrations of Credit Risk
Financial instruments that potentially expose the Company to concentrations of credit risk at any given time may consist of cash and cash equivalents, restricted cash, money market funds and overnight investment accounts, short-term investments in certificates of deposit, trade and other receivables and other current assets. At December 31, 2019 and 2018, the Company had deposits with domestic and international banks in excess of federally insured limits. Management
F-23
believes the credit risk associated with these deposits is minimal. Money market funds seek to preserve the value of the investment, but it is possible to lose money investing in these funds.
The Company’s sales are to clients whose activities relate to oil and natural gas exploration and production. The Company generally extends unsecured credit to these clients; therefore, collection of receivables may be affected by the economy surrounding the oil and natural gas industry or other economic conditions. The Company closely monitors extensions of credit and may negotiate payment terms that mitigate risk.
19. Quarterly Consolidated Financial Data (unaudited and in thousands, except per share data)
|
|
|
Quarter Ended |
|
||||||||||
|
|
|
March 31, |
|
June 30, |
|
September 30, |
|
December 31, |
|
||||
|
Year ended December 31, 2019: |
|
|
|
|
|
|
|
|
|
|
|
|
|
|
Operating revenues |
|
$ |
51,164 |
|
$ |
24,076 |
|
$ |
36,976 |
|
$ |
33,557 |
|
|
(Loss) income from operations |
|
$ |
(317) |
|
$ |
(11,622) |
|
$ |
1,911 |
|
$ |
(6,218) |
|
|
Net (loss) income |
|
$ |
(137) |
|
$ |
(11,246) |
|
$ |
1,998 |
|
$ |
(5,828) |
|
|
Basic (loss) income per share of common stock |
|
$ |
(0.01) |
|
$ |
(0.49) |
|
$ |
0.09 |
|
$ |
(0.25) |
|
|
Diluted (loss) income per share of common stock |
|
$ |
(0.01) |
|
$ |
(0.49) |
|
$ |
0.09 |
|
$ |
(0.25) |
|
|
|
|
|
|
|
|
|
|
|
|
|
|
|
|
|
Year ended December 31, 2018: |
|
|
|
|
|
|
|
|
|
|
|
|
|
|
Operating revenues |
|
$ |
49,880 |
|
$ |
36,158 |
|
$ |
40,448 |
|
$ |
27,670 |
|
|
Loss from operations |
|
$ |
(1,640) |
|
$ |
(6,291) |
|
$ |
(5,234) |
|
$ |
(11,862) |
|
|
Net loss |
|
$ |
(1,709) |
|
$ |
(5,711) |
|
$ |
(5,171) |
|
$ |
(11,816) |
|
|
Basic loss per share of common stock |
|
$ |
(0.07) |
|
$ |
(0.25) |
|
$ |
(0.23) |
|
$ |
(0.51) |
|
|
Diluted loss per share of common stock |
|
$ |
(0.07) |
|
$ |
(0.25) |
|
$ |
(0.23) |
|
$ |
(0.51) |
|
Basic and diluted (loss) income per share of common stock are computed independently for each of the quarters presented. Therefore, the sum of quarterly basic and diluted information may not equal the annual basic and diluted loss per share of common stock.
F-24