Attached files
| file | filename |
|---|---|
| 8-K - FORM 8-K - MERCADOLIBRE INC | d825420d8k.htm |
| EX-99.1 - EX-99.1 - MERCADOLIBRE INC | d825420dex991.htm |
| EX-99.2 - EX-99.2 - MERCADOLIBRE INC | d825420dex992.htm |
 August
2014
Investor Relations
Second Quarter 2014 Results
Exhibit 99.3 |
 This
presentation may make forward-looking statements relating to such matters as continued growth
prospects for the company, industry trends and product and technology initiatives.
These statements are based on currently available information and our current
assumptions, expectations and projections about future events. While we believe that
our assumptions, expectations and projections are reasonable in view of currently
available information, you are cautioned not to place undue reliance on these
forward-looking statements. Our actual results may differ materially from those included in this
presentation, for a variety of reasons, including those described in the forward-looking
statements and risk factor sections of our 10-K and other filings with the
Securities and Exchange Commission, which are available on our investor relations
website. (http://investor.mercadolibre.com) A reconciliation of Non-GAAP measures
to the nearest comparable GAAP measures can be found in our second quarter 2014
earnings press release available on our investor relations website All of the
information included in this presentation is updated as of August 7th, 2014. Except as may be
required by applicable law, we assume no obligation to publicly update or revise our
statements. |
 Q2 2014
Highlights •
Payments outpaced solid Marketplace performance in MELI’s second quarter
•
Total Revenues accelerated to +66% YoY in local currencies (+47%
ex Venezuela), despite
World Cup and Easter headwinds
•
Local currency revenues accelerated in our largest market, Brazil: +34% YoY
•
Total payments volume accelerated both On & Off Platform in the second quarter, growing
82% and 61% YoY in local currencies in the second quarter
Key Trends
Continued progress on
strategic initiatives
•
Total payments reached 44% of gross merchandise volume, with strong on-platform
penetration in Brazil and Argentina.
•
Our shipping solution, MercadoEnvios, shipped over 25% of Brazil’s sold items in
June •
In June, 31% of our new registered users were mobile, and mobile
penetration of our gross
merchandise volume reached 16%
•
Official Stores for large brands gained ground in Argentina, Brazil and Mexico, totaling 226
by end of quarter
•
Closed the acquisition of 2 real estate portals, operating in Chile and Mexico: Portal
Inmobiliario and Guia de Inmuebles
•
Issued $330 million convertible notes due 2019, at a rate of 2.25% per year
In Other News… |
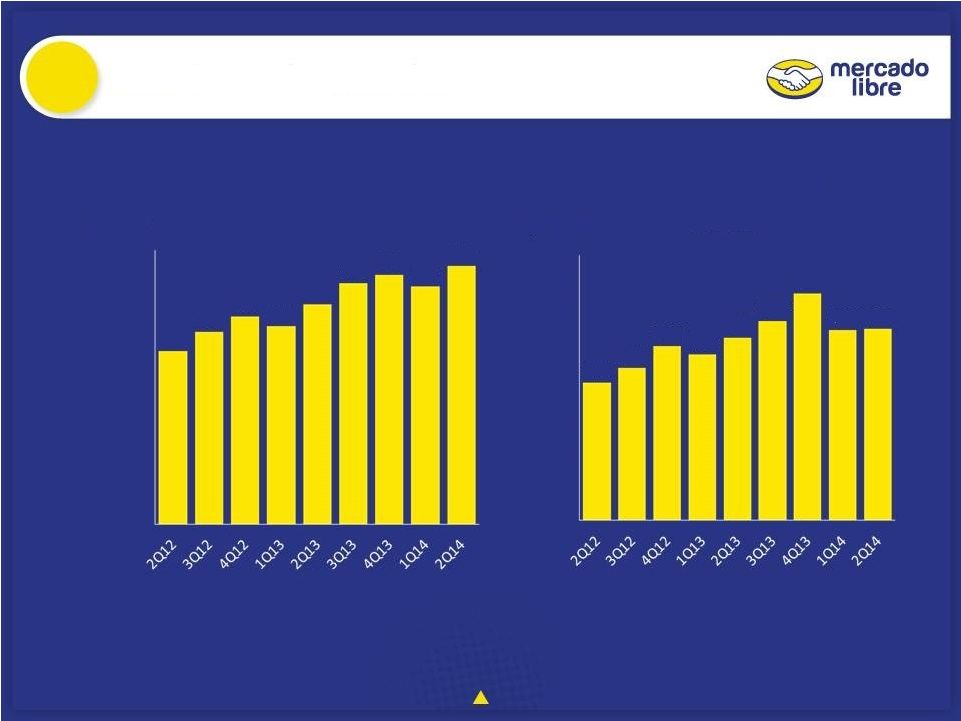 Core Operating
Metrics 20%
18%
36%
22%
19%
20%
27%
25%
20%
YoY
Growth
15%
5%
22%
7%
14%
18%
33%
31%
30%
YoY Reported
USD growth
58%
67%
37%
20%
21%
30%
45%
49%
49%
YoY Constant
USD growth
15.8
17.6
19.0
18.1
20.1
22.0
22.8
21.7
23.6
0
5
10
15
20
25
Millions
Items Sold
1,299
1,436
1,647
1,563
1,725
1,878
2,139
1,797
1,805
0
500
1,000
1,500
2,000
2,500
U$ Millions
Gross Merchandise
Volume |
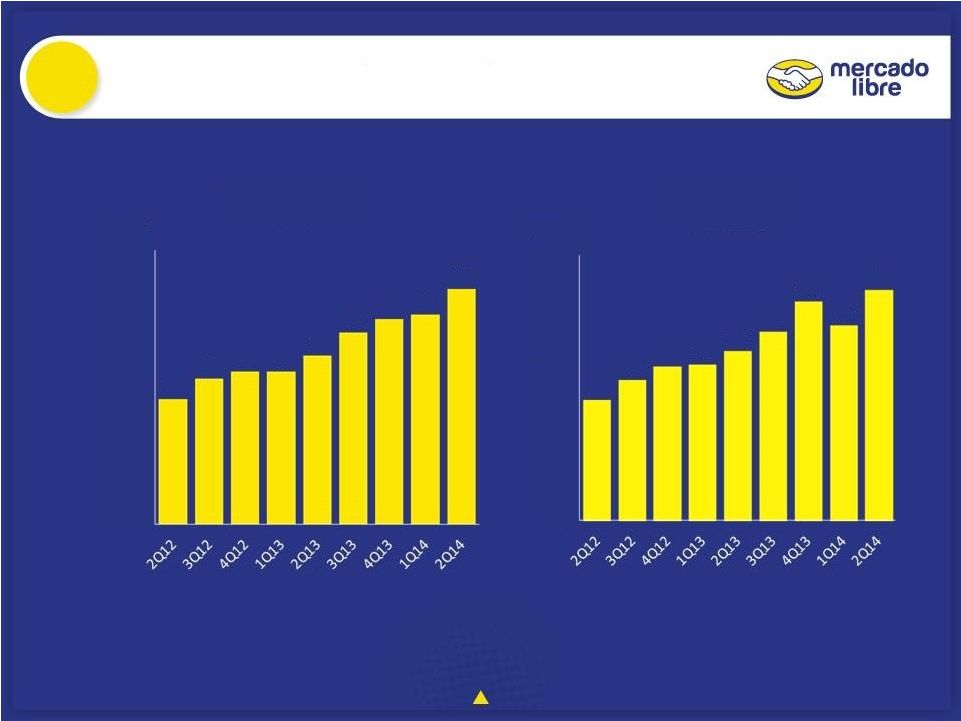 Payments
Operating Metrics 36%
40%
78%
65%
43%
38%
35%
32%
34%
YoY
Growth
25%
36%
39%
30%
30%
44%
40%
34%
42%
YoY Reported
USD growth
64%
77%
64%
55%
47%
62%
54%
55%
66%
YoY Constant
USD growth
5.5
6.4
6.7
6.7
7.4
8.4
9.0
9.2
10.3
0
2
4
6
8
10
12
Millions
Total Payment
Transactions
412
480
525
532
578
642
746
664
785
0
100
200
300
400
500
600
700
800
900
U$ Millions
Total Payment
Volume |
 Net
Revenues 12%
18%
28%
19%
20%
23%
26%
27%
30%
YoY Reported
USD Growth
50%
66%
47%
37%
31%
36%
38%
45%
50%
YoY Constant
USD Growth
88.8
97.3
103.8
102.7
112.2
123.1
134.6
115.4
131.8
0
20
40
60
80
100
120
140
160
2Q12
3Q12
4Q12
1Q13
2Q13
3Q13
4Q13
1Q14
2Q14
U$ Millions
Net Revenues |
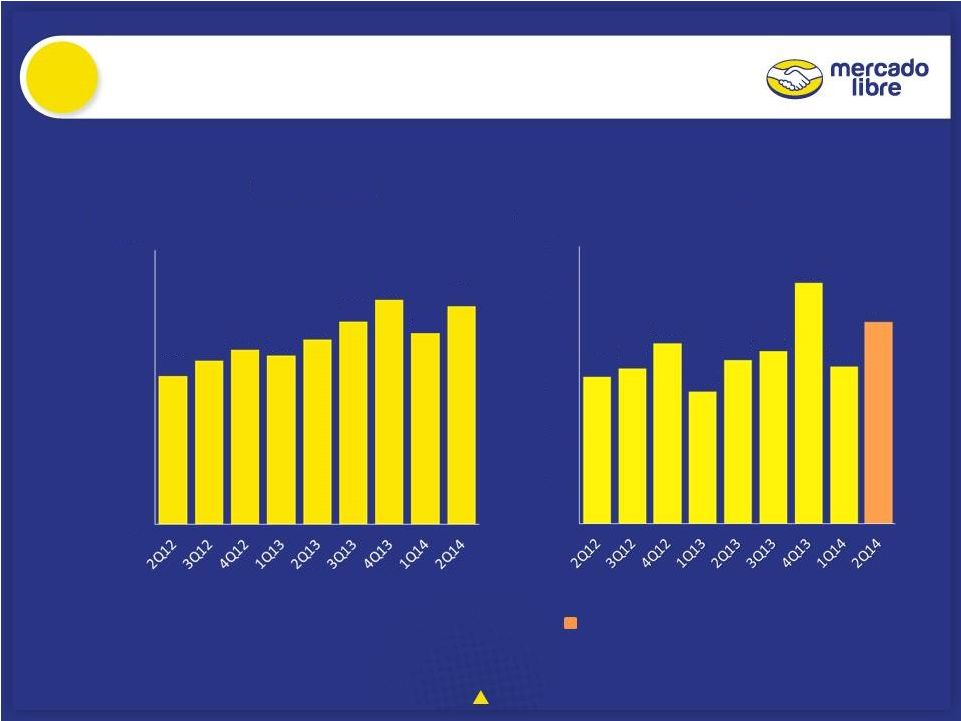 Gross Profit
& EBIT 73%
72%
73%
74%
74%
72%
72%
72%
73%
Gross
Margin
29%
36%
35%
38%
28%
32%
30%
39%
EBIT
Margin
* Adjusted measures, excluding one time effects of Venezuela
devaluation in 2Q14. A reconciliation of these Non-GAAP
measures can be found at the end of this presentation
33%*
65.0
71.6
76.4
74.1
81.1
88.9
98.4
83.8
95.5
0
20
40
60
80
100
120
U$ Millions
Gross Profit
31.9
33.7
39.1
28.6
35.4
37.4
52.1
34.0
43.6*
0
10
20
30
40
50
60
U$ Millions
EBIT |
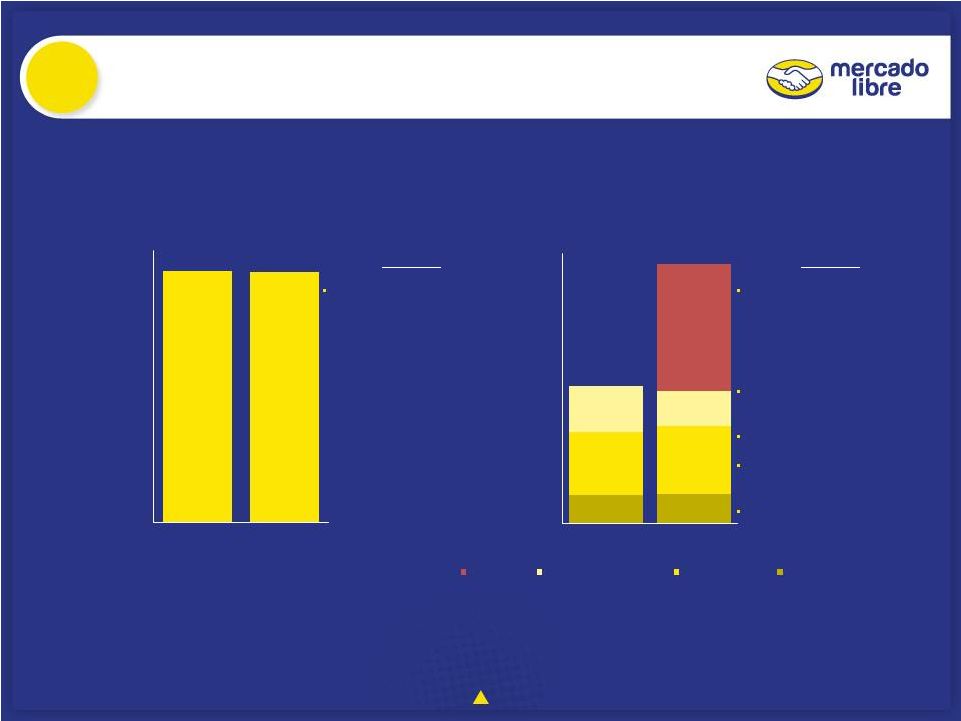 COGS &
OPEX YoY change:
+139 bps of margin
contraction due to growth in
MP, offset by scale in Sales
Taxes, Customer Experience
and Fraud Prevention
YoY change:
$49.5 M one-time Impairment
charge on Venezuela long-
lived assets, following the
adoption of SICAD 2 FX rate in
that country
-279 bps of scale in salaries
-351 bps of scale in offline
marketing (TV campaign last year)
+222 bps as chargebacks grow in
line with payments
Scale in salaries offset by
hardware maintenance
40.7
76.9
27.7
27.6
0
10
20
30
2Q13
2Q14
% of
Revenues
COGS
8.7
8.9
18.6
20.1
13.4
10.4
37.5
0
10
20
30
40
50
60
70
80
2Q13
2Q14
% of
Revenues
OPEX
Impairment
General & Administrative
Sales & Marketing
Product Development |
 Net Income &
EPS 26%
24%*
29%
27%
29%
17%
27%
24%
30%
Net Income
Margin
0.69
0.72*
0.45
0.57
0.59
0.69
0.40
0.67
0.66
EPS
* Adjusted measures, excluding one time effects of Venezuela devaluation in 2Q14. A
reconciliation of these Non-GAAP measures can be found at the end of this
presentation 25.4
26.1
30.2
17.5
30.0
29.1
40.8
30.3
31.8*
0
5
10
15
20
25
30
35
40
45
2Q12
3Q12
4Q12
1Q13
2Q13
3Q13
4Q13
1Q14
2Q14
U$ Millions
Net Income |
 Non -
GAAP Financial Measures
Three-months periods ended (**)
June 30, 2014
June 30, 2013
Operating expenses (OPEX)
(101.4)
(45.7)
Impairment of long-lived assets
49.5
-
Adjusted Operating expenses (OPEX)
(51.9)
(45.7)
Income from operations (EBIT)
$
(5.9)
$
35.4
Impairment of long-lived assets
49.5
-
Adjusted Income from operations
$
43.6
$
35.4
Net Income
$
(25.6)
$
30.0
Devaluation loss in Venezuela
16.5
-
Impairment of long-lived assets
49.5
-
Income tax effect on devaluation loss in Venezuela
(8.6)
-
(1)
Adjusted Net Income
$
31.8
$
30.0
(**) Stated in millions of U.S. dollars
(1) Income tax charge related to the Venezuela devaluation under local tax norms.
|