Attached files
| file | filename |
|---|---|
| EX-99.1 - EX-99.1 - Behringer Harvard Opportunity REIT I, Inc. | a14-24866_1ex99d1.htm |
| 8-K - CURRENT REPORT OF MATERIAL EVENTS OR CORPORATE CHANGES - Behringer Harvard Opportunity REIT I, Inc. | a14-24866_18k.htm |
Exhibit 99.2
|
|
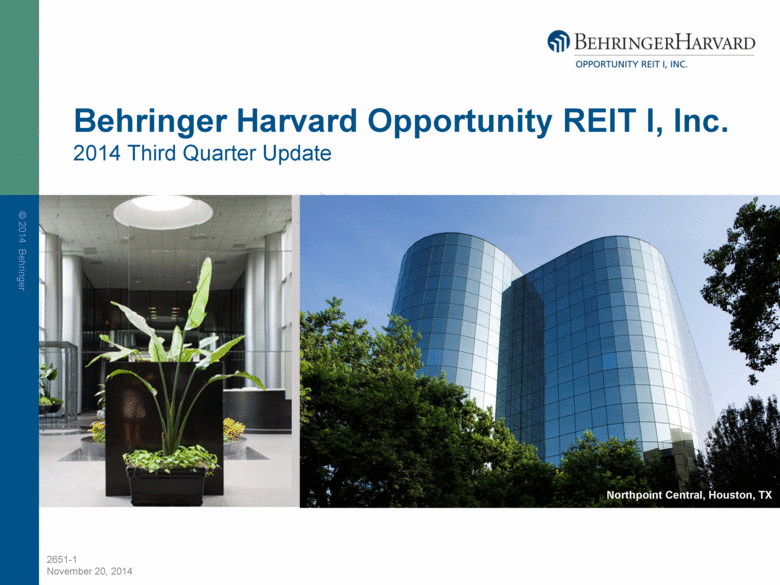
Behringer Harvard Opportunity REIT I, Inc. 2014 Third Quarter Update Northpoint Central, Houston, TX |
|
|
Dial-In and Replay Information To listen to today’s call: Dial: 800-967-7149 Conference ID: 7318509 For a replay of today’s call: Dial: 888-203-1112 Conference ID: 7318509 |
|
|
Forward-Looking Statements This presentation contains forward-looking statements, including discussion and analysis of the financial condition of us and our subsidiaries and other matters. These forward-looking statements are not historical facts but are the intent, belief or current expectations of our management based on their knowledge and understanding of our business and industry. Words such as “may,” “anticipates,” “expects,” “intends,” “plans,” “believes,” “seeks,” “estimates,” “would,” “could,” “should” and variations of these words and similar expressions are intended to identify forward-looking statements. We intend that such forward-looking statements be subject to the safe harbor provisions created by Section 27A of the Securities Act of 1933 and Section 21E of the Securities Exchange Act of 1934. These statements are not guarantees of future performance and are subject to risks, uncertainties and other factors, some of which are beyond our control, are difficult to predict and could cause actual results to differ materially from those expressed or forecasted in the forward-looking statements. Forward-looking statements that were true at the time made may ultimately prove to be incorrect or false. We caution you not to place undue reliance on forward-looking statements, which reflect our management's view only as of the date of this presentation. We undertake no obligation to update or revise forward-looking statements to reflect changed assumptions the occurrence of unanticipated events or changes to future operating results. |
|
|
Forward-Looking Statements Factors that could cause actual results to differ materially from any forward-looking statements made in the presentation include but are not limited to: market and economic challenges experienced by the U.S. and global economies or real estate industry as a whole and the local economic conditions in the markets in which our properties are located; the availability of cash flow from operating activities for capital expenditures; our ability to retain our executive officers and other key personnel of our advisor, our property manager and their affiliates; conflicts of interest arising out of our relationships with our advisor and its affiliates; our level of debt and the terms and limitations imposed on us by our debt agreements; the availability of credit generally, and any failure to refinance or extend our debt as it comes due or a failure to satisfy the conditions and requirements of that debt; the need to invest additional equity in connection with debt financings as a result of reduced asset values and requirements to reduce overall leverage; future increases in interest rates; our ability to raise capital in the future by issuing additional equity or debt securities, selling our assets or otherwise; impairment charges; unfavorable changes in laws or regulations impacting our business or our assets; and factors that could affect our ability to qualify as a real estate investment trust. The forward-looking statements should be read in light of these and other risk factors identified in the “Risk Factors” section of our Annual Report on Form 10-K for the year ended December 31, 2013, as filed with the Securities and Exchange Commission. |
|
|
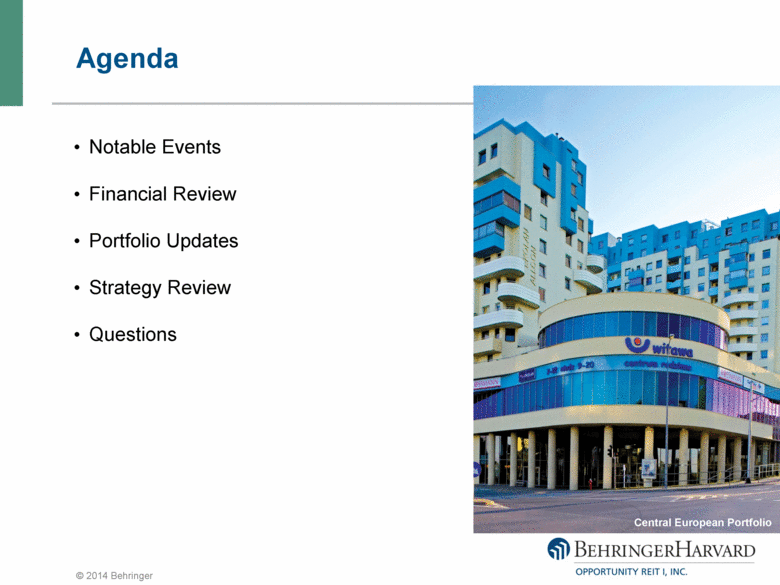
Agenda Notable Events Financial Review Portfolio Updates Strategy Review Questions Central European Portfolio |
|
|
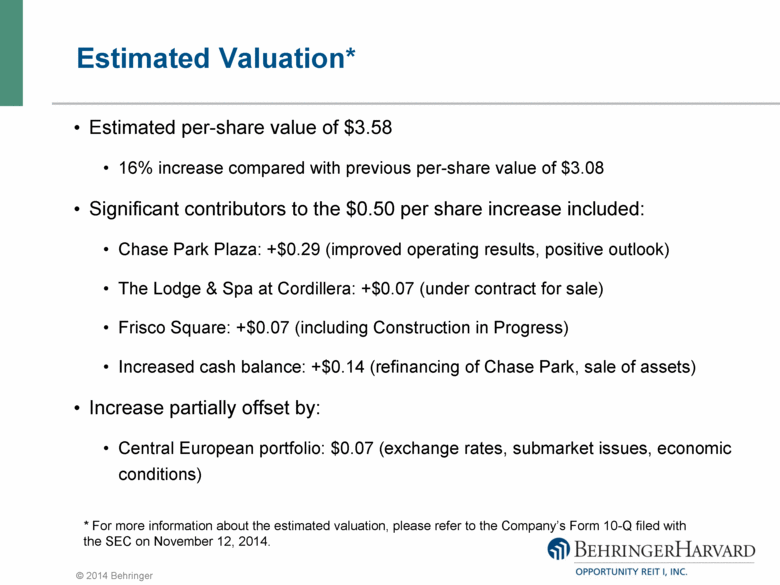
* For more information about the estimated valuation, please refer to the Company’s Form 10-Q filed with the SEC on November 12, 2014. Estimated Valuation* Estimated per-share value of $3.58 16% increase compared with previous per-share value of $3.08 Significant contributors to the $0.50 per share increase included: Chase Park Plaza: +$0.29 (improved operating results, positive outlook) The Lodge & Spa at Cordillera: +$0.07 (under contract for sale) Frisco Square: +$0.07 (including Construction in Progress) Increased cash balance: +$0.14 (refinancing of Chase Park, sale of assets) Increase partially offset by: Central European portfolio: $0.07 (exchange rates, submarket issues, economic conditions) |
|
|
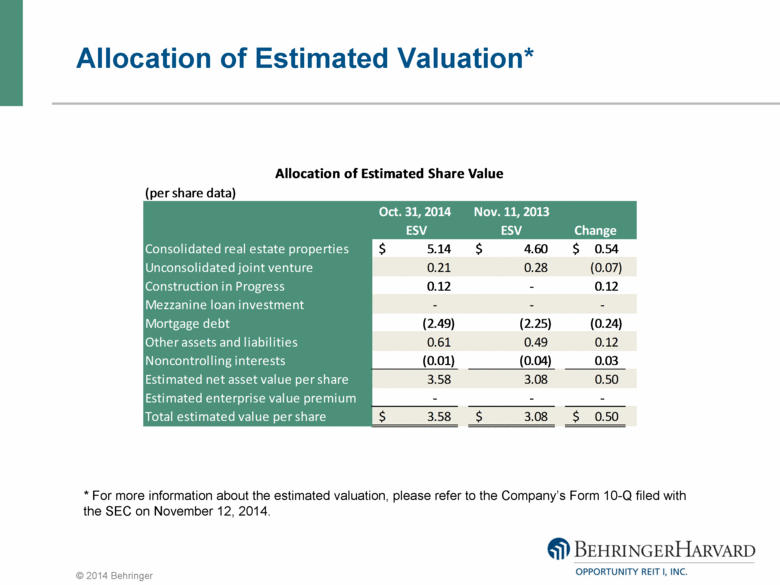
Allocation of Estimated Valuation* * For more information about the estimated valuation, please refer to the Company’s Form 10-Q filed with the SEC on November 12, 2014. (per share data) Oct. 31, 2014 ESV Nov. 11, 2013 ESV Change Consolidated real estate properties 5.14 $ 4.60 $ 0.54 $ Unconsolidated joint venture 0.21 0.28 (0.07) Construction in Progress 0.12 - 0.12 Mezzanine loan investment - - - Mortgage debt (2.49) (2.25) (0.24) Other assets and liabilities 0.61 0.49 0.12 Noncontrolling interests (0.01) (0.04) 0.03 Estimated net asset value per share 3.58 3.08 0.50 Estimated enterprise value premium - - - Total estimated value per share 3.58 $ 3.08 $ 0.50 $ Allocation of Estimated Share Value |
|
|
Valuation Methodology* Engaged Capright Property Advisors and obtained their opinions regarding: The “as is” market value of the Company’s real estate investments The reasonableness of the methodology and valuation conclusions of the Advisor for the Company’s other assets and liabilities Capright’s work was extensive and thorough Reviewed historical performance and business plans related to Company’s investments Reviewed applicable markets to measure conditions, supply and demand factors, and growth factors Reviewed key market assumptions for mortgage liabilities * For more information about the estimated valuation, please refer to the Company’s Form 10-Q filed with the SEC on November 12, 2014. |
|
|
Valuation Methodology* (cont.) Capright’s work was extensive and thorough (cont.) Reviewed the Advisor’s data models supporting the valuation for each investment Reviewed the Advisor’s key assumptions used in the valuation models, including terminal capitalization rates, discount rates, and growth rates Reviewed Advisor’s calculations related to value allocations to non-controlling interests and joint venture interests Reviewed the Advisor’s valuation methodology for other assets and liabilities *For more information about the estimated valuation, please refer to the Company’s Form 10-Q filed with the SEC on November 12, 2014. |
|
|
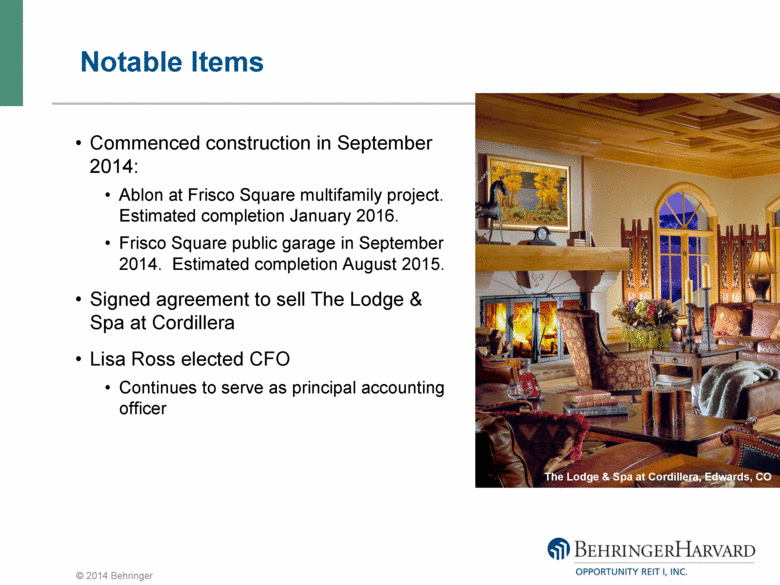
Notable Items The Lodge & Spa at Cordillera, Edwards, CO Commenced construction in September 2014: Ablon at Frisco Square multifamily project. Estimated completion January 2016. Frisco Square public garage in September 2014. Estimated completion August 2015. Signed agreement to sell The Lodge & Spa at Cordillera Lisa Ross elected CFO Continues to serve as principal accounting officer |
|
|
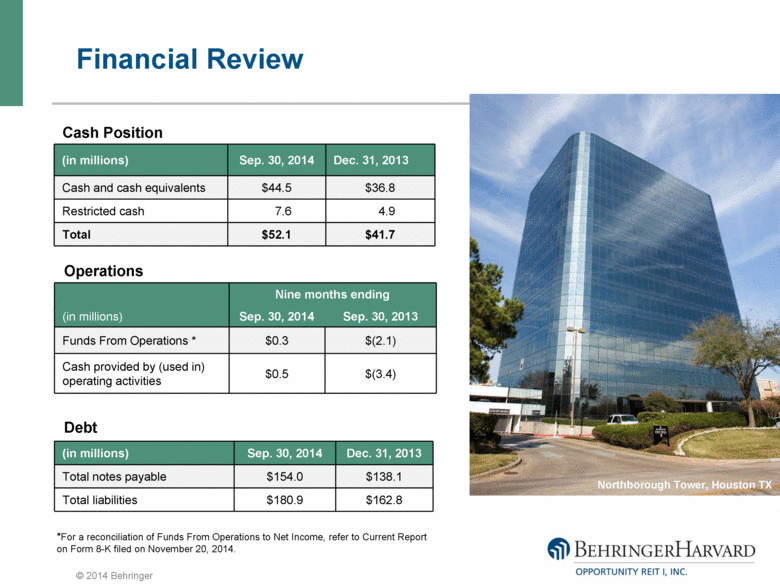
Financial Review (in millions) Sep. 30, 2014 Dec. 31, 2013 Cash and cash equivalents $44.5 $36.8 Restricted cash 7.6 4.9 Total $52.1 $41.7 (in millions) Sep. 30, 2014 Dec. 31, 2013 Total notes payable $154.0 $138.1 Total liabilities $180.9 $162.8 Northborough Tower, Houston TX Nine months ending (in millions) Sep. 30, 2014 Sep. 30, 2013 Funds From Operations * $0.3 $(2.1) Cash provided by (used in) operating activities $0.5 $(3.4) *For a reconciliation of Funds From Operations to Net Income, refer to Current Report on Form 8-K filed on November 20, 2014. Cash Position Operations Debt |
|
|
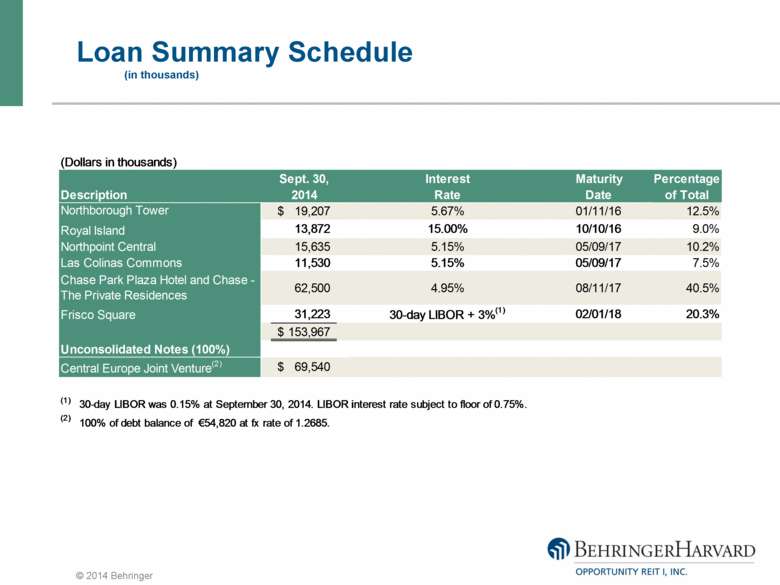
Loan Summary Schedule (in thousands) (Dollars in thousands) Sept. 30, Interest Maturity Percentage Description 2014 Rate Date of Total Northborough Tower 19,207 $ 5.67% 01/11/16 12.5% Royal Island 13,872 15.00% 10/10/16 9.0% Northpoint Central 15,635 5.15% 05/09/17 10.2% Las Colinas Commons 11,530 5.15% 05/09/17 7.5% 62,500 4.95% 08/11/17 40.5% Frisco Square 31,223 30-day LIBOR + 3% (1) 02/01/18 20.3% 153,967 $ Unconsolidated Notes (100%) Central Europe Joint Venture (2) 69,540 $ (1) 30-day LIBOR was 0.15% at September 30, 2014. LIBOR interest rate subject to floor of 0.75%. (2) 100% of debt balance of €54,820 at fx rate of 1.2685. Chase Park Plaza Hotel and Chase - The Private Residences |
|
|
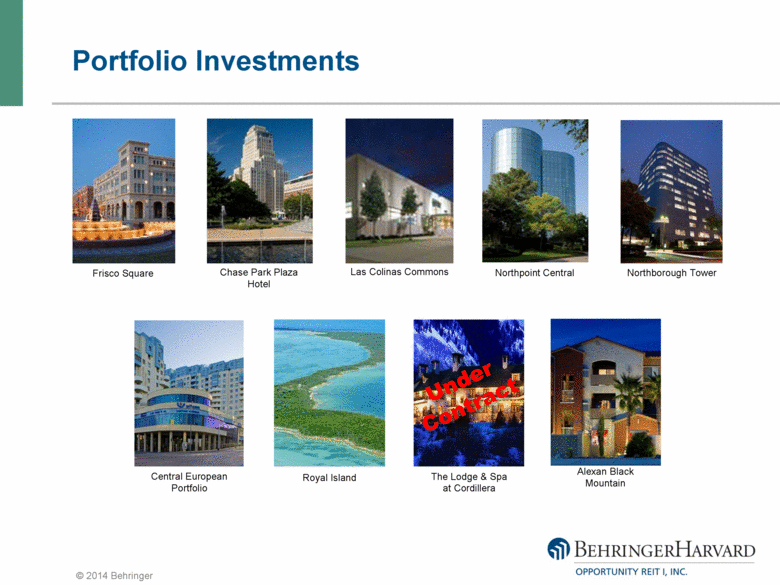
Frisco Square Alexan Black Mountain Las Colinas Commons Northpoint Central Northborough Tower The Lodge & Spa at Cordillera Central European Portfolio Royal Island Chase Park Plaza Hotel Portfolio Investments Under Contract |
|
|
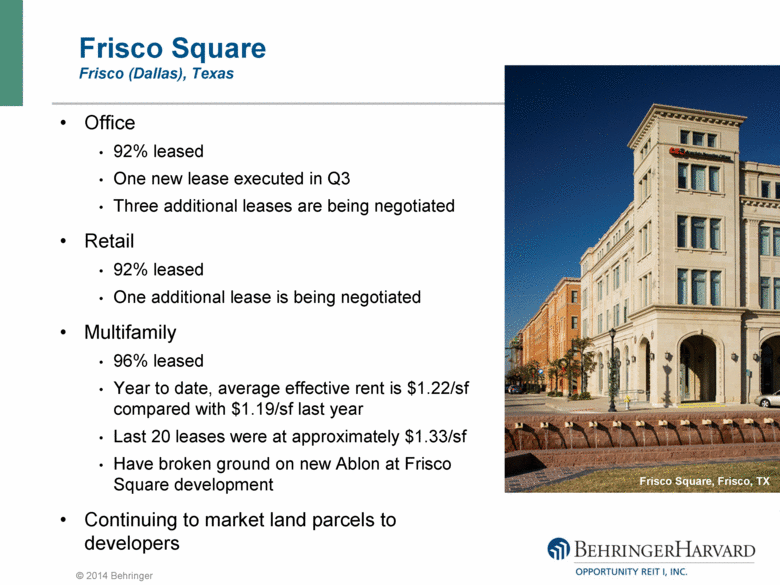
Frisco Square Frisco (Dallas), Texas Office 92% leased One new lease executed in Q3 Three additional leases are being negotiated Retail 92% leased One additional lease is being negotiated Multifamily 96% leased Year to date, average effective rent is $1.22/sf compared with $1.19/sf last year Last 20 leases were at approximately $1.33/sf Have broken ground on new Ablon at Frisco Square development Continuing to market land parcels to developers Frisco Square, Frisco, TX |
|
|
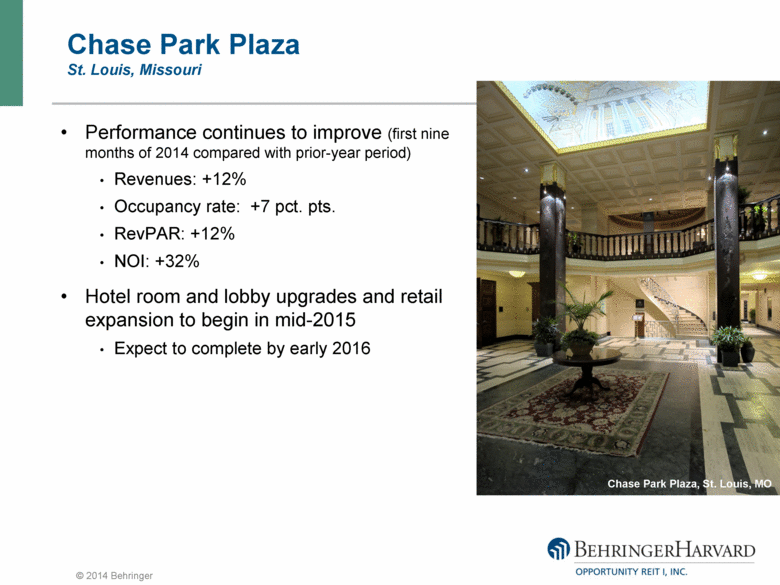
Chase Park Plaza St. Louis, Missouri Performance continues to improve (first nine months of 2014 compared with prior-year period) Revenues: +12% Occupancy rate: +7 pct. pts. RevPAR: +12% NOI: +32% Hotel room and lobby upgrades and retail expansion to begin in mid-2015 Expect to complete by early 2016 Chase Park Plaza, St. Louis, MO |
|
|
Northpoint Central Houston, Texas Performing well 96%-leased Good lease renewal activity Northborough Tower Houston, Texas 100%-leased to single tenant through April 2018 Loan matures in January 2016 Already working on retenanting plan Texas Office Properties Houston/Dallas, Texas Las Colinas Commons Irving (Dallas), Texas 74%-leased Leasing interest from prospective tenants |
|
|
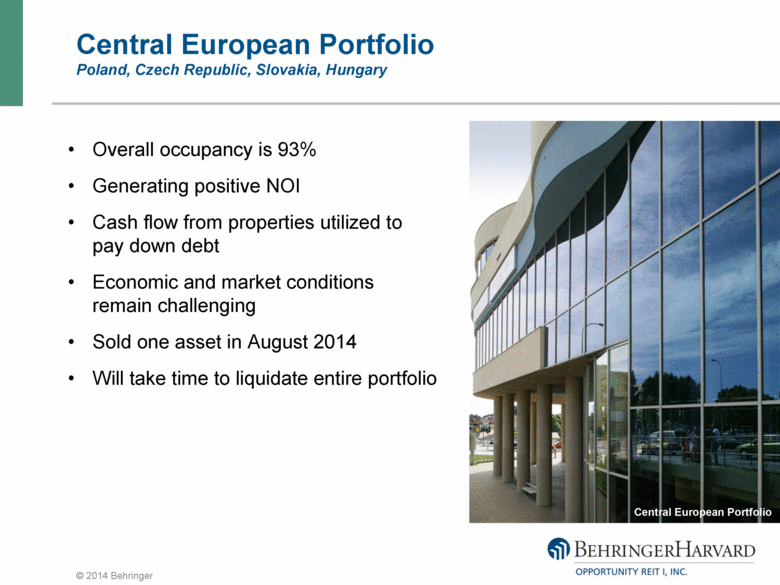
Central European Portfolio Poland, Czech Republic, Slovakia, Hungary Overall occupancy is 93% Generating positive NOI Cash flow from properties utilized to pay down debt Economic and market conditions remain challenging Sold one asset in August 2014 Will take time to liquidate entire portfolio Central European Portfolio |
|
|
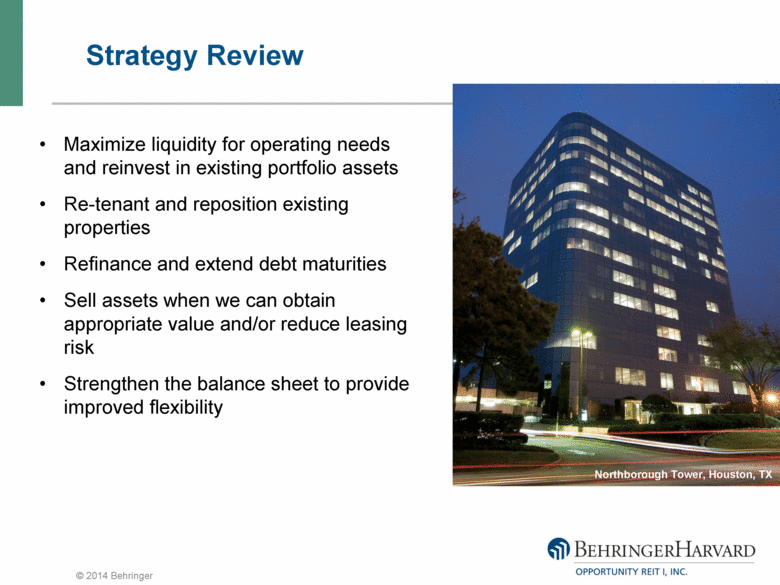
Strategy Review Maximize liquidity for operating needs and reinvest in existing portfolio assets Re-tenant and reposition existing properties Refinance and extend debt maturities Sell assets when we can obtain appropriate value and/or reduce leasing risk Strengthen the balance sheet to provide improved flexibility Northborough Tower, Houston, TX |
|
|
Playback Information Representatives may log on to the password-protected portion of the Behringer website (www.behringersecurities.com) in the Financial Professional’s log-in section for a playback of today’s call Investors may dial toll free (888) 203-1112 and use conference ID 7318509 to access a playback of today’s call Replays will be available until December 19, 2014. |

