Attached files
| file | filename |
|---|---|
| 8-K - 8-K - DYNEX CAPITAL INC | form8-kinvestorpresentatio.htm |

Southwest IDEAS Investor Conference November 19, 2014

Safe Harbor Statement NOTE: This presentation contains certain statements that are not historical facts and that constitute “forward-looking statements” within the meaning of the Private Securities Litigation Reform Act of 1995. Statements in this presentation addressing expectations, assumptions, beliefs, projections, future plans, strategies, and events, developments that we expect or anticipate will occur in the future, and future operating results or financial condition are forward-looking statements. Forward-looking statements in this presentation may include, but are not limited to, statements about projected future investment strategies, investment opportunities, future government or central bank actions and the impact of such actions, financial performance, dividends, leverage ratios, capital raising activities, share issuances and repurchases, the use or impact of NOL carryforwards, and interest rates. The words “will,” “believe,” “expect,” “forecast,” “anticipate,” “intend,” “estimate,” “assume,” “project,” “plan,” “continue,” and similar expressions also identify forward-looking statements. These forward-looking statements reflect our current beliefs, assumptions and expectations based on information currently available to us, and are applicable only as of the date of this presentation. Forward-looking statements are inherently subject to risks, uncertainties, and other factors, some of which cannot be predicted or quantified and any of which could cause the Company’s actual results and timing of certain events to differ materially from those projected in or contemplated by these forward-looking statements. Not all of these risks, uncertainties and other factors are known to us. New risks and uncertainties arise over time, and it is not possible to predict those risks or uncertainties or how they may affect us. The projections, assumptions, expectations or beliefs upon which the forward-looking statements are based can also change as a result of these risks and uncertainties or other factors. If such a risk, uncertainty, or other factor materializes in future periods, our business, financial condition, liquidity and results of operations may differ materially from those expressed or implied in our forward-looking statements. While it is not possible to identify all factors, some of the factors that may cause actual results to differ from historical results or from any results expressed or implied by our forward-looking statements, or that may cause our projections, assumptions, expectations or beliefs to change, include the risks and uncertainties referenced in our Annual Report on Form 10-K for the year ended December 31, 2013 and subsequent filings with the Securities and Exchange Commission, particularly those set forth under the caption “Risk Factors”. 2

Common Stock Preferred Stock NYSE Stock Ticker: DX DXPrA DXPrB Shares Outstanding: (as of 9/30/14) 54,734,817 2,300,000 2,250,000 Q3 Dividends per share: $0.25 $0.53125 $0.4765625 Dividend Yield: (annualized) 11.82% 8.44% 7.86% Share Price: $8.46 $25.18 $24.26 Market Capitalization: $463.06M $57.91M $54.59M Price to Book: (based on 9/30/14 Book Value) .93x - - Market Snapshot (as of 11/17/14 unless otherwise noted) 3

3Q2014 PERFORMANCE 4

• GAAP net income of $0.52 per common share • Core net operating income(1) of $0.25 per common share, for an adjusted return on common equity(1) of 11.0% • Common dividend declared of $0.25 per share, for an annualized 11.9% yield based on $8.39 closing stock price on November 3, 2014 • GAAP net interest spread of 2.03% and adjusted net interest spread(1) of 1.93% • Increase in book value per common share of $0.02 to $9.14 at September 30, 2014 • Decline during the quarter in overall leverage to 5.2x from 5.7x • Modest increase in portfolio CPR for the third quarter of 2014 to 13.2% from 11.1% for the second quarter of 2014 Third Quarter 2014 Highlights (1) Non-GAAP measures. See reconciliations on slides 28 and 29. 5

Key Financial Metrics • Core net operating income per share for the third quarter was $0.25 with a dividend declared of $0.25 per share • Investment portfolio purchases and repositioning on both investments and funding/hedging contributed to wider adjusted net interest spread in the quarter (1) Non-GAAP measures. See reconciliation on slides 28 and 29. • Book value per common share increased $0.02 in the third quarter as spread tightening and curve roll down offset impact of higher rates. Book Value per Common Share Core Net Operating Income per Common Share and Adjusted Net Interest Spread (1) 6

INVESTMENT PORTFOLIO OUTLOOK AND STRATEGY 7

The decline in risk premiums across asset classes, when viewed against the backdrop of macro and market factors, has led to several portfolio adjustments: • $19.4 million in realized gains on Agency Multifamily CMBS between 3Q14 and 4Q14 • Actively managed our hedge position to reduce our interest rate risk exposure • Actively managed our repo relationships and funding portfolio resulting in 7bp decline in effective borrowing costs in 3Q14 • On balance, we have moved up in credit and increased the liquidity of the balance sheet Recent Actions Taken 8

CMBS and CMBS IO Historical Spreads Source: Company data 9

Interest Rate Sensitivity Intermediate curve point shifts are interpolated for non-parallel scenarios 10
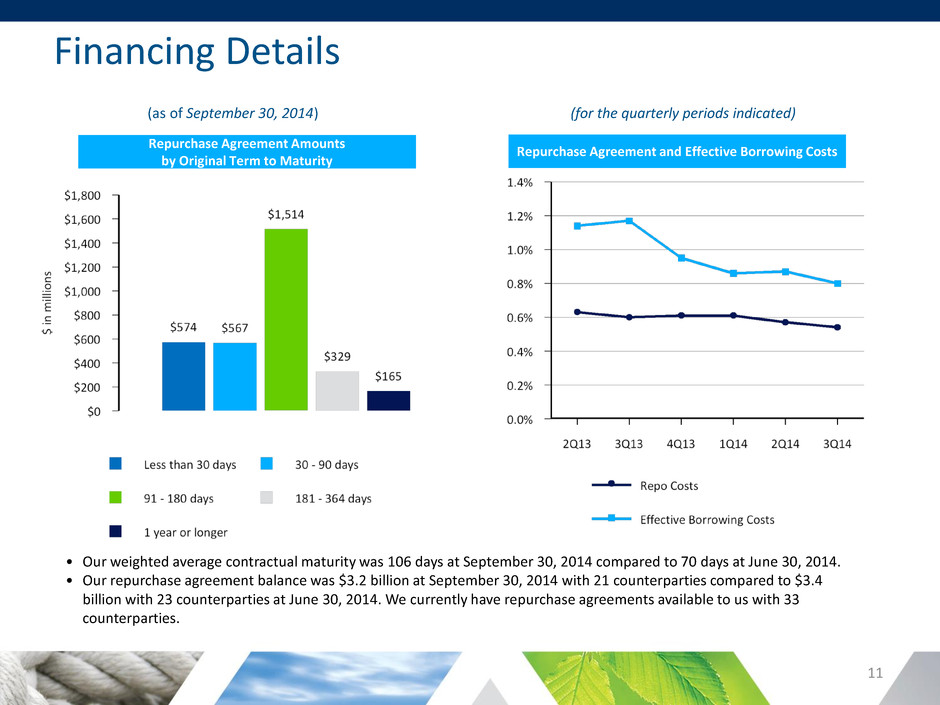
Financing Details (as of September 30, 2014) (for the quarterly periods indicated) • Our weighted average contractual maturity was 106 days at September 30, 2014 compared to 70 days at June 30, 2014. • Our repurchase agreement balance was $3.2 billion at September 30, 2014 with 21 counterparties compared to $3.4 billion with 23 counterparties at June 30, 2014. We currently have repurchase agreements available to us with 33 counterparties. Repurchase Agreement and Effective Borrowing Costs Repurchase Agreement Amounts by Original Term to Maturity 11

Market Fundamentals: Global divergence but the cash is still in the system • US economy moving at a different pace than Europe or Japan. China economic condition is highly uncertain and could have a meaningful impact on global growth. • Fed has ended LSAP, now data dependent but looking to begin removal of unprecedented stimulus in the next 12-18 months. • Risk premiums are still low relative to historical levels as cash seeks to find higher returns – spreads are tighter across many risk assets even after brief correction in October. • Commercial real estate fundamentals are solid, especially in the multifamily sector. Competition in the primary lending markets and looser underwriting standards are a concern. • Single family housing recovery remains fragile; economic upturn more likely to benefit multifamily housing sector. • Funding costs have declined, reflecting balance sheet capacity and scarcity of high quality collateral. • GSE reform remains uncertain and no stand alone credit markets exist to replace GSEs. Market Technicals: Prices have been distorted by global central bank participation in the capital markets and the Fed’s exit is a key factor • Global reach for yield has substantially reduced risk adjusted returns, now compounded by diverging central bank actions. • Residential mortgage production continues to be lower than anticipated, which reinforces tighter spread environment but end of Fed’s LSAP will be a factor. • Conduit CMBS and agency multifamily supply is lower than expected and investor demand continues to be strong. Market Psychology: • Bond market participants continue to have a bearish bias, and the market is still net short today. Investment Environment 12

Going forward, we expect to: • Add investments within our disciplined framework to capital deployment – assessing risk adjusted returns in the context of net interest income and book value volatility; • Maintain leverage levels that respect the current environment and opportunistically reposition asset portfolio and hedges; and • Actively manage repo counterparty relationships and funding portfolio. Implications for Dynex Strategy 13

Portfolio Update (as of September 30, 2014) ($ in millions) $673.0 Agency MBS are considered AAA-rated for purposes of this chart. Portfolio Credit Quality* Net Premium by Asset Type Portfolio Expected Maturity/Reset Distribution* $690.6 $121.0 15.5% 12.0% 23.0% 13.6% 1.3% 34.7% *Excludes loans 14

Equity Capital Allocation Quarterly Comparison ($ in millions) $673.0 As of September 30, 2014 As of June 30, 2014 $56.6 $217.2 $152.4 $105.9 $62.0 $19.9 $228.4 $161.9 $36.8 $32.7 $24.9 $128.2 15
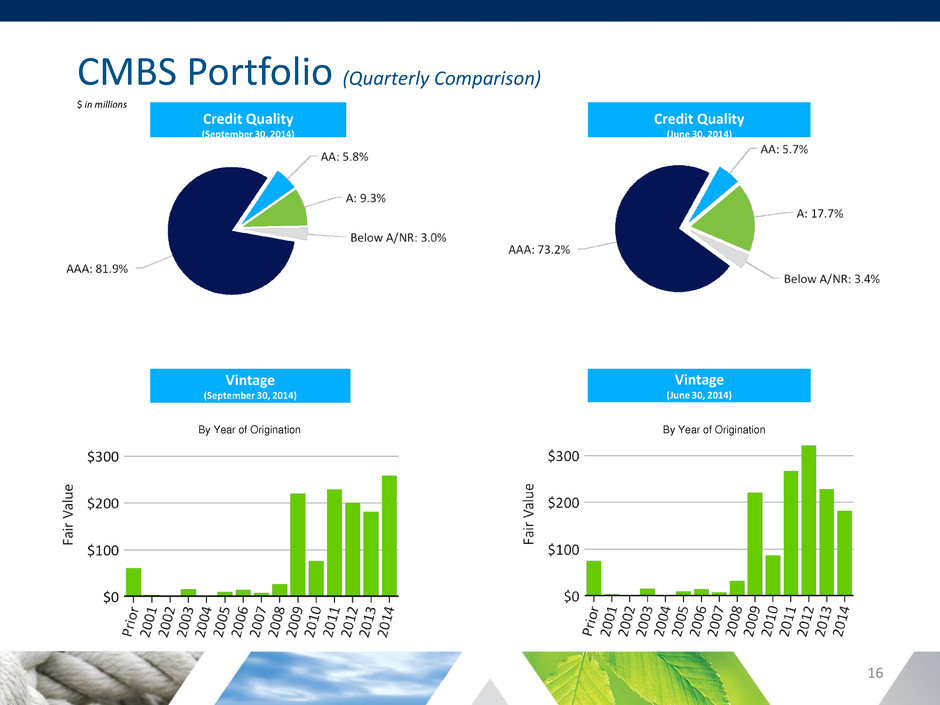
CMBS Portfolio (Quarterly Comparison) Vintage (by year of origination) Asset Type $ in millions Credit Quality (September 30, 2014) Credit Quality (June 30, 2014) Vintage (September 30, 2014) Vintage (June 30, 2014) By Year of Origination By Year of Origination 16

CMBS Portfolio (as of September 30, 2014) Vintage (by year of origination) Asset Type $ in millions Agency MBS are considered AAA-rated for purposes of this chart. Credit Quality Vintage Collateral Asset Type Year of Origination 17

Asset Type ($ in millions) RMBS Portfolio (as of September 30, 2014) Credit Quality Months to Maturity/Reset For ARMs/Hybrids 4% 13% 50% 16% 8% 10% Weighted Average Loan Age 23.7% 11.7% 22.1% 11.3% 31.2% 18

Hedging Details 19

• Long term, we see opportunities for investments in both residential and commercial assets and in markets previously dominated by the Fed/GSEs. • Private capital for the first time will need to replace the government as the dominant purchaser of MBS. • As the US housing system is reformed, there should be more opportunities to invest in residential credit. • The current market environment is complex. Uncertainty around economic growth, regulatory changes, market reaction and global market imbalances requires discipline and vigilance. • Our investment strategy and thesis have not changed – our portfolio continues to generate an above average dividend yield with a conservative profile. • We are committed to delivering solid and stable shareholder returns with manageable risk. Conclusion 20
APPENDIX 21
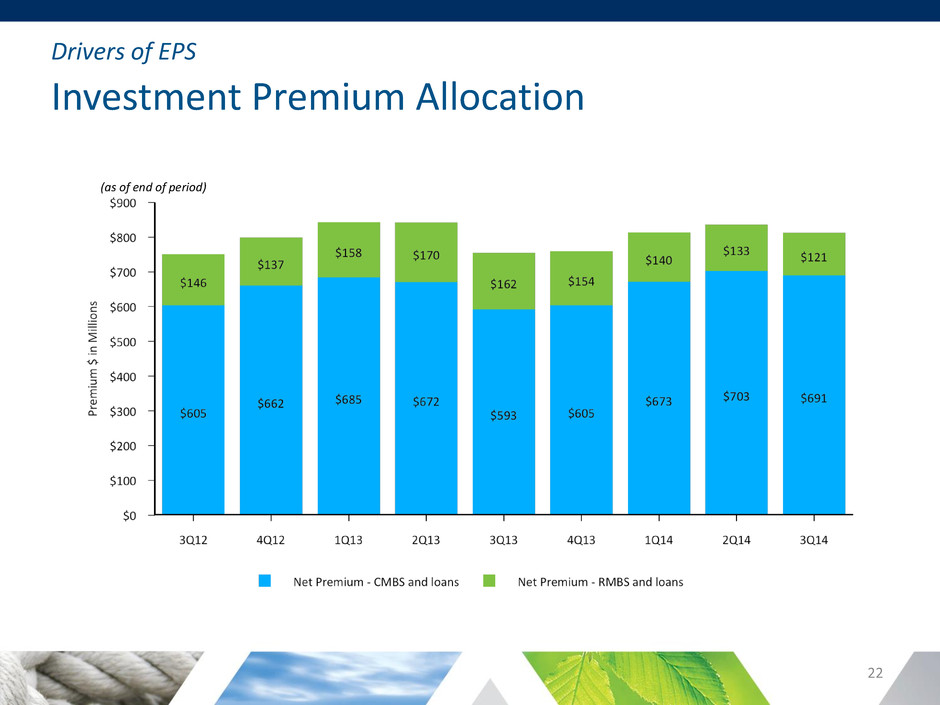
Drivers of EPS Investment Premium Allocation (as of end of period) 22
Drivers of Book Value Spread Risk • An asset’s “spread” is the market premium above a benchmark rate that reflects the relative riskiness of the asset versus the benchmark. • Spread risk is the uncertainty in pricing resulting from the expansion and contraction of the risk premium over the benchmark. • Spreads (and therefore prices) are impacted by the following factors: • Fundamentals: Probability of default, cash flow uncertainty • Technicals: Supply and demand for various assets • Psychology: Reflects the risk appetite of the market and the perceived riskiness of specific assets • Most mortgage REIT business models are inherently exposed to spread risk. At Dynex, we focus on all three aspects of spread risk. However, changes in pricing due to technicals and psychology are difficult to predict. We manage spread risk over the long-term through portfolio construction. 23

Drivers of Book Value Agency RMBS Historical Spreads Source: Company data Basis Points 24
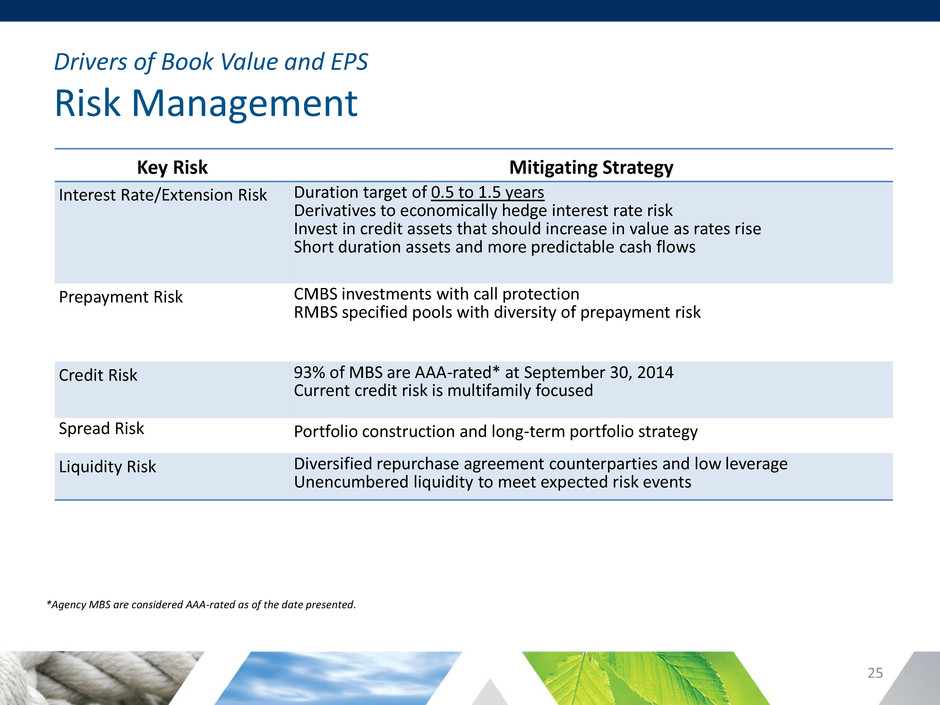
Drivers of Book Value and EPS Risk Management Key Risk Mitigating Strategy Interest Rate/Extension Risk Duration target of 0.5 to 1.5 years Derivatives to economically hedge interest rate risk Invest in credit assets that should increase in value as rates rise Short duration assets and more predictable cash flows Prepayment Risk CMBS investments with call protection RMBS specified pools with diversity of prepayment risk Credit Risk 93% of MBS are AAA-rated* at September 30, 2014 Current credit risk is multifamily focused Spread Risk Portfolio construction and long-term portfolio strategy Liquidity Risk Diversified repurchase agreement counterparties and low leverage Unencumbered liquidity to meet expected risk events *Agency MBS are considered AAA-rated as of the date presented. 25

Accounting Disclosure Selected Financial Highlights (as of and for the quarter ended) (1) Core net operating income to common shareholders (including on a per share basis), adjusted return on average common equity and adjusted net interest spread are non-GAAP financial measures. Reconciliations of these non-GAAP financial measures are provided on slides 28 and 29. (2) Weighted average effective yield is based on the average balance of investments which is calculated using daily amortized cost. ($ in thousands, except per share amounts) 3Q2014 2Q2014 3Q2013 Net interest income $ 19,942 $ 21,146 $ 22,948 Gain (loss) on derivative instruments, net $ 4,842 $ (23,074 ) $ (24,019 ) Gain (loss) on sale of investments, net $ 9,057 $ (477 ) $ (825 ) Net income (loss) to common shareholders $ 28,572 $ (8,293 ) $ (6,921 ) Net income (loss) per common share $ 0.52 $ (0.15 ) $ (0.13 ) Core net operating income to common shareholders (1) $ 13,802 $ 14,106 $ 14,885 Core net operating income per common share (1) $ 0.25 $ 0.26 $ 0.27 Return on average common equity (annualized) 22.7 % (6.7 )% (5.7 )% Adjusted return on average common equity (annualized) (1) 11.0 % 11.3 % 12.3 % Dividends per common share $ 0.25 $ 0.25 $ 0.27 Book value per common share, end of period $ 9.14 $ 9.12 $ 8.59 Average interest earning assets $ 3,820,898 $ 3,944,154 $ 4,371,485 Average interest bearing liabilities $ 3,364,225 $ 3,466,651 $ 3,859,653 Weighted average effective yield (2) 2.73 % 2.79 % 2.82 % Annualized cost of funds 0.70 % 0.75 % 0.88 % Net interest spread 2.03 % 2.04 % 1.94 % Adjusted net interest spread (1) 1.93 % 1.92 % 1.65 % Debt to shareholders' equity ratio, end of period 5.2 x 5.7 x 6.4 x 26

Accounting Disclosure Book Value Reconciliation (1) Core net operating income to common shareholder (including on a per share basis) is a non-GAAP financial measure. A reconciliation of this non-GAAP financial measure is provided on slide 28. Book Value ($ in thousands) Book Value Per Common Share Shareholders' equity at June 30, 2014 $ 612,914 $ 9.12 GAAP net income to common shareholders: Core net operating income (1) 13,802 0.25 Amortization of de-designated cash flow hedges (1,442 ) (0.03 ) Change in fair value of derivative instruments, net 7,113 0.13 Gain on sale of investments, net 9,057 0.17 Fair value adjustments, net 42 — Other comprehensive loss (14,482 ) (0.26 ) Common dividends declared (13,683 ) (0.25 ) Other 726 0.01 Shareholders' equity at September 30, 2014 $ 614,047 $ 9.14 27

($ in thousands except per share data) Quarter Ended 9/30/2014 6/30/2014 3/31/2014 12/31/2013 9/30/2013 Net income (loss) to common shareholders $28,572 ($8,293 ) ($3,028 ) $19,266 ($6,921 ) Adjustments: Amortization of de-designated cash flow hedges (1) 1,442 1,608 2,288 2,609 2,583 Change in fair value on derivatives instruments, net (7,113 ) 20,402 11,211 (5,636 ) 18,548 (Gain) loss on sale of investments, net (9,057 ) 477 3,307 (757 ) 825 Fair value adjustments, net (42 ) (88 ) (32 ) 62 (150 ) Core net operating income to common shareholders $13,802 $14,106 $13,746 $15,544 $14,885 Core net operating income per share $0.25 $0.26 $0.25 $0.29 $0.27 ROAE based on annualized net income (loss) to common shareholders 22.7 % (6.7 )% (2.5 )% 16.1 % (5.7 )% Amortization of de-designated cash flow hedges 1.1 % 1.3 % 1.9 % 2.2 % 2.1 % Change in fair value on derivatives instruments, net (5.6 )% 16.4 % 9.2 % (4.7 )% 15.3 % (Gain) loss on sale of investments, net (7.2 )% 0.4 % 2.7 % (0.6 )% 0.7 % Fair value adjustments, net — % (0.1 )% — % — % (0.1 )% Adjusted ROAE, based on annualized core net operating income 11.0 % 11.3 % 11.3 % 13.0 % 12.3 % Average common equity during the period $503,861 $497,864 $485,044 $477,432 $484,356 (1) Amount recorded as a portion of "interest expense" in accordance with GAAP related to the amortization of the balance remaining in accumulated other comprehensive loss as of June 30, 2013 as a result of the Company's discontinuation of hedge accounting. Accounting Disclosure Reconciliation of GAAP Measures to Non-GAAP Measures 28

Accounting Disclosure Reconciliation of GAAP Measures to Non-GAAP Measures (1) Rates shown are based on annualized interest expense amounts divided by average interest bearing liabilities. Recalculation of annualized cost of funds using total interest expense shown in the table may not be possible because certain expense items use a 360-day year for the calculation while others use actual number of days in the year. (2) Amount recorded as a portion of "interest expense" in accordance with GAAP related to the amortization of the balance remaining in accumulated other comprehensive loss as of June 30, 2013 as a result of the Company's discontinuation of hedge accounting. (3) Amount equals the net interest payments (including accrued amounts) related to interest rate derivatives during the period which are not included in "interest expense" in accordance with GAAP. Quarter Ended 9/30/2014 6/30/2014 3/31/2014 12/31/2013 9/30/2013 GAAP Interest income/ annualized yield $26,000 2.73 % $27,718 2.79 % $27,640 2.74 % $28,594 2.72 % $31,666 2.82 % GAAP Interest expense/ annualized cost of funds (1) 6,058 0.70 % 6,572 0.75 % 7,633 0.87 % 8,408 0.90 % 8,718 0.88 % GAAP net interest income/spread $19,942 2.03 % $21,146 2.04 % $20,007 1.87 % $20,186 1.82 % $22,948 1.94 % GAAP interest expense/ annualized cost of funds (from above) $6,058 0.70 % $6,572 0.75 % $7,633 0.87 % $8,408 0.90 % $8,718 0.88 % Amortization of de-designated cash flow hedges (2) (1,442 ) (0.17 )% (1,608 ) (0.18 )% (2,288 ) (0.26 )% (2,609 ) (0.28 )% (2,583 ) (0.26 )% Net periodic interest costs (3) 2,271 0.27 % 2,672 0.30 % 2,211 0.25 % 3,029 0.33 % 5,471 0.55 % Effective borrowing costs $6,887 0.80 % $7,636 0.87 % $7,556 0.86 % $8,828 0.95 % $11,606 1.17 % Adjusted net interest income/spread $19,113 1.93 % $20,082 1.92 % $20,084 1.88 % $19,766 1.77 % $20,060 1.65 % ($ in thousands) 29
