Attached files
| file | filename |
|---|---|
| 8-K - 8-K - Mead Johnson Nutrition Co | a14-24578_18k.htm |
Exhibit 99.1
|
|
Morgan Stanley Global Consumer & Retail Conference November 18, 2014 Pete Leemputte Executive VP & CFO |

|
|
Safe Harbor Statement Forward-Looking Statements Certain statements in this presentation are forward-looking as defined in the Private Securities Litigation Reform Act of 1995. These forward-looking statements may be identified by the fact they use words such as “should,” “expect,” “anticipate,” “estimate,” “target,” “may,” “project,” “guidance,” “intend,” “plan,” “believe” and other words and terms of similar meaning and expression. Such statements are likely to relate to, among other things, a discussion of goals, plans and projections regarding financial position, results of operations, cash flows, market position, product development, product approvals, sales efforts, expenses, capital expenditures, performance or results of current and anticipated products and the outcome of contingencies such as legal proceedings and financial results. Forward-looking statements can also be identified by the fact that they do not relate strictly to historical or current facts. Such forward-looking statements are based on current expectations that involve inherent risks, uncertainties and assumptions that may cause actual results to differ materially from expectations as of the date of this presentation. These risks include, but are not limited to: (1) the ability to sustain brand strength, particularly the Enfa family of brands; (2) the effect on the company's reputation of real or perceived quality issues; (3) the effect of regulatory restrictions related to the company’s products; (4) the adverse effect of commodity costs; (5) increased competition from branded, private label, store and economy-branded products; (6) the effect of an economic downturn on consumers' purchasing behavior and customers' ability to pay for product; (7) inventory reductions by customers; (8) the adverse effect of changes in foreign currency exchange rates; (9) the effect of changes in economic, political and social conditions in the markets where we operate; (10) changing consumer preferences; (11) the possibility of changes in the Women, Infant and Children (WIC) program, or participation in WIC; (12) legislative, regulatory or judicial action that may adversely affect the company's ability to advertise its products or maintain product margins; and (13) the ability to develop and market new, innovative products. For additional information regarding these and other factors, see the company’s filings with the United States Securities and Exchange Commission (the SEC), including its most recent Annual Report on Form 10-K, which filings are available upon request from the SEC or at www.meadjohnson.com. The company cautions readers not to place undue reliance on any forward-looking statements, which speak only as of the date made. The company undertakes no obligation to publicly update any forward-looking statement, whether as a result of new information, future events or other otherwise. Factors Affecting Comparability—Non-GAAP Financial Measures This presentation contains non-GAAP financial measures, which may include non-GAAP net sales, gross profit, certain components of operating expenses including selling, general and administrative, research and development and other expenses-net, EBIT, earnings and earnings per share information. The items included in GAAP measures, but excluded for the purpose of determining the above listed non-GAAP financial measures, include significant income/expenses not indicative of on-going results, including the related tax effect. The above listed non-GAAP measures represent an indication of the company’s underlying operating results and are intended to enhance an investor’s overall understanding of the company’s financial performance. In addition, this information is among the primary indicators the company uses as a basis for evaluating company performance, setting incentive compensation targets and planning and forecasting of future periods. This information is not intended to be considered in isolation or as a substitute for financial measures prepared in accordance with GAAP. Tables that reconcile non-GAAP to GAAP disclosure are included in the Appendix. For more information: Kathy MacDonald Vice President – Investor Relations Mead Johnson Nutrition Company 847-832-2182 kathy.macdonald@mjn.com November 2014 1 |
|
|
To nourish the world’s children for the best start in life Mead Johnson Heritage and Focus 2 1929 Today Good Nutrition early in life supports lifelong health Empowering Mothers: Most mothers trust infant formula to support their baby’s nutritional well-being Informed Decisions: Mothers want access to factual information and to do what they believe is best for their babies and families Our MISSION Quote penned by Edward “Ted” Mead Johnson, Jr. |

|
|
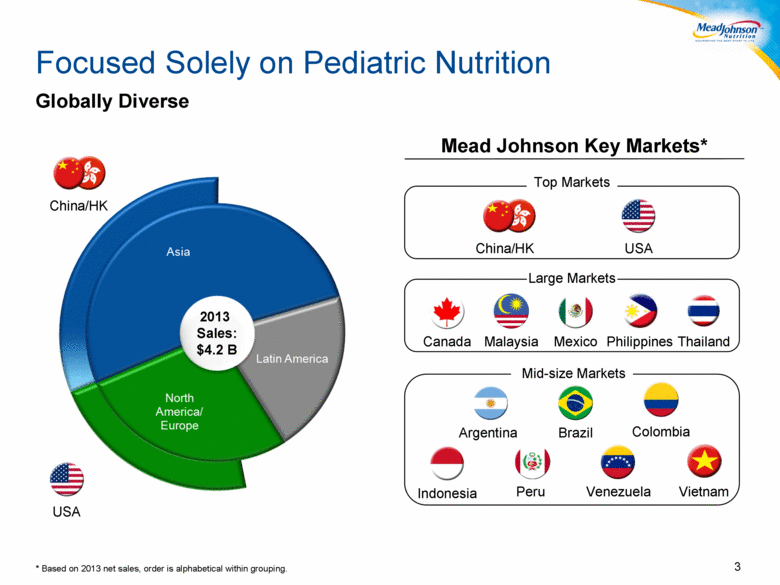
Focused Solely on Pediatric Nutrition Globally Diverse Mead Johnson Key Markets* Our Vision Top Markets Mexico Canada Large Markets Malaysia Philippines Thailand Argentina Mid-size Markets Brazil Indonesia Peru Venezuela Vietnam USA China/HK Colombia * Based on 2013 net sales, order is alphabetical within grouping. 3 2013 Sales: $4.2 B USA China/HK |
|
|
Key External Drivers of Long-Term Growth Trends Impacting Growth Kilograms per Birth Births/1,000 Population 2013 Birth Rate* 2013 IF-GUM Volume Consumption* * Births from CIA World Factbook (2013 estimates as of June 2014) and volume consumption from ERC annual report (June 2014), excludes the Indian subcontinent. IF-GUM is defined as Infant Formula and Growing Up Milks. Economic Growth and Job Creation Increasing Number of Women in Workforce Middle Class and Dual-Income Families Emerge Increasing Spend on Premium Nutrition 4 12 24 34 42 Latin America Asia Western Europe United States 18 13 10 13 Latin America Asia Western Europe United States |

|
|
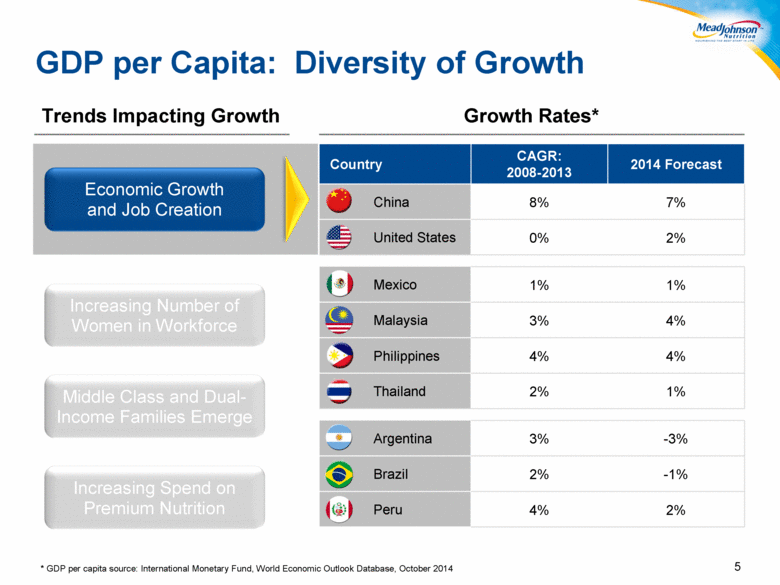
Trends Impacting Growth 5 5 * GDP per capita source: International Monetary Fund, World Economic Outlook Database, October 2014 GDP per Capita: Diversity of Growth Country CAGR: 2008-2013 2014 Forecast China 8% 7% United States 0% 2% Mexico 1% 1% Malaysia 3% 4% Philippines 4% 4% Thailand 2% 1% Argentina 3% -3% Brazil 2% -1% Peru 4% 2% Growth Rates* Economic Growth and Job Creation Increasing Number of Women in Workforce Middle Class and Dual-Income Families Emerge Increasing Spend on Premium Nutrition 5 |
|
|
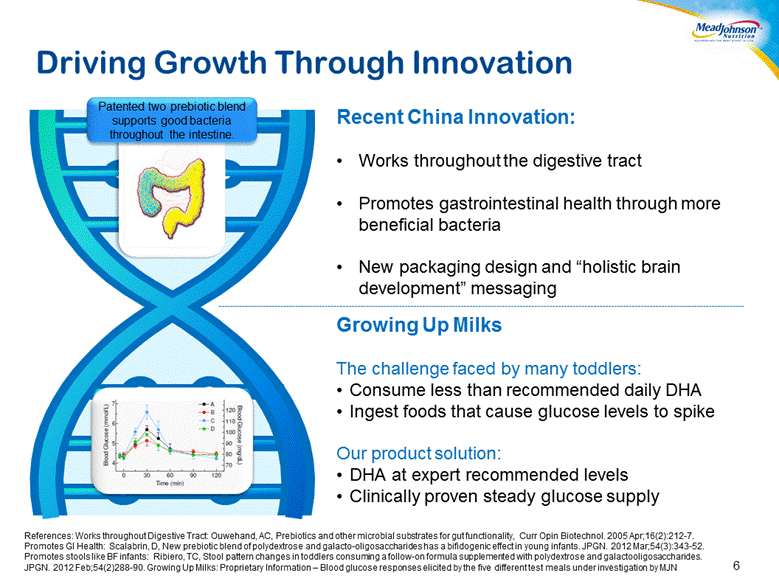
Driving Growth Through Innovation Growing Up Milks The challenge faced by many toddlers: Consume less than recommended daily DHA Ingest foods that cause glucose levels to spike Our product solution: DHA at expert recommended levels Clinically proven steady glucose supply References: Works throughout Digestive Tract: Ouwehand, AC, Prebiotics and other microbial substrates for gut functionality, Curr Opin Biotechnol. 2005 Apr;16(2):212-7. Promotes GI Health: Scalabrin, D, New prebiotic blend of polydextrose and galacto-oligosaccharides has a bifidogenic effect in young infants. JPGN. 2012 Mar;54(3):343-52. Promotes stools like BF infants: Ribiero, TC, Stool pattern changes in toddlers consuming a follow-on formula supplemented with polydextrose and galactooligosaccharides. JPGN. 2012 Feb;54(2)288-90. Growing Up Milks: Proprietary Information – Blood glucose responses elicited by the five different test meals under investigation by MJN Recent China Innovation: Works throughout the digestive tract Promotes gastrointestinal health through more beneficial bacteria New packaging design and “holistic brain development” messaging 6 Formulations Patented two prebiotic blend supports good bacteria throughout the intestine. |
|
|
China Our Top Markets 7 |

|
|
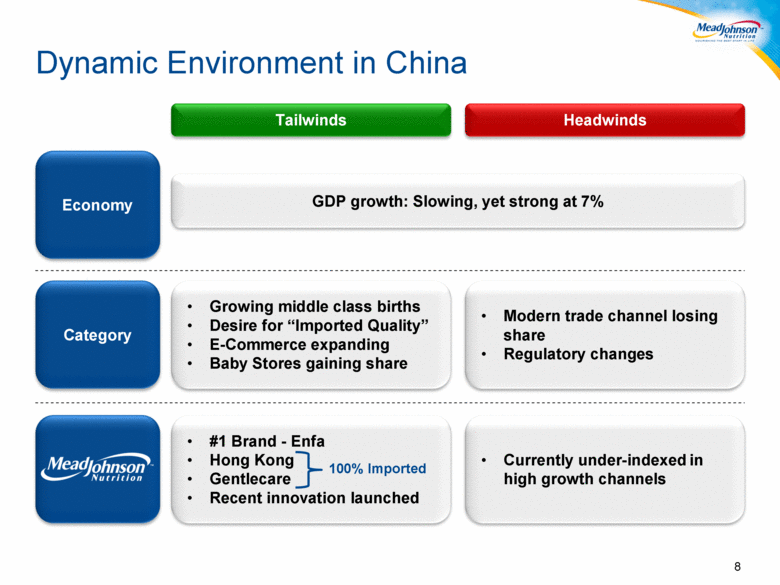
Dynamic Environment in China Economy Category Tailwinds Headwinds GDP growth: Slowing, yet strong at 7% Growing middle class births Desire for “Imported Quality” E-Commerce expanding Baby Stores gaining share #1 Brand - Enfa Hong Kong Gentlecare Recent innovation launched Modern trade channel losing share Regulatory changes Currently under-indexed in high growth channels 100% Imported 8 |
|
|
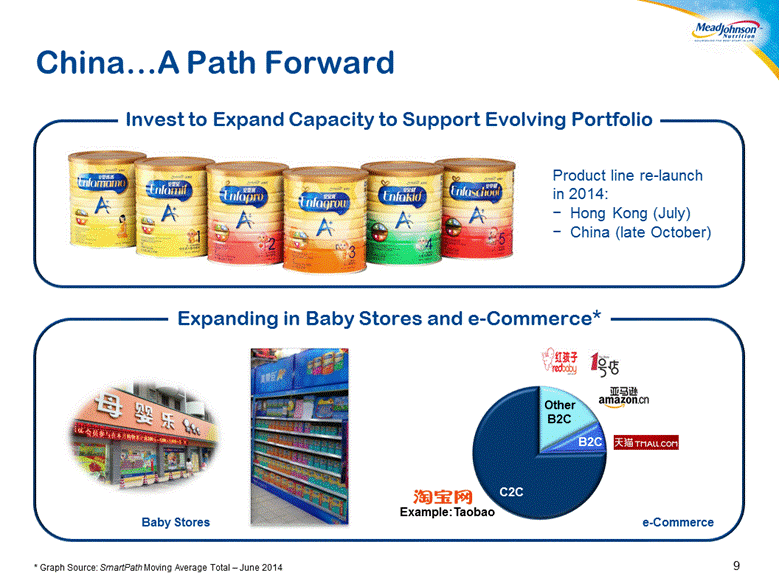
ChinaA Path Forward * Graph Source: SmartPath Moving Average Total – June 2014 9 C2C Other B2C B2C Baby Stores e-Commerce Invest to Expand Capacity to Support Evolving Portfolio Expanding in Baby Stores and e-Commerce* Product line re-launch in 2014: Hong Kong (July) China (late October) Example:Taobao |
|
|
Our Top Markets United States 10 |
|
|
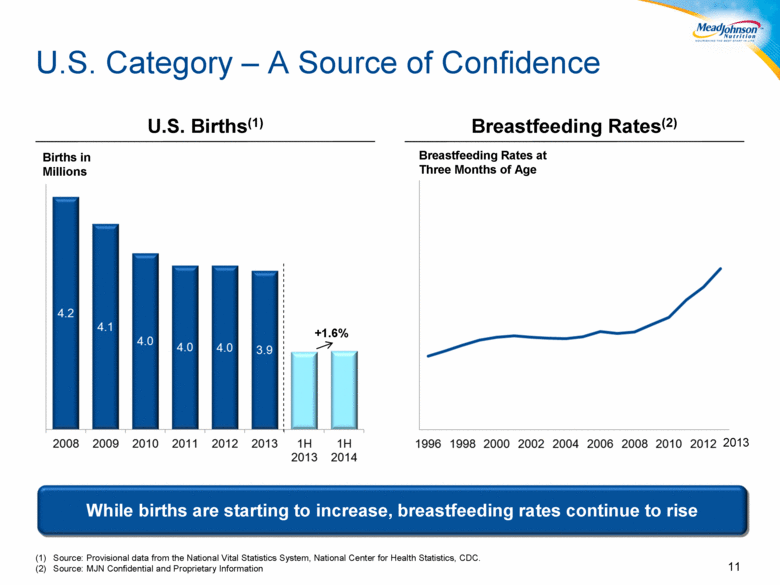
U.S. Category – A Source of Confidence U.S. Births(1) Source: Provisional data from the National Vital Statistics System, National Center for Health Statistics, CDC. Source: MJN Confidential and Proprietary Information Breastfeeding Rates(2) While births are starting to increase, breastfeeding rates continue to rise 2013 +1.6% 11 Births in Millions Breastfeeding Rates at Three Months of Age |
|
|
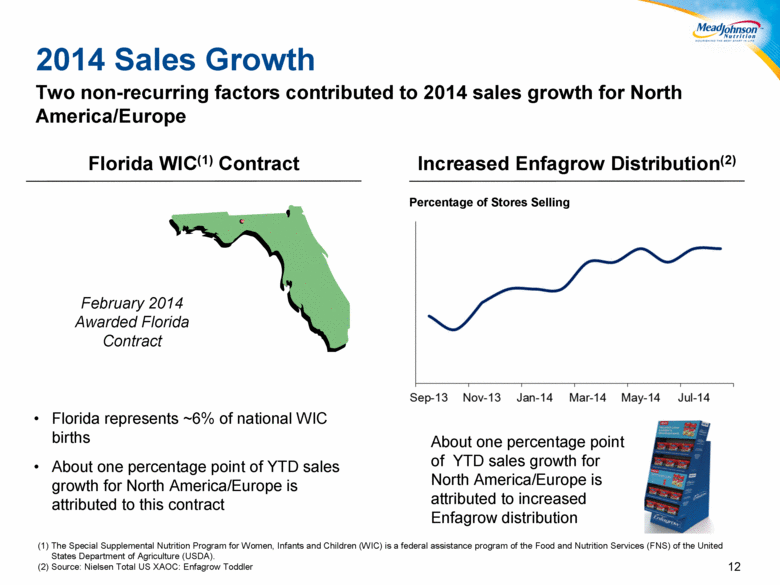
2014 Sales Growth Florida represents ~6% of national WIC births About one percentage point of YTD sales growth for North America/Europe is attributed to this contract Florida WIC(1) Contract February 2014 Awarded Florida Contract Increased Enfagrow Distribution(2) 12 About one percentage point of YTD sales growth for North America/Europe is attributed to increased Enfagrow distribution Percentage of Stores Selling Two non-recurring factors contributed to 2014 sales growth for North America/Europe The Special Supplemental Nutrition Program for Women, Infants and Children (WIC) is a federal assistance program of the Food and Nutrition Services (FNS) of the United States Department of Agriculture (USDA). Source: Nielsen Total US XAOC: Enfagrow Toddler |
|
|
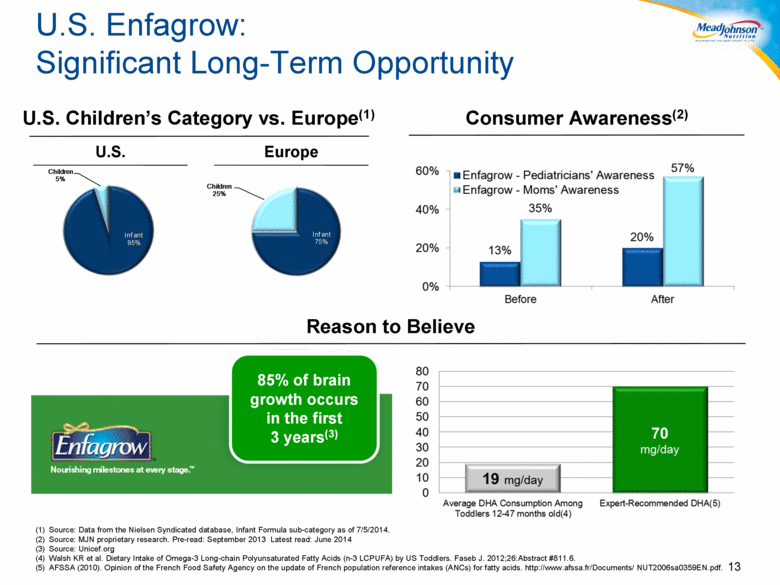
U.S. Enfagrow: Significant Long-Term Opportunity Source: Data from the Nielsen Syndicated database, Infant Formula sub-category as of 7/5/2014. Source: MJN proprietary research. Pre-read: September 2013 Latest read: June 2014 Source: Unicef.org Walsh KR et al. Dietary Intake of Omega-3 Long-chain Polyunsaturated Fatty Acids (n-3 LCPUFA) by US Toddlers. Faseb J. 2012;26:Abstract #811.6. AFSSA (2010). Opinion of the French Food Safety Agency on the update of French population reference intakes (ANCs) for fatty acids. http://www.afssa.fr/Documents/ NUT2006sa0359EN.pdf. Consumer Awareness(2) Reason to Believe U.S. Children’s Category vs. Europe(1) U.S. Europe 13 85% of brain growth occurs in the first 3 years(3) Infant 75% Children 25% Infant 95% Children 5% |
|
|
Financial Highlights |

|
|
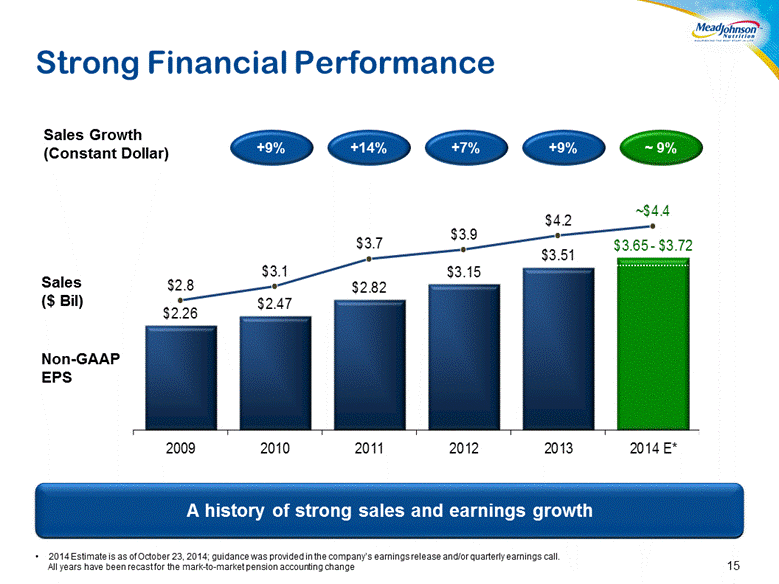
Strong Financial Performance A history of strong sales and earnings growth Sales ($ Bil) Non-GAAP EPS Sales Growth (Constant Dollar) ~ 9% +9% +14% +9% +7% 2014 Estimate is as of October 23, 2014; guidance was provided in the company’s earnings release and/or quarterly earnings call. All years have been recast for the mark-to-market pension accounting change 15 $2.26 $2.47 $2.82 $3.15 $3.51 $3.65 - $3.72 $2.8 $3.1 $3.7 $3.9 $4.2 ~$4.4 2009 2010 2011 2012 2013 2014 E* |
|
|
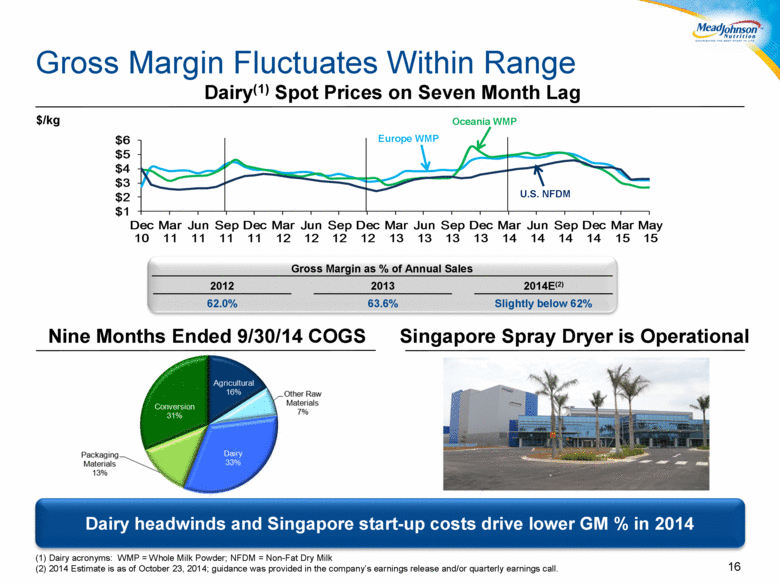
Gross Margin Fluctuates Within Range Nine Months Ended 9/30/14 COGS Dairy headwinds and Singapore start-up costs drive lower GM % in 2014 Singapore Spray Dryer is Operational Gross Margin as % of Annual Sales 62.0% 2012 63.6% 2013 Slightly below 62% 2014E(2) (1) Dairy acronyms: WMP = Whole Milk Powder; NFDM = Non-Fat Dry Milk (2) 2014 Estimate is as of October 23, 2014; guidance was provided in the company’s earnings release and/or quarterly earnings call. 16 Dairy(1) Spot Prices on Seven Month Lag $/kg Oceania WMP Europe WMP U.S. NFDM $1 $2 $3 $4 $5 $6 Dec 10 Mar 11 Jun 11 Sep 11 Dec 11 Mar 12 Jun 12 Sep 12 Dec 12 Mar 13 Jun 13 Sep 13 Dec 13 Mar 14 Jun 14 Sep 14 Dec 14 Mar 15 May 15 |
|
|
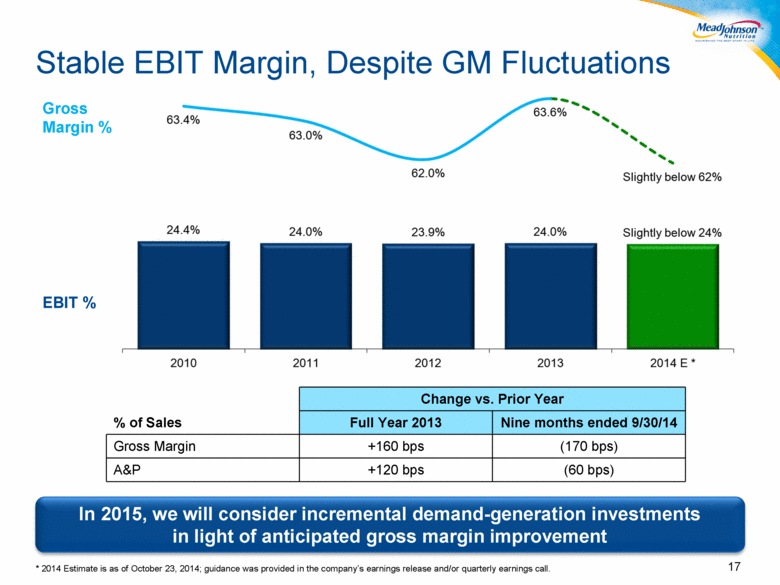
Stable EBIT Margin, Despite GM Fluctuations 17 Gross Margin % EBIT % In 2015, we will consider incremental demand-generation investments in light of anticipated gross margin improvement * 2014 Estimate is as of October 23, 2014; guidance was provided in the company’s earnings release and/or quarterly earnings call. Change vs. Prior Year % of Sales Full Year 2013 Nine months ended 9/30/14 Gross Margin +160 bps (170 bps) A&P +120 bps (60 bps) |
|
|
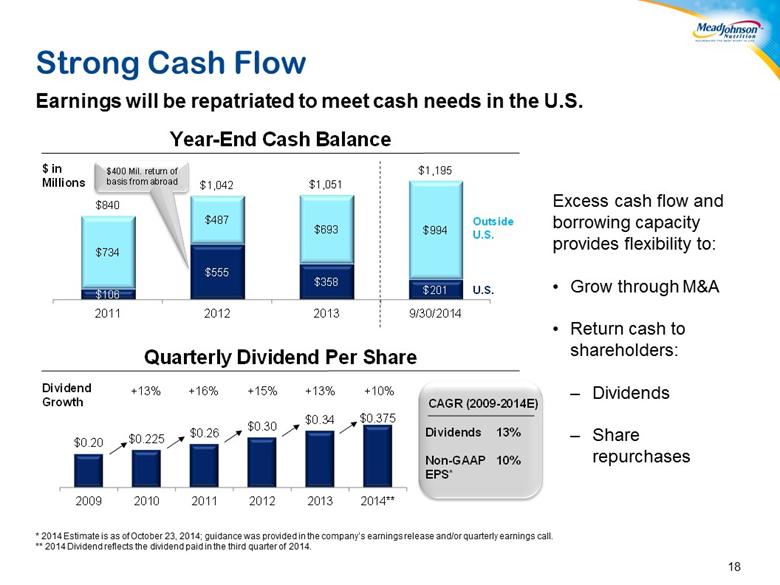
Strong Cash Flow Earnings will be repatriated to meet cash needs in the U.S. 18 Excess cash flow and borrowing capacity provides flexibility to: Grow through M&A Return cash to shareholders: Dividends Share repurchases * 2014 Estimate is as of October 23, 2014; guidance was provided in the company’s earnings release and/or quarterly earnings call. ** 2014 Dividend reflects the dividend paid in the third quarter of 2014. $0.20 $ 0.225 $0.26 $0.30 $0.34 $0.375 2009 2010 2011 2012 2013 2014** $106 $555 $358 $201 $734 $487 $693 $994 $840 $1,042 $1,051 $1,195 2011 2012 2013 9/30/2014 $400 Mil. return of basis from abroad Outside U.S. U.S. Year - End Cash Balance Quarterly Dividend Per Share +13% +16% +15% +13% CAGR (2009 - 2014E) Dividends 13% Non - GAAP 10% EPS* Dividend Growth +10% $ in Millions |
|
|
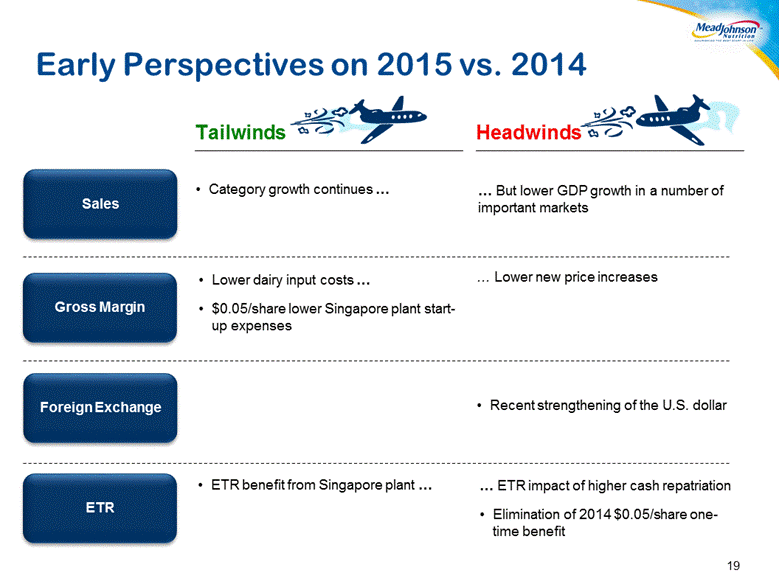
Early Perspectives on 2015 vs. 2014 Headwinds Tailwinds 19 ETR Gross Margin But lower GDP growth in a number of important markets Lower new price increases ETR impact of higher cash repatriation Elimination of 2014 $0.05/share one-time benefit Category growth continues Lower dairy input costs $0.05/share lower Singapore plant start-up expenses ETR benefit from Singapore plant Foreign Exchange Recent strengthening of the U.S. dollar Sales |
|
|
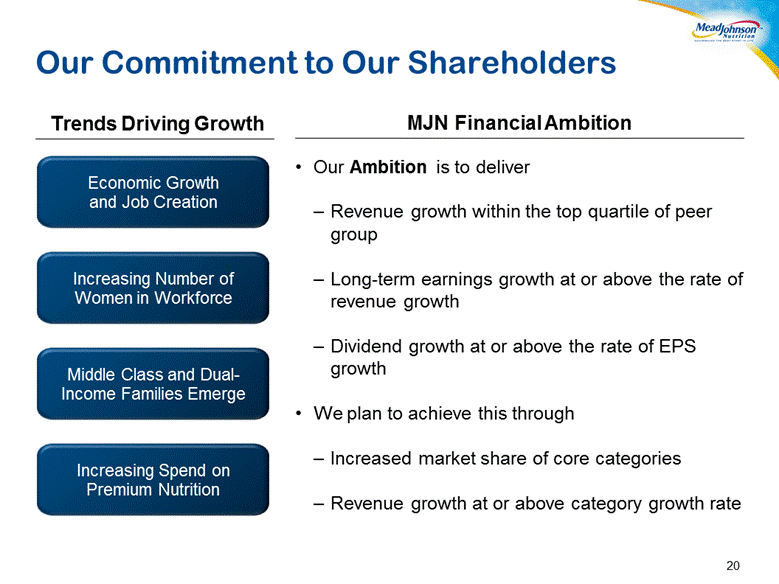
Our Commitment to Our Shareholders MJN Financial Ambition Our Ambition is to deliver Revenue growth within the top quartile of peer group Long-term earnings growth at or above the rate of revenue growth Dividend growth at or above the rate of EPS growth We plan to achieve this through Increased market share of core categories Revenue growth at or above category growth rate Economic Growth and Job Creation Increasing Spend on Premium Nutrition Increasing Number of Women in Workforce Middle Class and Dual-Income Families Emerge Trends Driving Growth 20 |
|
|
Appendix 21 |

|
|
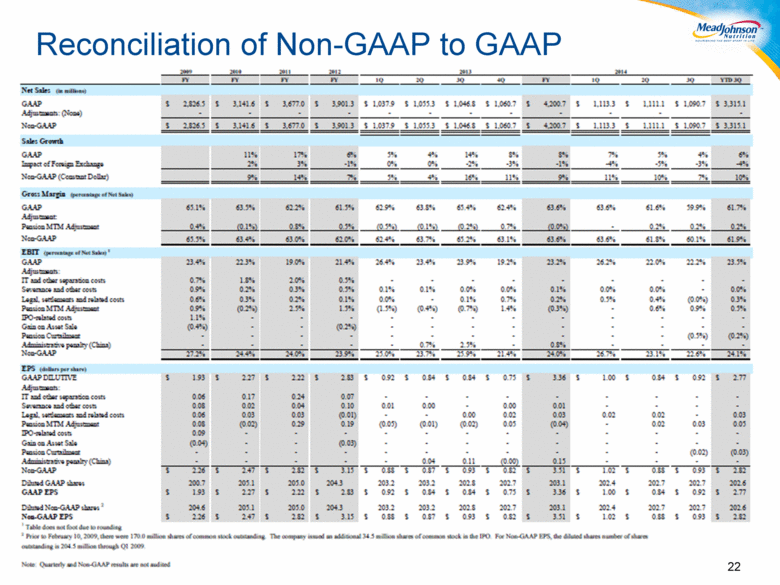
Reconciliation of Non-GAAP to GAAP Net Sales (in millions) 2009 2010 2011 2012 2013 2014 Net sales (in millions) Gaap adunstments (None) non-gaap sales growth gaap impact of foreign exchange non-gaap (constant dollar) Gross margin EBIT EPS GAAP EPS $ 2,826.5 3 2,826.5 3 3.1416 3,677.0 1 3301.3 5 l.C373 1 1055.3 1 1A46.8 1 1,060.7 $ 4.7 3 1,113.3 3 tIll.l 3 l.19C7 I 3j15.1 11% 17% 8% 5. -4. 14-. 8% 8% 7% 3% 4% 0. 2% 3% -1-. 0. 0% -2-. -3% -1% -4% -5% -3. -4. 9% 14. 7. 5. 4% 26. 11. 9. 11. 20% 7. 10. 63.1% 63.5. 62r. 61.5% 62.9. 63.8. 654. 62.4. 63.6. 636% 61.6. 59.9% 61.7% 0.4. (0.1%) or. C- 5. 10!.) (Cl.) (02.) 2.7. 10.0%) - 0.2. or. or. 65.5% 63.4% 63.0% 62.0% 62.4% 63.7% 65.2. 63.1% 63.6% 63.6% 61.8% 60.1% 61.9% 23.4% 223% 19.0% 21.4% 26.4% 23.4% 23.9% 19.2% 232% 262% 22.0% 22.2% 23.3% 0.7% 1.8. 2.0% 0.5% - - - - - - - - - 0.9% 02% 0.3% 0.5% 0.1% 0.1% 0.0. 0.0% 0.1% 0.0% 0.0% - 0.0% 0.6. 0.9% 1.1% 03% (02%) - 0.2% 2.5% - 0.1% 1.5% - 0.0% (1.5%) - - (0.4%) - 0.1% (0.7%) - 0.7% 1.4% - 0.2% (0.3%) - 0.5% - - 0.-P. 0.6. - (0.0%) or. - 0.3% 0.5% - 4%) - - - - - - - - (02%) - - - - - - - 0.7% - - 2.5% - - - - - 0.8% - - - - - - - (03%) - - (02%) - 27.2. 24.4. 24.0. 23.9. 2!.0. 23.7% 25.9. 21.4. 24.0% 261. 23.1. 223% 24.1% I L935 225 2221 2.835 0.921 0.841 0.84$ 0.731 3.363 LOOt 0.841 0.921 2.7? 0.06 0.17 0.24 0.07 - - • - - - - . - 0.08 0.02 0.04 0.10 0.01 0.00 - 0.00 0.01 - - - - 0.06 0.08 0.09 003 (0.02) - 0.03 0.29 - (0.01) 0.19 - - (0.05) - - (0.01) - 0.00 (0.02) - 0.02 0.03 - 0.03 (0.04) - 0.02 - - 0.02 0.02 - - 0.03 - 0.03 0.03 - (0.04) - - (0.05) - - - - - - - - - - - - 334 0.11 (0.00) 015 2.821 3.153 1.031 1.173 0.931 0.823 3.513 22 |
|
|
Thank you |