Attached files
| file | filename |
|---|---|
| 8-K - 8-K - HCC INSURANCE HOLDINGS INC/DE/ | a14-24731_18k.htm |
Exhibit 99.1
|
|
Third Quarter 2014 Investor Presentation November 18, 2014 |
|
|
See Notice About This Presentation Notice About This Presentation ABOUT FORWARD-LOOKING STATEMENTS: This presentation contains certain “forward-looking statements” within the meaning of Section 27A of the Securities Act of 1933 and Section 21E of the Securities Exchange Act of 1934, which are intended to be covered by the safe harbors created by those laws. These forward-looking statements reflect our current expectations and projections about future events and include information about possible or assumed future results of our operations. All statements, other than statements of historical facts, included or incorporated by reference in this presentation that address activities, events or developments that we expect or anticipate may occur in the future, including such things as growth of our business and operations, business strategy, competitive strengths, goals, plans, future capital expenditures and references to future successes may be considered forward-looking statements. Generally, words such as “anticipate,” “believe,” “estimate,” “expect,” “intend,” “plan,” “probably” or similar expressions indicate forward-looking statements. Many risks and uncertainties may have an impact on the matters addressed in these forward-looking statements, which could affect our future financial results and performance. These events or factors could cause our results or performance to differ materially from those we express in our forward-looking statements. Although we believe that the assumptions underlying our forward-looking statements are reasonable, any of these assumptions, and, therefore, the forward-looking statements based on these assumptions, could themselves prove to be inaccurate. In light of the significant uncertainties inherent in the forward-looking statements that are included in this presentation, our inclusion of this information is not a representation by us or any other person that our objectives or plans will be achieved. Our forward-looking statements speak only at the date made, and we will not update these forward-looking statements unless the securities laws require us to do so. In light of these risks, uncertainties and assumptions, any forward-looking events discussed in this presentation may not occur. PRESENTATION FORMATTING: Certain figures included in this publication have been rounded for presentation and are provided for comparative purposes only. Our periodic reports filed with the Securities and Exchange Commission contain more detailed information, including specific figures. 2 |
|
|
See Notice About This Presentation A Proven Track Record 3 40 years of sustained, profitable growth |
|
|
See Notice About This Presentation 4 HCC Overview |
|
|
See Notice About This Presentation What Is HCC? Specialty Insurance Underwriter 5 |
|
|
Over 100 Specialty Lines Diverse, non-correlated lines of business See Notice About This Presentation 6 |
|
|
See Notice About This Presentation Performance Through Cycles Consistent, top-tier financial results and value creation regardless of market cycles 7 |
|
|
See Notice About This Presentation Strong Balance Sheet AA (Very Strong) from Standard & Poor’s A+ (Superior) from A.M. Best Company AA (Very Strong) from Fitch Ratings A1 (Good Security) from Moody’s 8 |
|
|
Consistent, Profitable Growth 9 Premium See Notice About This Presentation ($ in millions) CAGR (2008-2013) GWP: 2.9% NWP: 1.8% YTD 3Q14 Growth YOY GWP: 4.6% NWP: 5.3% |
|
|
Underwriting Focus 10 Underwriting Ratios See Notice About This Presentation |
|
|
See Notice About This Presentation Effective Catastrophe Management 11 1 1/1/14 PML excludes reinstatement premiums and is based on 1 in 250 year estimates from RMS models and internal PML estimates for lines not modeled in RMS. After-tax Net Probable Maximum Loss (PML)1 for a single event managed to 5% of Shareholders’ Equity After-tax Net PML as % of Shareholders’ Equity |
|
|
See Notice About This Presentation 12 YTD 3Q14 Results |
|
|
See Notice About This Presentation Earnings Per Share 13 YTD 3Q13 actual $2.90 EPS YTD 3Q14 actual $3.45 EPS A new nine-month record |
|
|
See Notice About This Presentation Book Value Growth 14 Note: Results are third quarter year-to-date 2014. 8.2% As reported 6.9% Excluding AOCI |
|
|
See Notice About This Presentation Combined Ratio 15 82.2% Target: mid-80s Note: Results are third quarter year-to-date 2014. |
|
|
See Notice About This Presentation Expense Ratio Low expense ratio = competitive advantage 16 26.4% Note: Results are third quarter year-to-date 2014. |
|
|
Note: Results are third quarter year-to-date 2014. 1 Operating return on equity is a non-GAAP financial measure. See GAAP reconciliation on slide 37. See Notice About This Presentation Operating Return on Equity1 17 10.9% Target: 10% above 90-day T-bill |
|
|
See Notice About This Presentation 18 Segment Results |

|
|
Underwriting Segment Overview ($ in millions) 19 See Notice About This Presentation Gross Written Premium Net Earned Premium Combined Ratio YTD 3Q13 Total: $2,209 YTD 3Q14 Total: $2,310 YTD 3Q13 Total: $1,679 YTD 3Q14 Total: $1,722 YTD 3Q13 Total: 84.1% YTD 3Q14 Total: 82.2% Segment Pretax Earnings YTD 3Q13 Total: $285 YTD 3Q14 Total: $322 Note: Totals for GWP and NEP include Exited Lines. |
|
|
See Notice About This Presentation U.S. Property & Casualty 20 Note: Results are third quarter year-to-date 2014. 69.5% combined ratio – 5 point improvement in loss ratio 7% earnings growth 23% GWP growth in Liability led by Primary Casualty Net favorable loss development of $40 million Continued focus on maintaining or improving margins in a competitive environment Gross Written Premium $525M |
|
|
See Notice About This Presentation Professional Liability 21 77.9% combined ratio Mid single-digit price increases on U.S. business; mid single-digit price decreases on International business Margins remain favorable Cumulative paid loss ratio below 30% since inception in 2002 Leader in worldwide D&O market Gross Written Premium $371M Note: Results are third quarter year-to-date 2014. |
|
|
See Notice About This Presentation Accident & Health 22 87.5% combined ratio – consistent with prior year 20% earnings growth; 14% GWP growth Medical Stop-loss price increases above loss trends – market competitive but stable Additional Medical Stop-loss growth opportunities emerging as Private Exchange market develops Continued strong growth in Short-term Medical Gross Written Premium $746M Note: Results are third quarter year-to-date 2014. |
|
|
See Notice About This Presentation U.S. Surety & Credit 23 83.7% combined ratio Consistent, strong underwriting results Competitive environment in all lines; successfully maintaining margins Improvements in U.S. and global economic recovery will benefit this segment Gross Written Premium $174M Note: Results are third quarter year-to-date 2014. |
|
|
See Notice About This Presentation International 24 85.2% combined ratio Earnings increased $53 million 5% GWP growth overall led by strong performance from Surety & Credit and Liability Favorable accident year loss ratio of 39.8% Net adverse development of $16 million due to $43 million charge for discontinued Spanish Surety Bonds Gross Written Premium $494M Note: Results are third quarter year-to-date 2014. |
|
|
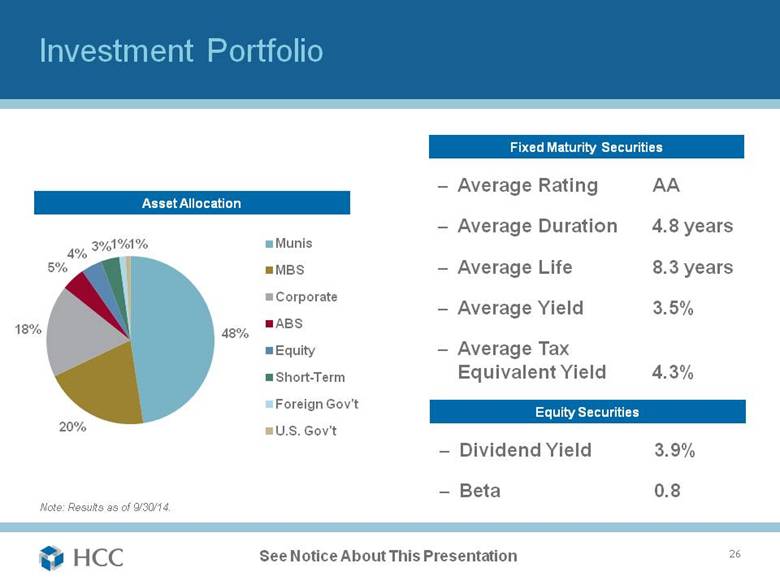
See Notice About This Presentation Investments 25 High quality portfolio with average rating of “AA” Investment leverage of 2x Buy and hold strategy with ample liquidity to fund liabilities Reduced equity allocation to 4% during 3Q14, realizing gains of $39 million Fixed Maturity Securities $6,577 Equity Securities 286 Short-term Investments 251 Total Investments $7,114 ($ in millions) Note: Results as of 9/30/14. |
|
|
See Notice About This Presentation Investment Portfolio 26 Average Rating AA Average Duration 4.8 years Average Life 8.3 years Average Yield 3.5% Average Tax Equivalent Yield 4.3% Fixed Maturity Securities Asset Allocation Dividend Yield 3.9% Beta 0.8 Equity Securities Note: Results as of 9/30/14. |
|
|
See Notice About This Presentation 27 Crop Insurance Acquisition |
|
|
See Notice About This Presentation ProAg Summary Definitive agreement to acquire Producers Ag Insurance Group, Inc. (ProAg) from CUNA Mutual Group for $110 million, subject to net worth adjustment at closing; expected closing in early 1Q15 Licensed provider of the U.S. Department of Agriculture’s (USDA) Multi-Peril Crop Insurance (MPCI) program offering a full suite of crop hail / named peril products 6th largest writer of MPCI (4.9% market share)1 One of the few crop insurers that has built a national platform Headquartered in Amarillo, Texas with 7 regional offices Over 400 full-time and part-time employees supporting operations in over 40 states 28 1 Source: USDA’s Risk Management Agency as of November 2013. Gross Premiums Earned by Product Description MPCI Gross Premium Mix (RY 2013) MPCI Market Share by Direct Premium Written1 2013 Gross Premium: $634M By State By Crop 2013 MPCI Gross Premium: $578M |
|
|
See Notice About This Presentation Crop Insurance – Benefits and Objectives 29 Future Objectives Benefits to HCC Excellent platform with an experienced management team Specialty line of business Historical profitability Lack of correlation with HCC’s existing lines Modest capital requirement Limited downside risk Expected to be accretive to earnings beginning in 2016 Grow business organically and through additional acquisitions |
|
|
See Notice About This Presentation 30 Capital Management |

|
|
See Notice About This Presentation 2014 Capital Management Initiatives Target returning 100% of net income through dividends and share repurchases in any given year Third Quarter Authorized new $500 million share repurchase program Declared regular cash dividend of $0.295 per share $0.07 per share or 31% increase in quarterly dividend 18th annual consecutive and largest ever increase in cash dividend Year-to-date Share repurchases of 4.3 million shares, or $205 million, at an average price of $47.27 Capital return of $301 million through dividends and share repurchases 31 Note: Results are year-to-date as of 11/17/14. |

|
|
See Notice About This Presentation 32 Peer Comparison |
|
|
33 Total Value Creation – 10 Years Source: Dowling & Partners; data through 12/31/13. Note: Total Value Creation is growth in tangible book value per share including dividends. See Notice About This Presentation |
|
|
See Notice About This Presentation Outperformance with Low Volatility – 10 Years 34 Source: Dowling & Partners; data through 12/31/13. |
|
|
9.3 point difference versus peers over last year 11.5 point difference versus peers over last three years 10.8 point difference versus peers over last five years See Notice About This Presentation Combined Ratio – HCC versus Peer Group 35 1 Year 3 Year2 5 Year2 1 Calculated by HCC using 12/31/13 and prior SEC filings for peer companies. Peers reflects average for peer companies. 2 Reflects average for three-year and five-year results. 1 1 1 83.4% 92.7% 86.0% 97.5% 85.5% 96.3% HCC Peers HCC Peers HCC Peers |
|
|
See Notice About This Presentation HCC’s Value Proposition Specialty Insurance businesses with strong long-term fundamentals and market leadership Diversified underwriting portfolio with historically low correlation Consistent track record of profitable growth and strong underwriting performance Lowest expense ratio amongst industry peers High quality investment portfolio Disciplined capital management Strong risk management practices Broadly experienced team 36 |
|
|
See Notice About This Presentation Reconciliation of Non-GAAP Financial Measure to GAAP NON-GAAP FINANCIAL MEASURE: Annualized operating return on equity is a non-GAAP financial measure under Regulation G and is calculated as net earnings excluding after-tax net realized investment gain/loss, other-than-temporary impairment credit losses, and foreign currency benefit/expense (collectively, operating earnings) divided by average shareholders’ equity excluding accumulated other comprehensive income. Management believes annualized operating return on equity is a useful measure for understanding the Company’s profitability relative to shareholders’ equity before consideration of investment-related gains/losses and foreign currency benefit/expense, both of which management excludes when evaluating operating results internally. 37 Nine months ended September 30, 2014 $345,314 41,948 5,801 Total items excluded from operating earnings 47,749 $297,565 $3,674,430 118,651 $3,555,779 $3,890,665 170,632 $3,720,033 $3,637,906 10.9% Numerator: (In thousands) Foreign currency benefit* GAAP net earnings Exclude: Net realized investment gain* Beginning equity, as adjusted GAAP equity - end of period GAAP equity - beginning of period Exclude - Accumulated other comprehensive income Operating earnings Denominator: Annualized operating return on equity *Net of tax, calculated using 35% statutory tax rate. Average equity, as adjusted Exclude - Accumulated other comprehensive income Ending equity, as adjusted |
|
|
See Notice About This Presentation 38 |