Attached files
| file | filename |
|---|---|
| 8-K - CURRENT REPORT - ANGIODYNAMICS INC | an31745800-8k.htm |
Exhibit 99.1
November 2014 Joseph M. DeVivo, President & CEO Mark Frost, Executive Vice President & CFO
Forward-Looking Statements Notice Regarding Forward Looking Statements This presentation contains forward-looking statements within the meaning of the Private Securities Litigation Reform Act of 1995. All statements regarding AngioDynamics’ expected future financial position, results of operations, cash flows, business strategy, budgets, projected costs, capital expenditures, products, competitive positions, growth opportunities, plans and objectives of management for future operations, as well as statements that include the words such as “expects,” “reaffirms” “intends,” “anticipates,” “plans,” “believes,” “seeks,” “estimates,” “optimistic,” or variations of such words and similar expressions, are forward-looking statements. These forward looking statements are not guarantees of future performance and are subject to risks and uncertainties. Investors are cautioned that actual events or results may differ from AngioDynamics’ expectations. Factors that may affect the actual results achieved by AngioDynamics include, without limitation, the ability of AngioDynamics to develop its existing and new products, technological advances and patents attained by competitors, future actions by the FDA or other regulatory agencies, domestic and foreign health care reforms and government regulations, results of pending or future clinical trials, overall economic conditions, the results of on-going litigation, the effects of economic, credit and capital market conditions, general market conditions, market acceptance, foreign currency exchange rate fluctuations, the effects on pricing from group purchasing organizations and competition, the ability of AngioDynamics to integrate purchased businesses, as well as the risk factors listed from time to time in AngioDynamics’ SEC filings, including but not limited to its Annual Report on Form 10-K for the year ended May 31, 2014, and its quarterly report on form 10-Q for the fiscal quarter ended August 31, 2014, and the current reports on Form 8-K, filed with the SEC on October 9, 2014, Oct. 31, 2014, and November 14, 2014. AngioDynamics does not assume any obligation to publicly update or revise any forward-looking statements for any reason. In the United States, NanoKnife has been cleared by the FDA for use in the surgical ablation of soft tissue. NanoKnife has not been cleared for the treatment or therapy of a specific disease or condition. This document may discuss the use of NanoKnife for specific clinical indications for which it is not cleared in the United States at this time. Notice Regarding Non-GAAP Financial Measures Management uses non-GAAP measures to establish operational goals, and believes that non-GAAP measures may assist investors in analyzing the underlying trends in AngioDynamics’ business over time. Investors should consider these non-GAAP measures in addition to, not as a substitute for or as superior to, financial reporting measures prepared in accordance with GAAP. In this presentation, AngioDynamics has reported non-GAAP sales growth, non-GAAP gross margin, non-GAAP operating income, adjusted EBITDA (income before interest, taxes, depreciation and amortization), non-GAAP net income and non-GAAP earnings per share. Management uses these measures in its internal analysis and review of operational performance. Management believes that these measures provide investors with useful information in comparing AngioDynamics’ performance over different periods. By using these non-GAAP measures, management believes that investors get a better picture of the performance of AngioDynamics’ underlying business. Management encourages investors to review AngioDynamics’ financial results prepared in accordance with GAAP to understand AngioDynamics’ performance taking into account all relevant factors, including those that may only occur from time to time but have a material impact on AngioDynamics’ financial results. Please see the tables that follow for a reconciliation of non-GAAP measures to measures prepared in accordance with GAAP. *
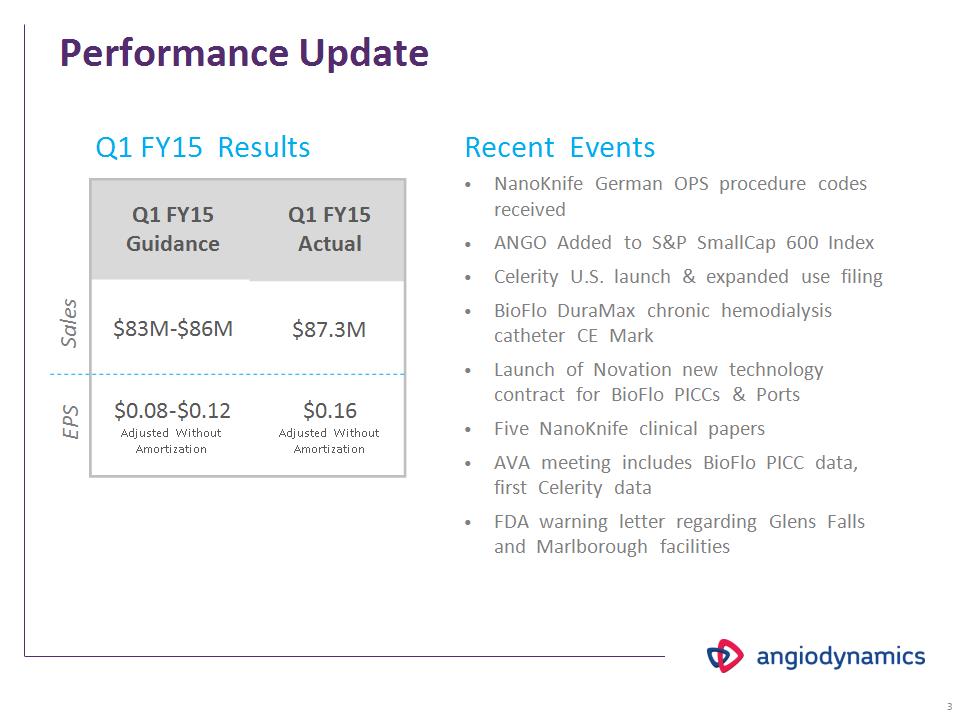
Performance Update Q1 FY15 Results Q1 FY15 Guidance Q1 FY15 Actual $83M-$86M $87.3M $0.08-$0.12 Adjusted Without Amortization $0.16 Adjusted Without Amortization Sales EPS NanoKnife German OPS procedure codes received ANGO Added to S&P SmallCap 600 Index Celerity U.S. launch & expanded use filing BioFlo DuraMax chronic hemodialysis catheter CE Mark Launch of Novation new technology contract for BioFlo PICCs & Ports Five NanoKnife clinical papers AVA meeting includes BioFlo PICC data, first Celerity data FDA warning letter regarding Glens Falls and Marlborough facilities Recent Events *
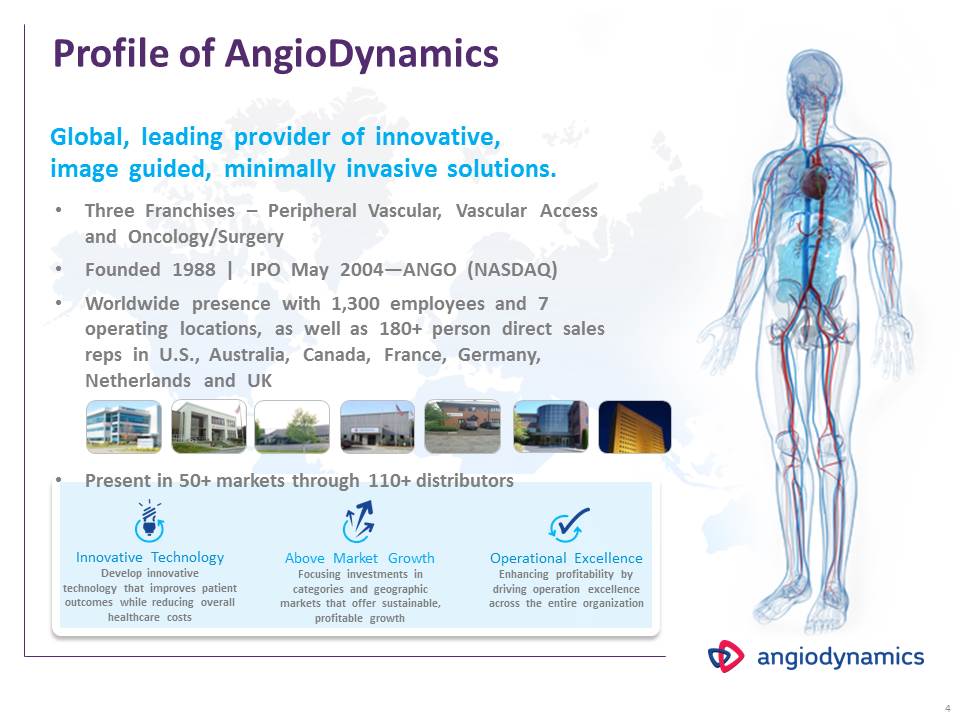
Profile of AngioDynamics Global, leading provider of innovative, image guided, minimally invasive solutions. Three Franchises – Peripheral Vascular, Vascular Access and Oncology/Surgery Founded 1988 | IPO May 2004—ANGO (NASDAQ) Worldwide presence with 1,300 employees and 7 operating locations, as well as 180+ person direct sales reps in U.S., Australia, Canada, France, Germany, Netherlands and UK Present in 50+ markets through 110+ distributors Innovative Technology Develop innovative technology that improves patient outcomes while reducing overall healthcare costs Operational Excellence Enhancing profitability by driving operation excellence across the entire organization Above Market Growth Focusing investments in categories and geographic markets that offer sustainable, profitable growth *
Leadership Joseph M. DeVivo President & CEO Mark Frost EVP & CFO John Soto EVP & CCO Matthew Kapusta SVP, Business Development Stephen Trowbridge SVP & General Counsel Barbara Kucharczyk VP, Operations Mark Stephens SVP, Administration Gary Barrett VP, RA/QA *
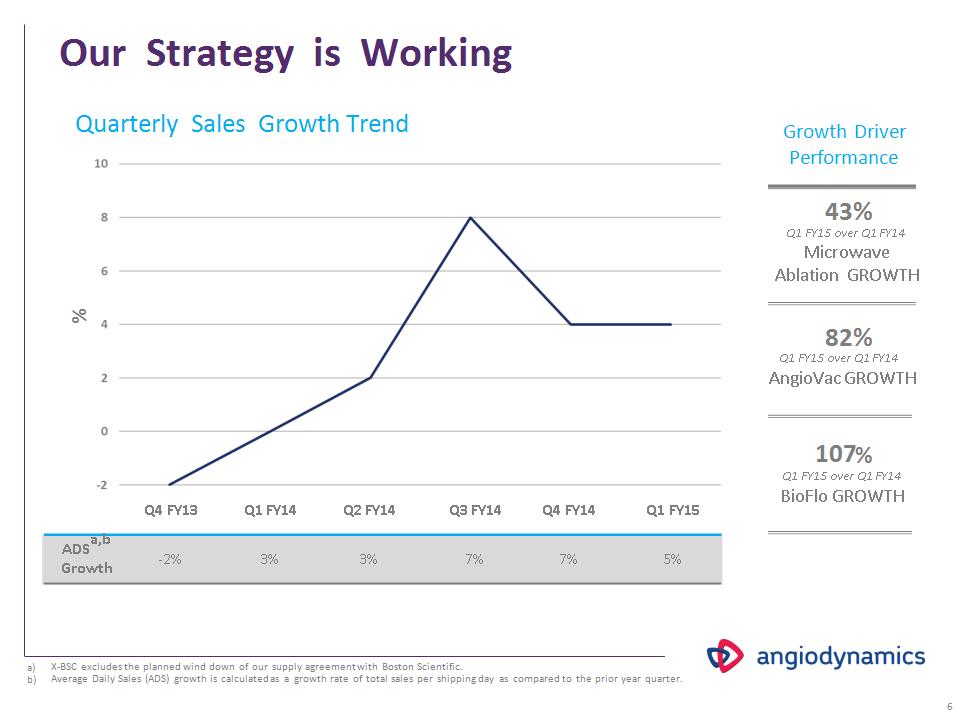
Our Strategy is Working Quarterly Sales Growth Trend Q4 FY13 Q1 FY14 Q2 FY14 Q3 FY14 Q4 FY14 Q1 FY15 % 107% Q1 FY15 over Q1 FY14 BioFlo GROWTH 43% Q1 FY15 over Q1 FY14 Microwave Ablation GROWTH 82% Q1 FY15 over Q1 FY14 AngioVac GROWTH Growth Driver Performance * -2% 3% 3% 7% 7% 5% ADSa,b Growth X-BSC excludes the planned wind down of our supply agreement with Boston Scientific. Average Daily Sales (ADS) growth is calculated as a growth rate of total sales per shipping day as compared to the prior year quarter.
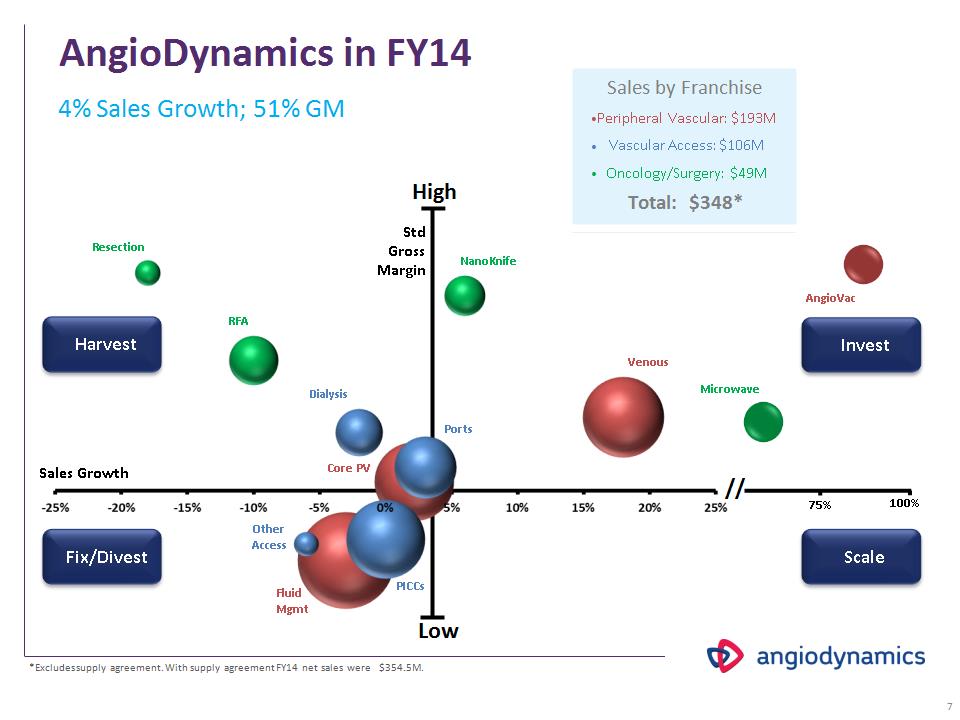
AngioDynamics in FY14 RFA Resection NanoKnife Microwave Venous Ports Dialysis PICCs Other Access Core PV Fluid Mgmt Sales Growth Std Gross Margin // 100% AngioVac Harvest Fix/Divest Invest Scale 4% Sales Growth; 51% GM Sales by Franchise Peripheral Vascular: $193M Vascular Access: $106M Oncology/Surgery: $49M Total: $348* 75% *Excludes supply agreement. With supply agreement FY14 net sales were $354.5M. High Low *
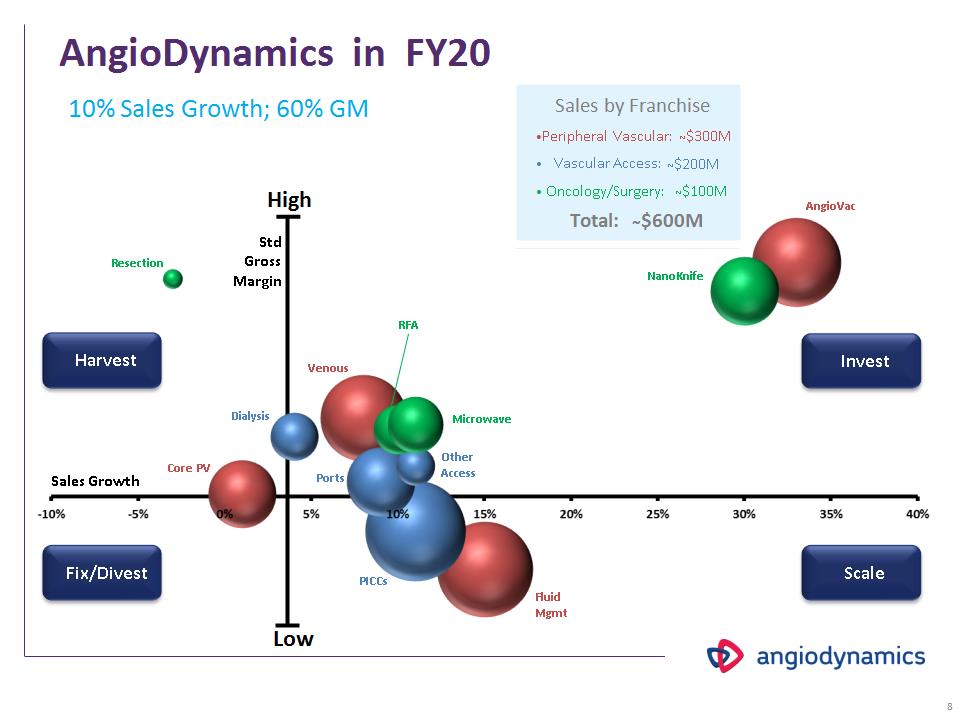
AngioDynamics in FY20 10% Sales Growth; 60% GM Harvest Fix/Divest Invest Scale Resection Core PV Dialysis NanoKnife AngioVac PICCs Fluid Mgmt Ports Other Access Microwave RFA Venous Sales Growth Std Gross Margin Sales by Franchise Peripheral Vascular: ̴$300M Vascular Access: ̴$200M Oncology/Surgery: ̴$100M Total: ̴$600M High Low *
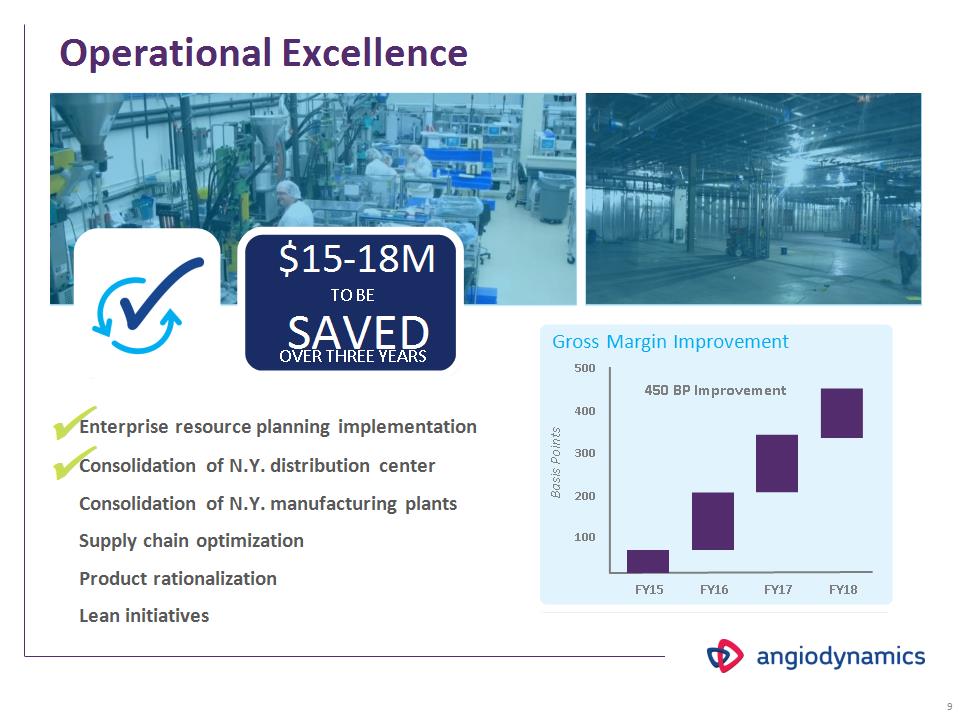
Operational Excellence Enterprise resource planning implementation Consolidation of N.Y. distribution center Consolidation of N.Y. manufacturing plants Supply chain optimization Product rationalization Lean initiatives Gross Margin Improvement FY15 FY16 FY17 FY18 Basis Points 100 200 300 400 500 $15-18M TO BE SAVED OVER THREE YEARS 450 BP Improvement *
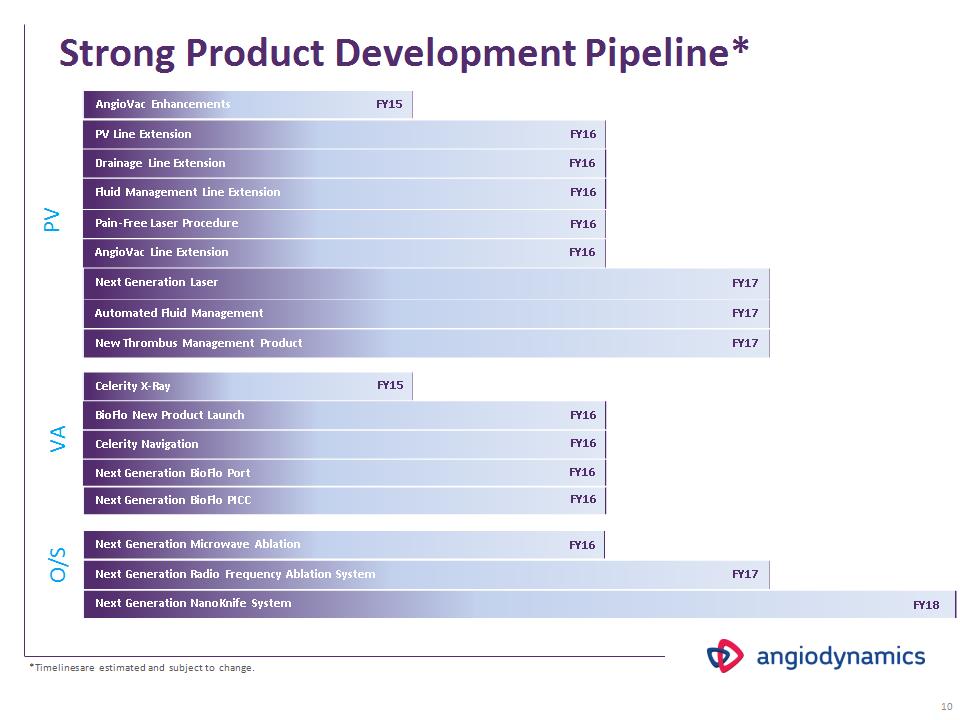
Strong Product Development Pipeline* PV VA O/S Celerity X-Ray FY15 BioFlo New Product Launch FY16 Celerity Navigation FY16 Next Generation BioFlo Port FY16 Next Generation BioFlo PICC FY16 Next Generation Radio Frequency Ablation System FY17 Next Generation Microwave Ablation FY16 Next Generation NanoKnife System FY18 AngioVac Enhancements FY15 PV Line Extension FY16 Drainage Line Extension FY16 Fluid Management Line Extension FY16 Pain-Free Laser Procedure FY16 AngioVac Line Extension FY16 Next Generation Laser FY17 Automated Fluid Management FY17 New Thrombus Management Product FY17 *Timelines are estimated and subject to change. *
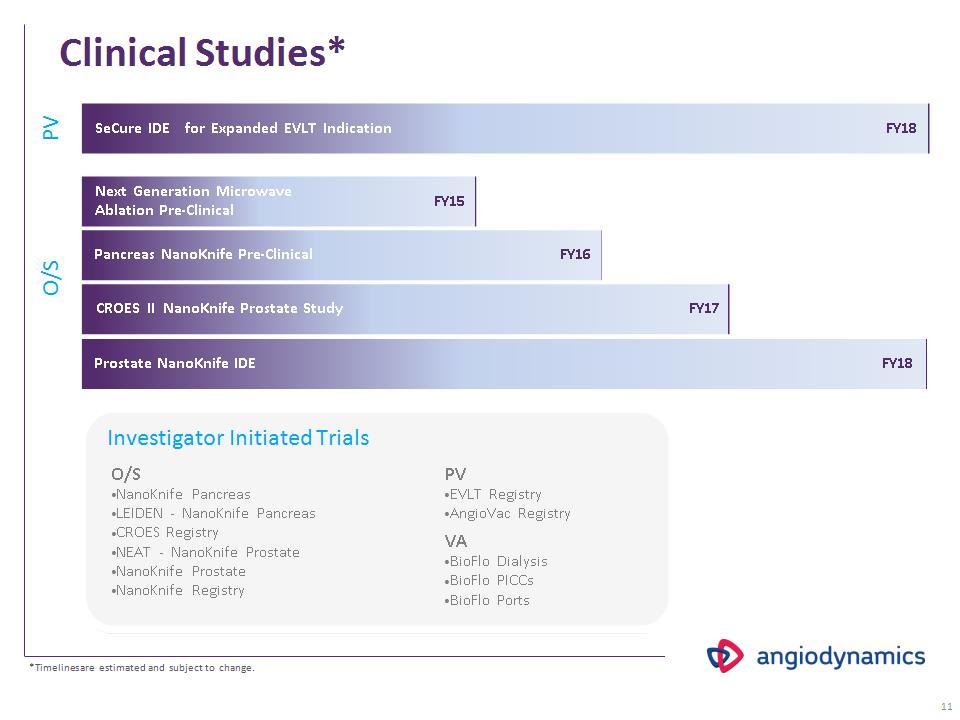
Clinical Studies* PV O/S SeCure IDE for Expanded EVLT Indication FY18 Pancreas NanoKnife Pre-Clinical FY16 Next Generation Microwave Ablation Pre-Clinical FY15 CROES II NanoKnife Prostate Study FY17 Prostate NanoKnife IDE FY18 O/S NanoKnife Pancreas LEIDEN – NanoKnife Pancreas CROES Registry NEAT – NanoKnife Prostate NanoKnife Prostate NanoKnife Registry Investigator Initiated Trials PV EVLT Registry AngioVac Registry VA BioFlo Dialysis BioFlo PICCs BioFlo Ports *Timelines are estimated and subject to change. *
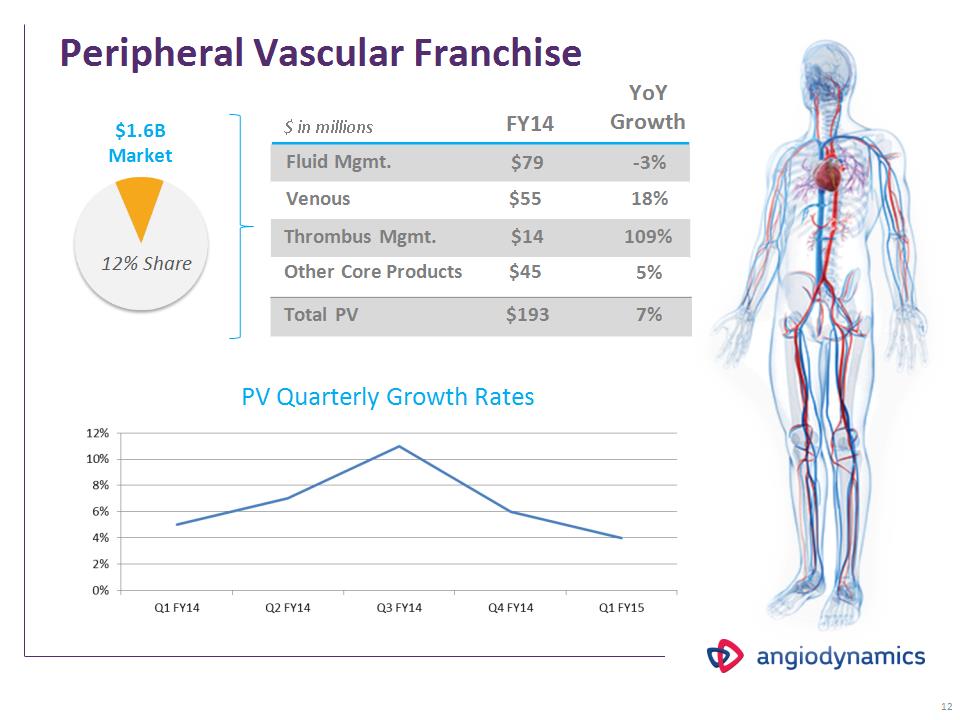
Peripheral Vascular Franchise FY14 Fluid Mgmt. Venous $79 $55 $ in millions $1.6B Market 12% Share Thrombus Mgmt. $14 Other Core Products $45 Total PV $193 YoY Growth -3% 18% 109% 5% 7% PV Quarterly Growth Rates *
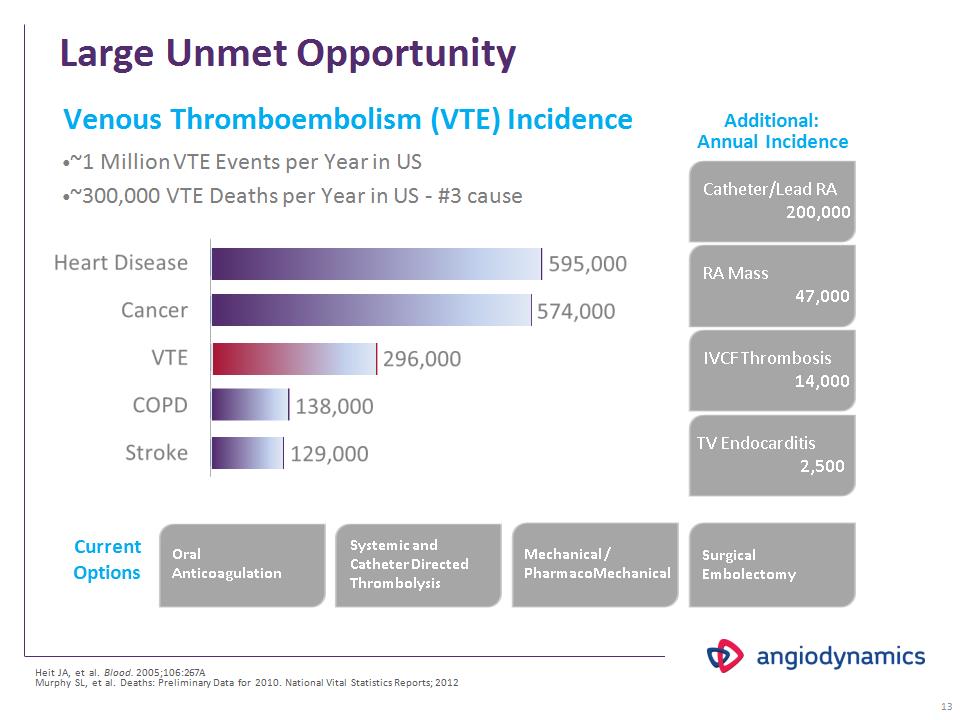
Large Unmet Opportunity Additional: Annual Incidence Venous Thromboembolism (VTE) Incidence ~1 Million VTE Events per Year in US ~300,000 VTE Deaths per Year in US - #3 cause Heit JA, et al. Blood. 2005;106:267A. Murphy SL, et al. Deaths: Preliminary Data for 2010. National Vital Statistics Reports; 2012 Catheter/Lead RA 200,000 RA Mass 47,000 IVCF Thrombosis 14,000 TV Endocarditis 2,500 Mechanical / PharmacoMechanical Oral Anticoagulation Systemic and Catheter Directed Thrombolysis Current Options Surgical Embolectomy *
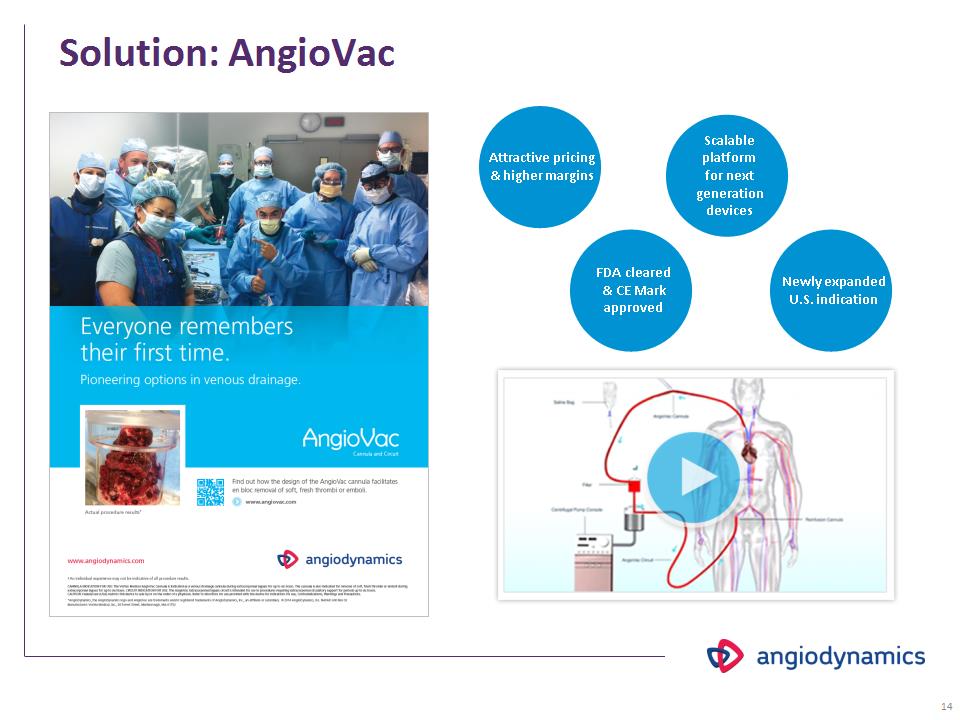
Solution: AngioVac FDA cleared & CE Mark approved Attractive pricing & higher margins Scalable platform for next generation devices Newly expanded U.S. indication *
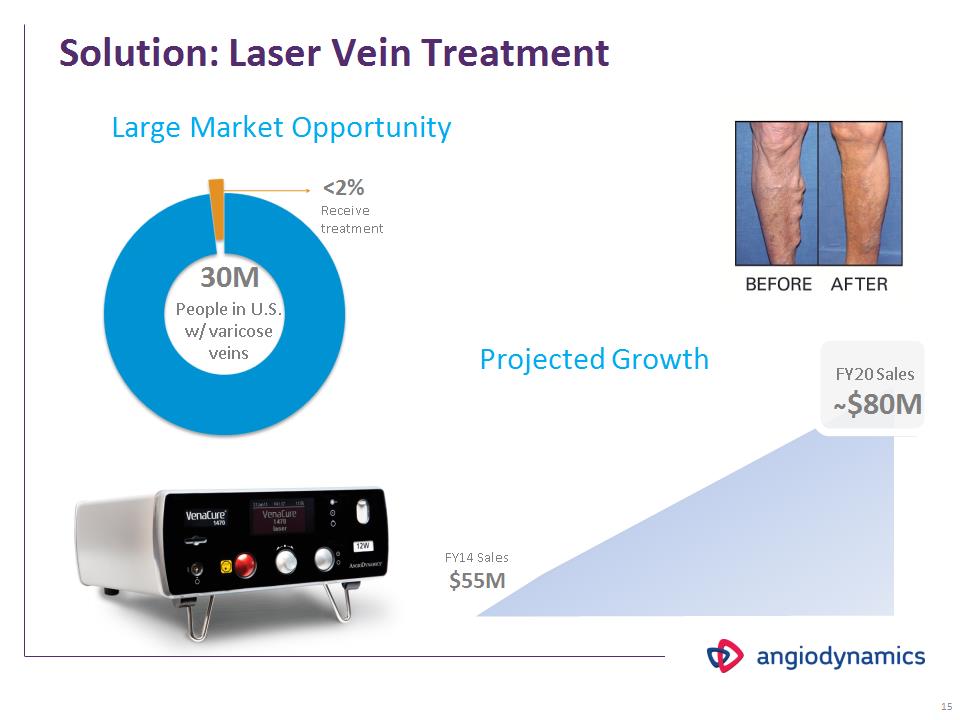
Solution: Laser Vein Treatment 30M People in U.S. w/ varicose veins Large Market Opportunity <2% Receive treatment Projected Growth FY20 Sales ̴$80M FY14 Sales $55M *
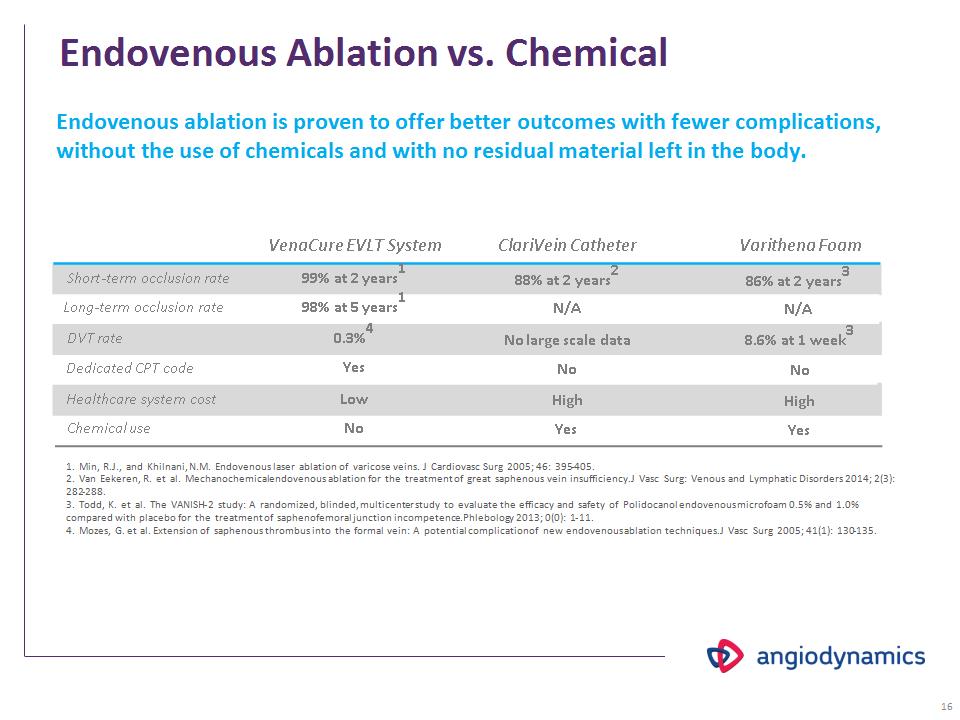
Endovenous Ablation vs. Chemical Endovenous ablation is proven to offer better outcomes with fewer complications, without the use of chemicals and with no residual material left in the body. VenaCure EVLT System Short-term occlusion rate Long-term occlusion rate DVT rate Dedicated CPT code Healthcare system cost Chemical use 99% at 2 years1 98% at 5 years1 0.3%4 Yes Low No ClariVein Catheter Varithena Foam 88% at 2 years2 N/A No large scale data No High Yes 86% at 2 years3 N/A 8.6% at 1 week3 No High Yes 1. Min, R.J., and Khilnani, N.M. Endovenous laser ablation of varicose veins. J Cardiovasc Surg 2005; 46: 395-405. 2. Van Eekeren, R. et al. Mechanochemical endovenous ablation for the treatment of great saphenous vein insufficiency. J Vasc Surg: Venous and Lymphatic Disorders 2014; 2(3): 282-288. 3. Todd, K. et al. The VANISH-2 study: A randomized, blinded, multicenter study to evaluate the efficacy and safety of Polidocanol endovenous microfoam 0.5% and 1.0% compared with placebo for the treatment of saphenofemoral junction incompetence. Phlebology 2013; 0(0): 1-11. 4. Mozes, G. et al. Extension of saphenous thrombus into the formal vein: A potential complication of new endovenous ablation techniques. J Vasc Surg 2005; 41(1): 130-135. *
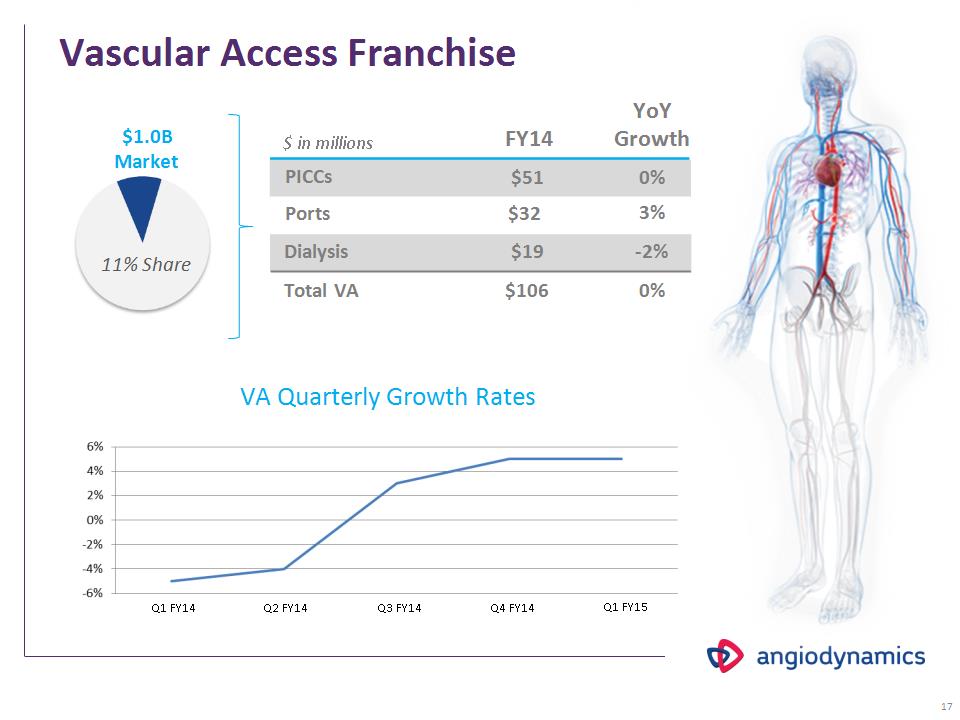
Vascular Access Franchise FY14 PICCs Ports $51 $32 $ in millions Dialysis $19 Total VA $106 $1.0B Market 11% Share YoY Growth 0% 3% -2% 0% VA Quarterly Growth Rates Q1 FY14 Q2 FY14 Q3 FY14 Q4 FY14 Q1 FY15 *
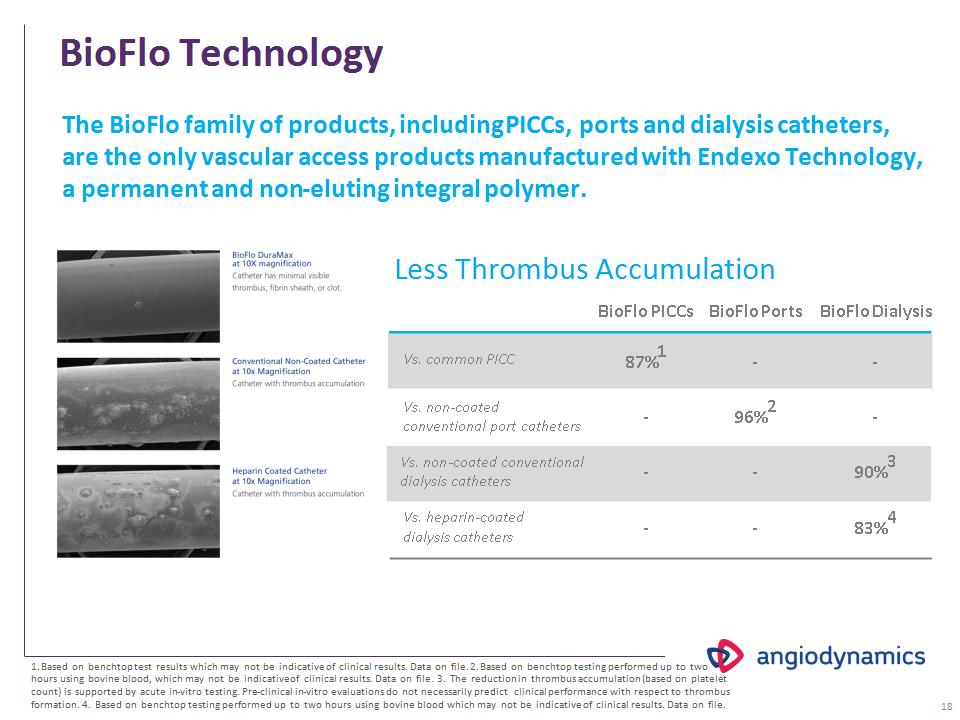
BioFlo Technology The BioFlo family of products, including PICCs, ports and dialysis catheters, are the only vascular access products manufactured with Endexo Technology, a permanent and non-eluting integral polymer. Less Thrombus Accumulation BioFlo PICCs BioFlo Ports Vs. common PICC Vs. non-coated conventional port catheters Vs. non-coated conventional dialysis catheters Vs. heparin-coated dialysis catheters 87%1 – BioFlo Dialysis – 96%2 – – – – – – 90%3 83%4 1. Based on benchtop test results which may not be indicative of clinical results. Data on file. 2. Based on benchtop testing performed up to two hours using bovine blood, which may not be indicative of clinical results. Data on file. 3. The reduction in thrombus accumulation (based on platelet count) is supported by acute in-vitro testing. Pre-clinical in-vitro evaluations do not necessarily predict clinical performance with respect to thrombus formation. 4. Based on benchtop testing performed up to two hours using bovine blood which may not be indicative of clinical results. Data on file. *
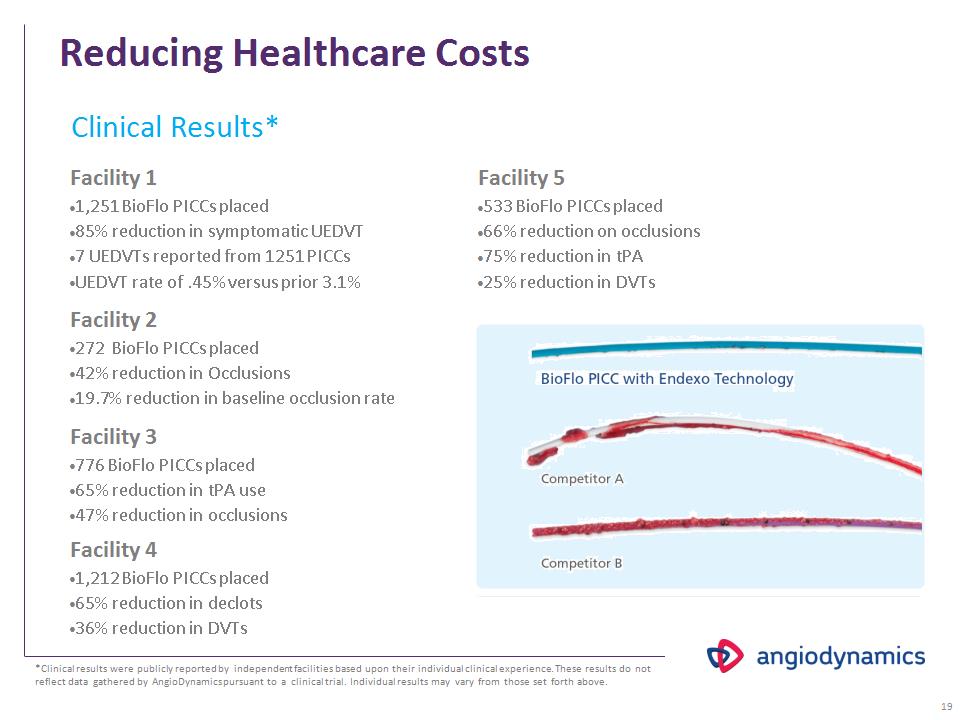
Reducing Healthcare Costs Facility 1 1,251 BioFlo PICCs placed 85% reduction in symptomatic UEDVT 7 UEDVTs reported from 1251 PICCs UEDVT rate of .45% versus prior 3.1% Facility 2 272 BioFlo PICCs placed 42% reduction in Occlusions 19.7% reduction in baseline occlusion rate Facility 3 776 BioFlo PICCs placed 65% reduction in tPA use 47% reduction in occlusions Facility 4 1,212 BioFlo PICCs placed 65% reduction in declots 36% reduction in DVTs Clinical Results* *Clinical results were publicly reported by independent facilities based upon their individual clinical experience. These results do not reflect data gathered by AngioDynamics pursuant to a clinical trial. Individual results may vary from those set forth above. Facility 5 533 BioFlo PICCs placed 66% reduction on occlusions 75% reduction in tPA 25% reduction in DVTs *
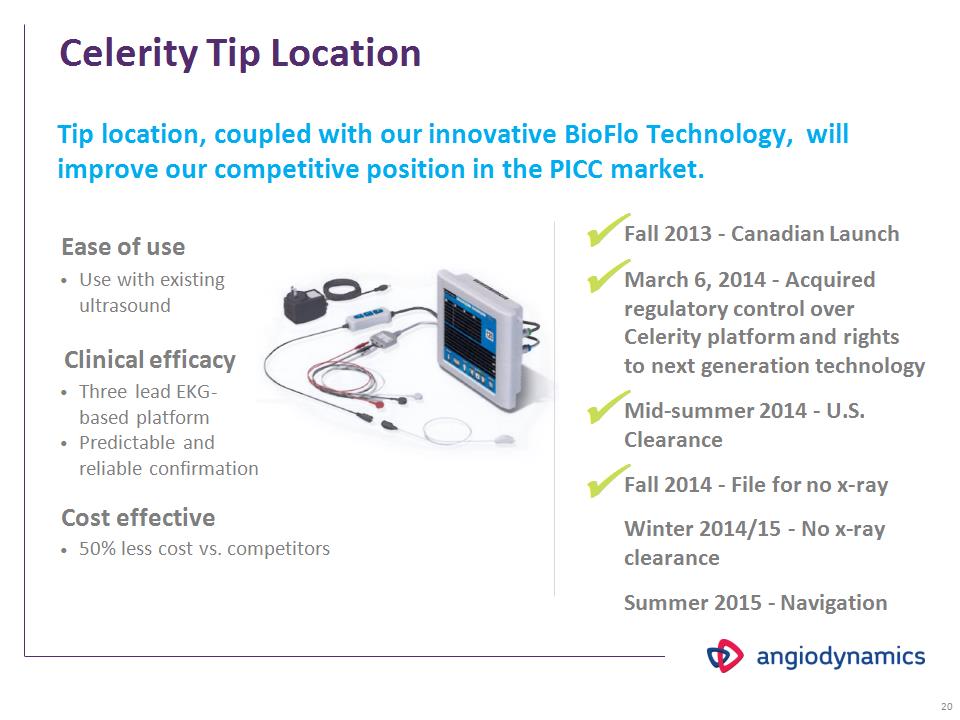
Celerity Tip Location Tip location, coupled with our innovative BioFlo Technology, will improve our competitive position in the PICC market. Ease of use Use with existing ultrasound Three lead EKG-based platform Predictable and reliable confirmation 50% less cost vs. competitors Clinical efficacy Cost effective Fall 2013 – Canadian Launch March 6, 2014 – Acquired regulatory control over Celerity platform and rights to next generation technology Mid-summer 2014 – U.S. Clearance Fall 2014 – File for no x-ray Winter 2014/15 – No x-ray clearance Summer 2015 - Navigation *
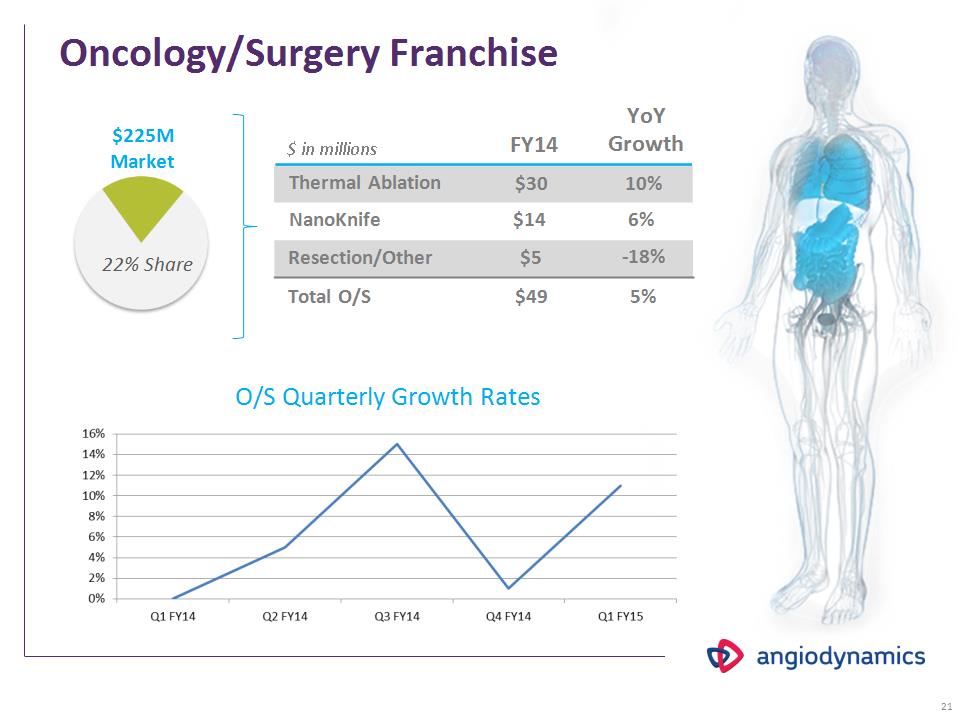
Oncology/Surgery Franchise FY14 Thermal Ablation NanoKnife $30 $14 $ in millions Resection/Other $5 Total O/S $49 $225M Market 22% Share YoY Growth 10% 6% -18% 5% O/S Quarterly Growth Rates *
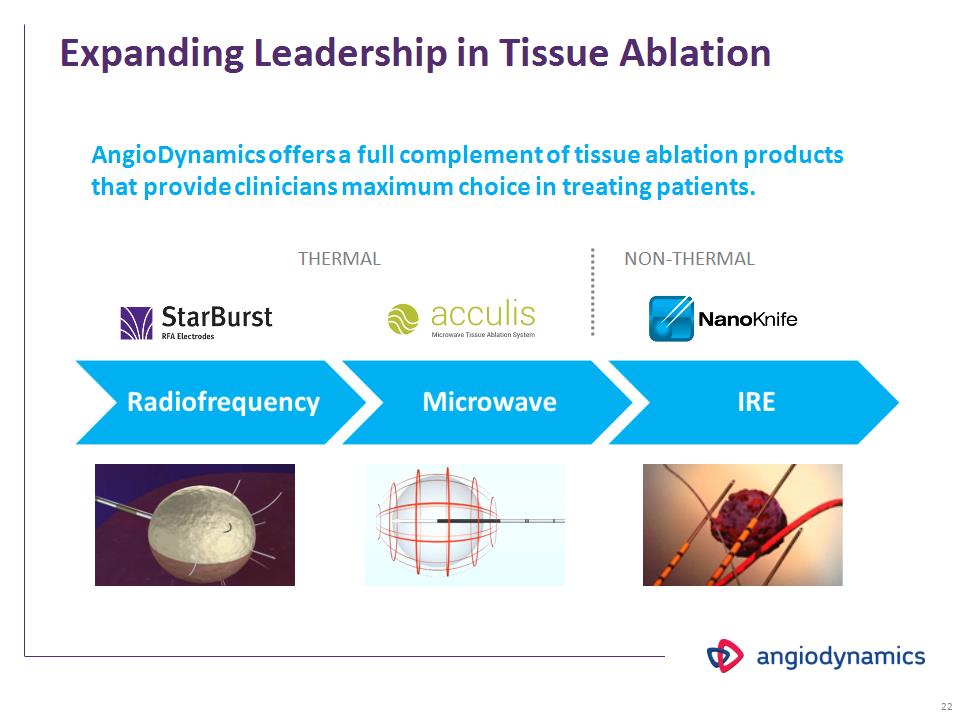
Expanding Leadership in Tissue Ablation THERMAL NON-THERMAL AngioDynamics offers a full complement of tissue ablation products that provide clinicians maximum choice in treating patients. *
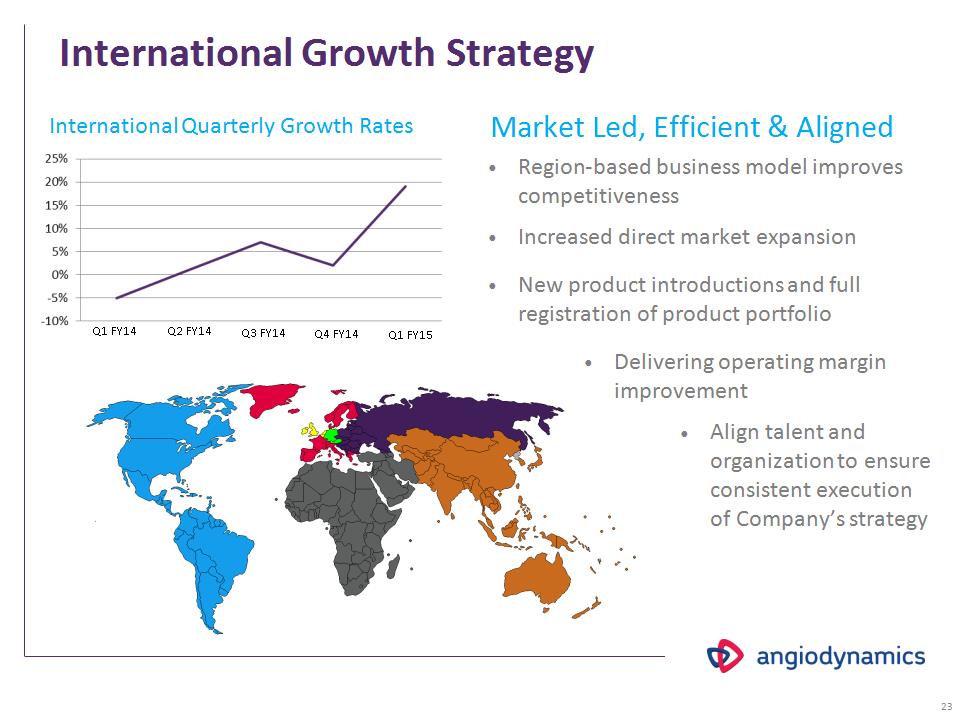
International Growth Strategy Market Led, Efficient & Aligned Region-based business model improves competitiveness Increased direct market expansion New product introductions and full registration of product portfolio Delivering operating margin improvement Align talent and organization to ensure consistent execution of Company’s strategy Q1 FY14 Q2 FY14 Q3 FY14 Q4 FY14 Q1 FY15 International Quarterly Growth Rates *
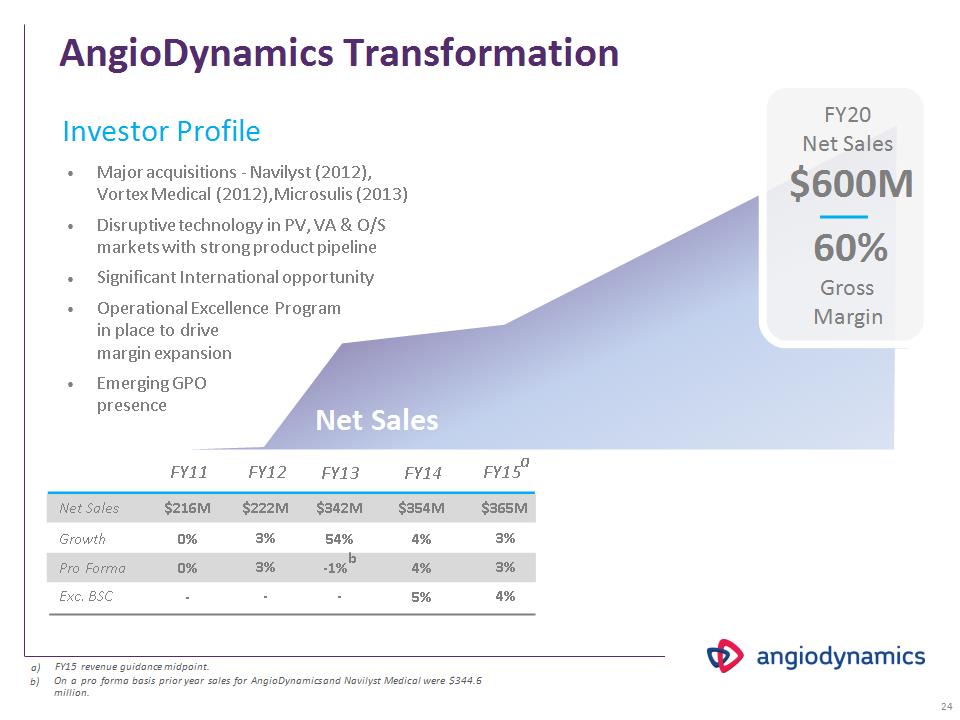
AngioDynamics Transformation FY11 FY12 FY13 FY14 FY15a Net Sales $216M $222M $342M $354M $365M Pro Forma 0% 3% -1%b 4% 3% FY15 revenue guidance midpoint. Exc. BSC – 5% 4% On a pro forma basis prior year sales for AngioDynamics and Navilyst Medical were $344.6 million. Investor Profile – – Major acquisitions – Navilyst (2012), Vortex Medical (2012), Microsulis (2013) Disruptive technology in PV, VA & O/S markets with strong product pipeline Significant International opportunity Operational Excellence Program in place to drive margin expansion Emerging GPO presence Growth 0% 3% 54% 4% 3% Net Sales FY20 Net Sales $600M 60% Gross Margin *
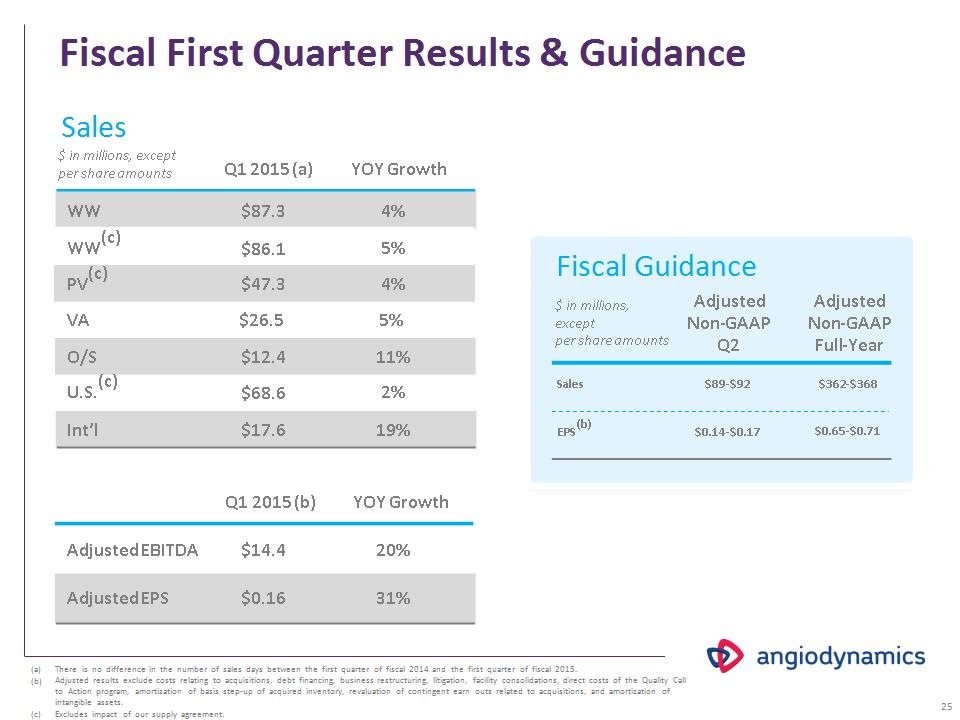
Fiscal First Quarter Results & Guidance There is no difference in the number of sales days between the first quarter of fiscal 2014 and the first quarter of fiscal 2015. Adjusted results exclude costs relating to acquisitions, debt financing, business restructuring, litigation, facility consolidations, direct costs of the Quality Call to Action program, amortization of basis step-up of acquired inventory, revaluation of contingent earn outs related to acquisitions, and amortization of intangible assets. Excludes impact of our supply agreement. Sales $ in millions, except per share amounts Q1 2015 (a) YOY Growth WW WW(c) PV(c) VA O/S U.S.(c) Int’l $87.3 $86.1 $47.3 $26.5 $12.4 $68.6 $17.6 4% 5% 4% 5% 11% 2% 19% Adjusted EBITDA Adjusted EPS $14.4 $0.16 20% 31% Fiscal Guidance $ in millions, except per share amounts Adjusted Non-GAAP Q2 Adjusted Non-GAAP Full-Year Sales EPS(b) $89-$92 $0.14-$0.17 $362-$368 $0.65-$0.71 Q1 2015 (b) YOY Growth *
Appendix
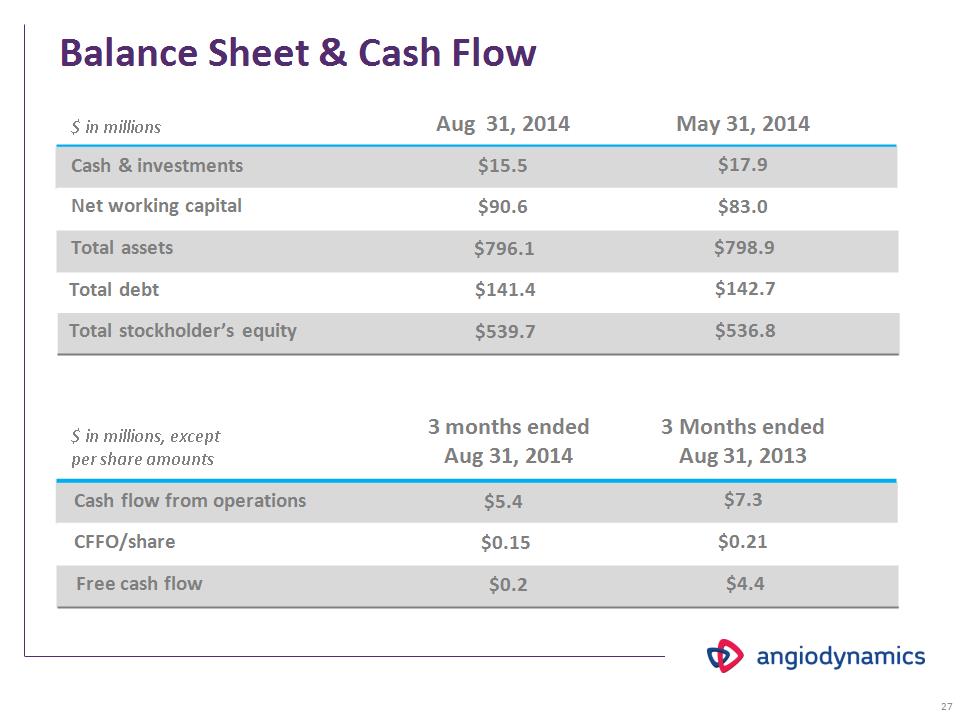
Balance Sheet & Cash Flow $ in millions Aug 31, 2014 May 31, 2014 Cash & investments $15.5 $17.9 Net working capital $90.6 $83.0 Total assets $796.1 $798.9 Total debt $141.4 $142.7 Total stockholder’s equity $539.7 $536.8 $ in millions, except per share amounts 3 months ended Aug 31, 2014 3 Months ended Aug 31, 2013 Cash flow from operations $5.4 $7.3 CFFO/share $0.15 $0.21 Free cash flow $0.2 $4.4 *
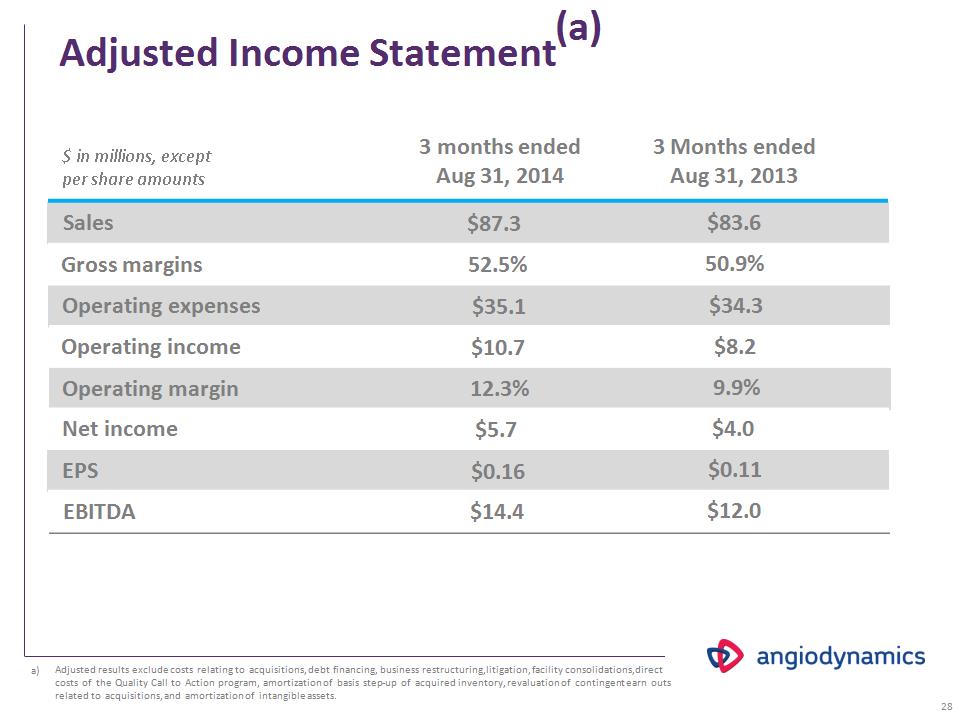
Adjusted Income Statement(a) $ in millions, except per share amounts 3 months ended Aug 31, 2014 3 Months ended Aug 31, 2013 Sales $87.3 $83.6 Gross margins 52.5% 50.9% Operating expenses $35.1 $34.3 Operating income $10.7 $8.2 Operating margin 12.3% 9.9% Net income $5.7 $4.0 EPS $0.16 $0.11 EBITDA $14.4 $12.0 Adjusted results exclude costs relating to acquisitions, debt financing, business restructuring, litigation, facility consolidations, direct costs of the Quality Call to Action program, amortization of basis step-up of acquired inventory, revaluation of contingent earn outs related to acquisitions, and amortization of intangible assets. *