Attached files
| file | filename |
|---|---|
| EX-23.5 - EX-23.5 - La Quinta Holdings Inc. | d785911dex235.htm |
| EX-23.6 - EX-23.6 - La Quinta Holdings Inc. | d785911dex236.htm |
| EX-23.2 - EX-23.2 - La Quinta Holdings Inc. | d785911dex232.htm |
| EX-23.3 - EX-23.3 - La Quinta Holdings Inc. | d785911dex233.htm |
| EX-1.1 - EX-1.1 - La Quinta Holdings Inc. | d785911dex11.htm |
| EX-23.4 - EX-23.4 - La Quinta Holdings Inc. | d785911dex234.htm |
Table of Contents
As filed with the Securities and Exchange Commission on November 17, 2014
Registration No. 333-199726
UNITED STATES
SECURITIES AND EXCHANGE COMMISSION
Washington, D.C. 20549
Amendment No. 1
to
FORM S-1
REGISTRATION STATEMENT
UNDER
THE SECURITIES ACT OF 1933
La Quinta Holdings Inc.
(Exact name of registrant as specified in its charter)
| Delaware | 7011 | 90-1032961 | ||
| (State or other jurisdiction of incorporation or organization) |
(Primary Standard Industrial Classification Code Number) |
(I.R.S. Employer Identification No.) |
909 Hidden Ridge, Suite 600
Irving, Texas 75038
(214) 492-6600
(Address, including zip code, and telephone number, including area code, of registrant’s principal executive offices)
Mark M. Chloupek
Executive Vice President, Secretary and General Counsel
909 Hidden Ridge, Suite 600
Irving, Texas 75038
(214) 492-6600
(Name, address, including zip code, and telephone number, including area code, of agent for service)
With copies to:
| Michael D. Nathan, Esq. Simpson Thacher & Bartlett LLP 425 Lexington Avenue New York, New York 10017 (212) 455-2000 |
Marc D. Jaffe, Esq. Cathy A. Birkeland, Esq. Latham & Watkins LLP 885 Third Avenue New York, New York 10022-4834 (212) 906-1200 |
Approximate date of commencement of proposed sale to the public: As soon as practicable after this Registration Statement is declared effective.
If any of the securities being registered on this Form are to be offered on a delayed or continuous basis pursuant to Rule 415 under the Securities Act of 1933, check the following box: ¨
If this Form is filed to register additional securities for an offering pursuant to Rule 462(b) under the Securities Act, please check the following box and list the Securities Act registration statement number of the earlier effective registration statement for the same offering. ¨
If this Form is a post-effective amendment filed pursuant to Rule 462(c) under the Securities Act, check the following box and list the Securities Act registration statement number of the earlier effective registration statement for the same offering. ¨
If this Form is a post-effective amendment filed pursuant to Rule 462(d) under the Securities Act, check the following box and list the Securities Act registration statement number of the earlier effective registration statement for the same offering. ¨
Indicate by check mark whether the registrant is a large accelerated filer, an accelerated filer, a non-accelerated filer, or a smaller reporting company. See the definitions of “large accelerated filer,” “accelerated filer” and “smaller reporting company” in Rule 12b-2 of the Exchange Act.
| Large accelerated filer | ¨ | Accelerated filer | ¨ | |||
| Non-accelerated filer | x (Do not check if a smaller reporting company) | Smaller reporting company | ¨ | |||
CALCULATION OF REGISTRATION FEE
|
| ||||||||
| Title of Each Class of Securities to be Registered |
Amount to be Registered |
Proposed Maximum Offering Price Per Share |
Proposed Maximum Aggregate |
Amount of Registration Fee | ||||
| Common Stock, par value $0.01 per share |
23,000,000(1) | $19.85(2) | $456,550,000 | $53,052(3) | ||||
|
| ||||||||
|
| ||||||||
| (1) | Includes 3,000,000 shares subject to the underwriters’ option to purchase additional shares. |
| (2) | Estimated solely for the purpose of calculating the amount of the registration fee pursuant to Rule 457(c) under the Securities Act of 1933, as amended. The price per share and aggregate offering price are based on the average of the high and low prices of the Registrant’s common stock on October 24, 2014, as reported on the New York Stock Exchange. |
| (3) | Previously paid. |
The Registrant hereby amends this Registration Statement on such date or dates as may be necessary to delay its effective date until the Registrant shall file a further amendment which specifically states that this Registration Statement shall thereafter become effective in accordance with Section 8(a) of the Securities Act of 1933, as amended, or until the Registration Statement shall become effective on such date as the Securities and Exchange Commission, acting pursuant to said Section 8(a), may determine.
Table of Contents
The information in this preliminary prospectus is not complete and may be changed. The selling stockholders may not sell these securities until the registration statement filed with the Securities and Exchange Commission is effective. This preliminary prospectus is not an offer to sell these securities and it is not soliciting an offer to buy these securities in any jurisdiction where the offer or sale is not permitted.
Subject to Completion. Dated November 17, 2014.
20,000,000 Shares

La Quinta Holdings Inc.
Common Stock
The selling stockholders identified in this prospectus are offering 20,000,000 shares of common stock of La Quinta Holdings Inc. We will not receive any of the proceeds from the sale of our common stock by the selling stockholders.
Our common stock is listed on the New York Stock Exchange (the “NYSE”) under the symbol “LQ.” The last reported sale price of our common stock on the NYSE on November 14, 2014 was $20.53 per share.
We are an “emerging growth company” as defined under the federal securities laws and, as such, may elect to comply with certain reduced public company reporting requirements for future filings. See “Prospectus summary—Implications of being an emerging growth company.”
See “Risk Factors” beginning on page 20 to read about factors you should consider before buying shares of our common stock.
Neither the Securities and Exchange Commission nor any other regulatory body has approved or disapproved of these securities or passed upon the accuracy or adequacy of this prospectus. Any representation to the contrary is a criminal offense.
| Per share | Total | |||||||
| Public offering price |
$ | $ | ||||||
| Underwriting discounts and commissions |
$ | $ | ||||||
| Proceeds, before expenses, to the selling stockholders |
$ | $ | ||||||
|
|
||||||||
To the extent that the underwriters sell more than 20,000,000 shares of common stock, the underwriters have the option to purchase up to an additional 3,000,000 shares of common stock from the selling stockholders at the public offering price less the underwriting discounts and commissions. The selling stockholders will receive all of the proceeds from the sale of any such additional shares to the underwriters.
The underwriters expect to deliver the shares against payment in New York, New York on , 2014.
| J.P. Morgan | Morgan Stanley |
| BofA Merrill Lynch | Citigroup | Credit Suisse | ||||
| Deutsche Bank Securities | Goldman, Sachs & Co. | Wells Fargo Securities | ||||
| EA Markets | Evercore ISI | JMP Securities | ||||
| Lebenthal Capital Markets | Loop Capital Markets | Mischler Financial Group, Inc | ||||
| Ramirez & Co., Inc. | Raymond James | RBC Capital Markets | Stifel | |||
Prospectus dated , 2014.
Table of Contents

Table of Contents

Table of Contents

Table of Contents
Prospectus
| Page | ||||
| i | ||||
| ii | ||||
| ii | ||||
| iii | ||||
| 1 | ||||
| 14 | ||||
| 15 | ||||
| 20 | ||||
| 55 | ||||
| 57 | ||||
| 58 | ||||
| 59 | ||||
| 60 | ||||
| 61 | ||||
| 71 | ||||
| MANAGEMENT’S DISCUSSION AND ANALYSIS OF FINANCIAL CONDITION AND RESULTS OF OPERATIONS |
74 | |||
| 116 | ||||
| 120 | ||||
| 140 | ||||
| 165 | ||||
| 168 | ||||
| 170 | ||||
| 174 | ||||
| 181 | ||||
| CERTAIN UNITED STATES FEDERAL INCOME AND ESTATE TAX CONSEQUENCES TO NON-U.S. HOLDERS |
184 | |||
| 188 | ||||
| 193 | ||||
| 193 | ||||
| 194 | ||||
| F-1 | ||||
Table of Contents
Neither we nor the selling stockholders have authorized anyone to provide any information or to make any representations other than those contained in this prospectus, any amendment or supplement to this prospectus or in any free writing prospectuses we have prepared. Neither we nor the selling stockholders take any responsibility for, or can provide any assurance as to the reliability of, any other information that others may give you. This prospectus is an offer to sell only the shares of common stock offered hereby, but only under circumstances and in jurisdictions where it is lawful to do so. The information contained in this prospectus is current only as of its date.
Table of Contents
Within this prospectus, we reference information and statistics regarding the hotel industry and various segments within such industry. We have obtained this information and statistics from various independent third-party sources, including independent industry publications, reports by market research firms and other independent sources. Smith Travel Research (“STR”) and PKF Hospitality Research, LLC (“PKF-HR”) are the primary sources for third-party market data and industry statistics and forecasts. STR does not guarantee the performance of any company about which it collects and provides data. Nothing in the STR or PKF-HR data should be construed as advice. We have also obtained information from surveys conducted by Temkin Group (“Temkin”) and Forrester Research, Inc. Some data and other information are also based on our good faith estimates, which are derived from our review of internal surveys and independent sources. We believe that these external sources and estimates are reliable, but have not independently verified them.
RevPAR Index, which measures a hotel’s fair market share of its competitive set’s revenue per available room, is stated as a percentage and is calculated for a hotel by comparing the hotel’s RevPAR to the aggregate RevPAR of a group of competing hotels generally in the same market (referred to as a “competitive set”); and when presented for a group of hotels is a weighted average of the individual hotel results. The manager for each of our owned hotels and each franchisee exercises discretion, subject to adherence to certain guidelines published by STR and described below and to review by La Quinta management to ensure system-wide consistency, in identifying the competitive set of properties for each such hotel. They consider such factors as physical proximity, competition for similar customers, services and amenities, quality and average daily rate, with location being the most significant factor. Competitive set makeup is initially determined when a new hotel enters our system and is reviewed for continuing appropriateness as non-La Quinta hotels enter and leave our markets. Each La Quinta hotel’s competitive set complies with the following four STR published guidelines, each of which places limitations on properties that may be included in a competitive set: (1) each competitive set must include a minimum of three participating properties, in addition to the subject property; (2) no single property or brand can account for more than 40% of the total participating room supply of a competitive set, excluding the rooms of the subject property; (3) no single company can account for more than 60% of the total participating room supply of a competitive set, excluding the rooms of the subject property; and (4) each competitive set must include a minimum of two companies other than that of the subject property. We may include certain competitors in a hotel property’s competitive set and those competitors may or may not include our hotel in their competitive set. We provide, for each La Quinta hotel, our proposed competitive set to STR for publication. STR confirms that each proposed competitive set complies with their published guidelines and then uses that information, along with ADR and RevPAR for each such hotel (which ADR and RevPAR may be calculated differently than we or our competitors do for internal purposes) to calculate RevPAR Index. STR calculates RevPAR Index for the current period and prior periods based on the competitive sets existing as of the date of the STR report for the current period of such report. Accordingly, our future filings may disclose historical RevPAR Index for prior periods that differ from those disclosed in this prospectus. In addition, within this prospectus, RevPAR Index disclosed in “Management’s discussion and analysis of financial condition and results of operations” is calculated by STR based on our competitive set of hotels existing as of September 30, 2014, whereas, elsewhere in this prospectus, RevPAR Index is calculated by STR based on our competitive set of hotels existing as of December 31, 2013.
i
Table of Contents
Trademarks, service marks and trade names
We own or have rights to use a number of registered and common law trademarks, service marks and trade names in connection with our business in the United States and/or in certain foreign jurisdictions, including, but not limited to, “La Quinta,” “La Quinta Inn,” “La Quinta Inn & Suites,” “LQ Instant Hold,” “LQ,” “LQ Hotel” and “Returns.”
Solely for convenience, the trademarks, service marks, logos and trade names referred to in this prospectus are without the ® and ™ symbols, but such references are not intended to indicate, in any way, that we will not assert, to the fullest extent under applicable law, our rights or the rights of the applicable licensors to these trademarks, service marks and trade names. This prospectus contains additional trademarks, service marks and trade names of others, which are the property of their respective owners. All trademarks, service marks and trade names appearing in this prospectus are, to our knowledge, the property of their respective owners.
On April 14, 2014, La Quinta Holdings, Inc. completed its initial public offering (the “IPO”), in which we issued and sold approximately 44.0 million shares of common stock at an IPO price of $17.00 per share. Prior to the IPO, we completed the Pre-IPO Transactions (as defined in “Prospectus summary—Our corporate structure”), which restructured and reorganized our existing business. Unless otherwise indicated or the context otherwise requires, all information in this prospectus reflects the consummation of the Pre-IPO Transactions and references in this prospectus to “we,” “our,” “us” and the “Company” refer to La Quinta Holdings Inc. and its consolidated subsidiaries, and references to “La Quinta Holdings Inc.” and the “Issuer” refer only to La Quinta Holdings Inc. exclusive of its subsidiaries.
As of December 31, 2013, four of our La Quinta-branded hotels were designated as assets held for sale and the results of their operations together with the operations of the 29 hotels sold during 2013, have been classified as discontinued operations (collectively, the “Hotels Designated for Sale”). Sales of these four hotels closed in February 2014.
Presentation of historical non-financial data and pro forma financial information. Unless otherwise indicated or the context otherwise requires, (i) operating and other non-financial data, including number of hotels and related data, disclosed in the sections of this prospectus other than the Financial Statement Sections (as defined below) and (ii) pro forma financial information in this prospectus:
| • | reflects the combined and consolidated business and operations of the entities owned by the Company at the completion of the IPO and previously under common control or otherwise consolidated for financial reporting purposes and their consolidated subsidiaries (the “Predecessor Entities”); |
| • | includes the 14 La Quinta hotels managed by the Predecessor Entities (the “Previously Managed Portfolio”) as owned hotels, which were acquired by the Predecessor Entities at the time of the IPO (see “Prospectus summary—Our corporate structure”); |
| • | includes the Hotels Designated for Sale (with the Hotels Designated for Sale treated as discontinued operations in the pro forma financial information); and |
ii
Table of Contents
| • | excludes 11 Baymont-branded hotels (the “Baymont Hotels”) which we sold on August 8, 2013 (with the Baymont Hotels treated as discontinued operations in the pro forma financial information). |
Presentation of combined financial information and certain other non-financial data. Unless otherwise indicated, or the context otherwise requires, for periods prior to the completion of the IPO, (i) the historical financial data (excluding all pro forma financial data) in this prospectus and (ii) the operating and other non-financial data (but excluding all related data prepared on a pro forma basis), including number of hotels and related data, disclosed in “Summary historical combined financial data,” “Selected financial and other data” and “Management’s discussion and analysis of financial condition and results of operations” (collectively, the “Financial Statement Sections”):
| • | reflects the combined and consolidated business and operations of the Predecessor Entities; |
| • | treats the Previously Managed Portfolio as franchised and managed hotels; |
| • | excludes the Hotels Designated for Sale (other than as discontinued operations); and |
| • | excludes the Baymont Hotels (other than as discontinued operations). |
Except where the context requires otherwise, the information in this prospectus assumes no exercise by the underwriters of their option to purchase up to an additional 3,000,000 shares of common stock from the selling stockholders.
The following are definitions of certain terms used in this prospectus:
| • | “ADR” or “average daily rate” means hotel room revenues divided by total number of rooms sold in a given period; |
| • | “Blackstone” or “our Sponsor” means The Blackstone Group L.P. and its affiliates; |
| • | “CAGR” means compound annual growth rate; |
| • | “Comfort” refers to Comfort Inns and Comfort Suites collectively; |
| • | “comparable hotels” means hotels that: (i) were active and operating in our system for at least one full calendar year as of the end of the applicable period and were active and operating as of January 1st of the previous year; and (ii) have not sustained substantial property damage, business interruption or for which comparable results are not available. Management uses comparable hotels as the basis upon which to evaluate ADR, occupancy, RevPAR and RevPAR Index on a system-wide basis and for each of our reportable segments; |
| • | “franchised hotels” refers to La Quinta-branded hotels which are owned and operated by franchisees under franchise agreements with us; |
| • | “Hampton” refers to Hampton Inns and Hampton Inn & Suites collectively; |
| • | “main STR competitive set” refers to Comfort, Holiday Inn Express and/or Hampton, the brands most often included in our STR competitive sets; |
iii
Table of Contents
| • | “occupancy” means the total number of rooms sold in a given period divided by the total number of rooms available at a hotel or group of hotels; |
| • | “owned hotels” and “owned portfolio” refer to our hotels located on properties in which we have an ownership interest or leasehold interest; |
| • | “pipeline” means our portfolio of future La Quinta-branded hotels, each of which is represented by an executed franchise agreement; |
| • | “pre-IPO owners” refers to Blackstone and the members of our management and consultants that owned, directly or indirectly, interests in the Predecessor Entities; |
| • | “RevPAR” or “revenue per available room” means the product of the ADR charged and the average daily occupancy achieved; |
| • | “RevPAR Index” measures a hotel’s fair market share of its competitive set’s revenue per available room. See “Market and industry data”; |
| • | “system-wide” refers collectively to our owned, franchised and managed hotel portfolios; |
| • | “team members” refers to our employees at our owned hotels and the employees of our franchisees at our franchised hotels; |
| • | “Temkin Experience Ratings” means the annual ranking by Temkin of U.S. companies in terms of customer experience based on a survey of approximately 10,000 U.S. customers regarding their recent interactions with such companies; and |
| • | “U.S. defined market tracts” refers to the 629 geographic areas or locations in the United States, compiled by STR, each of which is a subset of a geographic market. |
iv
Table of Contents
This summary highlights certain significant aspects of our business and this offering. This is a summary of information contained elsewhere in this prospectus, is not complete and does not contain all of the information that you should consider before making your investment decision. You should carefully read the entire prospectus, including the information presented under the section entitled “Risk factors” and the combined financial statements and the notes thereto, before making an investment decision. This summary contains forward-looking statements that involve risks and uncertainties. Our actual results may differ significantly from future results contemplated in the forward-looking statements as a result of certain factors such as those set forth in “Risk factors” and “Special note regarding forward-looking statements.” When making an investment decision, you should also read the discussion under “Basis of presentation” above for the definition of certain terms used in this prospectus and a description of certain transactions and other matters described in this prospectus.
Company overview
We are a leading owner, operator and franchisor of select-service hotels primarily serving the midscale and upper-midscale segments under the La Quinta brand. Based on data provided by STR, La Quinta is the fastest growing principal select-service hotel brand in the United States primarily serving these segments in terms of percentage growth of number of hotels over the last ten years ended December 31, 2013, growing our total number of hotels from 362 in 2003 to 854 as of September 30, 2014, significantly outpacing the percentage growth of hotels franchised, owned and operated by Comfort, Holiday Inn Express and Hampton, the hotel brands one or more of which is most often included in the competitive sets we determine for STR, subject to STR’s guidelines, which we refer to as our “main STR competitive set.” Our system-wide portfolio, as of September 30, 2014, consisted of 854 hotels representing approximately 85,500 rooms located predominantly across 47 U.S. states, as well as in Canada and Mexico, of which 353 hotels were owned and operated and 501 were franchised. We also have a pipeline of 196 franchised hotels as of September 30, 2014, to be located in the United States, Mexico, Canada, Colombia, Honduras, Nicaragua and Guatemala (83% of which represents new construction as opposed to the conversion of an existing hotel).
1
Table of Contents
The following tables illustrate the growth in number of our owned and franchised hotels from 2003 to September 30, 2014.
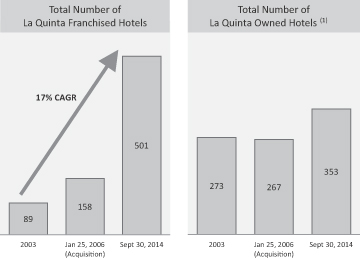
| (1) | Certain of our owned hotels were previously operated by us as non-La Quinta hotels and are not included in this table until such time as they were converted to La Quinta-branded hotels. From the Acquisition, as defined below, through September 30, 2014 and primarily in 2006, we converted 128 hotels. |
We primarily derive our revenues from owned hotel operations and fees generated from franchised and managed hotels. On a pro forma basis, for the year ended December 31, 2013, we generated total revenue of $909.1 million, Adjusted EBITDA of $340.2 million and net income from continuing operations of $39.7 million. On a pro forma basis, for the nine months ended September 30, 2014, we generated total revenue of $760.6 million, Adjusted EBITDA of $295.9 million and net income from continuing operations of $46.3 million. For a reconciliation of Adjusted EBITDA, see “Summary historical combined financial data.”
We are focused on providing clean and comfortable guest rooms at affordable prices in convenient locations. When STR’s price points by segment are applied to each of our hotels, approximately 31% would be considered upper-midscale, approximately 53% would be considered midscale, approximately 6% (principally our owned hotels) would be considered economy and the balance would be considered in the segments above upper-midscale. Our hotels have fewer costly services and amenities than full-service hotels, which we believe results in a highly efficient hotel-level cost structure. Our hotels typically include common areas with amenities such as a great room (including breakfast seating area, lobby with seating area and business center), swimming pool and vending areas and generally offer a complimentary breakfast. As of September 30, 2014, the hotels in our system consisted of 593 La Quinta Inn & Suites, which include guest suites and generally are our newer hotels with interior corridors, and 261 La Quinta Inns, 140 of which include interior corridors. Our guest mix includes both business and leisure travelers.
La Quinta was founded in San Antonio, Texas in 1968 and has a 46-year history of owning and operating hotels and, from 1973 to January 2006, we operated through our predecessors as a
2
Table of Contents
public company. In January 2006, we were acquired by Blackstone (the “Acquisition”), who identified a strategic repositioning opportunity to improve the quality and performance of our owned portfolio, narrow the RevPar Index gap between us and our main STR competitive set and accelerate growth in our franchise business. RevPAR Index measures a hotel’s fair market share of its competitive set’s revenue per available room and is calculated by comparing the hotel’s RevPAR to the aggregate RevPAR of a group of competing hotels generally in the same market.
Our strategic repositioning plan included:
| • | assembling a management team led by lodging industry and La Quinta veteran Wayne Goldberg; |
| • | investing capital into our owned real estate, brand and technology infrastructure; |
| • | prioritizing the growth of our franchise business and dedicating resources to existing and new domestic franchise markets; |
| • | establishing a franchising infrastructure in Mexico and Central America; |
| • | increasing the focus on operating efficiencies and revenue management within our owned portfolio; |
| • | consolidating operations around the La Quinta brand; and |
| • | increasing the marketing spend with a focus on differentiating the La Quinta brand and growing our loyalty program. |
In connection with our strategic repositioning plan from the Acquisition through September 30, 2014, we have expanded our franchise system by approximately three times, growing from 158 franchised hotels to 501 franchised hotels, with an additional 196 hotels in our pipeline. Based on historical experience, converted hotels in our pipeline can generally become operational between 12 to 18 months from the date of execution of the franchise agreement, and newly constructed hotels in our pipeline can generally become operational between 36 to 48 months from the date of execution of the franchise agreement. Openings may be delayed, or franchises canceled, for a number of factors, including economic conditions, weather and construction delays, and certain of our pipeline properties may not become operational. Additionally, because revenues from franchised hotels are principally derived from franchise fees rather than room rentals, as we grow our system by increasing the number of franchised hotels, our revenues and expenses will increase at a significantly slower rate than if we were growing our system through an increase in number of owned hotels.
Additionally, over the period from 2007 through December 31, 2013, we have:
| • | invested a total of $759 million in capital, $310 million of which we consider repositioning capital which was invested to increase our RevPAR Index. Repositioning capital investments included $148 million for improvements across our owned hotel portfolio, including acceleration of some aspects of cycle renovations and $45 million for upgrades to our technology infrastructure. Repositioning capital also included over $74 million expended to |
3
Table of Contents
| upgrade the non-La Quinta hotels we converted to La Quinta-branded hotels after the Acquisition and $42 million to develop our flagship downtown Chicago property; |
| • | after experiencing a decrease in RevPAR Index of 340 basis points from 2006 to 2007, principally due to the conversion over that period of 128 non-La Quinta hotels to La Quinta-branded hotels, increased our system-wide RevPAR Index by 990 basis points to 98.5% over the annual periods from 2007 through December 31, 2013, based on the STR competitive set of hotels existing as of December 31, 2013; |
| • | sold (or are holding for sale) 33 La Quinta hotels, the effect of which was to improve our system-wide RevPAR and guest satisfaction scores for our remaining portfolio; |
| • | increased membership in our La Quinta Returns loyalty program by 143% from 3.7 million to over nine million members; and |
| • | improved guest satisfaction scores and we ranked #2 among the 15 and 18 hotel chains included, respectively, in the 2013 and 2014 Temkin Experience Ratings. |
Additionally, following the industry-wide economic downturn that began in 2008, our operating performance has improved significantly over the past four fiscal years, during the strong lodging industry recovery that industry analysts believe will continue for the next several years. Specifically, we have:
| • | increased our ADR 14.5% from $69.38 to $79.46 for the year ended December 31, 2013 compared to the year ended December 31, 2010; |
| • | increased our RevPAR 26.3% from $40.49 to $51.14 for the year ended December 31, 2013 compared to the year ended December 31, 2010; and |
| • | realized Adjusted EBITDA growth (including the Previously Managed Portfolio as franchised and managed hotels) of 42.1% for the twelve months ended December 31, 2013 compared to the twelve months ended December 31, 2010. |
Although we believe we have been successful in implementing our strategic repositioning plan, we believe there remains significant opportunity for future growth:
| • | There remains a meaningful ADR differential between us and the hotels in our main STR competitive sets, which we believe we can continue to decrease over time. We estimate that in 2013, each $1 increase in ADR across our owned portfolio would have increased our pro forma Adjusted EBITDA for our owned hotels by approximately $11 million, assuming all other variables remain constant. |
| • | Our 2013 Adjusted EBITDA and Adjusted EBITDA margins for our owned portfolio remain below comparable 2008 metrics which we believe represents significant capacity for future organic growth at our hotels. |
| • | We remain approximately half the size of the hotel brands in our main STR competitive set in terms of number of hotels in the United States, which we believe provides for significant future expansion opportunity. |
4
Table of Contents
Our competitive strengths
We are driven by our core values and principles that we believe drive a high level of employee and guest engagement. Together with these core values and principles, we believe that the following competitive strengths position us to execute on our business plan and growth strategies.
| • | Scalable and efficient business model with attractive cash flow characteristics. Our hotel product offering is efficient, replicable and supported by a scalable operational, technological and administrative platform. In 2013, over 98% of our owned hotel revenue was derived solely from room rentals, as compared to 63% for full-service hotels, according to STR, and our operating margins in 2013 were 47% as compared to operating margins in 2013 of 32% for full-service hotels (which reflects the most current available information). As a select-service hotel brand, our hotels require fewer costly services, amenities and capital expenditures than full-service hotels, resulting in what we believe to be a highly efficient hotel-level cost structure, strong Adjusted EBITDA margins and stable cash flows. Even during the height of the recent economic downturn in 2009, our Adjusted EBITDA margins remained above 32% as compared to approximately 20% for full-service hotels, based on data provided by STR. In addition, our model enables us to manage corporate overhead expenses even though the number of our hotels, particularly the number of our franchised hotels, has increased substantially. |
| • | Established and rapidly growing franchise business. Since 2003, we have grown our total number of franchised hotels from 89 in 2003 to 501 as of September 30, 2014, achieving a franchise compounded annual growth rate of 17%. Our franchise business requires little or no capital investment by us (which we refer to as “capital light”), and has substantial scale and an established infrastructure that we believe positions us to achieve meaningful franchise growth as development capital for franchisees continues to become more available. The hotels in our franchised portfolio have an average age of 13 years, with 33% of our franchised portfolio being in our system less than 5 years. Despite the strong decade of growth, we are still less than half the size of our main STR competitive set, allowing room for continued aggressive franchise growth in a number of under-penetrated U.S. markets. As of September 30, 2014, we have a large pipeline of 196 franchised hotels (of which 83% are new construction), each represented by an executed franchise agreement, which upon completion would represent a 39% expansion of our total existing franchise system. Given our founding and significant presence in Texas, our presence in the U.S. southern border states and our established brand history with travelers from this region, we believe La Quinta has significant brand awareness in Mexico and believe Mexico, Central America and South America provide opportunities for significant franchise growth internationally where we have laid the foundation for expansion. In Central and South America, we will build on this awareness of the La Quinta brand by emphasizing the associated “LQ” registered marks to identify La Quinta hotels in certain markets. Additionally, as our franchise business continues to grow, we expect cash flow from this segment will comprise a higher percentage of our total cash flow. Given that the average remaining term of our existing franchise contracts is approximately 13 years, we believe that our existing franchisees provide a long-term stable income stream. Moreover, we anticipate our franchise revenues will grow over time as new franchise agreements and renewals of existing franchise agreements are executed at our newly published rates, which include a 4.5% royalty fee, which is higher than the 4.0% royalty fee generally applicable to our franchise agreements entered into prior to April 2013. |
5
Table of Contents
| • | Widely recognized and differentiated brand. We own, operate and franchise all of our hotels under a single brand, La Quinta, a highly recognizable brand in the select-service market, established over a 46-year history. We also ranked #2 among the 15 and 18 hotel chains included, respectively, in the 2013 and 2014 Temkin Experience Ratings. Additionally, we have a loyal base of customers and a growing loyalty program, La Quinta Returns, with approximately ten million members as of September 30, 2014. We believe the capital investments we have made to upgrade and reposition our brand and hotel experience have helped to improve our brand awareness, brand perception, guest loyalty and guest experience. Our improved guest experience, brand perception and growing loyalty have contributed to consistent market share increases as reflected by our RevPAR Index growth. We believe that the demonstrated strength of our brand and loyal customer base drive revenues for our existing owned and franchised hotels and also makes us attractive to new franchisees. |
| • | Owner and operator business model promotes alignment with our franchisees. Our position as an owner and operator of La Quinta-branded hotels creates an alignment of economic objectives with our franchisees, which we believe is a differentiating factor among our competitors. We are focused on delivering value to our guests, which generates repeat stays and increases guest loyalty. Delivering value combined with the benefits of an increasing market presence through our growth in the number of hotels has strengthened our brand. We believe this focus and the powerful alignment with our franchisees drive strong operating results and financial returns which benefit both us and our franchisees and will continue to benefit and grow our business in the future. We have an active advisory Brand Council that includes both Company and franchisee representation and meets three to four times a year to discuss ways to strengthen our brand. Through the Brand Council, we often test new concepts at both owned and franchised hotels, which we believe promotes collaboration between us and our franchisees. We believe our model incentivizes franchisees to invest in growing the La Quinta brand through additional capital investment into existing franchised hotels and through the development of new La Quinta hotels. |
| • | Highly experienced and successful management team. Our management team has extensive experience in hospitality, consumer-facing and brand-based companies, with a proven track record for delivering strong results. Our executive management team has an average industry tenure of 19 years, including Wayne Goldberg with more than 35 years of select-service experience, Rajiv Trivedi, our Chief Development Officer, with 24 years of industry experience and Angelo Lombardi, our Chief Operating Officer, with 25 years of industry experience. In addition, Keith Cline, our Chief Financial Officer, who joined our executive management team in January 2013, brings over 22 years of finance, accounting and brand experience, including over 13 years of public company experience. Management has developed a culture of strong collaboration and teamwork that runs throughout the organization and has contributed to La Quinta’s successful performance. |
Our strategies
The following are key elements of our strategy to become the preferred select-service brand for our guests and franchise partners.
| • | Take advantage of our significant capital investment to optimize the performance of our owned hotels. We will continue to focus on maximizing revenues and managing costs at each |
6
Table of Contents
| of our owned hotels where we have updated our guest rooms to generally include a 32” flat panel high definition television, pillow-top mattresses, a large work desk with an ergonomic “task” chair, high speed internet access, a coffee maker, high-flow shower heads and curved shower rods. As of September 30, 2014, we had 353 owned hotels, representing 41% of our system-wide units and 53% of our system-wide rooms. We intend to drive revenue growth by employing our active revenue management strategies and increasing our ADR, share of hotel stays by return guests, membership in our Returns program, overall brand awareness and volume of our corporate guests. There is currently a meaningful ADR differential between us and the hotels in our main STR competitive sets. We believe the significant amount of capital we have spent since 2007 to reposition and improve the brand and the quality of our hotels, the growth in the number of hotel units in our system and the resulting increased brand awareness will allow us to continue to increase ADR. We estimate that in 2013 each $1 increase in ADR across our owned portfolio would have increased our pro forma Adjusted EBITDA for our owned hotels by approximately $11 million, assuming all other variables remained constant. We further expect to continue to enhance the profitability of our owned hotels by maximizing cost efficiencies through disciplined cost control and focusing on operational enhancements. |
| • | Continue to aggressively grow our capital light franchise business both domestically and internationally. A primary element of our growth strategy is to continue to grow the number of units in our higher margin, scalable franchise fee-based business. As of September 30, 2014, we had 501 franchised hotels, representing 59% of our system-wide units and 47% of our system-wide rooms. Additionally, we have a large pipeline of 196 franchised hotels, 83% of which represents new construction, rather than the conversion of an existing hotel. We believe that there remains meaningful opportunity for continued growth in the United States, with La Quinta under-penetrated in many of the markets served by our main STR competitive set, including the Northeast and Northwest. For example as of September 30, 2014, we are represented in 64% of the 629 U.S. defined market tracts and have an average 2.08 hotels in such represented markets, whereas the hotel brands of our main STR competitive set are represented in over 93% of such market tracts and have an average 3.21 hotels in our represented markets. In addition, our pipeline includes hotels in 33 additional market tracts, which represents new distribution for our brand. We also intend to add new domestic franchised hotels in highly populated urban locations to serve a wider group of guests and increase brand awareness. We believe the opportunity for franchise growth in Mexico, Central America and South America under the “La Quinta,” “LQ,” “LQ Hotel” and other similar marks is significant given our existing infrastructure, established brand history with travelers from these regions and our presence in the U.S. southern border states and Mexico. We have dedicated franchise and sales personnel who are focused exclusively on our franchise operations in these regions. As of September 30, 2014, we had 25 hotels either open or in the pipeline and continue to explore other franchise opportunities in these international markets. |
| • | Continue to increase La Quinta brand awareness. We will continue to invest in marketing and brand building in order to increase awareness and differentiation of the La Quinta brand to improve hotel performance in our owned and franchised hotels and attract new La Quinta franchisees. We are able to concentrate our marketing and advertising efforts under a single brand rather than spreading them across multiple brands, which we believe enhances our ability to raise awareness of La Quinta hotels. Our owned and franchised hotels contribute |
7
Table of Contents
| 2.5% of gross room revenues to our Brand Marketing Fund (“BMF”) to support our marketing and build the brand and, from 2007 to 2013, total annual contributions to our BMF have grown 27% to $38.9 million, and, for the year ended December 31, 2013, 47% of contributions to the BMF, or $18.1 million, were funded by our franchisees. We expect amounts available in the BMF and the percentage of such amounts contributed by our franchisees to continue to grow as the number of hotels in the La Quinta system grows and the performance of our hotels continues to improve. We will seek to continue to expand existing relationships and develop new relationships with franchise owners who demonstrate an ability to provide an excellent guest experience and maintain our brand standards, and who can broaden our reach into existing and under penetrated markets. We will continue to focus on growing our loyal customer base by increasing the membership in La Quinta Returns, our loyalty program designed to increase stays and raise market share. Our approximately ten million La Quinta Returns members as of September 30, 2014 (representing growth of 176% in membership since January 1, 2008) generated 47% of room revenues at our owned and franchised hotels for the year ended December 31, 2013 (representing a 108% increase in room revenue contribution at owned and franchised hotels since 2008). In 2011, we introduced our “Taking Care of Business” national advertising campaign, featuring points of differentiation and the role of people and service in delighting our guests with our “Here For You” branded guest experience. We will continue to test media, technology, social platforms and email campaigns to find new ways to strengthen our brand. |
| • | Expand distribution channels and grow corporate accounts. In 2013, revenues from bookings made through our website increased by 8%, while total electronic distribution revenues increased 17%, each as compared to the year ended December 31, 2012. In addition, in 2012, we launched a new mobile site and introduced our new LQ Instant Hold feature (patent pending), which permits our guests to use a mobile application to hold a room for up to 4 hours from any smart device by just entering a phone number. We will continue to develop our online and mobile channels in an effort to use lower cost, proprietary distribution channels. We will also seek to grow our market share by establishing new online relationships as new technologies and platforms are introduced. La Quinta is also well recognized in the corporate community and, for the year ended December 31, 2013, corporate accounts, including government and military accounts, generated 25% of room revenue at our owned and franchised hotels. We will seek to increase room revenues from corporate accounts, as we believe such accounts are associated with more consistent demand and longer stays. |
Our industry—the select-service segment
Select-service hotels generally serve the midscale and upper-midscale chain segments as defined by STR. Select-service hotels typically have fewer costly services and amenities than full-service hotels, which results in a highly efficient hotel-level cost structure. Select-service hotels typically have limited food and beverage outlets and do not offer comprehensive business or banquet facilities. Hotels in the midscale segment had an average ADR of $76.33 in 2013, and hotels in the upper-midscale segment had an average ADR of $100.29 in 2013. As of September 30, 2014, the midscale and upper-midscale segments collectively represent 1,357,292 rooms, or 27.3% of the overall U.S. lodging industry.
The midscale and upper-midscale segments tend to follow the cyclicality of the overall lodging industry and have also improved with the economic recovery in recent years. According to data
8
Table of Contents
provided by STR for the lodging industry, demand for the U.S. midscale and upper-midscale segments has improved, experiencing a CAGR of 3.3% over the three years ended December 31, 2013, while U.S. midscale and upper-midscale supply has grown at a CAGR of 0.1%. This recent demand growth has exceeded the CAGR of 1.4% over the ten years ended December 31, 2013, while supply growth has trended lower than the CAGR of 0.9% over the ten years ended December 31, 2013. We believe this positive imbalance between demand growth and supply growth, together with the economic recovery, has contributed to a RevPAR CAGR of 6.4% over the three years ended December 31, 2013, well above the CAGR of 3.4% over the ten years ended December 31, 2013. We believe that the fundamentals of the U.S. lodging industry in the midscale and upper-midscale segments will yield strong industry segment performance and support the growth of our business. According to PKF-HR, U.S. midscale and upper-midscale segment RevPAR is expected to increase 7.9% and 8.1%, respectively, in 2014 and 5.9% and 5.1%, respectively, in 2015.
For a further discussion of our industry, see “Industry.”
Investment risks
An investment in shares of our common stock involves substantial risks and uncertainties that may adversely affect our business, financial condition and results of operations and cash flows. Some of the more significant challenges and risks relating to an investment in our Company include, among other things, the following:
| • | We are subject to the business, financial and operating risks inherent to the hospitality industry, any of which could reduce profits and limit opportunities for growth. |
| • | Macroeconomic and other factors beyond our control can adversely affect and reduce demand for rooms at hotels that we own or franchise. |
| • | Contraction in the global economy or low levels of economic growth could adversely affect our revenues and profitability as well as limit or slow our future growth. |
| • | Because we operate in a highly competitive industry, our revenues or profits could be harmed if we are unable to compete effectively. |
| • | Any deterioration in the quality or reputation of our brand could have an adverse impact on our reputation, business, financial condition or results of operations. |
| • | Some of our existing development pipeline may not be developed into La Quinta hotels, which could adversely affect our growth prospects. |
| • | Our hotels are geographically concentrated, with 25% of our hotel rooms and 31% of our pipeline properties located in Texas, which exposes our business to the effects of regional events and occurrences. |
| • | Our efforts to renovate, redevelop or develop our hotels could be delayed or become more expensive, which could reduce profits or impair our ability to compete effectively. |
| • | The hotels in our owned portfolio have an average age of 27 years, and the hotels in our franchise portfolio have an average age of 13 years. Our business is capital intensive and our failure or the failure of our franchises to make necessary investments could adversely affect the quality and reputation of our brand. |
9
Table of Contents
| • | The hospitality industry is subject to seasonal and cyclical volatility, which may contribute to fluctuations in our financial condition and results of operations. |
| • | If our franchisees are unable to access the capital necessary to implement plans for growth, including our existing pipeline, our revenues may be reduced and our ability to compete effectively may be diminished. |
| • | If we are unable to maintain good relationships with our franchisees, revenues could decrease and we may be unable to expand our presence. |
| • | Franchise agreement standards are important to protecting our brand reputation and perception, and if our franchisees fail to make investments necessary to maintain or improve their hotels, guest preference for the La Quinta brand and reputation could suffer or the franchise agreements with those parties could terminate. |
| • | If our franchisees are unable to repay or refinance loans secured by the mortgaged hotels, our revenues, profits and capital resources could be reduced and our business could be harmed. |
| • | We are exposed to the risks resulting from significant investments in owned real estate, which could increase our costs, reduce our profits and limit our ability to respond to market conditions. |
| • | Changes in local market or neighborhood conditions may diminish the value of real property. |
| • | Failure to keep pace with developments in technology could adversely affect our operations or competitive position. |
| • | Failures in, material damage to, or interruptions in our information technology systems, software or websites, including as a result of cyber-attacks, and difficulties in updating our existing software or developing or implementing new software could have a material adverse effect on our business or results of operations. |
| • | We may be exposed to risks and costs associated with protecting the integrity and security of our guests’ personal information. |
| • | Any failure to protect our trademarks and other intellectual property could reduce the value of our brand and harm our business. |
| • | The loss of senior executives or key field personnel could significantly harm our business. |
| • | As of September 30, 2014, our total indebtedness was approximately $1.9 billion. Our substantial indebtedness could adversely affect our financial condition, our ability to raise additional capital to fund our operations, our ability to operate our business, our ability to react to changes in the economy or our industry and our ability to pay our debts. Our substantial indebtedness could also expose us to interest rate risk to the extent of our variable debt and divert our cash flow from operations to make debt payments. |
| • | Following this offering, our Sponsor will beneficially own approximately 47.5% of our common stock (or 45.2% if the underwriters exercise in full their option to purchase additional shares), and their interests may conflict with ours or yours in the future. |
| • | Future issuances of common stock by us, and the availability for resale of shares held by our pre-IPO owners may depress the price of our common stock. |
10
Table of Contents
Please see “Risk factors” for a discussion of these and other factors you should consider before making an investment in shares of our common stock.
Implications of being an emerging growth company
As a company with less than $1.0 billion in revenue during our most recently completed fiscal year, we qualify as an “emerging growth company” as defined in Section 2(a) of the Securities Act of 1933, as amended (the “Securities Act”), as modified by the Jumpstart Our Business Startups Act of 2012 (the “JOBS Act”). As an emerging growth company, we may take advantage of specified reduced disclosure and other requirements that are otherwise applicable generally to public companies that are not emerging growth companies. These provisions include:
| • | reduced disclosure about our executive compensation arrangements; |
| • | no non-binding shareholder advisory votes on executive compensation or golden parachute arrangements; and |
| • | exemption from the auditor attestation requirement in the assessment of our internal control over financial reporting. |
We may take advantage of these exemptions for up to five years or such earlier time that we are no longer an emerging growth company. We will cease to be an emerging growth company upon the earliest of: (i) the end of the fiscal year following the fifth anniversary of the IPO; (ii) the first fiscal year after our annual gross revenues are $1.0 billion or more; (iii) the date on which we have, during the previous three-year period, issued more than $1.0 billion in non-convertible debt securities; or (iv) the end of any fiscal year in which the market value of our common stock held by non-affiliates exceeded $700 million as of the end of the second quarter of that fiscal year. As of June 30, 2014, the market value of our common stock held by non-affiliates exceeded $700 million. As such, as of December 31, 2014, we will no longer qualify as an emerging growth company.
We have taken advantage of reduced disclosure regarding executive compensation arrangements in this prospectus, and we may choose to take advantage of some but not all of these reduced disclosure obligations in future filings while we remain an emerging growth company. If we do, the information that we provide stockholders may be different than you might get from other public companies in which you hold stock.
The JOBS Act permits an emerging growth company such as us to take advantage of an extended transition period to comply with new or revised accounting standards applicable to public companies. We have chosen to “opt out” of this provision and, as a result, we will comply with new or revised accounting standards as required when they are adopted. This decision to opt out of the extended transition period under the JOBS Act is irrevocable.
Our corporate structure
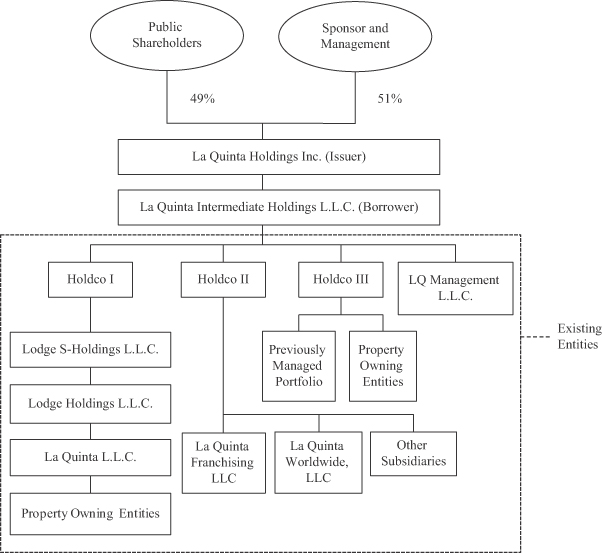
Our business prior to the IPO was conducted, and our hotel properties were owned, through multiple entities (including the Predecessor Entities and entities that own the Previously Managed Portfolio, collectively, the “Existing Entities”). To effectuate the IPO, we effected a series of transactions that resulted in a reorganization of our business (the “Pre-IPO Transactions”) . Specifically, (i) Holdco III purchased the Previously Managed Portfolio, (ii) the
11
Table of Contents
equity interests in Holdco I, Holdco II and Holdco III (the “Holdcos”) held by the pre-IPO owners were exchanged by the pre-IPO owners for shares of common stock of the Issuer, (iii) LQ Management L.L.C. was sold to our wholly-owned subsidiary, La Quinta Intermediate Holdings L.L.C., for cash and (iv) certain other transactions described in the footnotes to “Unaudited pro forma condensed combined financial information” occurred. Additionally, all of the shares of capital stock held by third-party stockholders of the Existing Entities that are REITs were redeemed for cash and the REITs were converted into limited liability companies. Following the IPO, neither we nor any of our subsidiaries were operated as a REIT, and we are taxed as a “C” corporation at the federal and state level.
The chart below summarizes our corporate structure and equity ownership immediately following this offering (assuming no exercise of the underwriters’ option to purchase additional shares of our common stock from the selling stockholders).
12
Table of Contents
Corporate history and information
La Quinta Holdings Inc. was incorporated in Delaware on December 9, 2013. Our principal executive offices are located at 909 Hidden Ridge, Suite 600, Irving, Texas 75038, and our telephone number is (214) 492-6600. We maintain a website at www.lq.com. The information contained on our website or that can be accessed through our website neither constitutes part of this prospectus nor is incorporated by reference herein.
13
Table of Contents
| Common stock offered by the selling stockholders |
20,000,000 shares. |
| Option to purchase additional shares of common stock from the selling stockholders |
3,000,000 shares. |
| Common stock outstanding after giving effect to this offering |
130,722,563 shares. |
| Use of proceeds |
We will not receive any of the proceeds from the sale of the shares by the selling stockholders, including upon the sale of shares if the underwriters exercise their option to purchase additional shares from the selling stockholders. See “Use of proceeds.” |
| Dividend policy |
We have no current plans to pay dividends on our common stock. Any decision to declare and pay dividends in the future will be made at the sole discretion of our board of directors and will depend on, among other things, our results of operations, cash requirements, financial condition, contractual restrictions and other factors that our board of directors may deem relevant. |
| Risk factors |
See “Risk factors” and other information included in this prospectus for a discussion of factors you should carefully consider before deciding to invest in our common stock. |
| NYSE ticker symbol |
“LQ.” |
Unless otherwise indicated or the context requires, all information in this prospectus assumes an offering of 20,000,000 shares by the selling stockholders and no exercise of the underwriters’ option to purchase additional shares.
In this prospectus, unless otherwise indicated, the number of shares of common stock that will be outstanding after this offering is based on the number of shares of our common stock outstanding as of November 13, 2014. The number of issued shares of our common stock as of November 13, 2014 excludes:
| • | an aggregate of 416,146 shares issuable upon settlement of time-vesting restricted stock units (granted to our directors) and performance-vesting restricted stock units at target (granted to our management) outstanding under our 2014 Omnibus Incentive Plan as of such date; and |
| • | an aggregate of 11,190,729 additional shares reserved for future issuance under our 2014 Omnibus Incentive Plan as of such date. |
See “Management-Executive compensation” for a further discussion of our 2014 Omnibus Incentive Plan.
14
Table of Contents
Summary historical combined financial data
The following table sets forth summary financial and operating data on a historical basis and on a pro forma basis after giving effect to the Pre-IPO Transactions and the completion of the IPO.
Our historical financial statements were prepared by combining the financial results of the entities owned by the Company at the completion of the IPO, including those entities under common control and their consolidated subsidiaries. The historical financial information below for the periods prior to the completion of the IPO does not include the acquisition of the Previously Managed Portfolio and does not include the Hotels Designated for Sale and the Baymont Hotels (other than the information relating to discontinued operations). We derived the summary statement of operations data for the years ended December 31, 2013, 2012 and 2011 and the summary balance sheet data as of December 31, 2013 and 2012 from the audited combined financial statements of the Predecessor Entities included elsewhere in this prospectus. We derived the summary balance sheet data as of December 31, 2011 from the audited combined financial statements of the Predecessor Entities not included elsewhere in this prospectus. We derived the selected statement of operations data for the nine months ended September 30, 2014 and 2013 and the selected balance sheet data as of September 30, 2014 from the unaudited condensed consolidated financial statements of La Quinta Holdings Inc. included elsewhere in this prospectus. The results for any interim period are not necessarily indicative of the results that may be expected for the full year. Additionally, historical results are not necessarily indicative of the results expected for any future period. You should read the table below, together with the combined financial statements including the related notes thereto appearing elsewhere in this prospectus, as well as “Selected financial and other data,” “Management’s discussion and analysis of financial condition and results of operations” and “Description of indebtedness,” and the other financial information included elsewhere in this prospectus.
The summary unaudited pro forma condensed combined financial information has been prepared to reflect (1) the acquisition of the Previously Managed Portfolio (the “WIH La Quinta Inn Hotels”) by the Predecessor Entities and the sale of four hotels which were classified as held for sale as of December 31, 2013, (2) the income tax impact of the Predecessor Entities and the WIH La Quinta Inn Hotels being owned by a “C” corporation, (3) the refinancing of our debt facilities outstanding at the time of our IPO and (4) the issuance of shares of our common stock offered by us in the IPO and the application of the net proceeds thereof. The summary unaudited pro forma combined financial data for the year ended December 31, 2013 is derived from our unaudited pro forma financial information included elsewhere in this prospectus and is presented as if the Pre-IPO Transactions (including the acquisition of the WIH La Quinta Inn Hotels) all had occurred on January 1, 2013 for the purposes of the unaudited pro forma combined statements of operations. The summary unaudited pro forma consolidated financial data for the nine months ended September 30, 2014 is derived from our unaudited pro forma financial information included elsewhere in this prospectus and is presented as if the Pre-IPO Transactions (including the acquisition of the WIH La Quinta Inn Hotels) all had occurred on January 1, 2013 for the purposes of the unaudited pro forma combined statements of operations. The unaudited pro forma condensed combined financial information excludes the Hotels Designated for Sale. The summary unaudited pro forma combined financial data has been prepared for illustrative purposes only and is not necessarily indicative of our financial position or results of operations had the transactions described above for which we are giving pro forma
15
Table of Contents
effect actually occurred on the dates or for the periods indicated, nor is such unaudited pro forma financial information necessarily indicative of the results to be expected for any future period. See “Unaudited pro forma financial information” for a complete description of the adjustments and assumptions underlying the summary unaudited pro forma combined data.
| Pro forma as of and for the nine months ended September 30, |
Pro forma as of and for the year ended December 31, |
As of and for the nine months ended |
As of and for the year ended December 31 |
|||||||||||||||||||||||||
| (in thousands) | 2014 | 2013 | 2014 | 2013 | 2013 | 2012 | 2011 | |||||||||||||||||||||
|
|
||||||||||||||||||||||||||||
| Statement of Operations Data: |
||||||||||||||||||||||||||||
| Revenues: |
||||||||||||||||||||||||||||
| Room revenues |
$ | 662,004 | $ | 796,015 | $ | 649,181 | $ | 585,294 | $ | 757,699 | $ | 714,143 | $ | 660,816 | ||||||||||||||
| Franchise and other fee-based revenues |
67,483 | 76,896 | 68,215 | 59,846 | 79,180 | 69,206 | 59,314 | |||||||||||||||||||||
| Other hotel revenues |
14,959 | 18,042 | 14,809 | 13,650 | 17,949 | 17,506 | 16,229 | |||||||||||||||||||||
|
|
|
|||||||||||||||||||||||||||
| 744,446 | 890,953 | 732,205 | 658,790 | 854,828 | 800,855 | 736,359 | ||||||||||||||||||||||
| Brand marketing fund revenues from franchised and managed properties |
16,190 | 18,107 | 16,511 | 14,594 | 19,065 | 17,157 | 15,182 | |||||||||||||||||||||
|
|
|
|||||||||||||||||||||||||||
| Total revenues |
760,636 | 909,060 | 748,716 | 673,384 | 873,893 | 818,012 | 751,541 | |||||||||||||||||||||
| Operating Expenses: |
||||||||||||||||||||||||||||
| Direct lodging expenses |
287,937 | 352,488 | 285,430 | 264,208 | 344,515 | 334,394 | 330,205 | |||||||||||||||||||||
| Depreciation and amortization |
131,771 | 170,493 | 129,948 | 122,694 | 164,077 | 155,879 | 149,356 | |||||||||||||||||||||
| General and administrative expenses |
73,443 | 88,919 | 100,863 | 49,724 | 74,794 | 74,111 | 61,578 | |||||||||||||||||||||
| Other lodging and operating expenses |
46,196 | 56,270 | 46,124 | 39,666 | 56,068 | 58,266 | 47,791 | |||||||||||||||||||||
| Marketing, promotional and other advertising expenses |
50,170 | 59,193 | 50,170 | 54,226 | 59,193 | 48,610 | 45,580 | |||||||||||||||||||||
| Impairment loss |
5,157 | — | 5,157 | — | — | — | — | |||||||||||||||||||||
|
|
|
|||||||||||||||||||||||||||
| 594,674 | 727,363 | 617,692 | 530,518 | 698,647 | 671,260 | 634,510 | ||||||||||||||||||||||
| Brand marketing fund expenses from franchised and managed properties |
16,190 | 18,107 | 16,511 | 14,594 | 19,065 | 17,157 | 15,182 | |||||||||||||||||||||
|
|
|
|||||||||||||||||||||||||||
| Total operating expenses |
610,864 | 745,470 | 634,203 | 545,112 | 717,712 | 688,417 | 649,692 | |||||||||||||||||||||
|
|
|
|||||||||||||||||||||||||||
| Operating Income |
149,772 | 163,268 | 114,513 | 128,272 | 156,181 | 129,595 | 101,849 | |||||||||||||||||||||
| Income from continuing operations before income taxes |
77,184 | 66,183 | 14,127 | 18,583 | 8,614 | 20,223 | 61,027 | |||||||||||||||||||||
| Income (loss) from continuing operations, net of tax |
46,311 | 39,710 | (328,787 | ) | 16,057 | 5,016 | 17,088 | 58,695 | ||||||||||||||||||||
| Net Income (loss) |
$ | 46,311 | $ | 39,710 | $ | (329,290 | ) | $ | 9,754 | $ | 2,521 | $ | (35,764 | ) | $ | 58,939 | ||||||||||||
| Net (income) loss attributable to noncontrolling interests |
(325 | ) | (397 | ) | (3,814 | ) | (1,106 | ) | 1,455 | 4,810 | 4,574 | |||||||||||||||||
|
|
|
|||||||||||||||||||||||||||
| Net income (loss) attributable to the Company |
$ | 45,986 | $ | 39,313 | $ | (333,104 | ) | $ | 8,648 | $ | 3,976 | $ | (30,954 | ) | $ | 63,513 | ||||||||||||
16
Table of Contents
| As of and for the nine months ended September 30 |
As of and for the year ended December 31 |
|||||||||||||||
| (in thousands) | 2014 | 2013 | 2012 | 2011 | ||||||||||||
|
|
||||||||||||||||
| Selected Balance Sheet Data: |
||||||||||||||||
| Cash and cash equivalents |
$ | 108,488 | $ | 33,412 | $ | 40,813 | $ | 90,857 | ||||||||
| Restricted cash |
— | 104,026 | 113,407 | 60,745 | ||||||||||||
| Total assets |
3,241,105 | 3,169,834 | 3,356,320 | 3,484,232 | ||||||||||||
| Total debt(1) |
1,930,206 | 2,720,286 | 2,899,965 | 3,158,409 | ||||||||||||
| Total equity (deficit)(2) |
798,518 | 305,253 | 303,385 | 183,095 | ||||||||||||
| Adjusted EBITDA(3) |
$ | 290,259 | $ | 326,807 | $ | 297,823 | $ | 258,389 | ||||||||
|
|
||||||||||||||||
| (1) | Includes current portion. |
| (2) | Reflects the impact of the Predecessor Entities and the WIH La Quinta Inn Hotels being owned by a “C” corporation, which results in the recording of a net deferred tax liability of approximately $321 million. |
| As of and for the nine months ended |
As of and for the year ended December 31 |
|||||||||||||||||||
| (in thousands other than operating data) | 2014 | 2013 | 2013 | 2012 | 2011 | |||||||||||||||
|
|
||||||||||||||||||||
| Summary Statement of Cash Flows Data: |
||||||||||||||||||||
| Capital expenditures |
$ | (65,832 | ) | $ | (82,979 | ) | $ | (115,529 | ) | $ | (102,886 | ) | $ | (95,552 | ) | |||||
| Cash flow from operating activities |
227,678 | 193,019 | 232,858 | 248,187 | 220,429 | |||||||||||||||
| Cash flow from investing activities |
(32,441 | ) | (38,867 | ) | 1,719 | (150,952 | ) | (92,446 | ) | |||||||||||
| Cash flow from financing activities |
(120,161 | ) | (146,011 | ) | (241,978 | ) | (147,279 | ) | (78,265 | ) | ||||||||||
| Operating Data*: |
||||||||||||||||||||
| Number of hotels |
793 | 772 | 771 | 756 | 719 | |||||||||||||||
| Number of rooms |
79,973 | 78,116 | 78,045 | 76,688 | 73,639 | |||||||||||||||
| Hotel occupancy |
68.1% | 66.4% | 64.8% | 63.5% | 61.9% | |||||||||||||||
| Hotel ADR |
$ | 83.92 | $ | 79.71 | $ | 79.11 | $ | 75.66 | $ | 72.14 | ||||||||||
| Hotel RevPAR |
$ | 57.17 | $ | 52.90 | $ | 51.26 | $ | 48.05 | $ | 44.67 | ||||||||||
| Hotel RevPAR Index |
97.4% | 97.0% | 97.1% | 95.2% | 94.2% | |||||||||||||||
|
|
||||||||||||||||||||
| * | Operating data (other than RevPAR Index) are for comparable hotels on a system-wide basis as of each period end. RevPAR Index is based on the STR competitive set of hotels existing as of September 30, 2014. See “Management’s discussion and analysis of financial condition and results of operations.” |
| (3) | Earnings before interest, taxes, depreciation and amortization (“EBITDA”) is a commonly used measure in many industries. We adjust EBITDA when evaluating our performance because we believe that the adjustment for certain items, such as impairment charges, discontinued operations, gains (losses) on asset sales, certain financing costs, non-cash equity-based compensation, and other items not indicative of ongoing operating performance, provides useful supplemental information to management and investors regarding our ongoing operating performance. We believe that EBITDA and Adjusted EBITDA provide useful information to investors about us and our financial condition and results of operations for the following reasons: (i) EBITDA and Adjusted EBITDA are among the measures used by our management team to evaluate our operating performance and make day-to-day operating decisions; and (ii) EBITDA and Adjusted EBITDA are frequently used by securities analysts, investors, lenders, and other interested parties as a common performance measure to compare results or estimate valuations across companies in our industry. |
| EBITDA and Adjusted EBITDA are not recognized terms under GAAP, have limitations as analytical tools and should not be considered either in isolation or as a substitute for net income (loss), cash flow or other methods of analyzing our results as reported under GAAP. Some of these limitations are: |
| • | EBITDA and Adjusted EBITDA do not reflect changes in, or cash requirements for, our working capital needs; |
| • | EBITDA and Adjusted EBITDA do not reflect our interest expense, or the cash requirements necessary to service interest or principal payments, on our indebtedness; |
| • | EBITDA and Adjusted EBITDA do not reflect our tax expense or the cash requirements to pay our taxes; |
17
Table of Contents
| • | EBITDA and Adjusted EBITDA do not reflect historical cash expenditures or future requirements for capital expenditures or contractual commitments; |
| • | EBITDA and Adjusted EBITDA do not reflect the impact on earnings or changes resulting from matters that we consider not to be indicative of our future operations; |
| • | although depreciation and amortization are non-cash charges, the assets being depreciated and amortized will often have to be replaced in the future, and EBITDA and Adjusted EBITDA do not reflect any cash requirements for such replacements; and |
| • | other companies in our industry may calculate EBITDA and Adjusted EBITDA differently, limiting their usefulness as comparative measures. |
| Because of these limitations, EBITDA and Adjusted EBITDA should not be considered as discretionary cash available to us to reinvest in the growth of our business or as measures of cash that will be available to us to meet our obligations. |
18
Table of Contents
| The following table provides a reconciliation of EBITDA and Adjusted EBITDA to net income attributable to the Company, which we believe is the most closely comparable U.S. GAAP financial measure: |
| (in thousands) |
Pro forma for 2014 |
Pro forma for 2013 |
As of and for the nine months ended |
For the year ended December 31, |
||||||||||||||||||||||||
| 2014 | 2013 | 2013 | 2012 | 2011 | ||||||||||||||||||||||||
|
|
||||||||||||||||||||||||||||
| Net Income (Loss) Attributable to the Company |
$ | 45,986 | $ | 39,313 | $ | (333,104 | ) | $ | 8,648 | $ | 3,976 | $ | (30,954 | ) | $ | 63,513 | ||||||||||||
| Interest expense |
71,532 | 98,329 | 97,300 | 110,908 | 148,806 | 103,342 | 51,986 | |||||||||||||||||||||
| Income tax provision |
30,873 | 26,473 | 21,860 | 2,573 | 3,665 | 3,283 | 2,472 | |||||||||||||||||||||
| Recognition of net deferred tax liabilities upon C-corporation conversion |
— | — | 321,054 | — | — | — | — | |||||||||||||||||||||
| Depreciation and amortization |
132,538 | 171,775 | 130,711 | 128,711 | 170,401 | 172,787 | 165,295 | |||||||||||||||||||||
| Non-controlling interests |
325 | 397 | 3,814 | 1,106 | (1,455 | ) | (4,810 | ) | (4,574 | ) | ||||||||||||||||||
| EBITDA |
281,254 | 336,287 | 241,635 | 251,946 | 325,393 | 243,648 | 278,692 | |||||||||||||||||||||
| Fixed asset impairment loss |
5,157 | — | 5,308 | 19,913 | 19,533 | 53,228 | — | |||||||||||||||||||||
| (Income) Loss from discontinued operations |
— | — | 377 | (8,420 | ) | (8,636 | ) | (12,723 | ) | (13,543 | ) | |||||||||||||||||
| Gain on sale from discontinued operations |
— | — | — | (7,694 | ) | (10,714 | ) | — | — | |||||||||||||||||||
| Loss on retirement of assets |
— | 681 | — | 47 | 359 | 1,562 | 2,168 | |||||||||||||||||||||
| (Gain) Loss related to casualty disasters |
(1,098 | ) | (1,926 | ) | (1,106 | ) | (2,611 | ) | (1,825 | ) | 4,730 | (3,447 | ) | |||||||||||||||
| (Gain) Loss on extinguishment of debt, net |
— | — | 2,030 | — | — | (1,192 | ) | (11,451 | ) | |||||||||||||||||||
| Management bonus related to debt amendment |
— | — | — | — | — | 4,932 | — | |||||||||||||||||||||
| Financing costs expensed as incurred |
— | — | — | — | — | 7,749 | 1,668 | |||||||||||||||||||||
| Equity based compensation |
8,036 | — | 39,703 | — | — | — | — | |||||||||||||||||||||
| Other (gains) losses, net |
2,570 | 5,170 | 2,312 | 3,034 | 2,697 | (4,111 | ) | (850 | ) | |||||||||||||||||||
| Termination of long-term contract |
— | — | — | — | — | — | 5,152 | |||||||||||||||||||||
| Adjusted EBITDA |
$ | 295,919 | $ | 340,212 | $ | 290,259 | $ | 256,215 | $ | 326,807 | $ | 297,823 | $ | 258,389 | ||||||||||||||
|
|
||||||||||||||||||||||||||||
19
Table of Contents
An investment in our common stock involves a high degree of risk. You should carefully consider each of the following risks as well as the other information included in this prospectus, including “Selected financial and other data,” “Management’s discussion and analysis of financial condition and results of operations” and our combined financial statements and related notes, before investing in our common stock. Any of the following risks could materially and adversely affect our business, financial condition and results of operations. In such a case, the trading price of our common stock could decline and you may lose all or part of your investment in the Company. Unless the context otherwise requires, references in this “Risk factors” section to “our hotels,” “our rooms” and similar phrases refer to hotels that we own or franchise.
Risks related to our business and industry
We are subject to the business, financial, and operating risks inherent to the hospitality industry, any of which could reduce profits and limit opportunities for growth.
Our business is subject to a number of business, financial and operating risks inherent to the hospitality industry, including:
| • | changes in operating costs, including energy, food, compensation, benefits, insurance and unanticipated costs resulting from force majeure events; |
| • | increases in costs due to inflation that may not be fully offset by price and fee increases in our business; |
| • | changes in taxes and governmental regulations that influence or set wages, prices, interest rates or construction and maintenance procedures and costs; |
| • | the costs and administrative burdens associated with complying with applicable laws and regulations; |
| • | the costs or desirability of complying with local practices and customs; |
| • | significant increases in cost for health care coverage for employees and potential government regulation with respect to health coverage, such as costs associated with the implementation of the requirements of the Patient Protection and Affordable Care Act; |
| • | shortages of labor or labor disruptions; |
| • | the availability and cost of capital necessary for us and our franchisees to fund investments, capital expenditures and service debt obligations; |
| • | delays in or cancellations of planned or future development or renovation projects; |
| • | the quality of services provided by franchisees; |
| • | the financial condition of franchisees; |
| • | relationships with franchisees, including the risk that our franchise agreements may be terminated early; |
| • | changes in desirability of particular geographic locations and shortages of desirable locations for development; |
20
Table of Contents
| • | changes in lodging preferences and travel patterns of our guests and geographic concentration of our operations and guests; |
| • | changes in the supply and demand for hotel services; |
| • | foreign exchange rate fluctuations or restructurings; |
| • | decreased business travel as a result of improvements to the alternatives to in-person meetings, including virtual meetings hosted on-line or over private teleconferencing networks; and |
| • | the ability of third-party internet and other travel intermediaries to attract and retain guests. |
Any of these factors could limit or reduce the prices we and our franchisees are able to charge for rooms. These factors can also increase costs or affect the ability to develop new hotels or maintain and operate existing hotels. As a result, any of these factors can reduce our profits and limit opportunities for growth.
Macroeconomic and other factors beyond our control can adversely affect and reduce demand for rooms at hotels that we own or franchise.
Macroeconomic and other factors beyond our control can reduce demand for rooms at hotels that we own or franchise. These factors include, but are not limited to:
| • | changes in general economic conditions, including the severity and duration of any downturn in the U.S. or global economy and financial markets; |
| • | war, political conditions or civil unrest, terrorist activities or threats and heightened travel security measures instituted in response to these events; |
| • | outbreaks of pandemic or contagious diseases, such as Ebola, avian flu, severe acute respiratory syndrome (SARS) and H1N1 (swine flu); |
| • | natural or man-made disasters, such as earthquakes, tsunamis, tornadoes, hurricanes, typhoons, floods, oil spills and nuclear incidents; |
| • | decreased corporate or government travel-related budgets and spending and cancellations, deferrals or renegotiations of group business; |
| • | low consumer confidence, high levels of unemployment or depressed real estate prices; |
| • | the financial condition and general business condition of the airline, automotive, and other transportation-related industries and its impact on travel; |
| • | decreased airline capacities and routes; |
| • | travel-related accidents; |
| • | oil prices and travel costs; |
| • | statements, actions or interventions by governmental officials related to travel and corporate travel-related activities and the resulting negative public perception of such travel and activities; |
| • | climate change and resource scarcity, such as water and energy scarcity; |
| • | domestic and international political and geo-political conditions; and |
| • | cyclical over-building in the hotel and lodging industries. |
21
Table of Contents
These factors, and the reputational repercussions of these factors, can adversely affect, and from time to time have adversely affected, individual hotels, particular regions and our business, financial condition and results of operations as a whole. Any one or more of these factors could limit or reduce the demand, or the rates that we are able to charge, for rooms. Declines in ADR and occupancy relating to declines in consumer demand will lower RevPAR and may adversely affect our business, financial condition and results of operations. In addition, these factors could increase our operating costs or affect our ability to develop or franchise new hotels or to maintain and operate our existing hotels.
Contraction in the global economy or low levels of economic growth could adversely affect our revenues and profitability as well as limit or slow our future growth.
Consumer demand for our rooms is closely linked to the performance of the general economy and is sensitive to business and personal discretionary spending levels. Decreased demand can be especially pronounced during periods of economic contraction or low levels of economic growth, and the recovery period in our industry may lag overall economic improvement. Declines in consumer demand due to adverse general economic conditions could negatively impact our business by decreasing the revenues and profitability of our owned hotels and limiting the amount of franchising fee revenues we are able to generate from our franchised hotels. For example, for the year ended December 31, 2009, our revenues declined approximately $136 million, or 17%, from revenues of $816 million for the year December 31, 2008, and our Adjusted EBITDA declined approximately 30%. In addition, many of the expenses associated with our business, including personnel costs, interest, rent, property taxes, insurance and utilities, are relatively fixed. During a period of overall economic weakness, if we are unable to meaningfully decrease these costs as demand for our hotels decreases, our business operations and financial performance may be adversely affected.
Additionally, recent global economic conditions have significantly affected consumer confidence and behavior and, as a result, historical financial results may be less effective as a means of predicting future demand and operating results. Uncertainty regarding the rate and pace of recovery from the recent economic downturn and the impact any such recovery may have on different regions of the world makes it difficult to predict future profitability levels. Moreover, if further economic weakness in the markets in which we operate were to occur, it could have an adverse impact on our revenues and negatively affect our profitability.
Because we operate in a highly competitive industry, our revenues or profits could be harmed if we are unable to compete effectively.
Competition for hotel guests
The segments of the hotel industry in which we operate are subject to intense competition. La Quinta is a select-service hotel brand that competes primarily against other select-service hotels in both the upper-midscale and the midscale segments. However, our owned and franchised hotels generally operate in segments that contain numerous competitors, including a wide range of lodging facilities offering full-service, select-service and all-suite lodging options. Hotels in other market segments, such as full-service hotels, may lower their rates to a level comparable to those of select-service hotels such as ours that, in turn, may further increase competitive pressure in our segments. Our owned and franchised hotels generally compete for guests on the basis of room rates, quality of accommodations, name recognition, service levels, convenience of locations and reward program offerings. Additionally, an increasing supply of hotel rooms in La
22
Table of Contents
Quinta’s market segments, and consolidations in the lodging industry generally, have resulted in the creation of several large, multi-branded hotel chains with diversified operations and greater marketing and financial resources than we have, which has increased competition for guests in the segments in which our owned and franchised hotels operate. If we are unable to compete successfully for hotel guests, our revenues or profits may decline.
Competition for franchise agreements
A primary component of our growth strategy entails increasing our system-wide portfolio of franchised hotels and further growing our franchise fee-based business. We compete for franchise agreements based primarily on brand name recognition and reputation, the room rate that can be realized, royalty fees charged and other contract terms. Some of our competitors may have substantially greater marketing and financial resources, greater brand distribution and awareness and/or offer greater financial incentives than we do. Other competitive factors for franchise agreements include relationships with hotel owners and investors, including institutional owners of multiple hotels, availability and affordability of financing, marketing support, reservation and e-commerce system capacity and efficiency and the ability to make investments that may be necessary to obtain franchise agreements. The terms of our franchise agreements for each of our franchised hotels are also influenced by contract terms offered by our competitors, among other things. As a result, the terms of new franchise agreements may not be as favorable as our current franchise agreements. For example, competition may require us to reduce or change fee structures, make greater use of key money or provide other financial incentives such as loans and guarantees to franchisees and/or reduce the level of hotel improvements required to conform to brand standards. In addition, if the availability of suitable locations for new hotels decreases, planning or other local regulations change or the availability or affordability of financing is limited, the supply of suitable hotels for franchising could be diminished. Additionally, an excess supply of hotel rooms or unfavorable borrowing conditions may discourage potential franchisees from expanding or constructing new hotels, thereby limiting a source of growth of the franchise fees received by us. Our franchise agreements generally restrict our ability to open a new owned or franchised hotel in a limited area near the franchised hotel, which can range from several city blocks in an urban area to several square miles in less populated areas. We may be prohibited from franchising or owning hotels in areas where opportunities exist due to these restrictions. If the hotels that we franchise perform less successfully than those of our competitors, if we are unable to offer terms as favorable as those offered by our competitors, or if the availability of suitable hotels is limited, our ability to compete effectively for new franchise agreements could be reduced. If we are unable to compete successfully for franchisees, our revenues or profits may decline.
Any deterioration in the quality or reputation of our brand could have an adverse impact on our reputation, business, financial condition or results of operations.
Our brand and our reputation are among our most important assets. The success of our hotel business and our ability to attract and retain guests and franchise partners depends on brand recognition and reputation. Such dependence makes our hotel business susceptible to reputational damage and to competition from other hotel management and franchise companies. Additionally, for our franchised hotels, the continued success of a hotel owner’s business and its ability to make payments to us may directly depend on the strength and reputation of our franchised hotels and our brand. We cannot assure you that the prior performance of our owned or franchised hotels will be indicative of future results or that competition from other brands will not adversely affect our market position or financial performance.
23
Table of Contents
In addition, the brand recognition and support that provide much of the basis for the successful operation of our owned hotels and our franchise business can also mean that changes or problems with La Quinta (e.g., changes in ownership or management or management practices, or acts or omissions that adversely affect our business), or within our hotel business or at other locations (e.g., crime, scandal, litigation, negative publicity, catastrophic fires or similar events or accidents and injuries or other harm to our guests or our team members) can have a substantial negative impact on the operations of otherwise successful individual locations, and can cause a loss of consumer confidence in La Quinta and other hotels in our segment. Adverse incidents have occurred in the past and may occur in the future. The considerable expansion in the use of social media over recent years has compounded the potential scope of the negative publicity that could be generated by such incidents. We could also face legal claims and adverse publicity from a variety of events or conditions, many of which are beyond our control. If the reputation or perceived quality of our brand declines, our reputation, business, financial condition or results of operations could be adversely affected.
Some of our existing development pipeline may not be developed into La Quinta hotels, which could adversely affect our growth prospects.
As of September 30, 2014, we had a total of 196 franchised hotels in our pipeline, each of which is represented by an executed 20-year franchise agreement. Approximately 83% of the pipeline represents new construction, rather than the conversion of an existing hotel, and, as of September 30, 2014, approximately 32% of the conversions and new construction has commenced. The commitments of owners and developers with whom we have agreements are subject to numerous conditions, and the eventual development and construction of our pipeline not currently under construction is subject to numerous risks, including, in certain cases, the ability of the franchisee to obtain governmental and regulatory approvals and adequate financing. As a result, we cannot assure you that our entire pipeline will develop into new hotels. Any of these risks could have an adverse impact on the growth of our business and future operating results.
Our efforts to renovate, redevelop or develop our hotels could be delayed or become more expensive, which could reduce profits or impair our ability to compete effectively.
We must maintain and renovate our hotels to remain competitive, maintain the value and brand standards of these hotels and comply with applicable laws and regulations. From time to time we evaluate our hotels to determine whether additional capital expenditures are required and will provide an acceptable return on investment.
Our strategy includes maintenance and renovation of our hotels and may include redevelopment, development and conversion of hotels, which is subject to a number of risks, including:
| • | the inability to obtain financing upon favorable terms or at all; |
| • | construction delays or cost overruns (including labor and materials) that may increase project costs; |
| • | lack of availability of rooms for revenue-generating activities during construction, modernization or renovation projects; |
| • | changes in economic conditions that may result in weakened or lack of demand or negative project returns; |
| • | the inability to find appropriate, strategically located hotels at commercially reasonable prices; |
24
Table of Contents
| • | obtaining zoning, occupancy, and other required permits or authorizations; |
| • | governmental restrictions on the size or kind of development; |
| • | force majeure events, including earthquakes, tornadoes, hurricanes, floods, or tsunamis; and |
| • | design defects that could increase costs. |
Furthermore, we generally rely heavily on local contractors, who may be inadequately capitalized or understaffed. The inability or failure of one or more local contractors to perform its obligations may result in construction or remodeling delays, increased costs and loss of revenues. As a result, we may not increase our revenues or generate expected profits and cash flows from the renovation, redevelopment or development of hotels.
If we are not able to begin operating hotels under renovation or development as scheduled, or if renovation investments adversely affect or fail to improve performance, our ability to compete effectively could be diminished and revenues could be reduced. Further, due to the lengthy development cycle, adverse economic conditions may alter or impede our development plans, thereby resulting in incremental costs to us or potential impairment charges. If the cost of funding these renovations or developments exceed budgeted amounts, profits could be reduced. Moreover, during the early stages of operations, charges related to interest expense and depreciation may substantially detract from, or even outweigh, the profitability of certain new hotel investments.
Our hotels are geographically concentrated, which exposes our business to the effects of regional events and occurrences.
We have a concentration of hotels in Texas, Florida and California. Specifically, as of September 30, 2014, approximately 42% of rooms in our system were located in Texas, Florida and California with approximately 25% of rooms in our system located in Texas. In addition, as of September 30, 2014, approximately 31% of our pipeline properties are to be located in Texas. The concentration of hotels in one region or a limited number of markets may expose us to risks of adverse economic developments that are greater than if our portfolio were more geographically diverse. These economic developments include regional economic downturns, significant increases in the number of our competitors’ hotels in these markets and potentially higher local property, sales and income taxes in the geographic markets in which we are concentrated. In addition, our hotels are subject to the effects of adverse acts of nature, such as winter storms, hurricanes, hail storms, strong winds, earthquakes and tornados, which have in the past caused damage such as flooding and other damage to our hotels in specific geographic locations, including in the Texas, Florida and California markets. Depending on the severity of these acts of nature, the damage to our hotels could require us to close all or substantially all of our hotels in one or more markets for a period of time while the necessary repairs and renovations, as applicable, are undertaken. Additionally, we cannot assure you that the amount of our hurricane, windstorm, earthquake, flood or other casualty insurance we maintain from time to time would entirely cover damages caused by any such event.
As a result of our geographic concentration of hotels, we will face a greater risk of a negative impact on our revenues in the event these areas are more severely impacted by adverse economic and competitive conditions and extreme weather than other areas in the United States.
25
Table of Contents
The hospitality industry is subject to seasonal and cyclical volatility, which may contribute to fluctuations in our financial condition and results of operations.
The hospitality industry is seasonal in nature. The periods during which our hotels experience higher revenues vary from hotel to hotel, depending principally upon location. Generally, our hotel revenues are greater in the second and third quarters than in the first and fourth quarters. The timing of holidays can also impact our quarterly results. This seasonality can be expected to cause quarterly fluctuations in revenue, profit margins and net earnings. Additionally, our first or second quarter results may be further adversely affected by the timing of certain of our marketing production expenditures. In addition, the opening of newly constructed or franchised hotels and the timing of any hotel acquisitions or dispositions may cause a variation of revenue from quarter to quarter. The seasonality and cyclicality of our industry may contribute to fluctuations in our financial condition and results of operations.
Our business is capital intensive and our failure or the failure of our franchisees to make necessary investments could adversely affect the quality and reputation of our brand.
The hotels in our owned portfolio have an average age of 27 years, and the hotels in our franchise portfolio have an average age of 13 years. For our owned and franchised hotels to remain attractive and competitive, we and the owners of our franchised hotels have to make periodic investments to keep the hotels well maintained, modernized and refurbished. This creates an ongoing need for capital. We and the owners of our franchised hotels may be unable to access capital or unwilling to spend available capital when necessary, even if required by the terms of our franchise agreements. To the extent that owners of franchised hotels and we cannot fund expenditures from cash generated by the operation of the hotels, funds must be borrowed or otherwise obtained, which may be difficult to obtain. Failure to make the investments necessary to maintain or improve hotels, act in accordance with applicable brand standards or project a consistent brand image could adversely affect the quality and reputation of our brand.
If our franchisees are unable to access the capital necessary to implement plans for growth, including our existing pipeline, our revenues may be reduced and our ability to compete effectively may be diminished.
Our franchisees depend on capital to buy and develop new franchised hotels, and our franchisees may be unable to access capital as expected. The availability of funds for development depends in large measure on capital markets and liquidity factors. Instability in the worldwide financial markets and the contraction of available liquidity may constrain the capital markets for hotel and real estate investments. As a result, while lenders have shown willingness to work with borrowers to extend relief in the short to medium term, many current and prospective hotel owners may struggle to find new hotel financing on commercially viable terms. The inability of our existing or future franchisees’ to obtain adequate funding could result in the decrease, delay or stoppage of development of new franchised hotels, including our existing pipeline.
If we are unable to maintain good relationships with our franchisees, revenues could decrease and we may be unable to expand our presence.
As of September 30, 2014, approximately 59% of the La Quinta-branded hotels were operated as franchised hotels. Our franchisees pay us a franchise fee and certain other fees pursuant to our franchise agreements. The viability of the franchising business depends on our ability to establish and maintain good relationships with our franchisees. Franchisees are focused on maximizing the value of their investment and working with a franchisor that can help them be successful in the
26
Table of Contents
ownership of their respective hotel investments. The value of our brand and the rapport that we maintain with our franchisees affect renewals of existing agreements and are important factors for potential franchisees considering doing business with us. Our relationships with franchisees generate additional hotel development opportunities that support growth. If we are unable to maintain good relationships with franchisees, we may be unable to renew existing franchise agreements or expand relationships with them. Additionally, opportunities for developing new relationships with additional franchisees may be adversely affected. This, in turn, could have an adverse effect on our results of operations and our ability to execute our growth strategy.
Franchise agreement standards are important to protecting our brand reputation and perception, and if our franchisees fail to make investments necessary to maintain or improve their hotels, guest preference for the La Quinta brand and reputation could suffer or the franchise agreements with those parties could terminate.
Substantially all of our franchise agreements require our franchisees to comply with standards that are essential to maintaining brand integrity and reputation and protecting the quality guests ascribe to the La Quinta brand. We depend on our franchisees to comply with these requirements by maintaining and improving hotels through investments, including investments in furniture, fixtures, equipment, amenities, personnel and branding elements.
Franchisees may be unable to access capital or unwilling to spend available capital when necessary, even if required by the terms of their agreements with us. If our franchisees fail to make investments necessary to maintain or improve the hotels that we franchise, guest preference for our brand and our reputation could suffer. Moreover, our franchisees may be unwilling or unable to incur the cost of complying with brand standards as brand standards may evolve from time to time. In addition, if our franchisees breach the terms of their agreements with us, we may elect to exercise our termination rights, which would eliminate revenues from these hotels and cause us to incur expenses related to terminating these relationships. We may be unable to find suitable or offsetting replacements for any terminated relationships. These risks become more pronounced during economic downturns.
Contractual and other disagreements with franchisees could make us liable to them or result in litigation costs or other expenses.
Our franchise agreements require us and our franchisees to comply with operational and performance conditions that are subject to interpretation and could result in disagreements. At any given time, we may be in disputes with one or more of our franchisees. Any dispute we have with our franchisees could result in arbitration or litigation, which could be very expensive for us even if the outcome is ultimately in our favor. We cannot predict the outcome of any such arbitration or litigation, the effect of any adverse judgment against us or the amount of any settlement that we may enter into with any franchisee. An adverse result in any such proceeding could adversely impact our results of operations and prospects.
If our franchise agreements terminate prematurely or expire in accordance with their terms, our revenues could decrease and our costs could increase.
Our franchise agreements may be terminated, renegotiated or expire, but typically have an initial term of 20 years. The continuation of a franchise agreement is subject to the franchisee adhering to certain standards and other applicable terms and conditions (including the obligation to pay certain fees to us). While our franchise agreements generally provide for liquidated damages to be paid to us by franchisees whose agreements have been terminated as the result of a violation
27
Table of Contents
of the provisions of the agreement, these damage amounts are typically less than the fees we would have received if the terminated franchisee fulfilled its contractual obligations.
Our franchise agreements also typically contain provisions permitting either party to terminate the franchise agreement after five, ten or fifteen years under certain circumstances without payment of damages. These agreements also provide early termination rights to the franchisees upon the failure to meet a specified performance test, which is typically based on the hotel’s occupancy rates. Franchisees also may attempt to terminate franchise agreements with us prior to their scheduled expiration date. If that happens, we may have difficulty recovering any resulting damages from the owner or replacing the revenues lost as a result of the termination. In addition, if a franchisee files for bankruptcy, our franchise agreements may be terminable under applicable law.
If any of our franchise agreements are terminated or expire, we cannot assure you that we can obtain new or replacement franchise agreements at the same time that those other agreements are terminated or expire. As a result, we could lose the revenues we derive from that agreement or incur costs related to ending our relationship with the franchisee.
Deterioration in the general financial condition of our franchisees may adversely affect our results.
Our operating results are impacted by the ability of our franchisees to generate revenues at hotels they franchise from us. Our franchisees compete for guests with other hotels in their geographic markets. Some of their competitors may have substantially greater marketing and financial resources than our franchisees, and they may construct new hotels or improve their existing hotels, reduce their prices or expand and improve their marketing programs in ways that adversely affect our franchisees’ operating results and financial condition. In addition, the ability of our franchisees to compete for guests directly impacts the desirability of our brand to current and prospective franchisees.
These factors, among others, could adversely affect the operating results and financial condition of our franchisees. This could result in the financial failure of our owners and result in a termination of the franchisee for non-payment of franchise fees and/or declines in franchise fees and other revenues derived from our franchising business.
If our franchisees are unable to repay or refinance loans secured by the mortgaged hotels, our revenues, profits and capital resources could be reduced and our business could be harmed.
Many of the hotels owned by our franchisees are pledged as collateral for mortgage loans entered into when such hotels were purchased or refinanced by them. If our franchisees are unable to repay or refinance maturing indebtedness on favorable terms or at all, the lenders could declare a default, accelerate the related debt and repossess the hotel. Debt defaults could lead franchisees to sell the hotel on unfavorable terms or to convey the mortgaged hotels to the lender. Any such sale or conveyance could, in certain cases, result in the termination of our franchise agreements or eliminate any anticipated income and cash flows from such hotel, which could negatively affect our business and results of operations.
28
Table of Contents
We are exposed to the risks resulting from significant investments in owned real estate, which could increase our costs, reduce our profits and limit our ability to respond to market conditions.
Real estate ownership is subject to risks not applicable to franchised and managed hotels, including:
| • | governmental regulations relating to real estate ownership or operations, including tax, environmental, zoning and eminent domain laws; |
| • | loss in value or functionality, or unanticipated liabilities, due to environmental conditions, governmental takings, uninsured casualties or restrictive changes in zoning and similar land use laws and regulations or in health, safety and environmental laws, rules and regulations and other governmental and regulatory action; |
| • | changes in tax laws and property taxes, even if the hotel level cash flows remain the same or decrease; |
| • | differences in potential civil liability between owners and operators for accidents or other occurrences on owned hotels; |
| • | the ongoing need for owner funded capital improvements and expenditures to maintain or upgrade hotels; |
| • | periodic total or partial closures due to renovations and hotel improvements; |
| • | risks associated with mortgage debt, including the possibility of default, fluctuating interest rate levels and uncertainties in the availability of replacement financing; |
| • | risks associated with the possibility that cost increases will outpace revenue increases and that in the event of an economic slowdown, the high proportion of fixed costs will make it difficult to reduce costs to the extent required to offset declining revenues; |
| • | acts of God, including earthquakes, hurricanes, floods, winter storms and other natural disasters (that may result in uninsured losses); |
| • | fluctuations in real estate values or potential impairments in the value of our assets; and |
| • | maintaining tenants for leased properties. |
Additionally, real estate investments are relatively illiquid and, therefore, cannot be purchased or sold rapidly in response to changes in economic or other conditions. Buyers may not be identified quickly or be able to secure suitable financing to consummate a transaction or we may not be able to sell hotels on terms favorable to us. Furthermore, sales of certain appreciated hotels could generate material adverse tax consequences, which may affect our ability to sell hotels in response to market conditions and adversely affect our ability to generate cash flows.
Any of the forgoing risks could increase our costs, reduce our profits and limit our ability to respond to market conditions.
Changes in local market or neighborhood conditions may diminish the value of real property.
Hotels may be difficult to convert to other uses if changes in market conditions or in the area in which the hotel is located make hotel use unattractive for any reason. In such cases, large capital investments in real estate may prove difficult to recover. Hotels may be completely undamaged, but may lose significant value that cannot be recovered through insurance or operational changes because of disasters occurring nearby.
29
Table of Contents
The negative impact on profitability and cash flow generation from a decline in revenues is more pronounced in owned hotels because we, as the owner, bear the risk of their high fixed-cost structure. The need to maintain and renovate owned hotels can present challenges, especially when cash generated from operations has declined due to decreased revenues or increased costs, or when government regulations or other factors require expenditures on property improvements that cannot be recovered through rate increases. The effectiveness of any cost-cutting efforts is limited by the fixed-cost nature of our business. As a result, we may not be able to offset revenue reductions through cost cutting, which could further reduce our margins. Further, during times of economic distress, declining demand and declining earnings often result in declining asset values.
In an unfavorable market, we may not be able to sell hotels in the short term. Accordingly, we may not be able to adjust our portfolio promptly in response to economic or other conditions. Similarly, unfavorable markets may make it difficult to refinance mortgage debt as it comes due.
Failure to keep pace with developments in technology could adversely affect our operations or competitive position.
The hospitality industry demands the use of sophisticated technology and systems for hotel management, brand assurance and compliance, procurement, reservation systems, operation of our loyalty program, distribution of hotel resources to current and future guests and guest amenities. These technologies require refinements, including compliance with privacy regulations and requirements of third parties such as the payment card industry. The development and maintenance of these technologies may require significant capital. We cannot assure you that as various systems and technologies become outdated or new technology is required, we will be able to replace or introduce them as quickly as our competition or in a cost-effective and timely manner. We also cannot assure you that we will achieve the benefits we may have been anticipating from any new technology or system.
Failures in, material damage to, or interruptions in our information technology systems, software or websites, including as a result of cyber-attacks, and difficulties in updating our existing software or developing or implementing new software could have a material adverse effect on our business or results of operations.
We depend heavily upon our information technology systems in the conduct of our business. For example, we own, license or otherwise contract for sophisticated technology and systems for hotel management, procurement, reservations, phone switches and the operation of our Returns program. Those systems are subject to damage or interruption from power outages, computer and telecommunications failures, computer viruses, security breaches and natural and manmade disasters. In particular, from time to time we and third parties who serve us experience cyber-attacks, attempted breaches of our or their information technology systems and networks or similar events, which could result in a loss of sensitive business or customer information, systems interruption or the disruption of our operations.
Damage or interruption to our information systems may require a significant investment to fix or replace them, and we may suffer interruptions in our operations in the interim. In addition, costs and potential problems and interruptions associated with the implementation of new or upgraded systems and technology or with maintenance or adequate support of existing systems could also disrupt or reduce the efficiency of our operations. Any material interruptions or failures in our systems, including those that may result from our failure to adequately develop,
30
Table of Contents
implement and maintain a robust disaster recovery plan and backup systems could severely affect our ability to conduct normal business operations and, as a result, may have a material adverse effect on our business or results of operations.
We are vulnerable to various risks and uncertainties associated with our website, including changes in required technology interfaces, website downtime and other technical failures, costs and technical issues as we upgrade our website software, computer viruses, changes in applicable federal and state regulation, security breaches, legal claims related to our website operations and e-commerce fulfillment and other consumer privacy concerns. Our failure to successfully respond to these risks and uncertainties could reduce website sales and have a material adverse effect on our business or results of operations.
Failure of third party technology providers or vendors to provide services and technology in a satisfactory manner could adversely affect our business.
We rely on third parties for the performance of a significant portion of our information technology functions worldwide and the provision of information technology and business process services. The success of our business depends in part on maintaining our relationships with these third parties and their continuing ability to perform these functions and services in a timely and satisfactory manner. If we experience a loss or disruption in the provision of any of these functions or services, or they are not performed in a satisfactory manner, we may have difficulty in finding alternate providers on terms favorable to us, in a timely manner or at all, and our business could be adversely affected.
We rely on certain software vendors to maintain and periodically upgrade many of our information technology systems so that they can continue to support our business. The software programs supporting many of our systems were licensed to us by independent software developers. The inability of these developers or us to continue to maintain and upgrade these information systems and software programs would disrupt or reduce the efficiency of our operations if we were unable to convert to alternate systems in an efficient and timely manner.
We may be exposed to risks and costs associated with protecting the integrity and security of our guests’ personal information.
We are subject to various risks associated with the collection, handling, storage and transmission of sensitive information, including risks related to compliance with U.S. and foreign data collection and privacy laws and other contractual obligations, as well as the risk that our systems collecting such information could be compromised. We collect and maintain information relating to our employees and guests for various business purposes, including managing our workforce and marketing and promotion purposes of our hotel business. Our various information technology systems enter, process, summarize and report such data, including credit card numbers and other personally identifiable information. A significant number of guest purchases are made using credit cards. Additionally, as of September 30, 2014, approximately 19.8% of our guest reservations are placed through our website, including through mobile devices and those reservations made via LQ Instant Hold. In order for our business to function successfully, we must be able to handle and transmit confidential information, including credit card information, securely.
Privacy regulation is an evolving area in which different jurisdictions may subject us to increasingly demanding or inconsistent compliance requirements. Compliance with applicable privacy laws, regulations and policies may increase our operating costs and/or adversely affect
31
Table of Contents
our ability to service hotel guests and market our products, hotels and services to hotel guests. In addition, our failure to comply with applicable privacy laws and regulations, with our own privacy policies or with third-party requirements (or in some circumstances non-compliance by third parties engaged by us), or a breach of security in which personal data are compromised, could result in fines, litigation, adverse reputation impacts, remedial and other expenses, criminal sanctions, or restrictions on the use or transfer of data, which could adversely affect our business. We cannot assure you that our business will always be conducted in compliance with these laws, regulations and policies.
Even if we are fully compliant with such legal standards, we may not be able to prevent security breaches involving guest transaction data and identity theft. In addition, efforts to hack or breach security measures, failures of systems or software to operate as designed or intended, viruses, operator error, or inadvertent releases of data all threaten our information systems and records. Our reliance on computer, Internet-based and mobile systems and communications and the frequency and sophistication of efforts by hackers to gain unauthorized access to such systems have increased in recent years. Any breach, theft, loss, or fraudulent use of guest, employee or Company data could cause consumers to lose confidence in the security of our website and choose not to purchase from us. If a computer hacker or other criminal is able to circumvent our security measures, he or she could destroy or steal valuable information or disrupt our operations. Any security breach could expose us to risks of data loss, litigation and action for damage and could seriously disrupt our operations and harm our reputation, any of which could adversely affect our business.
Failure to comply with marketing and advertising laws, including with regard to direct marketing, could result in fines or place restrictions on our business.
We rely on a variety of direct marketing techniques, including telemarketing, email marketing and postal mailings. Any further restrictions in laws such as the Telephone Consumer Protection Act of 1991, the Telemarketing Sales Rule, CAN-SPAM Act of 2003, and various U.S. state laws, or new federal laws, regarding marketing and solicitation or international data protection laws that govern these activities could adversely affect current or planned marketing activities and could force further changes in our marketing strategy. If this occurs, we may not be able to develop adequate alternative marketing strategies. We also obtain access to potential guests from travel service providers or other companies with whom we have substantial relationships. We market to some individuals on these lists directly or through other companies’ marketing materials. If access to these lists was prohibited or otherwise restricted, our ability to develop new guests, and introduce them to our hotels could be impaired.
The growth of internet reservation channels could adversely affect our business and profitability.
A significant percentage of hotel rooms for individual guests is booked through internet travel intermediaries. We contract with such intermediaries and pay them various commissions and transaction fees for sales of our rooms through their system. If such bookings increase, these intermediaries may be able to obtain higher commissions, reduced room rates or other significant contract concessions from us or our franchisees. Moreover, hospitality intermediaries generally employ aggressive marketing strategies, including expending significant resources for online and television advertising campaigns to drive consumers to their websites. Further, some of these internet travel intermediaries are attempting to commoditize hotel rooms by increasing the importance of price and general indicators of quality at the expense of brand identification.
32
Table of Contents
Consumers may develop brand loyalties to the intermediaries’ websites and reservations systems rather than to the La Quinta brand. If this happens, our business and profitability may be significantly harmed as shifting guest loyalties divert bookings away from our websites, or as the fees charged by third-party websites increase the overall cost of internet bookings for our hotels.
In addition, recent class action litigation against several online travel intermediaries and lodging companies challenges the legality under antitrust law of certain provisions in contracts with third party intermediaries. While the travel intermediaries and lodging companies are vigorously defending this litigation and believe the contract provisions are lawful, the courts will ultimately determine this issue and an adverse outcome could force hotel companies, including us, to alter their business arrangements with these third parties which could have a negative impact on our financial condition and results of operations.
Our reservation system is an important component of the La Quinta brand and a disruption to its functioning could have an adverse effect on our hotels.
We license software from unaffiliated third parties for the La Quinta hotels reservation system. Losing these licenses may adversely affect our ability to maintain a technically adequate reservations system, which, in the absence of suitable alternatives, would inhibit our ability to conduct our business (including our ability to attract and retain franchise arrangements) and, ultimately, diminish our ability to generate revenue.
We manage a reservation system that communicates reservations to our owned and franchised hotels that have been made by individuals directly, either online or by telephone to our call centers, or through intermediaries like travel agents, internet travel web sites and other distribution channels. The cost, speed, efficacy and efficiency of the reservation system, as well as protection of personal or confidential information of its users, are important aspects of the business and are major considerations of franchisees in choosing to affiliate with the La Quinta brand. Any degradation of, failure of adequate development relative to, or security breach of, our reservation system may adversely affect our business.
Our reservation system relies on data communications networks operated by unaffiliated third parties. Any significant interruption of the function of our reservation system (or significant parts of our reservation system) may adversely affect our business as well as our ability to generate revenues.
The cessation, reduction or taxation of program benefits of our Returns loyalty program could adversely affect the La Quinta brand and guest loyalty.
We manage the Returns program for the La Quinta brand. Our owned and franchised hotels contribute a percentage of the guest’s room rate per night to the program for each hotel stay of a Returns program member. We arrange with service providers such as airlines to exchange monetary value represented by points for program awards and we may charge a license fee to such service providers for use of the La Quinta brand trademarks. Returns program members accumulate points based on eligible stays and hotel charges and redeem the points for a range of benefits, including free rooms, airline miles and other items of value. The Returns program is an important aspect of our business and of the affiliation value for hotel owners under franchise agreements. Currently, the program benefits are not taxed as income to members. If the program awards and benefits are materially altered, curtailed or taxed and, as a result, a material number of Returns members choose to stay at non-La Quinta-branded hotels, our business could be adversely affected.
33
Table of Contents
Any failure to protect our trademarks and other intellectual property could reduce the value of our brand and harm our business.
The recognition and reputation of our brand are important to our success. We rely on trademark laws to protect our proprietary rights. The success of our business depends in part upon our continued ability to use our trademarks to increase brand awareness and further develop our brand in both domestic and international markets. From time to time, we apply to have certain trademarks registered; however, we cannot assure you that those trademark or other intellectual property registrations will be granted or that the steps we take to use, control or protect our trademarks or other intellectual property in the United States and other jurisdictions will always be adequate to prevent third parties, including former employees, from copying or using the trademarks or other intellectual property without authorization or in a manner where authorization may not be required. We may also fail to obtain and maintain trademark protection for our brand in all jurisdictions. For example, in certain jurisdictions, third parties have registered or otherwise have the right to use certain trademarks that are the same as or similar to our trademarks, which could prevent us from registering trademarks and opening hotels in that jurisdiction. In addition, “la quinta” is a commonly used term in Central and South America and, as such, we may face greater difficulty protecting our “La Quinta” registered trademarks in those regions. Third parties in those countries may also challenge our rights to certain trademarks or oppose our trademark applications. Defending against any such proceedings may be costly, and if unsuccessful, could result in the loss of important intellectual property rights. Obtaining and maintaining trademark protection for multiple brands in multiple jurisdictions is also expensive, and we may therefore elect not to apply for or to maintain certain trademarks. See “Business—Our trademarks.”
Our intellectual property is also vulnerable to unauthorized copying or use in some jurisdictions outside the United States, where local law, or lax enforcement of law, may not adequately protect it. If our trademarks or other intellectual property are misappropriated, or otherwise used in a manner where authorization may not be required, the La Quinta brand, including its value and reputation, could be harmed.
We monitor the unauthorized copying or use of intellectual property in the United States and other countries in which we operate or plan to operate. However, it is difficult to protect against every possible unauthorized use of our trademarks or other intellectual property and there are times where we have resorted, and may in the future resort, to litigation to enforce our intellectual property rights. Litigation of this type could be costly, force us to divert our resources, lead to counterclaims or other claims against us or otherwise harm our business or reputation. In addition, we license certain of our trademarks to third parties. For example, we grant our franchisees a right to use certain of our trademarks in connection with their operation of the applicable hotel. If a franchisee or other licensee fails to maintain the quality of the goods and services used in connection with the licensed trademarks, our rights to, and the value of, our trademarks could potentially be harmed. Negative publicity relating to the franchisee or licensee could also be incorrectly associated with us, which could harm our business. Failure to maintain, control and protect our trademarks and other intellectual property would likely adversely affect the ability of our hotels to generate revenues or our ability to enter into new franchise agreements.
34
Table of Contents
Third-party claims that we infringe patent, trademark, copyright or other intellectual property rights or misappropriate trade secrets of others could subject us to damages and other costs and expenses.
Third parties may make claims against us for infringing their patent, trademark, copyright or other intellectual property rights or for misappropriating their trade secrets. Any such claims, even those without merit, could:
| • | be expensive and time consuming to defend; |
| • | force us to stop using the intellectual property that is being challenged, or to stop providing products or services that use the challenged intellectual property; |
| • | force us to rebrand our services; |
| • | divert management’s attention and resources; |
| • | force us to enter into royalty, licensing, co-existence or other agreements to obtain the right to use a third party’s intellectual property; |
| • | limit the use or the scope of our intellectual property or other rights; |
| • | force us to pay significant damages; and |
| • | limit where we can open future hotels. |
In addition, we may be required to indemnify franchisees for any losses they incur as a result of any such infringement claims. All necessary royalty, licensing or other agreements may not be available to us at all or on acceptable terms. Any costs, lost revenues, changes to our business or diversion of management attention related to intellectual property claims against us, whether successful or not, could adversely affect our business.
Because a component of our strategy is to continue to grow our franchise business internationally, the risks of doing business internationally could lower our revenues, increase our costs, reduce our profits or disrupt our business.
At September 30, 2014, eight of our 501 franchised hotels were located outside of the United States, which represents approximately 1.6% of our total franchised hotels. We expect to increase the number of franchised hotels located outside of the United States in the coming years, with approximately 10.2% of our pipeline relating to hotels located outside the United States. As a result, we are and will be, on an increasing basis, subject to the risks of doing business outside the United States, including:
| • | recessionary trends or economic instability in international markets; |
| • | changes in foreign currency exchange rates or currency restructurings and hyperinflation or deflation in the countries in which we operate; |
| • | the imposition of restrictions on currency conversion or the transfer of funds or limitations on our ability to repatriate non-U.S. earnings in a tax effective manner; |
| • | the presence and acceptance of varying levels of business corruption in international markets; |
| • | the impact of various anti-corruption and other laws; |
35
Table of Contents
| • | the ability to comply with, or impact of complying with, complex and changing laws, regulations and policies of foreign governments that may affect investments or operations, including foreign ownership restrictions, import and export controls, tariffs, embargoes, licensing requirements and regulations, increases in taxes paid and other changes in applicable tax laws; |
| • | uncertainties as to local laws and enforcement of contract and intellectual property rights; |
| • | the difficulties involved in managing an organization doing business in many different countries; |
| • | rapid changes in governmental, economic and political policies, political or civil unrest, acts of terrorism or the threat of international boycotts or U.S. anti-boycott legislation; |
| • | increases in anti-American sentiment and the identification of the licensed brands as an American brand; |
| • | forced nationalization of franchised hotels by local, state or national governments; |
| • | the effect of disruptions caused by severe weather, natural disasters, outbreak of disease or other events that make travel to a particular region less attractive or more difficult; and |
| • | political and economic instability. |
Any or all of these factors may adversely affect the income from and the market value of our hotels located in international markets. In addition, the economy of any region in which our hotels are located may be adversely affected to a greater degree than that of other areas of the country or the world by certain developments affecting industries concentrated in that region or country. A decline in the general economic condition in regions or countries in which our hotels are located could result in a decrease in hotel demand in the region, and the income from and market value of these hotels may be adversely affected. Over time, room rates in regions can fluctuate and have historically fluctuated widely. While these factors and the impact of these factors are difficult to predict, any one or more of them could lower our revenues, increase our costs, reduce our profits or disrupt our business, and as our international operations increase, these risks will become more pronounced.
A number of our owned hotels are subject to ground leases; if we are found to be in breach of a ground lease or are unable to renew a ground lease, we could be adversely affected.
Twenty of our owned hotels are either completely or partially on land subject to ground leases. If we are found to be in breach of a ground lease or ground sublease, such ground lease or sublease could be terminated. Assuming that we exercise all available options to extend the terms of our ground leases and ground subleases, all of our ground leases and ground subleases will expire between 2014 and 2102, with two expiring in the next three years. However, in certain cases, our ability to exercise such options is subject to the condition that we are not in default under the terms of the ground lease or ground sublease, as applicable, at the time that we exercise such options and/or the time such extension occurs, and we can provide no assurances that we will be able to exercise our options at such time. Furthermore, we can provide no assurances that we will be able to renew our ground leases and ground subleases upon expiration. If a ground lease or ground sublease expires or is terminated, we would be unable to derive income from such hotel, which could adversely affect us.
36
Table of Contents
If an appropriate opportunity becomes available, we may seek to expand through acquisitions of and investments in other businesses and hotels, or through alliances. We may also seek to divest some of our hotels and other assets. These acquisition and disposition activities may be unsuccessful or divert management’s attention.
We may consider strategic and complementary acquisitions of and investments in other hotel or hospitality brands, businesses, hotels or other assets. Furthermore, we may pursue these opportunities in alliance with existing or prospective owners of franchised hotels. In many cases, we will be competing for these opportunities with third parties that may have substantially greater financial resources than us. Acquisitions or investments in brands, businesses, hotels or assets as well as these alliances are subject to risks that could affect our business, including risks related to:
| • | issuing shares of stock that could dilute the interests of our existing stockholders; |
| • | spending cash and incurring debt; |
| • | assuming contingent liabilities; or |
| • | creating additional expenses. |
We cannot assure you that we will be able to identify opportunities or complete transactions on commercially reasonable terms or at all, or that we will actually realize any anticipated benefits from such acquisitions, investments or alliances. There may be high barriers to entry in certain key markets and scarcity of available development and investment opportunities in desirable locations. Similarly, we cannot assure you that we will be able to obtain financing for acquisitions or investments on attractive terms or at all, or that the ability to obtain financing will not be restricted by the terms of our indebtedness.
The success of any such acquisitions or investments also will depend, in part, on our ability to integrate the acquisition or investment with our existing operations. We may experience difficulty with integrating acquired businesses, hotels or other assets, including difficulties relating to:
| • | coordinating sales, distribution, and marketing functions; |
| • | integrating technology information systems; and |
| • | preserving the important guest, labor and other relationships of the acquired assets. |
Divestment of some of our hotels or assets may yield lower than expected returns. In some circumstances, sales of hotels or other assets may result in losses. Upon a sale of hotels or assets, we may become subject to contractual indemnity obligations, incur material losses, including impairment charges, or tax liabilities or, as a result of required debt repayment, face a shortage of liquidity. In addition, any acquisitions, investments, dispositions or alliances could demand significant attention from management that would otherwise be available for business operations, which could harm our business.
Governmental regulation may adversely affect the operation of our hotels.
The hotels that we operate are subject to extensive local, regional and national regulations and, on a periodic basis, must obtain various licenses and permits. The laws and regulations of states, counties, cities, provinces and other political subdivisions may also require certain registration, disclosure statements and other practices with respect to the franchising of hotels. Any failure to identify, obtain or maintain required licenses and permits could result in adverse consequences.
The hotel industry is subject to extensive federal, state and local governmental regulations in the United States and the other countries in which our franchised hotels operate, including those
37
Table of Contents
relating to building and zoning requirements and those relating to the preparation and sale of food. Hotels and their owners and operators are also subject to licensing and regulation by state and local departments relating to health, sanitation, fire and safety standards, and to laws governing their relationships with employees, including minimum wage requirements, overtime, working conditions and citizenship requirements. In connection with the continued operation or remodeling of certain of our hotels, we or our franchisees may be required to expend funds to meet federal, state and local regulations. For example, we may incur significant costs complying with the Americans with Disabilities Act (“ADA”), which requires that all public accommodations meet certain federal requirements related to access and use by disabled persons. The regulations also mandate certain operational requirements that hotel operators must observe. If, pursuant to the ADA, we are required to make substantial alterations to, and capital expenditures for, our hotels, including removal of access barriers, it could increase our expenditures and, in turn, could reduce our earnings. Any failure to obtain or maintain any such licenses or any publicity resulting from actual or alleged violations of any such laws and regulations could result in injunctive relief, fines, damage awards or capital expenditures and could have an adverse effect on our results of operations. Moreover, new or revised laws and regulations or new interpretations of existing laws and regulations could affect the operation of our hotels or result in significant additional expense and operating restrictions on us and our franchisees.
In addition, we may be subject to certain laws and regulations that govern the offer and sale of franchises, including regulations promulgated by the Federal Trade Commission (the “FTC”). Many franchise laws impose substantive requirements on franchise agreements, including limitations on provisions concerning the termination or non-renewal of a franchise. The FTC requires franchisors to make extensive disclosure to prospective franchisees but does not require registration. Some franchise laws require that certain materials be registered before franchises can be offered or sold in that state. The failure to obtain or retain licenses or approvals to sell franchises could adversely affect us and our franchisees.
Failure to comply with laws and regulations applicable to our international operations may increase costs, reduce profits, limit growth or subject us to broader liability.
Our business operations in countries outside the United States are subject to a number of U.S. federal laws and regulations, including restrictions imposed by the Foreign Corrupt Practices Act (“FCPA”) as well as trade sanctions administered by the Office of Foreign Assets Control (“OFAC”) and the Commerce Department. The FCPA is intended to prohibit bribery of foreign officials or parties and requires public companies in the United States to keep books and records that accurately and fairly reflect those companies’ transactions. OFAC and the Commerce Department administer and enforce economic and trade sanctions based on U.S. foreign policy and national security goals against targeted foreign states, organizations and individuals. Some of our business operations are also subject to the laws and regulations of non-U.S. jurisdictions, including anti-corruption legislation in the countries in which we conduct operations. If we fail to comply with these laws and regulations, we could be exposed to claims for damages, financial penalties, reputational harm, incarceration of our employees or restrictions on our operation, ownership or franchising of hotels, including the termination of our franchise and ownership rights. These restrictions could increase our costs of operations, reduce our profits or cause us to forgo development opportunities that would otherwise support our growth.
In August 2012, Congress enacted the Iran Threat Reduction and Syria Human Rights Act of 2012 (“ITRSHRA”), which expands the scope of U.S. sanctions against Iran. More specifically, Section 219 of the ITRSHRA amended the Exchange Act to require companies subject to Securities
38
Table of Contents
and Exchange Commission, or SEC, reporting obligations under Section 13 of the Exchange Act to disclose in their periodic reports specified dealings or transactions involving Iran or other individuals and entities targeted by certain OFAC sanctions engaged in by the reporting company or any of its affiliates during the period covered by the relevant periodic report. In some cases, ITRSHRA requires companies to disclose these types of transactions even if they were permissible under U.S. law. These companies are required to separately file with the SEC a notice that such activities have been disclosed in the relevant periodic report, and the SEC is required to post this notice of disclosure on its website and send the report to the U.S. President and certain U.S. Congressional committees. The U.S. President thereafter is required to initiate an investigation and, within 180 days of initiating such an investigation, to determine whether sanctions should be imposed. Under ITRSHRA, we would be required to report if we or any of our “affiliates” knowingly engaged in certain specified activities during the period covered by the report. Because the SEC defines the term “affiliate” broadly, it includes any entity controlled by us as well as any person or entity that controls us or is under common control with us. Because we may be deemed to be a controlled affiliate of Blackstone, affiliates of Blackstone may also be considered our affiliates. Disclosure of such activity by us or our affiliates, even if such activity is not subject to sanctions under applicable law, and any sanctions actually imposed on us or our affiliates as a result of these activities, could harm our reputation and have a negative impact on our business.
Foreign or U.S. environmental laws and regulations may cause us to incur substantial costs or subject us to potential liabilities.
We are subject to certain compliance costs and potential liabilities under various foreign and U.S. federal, state and local environmental, health and safety laws and regulations. These laws and regulations govern actions including air emissions, the use, storage and disposal of hazardous and toxic substances, and wastewater disposal. Our failure to comply with such laws, including any required permits or licenses, could result in substantial fines or possible revocation of our authority to conduct some of our operations. We could also be liable under such laws for the costs of investigation, removal or remediation of hazardous or toxic substances at our currently or formerly owned, operated or franchised hotels or at third-party locations in connection with our waste disposal operations, regardless of whether or not we knew of, or caused, the presence or release of such substances. Some laws may regard us as having liability as an operator by virtue of how we may implement our franchise agreements, rendering us potentially responsible for addressing environmental or other conditions existing at our franchised hotels. In some cases, we may be entitled to indemnification from the party that caused the contamination, or pursuant to our franchise agreements, but there can be no assurance that we would be able to recover all or any costs we incur in addressing such problems. From time to time, we may be required to remediate such substances or remove, abate or manage asbestos, mold, radon gas, lead or other hazardous conditions at our hotels. The presence or release of such toxic or hazardous substances could result in third-party claims for personal injury, property or natural resource damages, business interruption or other losses. Such claims and the need to investigate, remediate, or otherwise address hazardous, toxic or unsafe conditions could adversely affect our operations, the value of any affected hotel, or our ability to sell, lease or assign our rights in any such hotel, or could otherwise harm our business or reputation. Environmental, health and safety requirements have also become increasingly stringent, and our costs may increase as a result. For example, Congress, the U.S. Environmental Protection Agency, or EPA, and some states are considering or have undertaken actions to regulate and reduce greenhouse gas emissions. New or revised laws and regulations or new interpretations of existing laws and regulations, such as
39
Table of Contents
those related to climate change, could affect the operation of our owned and franchised hotels or result in significant additional expense and operating restrictions on us and our franchisees. The potential for changes in the frequency, duration and severity of extreme weather events that may be a result of climate change could lead to significant property damage at our hotels and other assets, impact our ability to obtain insurance coverage in areas that are most vulnerable to such events, and have a negative effect on revenues.
Asbestos, lead-based paint, mold and other hotel related issues could expose us to substantial liability.
Certain U.S. and foreign laws impose liability for the release of asbestos containing materials into the air or require the removal or containment of asbestos containing materials, and third parties may seek recovery from owners or operators of real properties for personal injury associated with exposure to toxic or hazardous substances. Some of our owned hotels may have asbestos containing materials, and when these materials have been discovered, we have taken action as and when required by applicable law. Such laws require that, as owners or operators of buildings containing asbestos, we must (i) properly manage and maintain the asbestos, (ii) notify and train those who may come into contact with asbestos and (iii) undertake special precautions, including removal or other abatement, if asbestos would be disturbed during renovation or demolition of a building. Such laws may impose fines and penalties on us if we fail to comply with these requirements and may allow third parties to seek recovery for personal injury associated with exposure to asbestos fibers, which could significantly increase our operating costs and reduce our earnings.
In addition, certain laws impose liability for lead based paint, and third parties may seek recovery from owners or operators of real properties for personal injury associated with lead based paint. Limits are placed on the amount of lead that may be present in public drinking water supplies, and third parties may seek recovery from owners or operators of real properties for injuries arising from exposure to high lead concentration.
Other materials used in the construction of our owned hotels that are currently thought to be safe may in the future be determined to be hazardous, and could expose us to substantial liability for damages, injuries, adverse health effects or removal and disposal costs. In addition, other building supplies thought to be appropriate for their use, while not toxic, have been discovered to be defective (such as fire-retardant plywood or polybutylene piping). Defects in such supplies have resulted in substantial costs on the part of the owners or operators of affected hotels to remove and replace the defective materials. Materials currently thought to be appropriate or safe may in the future prove to be defective, and could result in substantial costs or losses.
Problems associated with mold may pose risks to our hotels and also may be the basis for personal injury claims against us. There is no generally accepted standard for the assessment of mold. If left unchecked or inadequately addressed, the growth of mold could result in litigation and remediation expenses, or in a closure of some or all of a hotel, that could adversely affect revenues from an individual hotel. We have discovered that some of our owned hotels have problems with mold. The presence of mold at some of our owned hotels has required us to undertake a remediation program to remove the mold from the affected hotels. The cost of remediation to date has not been material. However, remediation costs may substantially increase if there is mold in our other hotels or if costs related to mold such as legal and insurance expense continue to increase rapidly, which could significantly increase our operating costs and reduce our earnings.
40
Table of Contents
Additionally, the U.S. Environmental Protection Agency has identified certain health risks associated with elevated radon gas in buildings, and has recommended that certain mitigating measures be considered. It is possible that other environmental conditions not currently known, or known but not currently thought to be dangerous, may in the future be determined to present a risk to health or safety, such as with respect to possible exposure to waterborne pathogens.
Franchisees are exposed to the same risks with respect to the hotels that they own and operate. Additionally, some laws may regard us as having liability as an operator by virtue of how we may implement our franchise agreements, rendering us potentially responsible for addressing environmental or other conditions existing at our franchised hotels. Our franchise agreements typically require our franchisees to assume and indemnify us against such liabilities, but there can be no assurance that governmental authorities will not look directly to us to address such matters or that we would be able to recover from our hotel owners any costs we incur in doing so.
For all of these reasons, the presence of, or potential for contamination by, such hazardous or toxic substances, or exposure to pathogens, at, on, under, adjacent to, emanating from, or in any of our hotels could materially adversely affect the operations, the value of such hotel or the ability to attract guests to such hotel, or could otherwise harm our business or reputation.
We are subject to risks from litigation filed by or against us.
In the normal course of our business, we are often involved in various legal proceedings. We cannot predict with certainty the cost of defense, the cost of prosecution or the ultimate outcome of these legal proceedings. Additionally, legal or governmental proceedings brought by or on behalf of franchisees, employees or guests may adversely affect our financial results. In recent years, a number of hospitality companies have been subject to lawsuits, including class action lawsuits, alleging violations of federal laws and regulations regarding workplace and employment matters, consumer protection claims and other commercial matters. A number of these lawsuits have resulted in the payment of substantial damages by the defendants through adverse judgments or settlement agreements. Similar lawsuits have been and may be instituted against us from time to time, and we may incur substantial damages and expenses resulting from lawsuits of this type, which could have a material adverse effect on our business. From time to time, we may also be engaged in lawsuits against franchisees. Similarly, we may from time to time institute legal proceedings on behalf of ourselves or others. The ultimate outcome of any such lawsuits or legal proceedings could cause us to incur substantial damages and expenses, which could have a material adverse effect on our business.
The loss of senior executives or key field personnel, such as general managers, could significantly harm our business.
Our ability to maintain our competitive position depends to a large degree on the efforts and skills of our senior executives. On average, our executive management team members have 19 years of experience in lodging and lodging related industries or have other relevant experience; however, we cannot guarantee that these individuals will remain with us. Finding suitable replacements for senior executives could be difficult. We currently do not have a life insurance policy or key person insurance policy with respect to any of our senior executives. Losing the services of one or more of these senior executives could adversely affect strategic relationships, including relationships with franchisees and vendors, and limit our ability to execute our business strategies.
41
Table of Contents
We also rely on the general managers at each of our owned hotels to manage daily operations and oversee the efforts of their team members. These general managers are trained professionals in the hospitality industry and have extensive experience in many markets worldwide. The failure to retain, train or successfully manage general managers for our owned hotels could negatively affect our operations.
Labor shortages and increase in minimum wage rates could restrict our ability to operate our hotels or grow our business or result in increased labor costs that could reduce our profits.
Our success depends in large part on our ability to attract, retain, train, manage and engage employees. If we are unable to attract, retain, train, manage and engage skilled employees, our ability to manage and staff the owned hotels adequately could be impaired, which could reduce guest satisfaction. In addition, the inability of our franchisees to attract, retain, train, manage and engage skilled employees for the franchised hotels could adversely affect our business. Staffing shortages also could hinder our ability to grow and expand our businesses. Because payroll costs are a major component of the operating expenses at our hotels, a shortage of skilled labor could also require higher wages that would increase labor costs, which could adversely affect our profits and the profits of our franchisees. In addition, increases in minimum wage rates could result in significantly increased costs and reduced profits for us and our franchisees.
Higher health care costs and labor costs could adversely affect our business.
With the passage in 2010 of the U.S. Patient Protection and Affordable Care Act (the “Act”), we are required to provide affordable coverage, as defined in the Act, to all employees, or otherwise be subject to a payment per employee based on the affordability criteria in the Act. Many of these requirements will be phased in over a period of time, with the majority of the most impactful provisions affecting us presently anticipated to begin in 2015. Additionally, some states and localities have passed state and local laws mandating the provision of certain levels of health benefits by some employers. Increased health care and insurance costs could have an adverse effect on our business, financial condition and results of operations. In addition changes in federal or state workplace regulations could adversely affect our ability to meet our financial targets.
Attempts by labor organizations to organize groups of our employees or changes in labor laws could disrupt our operations, increase our labor costs or interfere with the ability of our management to focus on implementing our business strategies.
Although none of our employees are currently covered under collective bargaining agreements, we cannot guarantee that our employees will not elect to be represented by labor unions in the future. We may become subject to collective bargaining agreements, similar agreements or regulations enforced by governmental entities in the future. Changes in the federal regulatory scheme could make it easier for unions to organize groups of our employees. If relationships with our employees become adverse, our hotels could experience labor disruptions such as strikes, lockouts and public demonstrations. Additionally, if such changes take effect, our employees could be subject to organizational efforts, which could potentially lead to disruptions or require our management’s time to address unionization issues.
Labor regulation could also lead to higher wage and benefit costs, changes in work rules that raise operating expenses and legal costs, and limit our ability to take cost saving measures during economic downturns. For example, on July 29, 2014, the general counsel of the National Labor
42
Table of Contents
Relations Board ruled that McDonald’s could be held jointly liable for labor and wage violations by its franchise operations. If such ruling is not overturned and is deemed applicable to other businesses with a significant number of franchises, such as La Quinta, we could be held party liable in cases of overtime, wage or union-organizing violations.
These or similar agreements, legislation or changes in regulations could disrupt our operations, hinder our ability to cross-train and cross-promote our employees due to prescribed work rules and job classifications, reduce our profitability or interfere with the ability of our management to focus on executing our business and operating strategies.
If the insurance that we or our franchisees carry does not sufficiently cover damage or other potential losses or liabilities to third parties involving our hotels, our profits could be reduced.
We carry, and we require our franchisees to carry, insurance from insurance carriers that we believe is adequate for foreseeable first and third party losses and with terms and conditions that we believe are reasonable and customary. Nevertheless, market forces beyond our control could limit the scope of the insurance coverage that we and our franchisees can obtain or restrict our or our franchisees’ ability to buy insurance coverage at reasonable rates. In the event of a substantial loss, the insurance coverage that we or our franchisees carry may not be sufficient to reimburse us in full for our losses or pay the full value of financial obligations, liabilities or the replacement cost of any lost investment or property loss, which could adversely affect our profits. In addition, risks that may fall outside the general coverage terms and limits of the policies and certain types of losses that are significantly uncertain, or generally of a catastrophic nature, such as hurricanes, earthquakes and floods or terrorist acts, may be uninsurable or not economically insurable. If such losses or events occur, they could cause substantial damage to our hotels or our franchised hotels or the surrounding area, without any insurance coverage. Further, we and our franchisees may not be able to obtain or renew insurance policies or, if we or our franchisees are able to obtain or renew our coverage, it may be at a significantly higher cost than the historic cost.
In addition, insurance coverage for our hotels and for casualty losses does not customarily cover damages that are characterized as punitive or similar damages. As a result, any claims or legal proceedings, or settlement of any such claims or legal proceedings that result in damages that are characterized as punitive or similar damages may not be covered by our insurance. If these types of damages are substantial, our financial condition and results of operation may be adversely affected.
In some cases, these factors could result in certain losses being completely uninsured. As a result, we or our franchisees could lose some or all of the capital invested in a hotel, as well as the anticipated future revenues and profits from the hotel. We or our franchisees could suffer an uninsured or underinsured loss, and we may not have sufficient insurance to cover awards of damages resulting from claims made against us.
Terrorism insurance may not be available at all or at commercially reasonable rates.
Following the September 11, 2001 terrorist attacks in New York City and the Washington, D.C. area, Congress passed the Terrorism Risk Insurance Act of 2002, which established the Terrorism Insurance Program to provide insurance capacity for terrorist acts. On December 26, 2007, the Terrorism Insurance Program was extended by the Terrorism Risk Insurance Program Reauthorization Act of 2007 through December 31, 2014, or TRIPRA. We carry insurance from insurance carriers to respond to both first-party and third-party liability losses related to
43
Table of Contents
terrorism. We purchase our first-party property damage and business interruption insurance from a stand-alone market in place of and to supplement insurance from government run pools. If TRIPRA is not extended or renewed upon its expiration in 2014, premiums for terrorism insurance coverage will likely increase and/or the terms of such insurance may be materially amended to increase stated exclusions or to otherwise effectively decrease the scope of coverage available, perhaps to the point where it is effectively unavailable.
Terrorist attacks and military conflicts may adversely affect the hospitality industry.
The terrorist attacks on the World Trade Center and the Pentagon on September 11, 2001 underscore the possibility that large public facilities or economically important assets could become the target of terrorist attacks in the future. The occurrence or the possibility of terrorist attacks or military conflicts could generally reduce travel to affected areas for tourism and business or adversely affect the willingness of guests to stay in or avail themselves of hotel services and result in higher costs for security and insurance premiums or diminish the availability of insurance coverage for losses related to terrorist attacks, all of which could adversely affect our financial condition and results of operations.
Changes to estimates or projections used to assess the fair value of our assets, or operating results that are lower than our current estimates at certain locations, may cause us to incur impairment charges that could adversely affect our results of operations.
Our total assets include intangible assets with an indefinite life, other intangible assets with finite useful lives, and substantial amounts of long-lived assets, principally property and equipment, including hotels. We analyze our assets for impairment on an annual basis or more frequently if events or changes in circumstances indicate that an asset might be impaired. Our evaluation of impairment requires us to make certain estimates and assumptions including projections of future results. After performing our evaluation for impairment, including an analysis to determine the recoverability of long-lived assets, we will record an impairment loss when the carrying value of the underlying asset, asset group or reporting unit exceeds its fair value. In connection with the ultimate disposition of certain our hotels, we determined that property and equipment related to these hotels were partially impaired primarily due to a decrease in assumed holding period, and in 2013 and 2012, we recorded impairment losses of approximately $19.5 million and $51.5 million, respectively. For the year ended December 31, 2013, no impairment was recorded on our assets held for use. In June 2014, we determined that the long-lived assets associated with one of our owned hotels were partially impaired primarily due to unfavorable expected terms of the upcoming underlying ground lease renewal and the high likelihood of the Company abandoning the hotel upon expiration of the ground lease. As a result, we recorded an impairment loss of approximately $5.2 million for the nine months ended September 30, 2014. If the estimates or assumptions used in our evaluation of impairment change, we may be required to record additional impairment charges on certain of these assets. During times of economic distress, declining demand and declining earnings often result in declining asset values. If any impairment losses we recognize are significant, our financial condition and results of operations would be adversely affected.
Changes in federal, state, local or foreign tax law or interpretations of existing tax law, or adverse determinations by tax authorities, could increase our tax burden or otherwise adversely affect our financial condition, results of operations or cash flows.
We are subject to taxation at the federal, state and local levels in the U.S. and other countries and jurisdictions. Our future effective tax rate could be affected by changes in the composition
44
Table of Contents
of earnings in jurisdictions with differing tax rates, changes in statutory rates and other legislative changes, changes in the valuation of our deferred tax assets and liabilities, or changes in determinations regarding the jurisdictions in which we are subject to tax. From time to time, the U.S. federal, state and local and foreign governments make substantive changes to tax rules and their application, which could result in materially higher taxes than would be incurred under existing tax law or interpretation and could adversely affect our profitability, financial condition, results of operations or cash flows. State and local tax authorities have also increased their efforts to increase revenues through changes in tax law and audits. Such changes and proposals, if enacted, could increase our future effective income tax rates. We are subject to ongoing and periodic tax audits and disputes in various jurisdictions. An unfavorable outcome from any tax audit could result in higher tax costs, penalties and interest, thereby adversely impacting our financial condition, results of operations or cash flows.
We are currently under audit by the Internal Revenue Service and may be required to pay additional taxes.
The Internal Revenue Service (the “IRS”) is currently auditing the tax returns of La Quinta Corporation, one of our former REITs prior to the Pre-IPO Transactions, and BRE/LQ Operating Lessee Inc., one of our former taxable REIT subsidiaries prior to the Pre-IPO Transactions, in each case for the tax years ended December 31, 2010 and 2011. We received a draft notice of proposed adjustment from the IRS on January 9, 2014, and the notice of proposed adjustment was issued to us on June 2, 2014. We submitted a timely response to the notice of proposed adjustment and, on July 7, 2014, we received an IRS 30-Day Letter proposing to impose a 100% tax on the REIT totaling $158 million for the periods under audit in which the IRS has asserted that the rent charged for these periods under the lease of hotel properties from the REIT to the taxable REIT subsidiary exceeded an arm’s length rent. In addition, the IRS proposed to eliminate $89 million of net operating loss carryforwards for the taxable REIT subsidiary for the tax years 2006 through 2009; however, in an IRS rebuttal received on September 26, 2014, the IRS conceded its proposed adjustment on this point was incorrect. We disagree with the IRS’ position with respect to rents charged by the REIT to its taxable REIT subsidiary and have appealed the proposed tax and adjustments to the IRS Appeals Office. In determining amounts payable by our taxable REIT subsidiary under the lease, we engaged a third party to prepare a transfer pricing study contemporaneous with the lease which concluded that the lease terms were consistent with an arm’s length rent as required by relevant provisions of the Internal Revenue Code of 1986 (the “Internal Revenue Code”) and applicable Treasury Regulations. We believe the IRS transfer pricing methodologies applied in the audits contain flaws and that the IRS proposed tax and adjustments are inconsistent with the U.S. federal tax laws related to REITs. We have concluded that the positions reported on our tax returns under audit by the IRS are, based on their technical merits, more-likely-than-not to be sustained upon examination. Accordingly, as of September 30, 2014, we have not established any reserves related to this proposed adjustment or any other issues reflected on the returns under examination. If, however, we are unsuccessful in challenging the IRS, an excise tax would be imposed on the REIT equal to 100% of the excess rent. Such adjustments could also give rise to additional state income taxes. The IRS has also indicated that it intends to review similar issues with respect to subsequent taxable years of the REIT and taxable REIT subsidiary. The IRS may also raise other issues in the course of examining our tax returns that could result in additional proposed adjustments. If the IRS were successful in its challenges, we could owe additional income taxes, interest and penalties, which could adversely affect our financial condition, results of operations and cash flow and the price of our common stock.
45
Table of Contents
Although neither we nor any of our subsidiaries has been a REIT for United States federal income tax purposes following the IPO, there can be no assurance that the IRS will not challenge the Existing Entities’ REIT status for previous years in which they elected REIT status. If the IRS were to successfully challenge the previous REIT status of any such entity, we may be required to pay additional taxes.
Certain of the Existing Entities elected to be treated as REITs for United States federal income tax purposes for taxable years ended on and prior to the date of the IPO. Following consummation of the IPO, neither we nor any of our subsidiaries has been a REIT for United States federal income tax purposes. However, there can be no assurance that the IRS will not challenge the Existing Entities’ REIT qualification for previous years in which they elected REIT status. Qualification as a REIT involves the application of highly technical and complex provisions of the Internal Revenue Code for which only a limited number of judicial or administrative interpretations exist. Although we believe that each of the Existing Entities that elected to be treated as a REIT met all of these requirements and qualified as a REIT in each of the years REIT status was elected, if the IRS were to successfully challenge the previous REIT status of any such entity, we could be liable for additional income taxes, interest and penalties, which could adversely affect our financial condition, results of operations and cash flow and the price of our common stock.
Changes to accounting rules or regulations may adversely affect our results of operations.
New accounting rules or regulations and varying interpretations of existing accounting rules or regulations have occurred and may occur in the future. A change in accounting rules or regulations may even affect our reporting of transactions completed before the change is effective, and future changes to accounting rules or regulations or the questioning of current accounting practices may adversely affect our financial condition and results of operations. For example, in 2013, the Financial Accounting Standards Board (“FASB”) issued a revised exposure draft outlining proposed changes to current lease accounting in FASB Accounting Standards Codification (“Codification” or “ASC”) Topic 840, “Leases” and certain of our owned hotels are located on land that is leased from third parties. The proposed Accounting Standards Update, if ultimately adopted in its current form, could result in significant changes to current accounting, including the capitalization of leases on the balance sheet that currently are recorded off balance sheet as operating leases. While this change would not impact the cash flow related to our leased hotels and other leased assets, it could adversely impact our balance sheet and could therefore impact our ability to raise financing from banks or other sources.
Risks relating to our indebtedness
Our substantial indebtedness could adversely affect our financial condition, our ability to raise additional capital to fund our operations, our ability to operate our business, our ability to react to changes in the economy or our industry and our ability to pay our debts and could expose us to interest rate risk to the extent of our variable debt and divert our cash flow from operations to make debt payments.
We have a significant amount of indebtedness. As of September 30, 2014, our total indebtedness was approximately $1.9 billion. Our substantial debt could have important consequences, including:
| • | requiring a substantial portion of cash flow from operations to be dedicated to the payment of principal and interest on our indebtedness, thereby reducing our ability to use our cash flow to fund our operations, capital expenditures and pursue future business opportunities; |
46
Table of Contents
| • | increasing our vulnerability to adverse economic, industry or competitive developments; |
| • | exposing us to increased interest expense, as our degree of leverage may cause the interest rates of any future indebtedness (whether fixed or floating rate interest) to be higher than they would be otherwise; |
| • | exposing us to the risk of increased interest rates because certain of our indebtedness is at variable rates of interest; |
| • | making it more difficult for us to satisfy our obligations with respect to our indebtedness, and any failure to comply with the obligations of any of our debt instruments, including restrictive covenants, could result in an event of default that accelerates our obligation to repay indebtedness; |
| • | restricting us from making strategic acquisitions or causing us to make non-strategic divestitures; |
| • | limiting our ability to obtain additional financing for working capital, capital expenditures, hotel development, satisfaction of debt service requirements, acquisitions and general corporate or other purposes; and |
| • | limiting our flexibility in planning for, or reacting to, changes in our business or market conditions and placing us at a competitive disadvantage compared to our competitors who may be better positioned to take advantage of opportunities that our leverage prevents us from exploiting. |
In addition, we are a holding company and substantially all of our consolidated assets are owned by, and most of our business is conducted through, our subsidiaries. Revenues from these subsidiaries are our primary source of funds for debt payments and operating expenses. If our subsidiaries are restricted from making distributions to us, that may impair our ability to meet our debt service obligations or otherwise fund our operations. Moreover, there may be restrictions on payments by subsidiaries to their parent companies under applicable laws, including laws that require companies to maintain minimum amounts of capital and to make payments to stockholders only from profits. As a result, although a subsidiary of ours may have cash, we may not be able to obtain that cash to satisfy our obligation to service our outstanding debt or fund our operations.
Servicing our indebtedness will require a significant amount of cash. Our ability to generate sufficient cash depends on many factors, some of which are not within our control.
Our ability to make payments on our indebtedness and to fund planned capital expenditures will depend on our ability to generate cash in the future. To a certain extent, this is subject to general economic, financial, competitive, legislative, regulatory and other factors that are beyond our control. If we are unable to generate sufficient cash flow to service our debt and meet our other commitments, we may need to restructure or refinance all or a portion of our debt, sell material assets or operations or raise additional debt or equity capital. We may not be able to effect any of these actions on a timely basis, on commercially reasonable terms or at all, and these actions may not be sufficient to meet our capital requirements. In addition, the terms of our existing or future debt arrangements may restrict us from effecting any of these alternatives. Our failure to make the required interest and principal payments on our indebtedness would result in an event of default under the agreement governing such indebtedness, which may result in the acceleration of some or all of our outstanding indebtedness.
47
Table of Contents
Despite our current level of indebtedness, we may be able to incur substantially more debt and enter into other transactions, which could further exacerbate the risks to our financial condition described above.
We may be able to incur significant additional indebtedness in the future. Although the credit agreement governing the senior secured credit facilities will contain restrictions on the incurrence of additional indebtedness and entering into certain types of other transactions, these restrictions are subject to a number of qualifications and exceptions. Additional indebtedness incurred in compliance with these restrictions could be substantial. These restrictions also do not prevent us from incurring obligations, such as trade payables, that do not constitute indebtedness as defined under our debt instruments. To the extent new debt is added to our current debt levels, the substantial leverage risks described in the preceding two risk factors would increase.
The credit agreement governing the senior secured credit facilities contains, and future debt agreements may contain, restrictions that may limit our flexibility in operating our business.
The credit agreement governing the senior secured credit facilities contains operating covenants that limit the discretion of management with respect to certain business matters. These covenants place restrictions on, among other things, our ability to incur additional indebtedness and make guarantees, create liens on assets, enter into sale and leaseback transactions, engage in mergers and consolidations, sell assets, make fundamental changes, pay dividends and distributions or repurchase our capital stock, make investments, loans and advances, including acquisitions, engage in certain transactions with affiliates, make changes in the nature of our business and make prepayments of junior debt. In addition, under our senior secured credit facilities, if, on the last day of any period of four consecutive quarters on or after June 30, 2014, the aggregate principal amount of revolving credit loans, swing line loans and/or letters of credit (excluding up to $20 million of letters of credit and certain other letters of credit that have been cash collateralized or back-stopped) that are issued and/or outstanding is greater than 25% of the revolving credit facility, the credit agreement requires the borrower to maintain a consolidated first lien net leverage ratio not to exceed 8.0 to 1.0. Additionally, the documents governing our future indebtedness may place additional restrictions on us and may require us to meet certain financial ratios and tests. Our ability to comply with these and other provisions of our new credit agreement and future debt agreements is dependent on our future performance, which will be subject to many factors, some of which are beyond our control. The breach of any of these covenants or non-compliance with any of these financial ratios and tests could result in an event of default under the debt agreements, which, if not cured or waived, could result in acceleration of the related debt and the acceleration of debt under other instruments evidencing indebtedness that may contain cross-acceleration or cross-default provisions.
Risks related to this offering and ownership of our common stock
Our Sponsor controls us and its interests may conflict with ours or yours in the future.
Immediately following this offering, our Sponsor will beneficially own approximately 47.5% of our common stock, or 45.2% if the underwriters exercise in full their option to purchase additional shares from the selling stockholders. Moreover, under our amended and restated bylaws and the stockholders’ agreement with our Sponsor, we have agreed to nominate to our board individuals designated by our Sponsor, whom we refer to as the “Sponsor Directors,”
48
Table of Contents
according to the following scale: (1) if our Sponsor continues to beneficially own at least 40% (but less than 50%) of our stock, the lowest whole number that is at least 40% of the total number of directors comprising our board of directors; (2) if our Sponsor continues to beneficially own at least 30% (but less than 40%) of our stock, the lowest whole number that is at least 30% of the total number of directors comprising our board of directors; (3) if our Sponsor continues to beneficially own at least 20% (but less than 30%) of our stock, the lowest whole number that is at least 20% of the total number of directors comprising our board of directors; and (4) if our Sponsor continues to beneficially own at least 5% (but less than 20%) of our stock, the lowest whole number that is at least 10% of the total number of directors comprising our board of directors. Following this offering, we expect to continue to have at least three directors on our board that are current employees of our Sponsor and one director on our board that is a retired employee of our Sponsor. Therefore, although immediately following this offering our Sponsor will cease to own shares of our stock representing a majority of our total voting power, our Sponsor will still be able to significantly influence the composition of our board of directors and the approval of actions requiring stockholder approval. Accordingly, our Sponsor will continue to have significant influence with respect to our management, business plans and policies, including the appointment and removal of our officers. In particular, for so long as our Sponsor continues to own a significant percentage of our stock, our Sponsor will be able to cause or prevent a change of control of our Company or a change in the composition of our board of directors and could preclude any unsolicited acquisition of our Company. The concentration of ownership could deprive you of an opportunity to receive a premium for your shares of common stock as part of a sale of our Company and ultimately might affect the market price of our common stock.
Our Sponsor engages in a broad spectrum of activities, including investments in real estate generally and in the hospitality industry in particular. In the ordinary course of their business activities, our Sponsor may engage in activities where their interests conflict with our interests or those of our stockholders. For example, our Sponsor owns interests in Extended Stay America, Inc., Hilton Worldwide Holdings Inc. and G6 Hospitality, LLC, and certain other investments in the hotel industry that may compete directly or indirectly with us. As a result, they could have interests that could conflict with ours. Additionally, some of our directors are, and our directors may in the future be, engaged in the hospitality industry. Our amended and restated certificate of incorporation provides that none of our Sponsor or any director who is not employed by us (including any non-employee director who serves as one of our officers in both his director and officer capacities) or his or her affiliates has any duty to refrain from engaging, directly or indirectly, in the same business activities or similar business activities or lines of business in which we operate. Our Sponsor also may pursue acquisition opportunities that may be complementary to our business, and, as a result, those acquisition opportunities may not be available to us. In addition, our Sponsor may have an interest in having the Company pursue acquisitions, divestitures and other transactions that, in its judgment, could enhance its investment in the Company, even though such transactions might involve risks to you.
Until December 31, 2014, we qualify as an emerging growth company, and any decision on our part to comply with certain reduced reporting and disclosure requirements applicable to emerging growth companies could make our common stock less attractive to investors.
We are an emerging growth company, and, for as long as we continue to be an emerging growth company, we currently intend to take advantage of exemptions from various reporting requirements applicable to other public companies but not to “emerging growth companies,” including, but not limited to, not being required to have our independent registered public
49
Table of Contents
accounting firm audit our internal control over financial reporting under Section 404 of the Sarbanes-Oxley Act, reduced disclosure obligations regarding executive compensation in our registration statements, periodic reports and proxy statements, and exemptions from the requirements of holding a nonbinding advisory vote on executive compensation and stockholder approval of any golden parachute payments not previously approved. We will cease to be an emerging growth company upon the earliest of: (i) the end of the fiscal year following the fifth anniversary of the IPO; (ii) the first fiscal year after our annual gross revenues are $1.0 billion or more; (iii) the date on which we have, during the previous three-year period, issued more than $1.0 billion in non-convertible debt securities; or (iv) the end of any fiscal year in which the market value of our common stock held by non-affiliates exceeded $700 million as of the end of the second quarter of that fiscal year. As of June 30, 2014, the market value of our common stock held by non-affiliates exceeded $700 million. As such, as of December 31, 2014, we will no longer qualify as an emerging growth company.
While we are an emerging growth company, we cannot predict if investors will find our common stock less attractive if we choose to rely on these exemptions. If some investors find our common stock less attractive as a result of any choices to reduce future disclosure, there may be a less active trading market for our common stock and the price of our common stock may be more volatile.
Under the JOBS Act, emerging growth companies can also delay adopting new or revised accounting standards until such time as those standards apply to private companies. We have irrevocably elected not to avail ourselves of this accommodation allowing for delayed adoption of new or revised accounting standards, and, therefore, we are subject to the same new or revised accounting standards as other public companies that are not emerging growth companies.
We have incurred, and will continue to incur, increased costs, and are subject to additional regulations and requirements as a result of being a public company, which could lower our profits or make it more difficult to run our business.
As a public company, we have incurred and will continue to incur significant legal, accounting and other expenses that we did not incur as a private company, including costs associated with public company reporting requirements. We have also incurred and will continue to incur costs associated with the Sarbanes-Oxley Act of 2002, or Sarbanes-Oxley Act, and related rules implemented by the SEC. The expenses incurred by public companies generally for reporting and corporate governance purposes have been increasing. These rules and regulations have and will increase our legal and financial compliance costs and to make some activities more time-consuming and costly. These laws and regulations also could make it more difficult or costly for us to obtain certain types of insurance, including director and officer liability insurance, and we may be forced to accept reduced policy limits and coverage or incur substantially higher costs to obtain the same or similar coverage. These laws and regulations could also make it more difficult for us to attract and retain qualified persons to serve on our board of directors, our board committees or as our executive officers. Furthermore, if we are unable to satisfy our obligations as a public company, we could be subject to delisting of our common stock, fines, sanctions and other regulatory action and potentially civil litigation.
50
Table of Contents
If we are unable to implement and maintain effective internal control over financial reporting in the future, investors may lose confidence in the accuracy and completeness of our financial reports and the market price of our common stock may be negatively affected.
As a public company, we are required to maintain internal controls over financial reporting and to report any material weaknesses in such internal controls. In addition, beginning with our second annual report on Form 10-K, we will be required to furnish a report by management on the effectiveness of our internal control over financial reporting, pursuant to Section 404 of the Sarbanes-Oxley Act. Our independent registered public accounting firm is not required to express an opinion as to the effectiveness of our internal control over financial reporting until after we are no longer an “emerging growth company,” as defined in the JOBS Act. At such time, however, our independent registered public accounting firm may issue a report that is adverse in the event it is not satisfied with the level at which our internal control over financial reporting is documented, designed or operating.
The process of designing, implementing, and testing the internal control over financial reporting required to comply with this obligation is time-consuming, costly, and complicated. If we identify material weaknesses in our internal control over financial reporting, if we are unable to comply with the requirements of Section 404 of the Sarbanes-Oxley Act in a timely manner or to assert that our internal control over financial reporting is effective, or if our independent registered public accounting firm is unable to express an opinion as to the effectiveness of our internal control over financial reporting once we are no longer an “emerging growth company,” investors may lose confidence in the accuracy and completeness of our financial reports and the market price of our common stock could be negatively affected, and we could become subject to investigations by the NYSE, the SEC, or other regulatory authorities, which could require additional financial and management resources.
The market price of shares of our common stock may be volatile, which could cause the value of your investment to decline.
The market price of our common stock may be highly volatile and could be subject to wide fluctuations. Securities markets worldwide experience significant price and volume fluctuations. This market volatility, as well as general economic, market or political conditions, could reduce the market price of shares of our common stock in spite of our operating performance. In addition, our operating results could be below the expectations of public market analysts and investors due to a number of potential factors, including variations in our quarterly operating results, additions or departures of key management personnel, failure to meet analysts’ earnings estimates, publication of research reports about our industry, litigation and government investigations, changes or proposed changes in laws or regulations or differing interpretations or enforcement thereof affecting our business, adverse market reaction to any indebtedness we may incur or securities we may issue in the future, changes in market valuations of similar companies or speculation in the press or investment community, announcements by our competitors of significant contracts, acquisitions, dispositions, strategic partnerships, joint ventures or capital commitments, adverse publicity about the industries we participate in or individual scandals, and in response the market price of shares of our common stock could decrease significantly. You may be unable to resell your shares of common stock at or above the public offering price.
In the past few years, stock markets have experienced extreme price and volume fluctuations. In the past, following periods of volatility in the overall market and the market price of a
51
Table of Contents
company’s securities, securities class action litigation has often been instituted against these companies. This litigation, if instituted against us, could result in substantial costs and a diversion of our management’s attention and resources.
Because we have no current plans to pay cash dividends on our common stock, you may not receive any return on your investment unless you sell your common stock for a price greater than that which you paid for it.
We have no current plans to pay any cash dividends. The declaration, amount and payment of any future dividends on shares of common stock will be at the sole discretion of our board of directors. Our board of directors may take into account, among other things, our financial condition, results of operations, level of indebtedness, capital requirements, restrictions in our debt agreements, other contractual restrictions and the terms of any preferred stock, our business prospects and other factors that our board of directors may deem relevant. For more information, see “Dividend policy.”
You may be diluted by the future issuance of additional common stock in connection with our incentive plans, acquisitions or otherwise.
We have approximately 1,869,300,000 shares of common stock authorized but unissued under our amended and restated certificate of incorporation. We are authorized to issue these shares of common stock and options, rights, warrants and appreciation rights relating to common stock for consideration and on terms and conditions established by our board of directors in its sole discretion, whether in connection with acquisitions or otherwise. We have reserved a total of 13,000,000 shares for issuance under our 2014 Omnibus Incentive Plan. See “Management—Executive compensation—Omnibus incentive plan” and “Management—Executive compensation—Long-term incentive awards.” Any common stock that we issue, including under our 2014 Omnibus Incentive Plan or other equity incentive plans that we may adopt in the future, would dilute the percentage ownership held by the investors who purchase common stock in this offering.
In the future, we may also issue our securities in connection with investments or acquisitions. The amount of shares of our common stock issued in connection with an investment or acquisition could constitute a material portion of our then-outstanding shares of common stock. Any issuance of additional securities in connection with investments or acquisitions may result in additional dilution to you.
Future issuances of common stock by us, and the availability for resale of shares held by our pre-IPO owners, could cause the market price of our common stock to decline.
The sale of substantial amounts of shares of our common stock in the public market, or the perception that such sales could occur, could harm the prevailing market price of shares of our common stock. After the expiration or earlier waiver or termination of the lock-up periods described below, substantially all of the outstanding shares of our common stock will be available for resale in the public market, subject, in the case of shares held by our affiliates, as that term is defined under Rule 144 of the Securities Act, to volume, manner of sale and other limitations under Rule 144 as described under “Shares eligible for future sale.” Registration of the sale of these shares of our common stock would permit their sale into the market immediately. The market price of our common stock could drop significantly if the holders of these shares sell them or are perceived by the market as intending to sell them.
52
Table of Contents
Pursuant to a registration rights agreement, we have granted our Sponsor the right to cause us, in certain instances, at our expense, to file registration statements under the Securities Act covering resales of our common stock held by them. These shares represented approximately 62.8% of our outstanding common stock as of November 13, 2014, or 47.5% following this offering (or 45.2% if the underwriters exercise in full their option to purchase additional shares from the selling stockholders). These shares also may be sold pursuant to Rule 144 under the Securities Act, depending on their holding period and subject to restrictions in the case of shares held by persons deemed to be our affiliates. As restrictions on resale end or if these stockholders exercise their registration rights, the market price of our stock could decline if the holders of restricted shares sell them or are perceived by the market as intending to sell them.
In connection with this offering, we, our executive officers and directors and our Sponsor will sign lock-up agreements with the underwriters that, subject to certain exceptions, restrict the sale of the shares of our common stock held by them for 90 days following the date of this prospectus. J.P. Morgan Securities LLC and Morgan Stanley & Co. LLC may, in their discretion and without notice, release all or any portion of the shares of common stock subject to such lock-up agreements. See “Underwriting” for a description of these lock-up agreements. Certain of our executive officers have established Rule 10b5-1 trading plans under the Exchange Act and sales of shares pursuant to such plans, and filings related thereto, may be made during the 90-day lock-up period. Our Sponsor held approximately 62.8% of our outstanding common stock as of November 13, 2014, or 47.5% following this offering (or 45.2% if the underwriters exercise in full their option to purchase additional shares from the selling stockholders).
As of November 13, 2014, 1,393,125 shares of our common stock have been granted in connection with outstanding vested and unvested equity awards under our 2014 Omnibus Incentive Plan and an aggregate of 11,606,875 shares of common stock were available for future issuance under such plan (which amount includes shares issuable upon settlement of time-vesting restricted stock units and performance-vesting stock). We have filed a registration statement on Form S-8 under the Securities Act to register shares of our common stock or securities convertible into or exchangeable for shares of our common stock issued pursuant to our 2014 Omnibus Incentive Plan. Accordingly, shares registered under such registration statement will be available for sale in the open market.
As restrictions on resale end, the market price of our shares of common stock could drop significantly if the holders of these restricted shares sell them or are perceived by the market as intending to sell them. These factors could also make it more difficult for us to raise additional funds through future offerings of our shares of common stock or other securities.
53
Table of Contents
Anti-takeover provisions in our organizational documents and Delaware law might discourage or delay acquisition attempts for us that you might consider favorable.
Our amended and restated certificate of incorporation and amended and restated bylaws contain provisions that may make the merger or acquisition of our Company more difficult without the approval of our board of directors. Among other things:
| • | although we do not have a stockholder rights plan, and would either submit any such plan to stockholders for ratification or cause such plan to expire within a year, these provisions would allow us to authorize the issuance of undesignated preferred stock in connection with a stockholder rights plan or otherwise, the terms of which may be established and the shares of which may be issued without stockholder approval, and which may include super voting, special approval, dividend, or other rights or preferences superior to the rights of the holders of common stock; |
| • | these provisions prohibit stockholder action by written consent from and after the date on which the parties to our stockholders’ agreement cease to beneficially own at least 40% of the total voting power of all then outstanding shares of our capital stock unless such action is recommended in advance by all directors then in office; |
| • | these provisions provide that the board of directors is expressly authorized to make, alter or repeal our amended and restated bylaws and that our stockholders may only amend our amended and restated bylaws with the approval of 80% or more of all of the outstanding shares of our capital stock entitled to vote; and |
| • | these provisions establish advance notice requirements for nominations for elections to our board or for proposing matters that can be acted upon by stockholders at stockholder meetings. |
Further, as a Delaware corporation, we are also subject to provisions of Delaware law, which may impair a takeover attempt that our stockholders may find beneficial. These anti-takeover provisions and other provisions under Delaware law could discourage, delay or prevent a transaction involving a change in control of our Company, including actions that our stockholders may deem advantageous, or negatively affect the trading price of our common stock. These provisions could also discourage proxy contests and make it more difficult for you and other stockholders to elect directors of your choosing and to cause us to take other corporate actions you desire.
54
Table of Contents
Special note regarding forward-looking statements
This prospectus contains “forward-looking statements” within the meaning of the federal securities laws. All statements, other than statements of historical facts included in this prospectus, including statements concerning our plans, objectives, goals, beliefs, business strategies, future events, business conditions, our results of operations, financial position and our business outlook, business trends and other information referred to under “Prospectus summary,” “Risk factors,” “Dividend policy,” “Management’s discussion and analysis of financial condition and results of operations” and “Business” are forward-looking statements. When used in this prospectus, the words “estimates,” “expects,” “contemplates,” “anticipates,” “projects,” “plans,” “intends,” “believes,” “forecasts,” “may,” “should” and variations of such words or similar expressions are intended to identify forward-looking statements. The forward-looking statements are not historical facts, and are based upon our current expectations, beliefs, estimates and projections, and various assumptions, many of which, by their nature, are inherently uncertain and beyond our control. Our expectations, beliefs, estimates and projections are expressed in good faith and we believe there is a reasonable basis for them. However, there can be no assurance that management’s expectations, beliefs, estimates and projections will result or be achieved and actual results may vary materially from what is expressed in or indicated by the forward-looking statements.
There are a number of risks, uncertainties and other important factors, many of which are beyond our control, that could cause our actual results to differ materially from the forward-looking statements contained in this prospectus. Such risks, uncertainties and other important factors include, among others, the risks, uncertainties and factors set forth above under “Risk factors,” and the following risks, uncertainties and factors:
| • | business, financial, and operating risks inherent to the hospitality industry; |
| • | macroeconomic and other factors beyond our control can adversely which affect and reduce demand for hotel rooms; |
| • | contraction in the global economy or low levels of economic growth; |
| • | inability to compete effectively; |
| • | any deterioration in the quality or reputation of our brand; |
| • | inability to develop our pipeline; |
| • | the geographic concentration of our hotels; |
| • | delays or increased expense relating to our efforts to develop, redevelop or renovate our hotels; |
| • | inability by us or our franchisees to make necessary investments to maintain the quality and reputation of our brand; |
| • | inability to access capital necessary for growth; |
| • | seasonal and cyclical volatility in the hotel industry; |
| • | inability to maintain good relationships with our franchisees; |
| • | inability to protect our brand standards; |
55
Table of Contents
| • | risks resulting from significant investments in owned real estate; |
| • | failure to keep pace with developments in technology; |
| • | failures or interruptions in, material damage to, or difficulties in updating, our information technology systems, software or websites; |
| • | inability to protect our guests’ personal information; |
| • | failure to comply with marketing and advertising laws; |
| • | disruptions to our reservation system; |
| • | failure to protect our trademarks and other intellectual property; |
| • | risks of doing business internationally; |
| • | the loss of senior executives or key field personnel; |
| • | our substantial indebtedness; and |
| • | Blackstone’s control of us. |
There may be other factors that may cause our actual results to differ materially from the forward-looking statements, including factors disclosed under the sections entitled “Risk factors” and “Management’s discussion and analysis of financial condition and results of operations” in this prospectus. You should evaluate all forward-looking statements made in this prospectus in the context of these risks and uncertainties.
We caution you that the risks, uncertainties and other factors referenced above may not contain all of the risks, uncertainties and other factors that are important to you. In addition, we cannot assure you that we will realize the results, benefits or developments that we expect or anticipate or, even if substantially realized, that they will result in the consequences or affect us or our business in the way expected. All forward-looking statements in this prospectus apply only as of the date made and are expressly qualified in their entirety by the cautionary statements included in this prospectus. We undertake no obligation to publicly update or revise any forward-looking statements to reflect subsequent events or circumstances.
56
Table of Contents
We will not receive any of the proceeds from the sale of our common stock by the selling stockholders, including any sales pursuant to the option to purchase additional shares. Pursuant to the registration rights agreement entered into in connection with the IPO, the Company will pay all expenses (other than the underwriting discount and commissions) of the selling stockholders in connection with this offering.
57
Table of Contents
Our common stock began trading publicly on the NYSE under the symbol “LQ” on April 9, 2014. Prior to that time, there was no public market for our common stock. Below is a summary of the high and low sales prices of our common stock as reported by the NYSE for the indicated periods:
| High | Low | |||||||
| 2014 | ||||||||
| Second Quarter (from April 9, 2014, date of initial trading) |
$ | 19.39 | $ | 16.01 | ||||
| Third Quarter |
$ | 20.82 | $ | 18.39 | ||||
| Fourth Quarter (through November 14, 2014) |
$ | 20.96 | $ | 17.66 | ||||
|
|
||||||||
On November 14, 2014, the last reported sale price of our common stock on the NYSE was $20.53 per share. As of November 14, 2014, there were 141 holders of record of our common stock. This stockholder figure does not include a substantially greater number of holders whose shares are held of record by banks, brokers and other financial institutions.
58
Table of Contents
We have no current plans to pay dividends on our common stock. Any decision to declare and pay dividends in the future will be made at the sole discretion of our board of directors and will depend on, among other things, our financial condition, results of operations, cash requirements, contractual restrictions and other factors that our board of directors may deem relevant. Because we are a holding company, and have no direct operations, we will only be able to pay dividends from funds we receive from our subsidiaries.
For a description of distributions made by the Predecessor Entities on their equity interests in 2013 and 2012 and the nine months ended September 30, 2014, see our consolidated financial statements and accompanying footnotes included elsewhere in this prospectus.
We did not declare or pay any dividends on our common stock since consummation of the IPO.
59
Table of Contents
The following table set forth our consolidated cash and cash equivalents and consolidated capitalization as of September 30, 2014.
Cash and cash equivalents is not a component of our total capitalization. You should read this table in conjunction with the information contained in “Use of proceeds,” “Unaudited pro forma condensed combined financial information,” “Selected financial and other data,” “Management’s discussion and analysis of financial condition and results of operations” and “Description of indebtedness,” as well as the combined financial statements and the notes thereto included elsewhere in this prospectus.
| (amounts in thousands, except shares and per share data) | As of September 30, 2014 |
|||
|
|
||||
| Cash and cash equivalents |
$ | 108,488 | ||
|
|
|
|||
| Total long-term debt, including current maturities |
$ | 1,930,206 | ||
| Stockholders’ equity: |
||||
| Common Stock, $0.01 par value; 2,000,000,000 shares authorized as of September 30, 2014, 130,778,665 shares issued and 130,722,563 shares outstanding as of September 30, 2014 |
1,307 | |||
| Additional paid in capital |
1,111,410 | |||
| Accumulated deficit |
(316,890 | ) | ||
| Treasury stock at cost, 56,102 shares as of September 30, 2014 |
(943 | ) | ||
| Accumulated other comprehensive income |
582 | |||
| Total stockholders’ equity |
795,466 | |||
| Non-controlling interests |
3,052 | |||
| Total equity |
798,518 | |||
| Total capitalization |
$ | 2,728,724 | ||
|
|
||||
60
Table of Contents
Unaudited pro forma condensed combined
financial information
The following unaudited pro forma condensed combined financial information has been prepared to reflect (1) the acquisition of the Previously Managed Portfolio (the “WIH La Quinta Inn Hotels”) by the Predecessor Entities, (2) the income tax impact of the Predecessor Entities and the WIH La Quinta Inn Hotels being owned by a “C” corporation, (3) the refinancing of our debt facilities in place at the time of the IPO and (4) the issuance and sale of 43,987,500 shares of our common stock by us in the IPO and the application of the net proceeds thereof. The unaudited pro forma financial information is presented as if the IPO and the Pre-IPO Transactions (including the acquisition of the WIH La Quinta Inn Hotels) all had occurred on January 1, 2013 for purposes of the unaudited pro forma condensed combined statements of operations for the year ended December 31, 2013 and the nine months ended September 30, 2014. The unaudited pro forma condensed combined financial information excludes the Hotels Designated for Sale.
The unaudited pro forma adjustments are based on preliminary estimates, accounting judgments and currently available information and assumptions that management believes are reasonable. The notes to the unaudited pro forma condensed combined financial statements provide a detailed discussion of how such adjustments were derived and presented in the unaudited pro forma condensed combined financial information. The unaudited pro forma condensed combined financial information should be read in conjunction with “Our prospectus summary—Our corporate structure,” “Description of indebtedness,” “Capitalization,” “Use of proceeds,” “Selected financial and other data,” “Management’s discussion and analysis of financial condition and results of operations,” and our combined financial statements and related notes thereto and the combined financial statements of WIH La Quinta Inn Hotels and related notes thereto included elsewhere in this prospectus.
The unaudited pro forma condensed combined financial information has been prepared for illustrative purposes only is not necessarily indicative of our financial position or results of operations had the transactions described above for which we are giving pro forma effect actually occurred on the dates or for the periods indicated, nor is such unaudited pro forma financial information necessarily indicative of the results to be expected for any future period. A number of factors may affect our results. See “Risk factors” and “Special note regarding forward-looking statements.”
61
Table of Contents
UNAUDITED PRO FORMA CONDENSED COMBINED STATEMENT OF OPERATIONS
FOR THE YEAR ENDED DECEMBER 31, 2013
(dollars in thousands, except share and per share data)
| Predecessor Entities |
WIH La Quinta Inn Hotels |
Acquisition Adjustments |
Income Taxes |
Debt Refinancing |
Equity Offering |
Pro forma | ||||||||||||||||||||||
| Revenue |
||||||||||||||||||||||||||||
| Room revenue |
$ | 757,699 | $ | 38,316 | $ | — | $ | — | $ | — | $ | — | $ | 796,015 | ||||||||||||||
| Franchise and other fee-based revenues |
79,180 | — | (2,284 | )(c) | — | — | — | 76,896 | ||||||||||||||||||||
| Other hotel revenues |
17,949 | 455 | (362 | )(c) | — | — | — | 18,042 | ||||||||||||||||||||
|
|
|
|||||||||||||||||||||||||||
| 854,828 | 38,771 | (2,646 | ) | — | — | — | 890,953 | |||||||||||||||||||||
| Brand marketing fund revenues from franchise properties |
19,065 | — | (958 | )(c) | — | — | — | 18,107 | ||||||||||||||||||||
|
|
|
|||||||||||||||||||||||||||
| Total Revenues |
873,893 | 38,771 | (3,604 | ) | — | — | — | 909,060 | ||||||||||||||||||||
| Operating Expenses |
||||||||||||||||||||||||||||
| Direct lodging expenses |
344,515 | 8,548 | (575 | )(c) | — | — | — | 352,488 | ||||||||||||||||||||
| Depreciation and amortization |
164,077 | 4,685 | 1,962 | (a) | — | — | — | 170,493 | ||||||||||||||||||||
| (231 | )(b) | |||||||||||||||||||||||||||
| General and administrative expenses |
74,794 | 14,253 | (128 | )(c) | — | — | — | 88,919 | ||||||||||||||||||||
| Other lodging and operating expenses |
56,068 | 282 | (80 | )(c) | — | — | — | 56,270 | ||||||||||||||||||||
| Marketing, promotional and other advertising expenses |
59,193 | — | — | — | — | — | 59,193 | |||||||||||||||||||||
| Management and other fees |
— | 1,863 | (1,863 | )(c) | — | — | — | — | ||||||||||||||||||||
|
|
|
|||||||||||||||||||||||||||
| 698,647 | 29,631 | (915 | ) | — | — | — | 727,363 | |||||||||||||||||||||
| Brand marketing fund expenses from franchise properties |
19,065 | — | (958 | )(c) | — | — | — | 18,107 | ||||||||||||||||||||
|
|
|
|||||||||||||||||||||||||||
| Total Operating Expenses |
717,712 | 29,631 | (1,873 | ) | — | — | — | 745,470 | ||||||||||||||||||||
| Loss on sale or retirement of assets |
— | (322 | ) | — | — | — | — | (322 | ) | |||||||||||||||||||
|
|
|
|||||||||||||||||||||||||||
| Operating Income |
156,181 | 8,818 | (1,731 | ) | — | — | — | 163,268 | ||||||||||||||||||||
| Other Income (Expenses) |
||||||||||||||||||||||||||||
| Interest expense, net |
(148,615 | ) | (1,663 | ) | — | — | 52,145 | (g) | — | (98,133 | ) | |||||||||||||||||
| Other income (loss) |
1,048 | — | — | — | — | — | 1,048 | |||||||||||||||||||||
|
|
|
|||||||||||||||||||||||||||
| Total Other Income (Expenses) |
(147,567 | ) | (1,663 | ) | — | — | 52,145 | — | (97,085 | ) | ||||||||||||||||||
|
|
|
|||||||||||||||||||||||||||
| Income (loss) from Continuing Operations Before Income Taxes |
8,614 | 7,155 | (1,731 | ) | — | 52,145 | — | 66,183 | ||||||||||||||||||||
| Income tax (expense)/ benefit |
(3,598 | ) | — | 692 | (d) | (2,709 | )(e) | (20,858 | )(h) | — | (26,473 | ) | ||||||||||||||||
|
|
|
|||||||||||||||||||||||||||
| Income from Continuing Operations |
5,016 | 7,155 | (1,039 | ) | (2,709 | ) | 31,287 | — | 39,710 | |||||||||||||||||||
|
|
|
|||||||||||||||||||||||||||
| Net Income (loss) |
$ | 5,016 | $ | 7,155 | $ | (1,039 | ) | $ | (2,709 | ) | $ | 31,287 | $ | — | $ | 39,710 | ||||||||||||
|
|
|
|||||||||||||||||||||||||||
| (Income) loss from noncontrolling interests in continuing operations |
1,455 | — | — | — | — | (1,852 | )(j) | (397 | ) | |||||||||||||||||||
|
|
|
|||||||||||||||||||||||||||
| Net (income) loss attributable to noncontrolling interests |
$ | 1,455 | $ | — | $ | — | $ | — | $ | — | $ | (1,852 | ) | $ | (397 | ) | ||||||||||||
|
|
|
|||||||||||||||||||||||||||
| Amounts attributable to the Company |
||||||||||||||||||||||||||||
| Income (loss) from continuing operations |
6,471 | 7,155 | (1,039 | ) | (2,709 | ) | 31,287 | (1,852 | )(j) | 39,313 | ||||||||||||||||||
|
|
|
|||||||||||||||||||||||||||
| Net income (loss) attributable to the Company |
$ | 6,471 | $ | 7,155 | $ | (1,039 | ) | $ | (2,709 | ) | $ | 31,287 | $ | (1,852 | ) | $ | 39,313 | |||||||||||
|
|
|
|||||||||||||||||||||||||||
| Earnings per Share: |
||||||||||||||||||||||||||||
| Net Income per share: |
||||||||||||||||||||||||||||
| Basic |
$ | 0.31 | ||||||||||||||||||||||||||
| Diluted |
$ | 0.30 | ||||||||||||||||||||||||||
| Weighted average shares outstanding: |
||||||||||||||||||||||||||||
| Basic |
127,564,612 | (k) | ||||||||||||||||||||||||||
| Diluted |
129,395,818 | (k) | ||||||||||||||||||||||||||
See notes to unaudited pro forma condensed combined financial information
62
Table of Contents
UNAUDITED PRO FORMA CONDENSED COMBINED STATEMENT OF OPERATIONS
FOR THE NINE MONTHS ENDED SEPTEMBER 30, 2014
(dollars in thousands, except share and per share data)
| La Quinta Holdings |
WIH La Quinta Inn Hotels(2) |
Acquisition Adjustments |
Income Taxes |
Debt Refinancing |
Equity Offering |
Pro forma | ||||||||||||||||||||||
| Revenue |
||||||||||||||||||||||||||||
| Room revenue |
$ | 649,181 | $ | 12,823 | $ | — | $ | — | $ | — | $ | — | $ | 662,004 | ||||||||||||||
| Franchise and other fee-based revenues |
68,215 | — | (732 | )(c) | — | — | — | 67,483 | ||||||||||||||||||||
| Other hotel revenues |
14,809 | 150 | — | — | — | — | 14,959 | |||||||||||||||||||||
|
|
|
|||||||||||||||||||||||||||
| 732,205 | 12,973 | (732 | ) | — | — | — | 744,446 | |||||||||||||||||||||
| Brand marketing fund revenues from franchise properties |
16,511 | — | (321 | )(c) | — | — | — | 16,190 | ||||||||||||||||||||
|
|
|
|||||||||||||||||||||||||||
| Total Revenues |
748,716 | 12,973 | (1,053 | ) | — | — | — | 760,636 | ||||||||||||||||||||
| Operating Expenses |
||||||||||||||||||||||||||||
| Direct lodging expenses |
285,430 | 2,588 | (81 | )(c) | — | — | — | 287,937 | ||||||||||||||||||||
| Depreciation and amortization |
129,948 | 1,324 | 589 | (a) | — | — | — | 131,771 | ||||||||||||||||||||
| (90 | )(b) | |||||||||||||||||||||||||||
| General and administrative expenses |
100,863 | 4,265 | (18 | )(c) | — | — | (31,667 | )(i) | 73,443 | |||||||||||||||||||
| Other lodging and operating expenses |
46,124 | 84 | (12 | )(c) | — | — | — | 46,196 | ||||||||||||||||||||
| Marketing, promotional and other advertising expenses |
50,170 | — | — | — | — | — | 50,170 | |||||||||||||||||||||
| Impairment loss |
5,157 | — | — | — | — | — | 5,157 | |||||||||||||||||||||
| Management and other fees |
— | 621 | (621 | )(c) | — | — | — | — | ||||||||||||||||||||
|
|
|
|||||||||||||||||||||||||||
| 617,692 | 8,882 | (233 | ) | — | — | (31,667 | ) | 594,674 | ||||||||||||||||||||
| Brand marketing fund expenses from franchise properties |
16,511 | — | (321 | )(c) | — | — | — | 16,190 | ||||||||||||||||||||
|
|
|
|||||||||||||||||||||||||||
| Total Operating Expenses |
634,203 | 8,882 | (554 | ) | — | — | (31,667 | ) | 610,864 | |||||||||||||||||||
|
|
|
|||||||||||||||||||||||||||
| Operating Income |
114,513 | 4,091 | (499 | ) | — | — | 31,667 | 149,772 | ||||||||||||||||||||
| Other Income (Expenses) |
||||||||||||||||||||||||||||
| Interest expense, net |
(97,260 | ) | (462 | ) | — | — | 26,230 | (g) | — | (71,492 | ) | |||||||||||||||||
| Loss on extinguishment of debt, net |
(2,030 | ) | 2,030 | (f) | ||||||||||||||||||||||||
| Other income (loss) |
(1,096 | ) | — | — | — | — | — | (1,096 | ) | |||||||||||||||||||
|
|
|
|||||||||||||||||||||||||||
| Total Other Income (Expenses) |
(100,386 | ) | (462 | ) | — | — | 28,260 | — | (72,588 | ) | ||||||||||||||||||
|
|
|
|||||||||||||||||||||||||||
| Income (loss) from Continuing Operations Before Income Taxes |
14,127 | 3,629 | (499 | ) | — | 28,260 | 31,667 | 77,184 | ||||||||||||||||||||
| Income tax provision |
(21,860 | ) | — | 200 | (d) | 14,758 | (e) | (11,304 | )(h) | (12,667 | )(h) | (30,873 | ) | |||||||||||||||
| Recognition of net deferred tax liabilities upon C-corporation conversion |
(321,054 | ) | 321,054 | (e) | ||||||||||||||||||||||||
|
|
|
|||||||||||||||||||||||||||
| Income from Continuing Operations |
(328,787 | ) | 3,629 | (299 | ) | 335,812 | 16,956 | 19,000 | 46,311 | |||||||||||||||||||
|
|
|
|||||||||||||||||||||||||||
| Net Income (loss) |
$ | (328,787 | ) | $ | 3,629 | $ | (299 | ) | $ | 335,812 | $ | 16,956 | $ | 19,000 | $ | 46,311 | ||||||||||||
|
|
|
|||||||||||||||||||||||||||
| (Income) loss from noncontrolling interests in continuing operations |
(3,814 | ) | — | — | — | — | 3,489 | (j) | (325 | ) | ||||||||||||||||||
|
|
|
|||||||||||||||||||||||||||
| Net (income) loss attributable to noncontrolling interests |
$ | (3,814 | ) | $ | — | $ | — | $ | — | $ | — | $ | 3,489 | $ | (325 | ) | ||||||||||||
|
|
|
|||||||||||||||||||||||||||
| Amounts attributable to the Company |
||||||||||||||||||||||||||||
| Income (loss) from continuing operations |
(332,601 | ) | 3,629 | (299 | ) | 335,812 | 16,956 | 22,489 | (j) | 45,986 | ||||||||||||||||||
|
|
|
|||||||||||||||||||||||||||
| Net income (loss) attributable to the Company |
$ | (332,601 | ) | $ | 3,629 | $ | (299 | ) | $ | 335,812 | $ | 16,956 | $ | 22,489 | $ | 45,986 | ||||||||||||
|
|
|
|||||||||||||||||||||||||||
| Earnings per Share: |
||||||||||||||||||||||||||||
| Net Income per share: |
||||||||||||||||||||||||||||
| Basic |
$ | 0.37 | ||||||||||||||||||||||||||
| Diluted |
$ | 0.36 | ||||||||||||||||||||||||||
| Weighted average shares outstanding: |
||||||||||||||||||||||||||||
| Basic |
125,541,543 | (k) | ||||||||||||||||||||||||||
| Diluted |
126,085,157 | (k) | ||||||||||||||||||||||||||
| (1) | This column reflects the combined results of the Predecessor Entities prior to the IPO, and the consolidated results of La Quinta Holdings Inc. (including the results of the acquired WIH La Quinta Inn Hotels) for the period after the IPO. |
| (2) | This column reflects the combined results of the WIH La Quinta Inn Hotels for the period prior to the IPO. After the IPO, the financial results of the WIH La Quinta Inn Hotels are included within the consolidated results of La Quinta Holdings Inc. |
See notes to unaudited pro forma condensed combined financial information
63
Table of Contents
NOTE 1: BASIS OF PRESENTATION
The unaudited pro forma financial information is based on our historical condensed combined financial statements, which are included elsewhere in this prospectus, and has been prepared to reflect the acquisition of the WIH La Quinta Inn Hotels by the Predecessor Entities, the income tax impact of the Predecessor Entities and the WIH La Quinta Inn Hotels being owned by a “C” corporation for tax purposes, the refinancing of our debt facilities in place at the time of the IPO, and the IPO.
The unaudited pro forma condensed combined statements of operations for the year ended December 31, 2013 and the nine months ended September 30, 2014 are presented on a pro forma adjusted basis to give effect to the acquisition of the WIH La Quinta Inn Hotels on April 14, 2014, by the Predecessor Entities, the income tax impact of the Predecessor Entities and the WIH La Quinta Inn Hotels being owned by a “C” corporation, the refinancing of our debt facilities in place at the time of the IPO and the IPO as if they were completed as of January 1, 2013. As presented within the pro forma condensed combined statement of operations for the nine months ended September 30, 2014, La Quinta Holdings Inc. reflects the combined results of the Predecessor Entities prior to the IPO, and the consolidated results of La Quinta Holdings Inc., (including the results of the acquired WIH La Quinta Inn Hotels) for the period after the IPO. As presented within the pro forma condensed combined statement of operations for the nine months ended September 30, 2014, WIH La Quinta Inn Hotels reflects the combined results of the WIH La Quinta Inn Hotels for the period prior to the IPO.
The unaudited pro forma adjustments are based on preliminary estimates, accounting judgments and currently available information and assumptions that management believes are reasonable. These adjustments are included only to the extent they are directly attributable to the acquisition of the WIH La Quinta Inn Hotels by the Predecessor Entities, the income tax impact of the Predecessor Entities and the WIH La Quinta Inn Hotels being owned by a “C” corporation, the refinancing of our debt and the IPO and the appropriate information is known and factually supportable.
Pro forma adjustments reflected in the unaudited pro forma condensed combined statements of operations are expected to have a continuing effect on us. As a result, the unaudited pro forma condensed combined statements of operations exclude the initial income tax impact of the Predecessor Entities and WIH La Quinta Hotels being owned by a “C” corporation, gains and losses related to the debt financing transactions, and the impact of the issuance of the restricted stock related to long-term incentives that will not have a continuing effect on us, although these items are reflected in our historical information for the nine months ended September 30, 2014.
NOTE 2. ACQUISITION OF PREVIOUSLY MANAGED PORTFOLIO
Concurrently with the consummation of the IPO, we acquired the WIH La Quinta Inn Hotels. The WIH La Quinta Inn Hotels consists of 14 La Quinta branded hotels, owned by affiliates of the Blackstone Group L.P. Prior to the acquisition, the 14 hotels had franchise and management agreements with the Predecessor Entities. All transactions between the Predecessor Entities and WIH La Quinta Inn Hotels have been eliminated in the accompanying pro forma condensed combined financial statements and footnotes.
The WIH La Quinta Inn Hotels are accounted for using the acquisition method of accounting in accordance with ASC 805, “Business Combinations”, which requires recognition and measurement of all identifiable assets acquired and liabilities assumed at their full fair value as of
64
Table of Contents
the date control is obtained. The pro forma condensed combined financial statements reflect the following preliminary acquisition method adjustments to tangible assets and other identifiable intangible assets, which were based upon a valuation performed with the assistance of a third party valuation specialist as well as management estimates, utilizing a combination of the income, market, and cost approaches to valuation.
The income approach is a valuation technique that provides an estimation of the fair value of an asset based on market participant expectations about the cash flows that an asset would generate over its remaining useful life, and converting these estimated future cash flows to a single present amount. The overall value for the WIH La Quinta Inn Hotels was primarily derived using the income approach, utilizing 2014 forecasted operating results as a baseline and applying a discount rate of 10.5 percent and terminal capitalization rate of 8.0 percent.
The market approach is a valuation technique that provides an estimation of fair value of an asset by using one or more methods that compare and correlate the subject to similar assets that have been sold. The cost approach is a valuation technique that uses the concept of replacement cost as an indicator of fair value. The estimated fair values of the tangible assets and other identifiable intangible assets related to the WIH La Quinta Inn Hotels were derived utilizing the market and cost approaches.
We believe that the key assumptions utilized within these valuation techniques are appropriate in the circumstances based on our knowledge of the operations of the WIH La Quinta Inn Hotels gained through our day to day management of the hotels, as well as our overall industry experience.
We acquired the WIH La Quinta Inn Hotels for a purchase price of approximately $161.7 million. Total net consideration paid was $150.8 million, which equals the total purchase price of $161.7 million less $10.9 million owed by the parent of the WIH La Quinta Inn Hotels to the Predecessor Entities. The total net consideration paid took the form of $76.9 million of cash and $73.9 million of equity consideration, in the form of La Quinta Holdings Inc. (“Holdings”) common stock concurrently with the consummation of the IPO. Goodwill was not recognized as a result of this acquisition.
NOTE 3. INCOME TAXES
In connection with consummating of the IPO, the Predecessor Entities and the WIH La Quinta Inn Hotels became owned by a “C” corporation and are subject to additional entity-level taxes that will be reflected in our financial statements.
NOTE 4. DEBT FINANCING TRANSACTIONS
Concurrently with the consummation of the IPO, we entered into a new $2.1 billion senior secured term loan B facility (the “Term Facility”) and a new $250.0 million senior secured revolving credit facility (the “Revolving Facility”). The net proceeds from the Term Facility, together with the net proceeds from the IPO, were used to repay our Holdco I Mortgage Loan, Holdco III Mortgage Loan and Mezzanine Loans, which had an outstanding balance of $1.9 billion, $208.9 million and $570.1 million, respectively, as of December 31, 2013.
Concurrently with the execution of the Term Facility, we entered into an interest rate swap agreement with an aggregate notional amount of $850.0 million that expires on April 14, 2019.
65
Table of Contents
This agreement swaps the LIBOR rate in effect under the Term Facility for this portion of the loan to a fixed-rate of 2.0311%, which includes a 1% LIBOR floor. We have elected to designate this interest rate swap as a cash flow hedge for accounting purposes.
NOTE 5. COMMON STOCK OFFERING
The gross proceeds provided by the IPO were approximately $747.8 million and proceeds to us, net of underwriting discounts and offering expenses, were approximately $697.5 million. Net proceeds of the IPO, available cash from debt financing transactions, and other available cash was used to repay approximately $2.7 billion of our outstanding indebtedness and pay a portion of the purchase price for the acquisition of the WIH La Quinta Inn Hotels. Remaining proceeds were used for our general corporate purposes.
NOTE 6. PRO FORMA ADJUSTMENTS
Adjustments included under the heading “Pro Forma Adjustments—Acquisition of WIH La Quinta Inn Hotels” represent the following:
The pro forma adjustments shown below for the WIH La Quinta Inn Hotels are subject to change based on the final determination of the fair value of assets and liabilities acquired.
| a. | Represents the pro forma impact of the fair value adjustment to property and equipment, and the associated change to depreciation expense, recorded as a result of the acquisition of WIH La Quinta Inn Hotels. The amounts assigned to property and equipment, the estimated useful lives, and the estimated depreciation expense related to the property and equipment acquired are as follows (in thousands): |
| Estimated fair value |
Estimated Useful Life |
Nine months Ended September 30, 2014 Depreciation Expense |
Year Ended December 31, 2013 Depreciation Expense |
|||||||||||||
|
|
||||||||||||||||
| Land |
$ | 27,565 | — | $ | — | $ | — | |||||||||
| Building and improvements |
114,770 | 10-40 years | 2,152 | 2,869 | ||||||||||||
| Furniture, fixtures, equipment and other |
24,157 | 6 years | 2,833 | 3,778 | ||||||||||||
|
|
|
|
|
|||||||||||||
| Total |
166,492 | 4,985 | 6,647 | |||||||||||||
| Less: Historical WIH PP&E and related depreciation expense(1) |
(86,195 | ) | (4,396 | ) | (4,685 | ) | ||||||||||
|
|
|
|
|
|||||||||||||
| Total pro forma adjustments |
$ | 80,297 | $ | 589 | $ | 1,962 | ||||||||||
|
|
||||||||||||||||
| (1) | For the nine months ended September 30, 2014, this amount includes $3.1 million of depreciation for the WIH PP&E included in the historical financial information for Holdings from the period from acquisition to September 30, 2014. |
Acquired property and equipment are being depreciated on a straight-line method over the estimated remaining useful life.
| b. | Represents the pro forma impact of the fair value of the recognized favorable and unfavorable leasehold interests, including ground leases, that were acquired, and the related amortization expense. The fair value of favorable leasehold interests is $1.4 million and the fair value of unfavorable leasehold interests is $5.3 million. The pro forma impact of the favorable and unfavorable leasehold interests to amortization expense for the nine months ended September 30, 2014 and the year ended December 31, 2013 included in the pro forma |
66
Table of Contents
| statements of operations was a reduction of depreciation and amortization of $0.1 million and $0.2 million, respectively. The acquired favorable leasehold interests and unfavorable leasehold interests are being amortized using the effective interest method over the remaining lease terms of nine years and twelve to sixty-seven years, respectively. |
| c. | Represents eliminations that would have occurred between the Predecessor Entities and the WIH La Quinta Inn Hotels had the acquisition taken place on January 1, 2013. Pursuant to hotel management agreements (“LQM Management Agreements”), LQM provided management services to the WIH La Quinta Inn Hotels, including supervision, direction, operation, management and promotion. Under the terms of the LQM Management Agreements, LQM was entitled to receive from hotels it manages a management fee of 1.67% of gross operating revenue, as well as reimbursement for certain shared group costs. Management fees earned by LQM from the WIH La Quinta Inn Hotels, for the year ended December 31, 2013, were approximately $0.6 million. Management fees earned by LQM from the WIH La Quinta Inn Hotels, for the period January 1, 2014 to April 14, 2014, were approximately $0.2 million. |
In addition, in accordance with the LQM Management Agreements, LQM also provided certain group services for the WIH La Quinta Inn Hotels including group and administrative services, information systems support, training, and other field services, and was reimbursed for the cost of providing these services. During 2013, LQM earned from WIH La Quinta Inn Hotels approximately $2.0 million of group services reimbursements. For the period January 1, 2014 to April 14, 2014, LQM earned from WIH La Quinta Inn Hotels approximately $0.5 million of group services reimbursements.
LQM maintains the Brand Marketing Fund (“BMF”) on behalf of all La Quinta branded hotel properties from which national marketing and advertising campaign expenses are paid. Each La Quinta branded hotel is charged a percentage of its room revenue from which the expenses of the fund are covered. During 2013, LQM collected BMF fees from the WIH La Quinta Inn Hotels totaling $1.0 million. For the period January 1, 2014 to April 14, 2014, LQM collected BMF fees from the WIH La Quinta Inn Hotels totaling $0.3 million.
Since the IPO, certain expense categories that were previously classified as General and administrative expenses for WIH La Quinta Inn Hotels have been included in Direct lodging expenses in our financial statements.
| d. | Represents the income tax effect related to the acquisition pro forma adjustments using an estimated blended statutory U.S. federal and state income tax rate of 40%. |
Adjustments included under the heading “Pro Forma Adjustments—Income Taxes” represent the following:
| e. | Represents the impact of the Predecessor Entities and the WIH La Quinta Inn Hotels being owned by a “C” corporation. Prior to the completion of the IPO, we operated primarily as limited liability companies treated as partnerships for U.S. federal income tax purposes, REIT entities, and taxable entities. As a result, we were not subject to U.S. federal and most state income taxes for our limited liability companies and our REIT entities. Our partnership and REIT status was terminated in connection with the IPO and we became subject to additional entity-level taxes. The adjustments to deferred tax assets and liabilities in the unaudited pro forma condensed combined balance sheet were computed as if our “C” corporation status was in effect as of December 31, 2013. These balance sheet adjustments reflect the future tax |
67
Table of Contents
| consequences attributable to differences between the financial statement carrying amounts of existing assets and liabilities and their respective tax bases and the blended statutory U.S. federal and state income tax rate of 38%. More specifically, the adjustment amount is primarily driven by (1) the recognition of additional deferred tax liabilities totaling approximately $462 million which are primarily related to differences between the book and tax basis for our fixed and intangible assets and related depreciation and (2) the recognition of additional deferred tax assets totaling approximately $141 million which are primarily related to the expected realization of federal net operating loss carryforwards. |
Below is a table of our deferred tax assets and liabilities underlying the unaudited pro forma adjustments.
| (in thousands) | Current | Non-current | Total | |||||||||
|
|
||||||||||||
| Deferred Tax Liabilities |
||||||||||||
| Fixed Assets |
$ | — | $ | 384,198 | $ | 384,198 | ||||||
| Trademark |
— | 61,134 | 61,134 | |||||||||
| Cancellation of Debt Income |
3,102 | 11,520 | 14,622 | |||||||||
| Other |
— | 2,290 | 2,290 | |||||||||
|
|
|
|||||||||||
| $ | 3,102 | $ | 459,142 | $ | 462,244 | |||||||
|
|
|
|||||||||||
| Deferred Tax Assets |
||||||||||||
| Net Operating Losses |
— | $ | 124,395 | $ | 124,395 | |||||||
| Insurance Accruals |
$ | 88 | — | 88 | ||||||||
| Tax Credits |
— | 7,151 | 7,151 | |||||||||
| Other |
4,579 | 17,312 | 21,891 | |||||||||
|
|
|
|||||||||||
| $ | 4,667 | $ | 148,858 | $ | 153,525 | |||||||
| Valuation Allowance |
(296 | ) | (9,439 | ) | (9,735 | ) | ||||||
|
|
|
|||||||||||
| $ | 4,371 | $ | 139,419 | $ | 143,790 | |||||||
|
|
|
|||||||||||
| Net Deferred Tax Asset (Liability) |
$ | 1,269 | $ | (319,723 | ) | $ | (318,454 | ) | ||||
| Less: |
||||||||||||
| Deferred Tax Asset-Historical |
— | (3,008 | ) | (3,008 | ) | |||||||
| Deferred Tax Liability-Historical |
— | 408 | 408 | |||||||||
|
|
|
|||||||||||
| Pro Forma Tax Adjustment |
$ | 1,269 | $ | (322,323 | )(1) | $ | (321,054 | ) | ||||
|
|
||||||||||||
| (1) | Amount is comprised of a reduction of the historical non-current deferred tax asset of $3.0 million and an increase to the historical non-current deferred tax liability of $319.7 million. |
The net operating losses above include $9.7 million of net operating losses attributable to a separate return group entity which is subject to limitation on the use of such losses under the consolidated return income tax regulations. The valuation allowance of $9.7 million is attributable to those specific net operating losses.
The adjustment for the recognition of the net deferred tax liabilities upon C-corporation conversion in the unaudited pro forma condensed consolidated statement of operations for the nine months ended September 30, 2014 was recorded in the historical financial statements for the nine months ended September 30, 2014, and was removed for pro forma presentation in order to more closely represent our continuing operations as it is a material nonrecurring item.
68
Table of Contents
In addition, the pro forma provision for income taxes reflects combined federal and state income taxes on a pro forma basis, as if the Company has been treated as a “C” corporation in 2014 and 2013, using an estimated blended statutory U.S. federal and state income tax rate of 40%.
Adjustments included under the heading “Pro Forma Adjustments—Debt financing Transaction” represent the following:
| f. | The adjustment for the $2.0 million in the unaudited pro forma condensed consolidated statement of operations for the nine months ended September 30, 2014 was to eliminate the loss on extinguishment of debt that was recorded in the historical financial statements for the nine months ended September 30, 2014, as this was a material nonrecurring item removed for pro forma presentation in order to more closely represent our continuing operations. |
| g. | To adjust interest expense for the new Term Facility and repayment of the existing indebtedness discussed above for the nine months ended September 30, 2014 and the year ended December 31, 2013, as follows: |
| Nine months ended September 30, |
Year ended December 31, |
|||||||
|
|
||||||||
| ($ in thousands) |
||||||||
|
|
||||||||
| Issuance of Term Facility: |
||||||||
| Interest expense(1)(2)(3) |
$ | 67,361 | $ | 92,754 | ||||
| Amortization expense of debt issuance costs |
4,131 | 5,379 | ||||||
|
|
|
|||||||
| 71,492 | 98,133 | |||||||
|
|
|
|||||||
| Repayment of existing debt: |
||||||||
| Interest expense(4) |
(92,683 | ) | (140,123 | ) | ||||
| Amortization expense of debt issuance costs |
(5,039 | ) | (10,155 | ) | ||||
|
|
|
|||||||
| (97,722 | ) | (150,278 | ) | |||||
|
|
|
|||||||
| Net adjustment to interest expense |
$ | (26,230 | ) | $ | (52,145 | ) | ||
|
|
||||||||
| (1) | Includes commitment fees on the unused Revolving Facility commitments. |
| (2) | A 0.125 percent change to interest rates on our variable rate debt would result in an increase in interest expense of approximately $2.0 million and $2.6 million for the nine months ended September 30, 2014 and the year ended December 31, 2013, respectively. |
| (3) | We entered into an interest rate swap agreement with an aggregate notional amount of $850.0 million that expires on April 14, 2019. This agreement swaps the LIBOR rate in effect under the new credit agreement for this portion of the loan to a fixed-rate of 2.0311%, which includes a 1% LIBOR floor. |
| (4) | Includes the expense incurred for the Term Facility and the interest rate swap that is included in our historical financial statements for the period from April 14, 2014 to September 30, 2014 |
| h. | Represents the estimated income tax effect related to the pro forma expense items noted above in adjustment (g) using an estimated blended statutory U.S. federal and state tax rate of 40%. |
69
Table of Contents
Adjustments included under the heading “Pro Forma Adjustments—Equity Offering” represent the following:
| i. | Certain members of our management and others associated with Blackstone were eligible to receive long-term incentives evidenced by units (the “Units”) in LQ Services L.L.C., which indirectly holds interests in the Predecessor Entities, which units are intended to be treated as “profits interests” for U.S. tax purposes. In connection with the IPO, the Units that were outstanding at the time of that offering were converted into restricted stock of Holdings of equivalent economic value, which was ultimately determined at the effective date of the IPO. |
We do not anticipate that there will be a material, recurring effect on the amount of future compensation expense as a result of the terms of the awards which solely vest upon achieving service conditions, including the additional compensation expense of $25 million that we expect to record from the effective date through the first anniversary of that date, and the additional compensation expense of approximately $2 million that we expect to record each year after the first anniversary of the effective date and continuing through the seventh anniversary of that date. Accordingly, we have made no adjustment to our unaudited pro forma condensed combined statements of operations for the year ended December 31, 2013, for any incremental compensation expense resulting from the issuance of these awards or additional stock awards to be made under our equity incentive plan at the time of the IPO.
The $31.7 million General and administrative expenses adjustment in the unaudited pro forma condensed consolidated statement of operations for the nine months ended September 30, 2014 represents the incremental compensation expense related to these awards. Approximately $20.8 million of this adjustment represents conversion of the profit interest into fully vested restricted stock of Holdings at the time of the IPO, and $10.9 million of this adjustment represents time vesting expense related to restricted stock awards received in exchange for the profit interest. These amounts were removed for the pro forma presentation in order to more closely represent our continuing operations as these are material nonrecurring items.
See “Management—Executive compensation—Long-term incentive awards” for a further discussion of the long-term incentive awards.
| j. | In connection with the Pre-IPO Transactions, the Predecessor Entities acquired LQ Management L.L.C. (LQM). As a result of the acquisition of LQM by the Predecessor Entities, income/loss related to LQM is shown as items attributable to the company rather than noncontrolling interests. |
| k. | Unaudited pro forma weighted average shares outstanding is calculated assuming all shares of common stock or other equity based awards issued by us in the IPO were outstanding for the entire period, and the proceeds from the sale of such shares, which will be used to repay indebtedness, is also reflected in our unaudited pro forma condensed consolidated statements of operations. |
70
Table of Contents
Selected financial and other data
Our historical financial statements were prepared by combining the financial results of the entities owned by the Company at the completion of the IPO, including those entities under common control and their consolidated subsidiaries, which corresponds to the results of operations for the Company on a prospective basis after giving effect to the consummation of the Pre-IPO Transactions and the IPO. The table below for the periods prior to the completion of the IPO does not include the Previously Managed Portfolio. Prior to their acquisition as part of the Pre-IPO Transactions, the Previously Managed Portfolio were not under common control. Further, the information provided below (other than the information relating to discontinued operations) does not include the Hotels Designated for Sale and the Baymont Hotels.
We derived the selected statement of operations data for the years ended December 31, 2013, 2012 and 2011 and the selected balance sheet data as of December 31, 2013 and 2012 from the audited combined financial statements of the Predecessor Entities included elsewhere in this prospectus. We derived the selected statement of operations data for the years ended December 31, 2010 and 2009 and the selected balance sheet data as of December 31, 2011, 2010 and 2009 from the audited combined financial statements of the Predecessor Entities which are not included in this prospectus. We derived the selected statement of operations data for the nine months ended September 30, 2014 and 2013 and the selected balance sheet data as of September 30, 2014 from the unaudited condensed consolidated financial statements of La Quinta Holdings Inc. included elsewhere in this prospectus. The results for any interim period are not necessarily indicative of the results expected for the full year. Additionally, historical results are not necessarily indicative of the results expected for any future period.
71
Table of Contents
You should read the selected condensed combined financial data below together with the combined financial statements including the related notes thereto appearing elsewhere in this prospectus, as well as “Management’s discussion and analysis of financial condition and results of operations” and “Description of indebtedness,” and the other financial information included elsewhere in this prospectus.
| Nine months ended September 30, | Years ended December 31, | |||||||||||||||||||||||||||
| (in thousands, except per share data) | 2014 | 2013 | 2013 | 2012 | 2011 | 2010 | 2009 | |||||||||||||||||||||
| Statement of Operations Data: |
||||||||||||||||||||||||||||
| Revenues: |
||||||||||||||||||||||||||||
| Room revenues |
$ | 649,181 | $ | 585,294 | $ | 757,699 | $ | 714,143 | $ | 660,816 | $ | 623,720 | $ | 610,395 | ||||||||||||||
| Franchising and other fee-based revenues |
68,215 | 59,846 | 79,180 | 69,206 | 59,314 | 52,074 | 40,716 | |||||||||||||||||||||
| Other hotel revenues |
14,809 | 13,650 | 17,949 | 17,506 | 16,229 | 16,821 | 16,743 | |||||||||||||||||||||
|
|
|
|||||||||||||||||||||||||||
| 732,205 | 658,790 | 854,828 | 800,855 | 736,359 | 692,615 | 667,854 | ||||||||||||||||||||||
| Brand marketing fund revenues from franchised and managed properties |
16,511 | 14,594 | 19,065 | 17,157 | 15,182 | 13,238 | 11,790 | |||||||||||||||||||||
|
|
|
|||||||||||||||||||||||||||
| Total revenues |
748,716 | 673,384 | 873,893 | 818,012 | 751,541 | 705,853 | 679,644 | |||||||||||||||||||||
|
|
|
|||||||||||||||||||||||||||
| Operating Expenses: |
||||||||||||||||||||||||||||
| Direct lodging expenses |
285,430 | 264,208 | 344,515 | 334,394 | 330,205 | 305,856 | 302,742 | |||||||||||||||||||||
| Depreciation and amortization |
129,948 | 122,694 | 164,077 | 155,879 | 149,356 | 141,708 | 135,303 | |||||||||||||||||||||
| General and administrative expenses |
100,863 | 49,724 | 74,794 | 74,111 | 61,578 | 63,828 | 56,449 | |||||||||||||||||||||
| Other lodging and operating expenses |
46,124 | 39,666 | 56,068 | 58,266 | 47,791 | 49,623 | 56,190 | |||||||||||||||||||||
| Marketing, promotional and other advertising expenses |
50,170 | 54,226 | 59,193 | 48,610 | 45,580 | 42,516 | 36,179 | |||||||||||||||||||||
| Impairment loss |
5,157 | — | — | — | — | — | — | |||||||||||||||||||||
|
|
|
|||||||||||||||||||||||||||
| 617,692 | 530,518 | 698,647 | 671,260 | 634,510 | 603,531 | 586,863 | ||||||||||||||||||||||
|
|
|
|||||||||||||||||||||||||||
| Brand marketing fund expenses from franchised and managed properties |
16,511 | 14,594 | 19,065 | 17,157 | 15,182 | 13,238 | 11,790 | |||||||||||||||||||||
| Total operating expenses |
634,203 | 545,112 | 717,712 | 688,417 | 649,692 | 616,769 | 598,653 | |||||||||||||||||||||
| Operating Income |
114,513 | 128,272 | 156,181 | 129,595 | 101,849 | 89,084 | 80,991 | |||||||||||||||||||||
| Other Income (Expenses): |
||||||||||||||||||||||||||||
| Interest expense, net |
(97,260 | ) | (110,746 | ) | (148,615 | ) | (103,124 | ) | (51,611 | ) | (50,469 | ) | (54,961 | ) | ||||||||||||||
| Other income (loss) |
(1,096 | ) | 1,057 | 1,048 | (7,440 | ) | (662 | ) | 1,483 | 2,115 | ||||||||||||||||||
| Gain (loss) on extinguishment of debt, net |
(2,030 | ) | — | 1,192 | 11,451 | 40,494 | — | |||||||||||||||||||||
|
|
|
|||||||||||||||||||||||||||
| Total other income (expenses) |
(100,386 | ) | (109,689 | ) | (147,567 | ) | (109,372 | ) | (40,822 | ) | (8,492 | ) | (52,846 | ) | ||||||||||||||
|
|
|
|||||||||||||||||||||||||||
| Income from continuing operations before income taxes |
14,127 | 18,583 | 8,614 | 20,223 | 61,027 | 80,592 | 28,145 | |||||||||||||||||||||
| Income tax expense |
(21,860 | ) | (2,526 | ) | (3,598 | ) | (3,135 | ) | (2,332 | ) | (2,459 | ) | 1,634 | |||||||||||||||
| Recognition of net deferred tax liabilities upon C-corporation conversion |
(321,054 | ) | — | — | — | — | — | — | ||||||||||||||||||||
|
|
|
|||||||||||||||||||||||||||
| Income from continuing operations, net of tax |
(328,787 | ) | 16,057 | 5,016 | 17,088 | 58,695 | 78,133 | 29,779 | ||||||||||||||||||||
| Gain (loss) on discontinued operations, net of tax |
(503 | ) | (6,303 | ) | (2,495 | ) | (52,852 | ) | 244 | (12,150 | ) | 2,145 | ||||||||||||||||
|
|
|
|||||||||||||||||||||||||||
| Net Income (Loss) |
$ | (329,290 | ) | $ | 9,754 | $ | 2,521 | $ | (35,764 | ) | $ | 58,939 | $ | 65,983 | $ | 31,924 | ||||||||||||
| Net Loss Attributable to Noncontrolling Interests |
(3,814 | ) | (1,106 | ) | 1,455 | 4,810 | 4,574 | 2,845 | 5,219 | |||||||||||||||||||
| Net Income (Loss) Attributable to the Company |
$ | (333,104 | ) | $ | 8,648 | $ | 3,976 | $ | (30,954 | ) | $ | 63,513 | $ | 68,828 | $ | 37,143 | ||||||||||||
| Basic and Diluted Earnings Per Share(1) |
$ | (2.65 | ) | $ | 0.07 | $ | 0.03 | $ | (0.25 | ) | $ | 0.52 | $ | 0.56 | $ | 0.30 | ||||||||||||
|
|
||||||||||||||||||||||||||||
72
Table of Contents
| As of September 30, | As of December 31, | |||||||||||||||||||||||
| (in thousands) | 2014 | 2013 | 2012 | 2011 | 2010 | 2009 | ||||||||||||||||||
| Selected Balance Sheet Data: |
||||||||||||||||||||||||
| Cash and cash equivalents |
108,488 | 33,412 | 40,813 | 90,857 | 41,139 | 41,163 | ||||||||||||||||||
| Restricted cash |
— | 104,026 | 113,407 | 60,745 | 61,243 | 44,705 | ||||||||||||||||||
| Total assets |
3,241,105 | 3,169,834 | 3,356,320 | 3,484,232 | 3,494,905 | 3,569,298 | ||||||||||||||||||
| Total debt(2) |
1,930,206 | 2,720,286 | 2,899,965 | 3,158,409 | 3,320,829 | 3,406,709 | ||||||||||||||||||
| Total equity (deficit) |
798,518 | 305,253 | 303,385 | 183,095 | 39,597 | 36,278 | ||||||||||||||||||
|
|
||||||||||||||||||||||||
| (1) | For purposes of computing earnings per share, it is assumed that our IPO and ownership reorganization had occurred for all periods presented and therefore the outstanding shares have been adjusted to reflect the issuance of shares that took place in connection with the IPO and the Pre-IPO Transactions |
| (2) | Includes current portion and the original issue discount |
73
Table of Contents
Management’s discussion and analysis of financial condition and results of operations
The following discussion should be read together with “Prospectus summary—Our corporate structure,” “Selected financial and other data,” “Unaudited pro forma financial information,” and the historical combined financial statements and the notes thereto of the Company included elsewhere in this prospectus.
Effective April 14, 2014, La Quinta Holdings Inc. (“Holdings” or the “Company”) completed its initial public offering (“IPO”). In the IPO, Holdings issued approximately 44.0 million shares of common stock at an IPO price of $17.00 per share, including the full exercise of the underwriters’ option to purchase additional shares.
Prior to the IPO, our business was conducted, and our hotel properties were owned, and franchised through multiple entities including (i) Lodge Holdco I L.L.C., Lodge Holdco II L.L.C., and Lodge Holdco III L.L.C., and their consolidated subsidiaries, (collectively, the “La Quinta Predecessor Entities”) and (ii) entities that owned the 14 La Quinta Hotels (the “Previously Managed Portfolio” and, together with the La Quinta Predecessor Entities, the “Pre-IPO Entities”) managed by LQ Management L.L.C. (“LQM”, a consolidated variable interest entity). The Pre-IPO Entities were owned (directly and indirectly) by certain investment funds affiliated with The Blackstone Group L.P. (“Blackstone”), members of our management, and other pre-existing owners (together, the “Pre-IPO Owners”) and certain subsidiaries of the Pre-IPO Entities operated as real estate investment trusts, or REITs, for U.S. federal income tax purposes. In connection with the IPO, (i) the La Quinta Predecessor Entities purchased the Previously Managed Portfolio for a net amount equal to $76.9 million in cash and 4,348,284 shares of common stock of Holdings, (ii) the equity interests in the La Quinta Predecessor Entities held by the Pre-IPO Owners were exchanged by the Pre-IPO Owners for an aggregate of 81,060,034 shares of common stock of Holdings, (iii) we effected the refinancing transactions described below under “Liquidity and Capital Resources—Debt” and (iv) we effected certain other transactions, including a grant of vested shares of Holdings common stock and unvested shares of Holdings restricted stock to certain employees in an aggregate amount equal to 349,522 shares pursuant to the La Quinta Holdings Inc. 2014 Omnibus Incentive Plan (the transactions described in (i) – (iv), the “IPO Transactions”).
The information in this “Management’s discussion and analysis of financial condition and results of operations” reflects the following: (1) as it pertains to periods prior to the completion of the IPO, the accounts of each of the La Quinta Predecessor Entities, LQM, and all related wholly and majority owned subsidiaries. For these periods, the La Quinta Predecessor Entities have been presented on a combined historical basis due to the their prior common ownership and control; and (2) as it pertains to the periods subsequent to the completion of the IPO, the accounts of Holdings as well as its wholly owned subsidiaries which include, among others, the La Quinta Predecessor Entities, the Previously Managed Portfolio, LQM, and all other subsidiaries created in connection with the IPO.
The following discussion contains forward-looking statements that reflect our plans, estimates and beliefs and involve numerous risks and uncertainties, including but not limited to those described in the “Risk factors” section of this prospectus. Actual results may differ materially from those contained in any forward-looking statements. You should carefully read “Risk factors” and “Special note regarding forward-looking statements.”
74
Table of Contents
Overview
Our business
We are a leading owner, operator and franchisor of select-service hotels primarily serving the midscale and upper-midscale segments under the La Quinta brand. According to data provided by Smith Travel Research (“STR”), La Quinta is the fastest growing principal select-service hotel brand in the United States primarily serving these segments in terms of percentage growth of number of hotels over the last ten years ended December 31, 2013, significantly outpacing the percentage growth of our main STR competitive set (meaning Comfort, Holiday Inn Express and/or Hampton, the brands most often included in our STR competitive set) in percentage terms. Our system-wide portfolio, as of September 30, 2014, consisted of 854 hotels representing approximately 85,500 rooms located predominantly across 47 U.S. states, as well as in Canada and Mexico, of which 353 hotels were owned and operated and 501 were franchised. We also have a pipeline of 196 franchised hotels in the United States, Mexico, Canada, Colombia, Honduras, Nicaragua, and Guatemala. We primarily derive our revenues from owned hotel operations and fees generated from franchised hotels.
All of our long-lived assets are located in the United States and, in the nine months ended September 30, 2014, we derived over 99% of our revenue from within the United States.
Segments
Our operating segments are components of the business which are managed discretely and for which discrete financial information is reviewed regularly by our Chief Executive Officer, who is our chief operating decision maker, to assess performance and make decisions regarding the allocation of resources. We define our reportable segments as follows:
| • | Owned hotels—This segment derives its earnings from the operation of owned hotel properties located in the United States. |
| • | Franchise and management—This segment derives its earnings primarily from fees earned under various license, franchise and management agreements relating to our owned, franchised and managed hotels. These agreements provide for us to earn compensation for the licensing of our brand to franchisees, for providing certain services (including hotel management services) and for providing access to certain shared services and marketing programs such as reservations, La Quinta Returns, and property management systems. Other than with respect to the Previously Managed Portfolio, which are reflected as managed hotels prior to their acquisition in connection with the IPO in this “Management’s discussion and analysis of financial condition and results of operations” section, we do not currently generate, and did not generate over the periods presented, any revenue from the management of hotel operations for third parties. This segment includes intercompany fees, which are charged to our owned portfolio to reflect that certain functions, such as franchise, licensing and management, are included in the franchise and management segment. We have historically charged aggregate fees of 2.0% (0.33% license fee for trademark rights and 1.67% management fee for management services) to our owned hotels (as well as having certain cost reimbursement arrangements). Upon effectiveness of the IPO, we entered into new franchise and management agreements covering our owned portfolio, which cover certain services as well as trademark rights, and terminated the agreements that existed prior to the IPO. The new agreements provide for a franchise fee of 4.5% of gross room revenues and a management fee of 2.5% of gross operating revenue for our owned hotels. We set the |
75
Table of Contents
| franchise fee on a basis that reflects the services and rights covered by the new franchise agreements and because, as a public company with two segments that may be valued differently by investors, we believe it is meaningful to investors to show a franchise fee on our owned portfolio that is consistent with the franchise fee we charge our franchisees. We set the management fee on a basis that reflects current market rates for select service hotels and the current composition of our owned portfolio. For purposes of this “Management’s Discussion and Analysis of Financial Condition and Results of Operations” section, we have reflected the historical aggregate intercompany fees of 2.0% prior to the IPO date, and the new rates for the period from April 14, 2014 to September 30, 2014. |
Our segment information also reflects corporate and other, which includes revenues generated by and related to operating expenses incurred in connection with the overall support and brand management of our owned, managed and franchised hotels and operations. The franchise agreements we entered into with our owned hotels upon effectiveness of the IPO also includes a reservation fee of 2.0% of gross room revenues, which is reflected in corporate and other from the period from April 14, 2014 to September 30, 2014.
We have a business model that involves both ownership of properties and franchising of third-party owned properties. This provides us with diversified revenue and income streams that balance both the advantages and risks associated with these lines of business.
As an owner of hotels, we can capture the full benefit of increases in operating profits during periods of increasing demand or ADR. The cost structure of our typical hotel is more fixed than variable, so as demand and ADR increase over time, the pace of increase in operating profits typically is higher than the pace of increase of revenues. Hotel ownership is, however, more capital intensive than granting franchise agreements to third-party hotel owners, as we are responsible for the costs and capital expenditures for our owned hotels. The profits realized by us in our Owned Hotels segment are generally more significantly affected by economic downturns and declines in revenues than the results of our Franchise and Management segment. See also “—Key components and factors affecting our results of operations—Expenses.”
As a franchisor of hotels, growth in the number of franchised hotels and earnings from franchises typically results in higher overall returns on invested capital because the capital required to build and maintain franchised hotels is typically provided by the owner of the respective property with minimal or no capital required by us, as franchisor. During periods of increasing demand, we do not, however, share in most of the benefits of increases in profits from franchised hotels because franchisees do not pay us fees based on profits. A principal component of our current growth strategy is to focus our expansion on our franchise business.
76
Table of Contents
For purposes of this “Management’s discussion and analysis of financial condition and results of operations,” the following table sets forth the number of net owned, franchised and managed hotels as of September 30, 2014 and December 31, 2013, 2012 and 2011.
| As of September 30, 2014 |
As of December 31, | |||||||||||||||
| 2013 | 2012 | 2011 | ||||||||||||||
|
|
||||||||||||||||
| Owned Hotels: |
||||||||||||||||
| Owned Hotels(1) |
353 | 343 | 372 | 372 | ||||||||||||
| Discontinued Operations |
— | 4 | 33 | 33 | ||||||||||||
| Net Owned Hotels |
353 | 339 | 339 | 339 | ||||||||||||
| Franchised/Managed Hotels: |
||||||||||||||||
| Franchised Hotels |
501 | 477 | 449 | 430 | ||||||||||||
| Managed Hotels |
— | 14 | 14 | 14 | ||||||||||||
| Total Franchised/Managed Hotels |
501 | 491 | 463 | 444 | ||||||||||||
| Total Net Owned and Franchised/Managed Hotels |
854 | 830 | 802 | 783 | ||||||||||||
|
|
||||||||||||||||
| (1) | Owned Hotels includes 18 properties that are subject to ground leases; we include these 18 properties as “Owned Hotels” throughout this Management’s discussion and analysis of financial condition and results of operations. |
Seasonality
The hotel industry is seasonal in nature. Generally, our revenues are greater in the second and third quarters than in the first and fourth quarters. The timing of holidays can also impact our quarterly results. The periods during which our properties experience higher revenues vary from property to property and depend principally upon location. This seasonality can be expected to cause quarterly fluctuations in revenue, profit margins and net earnings. Additionally, our first quarter results may be further adversely affected by the timing of certain of our marketing production expenditures. Further, the timing of opening of newly constructed or franchised hotels and the timing of any hotel acquisitions or dispositions may cause a variation of revenue and earnings from quarter to quarter.
Inflation
We do not believe that inflation had a material effect on our business during the nine month period ended September 30, 2014 or the years ended December 31, 2013, 2012 and 2011. Although we believe that increases in the rate of inflation will generally result in comparable increases in hotel room rates, severe inflation could contribute to a slowing of the U.S. economy. Such a slowdown could result in a reduction in room rates and occupancy levels, negatively impacting our revenues and net income.
Key components and factors affecting our results of operations
Revenues
We primarily derive our revenues from the following sources:
| • | Room revenues. Represents revenues derived from hotel operations at owned hotels which are almost exclusively driven by room rentals. These revenues are primarily derived from three categories of guests: leisure, corporate and group. |
| • | Franchise fees. Represents revenues derived from franchise fees received in connection with the franchising of our brand, and other revenue generated by the incidental support of hotel |
77
Table of Contents
| operations for franchised hotels. Franchise fees consist of an initial fee upon the entry of a new hotel into the system and a monthly royalty fee, generally calculated as a percentage of gross room revenue. As new franchised hotels are established in our franchise system, we expect the franchise fees received from such hotels to increase over time as they establish their presence in the marketplace and stabilize their operations. |
| • | Management fees. Represents revenues derived from management fees received in connection with the management of day-to-day hotel operations, and other revenue generated by the incidental support of hotel operations for managed properties. Management fees are generally calculated as a percentage of gross room revenue. After the consummation of the IPO Transactions, we no longer have any management fees from third parties. |
| • | Other hotel revenues. Other hotel revenues include revenues generated by the incidental support of hotel operations for owned hotels, including charges to guests for vending commissions, meeting and banquet room revenue, laundry services, and other rental income from operating leases associated with leasing space for restaurants, billboards and cell towers. |
| • | Brand marketing fund revenues from franchised and managed properties. These revenues represent the fees collected from our franchised and managed hotels related to our Brand Marketing Fund (“BMF”), which are calculated as a percentage of gross room revenues. The corresponding expenses are presented as other expenses from franchised and managed properties in our condensed consolidated statements of operations, resulting in no impact to operating income or net income. After the consummation of the IPO Transactions, we no longer have BMF revenues from properties managed for third parties. |
Consumer demand for our services is closely linked to the performance of the general economy and is sensitive to business and personal discretionary spending levels. Declines in consumer demand due to adverse general economic conditions, risks affecting or reducing travel patterns, lower consumer confidence and adverse political conditions can lower the revenues and profitability of our owned hotels and the amount of franchise fee revenues we are able to generate from our franchised hotels. As a result, changes in consumer demand and general business cycles can subject, and have subjected, our revenues to significant volatility. See “Risk factors—Risks related to our business and industry” and “Industry.”
In addition to general economic conditions, our guest satisfaction scores, the location of our hotels, the expenditures that we and our franchisees incur to improve our hotels, our loyalty program and the quality of our service impact our ADR, occupancy rates, RevPAR and RevPAR Index performance (each of which is described below under “—Key indicators of financial condition and operating performance”). Changes in ADR, occupancy, RevPAR and RevPAR Index performance significantly impact our revenues.
Expenses
We primarily incur the following expenses:
| • | Direct lodging expenses and other lodging and operating expenses. Direct lodging and Other lodging and operating expenses reflect the operating expenses of our owned hotels, including both direct and indirect hotel operating expenses. Direct lodging expenses include items such as compensation costs for hotel level management, housekeeping, laundry and front desk staff, supply costs for guest room amenities and laundry, repairs and maintenance, utilities, sales and local marketing, bad debt expenses related to direct-bill corporate customers, and |
78
Table of Contents
| online and offline travel agency commissions. Other lodging and operating expenses include indirect property operating expenses, primarily property taxes and insurance. |
| • | Depreciation and amortization. These are non-cash expenses that primarily consist of depreciation of fixed assets such as buildings, furniture, fixtures and equipment at our owned hotels, as well as certain corporate assets. Amortization expense primarily consists of amortization of intangibles related to our franchise business and other leasehold interests, which are amortized over their estimated useful lives. |
| • | General and administrative expenses. General and administrative expenses consist primarily of compensation expense for our corporate staff and personnel supporting our business segments, professional fees (including consulting, audit and legal fees), travel and entertainment expenses, contractual performance obligations and office administrative and related expenses. |
| • | Impairment losses. We hold amortizing and non-amortizing intangible assets and long-lived assets. We evaluate these assets for impairment as further discussed in “—Critical accounting policies and estimates.” These evaluations have, in the past, resulted in impairment losses for certain of these assets based on the specific facts and circumstances surrounding those assets and our estimates of the fair value of those assets. Based on economic conditions or other factors at a hotel-specific or system-wide level, we may be required to take additional impairment losses to reflect further declines in our asset and/or investment values. |
| • | Brand marketing fund expenses from franchised and managed properties. These expenses represent the expenditure of BMF fees collected from our franchised and managed hotels for marketing and other support of the La Quinta brand. The corresponding revenues are presented as other revenues from franchised and managed properties in our condensed consolidated statements of operations, resulting in no impact to operating income or net income. After the consummation of the IPO Transactions, we no longer have BMF expenses from properties managed for third parties. |
| • | Marketing, promotional and other advertising expenses. These expenses include advertising costs associated with general promotion of the La Quinta brand and specific advertising and marketing support for our operation and for the operations of our franchisees, which are in addition to the expenditure of BMF fees collected from franchised and managed properties for the same purpose. |
Fluctuations in operating expenses at our owned hotels can be related to various factors, including changes in occupancy rates, which directly impact certain variable expenses including labor, supplies, utilities and other operating expenses. However, certain of our expenses are relatively fixed, including rent, property taxes, liability insurance and, to a certain extent, payroll. As market conditions dictate, we take steps to reduce both our variable and fixed costs to levels we feel are appropriate to maximize profitability and respond to market conditions without jeopardizing the overall guest experience or the value of our hotels or brand. In addition, changes in depreciation expenses may be impacted by renovations of existing hotels or the disposition of existing hotels through sale or closure. For other factors affecting our costs and expenses, see “Risk factors—Risks related to our business and industry.”
79
Table of Contents
Key indicators of financial condition and operating performance
We use a variety of financial and other information in monitoring the financial condition and operating performance of our business. Some of this information is financial information that is prepared in accordance with accounting principles generally accepted in the United States of America, or GAAP, while other information may be financial in nature and may not be prepared in accordance with GAAP. Our management also uses other information that may not be financial in nature, including statistical information and comparative data that are commonly used within the lodging industry to evaluate hotel financial and operating performance. Our management uses this information to measure the performance of hotel properties and/or our business as a whole. Historical information is periodically compared to our internal budgets, as well as against industry-wide information. We use this information for planning and monitoring our business, as well as in determining management and employee compensation.
Average daily rate (“ADR”) represents hotel room revenues divided by total number of rooms sold in a given period. ADR measures the average room price attained by a hotel or group of hotels, and ADR trends provide useful information concerning pricing policies and the nature of the guest base of a hotel or group of hotels. Changes in room rates have an impact on overall revenues and profitability.
Occupancy represents the total number of rooms sold in a given period divided by the total number of rooms available at a hotel or group of hotels. Occupancy measures the utilization of our hotels’ available capacity. Management uses occupancy to gauge demand at a specific hotel or group of hotels in a given period. Occupancy levels also help us determine achievable ADR levels as demand for hotel rooms increases or decreases.
Revenue per available room (“RevPAR”) is defined as the product of the ADR charged and the average daily occupancy achieved. RevPAR does not include other ancillary, non-room revenues, such as food and beverage revenues or parking, telephone or other guest service revenues generated by a hotel, which are not significant for the Company.
As it pertains to owned hotels, RevPAR changes that are driven predominately by occupancy have different implications for overall revenue levels and incremental hotel operating profit than changes driven predominately by ADR. For example, increases in occupancy at a hotel would lead to increases in room revenues, as well as incremental operating costs (including, but not limited to, housekeeping services, utilities and room amenity costs). RevPAR increases due to higher ADR, however, would generally not result in additional operating costs, with the exception of those charged or incurred as a percentage of revenue, such as credit card fees. As a result, changes in RevPAR driven by increases or decreases in ADR generally have a greater effect on operating profitability at our owned hotels than changes in RevPAR driven by occupancy levels. Changes in RevPAR for our franchised hotels, whether driven by occupancy or ADR, directly impact our franchise revenues as these revenues are generally based on a percentage of the franchised hotels’ room revenues. Due to seasonality in our business, we review RevPAR by comparing current periods to budget and period-over-period.
RevPAR Index measures a hotel’s or group of hotels’ fair market share of a competitive set’s revenue per available room. RevPAR Index is stated as a percentage and is calculated for each hotel by comparing the hotel’s RevPAR to the aggregate RevPAR of a group of competing hotels generally in the same market. RevPAR Index is a weighted average of the individual property results. We subscribe to STR who collects and compiles the data used to calculate RevPAR Index,
80
Table of Contents
and STR may calculate ADR and RevPAR differently than we and our competitors do. The owner of each La Quinta hotel exercises its discretion in identifying the competitive set of properties for such hotel, considering, subject to STR’s guidelines, such factors as physical proximity, competition for similar customers, services and amenities, quality and average daily rate. We initially review the competitive set makeup of each new hotel that enters our system and review the continuing appropriateness of each hotel’s competitive set on an ongoing basis. Accordingly, while the hotel brands included in the competitive set for any individual La Quinta hotel depend heavily on market-specific conditions, the competitive sets for La Quinta hotels most often include one or more of Comfort, Holiday Inn Express and Hampton. Management uses RevPAR Index and changes in RevPAR Index, particularly year-over-year percentage changes, to evaluate the performance of individual or groups of hotels relative to other competing hotels.
Comparable hotels are defined as hotels that: (i) were active and operating in our system for at least one full calendar year as of the end of the applicable period and were active and operating as of January 1st of the previous year; and (ii) have not sustained substantial property damage, business interruption or for which comparable results are not available. Management uses comparable hotels as the basis upon which to evaluate ADR, occupancy and RevPAR on a system-wide basis and for each of our reportable segments. We report variances in ADR, occupancy and RevPAR between periods for the set of comparable hotels existing at the reporting date versus the results of same set of hotels in the prior period.
| • | Of the 854 and 819 hotels in our system (excluding our assets held for sale or otherwise sold) as of September 30, 2014 and 2013, respectively, 793 and 772 have been classified as comparable hotels for the nine months ended September 30, 2014 and 2013, respectively. |
| • | Of the 830, 802 and 783 hotels in our system (excluding our assets held for sale or otherwise sold) as of December 31, 2013, 2012, and 2011, respectively, 771, 756 and 719 have been classified as comparable hotels for the years ended December 31, 2013, 2012, and 2011, respectively. |
EBITDA and Adjusted EBITDA. Earnings before interest, taxes, depreciation and amortization (“EBITDA”) is a commonly used measure in many industries. We adjust EBITDA when evaluating our performance because we believe that the adjustment for certain items, such as restructuring and acquisition transaction expenses, impairment charges related to long-lived assets, non-cash equity-based compensation, discontinued operations, and other items not indicative of ongoing operating performance, provides useful supplemental information to management and investors regarding our ongoing operating performance. We believe that EBITDA and Adjusted EBITDA provide useful information to investors about us and our financial condition and results of operations for the following reasons: (i) EBITDA and Adjusted EBITDA are among the measures used by our management team to evaluate our operating performance and make day-to-day operating decisions; and (ii) EBITDA and Adjusted EBITDA are frequently used by securities analysts, investors, lenders and other interested parties as a common performance measure to compare results or estimate valuations across companies in our industry.
EBITDA and Adjusted EBITDA are not recognized terms under GAAP, have limitations as analytical tools and should not be considered either in isolation or as a substitute for net income (loss), cash flow or other methods of analyzing our results as reported under GAAP. Some of these limitations are:
| • | EBITDA and Adjusted EBITDA do not reflect changes in, or cash requirements for, our working capital needs; |
81
Table of Contents
| • | EBITDA and Adjusted EBITDA do not reflect our interest expense, or the cash requirements necessary to service interest or principal payments, on our indebtedness; |
| • | EBITDA and Adjusted EBITDA do not reflect our tax expense or the cash requirements to pay our taxes; |
| • | EBITDA and Adjusted EBITDA do not reflect historical cash expenditures or future requirements for capital expenditures or contractual commitments; |
| • | EBITDA and Adjusted EBITDA do not reflect the impact on earnings or changes resulting from matters that we consider not to be indicative of our future operations; |
| • | although depreciation and amortization are non-cash charges, the assets being depreciated and amortized will often have to be replaced in the future, and EBITDA and Adjusted EBITDA do not reflect any cash requirements for such replacements; and |
| • | other companies in our industry may calculate EBITDA and Adjusted EBITDA differently, limiting their usefulness as comparative measures. |
Because of these limitations, EBITDA and Adjusted EBITDA should not be considered as discretionary cash available to us to reinvest in the growth of our business or as measures of cash that will be available to us to meet our obligations.
Results of operations
Our business has steadily improved in recent years following declines during the economic downturn, resulting in an increase in RevPAR on a year-over-year basis each year since 2011. We have experienced occupancy increases in our business and we have been able to increase ADR in our markets where demand has outpaced supply.
The following table presents hotel operating statistics for our system-wide (owned, franchised and managed) comparable hotels for the applicable periods(1):
| Nine months ended September 30, 2014 |
Variance nine months 2014 vs.
nine 2013 |
Year ended December 31, 2013 |
Variance 2013 vs. 2012 |
Year ended December 31, 2012 |
Variance 2012 vs. 2011 |
Year ended December 31, 2011 |
||||||||||||||||||||||
|
|
||||||||||||||||||||||||||||
| Occupancy |
68.1% | 195 bps | 64.8% | 143 bps | 63.5% | 191 bps | 61.9% | |||||||||||||||||||||
| ADR |
$ | 83.92 | 4.8% | $ | 79.11 | 4.2% | $ | 75.66 | 4.6% | $ | 72.14 | |||||||||||||||||
| RevPAR |
$ | 57.17 | 7.9% | $ | 51.26 | 6.6% | $ | 48.05 | 7.8% | $ | 44.67 | |||||||||||||||||
|
|
||||||||||||||||||||||||||||
| (1) | See definition of comparable hotels in “—Key indicators of financial condition and operating performance—Comparable hotels.” |
In addition, the following table presents RevPAR Index for our system-wide (owned, franchised and managed) hotels for the applicable periods:
| Nine months ended September 30, 2014 |
Variance nine months 2014 vs.
nine 2013 |
Year ended December 31, 2013 |
Net Change |
Year ended December 31, 2012 |
Net Change |
Year ended December 31, 2011 |
||||||||||||||||||||||
|
|
||||||||||||||||||||||||||||
| RevPAR Index(1) |
97.4% | 33 bps | 97.1% | 192 bps | 95.2% | 93 bps | 94.2% | |||||||||||||||||||||
|
|
||||||||||||||||||||||||||||
| (1) | Information based on the STR competitive set of hotels existing as of September 30, 2014 |
82
Table of Contents
We anticipate that if the overall economic recovery continues, we will continue to experience increases in demand for hotel accommodations. Because this continued increase in demand is not expected to be met with a corresponding significant increase in hotel room supply in the near term, particularly in the United States, we expect to see continued improvement in our operational and financial metrics. While we expect operating results at existing properties to improve and our business to continue to grow based on our business strengths and strategies that have and will continue to maximize our performance, our ability to do so is dependent in part on increases in discretionary spending and continued stabilization and recovery in the overall economic environment.
We also anticipate growth in our Franchise and Management segment, driven both by improvements in performance at our existing franchised hotels and by increases in the number of franchised hotels in our system based on our pipeline and plans to grow our franchise business. In recent years, we have made significant progress in executing our strategic priorities, including the expansion of our footprint through our franchise business. From September 30, 2013 to September 30, 2014, our total number of owned, franchised and managed La Quinta hotels has grown from 819, or approximately 80,400 rooms, to 854, or approximately 85,500 rooms, with franchised hotels increasing from 466 to 501. At September 30, 2013, our pipeline numbered 175 hotels, or approximately 14,300 rooms, and has remained strong with 196 hotels, or approximately 16,100 rooms, in our pipeline at September 30, 2014, while we have opened a net total of 35 hotels over that time period. Each of our pipeline hotels is represented by an executed franchise agreement, and approximately 32% of the conversions and new construction projects have commenced as of September 30, 2014. However, should our franchisees experience difficulty in securing financing for their franchise or a decline in demand for hotel rooms, our pipeline may be adversely affected, resulting in delays in the opening of new hotels or decreases in the number of future properties that we could potentially franchise. Although there is no significant cost to us associated with our pipeline, because revenues from franchised hotels are principally derived from franchise fees rather than room rentals, as we grow our system by increasing the number of franchised hotels, our revenues and expenses will increase at a significantly slower rate than if we were growing our system through an increase in number of owned hotels.
The completion of the IPO had material effects on our results of operations and financial condition. In connection with the IPO Transactions, we incurred, in the quarter ended June 30, 2014, a one-time net tax expense of $321.1 million, which reflects the impact of the La Quinta Predecessor Entities becoming owned by a “C” corporation and establishing the related net deferred tax liability on our books. Also in connection with the IPO Transactions, we recorded, in the quarter ended June 30, 2014, a one-time compensation expense of approximately $20.8 million related to the exchange of ownership units awards outstanding under our long-term cash incentive plan for vested shares of common stock of the Company, and will record additional compensation expense in the future for the unvested shares of restricted stock of the Company received in this exchange. See notes 11 and 13 to our unaudited condensed consolidated financial statements included elsewhere in this prospectus for more information. Since the consummation of the IPO, our results of operations have been and will be affected by other one-time costs and recurring costs of being a public company, including increases in executive and board compensation (including equity based compensation), increased insurance, accounting, legal and investor relations costs, the costs of compliance with the Sarbanes-Oxley Act of 2002, and the costs of complying with the other rules and regulations of the SEC and the NYSE. Additionally, as a result of becoming owned by a “C” corporation, we are taxed as a “C” corporation at the federal and state level. These costs are not
83
Table of Contents
reflected in our historical results for the periods prior to April 14, 2014, but are included in our results for the periods following the consummation of the IPO.
Nine months ended September 30, 2014 compared with nine months ended September 30, 2013
For the nine months ended September 30, 2014, we experienced system-wide improvement at our comparable hotels in occupancy, ADR, and RevPAR, compared to the nine months ended September 30, 2013. Despite challenges in specific markets, we were able to increase ADR in markets where demand outpaced supply and successfully manage room rate availability, resulting in a 4.8 percent increase in system-wide ADR in the nine months ended September 30, 2014, compared to the nine months ended September 30, 2013. System-wide occupancy increased 195 basis points in the nine months ended September 30, 2014, compared to the nine months ended September 30, 2013. The combination of improved occupancy and ADR drove a system-wide RevPAR increase of 7.9 percent in the nine months ended September 30, 2014, compared to the nine months ended September 30, 2013.
The following tables present our overall operating performance, and system-wide and segment occupancy, ADR and RevPAR rates on a comparable hotel statistic basis, in each case, for the nine months ended September 30, 2014 and 2013, including the amount and percentage change in these results between the periods:
| Nine months ended September 30, |
Increase/(Decrease) | |||||||||||||||
| (in thousands) | 2014 | 2013 | $ change | % change | ||||||||||||
|
|
||||||||||||||||
| Revenues |
||||||||||||||||
| Room revenues |
$ | 649,181 | $ | 585,294 | $ | 63,887 | 10.9 | |||||||||
| Franchise and other fee-based revenues |
68,215 | 59,846 | 8,369 | 14.0 | ||||||||||||
| Other hotel revenues |
14,809 | 13,650 | 1,159 | 8.5 | ||||||||||||
|
|
|
|||||||||||||||
| 732,205 | 658,790 | 73,415 | 11.1 | |||||||||||||
| Brand marketing fund revenues from franchised and managed properties |
16,511 | 14,594 | 1,917 | 13.1 | ||||||||||||
|
|
|
|||||||||||||||
| Total Revenues |
748,716 | 673,384 | 75,332 | 11.2 | ||||||||||||
| Operating Expenses |
||||||||||||||||
| Direct lodging expenses |
285,430 | 264,208 | 21,222 | 8.0 | ||||||||||||
| Depreciation and amortization |
129,948 | 122,694 | 7,254 | 5.9 | ||||||||||||
| General and administrative expenses |
100,863 | 49,724 | 51,139 | 102.8 | ||||||||||||
| Other lodging and operating expenses |
46,124 | 39,666 | 6,458 | 16.3 | ||||||||||||
| Marketing, promotional and other advertising expenses |
50,170 | 54,226 | (4,056 | ) | (7.5 | ) | ||||||||||
| Impairment loss |
5,157 | — | 5,157 | NM | (1) | |||||||||||
|
|
|
|||||||||||||||
| 617,692 | 530,518 | 87,174 | 16.4 | |||||||||||||
| Brand marketing fund expenses from franchised and managed properties |
16,511 | 14,594 | 1,917 | 13.1 | ||||||||||||
|
|
|
|||||||||||||||
| Total Operating Expenses |
634,203 | 545,112 | 89,091 | 16.3 | ||||||||||||
|
|
|
|||||||||||||||
| Operating Income |
114,513 | 128,272 | (13,759 | ) | (10.7 | ) | ||||||||||
|
|
||||||||||||||||
84
Table of Contents
| Nine months ended September 30, |
Increase/(Decrease) | |||||||||||||||
| (in thousands) | 2014 | 2013 | $ change | % change | ||||||||||||
|
|
||||||||||||||||
| Other Income (Expenses) |
||||||||||||||||
| Interest expense, net |
(97,260 | ) | (110,746 | ) | 13,486 | (12.2 | ) | |||||||||
| Loss on extinguishment of debt, net |
(2,030 | ) | — | (2,030 | ) | NM | (1) | |||||||||
| Other income (loss) |
(1,096 | ) | 1,057 | (2,153 | ) | NM | (1) | |||||||||
|
|
|
|||||||||||||||
| Total Other Income (Expenses) |
(100,386 | ) | (109,689 | ) | 9,303 | 8.5 | ||||||||||
|
|
|
|||||||||||||||
| Income from Continuing Operations Before Income Taxes |
14,127 | 18,583 | (4,456 | ) | (24.0 | ) | ||||||||||
| Income tax provision |
(21,860 | ) | (2,526 | ) | (19,334 | ) | NM | (1) | ||||||||
| Recognition of net deferred tax liabilities upon C-corporation conversion |
(321,054 | ) | — | (321,054 | ) | NM | (1) | |||||||||
|
|
|
|||||||||||||||
| Income (Loss) from Continuing Operations, Net of Tax |
(328,787 | ) | 16,057 | (344,844 | ) | NM | (1) | |||||||||
| Loss on Discontinued Operations, Net of Tax |
(503 | ) | (6,303 | ) | 5,800 | NM | (1) | |||||||||
|
|
|
|||||||||||||||
| Net Income (Loss) |
(329,290 | ) | 9,754 | (339,044 | ) | NM | (1) | |||||||||
| Net Income Attributable to Noncontrolling Interests |
(3,814 | ) | (1,106 | ) | (2,708 | ) | NM | (1) | ||||||||
|
|
|
|||||||||||||||
| Net Income (Loss) Attributable to La Quinta Holdings’ stockholders |
$ | (333,104 | ) | $ | 8,648 | $ | (341,752 | ) | NM | (1) | ||||||
|
|
||||||||||||||||
| (1) | Fluctuation in terms of percentage change is not meaningful. |
| Comparable hotel statistics | Nine months ended September 30, 2014 |
Variance 2014 vs. 2013 |
||||||
|
|
||||||||
| Owned Hotels |
||||||||
| Occupancy |
67.7% | 155 bps | ||||||
| ADR |
$ | 79.73 | 5.2% | |||||
| RevPAR |
$ | 53.99 | 7.7% | |||||
| Franchised Hotels |
||||||||
| Occupancy |
68.6% | 245 bps | ||||||
| ADR |
$ | 89.22 | 4.2% | |||||
| RevPAR |
$ | 61.25 | 8.0% | |||||
| System-wide |
||||||||
| Occupancy |
68.1% | 195 bps | ||||||
| ADR |
$ | 83.92 | 4.8% | |||||
| RevPAR |
$ | 57.17 | 7.9% | |||||
|
|
||||||||
Revenues
Owned hotels
As of September 30, 2014, we had 353 owned hotels, including the 14 Previously Managed Hotels, comprising 45,000 rooms, located in the United States. Room revenues at our owned hotels for the nine months ended September 30, 2014 and 2013 totaled $649.2 million and $585.3 million, respectively. The increase of $63.9 million, or 10.9 percent, was primarily driven by
85
Table of Contents
an increase in RevPAR at our comparable owned hotels of 7.7 percent, which was due to increases in ADR and occupancy of 5.2 percent and 155 basis points, respectively. Additionally, room revenues for the nine months ended September 30, 2014 includes room revenues of $18.1 million for the 14 Previously Managed Hotels from the acquisition date, April 14, 2014, to the period ended September 30, 2014.
The increase in RevPAR was driven by a combination of factors, including the continuing economic recovery, an increased demand for hotel rooms due in part to the historically low level of new hotels being built in our competitive markets, enhanced pricing power in certain of our markets, the introduction of new distribution and selling channels and continuous enhancements to our brand experience through capital expenditures and staff training.
Other hotel revenues at our owned hotels for the nine months ended September 30, 2014 and 2013 totaled $14.8 million and $13.7 million, respectively. The increase of $1.2 million, or 8.5 percent, was primarily a result of an increase in demand for ancillary hotel services, which was driven by increased occupancy, as well as the expansion of the number of Bright Side Market sundry shops in our owned hotels and an increase in restaurant rental income.
Franchise and other fee-based revenues
As of September 30, 2014, we had 501 franchised and managed hotels, comprising approximately 40,500 rooms, located in the United States, Canada and Mexico. Franchise and other fee-based revenues for the nine months ended September 30, 2014 and 2013 totaled $68.2 million and $59.8 million, respectively. The increase of $8.4 million, or 14.0 percent, was primarily driven by an increase in RevPAR at our comparable franchised hotels of 8.0 percent, which was due to increases in ADR and occupancy of 4.2 percent and 245 basis points, respectively. The increase in RevPAR was driven by a combination of factors, including the continuing economic recovery, an increased demand for hotel rooms due in part to the historically low level of new hotels being built in our franchised hotels’ competitive markets, the continued expansion of our footprint into higher-rated markets, and enhanced pricing power in certain of our franchisees’ markets.
The addition of new hotels to our franchise system also contributed to the growth in revenue. From September 30, 2013 to September 30, 2014, we added 35 franchised hotels on a net basis, providing an additional 3,200 rooms to our system.
Operating expenses
| Nine months ended September 30, |
Percent change |
|||||||||||
| (in millions) | 2014 | 2013 | 2014 vs. 2013 | |||||||||
|
|
||||||||||||
| Direct lodging expenses |
$ | 285.4 | $ | 264.2 | ||||||||
| Other lodging and operating expenses |
46.1 | 39.7 | ||||||||||
|
|
|
|||||||||||
| $ | 331.5 | $ | 303.9 | 9.1 | ||||||||
|
|
||||||||||||
In total, direct lodging and other lodging and operating expenses amounted to $331.5 million and $303.9 million, respectively, for the nine months ended September 30, 2014 and 2013 resulting in an increase of $27.6 million, or 9.1 percent. This overall increase was primarily the result of increases in direct lodging expenses for our owned hotels driven primarily by: (1) an occupancy increase of 155 basis points; (2) increased travel agency commission costs due to (a) increased volume driven through Expedia.com’s Expedia Traveler’s Preference, which was
86
Table of Contents
introduced in the second quarter of 2013 and which allows the guest a choice to pay for a reservation at the time of booking resulting in Expedia retaining its margin before paying us after the guest’s stay, or to pay us directly, resulting in the recognition of a commission after the guest departs based on actual consumed revenue. Many of our guests chose to pay us directly under this program, resulting in a new commission expense; and (b) increased volume driven through Booking.com, a significant new online travel agency introduced to our system mid-2013; (3) increased repair and maintenance costs; (4) increased professional fees for services rendered for our owned hotels; (5) increased expenses related to the acquisition of the 14 Previously Managed Hotels, including ground lease rental and employee compensation; and (6) increased utilities costs, specifically electric, water and natural gas. These expense increases were partially offset by the effects of continued cost mitigation strategies and the impact of operational efficiencies employed at our owned hotels. In addition, the overall increase was driven by increases in other lodging and operating expenses for our owned hotels increased primarily in the cost for property, general liability and auto insurance, as well as property taxes related to increased valuation assessments for certain of our owned hotels, as well as expenses relating to the 14 Previously Managed Hotels.
| Nine months ended September 30, |
Percent change |
|||||||||||
| (in millions) | 2014 | 2013 | 2014 vs. 2013 | |||||||||
|
|
||||||||||||
| Depreciation and amortization |
$ | 129.9 | $ | 122.7 | 5.9 | |||||||
|
|
||||||||||||
Depreciation and amortization expense for our owned hotels totaled $129.9 million and $122.7 million, respectively, for the nine months ended September 30, 2014 and 2013. The increase of $7.3 million, or 5.9 percent, was the result of $98.4 million in capital expenditures between September 30, 2013 and September 30, 2014, and $166.5 million in additions to property and equipment as part of the acquisition of the Previously Managed Hotels, which drove additional depreciation on certain owned assets in 2014.
| Nine months ended September 30, |
Percent change |
|||||||||||
| (in millions) | 2014 | 2013 | 2014 vs. 2013 | |||||||||
|
|
||||||||||||
| General and administrative expenses |
$ | 100.9 | $ | 49.7 | ||||||||
| Marketing, promotional and other advertising expenses |
50.2 | 54.2 | ||||||||||
|
|
|
|||||||||||
| $ | 151.1 | $ | 103.9 | 45.4 | ||||||||
|
|
||||||||||||
In total, general and administrative and marketing, promotional and other advertising expenses, not funded by the BMF collected from our franchised and managed hotels, amounted to $151.1 million and $103.9 million, respectively, for the nine months ended September 30, 2014 and 2013, resulting in an increase of $47.2 million, or 45.4 percent. This overall increase was primarily the result of equity based compensation expense of $39.6 million for the nine months ended September 30, 2014, of which, $31.7 million related to the exchange of long-term incentive ownership units held by certain members of the Company’s management for shares of the Company’s common stock in connection with our IPO. The balance of the equity based compensation amount relates to certain grants made under the La Quinta Holdings Inc. 2014 Omnibus Incentive Plan at the time of, and subsequent to, our IPO. Other factors causing the increase include increases in executive and director compensation and bonus accrual and fees for professional services, primarily accounting and legal, related to the Company operating as a public company, and the IRS audit tax defense.
87
Table of Contents
In addition, we spent $16.5 million and $14.6 million of BMF fees collected from franchised and managed hotels on similar brand management and other advertising expenses for the nine months ended September 30, 2014 and 2013, respectively.
| Nine months ended September 30, |
Percent change |
|||||||||||
| (in millions) | 2014 | 2013 | 2014 vs. 2013 | |||||||||
|
|
||||||||||||
| Impairment loss |
$ | 5.2 | $ | — | NM | (1) | ||||||
|
|
||||||||||||
| (1) | Fluctuation in terms of percentage change is not meaningful |
In June 2014 we determined that the long-lived assets associated with one of our owned hotels were partially impaired primarily due to unfavorable expected terms of the upcoming underlying ground lease renewal and the likelihood of the Company abandoning the hotel upon expiration of the ground lease. As a result, we recorded an impairment loss of approximately $5.2 million for the nine months ended September 30, 2014.
Other Income (Expenses)
| Nine months ended September 30, |
Percent change |
|||||||||||
| (in millions) | 2014 | 2013 | 2014 vs. 2013 | |||||||||
|
|
||||||||||||
| Interest expense, net |
$ | 97.3 | $ | 110.7 | (12.2 | ) | ||||||
|
|
||||||||||||
Net interest expense totaled $97.3 million and $110.7 million, respectively, for the nine months ended September 30, 2014 and 2013. The decrease of $13.5 million, or 12.2 percent, primarily driven by a decrease in the interest rate on our new senior debt facility as compared to our historical debt, which was partially offset by $4.1 million of interest expense related to an interest rate swap agreement covering a portion of our outstanding long-term debt entered into on April 14, 2014.
| Nine months ended September 30, |
Percent change |
|||||||||||
| (in millions) | 2014 | 2013 | 2014 vs. 2013 | |||||||||
|
|
||||||||||||
| Loss on extinguishment of debt, net |
$ | 2.0 | $ | — | NM | (1) | ||||||
|
|
||||||||||||
| (1) | Fluctuation in terms of percentage change is not meaningful. |
In connection with the refinancing of our debt during the nine months ended September 30, 2014, we recorded a $2.0 million loss on extinguishment of debt, representing the write-off of unamortized debt issuance costs and associated fees.
| Nine months ended September 30, |
Percent change |
|||||||||||
| (in millions) | 2014 | 2013 | 2014 vs. 2013 | |||||||||
|
|
||||||||||||
| Income tax provision |
$ | 21.9 | $ | 2.5 | ||||||||
| Recognition of net deferred tax liabilities upon C-corporation conversion |
321.1 | — | ||||||||||
|
|
|
|||||||||||
| $ | 343.0 | $ | 2.5 | NM | (1) | |||||||
|
|
||||||||||||
| (1) | Fluctuation in terms of percentage change is not meaningful. |
Prior to our IPO on April 14, 2014, we operated within legal structures that are disregarded for federal and most state income tax purposes. Accordingly, in those jurisdictions that recognize
88
Table of Contents
disregarded status, items of income and expense have been allocated to the owners of our legal entities. Our partnership and REIT status terminated in connection with the IPO, as the La Quinta Predecessor Entities were contributed to Holdings, a “C” corporation, and our REITs were converted into limited liability companies. As a result of these transactions, we became subject to additional entity-level taxes during the nine months ended September 30, 2014 and we recorded a one-time net deferred tax expense of $321.1 million, primarily driven by the accumulated differences between book and tax depreciation, and the recognition of additional deferred tax assets which are primarily related to the expected realization of federal net operating loss carryforwards. The provision for the nine months ended September 30, 2014 also includes the impact of a loss in the pre-IPO period for which no tax benefit has been recorded, as well as equity compensation charges that are not deductible for income tax purposes. See “—Critical accounting policies and estimates—Income taxes”.
| Nine months ended September 30, |
Percent change |
|||||||||||
| (in millions) | 2014 | 2013 | 2014 vs. 2013 | |||||||||
|
|
||||||||||||
| Loss on discontinued operations, net of tax |
$ | 0.5 | $ | 6.3 | (92.0 | ) | ||||||
|
|
||||||||||||
During June 2013, we finalized the decision to dispose of 44 of our owned hotels, including all of our Baymont-branded hotels. As such, these hotels were classified as assets held for sale, and the results of their operations are presented within discontinued operations for the nine months ended September 30, 2013. Prior to December 31, 2013, 40 of the 44 hotels were sold, with the remaining 4 being sold in February 2014. The results of the operations of the 4 hotels that were sold in February 2014, was a net loss of $0.5 million for the nine months ended September 30, 2014.
89
Table of Contents
Segment results
We evaluate our segments’ operating performance using segment Adjusted EBITDA, as described in Note 15: “Segments” in the unaudited condensed consolidated financial statements of La Quinta Holdings Inc. as of and for the nine months ended September 30, 2014 and 2013, included elsewhere in this prospectus. Refer to those financial statements for a reconciliation of Adjusted EBITDA to net income. For a discussion of our definitions of EBITDA and Adjusted EBITDA, how management uses them to manage our business and material limitations on their usefulness, refer to “—Key indicators of financial condition and operating performance.” The following table sets forth revenues and Adjusted EBITDA by segment, reconciled to consolidated amounts, for the nine months ended September 30, 2014 and 2013. The comparison of the nine month period September 30, 2014 to the nine month period ended September 30, 2013 is impacted by the change in certain intercompany agreements which went into effect on April 14, 2014—refer to the footnotes to the table below for a more detailed discussion:
| Nine months ended September 30, |
||||||||
| (in thousands) | 2014 | 2013 | ||||||
|
|
||||||||
| Revenues |
||||||||
| Owned Hotels |
$ | 667,564 | $ | 601,504 | ||||
| Franchise and Management(1) |
68,977 | 42,232 | ||||||
|
|
|
|||||||
| Segment revenues |
736,541 | 643,736 | ||||||
| Other revenues from franchised and managed properties |
16,511 | 14,594 | ||||||
| Corporate and other(2) |
88,054 | 74,424 | ||||||
| Intersegment elimination(3) |
(92,390 | ) | (59,370 | ) | ||||
|
|
|
|||||||
| Total revenues |
$ | 748,716 | $ | 673,384 | ||||
|
|
|
|||||||
| Adjusted EBITDA |
||||||||
| Owned Hotels |
$ | 249,226 | $ | 246,171 | ||||
| Franchise and Management |
68,977 | 42,232 | ||||||
|
|
|
|||||||
| Segment Adjusted EBITDA |
318,203 | 288,403 | ||||||
| Corporate and other |
(27,944 | ) | (32,188 | ) | ||||
|
|
|
|||||||
| Adjusted EBITDA |
$ | 290,259 | $ | 256,215 | ||||
|
|
||||||||
| (1) | This segment includes intercompany fees which are charged to our owned hotels to reflect that certain functions, such as licensing and management, are included in the franchise and management segment. Prior to the IPO, we charged aggregate fees of 2.0% (0.33% license fees for trademark rights and 1.67% management fee for management services) to our owned hotels. In connection with the IPO, we entered into a new franchise agreement with our owned hotels, which covers certain services as well as trademark rights, and a new management agreement and terminated the existing agreements with our owned hotels. The new agreements, which commenced April 14, 2014, provide for a franchise fee of 4.5% of gross room revenues and a management fee of 2.5% of gross operating revenue for our owned hotels. Our consolidated financial information by segment for periods prior to April 14, 2014 presented herein reflects the historical aggregate fees of 2.0%. |
| (2) | Includes revenues related to our brand management programs and other cost reimbursements. The portion of these fees that are charged to our owned hotels, which totaled $51.0 million and $41.4 million for the nine months ended September 30, 2014 and 2013, respectively, are eliminated in the accompanying condensed consolidated financial statements. The franchise agreement we entered into with our owned hotels upon effectiveness of the IPO also includes a reservation fee of 2.0% of gross room revenues, which is reflected in corporate and other. |
| (3) | Includes management, license, franchise, BMF, Returns and other cost reimbursements totaling $92.4 million and $59.4 million for each of the nine month periods ended September 30, 2014 and 2013, respectively. These fees are charged to owned hotels and are eliminated in the accompanying condensed consolidated financial statements. |
90
Table of Contents
Owned hotels
Owned Hotels segment revenues increased primarily due to an improvement in RevPAR of 7.7 percent at our comparable owned hotels. Refer to “Revenues—Owned hotels” within this section for further discussion on the increase in revenues from our comparable owned hotels. Our Owned Hotels segment’s Adjusted EBITDA increased as a result of an increase in Owned Hotels segment revenues of approximately $66.1 million, partially offset by increased franchise, reservation, and management fee expense totaling $28.8 million related to the establishment of new franchise and management agreements at the time of our IPO. In addition, direct lodging expenses increased $21.2 million, and other lodging and operating expenses increased $6.5 million at our owned hotels. Refer to “Operating expenses—Owned hotels” within this section for further discussion on the increase in operating expenses at our owned hotels.
Franchise and management
Franchise and Management segment revenues increased by $26.7 million primarily as a result of increases in RevPAR of 8.0 percent at our comparable franchised and owned hotels and the net addition of hotels added to our franchise system. Refer to “Revenues—Franchise and other fee-based revenues” within this section for further discussion on the increase in revenues from our comparable franchised hotels. In addition, franchise and management segment revenues increased as a result of the establishment of new franchise and management agreements at the time of our IPO which resulted in increased franchise and management fee income totaling $20.2 million. Our Franchise and Management segment’s Adjusted EBITDA increased as a result of the overall increase in Franchise and Management segment revenues.
Year ended December 31, 2013 compared with year ended December 31, 2012
For 2013, we experienced system-wide improvement at our comparable hotels in occupancy, ADR, and RevPAR, compared to the year ended December 31, 2012. Despite challenges in specific markets, we were able to increase ADR in markets where demand outpaced supply and successfully manage the usage of our best available rates (BAR), which represents our lowest available unqualified rate, resulting in a 4.2 percent increase in system-wide ADR in the year ended December 31, 2013, compared to the year ended December 31, 2012. System-wide occupancy increased 143 basis points in the year ended December 31, 2013, compared to the year ended December 31, 2012. The combination of improved occupancy and ADR drove a system-wide RevPAR increase of 6.6 percent in the year ended December 31, 2013, compared to the year ended December 31, 2012.
91
Table of Contents
The following tables present our overall operating performance, and system-wide and segment occupancy, ADR and RevPAR rates on a comparable hotel statistic basis, in each case, for the year ended December 31, 2013 and 2012, including the amount and percentage change in these results between the periods:
| Year ended December 31, |
Increase/(Decrease) | |||||||||||||||
| (in thousands) | 2013 | 2012 | $ change | % change | ||||||||||||
|
|
||||||||||||||||
| Revenues |
||||||||||||||||
| Room revenues |
$ | 757,699 | $ | 714,143 | $ | 43,556 | 6.1% | |||||||||
| Franchise and other fee-based revenues |
79,180 | 69,206 | 9,974 | 14.4 | ||||||||||||
| Other hotel revenues |
17,949 | 17,506 | 443 | 2.5 | ||||||||||||
|
|
|
|||||||||||||||
| 854,828 | 800,855 | 53,973 | 6.7 | |||||||||||||
| Brand marketing fund revenues from franchised and managed properties |
19,065 | 17,157 | 1,908 | 11.1 | ||||||||||||
|
|
|
|||||||||||||||
| Total Revenues |
873,893 | 818,012 | 55,881 | 6.8 | ||||||||||||
| Operating Expenses |
||||||||||||||||
| Direct lodging expenses |
344,515 | 334,394 | 10,121 | 3.0 | ||||||||||||
| Depreciation and amortization |
164,077 | 155,879 | 8,198 | 5.3 | ||||||||||||
| General and administrative expenses |
74,794 | 74,111 | 683 | 0.9 | ||||||||||||
| Other lodging and operating expenses |
56,068 | 58,266 | (2,198 | ) | (3.8 | ) | ||||||||||
| Marketing, promotional and other advertising expenses |
59,193 | 48,610 | 10,583 | 21.8 | ||||||||||||
|
|
|
|||||||||||||||
| 698,647 | 671,260 | 27,387 | 4.1 | |||||||||||||
| Brand marketing fund expenses from franchised and managed properties |
19,065 | 17,157 | 1,908 | 11.1 | ||||||||||||
|
|
|
|||||||||||||||
| Total Operating Expenses |
717,712 | 688,417 | 29,295 | 4.3 | ||||||||||||
| Operating Income |
156,181 | 129,595 | 26,586 | 20.5 | ||||||||||||
|
|
|
|||||||||||||||
| Other Income (Expenses) |
||||||||||||||||
| Interest expense, net |
(148,615 | ) | (103,124 | ) | (45,491 | ) | 44.1 | |||||||||
| Other income (loss) |
1,048 | (7,440 | ) | 8,488 | NM | (1) | ||||||||||
| Gain on extinguishment of debt, net |
— | 1,192 | (1,192 | ) | NM | (1) | ||||||||||
|
|
|
|||||||||||||||
| Total Other Income (Expenses) |
(147,567 | ) | (109,372 | ) | (38,195 | ) | NM | (1) | ||||||||
|
|
|
|||||||||||||||
| Income from Continuing Operations Before Income Taxes |
8,614 | 20,223 | (11,609 | ) | NM | (1) | ||||||||||
| Income tax expense |
(3,598 | ) | (3,134 | ) | (463 | ) | 14.8 | |||||||||
|
|
|
|||||||||||||||
| Income from Continuing Operations, Net of Tax |
5,016 | 17,088 | (12,072 | ) | NM | (1) | ||||||||||
| Loss on Discontinued Operations, Net of Tax |
(2,495 | ) | (52,852 | ) | 50,357 | NM | (1) | |||||||||
| Net Income |
2,521 | (35,764 | ) | 38,285 | NM | (1) | ||||||||||
| Net Loss Attributable to Noncontrolling Interests |
1,455 | 4,810 | (3,355 | ) | (69.8 | ) | ||||||||||
|
|
|
|||||||||||||||
| Net Income (Loss) Attributable to the Company |
$ | 3,976 | $ | (30,954 | ) | $ | 34,930 | NM | (1) | |||||||
|
|
||||||||||||||||
| (1) | Fluctuation in terms of percentage change is not meaningful. |
92
Table of Contents
| Comparable hotel statistics | Year ended December 31, 2013 |
Variance 2013 vs. 2012 |
||||||
|
|
||||||||
| Owned Hotels |
||||||||
| Occupancy |
64.0% | 96 bps | ||||||
| ADR |
$ | 75.08 | 4.8% | |||||
| RevPAR |
$ | 48.05 | 6.4% | |||||
| Franchised and Managed Hotels |
||||||||
| Occupancy |
65.8% | 201 bps | ||||||
| ADR |
$ | 83.98 | 3.6% | |||||
| RevPAR |
$ | 55.25 | 6.8% | |||||
| System-wide |
||||||||
| Occupancy |
64.8% | 143 bps | ||||||
| ADR |
$ | 79.11 | 4.2% | |||||
| RevPAR |
$ | 51.26 | 6.6% | |||||
|
|
||||||||
Revenues
Owned hotels
As of December 31, 2013, we had 339 owned hotels, comprising 43,210 rooms, located in the United States. Room revenues at our owned hotels for the years ended December 31, 2013 and 2012 totaled $757.7 million and $714.1 million, respectively. The increase of $43.6 million, or 6.1 percent, was primarily driven by an increase in RevPAR at our comparable owned hotels of 6.4 percent, which was due to increases in ADR and occupancy of 4.8 percent and 96 basis points, respectively.
The increase in RevPAR was driven by a combination of factors, including the continuing economic recovery, an increased demand for hotel rooms due in part to the historically low level of new hotels being built in our competitive markets, enhanced pricing power in certain of our markets, the introduction of new distribution and selling channels and continuous enhancements to our brand experience through capital expenditures and staff training.
Other hotel revenues at our owned hotels for the year ended December 31, 2013 and 2012 totaled $17.9 million and $17.5 million, respectively. The increase of $0.4 million, or 2.5 percent, was primarily a result of an increase in demand for ancillary hotel services, which was driven by increased occupancy.
Franchise and other fee-based revenues
As of December 31, 2013, we had 491 franchised and managed hotels, comprising 39,969 rooms, located in the United States, Canada and Mexico. Franchise and other fee-based revenues for the years ended December 31, 2013 and 2012 totaled $79.2 million and $69.2 million, respectively. The increase of $10 million, or 14.4 percent, was primarily driven by an increase in RevPAR at our comparable franchised and managed hotels of 6.8 percent, which was due to increases in ADR and occupancy of 3.6 percent and 201 basis points, respectively. The increase in RevPAR was driven by a combination of factors, including the continuing economic recovery, an increased demand for hotel rooms due in part to the historically low level of new hotels being built in our franchised hotels’ competitive markets and enhanced pricing power in certain of our franchisees’ markets.
93
Table of Contents
The addition of new hotels to our franchise system also contributed to the growth in revenue. From December 31, 2012 to December 31, 2013, we added 28 franchised hotels on a net basis, providing an additional 2,485 rooms to our system.
Operating expenses
| Year ended December 31, |
Percent change |
|||||||||||
| (in millions) | 2013 | 2012 | 2013 vs. 2012 | |||||||||
|
|
||||||||||||
| Direct lodging expenses |
$ | 344.5 | $ | 334.4 | 3.0 | |||||||
| Other lodging and operating expenses |
56.1 | 58.3 | (3.8 | ) | ||||||||
|
|
||||||||||||
Direct lodging expenses for our owned hotels totaled $344.5 million and $334.4 million, respectively, for the years ended December 31, 2013 and 2012. The increase of $10.1 million, or 3.0 percent, was driven primarily by: (1) an occupancy increase of 96 basis points; (2) increased usage and market driven price increases in certain of the commodities that impact our business, such as milk, orange juice and cotton; (3) increased travel agency commission costs due to the introduction of Expedia.com’s Expedia Traveler’s Preference, which allows the guest a choice to pay for a reservation at the time of booking, resulting in Expedia retaining its margin before paying us after the guest’s stay, or to pay us directly, resulting in the recognition of a commission after the guest departs based on actual consumed revenue. Many of our guests chose to pay us directly under this program, resulting in a new commission expense; and (4) the introduction of a significant new online travel agency, Booking.com, to our system. These expense increases were partially offset by the effects of continued cost mitigation strategies and the impact of operational efficiencies employed at our owned hotels. Other lodging and operating expenses for our owned hotels totaled $56.1 million and $58.3 million, respectively, for the years ended December 31, 2013 and 2012. The decrease of $2.2 million, or 3.8 percent, was primarily the result of decreases in net property casualty losses and losses on retirement or sale of assets, partially offset by increased cost for property, general liability and auto insurance.
| Year ended December 31, |
Percent change |
|||||||||||
| (in millions) | 2013 | 2012 | 2013 vs. 2012 | |||||||||
|
|
||||||||||||
| Depreciation and amortization |
$ | 164.1 | $ | 155.9 | 5.3 | |||||||
|
|
||||||||||||
Depreciation and amortization expense for our owned hotels totaled $164.1 million and $155.9 million, respectively, for the years ended December 31, 2013 and 2012. The increase of $8.2 million, or 5.3 percent, was the result of $115.5 million in capital expenditures between December 31, 2012 and December 31, 2013, which drove additional depreciation on certain owned assets in 2013.
| Year ended December 31, |
Percent change |
|||||||||||
| (in millions) | 2013 | 2012 | 2013 vs. 2012 | |||||||||
|
|
||||||||||||
| General and administrative expenses |
$ | 74.8 | $ | 74.1 | 0.9 | |||||||
|
|
||||||||||||
94
Table of Contents
General and administrative expenses totaled $74.8 million and $74.1 million, respectively, for the years ended December 31, 2013 and 2012. The increase of $0.7 million, or 0.9 percent, was primarily the result of an increase in professional services by outside parties and corporate salaries.
| Year ended December 31, |
Percent change |
|||||||||||
| (in millions) | 2013 | 2012 | 2013 vs. 2012 | |||||||||
|
|
||||||||||||
| Marketing, promotional and other advertising expenses |
$ | 59.2 | $ | 48.6 | 21.8 | |||||||
|
|
||||||||||||
Marketing, promotional and other advertising expenses, not funded by the BMF collected from our franchised and managed hotels, totaled $59.2 million and $48.6 million, respectively, for the years ended December 31, 2013 and 2012. The increase of $10.6 million, or 21.8 percent, was primarily driven by increased spending to enhance brand awareness via broadcast, online, and print media outlets, increased administrative costs to support our growing brand programs and increased reimbursements to franchised and managed hotels for free night certificate redemptions. In addition, we spent $19.1 million of the BMF fees collected from franchised and managed hotels on similar brand management and other advertising expenses.
| Year ended December 31, |
Percent change |
|||||||||||
| (in millions) | 2013 | 2012 | 2013 vs. 2012 | |||||||||
|
|
||||||||||||
| Interest expense, net |
$ | 148.6 | $ | 103.1 | 44.1 | |||||||
|
|
||||||||||||
Net interest expense totaled $148.6 million and $103.1 million, respectively, for the years ended December 31, 2013 and 2012. The increase of $45.5 million, or 44.1 percent, was primarily driven by the amendment and extension of our debt facilities (the “Secured Debt”) which occurred in May 2012 (the “Amendment”). The Amendment raised the weighted average effective interest rate on our Secured Debt from approximately 3.4 percent to approximately 5.4 percent for the years ended December 31, 2012 and 2013. The higher effective interest rate was in place for the full twelve months in 2013 as compared to approximately seven months in 2012.
| Year ended December 31, |
Percent change |
|||||||||||
| (in millions) | 2013 | 2012 | 2013 vs. 2012 | |||||||||
|
|
||||||||||||
| Gain on extinguishment of debt, net |
$ | — | $ | 1.2 | NM | (1) | ||||||
| Other income (loss) |
$ | 1.0 | $ | (7.4 | ) | NM | (1) | |||||
|
|
||||||||||||
| (1) | Fluctuation in terms of percentage change is not meaningful. |
In connection with the Amendment, we (1) settled a portion of our Secured Debt for $69.8 million, which resulted in a $5.2 million gain, and modified the terms of an additional portion of our Secured Debt, which resulted in a $4.0 million loss, the net impact of which was a gain on early extinguishment of debt of approximately $1.2 million, and (2) incurred $7.7 million of closing costs which were expensed as incurred and included in other income (loss).
| Year ended December 31, |
Percent change |
|||||||||||
| (in millions) | 2013 | 2012 | 2013 vs. 2012 | |||||||||
|
|
||||||||||||
| Income tax expense |
$ | 3.6 | $ | 3.1 | 14.8 | |||||||
|
|
||||||||||||
95
Table of Contents
We have historically operated within legal structures that are disregarded for federal and most state income tax purposes. Accordingly, in those jurisdictions that recognize disregarded status, items of income and expense have been allocated to the owners of our legal entities. See “—Critical accounting policies and estimates—Income taxes.”
Our income tax expense totaled $3.6 million and $3.1 million, respectively, for the years ended December 31, 2013 and 2012 and primarily consisted of the Texas margin tax, federal income taxes paid by certain taxable REIT subsidiaries and a provision for foreign income taxes. The increase of $0.5 million, or 14.8 percent, is primarily attributable to increased alternative minimum tax paid by a taxable REIT subsidiary and an increase in state income taxes due to increased taxable income, primarily in Texas, Colorado and California.
The effective tax rate for 2013 of 41.8% differs from the U.S. statutory federal income tax rate of 35% primarily due to state tax rates applied to U.S. earnings, foreign income taxes, and the increase in the valuation allowance for alternative minimum tax credit carry forwards. This is offset by a $2.9 million benefit for income not subject to tax at the Predecessor Entities level due to limited liability companies treated as partnerships and REIT status.
The effective tax rate for 2012 of 15.5% differed from the U.S. statutory federal income tax rate of 35% primarily due to the benefit of $7.0 million for income not subject to tax at the Predecessor Entities level due to limited liability companies treated as partnerships and REIT status. This is offset by state tax rates applied to U.S. earnings, foreign income taxes, and the increase in the valuation allowance for alternative minimum tax credit carry forwards.
Segment results
We evaluate our segments’ operating performance using segment Adjusted EBITDA, as described in Note 16: “Segments” in the audited combined financial statements of the Predecessor Entities, included elsewhere in this prospectus. Refer to those financial statements for a reconciliation of Adjusted EBITDA to net income. For a discussion of our definitions of EBITDA and Adjusted EBITDA, how management uses them to manage our business and material limitations on their usefulness, refer to “—Key indicators of financial condition and operating performance.” The following table sets forth revenues and Adjusted EBITDA by segment, reconciled to consolidated amounts, for the years ended December 31, 2013 and 2012:
| Year ended December 31, |
Percent change |
|||||||||||
| (in thousands) | 2013 | 2012 | 2013 vs. 2012 | |||||||||
|
|
||||||||||||
| Revenues |
||||||||||||
| Owned Hotels |
$ | 778,898 | $ | 734,547 | 6.0 | |||||||
| Franchise and Management |
55,542 | 50,086 | 10.9 | |||||||||
| Segment revenues |
834,440 | 784,633 | 6.3 | |||||||||
| Other revenues from franchised and managed properties |
19,065 | 17,157 | 11.1 | |||||||||
| Corporate and other revenues(1)(2) |
97,177 | 88,870 | 9.3 | |||||||||
| Intersegment elimination(3) |
(76,789 | ) | (72,648 | ) | 5.7 | |||||||
| Total revenues |
873,893 | 818,012 | 6.8 | |||||||||
| Adjusted EBITDA |
||||||||||||
| Owned Hotels |
311,809 | 285,974 | 9.0 | |||||||||
| Franchise and Management |
55,542 | 50,086 | 10.9 | |||||||||
| Segment Adjusted EBITDA |
367,351 | 336,060 | 9.3 | |||||||||
| Corporate and other |
(40,544 | ) | (38,237 | ) | 6.0 | |||||||
| Adjusted EBITDA |
326,807 | 297,823 | 9.7 | |||||||||
|
|
||||||||||||
96
Table of Contents
| (1) | Corporate and other includes revenues generated by and related to, and operating expenses incurred in connection with, the overall support and brand management of our owned, managed and franchised hotels and operations. |
| (2) | Includes revenues related to our brand management programs and other cost reimbursements. The portion of these fees that are charged to our owned hotels, which totaled $53.7 million and $51.1 million for the years ended December 31, 2013 and 2012, respectively, are eliminated in our consolidated financial statements. |
| (3) | Includes management, royalty, intellectual property royalty fees and other cost reimbursements totaling $76.8 million and $72.6 million for the years ended December 31, 2013 and 2012, respectively, which are eliminated in our combined financial statements. |
Owned hotels
Owned Hotels segment revenues increased primarily due to an improvement in RevPAR of 6.4 percent at our comparable owned hotels. Refer to “Revenues—Owned hotels” within this section for further discussion on the increase in revenues from our comparable owned hotels. Our Owned Hotels segment’s Adjusted EBITDA increased as a result of an increase in Owned Hotels segment revenues of approximately $44.4 million, partially offset by an increase in operating expenses of $18.4 million at our owned hotels. Refer to “Operating expenses—Owned hotels” within this section for further discussion on the increase in operating expenses at our owned hotels.
Franchise and management
Franchise and Management segment revenues increased primarily as a result of increases in RevPAR of 6.8 percent at our comparable franchised and owned hotels and the net addition of hotels added to our franchise system. Refer to “Revenues—Franchise and other fee-based revenues” within this section for further discussion on the increase in revenues from our comparable franchised hotels. Our Franchise and Management segment’s Adjusted EBITDA increased as a result of the increase in Franchise and Management segment revenues.
Year ended December 31, 2012 compared with year ended December 31, 2011
For 2012, the growth in hotel room demand continued from 2011 and 2010, as we experienced system-wide improvement at our comparable hotels in occupancy, ADR and RevPAR, compared to the year ended December 31, 2011. Despite challenges in specific markets, we were able to increase ADR in markets where demand outpaced supply, successfully manage the usage of our best available rates (BAR), which represents our lowest available unqualified rate, and shift business to higher rated channels, resulting in a 4.6 percent increase in system-wide ADR in the year ended December 31, 2012, compared to the year ended December 31, 2011. System-wide occupancy increased 191 basis points in the year ended December 31, 2012, compared to the year ended December 31, 2011. The combination of improved occupancy and ADR drove a system-wide RevPAR increase of 7.8 percent in the year ended December 31, 2012, compared to the year ended December 31, 2011.
97
Table of Contents
The following tables present our overall operating performance and system-wide and segment occupancy, ADR and RevPAR rates, in each case, for the years ended December 31, 2012 and 2011, including the amount and percentage change in these results between the periods:
| Year ended December 31, |
Increase/(Decrease) | |||||||||||||||
| (in thousands) | 2012 | 2011 | $ change | % change | ||||||||||||
|
|
||||||||||||||||
| Revenues |
||||||||||||||||
| Room revenues |
$ | 714,143 | $ | 660,816 | $ | 53,327 | 8.1% | |||||||||
| Franchise and other fee-based revenues |
69,206 | 59,314 | 9,892 | 16.7 | ||||||||||||
| Other hotel revenues |
17,506 | 16,229 | 1,277 | 7.9 | ||||||||||||
|
|
|
|||||||||||||||
| 800,855 | 736,359 | 64,496 | 8.8 | |||||||||||||
| Brand marketing fund revenues from franchised and managed properties |
17,157 | 15,182 | 1,975 | 13.0 | ||||||||||||
|
|
|
|||||||||||||||
| Total Revenues |
818,012 | 751,541 | 66,471 | 8.8 | ||||||||||||
| Operating Expenses |
||||||||||||||||
| Direct lodging expenses |
334,394 | 330,205 | 4,189 | 1.3 | ||||||||||||
| Depreciation and amortization |
155,879 | 149,356 | 6,523 | 4.4 | ||||||||||||
| General and administrative expenses |
74,111 | 61,578 | 12,533 | 20.4 | ||||||||||||
| Other lodging and operating expenses |
58,266 | 47,791 | 10,475 | 21.9 | ||||||||||||
| Marketing, promotional and other advertising expenses |
48,610 | 45,580 | 3,030 | 6.6 | ||||||||||||
|
|
|
|||||||||||||||
| 671,260 | 634,510 | 36,750 | 5.8 | |||||||||||||
| Brand marketing fund expenses from franchised and managed properties |
17,157 | 15,182 | 1,975 | 13.0 | ||||||||||||
|
|
|
|||||||||||||||
| Total Operating Expenses |
688,417 | 649,692 | 38,725 | 6.0 | ||||||||||||
| Operating Income |
129,595 | 101,849 | 27,746 | 27.2 | ||||||||||||
|
|
|
|||||||||||||||
| Other Income (Expenses) |
||||||||||||||||
| Interest expense, net |
(103,124 | ) | (51,611 | ) | (51,513 | ) | 99.8 | |||||||||
| Impairment loss |
— | — | ||||||||||||||
| Other income (loss) |
(7,440 | ) | (662 | ) | (6,778 | ) | NM | (1) | ||||||||
| Gain on extinguishment of debt, net |
1,192 | 11,451 | (10,259 | ) | (89.6 | ) | ||||||||||
|
|
|
|||||||||||||||
| Total Other Income (expenses) |
(109,372 | ) | (40,822 | ) | (68,550 | ) | NM | (1) | ||||||||
|
|
|
|||||||||||||||
| Income from Continuing Operations Before Income Taxes |
20,223 | 61,027 | (40,804 | ) | NM | (1) | ||||||||||
| Income tax expense |
(3,135 | ) | (2,332 | ) | (803 | ) | 34.4 | |||||||||
|
|
|
|||||||||||||||
| Income from Continuing Operations, Net of Tax |
17,088 | 58,695 | (41,607 | ) | NM | (1) | ||||||||||
| Gain (Loss) on Discontinued Operations, Net of Tax |
(52,852 | ) | 244 | (53,096 | ) | NM | (1) | |||||||||
|
|
|
|||||||||||||||
| Net Income (Loss) |
(35,764 | ) | 58,939 | (94,703 | ) | NM | (1) | |||||||||
| Net Loss Attributable to Noncontrolling Interests |
4,810 | 4,574 | 236 | 5.2 | ||||||||||||
|
|
|
|||||||||||||||
| Net Income (Loss) Attributable to the Company |
$ | (30,954 | ) | $ | 63,513 | $ | (94,467 | ) | NM | (1) | ||||||
|
|
||||||||||||||||
| (1) | Fluctuation in terms of percentage change is not meaningful. |
98
Table of Contents
| Comparable hotel statistics | Year ended December 31, 2012 |
Variance 2012 vs. 2011 |
||||||
|
|
||||||||
| Owned Hotels |
||||||||
| Occupancy |
63.0% | 159 bps | ||||||
| ADR |
$ | 71.67 | 5.0% | |||||
| RevPAR |
$ | 45.18 | 7.8% | |||||
| Franchised and Managed Hotels |
||||||||
| Occupancy |
64.1% | 232 bps | ||||||
| ADR |
$ | 80.72 | 4.0% | |||||
| RevPAR |
$ | 51.77 | 7.9% | |||||
| System-wide |
||||||||
| Occupancy |
63.5% | 191 bps | ||||||
| ADR |
$ | 75.66 | 4.6% | |||||
| RevPAR |
$ | 48.05 | 7.8% | |||||
|
|
||||||||
Revenues
Owned hotels
As of December 31, 2012, we had 339 owned hotels, comprising 43,197 rooms located in the United States. Room revenues at our owned hotels for the years ended December 31, 2012 and 2011 totaled $714.1 million and $660.8 million, respectively. The increase of $53.3 million, or 8.1 percent, was primarily driven by an increase in RevPAR at our comparable owned hotels of 7.8 percent, which was due to increases in ADR and occupancy of 5.0 percent and 159 basis points, respectively.
The increase in RevPAR was driven by a combination of factors, including the continuing economic recovery, an increased demand for hotel rooms due in part to the historically low level of new hotels being built in our competitive markets, enhanced pricing power in certain of our markets, the introduction of new distribution and selling channels, and continuous enhancements to our brand experience through capital expenditures and staff training.
Other hotel revenues at our owned hotels for the years ended December 31, 2012 and 2011 totaled $17.5 million and $16.2 million, respectively. The increase of $1.3 million, or 7.9 percent, was primarily a result of an increase in demand for ancillary hotel services, which was driven by increased occupancy.
Franchise and other fee-based revenues
As of December 31, 2012, we had 463 franchised hotels, comprising 37,484 rooms, located in the United States, Canada and Mexico. Franchise and other fee-based revenues for the years ended December 31, 2012 and 2011 totaled $69.2 million and $59.3 million, respectively. The increase of $9.9 million, or 16.7 percent, was primarily driven by an increase in RevPAR at our comparable franchised and managed hotels of 7.9 percent, which was due to increases in ADR and occupancy of 4.0 percent and 232 basis point, respectively. The increase in RevPAR was driven by a combination of factors, including the continuing economic recovery, an increased demand for hotel rooms due in part to the historically low level of new hotels being built in our franchised hotels’ competitive markets and enhanced pricing power in certain of our franchisees’ markets.
The addition of new hotels to our franchise system also contributed to the growth in revenue. From December 31, 2011 to December 31, 2012, we added 19 franchised hotels on a net basis, providing an additional 1,653 rooms to our system.
99
Table of Contents
Operating expenses
| Year ended December 31, |
Percent change |
|||||||||||
| (in millions) | 2012 | 2011 | 2012 vs. 2011 | |||||||||
|
|
||||||||||||
| Direct lodging expenses |
$ | 334.4 | $ | 330.2 | 1.3 | |||||||
| Other lodging and operating expenses |
$ | 58.3 | $ | 47.8 | 21.9 | |||||||
|
|
||||||||||||
Direct lodging expenses for our owned hotels totaled $334.4 million and $330.2 million, respectively, for the years ended December 31, 2012 and 2011. The increase of $4.2 million, or 1.3 percent, was primarily due to increased occupancy of 159 basis points, market driven increases in commodity pricing, local market advertising costs and travel agency commissions. These expense increases were partially offset by the effects of continued cost mitigation strategies and the impact of operational efficiencies employed at our owned hotels.
Other lodging and operating expenses for our owned hotels totaled $58.3 million and $47.8 million, respectively, for the years ended December 31, 2012 and 2011. The increase of $10.5 million, or 21.9 percent, was primarily the result of increased cost for property insurance and assessed property taxes, as well as an increase in net property casualty losses.
| Year ended December 31, |
Percent change |
|||||||||||
| (in millions) | 2012 | 2011 | 2012 vs. 2011 | |||||||||
|
|
||||||||||||
| Depreciation and amortization |
$ | 155.9 | $ | 149.4 | 4.4 | |||||||
|
|
||||||||||||
Depreciation and amortization expense for our owned hotels totaled $155.9 million and $149.4 million, respectively, for the years ended December 31, 2012 and 2011. The increase of $6.5 million, or 4.4 percent, was the result of $103 million in capital expenditures occurring in 2012, which drove additional depreciation on certain owned assets during the year.
| Year ended December 31, |
Percent change |
|||||||||||
| (in millions) | 2012 | 2011 | 2012 vs. 2011 | |||||||||
|
|
||||||||||||
| General and administrative expenses |
$ | 74.1 | $ | 61.6 | 20.4 | |||||||
|
|
||||||||||||
General and administrative expenses totaled $74.1 million and $61.6 million, respectively, for the years ended December 31, 2012 and 2011. The increase of $12.5 million, or 20.4 percent, was primarily driven by a one-time management bonus payment tied to the successful amendment and extension of our long-term debt obligations, shifting of certain support staff from direct hotel operations to general and administrative functions, as well as an increase in our operational staff to support the growth of the overall business.
| Year ended December 31, |
Percent change |
|||||||||||
| (in millions) | 2012 | 2011 | 2012 vs. 2011 | |||||||||
|
|
||||||||||||
| Marketing, promotional and other advertising expenses |
$ | 48.6 | $ | 45.6 | 6.6 | |||||||
|
|
||||||||||||
Marketing, promotional and other advertising expenses, not funded by the BMF collected from our franchised and managed hotels, totaled $48.6 million and $45.6 million, respectively, for the years ended December 31, 2012 and 2011. The increase of $3.0 million, or 6.6 percent, was primarily driven by increased spending to enhance brand awareness via broadcast, online and
100
Table of Contents
print media outlets, increased reimbursements to franchised and managed hotels for free night certificate redemptions and increased use of advertising agencies. In addition, we spent $17.2 million of the BMF from franchised and managed hotels on similar brand management and other advertising expenses.
| Year ended December 31, |
Percent change |
|||||||||||
| (in millions) | 2012 | 2011 | 2012 vs. 2011 | |||||||||
|
|
||||||||||||
| Interest expense, net |
$ | 103.1 | $ | 51.6 | 99.8 | |||||||
|
|
||||||||||||
Net interest expense totaled $103.1 million and $51.6 million, respectively, for the years ended December 31, 2012 and 2011. The increase of $51.5 million, or 99.8 percent, was primarily driven by the Amendment, which was finalized in May of 2012. The Amendment raised the weighted average effective interest rate on our Secured Debt from approximately 1.6 percent to 3.5 percent for the years ended December 31, 2011 and 2012, respectively.
| Year ended December 31, |
Percent change |
|||||||||||
| (in millions) | 2012 | 2011 | 2012 vs. 2011 | |||||||||
|
|
||||||||||||
| Gain on extinguishment of debt, net |
$ | 1.2 | $ | 11.5 | (89.6 | ) | ||||||
| Other income (loss) |
$ | (7.4 | ) | $ | (0.7 | ) | NM | (1) | ||||
|
|
||||||||||||
| (1) | Fluctuation in terms of percentage change is not meaningful. |
In connection with the Amendment, we (1) settled a portion of our Secured Debt for $69.8 million, which resulted in a $5.2 million gain, and modified the terms of an additional portion of our Secured Debt, which resulted in a $4.0 million loss, the net impact of which was a gain on early extinguishment of debt of approximately $1.2 million, and (2) incurred $7.7 million of closing costs which were expensed as incurred and included in other income (loss). In 2011, we settled a portion of our Secured Debt, resulting in a gain on early extinguishment of debt of approximately $11.5 million.
| Year ended December 31, |
Percent change |
|||||||||||
| (in millions) | 2012 | 2011 | 2012 vs. 2011 | |||||||||
|
|
||||||||||||
| Income tax expense |
$ | 3.1 | $ | 2.3 | 34.4 | |||||||
|
|
||||||||||||
We have historically operated within legal structures that are disregarded for federal and most state income tax purposes. Accordingly, in those jurisdictions that recognize disregarded status, items of income and expense have been allocated to the owners of our legal entities. See “—Critical accounting policies and estimates—Income taxes.”
Our income tax expense totaled $3.1 million and $2.3 million, respectively, for the years ended December 31, 2012 and 2011 and primarily consisted of the Texas margin tax, federal income taxes paid by certain taxable REIT subsidiaries and a provision for foreign income taxes. The increase of $0.8 million, or 34.4 percent, is primarily attributable to increased alternative minimum tax paid by a taxable REIT subsidiary, and an increased provision for foreign income taxes related to our growing operations outside the United States.
The effective income tax rate is determined by the level and composition of pre-tax income which is subject to federal, foreign, state, and local income taxes. Our effective tax rate was 16 percent and 4 percent for the years ended December 31, 2012 and 2011, respectively.
101
Table of Contents
Discontinued operations
| Year ended December 31, |
Percent change |
|||||||||||
| (in millions) | 2012 | 2011 | 2012 vs. 2011 | |||||||||
|
|
||||||||||||
| Gain (Loss) on discontinued operations |
$ | (52.9 | ) | $ | 0.2 | NM | (1) | |||||
|
|
||||||||||||
| (1) | Fluctuation in terms of percentage change is not meaningful. |
Gain (Loss) on discontinued operations totaled $(52.9) million and $0.2 million, respectively, for the years ended December 31, 2012 and 2011. During 2012, we began an exercise to identify hotel assets in our portfolio which, for a variety of reasons, we determined detracted from our brand. As a result of a tentative disposal list of hotels being identified, and the resulting decrease in the assumed holding period for these assets, an impairment charge of $51.5 million was recognized as part of our annual testing for impairment of long-lived assets. However, the assets did not meet all of the criteria for classification as assets held for sale as of December 31, 2012.
During the second quarter of 2013, the disposal list was finalized, causing 44 of our hotels, including all 11 of our Baymont-branded hotels, to meet all of the criteria to be classified as assets held for sale. As such, these hotels were classified as assets held for sale, and the results of their operations have accordingly been presented within discontinued operations for all periods presented herein. For the year ended December 31, 2011, no impairment was recorded. See Note 6: “Discontinued Operations” in the audited condensed combined financial statements of the Predecessor Entities included elsewhere in this prospectus.
Segment results
We evaluate our segments’ operating performance using segment Adjusted EBITDA, as described in Note 16: “Segments” in the audited condensed combined financial statements of the Predecessor Entities included elsewhere in this prospectus. Refer to those financial statements for a reconciliation of Adjusted EBITDA to net income. For a discussion of our definitions of EBITDA and Adjusted EBITDA, how management uses them to manage our business and material limitations on their usefulness, refer to “—Key indicators of financial condition and operating performance.” The following table sets forth revenues and Adjusted EBITDA by segment, reconciled to consolidated amounts, for the years ended December 31, 2012 and 2011:
| Year ended December 31, |
Percent change |
|||||||||||
| (in thousands) | 2012 | 2011 | 2012 vs. 2011 | |||||||||
|
|
||||||||||||
| Revenues |
||||||||||||
| Owned Hotels |
$ | 734,547 | $ | 679,843 | 8.0 | |||||||
| Franchise and Management |
50,086 | 44,064 | 13.7 | |||||||||
| Segment revenues |
784,633 | 723,907 | 8.4 | |||||||||
| Other revenues from franchised and managed properties |
17,157 | 15,182 | 13.0 | |||||||||
| Corporate and other revenues(1)(2) |
88,870 | 76,178 | 16.7 | |||||||||
| Intersegment elimination(3) |
(72,648 | ) | (63,726 | ) | 14.0 | |||||||
| Total revenues |
818,012 | 751,541 | 8.8 | |||||||||
| Adjusted EBITDA |
||||||||||||
| Owned Hotels |
285,974 | 250,701 | 14.1 | |||||||||
| Franchise and Management |
50,086 | 44,064 | 13.7 | |||||||||
| Segment Adjusted EBITDA |
336,060 | 294,765 | 14.0 | |||||||||
| Corporate and other |
(38,237 | ) | (36,376 | ) | 5.1 | |||||||
| Adjusted EBITDA |
297,823 | 258,389 | 15.3 | |||||||||
|
|
||||||||||||
102
Table of Contents
| (1) | Corporate and other includes revenues generated by and related to and operating expenses incurred in connection with the overall support and brand management of our owned, managed, and franchised hotels and operations. |
| (2) | Includes revenues related to cost reimbursements and brand management fees. The portion of these fees that are charged to our owned, which totaled $51.1 million and $44.1 million for the years ended December 31, 2012 and 2011, respectively, hotels are eliminated in our consolidated financial statements. |
| (3) | Includes management, royalty, intellectual property royalty fees and other cost reimbursements totaling $72.6 million and $63.7 million for the years ended December 31, 2012 and 2011, respectively, which are eliminated in our combined financial statements. |
Owned hotels
Owned Hotels segment revenues increased primarily due to an improvement in RevPAR of 7.8 percent at our comparable owned hotels. Refer to “Revenues—Owned hotels” within this section for further discussion on the increase in revenues from our comparable owned hotels. Our Owned Hotels segment’s Adjusted EBITDA increased as a result of an increase in Owned Hotels segment revenues of approximately $54.7 million, partially offset by an increase in operating expenses of approximately $19.4 million at our owned hotels. Refer to “Operating expenses—Owned hotels” within this section for further discussion on the increase in operating expenses at our owned hotels.
Franchise and management
Franchise and Management segment revenues increased primarily as a result of increases in RevPAR of 7.9 percent at our comparable franchised and owned hotels and the net addition of hotels added to our franchise system. Refer to “Revenues—Franchise and other fee-based revenues” within this section for further discussion on the increase in revenues from our comparable franchised hotels. Our Franchise and Management segment’s Adjusted EBITDA increased as a result of the increase in Franchise and Management segment revenues.
Liquidity and capital resources
Overview
As of September 30, 2014, we had total cash and cash equivalents of $108.5 million. Our known liquidity requirements primarily consist of funds necessary to pay for operating expenses and other expenditures, including corporate expenses, taxes, payroll and related benefits, legal costs, operating costs associated with the operation of hotels, interest and scheduled principal payments on our outstanding indebtedness, potential payments related to our interest rate swap, capital expenditures for renovations and maintenance at our owned hotels, and other purchase commitments.
Concurrently with the consummation of the IPO, we entered into a new credit agreement to refinance all of our then existing secured debt, which was to mature in July 2014. The new credit agreement provides for senior secured credit facilities consisting of a $2.1 billion senior secured term loan facility, which will mature in 2021, and a $250.0 million senior secured revolving credit facility, $50.0 million of which is available in the form of letters of credit, which will mature in 2019. See “—Debt” for a further discussion our new credit agreement. In addition, following consummation of the IPO, for federal income tax purposes, our partnership and REIT status terminated and we became subject to additional entity-level taxes at the federal and state level and we recorded in our second quarter an adjustment for the estimated net deferred tax liability of $321.1 million. Accordingly, as this net deferred tax liability is reduced, we expect that in the future, our cash taxes, after utilization of net operating losses (“NOLs”) currently expected to be utilized in 2014 and 2015, will exceed the income tax provision in our financial statements. We currently estimate that this excess could be approximately $27 million per year beginning in 2016, which amount may vary based on taxable income among other factors.
103
Table of Contents
In addition, if we undergo an ownership change (including as a result of a sale or sales of our stock by Blackstone) in the future, our ability to fully utilize our NOLs could be subject to annual limitations on utilization by Section 382 of the Internal Revenue Code. See note 11 to our unaudited condensed consolidated financial statements included elsewhere in this prospectus for more information.
We finance our business activities primarily with existing cash and cash generated from our operations. We believe that this cash will be adequate to meet anticipated requirements for operating expenses and other expenditures, including corporate expenses, payroll and related benefits, legal costs, and purchase commitments for the foreseeable future. The objectives of our cash management policy are to maintain the availability of liquidity and minimize operational costs. We currently expect, in 2015, to use a significant portion of our available cash flow from operations to make prepayments on our outstanding indebtedness.
The following tables summarize our net cash flows and key metrics related to our liquidity:
| As of and for the nine months ended September 30, |
Percent Change | |||||||||||
| (in millions) | 2014 | 2013 | 2014 vs. 2013 | |||||||||
|
|
||||||||||||
| Net cash provided by operating activities |
$ | 227.7 | $ | 193.0 | 18.0 | |||||||
| Net cash used in investing activities |
(32.4 | ) | (38.9 | ) | (16.5 | ) | ||||||
| Net cash used in financing activities |
(120.2 | ) | (146.0 | ) | (17.7 | ) | ||||||
|
|
||||||||||||
| As of and for the year ended December 31, |
Percent change | |||||||||||||||||||
| (in millions) | 2013 | 2012 | 2011 | 2013 vs. 2012 | 2012 vs. 2011 | |||||||||||||||
|
|
||||||||||||||||||||
| Net cash provided by operating activities |
$ | 232.9 | $ | 248.1 | $ | 220.4 | (6.2 | ) | 12.6 | |||||||||||
| Net cash provided by (used in) investing activities |
1.7 | (151.0 | ) | (92.4 | ) | (101.1 | ) | 63.3 | ||||||||||||
| Net cash used in financing activities |
(242.0 | ) | (147.3 | ) | (78.3 | ) | 64.3 | 88.2 | ||||||||||||
| Working capital surplus(1) |
68.9 | 63.9 | 65.6 | 7.8 | (2.7 | ) | ||||||||||||||
|
|
||||||||||||||||||||
| (1) | Total current assets less total current liabilities, excluding the current portion of long-term debt. |
Our ratio of current assets to current liabilities, excluding the current portion of long-term debt, was 1.09, 1.53, 1.47 and 1.52 as of September 30, 2014, December 31, 2013, 2012 and 2011, respectively.
Operating activities
Cash flow from operating activities is primarily generated from operating income from our owned hotels and our franchising business.
Net cash provided by operating activities was $227.7 million for the nine months ended September 30, 2014, compared to $193.0 million for the nine months ended September 30, 2013. The $34.7 million increase was primarily driven by increased operating income prior to the reduction for equity based compensation of $39.6 million. The change period over period also includes the effects of timing in our various working capital components including accounts receivable and accrued expenses and other liabilities.
104
Table of Contents
Net cash provided by operating activities was $232.9 million for the year ended December 31, 2013, compared to $248.1 million for the year ended December 31, 2012. The $15.2 million decrease was primarily due to a net decrease in cash due to changes in various working capital components of approximately $18.6 million and an increase in cash paid for interest of approximately $25.0 million driven by the increase in effective interest rate as a result of the amendment and extension of our long-term debt, partially offset by an increase in operating income of approximately $26.6 million.
The net $27.7 million increase in cash provided by operating activities during the year ended December 31, 2012, compared to the year ended December 31, 2011, was primarily due to an increase in operating income of $27.7 million, a net increase in cash due to changes in various working capital components of approximately $13.2 million, partially offset by an increase in losses from hotel property casualty occurrences of approximately $7.6 million and an increase in cash paid for interest of approximately $22.2 million.
Investing activities
Net cash used in investing activities during the nine months ended September 30, 2014 was $32.4 million, compared to $38.9 million during the nine months ended September 30, 2013. The $6.4 million decrease in cash used in investing activities was primarily attributable to a net decrease in restricted cash of approximately $126.2 million due to the refinancing of our debt and a decrease of $17.1 million in capital expenditures, partially offset by $77.7 million in cash acquisition costs for the 14 Previously Managed Hotels and a decrease in proceeds from the sale of assets of $58.2 million.
Net cash provided by investing activities during the year ended December 31, 2013 was $1.7 million, compared to $151.0 million in net cash used during the year ended December 31, 2012. The $152.7 million increase in cash used in investing activities was primarily attributable to the receipt of approximately $105.8 million in proceeds from the sale of the 11 Baymont Hotels and the 29 La Quinta-branded hotels during 2013, a decrease in amounts funded to restricted cash accounts created in connection with the Amendment in the amount of approximately $62.0 million, partially offset by a $12.6 million increase in capital expenditures.
The $58.6 million increase in net cash used in investing activities during the year ended December 31, 2012, compared to the year ended December 31, 2011, was primarily attributable to an increase in restricted cash of $53.1 million and an increase in capital expenditures of $7.3 million. The majority of the increase in capital expenditures related to improvements at existing owned hotels. The increase in restricted cash was a result of new requirements associated with the Amendment.
Financing activities
Net cash used in financing activities during the nine months ended September 30, 2014 was $120.2 million, compared to $146.0 million during the nine months ended September 30, 2013. The $25.9 million decrease in cash used in financing activities was primarily attributable to proceeds from our new senior debt facility of $2.1 billion, the net proceeds from issuance of common stock of $698.0 million, and capital contributions of $21.5 million, partially offset by repayment of long-term debt of $2.9 billion, payment of deferred costs of $27.3 million, payment of original issue discount of $10.5 million, repurchase of our stock of $0.9 million, and increased distributions to noncontrolling interest holders of $3.9 million.
Net cash used in financing activities during the year ended December 31, 2013 was $242.0 million, compared to $147.3 million during the year ended December 31, 2012. The $94.7
105
Table of Contents
million increase in cash used in financing activities was primarily attributable to a decrease of $156.7 million in net member contributions, partially offset by a net decrease of $53.0 million in repayment of long term debt and a decrease of $9.0 million in financing costs.
Net cash used in financing activities during the year ended December 31, 2012 increased $69.0 million compared to the year ended December 31, 2011, primarily due to activity related to the Amendment, which resulted in increased net principal payments totaling approximately $130.4 million and increased payments for financing costs of approximately $10.1 million, partially offset by increased net contributions from our Pre-IPO Owners of approximately $71.5 million.
Capital expenditures
We divide our capital expenditures primarily between “repositioning” and “recurring” capital. Repositioning capital includes projects designed to increase our RevPAR Index through enhancements to our hotel rooms, hotel common areas and hotel exteriors and conversions of pre-existing non-La Quinta hotels to La Quinta brand standards. In addition, our historic repositioning capital also includes funds spent to develop our flagship hotel property in downtown Chicago and capital projects to upgrade our technology infrastructure. Repositioning capital includes acceleration of some aspects of normal cycle renovations. Recurring capital expenditures are comprised of repair and maintenance in ordinary course operations, cycle renovations and ongoing maintenance of our technology infrastructure in order to keep it current.
The cost of all improvements and renovations to our owned hotels are generally made with cash on hand and cash flows from operations.
During the nine months ended September 30, 2014 and 2013, we incurred capital expenditures of approximately $65.8 million and $83.0 million, respectively. The decrease in capital expenditures is primarily related to reduced spending of repositioning capital related to our Owned Hotels.
During the years ended December 31, 2013 and 2012, we incurred capital expenditures of approximately $115.5 million and $102.9 million, respectively. Of these amounts, approximately 14% and 24%, respectively, represented repositioning capital and 86% and 76%, respectively, represented recurring capital.
For 2014 and 2015, we currently consider a spending level of approximately 8-9% of each year’s total annual revenues for capital expenditures to be required in order to repair, maintain and complete necessary cycle renovations and fund other capital commitments. These levels do not reflect additional capital expenditures we may elect to make to, among other reasons, maintain or improve our competitive position or construct or acquire new hotels.
As of September 30, 2014, we had outstanding commitments under capital expenditure contracts of approximately $22.0 million for capital expenditures at certain owned hotels and for information technology enhancements. If cancellation of a contract occurred, our commitment would be any costs incurred up to the cancellation date, in addition to any costs associated with the discharge of the contract.
Debt
Concurrently with the consummation of the IPO, we refinanced all of our existing debt and accrued interest and related fees. As part of the refinancing, we entered into a credit agreement which provides for senior secured credit facilities consisting of:
| • | a $2.1 billion senior secured term loan facility, which will mature in 2021; and |
106
Table of Contents
| • | a $250.0 million senior secured revolving credit facility, which will mature in 2019. The revolving credit facility includes $50 million of borrowing capacity available for letters of credit and borrowing capacity for short-term borrowings referred to as the swing line borrowings. |
In addition, the senior secured credit facilities also provide us with the option to raise incremental credit facilities, refinance the loans with debt incurred outside the credit agreement and extend the maturity date of the revolving credit facility and term loans, subject to certain limitations.
We used the net proceeds of the senior secured term loan facility, together with the net proceeds from the IPO and available cash, to repay all of our previous indebtedness. In June 2014 and September 2014, we made voluntary prepayments of $80.0 million and $75 million, respectively, on the term loan facility.
The senior secured credit facilities are unconditionally and irrevocably guaranteed by Holdings, and any subsidiary of Holdings that directly or indirectly owns any issued and outstanding equity interests of Holdings’ wholly-owned subsidiary, La Quinta Intermediate Holdings L.L.C., which is the borrower under the senior secured credit facilities (the “Borrower”), and, subject to certain exceptions, each of the Borrower’s existing and future material domestic wholly owned subsidiaries (collectively, the “Guarantors”). In addition, the senior secured credit facilities are collateralized by first priority or equivalent security interests in (i) all the capital stock of, or other equity interests in, the Borrower and each of the Borrower’s and Guarantors’ material direct or indirect wholly owned restricted domestic subsidiaries and 65% of the voting stock (and 100% of the non-voting stock) of, or other equity interests in, each of the Borrower’s or any subsidiary Guarantor’s material direct wholly owned first-tier restricted foreign subsidiaries and (ii) certain tangible and intangible assets of the Borrower (other than real property except for certain real property described in the credit agreement) and those of the Guarantors (subject to certain exceptions and qualifications).
The senior secured credit facilities require us to prepay outstanding term loans, subject to certain exceptions, with (i) 50% of annual “excess cash flow” (with step-downs to 25% and 0%, as applicable, based upon the consolidated first lien net leverage ratio); (i) 100% of the net cash proceeds of all non-ordinary course asset sales or other dispositions, subject to reinvestment rights; and (iii) 100% of the net proceeds of any incurrence of debt by the Borrower or any of its restricted subsidiaries, other than debt permitted to be incurred or issued under the senior secured credit facilities.
The senior secured credit facilities contain a number of significant affirmative and negative covenants. Such covenants, among other things, restrict, subject to certain exceptions, the ability of (i) the Company to engage in any material operating or business activities other than the ownership of the equity interests of the Borrower and (ii) the Borrower and its restricted subsidiaries to:
| • | incur additional indebtedness and make guarantees; |
| • | create liens on assets; |
| • | enter into sale and leaseback transactions; |
| • | engage in mergers or consolidations; |
| • | sell certain assets; |
| • | make fundamental changes; |
| • | pay dividends and distributions or repurchase capital stock; |
107
Table of Contents
| • | make investments, loans and advances; |
| • | engage in certain transactions with affiliates; |
| • | make changes in the nature of their business; and |
| • | make prepayments of junior debt. |
In addition, if, on the last day of any period of four consecutive quarters on or after June 30, 2014, the aggregate principal amount of revolving credit loans, swing line loans and/or letters of credit (excluding up to $20 million of letters of credit and certain other letters of credit that have been cash collateralized or back-stopped) that are issued and/or outstanding is greater than 25% of the revolving credit facility, the credit agreement requires the Borrower to maintain a maximum consolidated first lien net leverage ratio.
Borrowings under the term loans bear interest, at the Borrower’s option, at a rate equal to a margin over either (a) a base rate determined by reference to the highest of (1) the administrative agent’s prime lending rate, (2) the federal funds effective rate plus 1/2 of 1.00% and (3) the LIBOR rate for a one-month interest period plus 1.00% or (b) a LIBOR rate determined by reference to the Reuters LIBOR rate for the interest period relevant to such borrowing. The margin for the term loans is 2.00%, in the case of base rate loans, and 3.00% in the case of LIBOR rate loans, subject to one step-down of 0.25% upon the achievement of a consolidated first lien net leverage ratio (as defined in the credit agreement) of less than or equal to 4.50 to 1.00, subject to a base rate floor of 2.00%, and a LIBOR floor of 1.00%.
Borrowings under the revolving credit facility bear interest, at the Borrower’s option, at a rate equal to a margin over either (a) a base rate determined by reference to the highest of (1) the administrative agent’s prime lending rate, (2) the federal funds effective rate plus 1/2 of 1.00% and (3) the LIBOR rate for a one-month interest period plus 1.00% or (b) a LIBOR rate determined by reference to the Reuters LIBOR rate for the interest period relevant to such borrowing. The margin for the revolving credit facility is 1.50%, in the case of base rate loans, and 2.50%, in the case of LIBOR rate loans, subject to three step-downs of 0.25% each upon the achievement of a consolidated first lien net leverage ratio of less than or equal to 5.00 to 1.00, 4.50 to 1.00 and 4.00 to 1.00, respectively.
On April 14, 2014, we entered into an interest rate swap agreement with an aggregate notional amount of $850.0 million that expires on April 14, 2019. This agreement swaps the LIBOR rate in effect under the new credit agreement for this portion of the loan to a fixed-rate of 2.0311%, which includes the 1% LIBOR floor. We have elected to designate this interest rate swap as a cash flow hedge for accounting purposes.
In addition, the Borrower is required to pay a commitment fee to the lenders under the revolving credit facility in respect of the unutilized commitments thereunder. The commitment fee rate is 0.50% per annum subject to a step-down to 0.375%, upon achievement of a consolidated first lien net leverage ratio of less than or equal to 5.00 to 1.00. The Borrower is also required to pay customary letter of credit fees.
If we are unable to generate sufficient cash flow from operations in the future to service our debt, we may be required to reduce capital expenditures or refinance all or a portion of our existing debt. Our ability to make scheduled principal payments and to pay interest on our debt depends on the future performance of our operations, which is subject to general conditions in or affecting the hotel industry that are beyond our control. See “Risk factors—Risks related to our business and industry” and “Risk factors—Risks relating to our indebtedness” in this prospectus.
108
Table of Contents
With the completion of the refinancing and our entry into the interest rate swap agreement described above, our net interest expense has decreased and we anticipate that it will continue to decrease.
Contractual obligations
The following table summarizes our significant contractual obligations as of September 30, 2014:
| (in millions) | Total | Less than 1 year |
1-3 years | 3-5 years | More than 5 years |
|||||||||||||||
|
|
||||||||||||||||||||
| Long-term debt obligations(1) |
$ | 2,486 | $ | 106 | $ | 209 | $ | 200 | $ | 1,971 | ||||||||||
| Capital lease obligations |
||||||||||||||||||||
| Operating and ground leases |
$ | 121 | $ | 4 | $ | 9 | $ | 8 | $ | 100 | ||||||||||
| Contract acquisition costs |
— | — | — | — | — | |||||||||||||||
| Purchase commitments |
22 | 22 | — | — | — | |||||||||||||||
| Total contractual obligations |
$ | 2,629 | $ | 132 | $ | 218 | $ | 208 | $ | 2,071 | ||||||||||
|
|
||||||||||||||||||||
| (1) | Includes principal as well as interest payments. For our variable-rate debt we have assumed a LIBOR floor of 1.0 percent plus a spread of 3.0 percent. For our interest rate swap, we have used the fixed-rate of 2.0311 percent, which includes a 1 percent LIBOR floor. |
In addition to the purchase commitments in the table above, in the normal course of business, we enter into purchase commitments for which we are reimbursed by our franchisees. These obligations have minimal or no impact on our net income and cash flow.
Off-balance sheet arrangements
We do not have off balance sheet arrangements that have or are reasonably likely to have a current or future effect on our financial condition, revenues or expenses, results of operations, liquidity, capital expenditures or capital resources. Under certain franchise agreements, we have committed to provide certain incentive payments, reimbursements, rebates and other payments, to help defray the costs of construction, marketing and other costs associated with opening and operating a La Quinta hotel.
Critical accounting policies and estimates
The preparation of our financial statements in accordance with GAAP requires us to make estimates and assumptions that affect the reported amounts of assets and liabilities as of the date of the financial statements, the reported amounts of revenues and expenses during the reporting periods and the related disclosures in the consolidated financial statements and accompanying footnotes. We believe that of our significant accounting policies, which are described in Note 2: “Basis of Presentation and Significant Accounting Policies” in the audited financial statements of the Predecessor Entities included elsewhere in this prospectus, the following accounting policies are critical because they involve a higher degree of judgment, and the estimates required to be made were based on assumptions that are inherently uncertain. As a result, these accounting policies could materially affect our financial position, results of operations and related disclosures. On an ongoing basis, we evaluate these estimates and judgments based on historical experiences and various other factors that are believed to reflect the current circumstances. While we believe our estimates, assumptions and judgments are reasonable, they are based on information presently available. Actual results may differ
109
Table of Contents
significantly from these estimates due to changes in judgments, assumptions and conditions as a result of unforeseen events or otherwise, which could have a material impact on financial position or results of operations.
Investments in long-lived assets
We annually review the performance of our long-lived assets, such as property and equipment and intangible assets, for impairment, as well as when events or changes in circumstances indicate that the carrying amount of an asset may not be recoverable. We also identify properties we intend to sell and properties we intend to hold for use. For each lodging asset or group of assets held for use, we compare the sum of the expected future cash flows (undiscounted and without interest charges) generated by the asset or group of assets with its associated net carrying value. If the net carrying value of the asset or group of assets exceeds expected future cash flows, the excess of the net book value over estimated fair value is charged to impairment loss in the accompanying combined statements of operations. Properties held for sale are reported at the lower of their carrying amount of their estimated sales price, less estimated costs to sell.
We estimate fair value primarily using unobservable inputs by (1) calculating the discounted expected future cash flows and (2) calculating expected liquidated sales proceeds, relying on common hotel valuation methods such as multiples of room revenues or per room valuations. Our estimate of fair value of the asset using these unobservable inputs then becomes the new basis of the asset or group of assets and this new basis is then depreciated over the asset’s remaining useful life. We may be subject to impairment charges in the future, in the event that operating results of individual hotel operations are materially different from its forecasts, the economy or the lodging industry weakens or the estimated holding period of a hotel is shortened.
Guest loyalty program
Our guest loyalty program, “Returns,” allows members to earn points primarily based on certain dollars spent at our owned and franchised hotels or via our co-branded credit card. Members may redeem points earned for free night certificates, gift cards, airline miles and a variety of other awards. We account for the economic impact of points earned by accruing an estimate of its liability for unredeemed points. The expense related to this estimate includes the cost of administering the program, as well as the incremental cost of the stay at one of its hotels or the value of awards purchased from program partners. We estimate the future redemption obligation based upon historical experience, including an estimate of “breakage” for points that will never be redeemed. The estimate is based on a calculation that includes an assumption for the redemption rate, redemption type (whether for a free night certificate or other award), and rate of redemption at our owned hotels versus franchised hotels. Actual results of the Returns program, and the related expense and liability, may vary significantly from our estimates due primarily to variances from assumptions used in the calculation of its obligation for future redemptions and changes in member behavior. These variances are accounted for as changes in estimates and are charged to operations as they become known.
We had approximately $14.5 million of guest loyalty liability as of September 30, 2014. Changes in the estimates used in developing our breakage rate could result in a material change to our loyalty liability. Currently, a 10% decrease to the breakage estimate used in determining future award redemption obligations would increase our loyalty liability by approximately $3.1 million.
110
Table of Contents
Insurance programs
Workers’ compensation, automobile and general liability
We maintain a retrospective loss deductible insurance program for workers’ compensation and automobile liability loss exposures, and a self-insured retention program for our commercial general liability loss exposures related to our lodging operations. A transfer of risk to an insurance underwriter is purchased for loss exposures in excess of the deductible and retention limits on both a primary and excess limits basis.
Case loss reserves are established for losses within the insurance and self-insured programs. These individual case reserves are estimates of amounts necessary to settle the claims as of the reporting date. These individual case estimates are based on known facts and interpretations of circumstances and legal standards and include the claims representatives’ expertise and experience with similar cases. These individual estimates change over time as additional facts and information become known.
On at least an annual basis, we perform a formal review of estimates of the ultimate liability for losses and associated expenses for each coverage component of the casualty insurance program within the deductible and self-insured retention. We engage outside actuaries who perform an analysis of historical development trends of loss frequency and severity in order to project the ultimate liability for losses, including incurred but not reported claims. The outside actuaries utilize various actuarial methods such as the loss triangle technique to derive loss development factors from the actual loss experience, which translate current case reserve value to an ultimate basis by measuring the historical change in valuations over time, which is characteristic of liability losses. Other methods such as “increased limits factors” are utilized for projecting losses and are calculated based on historical experience and represent an average over several years and used to estimate the ultimate loss. We revise our reserve amounts periodically based upon recognized changes in the development factors and trends that affect loss costs and their impact on the actuarial calculation. These estimates are influenced by external factors, including inflation, changes in law, court decisions and changes to regulatory requirements, economic conditions and public attitudes.
Employee healthcare
We maintain a self-insurance program for major medical and hospitalization coverage for our employees and their dependents, which is partially funded by payroll deductions. Payments for major medical and hospitalization to individual participants below specified amounts are self-insured by us. We base our estimate of ultimate liability on trends in claim payment history, historical trends in incurred but not reported incidents and developments in other cost components (such as rising medical costs, projected premium costs and the number of participants). Our liability with respect to employee healthcare reserves is monitored on a periodic basis and adjusted accordingly.
Income taxes
We have various taxable subsidiaries and account for the taxable subsidiaries’ income taxes using the asset and liability approach for financial accounting and reporting purposes. For financial reporting purposes, income tax expense or benefit is based on reported financial accounting income or loss before non-controlling interests and income taxes related to our taxable subsidiaries. Deferred tax assets and liabilities reflect the temporary differences between assets and liabilities recognized for financial reporting and the analogous amounts recognized for tax
111
Table of Contents
purposes using the statutory tax rates expected to be in effect for the year in which the differences are expected to reverse, within the taxable subsidiaries. We evaluate the probability of realizing the future benefits of their deferred tax assets and provide a valuation allowance for the portion of any deferred tax assets where the likelihood of realizing an income tax benefit in the future does not meet the more-likely-than-not criteria for recognition.
We recognize the financial statement benefit of a tax position only after determining that the relevant tax authority would more likely than not sustain the position following an audit. For tax positions meeting the more-likely-than-not threshold, the amount recognized in the financial statements is the largest benefit that has a greater than 50 percent likelihood of being realized upon ultimate settlement with the relevant tax authority.
See Note 12: “Income Taxes” in the audited condensed combined financial statements of the Predecessor Entities included elsewhere in this prospectus.
Legal contingencies
We are subject to various legal proceedings and claims, the outcomes of which are subject to significant uncertainty. We accrue an estimated amount for a loss contingency if it is probable and the amount of the loss can be reasonably estimated. Significant judgment is required when we evaluate, among other factors, the degree of probability of an unfavorable outcome and the ability to make a reasonable estimate of the amount of loss. Changes in these factors could materially impact our consolidated financial statements.
Quantitative and qualitative disclosures about market risk
We are exposed to market risk primarily from changes in interest rates, which may impact future income, cash flows, and fair value of the Company, depending on changes to interest rates. In certain situations, we may seek to reduce cash flow volatility associated with changes in interest rates by entering into financial arrangements intended to provide a hedge against a portion of the risks associated with such volatility. We continue to have exposure to such risks to the extent they are not hedged. We enter into derivative financial arrangements to the extent they meet the objective described above, or are required by the terms of our debt facilities, and we do not use derivatives for trading or speculative purposes.
Interest rate risk
We are exposed to interest rate risk under our new credit agreement, as the interest is floating rate based on LIBOR. On April 14, 2014, we entered into an interest rate swap agreement with an aggregate notional amount of $850.0 million that expires on April 14, 2019. This agreement swaps the LIBOR rate in effect under the new credit agreement for this portion of the loan to a fixed-rate of 2.0311%, which includes the 1% LIBOR floor. We have elected to designate these interest rate swaps as cash flow hedges for accounting purposes. The 30-day LIBOR rate decreased from 0.17 percent per annum at December 31, 2013 to 0.15 percent at September 30, 2014. Changes in interest rates also affect the fair value of our debt.
112
Table of Contents
The following table sets forth the scheduled maturities and the total fair value as of September 30, 2014 for our financial instruments that were materially affected by interest rate risks (in millions, excluding average interest rate):
| Maturities by period | Carrying value |
Fair value |
||||||||||||||||||||||||||||||
| 2014 | 2015 | 2016 | 2017 | 2018 | Thereafter | |||||||||||||||||||||||||||
|
|
||||||||||||||||||||||||||||||||
| Term Facility |
$ | 4.9 | $ | 19.5 | $ | 19.5 | $ | 19.5 | $ | 19.5 | $ | 1,846.7 | $ | 1,929.6 | $ | 1,899.6 | ||||||||||||||||
| Weighted average interest rate(1) |
4.451% | |||||||||||||||||||||||||||||||
|
|
||||||||||||||||||||||||||||||||
| (1) | Weighted average interest rate as of September 30, 2014, which includes the effect of the interest rate swap. |
Refer to our Note 6: “Fair Value Measurements” in the unaudited condensed consolidated financial statements of the La Quinta Holdings Inc. as of and for the nine months ended September 30, 2014 and 2013 included elsewhere in this prospectus for further discussion of the fair value measurements of our financial assets and liabilities.
Newly Issued Accounting Standards
In April 2014, the Financial Accounting Standards Board (“FASB”) issued Accounting Standards Update (“ASU”) No. 2014-08. This ASU raises the threshold for a disposal to qualify as a discontinued operation and requires new disclosures of both discontinued operations and certain other disposals that do not meet the definition of a discontinued operation. It is effective for annual periods beginning on or after December 15, 2014. Early adoption is permitted but only for disposals that have not been reported in financial statements previously issued. We are currently in the process of evaluating the impact of the adoption on our consolidated financial statements.
In May 2014, FASB issued ASU No. 2014-09. The new guidance on revenue from contracts with customers will supersede most current revenue recognition guidance, including industry-specific guidance. The underlying principle is that an entity will recognize revenue to depict the transfer of goods or services to customers at an amount that the entity expects to be entitled to in exchange for those goods or services. The guidance provides a five-step analysis of transactions to determine when and how revenue is recognized. Other major provisions include capitalization of certain contract costs, consideration of time value of money in the transaction price, and allowing estimates of variable consideration to be recognized before contingencies are resolved in certain circumstances. The guidance also requires enhanced disclosures regarding the nature, amount, timing and uncertainty of revenue and cash flows arising from an entity’s contracts with customers. The guidance is effective for the interim and annual periods beginning on or after December 15, 2016; early adoption is not permitted. The guidance permits the use of either a retrospective or cumulative effect transition method. We have not yet selected a transition method and are currently evaluating the impact of the amended guidance on our consolidated financial position, results of operations and related disclosures.
In June 2014, FASB issued ASU No. 2014-12. The new guidance requires that a performance target that affects vesting, and that could be achieved after the requisite service period, be treated as a performance condition. As such, the performance target should not be reflected in estimating the grant date fair value of the award. This update further clarifies that compensation cost should be recognized in the period in which it becomes probable that the performance target will be achieved and should represent the compensation cost attributable to the period(s) for
113
Table of Contents
which the requisite service has already been rendered. The guidance is effective for the interim and annual periods beginning on or after December 15, 2015; early adoption is permitted. We do not anticipate that the adoption of this standard will have a material impact on our financial position, results of operations and related disclosures.
In August 2014, FASB issued ASU No. 2014-15. The new guidance establishes management’s responsibility to evaluate whether there is substantial doubt about an entity’s ability to continue as a going concern or to provide related footnote disclosures. The amendments require management to assess an entity’s ability to continue as a going concern by incorporating and expanding upon certain principles in U.S. auditing standards. Specifically, ASU 2014-15 provides a definition of the term substantial doubt and requires an assessment for a period of one year after the date that the financial statements are issued or available to be issued. It also requires certain disclosures when substantial doubt is alleviated as a result of consideration of management’s plans and requires an express statement and other disclosures when substantial doubt is not alleviated. The guidance is effective for the interim and annual periods beginning on or after December 15, 2016; early adoption is permitted. We do not anticipate that the adoption of this standard will have a material impact on our financial position, results of operations and related disclosures.
Newly Adopted Accounting Standards
In July 2013, FASB issued ASU No. 2013-11. This ASU provides guidance on the financial statement presentation of an unrecognized tax benefit when a net operating loss carryforward, a similar tax loss, or a tax credit carryforward exists in the applicable jurisdiction to settle any additional income taxes that would result from disallowance of the tax position. We adopted ASU 2013-11 prospectively as of January 1, 2014. The adoption of this ASU did not have a material impact on our financial condition, results of operations, cash flows, or disclosures.
114
Table of Contents
SELECTED QUARTERLY FINANCIAL DATA (unaudited, amounts in thousands except per share data)
The following table sets forth selected quarterly financial data for each of the quarters from first quarter 2012 through third quarter 2014. The selected quarterly financial data is derived from our unaudited consolidated and combined financial statements, which were prepared on the same basis as our audited combined financial statements, and includes, in our opinion, all adjustments necessary to present fairly the information presented for the interim periods. However, the results for past periods are not necessarily indicative of results that may be expected for future periods.
| First Quarter | Second Quarter | Third Quarter | Fourth Quarter | |||||||||||||
|
|
||||||||||||||||
| 2014 |
||||||||||||||||
| Total revenues |
$ | 217,309 | $ | 260,289 | $ | 271,118 | ||||||||||
| Operating income |
$ | 34,742 | $ | 25,452 | $ | 54,319 | ||||||||||
| Income (loss) before income taxes |
$ | (2,271 | ) | $ | (12,631 | ) | $ | 29,029 | ||||||||
| Net income (loss) |
$ | (3,522 | ) | $ | (338,635 | )(1)(2) | $ | 12,867 | ||||||||
| Earnings (loss) per common share—basic and diluted |
$ | (0.06 | ) | $ | (2.67 | ) | $ | 0.10 | ||||||||
| 2013 |
||||||||||||||||
| Total revenues |
$ | 202,272 | $ | 233,077 | $ | 238,035 | $ | 200,509 | ||||||||
| Operating income |
$ | 28,039 | $ | 48,555 | $ | 51,678 | $ | 27,909 | ||||||||
| Income (loss) before income taxes |
$ | (8,074 | ) | $ | 12,616 | $ | 14,041 | $ | (9,969 | ) | ||||||
| Net income (loss) |
$ | (9,054 | ) | $ | (4,168 | )(2) | $ | 22,976 | $ | (7,233 | ) | |||||
| Earnings (loss) per common share—basic and diluted |
$ | (0.08 | ) | $ | (0.03 | ) | $ | 0.19 | $ | (0.04 | ) | |||||
| 2012 |
||||||||||||||||
| Total revenues |
$ | 188,771 | $ | 218,174 | $ | 223,362 | 187,705 | |||||||||
| Operating income |
$ | 24,687 | $ | 46,856 | $ | 46,074 | 11,978 | |||||||||
| Income (loss) before income taxes |
$ | 12,983 | $ | 21,709 | $ | 9,851 | (24,320 | ) | ||||||||
| Net income (loss) |
$ | 11,889 | $ | 21,953 | $ | 8,172 | (77,778 | )(2) | ||||||||
| Earnings (loss) per common share—basic and diluted |
$ | 0.10 | $ | 0.16 | $ | 0.12 | $ | (0.63 | ) | |||||||
|
|
||||||||||||||||
| (1) | In connection with the IPO Transactions, we incurred, in the second quarter of 2014, a one-time net tax expense of $321.1 million, which reflects the impact of the La Quinta Predecessor Entities becoming owned by a “C” corporation and establishing the related net deferred tax liability on our books. Also in connection with the IPO Transactions, we recorded, in the second quarter of 2014, a one-time compensation expense of approximately $20.8 million related to the exchange of ownership units outstanding under our long-term cash incentive plan for vested shares of common stock of the Company. |
| (2) | In second quarter of 2014, we recorded an impairment loss of approximately $5.2 million associated with one of our owned hotels, classified as held for use. In the second quarter of 2013, we recorded an impairment loss of approximately $19.5 million related to classifying certain of our owned hotels as held for sale. In the fourth quarter of 2012, we determined that property and equipment related to certain of our owned hotels, which became assets held for sale during the second quarter of 2013, were partially impaired and, as a result, we recorded an impairment loss of approximately $51.5 million. |
115
Table of Contents
The lodging sector is a significant part of the U.S. economy, generating approximately $163.3 billion of revenues in 2013, according to data provided by STR. As of December 2013, the U.S. hotel sector comprised approximately 53,000 hotels with more than 4.9 million rooms, of which 69% were affiliated with a brand. Over the 25 years ended December 31, 2013, the sector revenue has grown at a CAGR of 4.7%. The industry can be segmented from a brand perspective across STR chain scale categories and from an operating structure across real estate ownership, franchise and third party management.
Chain scale segments
Hotels can be divided into STR chain scale categories or groupings of generally competitive brands as follows:
| • | Luxury—typically offers first class appointments and an extensive range of on-property amenities and services, including restaurants, spas, recreational facilities, business centers, concierges, room service and local transportation (shuttle service to airport and/or local attractions). According to STR, the average of the ADR for the luxury chain scale in 2013 was $290.31. |
| • | Upper upscale—typically offers well-appointed properties that offer a full range of on-property amenities and services, including restaurants, spas, recreational facilities, business centers, concierges, room service and local transportation (shuttle service to airport and/or local attractions). According to STR, the average of the ADR for the upper upscale chain scale in 2013 was $161.04. |
| • | Upscale—typically offers a full range of on-property amenities and services, including restaurants, spas, recreational facilities, business centers, concierges, room service and local transportation (shuttle service to airport and/or local attractions). According to STR, the average of the ADR for the upscale chain scale in 2013 was $121.72. |
| • | Upper midscale—typically offers limited food service (which may include restaurants), vending, selected business services, partial recreational facilities (either a pool or fitness equipment) and limited transportation (airport shuttle). According to STR, the average of the ADR for the upper midscale chain scale in 2013 was $100.29. |
| • | Midscale—typically offers limited breakfast, selected business services, limited recreational facilities (either a pool or fitness equipment) and limited transportation (airport shuttle). According to STR, the average of the ADR for the midscale chain scale in 2013 was $76.33. |
| • | Economy—typically offers basic amenities and may offer a limited breakfast. According to STR, the average of the ADR for the economy chain scale in 2013 was $54.27. |
116
Table of Contents
The following table shows the total room count per each STR chain scale category and the independent segment in the United States at December 31, 2013. The STR midscale and upper midscale segments are predominantly comprised of brands that are affiliated with broader multi-branded companies. La Quinta’s STR competitive sets most often include Comfort, Holiday Inn Express and/or Hampton.
| Chain scale | Brand examples | Room count |
% of total room count |
Avg. number of rooms per hotel |
||||||||||
|
|
||||||||||||||
| Luxury |
Four Seasons, Ritz Carlton, W Hotel | 107,263 | 2.2% | 340.5 | ||||||||||
| Upper Upscale |
Hilton, Hyatt, Marriott, Sheraton | 560,888 | 11.4% | 360.0 | ||||||||||
| Upscale |
Cambria Suites, Courtyard, Hilton Garden Inn | 612,565 | 12.4% | 153.2 | ||||||||||
| Upper Midscale |
Comfort, Hampton, Holiday Inn Express | 875,153 | 17.7% | 97.7 | ||||||||||
| Midscale |
Best Western, La Quinta, Ramada, Quality | 475,464 | 9.6% | 86.7 | ||||||||||
| Economy |
Days Inn, Econo Lodge, Red Roof Inn, Super 8 | 773,719 | 15.7% | 76.0 | ||||||||||
|
|
|
|||||||||||||
| Sub-Total Brand Affiliated |
3,405,052 | 68.9% | 111.7 | |||||||||||
|
|
|
|||||||||||||
| Independents |
1,534,156 | 31.1% | 68.1 | |||||||||||
|
|
|
|||||||||||||
| Total All Hotels |
4,939,208 | 100.0% | 93.2 | |||||||||||
|
|
||||||||||||||
Source: STR
Hotel operating structures
The U.S. lodging industry is generally segmented into three different operating structures: real estate ownership, franchise and third party management. Some companies employ only one component while other companies employ a combination of operating structures.
| • | Ownership—Hotels are owned by a company and are operated either by the company’s own management team or by an independent third party manager. Hotels may be branded under a franchise agreement, may be operated under a management agreement in which the manager brings its own brand to the hotel, or may be operated under the owner’s brand or as an independent hotel. Ownership requires a more substantial capital commitment as compared to other models but can offer high returns due to the owner’s ability to influence margins by driving RevPAR, managing operating expenses and financial leverage. The ownership model has a high fixed-cost structure that results in a high degree of operating leverage relative to RevPAR performance. As a result, profits escalate rapidly in a lodging up-cycle but can erode quickly in a downturn. Profits from an ownership model generally increase at a greater rate from RevPAR growth attributable to ADR growth, than from occupancy gains since there are more incremental costs associated with higher guest volumes compared to higher pricing. |
| • | Franchise—Franchisors license their brands to a hotel owner, providing the hotel owner the right to use the brand name, logo, operating practices and reservations systems in exchange for a fee and an agreement to operate the hotel in accordance with the franchisor’s brand standards. Under a typical franchise agreement, the hotel owner pays the franchisor an initial fee, a percentage-of-revenue royalty fee and a marketing/reservation fee. A franchisor’s revenues are dependent on the number of rooms in its system and the top-line performance of |
117
Table of Contents
| those hotels. Earnings drivers include RevPAR increases, unit growth and effective royalty rate improvement. Franchisors enjoy significant operating leverage in their business model since it typically costs little to add a new hotel franchise to an existing system. |
| • | Third party management—Third party management companies operate hotels on behalf of the hotel owner but do not, themselves, own the hotel. These companies collect base management fees which are typically a percentage of hotel revenue and incentive management fees which are tied to the financial performance of the hotel. The hotels may be operated under a franchise agreement and/or management agreement with a brand, or as an independent hotel. Similar to franchising activities, the key drivers of revenue based management fees are RevPAR and unit growth and similar to ownership activities, profit based fees are driven by improved hotel margins and RevPAR growth. |
U.S. lodging industry performance
Lodging industry performance is generally tied to both macro-economic and micro-economic trends in the United States and, similar to other industries, experiences both positive and negative operating cycles. Positive cycles are characterized as periods of increasing RevPAR and hotel development. These cycles usually continue until the economy sustains a prolonged downturn, excess supply conditions exist or some external factor occurs such as war, terrorism or natural resource shortages. Negative cycles are characterized by hoteliers reducing room rates to stimulate occupancy and a reduction of hotel development. Industry recovery usually begins with an increase in occupancy followed by hoteliers increasing room rates. As demand begins to exceed room supply, occupancies and rates continue to improve.
The following graph illustrates historical and projected U.S. supply, demand and RevPAR growth. The trends are derived from historical data provided by STR and projections provided by PKF-HR.
Historical and Projected U.S. Supply, Demand and RevPAR Growth
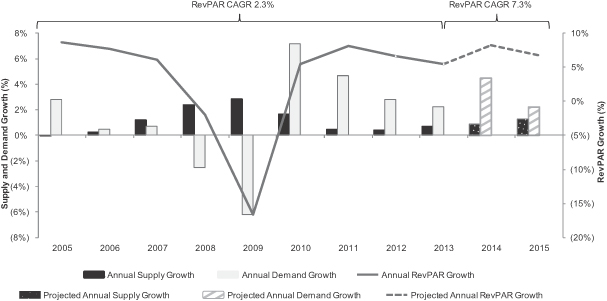
Source: STR (2005-2013), PKF-HR (2014-2015)
118
Table of Contents
Select-service segment performance
Select-service hotels generally serve the midscale and upper-midscale chain segments as defined by STR. Select-service hotels typically have fewer costly services and amenities than full-service hotels, which results in an efficient hotel-level cost structure. Select-service hotels typically have limited food and beverage outlets and do not offer comprehensive business or banquet facilities.
The midscale and upper-midscale segments tend to follow the cyclicality of the overall lodging industry and have also improved with the economic recovery in recent years. The following tables illustrate historical and projected midscale and upper-midscale U.S. supply, demand and RevPAR growth. The trends are derived from historical data provided by STR and projections provided by PKF-HR. Industry forecasts for RevPAR for both the midscale and upper-midscale segments remain positive for the next several years as the hotel industry is expected to continue to benefit from a supply and demand imbalance. We believe that the fundamentals of the U.S. lodging industry in the midscale and upper-midscale segments will yield strong industry segment performance and support the growth of our business.
Historical U.S. Midscale/Upper-Midscale Supply, Demand and RevPAR Growth
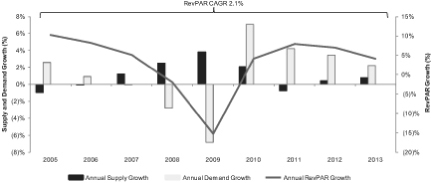
Projected U.S. Midscale/Upper-Midscale Supply, Demand and RevPAR Growth
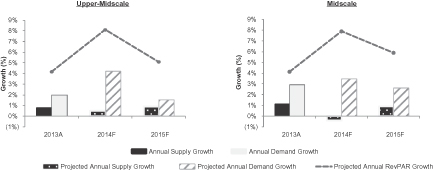
Source: STR (2013); PKF-HR (2014-2015)
119
Table of Contents
Company overview
We are a leading owner, operator and franchisor of select-service hotels primarily serving the midscale and upper-midscale segments under the La Quinta brand. Based on data provided by STR, La Quinta is the fastest growing principal select-service hotel brand in the United States primarily serving these segments in terms of percentage growth of number of hotels over the last ten years ended December 31, 2013, growing our total number of hotels from 362 in 2003 to 854 as of September 30, 2014, significantly outpacing the percentage growth of hotels franchised, owned and operated by Comfort, Holiday Inn Express and Hampton, the hotel brands one or more of which is most often included in the competitive sets we determine for STR, subject to STR’s guidelines, which we refer to as our “main STR competitive set.” Our system-wide portfolio, as of September 30, 2014, consisted of 854 hotels representing approximately 85,500 rooms located predominantly across 47 U.S. states, as well as in Canada and Mexico, of which 353 hotels were owned and operated and 501 were franchised. We also have a pipeline of 196 franchised hotels as of September 30, 2014, to be located in the United States, Mexico, Canada, Colombia, Honduras, Nicaragua and Guatemala (83% of which represents new construction as opposed to the conversion of an existing hotel).
The following table illustrates the growth in number of our owned and franchised hotels from 2003 to September 30, 2014.
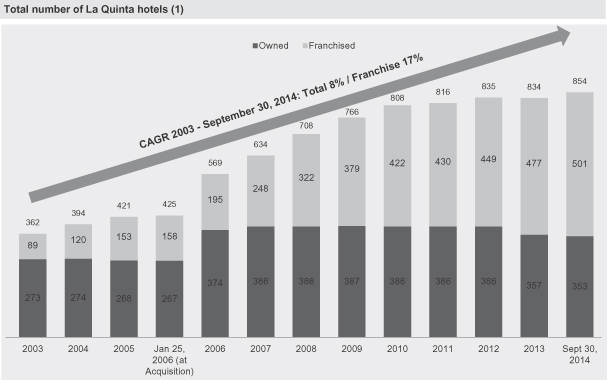
| (1) | Certain of our owned hotels were previously operated by us as non-La Quinta hotels and are not included in this table until such time as they were converted to La Quinta-branded hotels. From the Acquisition through September 30, 2014 and primarily in 2006, we converted 128 hotels. |
We primarily derive our revenues from owned hotel operations and fees generated from franchised and managed hotels. On a pro forma basis, for the year ended December 31, 2013, we
120
Table of Contents
generated total revenue of $909.1 million, Adjusted EBITDA of $340.2 million and net income from continuing operations of $39.7 million. On a pro forma basis, for the nine months ended September 30, 2014, we generated total revenue of $760.6 million, Adjusted EBITDA of $295.9 million and net income from continuing operations of $46.3 million. For a reconciliation of Adjusted EBITDA, see “Summary historical combined financial data.”
We are focused on providing clean and comfortable guest rooms at affordable prices in convenient locations. Our hotels have fewer costly services and amenities than full-service hotels, which we believe results in a highly efficient hotel-level cost structure. Our hotels typically include common areas with amenities such as a great room (including breakfast seating area, lobby with seating area and business center), swimming pool and vending areas and generally offer a complimentary breakfast. As of September 30, 2014, the hotels in our system consisted of 593 La Quinta Inn & Suites, which include guest suites and generally are our newer hotels with interior corridors, and 261 La Quinta Inns, 140 of which include interior corridors. Our guest mix includes both business and leisure travelers.
La Quinta was founded in San Antonio, Texas in 1968 and has a 46-year history of owning and operating hotels and, from 1973 to January 2006, we operated through our predecessors as a public company. In January 2006, we were acquired by Blackstone (the “Acquisition”) and assembled a management team led by lodging industry and La Quinta veteran Wayne Goldberg, our President and Chief Executive Officer. At the time of the Acquisition, we had a total of 425 hotels, 267 owned hotels and 158 franchised hotels. Since 2007, we have focused on growing our franchise business and investing in significant repositioning capital designed to increase our market penetration.
We began franchising the La Quinta brand in order to more rapidly expand our hotel system, promote brand awareness and drive growth without significant capital investment. Since the Acquisition and through September 30, 2014, we have aggressively grown our franchise business in the United States and expanded into international markets. During that period, we expanded our franchise system by approximately three times, growing from 158 franchised hotels to 501 franchised hotels. We also established a franchise presence in Mexico, Central America and South America, with 25 hotels either open or in the pipeline in those regions.
From 2007 through December 31, 2013, in addition to customary recurring capital expenditures such as repair and maintenance, cycle renovations and ongoing maintenance of our technology infrastructure, we invested approximately $310 million in our owned hotel portfolio and infrastructure, which we consider repositioning capital. We believe this investment has contributed to the overall improved perception of our brand and our ability to increase our ADR, occupancy and RevPAR Index for our owned hotels from 2007 through December 31, 2013. While we do not currently have any plans for major projects that would require additional repositioning capital expenditures, we will continue to evaluate projects and invest in those that we believe will provide an appropriate return on capital invested and increased RevPAR Index. We will also continue to make customary recurring capital expenditures.
Repositioning capital investments spent over this period have included $148 million for improvements across our owned hotel portfolio, including acceleration of some aspects of normal cycle renovations, and $45 million for upgrades to our technology infrastructure. Repositioning capital was used to update guest rooms at our owned hotels to generally include:
| • | a 32” flat panel high definition television |
| • | quilted, pillow-top mattress |
| • | large work desk with an ergonomic “task” chair |
121
Table of Contents
| • | high speed internet access |
| • | coffee maker |
| • | high-flow shower heads and curved shower rods |
| • | plug-and-play feature which allows guests to connect personal devices to our side television panels in order to watch their own content |
Additionally, repositioning capital included over $74 million expended to upgrade the 128 hotels we converted from non-La Quinta hotels to La Quinta-branded hotels since the Acquisition and $42 million to develop our flagship downtown Chicago property.
Recurring capital expenditures from 2007 through December 31, 2013 totaled approximately $449 million. Recurring capital expenditures are comprised of repair and maintenance in ordinary course operations, customary cycle renovations and ongoing maintenance of our technology infrastructure in order to keep it current. Customary cycle renovations, which can range from design renovations to full renovations, take place on an as needed basis and, as of December 31, 2013, the overall average time since last cycle renovation for the owned portfolio was seven years. Customary cycle renovations can include, among other things, replacement of mattresses, seating, fixtures or carpet, repainting, window treatments and improvements in the common areas. We maintain a variety of designs and décor scheme options for our rooms and select the room scheme for a given hotel’s cycle renovation based on market factors and our review of the optimal return for the capital invested.
Our competitive strengths
We believe that the following competitive strengths position us to execute on our business plan and growth strategies.
| • | Scalable and efficient business model with attractive cash flow characteristics. Our hotel product offering is efficient, replicable and supported by a scalable operational, technological and administrative platform. In 2013, over 98% of our owned hotel revenue was derived solely from room rentals, as compared to 63% for full-service hotels, according to STR, and our operating margins in 2013 were 47% as compared to operating margins in 2013 of 32% for full-service hotels (which reflects the most current available information). As a select-service hotel brand, our hotels require fewer costly services, amenities and capital expenditures than full-service hotels, resulting in what we believe to be a highly efficient hotel-level cost structure, strong Adjusted EBITDA margins and stable cash flows. Even during the height of the recent economic downturn in 2009, our Adjusted EBITDA margins remained above 32% as compared to approximately 20% for full-service hotels, based on data provided by STR. In addition, our model enables us to manage corporate overhead expenses even though the number of our hotels, particularly the number of our franchised hotels, has increased substantially. Moreover, our 2013 Adjusted EBITDA and Adjusted EBITDA margins for our owned portfolio remained below comparable 2008 metrics, which we believe represents significant capacity for future organic growth at our hotels. |
| • | Established and rapidly growing franchise business. Since 2003, we have grown our total number of franchised hotels from 89 in 2003 to 501 as of September 30, 2014, achieving a franchise compounded annual growth rate of 17%. Our franchise business requires little or no capital investment by us (which we refer to as “capital light”), and has substantial scale and an established infrastructure that we believe positions us to achieve meaningful franchise growth |
122
Table of Contents
| as development capital for franchisees continues to become more available. To achieve that growth, we continue to identify and sign franchise agreements with hotel developers who are new to the La Quinta brand, while building on the strength of our existing franchise owner base. During 2013 and through the third quarter of 2014, more than 45% of our franchise agreements were with entities or individuals who also had ownership interests in additional La Quinta franchises. The hotels in our franchised portfolio have an average age of 13 years, with 33% of our franchised portfolio being in our system less than 5 years. Despite the strong decade of growth, we are still less than half the size of our main STR competitive set, allowing room for continued aggressive franchise growth in a number of under-penetrated U.S. markets. As of September 30, 2014, we have a large pipeline of 196 franchised hotels (of which 83% are new construction), each represented by an executed franchise agreement, which upon completion would represent a 39% expansion of our total existing franchise system. Given our founding and significant presence in Texas, our presence in the U.S. southern border states and our established brand history with travelers from this region, we believe La Quinta has significant brand awareness in Mexico and believe Mexico, Central America and South America provide opportunities for significant franchise growth internationally where we have laid the foundation for expansion. In Central and South America, we will build on this awareness of the La Quinta brand by emphasizing the associated “LQ” registered marks to identify La Quinta hotels in certain markets. Additionally, as our franchise business continues to grow, we expect cash flow from this segment will comprise a higher percentage of our total cash flow. Given that the average remaining term of our existing franchise contracts is approximately 13 years, we believe that our existing franchisees provide a long-term stable income stream. Additionally, we anticipate our franchise revenues will grow over time as new franchise agreements and renewals of existing franchise agreements are executed at our newly published rates, which include a 4.5% royalty fee, which is higher than the 4.0% royalty fee generally applicable to our franchise agreements entered into prior to April 2013. |
| • | Widely recognized and differentiated brand. We own, operate and franchise all of our hotels under a single brand, La Quinta, a highly recognizable brand in the select-service market, established over a 46-year history. We also ranked #2 among the 15 and 18 hotel chains included, respectively, in the 2013 and 2014 Temkin Experience Ratings. Additionally, we have a loyal base of customers and a growing loyalty program, La Quinta Returns, with approximately ten million members as of September 30, 2014. We believe the capital investments we have made to upgrade and reposition our brand and hotel experience have helped to improve our brand awareness, brand perception, guest loyalty and guest experience. Our improved guest experience, brand perception and growing loyalty have contributed to consistent market share increases as reflected by our RevPAR Index growth. After experiencing a decrease in RevPAR Index of 340 basis points from 2006 to 2007, principally due to the conversion over that period of 128 non-La Quinta hotels to La Quinta-branded hotels, from the year ended December 31, 2007 through December 31, 2013, our RevPAR Index has increased 990 basis points from 88.6% to 98.5%, based on the STR competitive set of hotels existing as of December 31, 2013. We believe that the demonstrated strength of our brand and loyal customer base drive revenues for our existing owned and franchised hotels and also makes us attractive to new franchisees. |
| • | Owner and operator business model promotes alignment with our franchisees. Our position as an owner and operator of La Quinta-branded hotels creates an alignment of economic objectives with our franchisees, which we believe is a differentiating factor among our competitors. We are focused on delivering value to our guests, which generates repeat stays |
123
Table of Contents
| and increases guest loyalty. Delivering value combined with the benefits of an increasing market presence through our growth in the number of hotels has strengthened our brand. We believe this focus and the powerful alignment with our franchisees drive strong operating results and financial returns which benefit both us and our franchisees and will continue to benefit and grow our business, in the future. We have an active advisory Brand Council that includes both Company and franchisee representation and meets three to four times a year to discuss ways to strengthen our brand. Through the Brand Council, we often test new concepts at both owned and franchised hotels, which we believe promotes collaboration between us and our franchisees. We believe our model incentivizes franchisees to invest in growing the La Quinta brand through additional capital investment into existing franchised hotels and through the development of new La Quinta hotels. |
| • | Highly experienced and successful management team. Our management team has extensive experience in hospitality, consumer-facing and brand-based companies, with a proven track record for delivering strong results. Our executive management team has an average industry tenure of 19 years, including Wayne Goldberg with more than 35 years of select-service experience, Rajiv Trivedi, our Chief Development Officer, with 24 years of industry experience and Angelo Lombardi, our Chief Operating Officer, with 25 years of industry experience. In addition, Keith Cline, our Chief Financial Officer, who joined our executive management team in January 2013, brings over 22 years of finance, accounting and brand experience, including over 13 years of public company experience. Management has developed a culture of strong collaboration and teamwork that runs throughout the organization and has contributed to La Quinta’s successful performance. |
Our strategies
The following are key elements of our strategy to become the preferred select-service brand for our guests and franchise partners.
| • | Take advantage of our significant capital investment to optimize the performance of our owned hotels. We will continue to focus on maximizing revenues and managing costs at each of our owned hotels. As of September 30, 2014, we had 353 owned hotels, representing 41% of our system-wide units and 53% of our system-wide rooms. We intend to drive revenue growth by employing our active revenue management strategies and increasing our ADR, share of hotel stays by return guests, membership in our Returns program, overall brand awareness and volume of our corporate guests. There is currently a meaningful ADR differential between us and the hotels in our main STR competitive sets. We believe the significant amount of capital we have spent since 2007 to reposition and improve the brand and the quality of our hotels, the growth in the number of hotel units in our system and the resulting increased brand awareness will allow us to continue to increase ADR. We estimate that in 2013 each $1 increase in ADR across our owned portfolio would have increased our pro forma Adjusted EBITDA for our owned hotels by approximately $11 million, assuming all other variables remained constant. We also intend to continue to make recurring capital expenditures to invest in and renovate our owned hotels to maintain a consistent standard for our brand and improve the overall quality of our hotels. We further expect to continue to enhance the profitability of our owned hotels by maximizing cost efficiencies through disciplined cost control and focusing on operational enhancements. We continually evaluate our owned hotel portfolio and, from time to time, we may sell certain hotels that we determine detract from our brand. |
124
Table of Contents
| • | Continue to aggressively grow our capital light franchise business both domestically and internationally. A primary element of our growth strategy is to continue to grow the number of units in our higher margin, scalable franchise fee-based business. As of September 30, 2014, we had 501 franchised hotels, representing 59% of our system-wide units and 47% of our system-wide rooms. Additionally, we have a large pipeline of 196 franchised hotels, 83% of which represents new construction, rather than the conversion of an existing hotel. We believe that there remains meaningful opportunity for continued growth in the United States, with La Quinta under-penetrated in many of the markets served by our main STR competitive set, including the Northeast and Northwest. For example, as of September 30, 2014, we are represented in 64% of the 629 U.S. defined market tracts and have an average 2.08 hotels in such represented markets, whereas the hotel brands of our main STR competitive set are represented in over 93% of such market tracts and have an average 3.21 hotels in our represented markets. In addition, our pipeline includes hotels in 33 additional market tracts, which represents new distribution for our brand. We also intend to add new domestic franchised hotels in highly populated urban locations to serve a wider group of guests and increase brand awareness. We believe the opportunity for franchise growth in Mexico, Central America and South America under the “La Quinta,” “LQ,” “LQ Hotel” and other similar marks is significant given our existing infrastructure, established brand history with travelers from these regions and our presence in the U.S. southern border states and Mexico. We have dedicated franchise and sales personnel who are focused exclusively on our franchise operations in these regions. As of September 30, 2014, we had 25 hotels either open or in the pipeline and continue to explore other franchise opportunities in these international markets. |
| • | Continue to increase La Quinta brand awareness. We will continue to invest in marketing and brand building in order to increase awareness and differentiation of the La Quinta brand to improve hotel performance in our owned and franchised hotels and attract new La Quinta franchisees. We are able to concentrate our marketing and advertising efforts under a single brand rather than spreading them across multiple brands, which we believe enhances our ability to raise awareness of La Quinta hotels. Our owned and franchised hotels contribute 2.5% of gross room revenues to our BMF to support our marketing and build the brand and, from 2007 to the year ended December 31, 2013, total annual contributions to our BMF have grown 27% to $38.9 million, and, for the year ended December 31, 2013, 47% of contributions to the BMF, or $18.1million, were funded by our franchisees. We expect amounts available in the BMF and the percentage of such amounts contributed by our franchisees to continue to grow as the number of hotels in the La Quinta system grows and the performance of our hotels continues to improve. We will seek to continue to expand existing relationships and develop new relationships with franchise owners who demonstrate an ability to provide an excellent guest experience and maintain our brand standards, and who can broaden our reach into existing and under penetrated markets. We will continue to focus on growing our loyal customer base by increasing the membership in La Quinta Returns, our loyalty program designed to increase stays and raise market share. Our approximately ten million La Quinta Returns members as of September 30, 2014 (representing growth of 176% in membership since January 1, 2008) generated 47% of room revenues at our owned and franchised hotels for the year ended December 31, 2013 (representing a 108% increase in room revenue contribution at owned and franchised hotels since 2008). In 2011, we introduced our “Taking Care of Business” national advertising campaign, featuring points of differentiation and the role of people and service in delighting our guests with our “Here For You” branded guest experience. We will continue to test media, technology, social platforms and email campaigns to find new ways to strengthen our brand. |
125
Table of Contents
| • | Expand distribution channels and grow corporate accounts. In 2013 revenues from bookings made through our website increased by 8%, while total electronic distribution revenues increased 17%, each as compared to the year ended December 31, 2012. In addition, in 2012, we launched a new mobile site and introduced our new LQ Instant Hold feature (patent pending), which permits our guests to use a mobile application to hold a room for up to 4 hours from any smart device by just entering a phone number. We will continue to develop our online and mobile channels in an effort to use lower cost, proprietary distribution channels. We will also seek to grow our market share by establishing new online relationships as new technologies and platforms are introduced. La Quinta is also well recognized in the corporate community and, for the year ended December 31, 2013, corporate accounts, including government and military accounts, generated 25% of room revenue at our owned and franchised hotels. We will seek to increase room revenues from corporate accounts, as we believe such accounts are associated with more consistent demand and longer stays. |
Our mission
We are guided by two prime goals that we believe contribute to a high level of employee and guest engagement:
1. Live our core values, which are defined by our people:
| • | People: People are the heart of everything we do. Make coming to work the best part of their day. |
| • | Passion: Approach each work day with a sense of ownership and personal pride. Always do “whatever it takes.” |
| • | Integrity: Always do the right thing, even when no one is watching. |
| • | Excellence: Do ordinary things extraordinarily well. Good is not good enough; strive for the best in all you do. |
| • | Unique: La Quinta is big but acts small. We’re not afraid to be different. |
2. Delight our guests with an experience that makes them feel:
| • | Assured: Secure, confident they made the right choice with La Quinta. Provide cues of assurance with a well-lit parking lot, a beautifully landscaped entry or a person at the front desk at all times. |
| • | Settled in: Comfortable, relaxed in their surroundings. We create moments for settling in with a spotlessly clean, well-maintained room, fresh towels and a clutter-free desk. |
| • | Optimistic: Ready to take on the new day—whatever it holds. When our guests feel assured and settled in, they are able to feel “up,” optimistic—ready to take on their day. It’s our brand promise of waking up on the bright side. |
Our two goals can be summarized using a single phrase—“Here For You.” It is not a program or a slogan, but a way of life at La Quinta that is built upon the purpose and core values that guide us. Our values are delivered by people who have a unique passion to enhance our guests’ experience and create enduring relationships by striving for excellence and serving with integrity every day. “Here For You” creates meaningful and differentiated experiences that are uniquely La Quinta and provides us with a powerful business advantage. “Here For You” provides valuable
126
Table of Contents
insight into not only what motivates our team members and drives them to perform and innovate; it also helps to inform our strategies through a better understanding of guest preferences which drives business results.
Our brand and hotels
Our brand has gone through a significant transformation and repositioning since the Acquisition under the leadership of our management team led by industry veteran Wayne Goldberg. We have experienced significant growth in the total number of La Quinta hotels in the United States, driven primarily by the rapid expansion of our franchise business. As of September 30, 2014, our system-wide portfolio consisted of 854 hotels representing approximately 85,500 rooms located predominantly across 47 U.S. states, as well as in Canada and Mexico, of which 353 hotels were owned and operated and 501 were franchised. As of September 30, 2014, we also had a pipeline of 196 franchised hotels, each represented by an executed franchise agreement. Twenty of these properties are to be located in Mexico, Canada, Colombia, Honduras, Nicaragua and Guatemala. The remaining properties are to be located throughout the United States, with 61 in Texas, 12 in Oklahoma, 14 in New York and the remaining 89 properties dispersed among 31 other states. As of December 31, 2013, over 50% of our existing hotel portfolio and our pipeline is located in states ranked in the first quartile in terms of economic growth projections for 2014 through 2020 by IHS Global Insight.
We own our owned hotels through wholly owned subsidiaries except for one hotel, which is owned by a joint venture in which we own a controlling interest. Generally, our owned hotels include the land, related easements and rights, buildings, improvements, furniture, fixtures and equipment, though certain of our owned hotels are located on land leased by us pursuant to ground leases with third parties.
As of September 30, 2014, the hotels in our system consisted of 593 La Quinta Inn & Suites hotels, which include guest suites and are generally our newer hotels, and 261 La Quinta Inns. When STR’s price points by segment are applied to each of our hotels, approximately 31% would be considered upper-midscale, approximately 53% would be considered midscale, approximately 6% (principally our owned hotels) would be considered economy and the balance would be considered in the segments above upper-midscale. Our hotels typically include common areas with amenities such as a great room (including breakfast seating area, lobby with seating area and business center), swimming pool and vending areas, and typically offer a complimentary breakfast. As of September 30, 2014, the hotels in our owned portfolio have an average age of 27 years, and the hotels in our franchise portfolio have an average age of 13 years.
To ensure continued overall quality, we regularly repair and maintain our hotels, and annually review each hotel to assess the need for renovations based on asset condition. For our owned hotel portfolio, customary cycle renovations, which can range from design renovations to full renovations, take place on an as needed basis and, as of September 30, 2014, the overall average time since last cycle renovation was six years. For our franchised hotels and excluding those hotels currently under renovation, the overall average time since the last cycle renovation or the date on which such hotel entered our system was 3.9 years. In addition, we evaluate our hotels for updates needed to improve our competitive position.
Current designs for La Quinta Inn & Suites hotels are a minimum of three-story structures and approximately 50,600 square feet with approximately 100 interior corridor guest rooms. International La Quinta Inn & Suites hotels generally also include expanded breakfast offerings,
127
Table of Contents
full-service restaurants and may be up to ten stories and between 98 and 164 rooms and suites. Current designs for La Quinta Inn hotels are on average 51,000 square feet with 121 guest rooms. Virtually all new franchised hotels are La Quinta Inn & Suites. Certain of our owned hotels are larger than our typical design. For example, our hotel in downtown Chicago, which was converted from office space to a La Quinta-branded hotel in 2009, is approximately 141,000 square feet with 241 guest rooms.
At both our La Quinta Inn & Suites and La Quinta Inn hotels, our guests typically have convenient access to food service at nearby freestanding restaurants, which include many national chains. We have an ownership interest in approximately 70 buildings that are adjacent to our hotels, which we generally lease to third party restaurant operators.
The table below sets forth the number of hotels and rooms as of September 30, 2014(1):
| Owned | Franchised | Total | ||||||||||||||||||||||
| # of hotels | # of rooms | # of hotels | # of rooms | # of hotels | # of rooms | |||||||||||||||||||
|
|
||||||||||||||||||||||||
| Texas |
78 | 10,364 | 145 | 10,594 | 223 | 20,958 | ||||||||||||||||||
| Florida |
53 | 6,560 | 24 | 2,055 | 77 | 8,615 | ||||||||||||||||||
| California |
22 | 3,271 | 32 | 2,652 | 54 | 5,922 | ||||||||||||||||||
| Georgia |
14 | 1,696 | 22 | 1,574 | 36 | 3,270 | ||||||||||||||||||
| Louisiana |
13 | 1,796 | 16 | 997 | 29 | 2,793 | ||||||||||||||||||
| Colorado |
15 | 1,892 | 11 | 911 | 26 | 2,803 | ||||||||||||||||||
| Tennessee |
8 | 988 | 15 | 1,260 | 23 | 2,248 | ||||||||||||||||||
| Oklahoma |
3 | 404 | 21 | 1,594 | 24 | 1,998 | ||||||||||||||||||
| Alabama |
9 | 1,067 | 10 | 796 | 19 | 1,863 | ||||||||||||||||||
| New Mexico |
8 | 914 | 10 | 662 | 18 | 1,576 | ||||||||||||||||||
| Other states |
130 | 15,965 | 187 | 16,479 | 317 | 32,445 | ||||||||||||||||||
| United States Total |
353 | 44,917 | 493 | 39,574 | 846 | 84,491 | ||||||||||||||||||
| Canada |
2 | 133 | 2 | 133 | ||||||||||||||||||||
| Mexico |
6 | 800 | 6 | 800 | ||||||||||||||||||||
| Total |
353 | 44,917 | 501 | 40,507 | 854 | 85,424 | ||||||||||||||||||
|
|
||||||||||||||||||||||||
| (1) | This table treats the Previously Managed Portfolio as owned hotels. See “Basis of Presentation.” |
In addition, our franchise agreements allow us to require franchised hotels to replace furnishings every five to seven years and require upgrades to meet then-current brand standards at any time, but we may not require substantial upgrading or remodeling more often than once every five years. Since the Acquisition and through September 30, 2014, we have prioritized (1) expanding our franchise business both in the United States and internationally and (2) upgrading our owned portfolio, driven by significant capital investment.
We continually evaluate our owned hotel portfolio and, from time to time, we may sell certain hotels that we determine detract from our brand. For example, beginning in 2012, we conducted a review of our portfolio of hotels and subsequently decided to sell 33 of our La Quinta hotels. As of December 31, 2013, four La Quinta hotels were designated as assets held for sale and the results of their operations have been classified as discontinued operations. Sales of these four hotels closed in February 2014. These sold hotels have or are in the process of exiting the La Quinta system. In addition to these 33 La Quinta-branded hotels, 11 Baymont-branded hotels which we owned as a franchisee were sold on August 8, 2013. See “Basis of presentation.”
128
Table of Contents
The following table summarizes our key operating statistics for our owned, franchised and managed hotels for the past five years and for the nine months ended September 30, 2014 and 2013(1):
| As of and for
the nine months ended September 30, |
As of and for the year ended December 31, | |||||||||||||||||||||||||||
| 2014 | 2013 | 2013 | 2012 | 2011 | 2010 | 2009 | ||||||||||||||||||||||
|
|
||||||||||||||||||||||||||||
| Number of Hotels in Operation |
||||||||||||||||||||||||||||
| Company Owned Hotels |
||||||||||||||||||||||||||||
| La Quinta Inn & Suites (interior corridor) |
184 | 185 | 184 | 185 | 185 | 185 | 186 | |||||||||||||||||||||
| La Quinta Inn & Suites (exterior corridor) |
3 | 3 | 3 | 3 | 3 | 3 | 3 | |||||||||||||||||||||
| La Quinta Inns (interior corridor) |
56 | 57 | 56 | 56 | 56 | 56 | 56 | |||||||||||||||||||||
| La Quinta Inns (exterior corridor) |
110 | 125 | 114 | 142 | 142 | 142 | 142 | |||||||||||||||||||||
| Total Owned |
353 | 370 | 357 | 386 | 386 | 386 | 387 | |||||||||||||||||||||
| Franchised/Managed Hotels |
||||||||||||||||||||||||||||
| La Quinta Inn & Suites (interior corridor) |
403 | 363 | 373 | 349 | 325 | 309 | 267 | |||||||||||||||||||||
| La Quinta Inn & Suites (exterior corridor) |
3 | 5 | 5 | 3 | 3 | 3 | 2 | |||||||||||||||||||||
| La Quinta Inns (interior corridor) |
84 | 88 | 89 | 92 | 98 | 102 | 100 | |||||||||||||||||||||
| La Quinta Inns (exterior corridor) |
11 | 10 | 10 | 5 | 4 | 8 | 10 | |||||||||||||||||||||
| Total Franchised/Managed |
501 | 466 | 477 | 449 | 430 | 422 | 379 | |||||||||||||||||||||
| Total |
854 | 836 | 834 | 835 | 816 | 808 | 766 | |||||||||||||||||||||
| Occupancy Percentage |
||||||||||||||||||||||||||||
| Company Owned Hotels |
67.7% | 65.9% | 64.4% | 62.7% | 61.2% | 59.6% | 58.1% | |||||||||||||||||||||
| Franchised/Managed Hotels |
68.6% | 65.9% | 64.3% | 62.8% | 61.0% | 56.4% | 53.6% | |||||||||||||||||||||
| Total |
68.1% | 65.9% | 64.4% | 62.7% | 61.1% | 58.4% | 56.5% | |||||||||||||||||||||
| Average Daily Rate |
||||||||||||||||||||||||||||
| Company Owned Hotels |
$ | 79.73 | $ | 74.96 | $ | 75.09 | $ | 70.55 | $ | 67.22 | $ | 65.10 | $ | 66.02 | ||||||||||||||
| Franchised/Managed Hotels |
$ | 89.22 | $ | 85.69 | $ | 84.96 | $ | 81.80 | $ | 78.11 | $ | 76.39 | $ | 78.26 | ||||||||||||||
| Total |
$ | 83.92 | $ | 79.62 | $ | 79.46 | $ | 75.21 | $ | 71.59 | $ | 69.38 | $ | 70.20 | ||||||||||||||
| RevPAR |
||||||||||||||||||||||||||||
| Company Owned Hotels |
$ | 53.99 | $ | 49.40 | $ | 48.36 | $ | 44.21 | $ | 41.11 | $ | 38.82 | $ | 38.33 | ||||||||||||||
| Franchised/Managed Hotels |
$ | 61.25 | $ | 56.45 | $ | 54.61 | $ | 51.37 | $ | 47.64 | $ | 43.08 | $ | 41.97 | ||||||||||||||
| Total |
$ | 57.17 | $ | 52.46 | $ | 51.14 | $ | 47.17 | $ | 43.74 | $ | 40.49 | $ | 39.64 | ||||||||||||||
|
|
||||||||||||||||||||||||||||
| (1) | This table treats the Previously Managed Portfolio as “Company Owned Hotels.” See “Basis of presentation.” |
Our owned hotel operations
Centralized corporate services for our owned hotels include marketing, global and regional sales, revenue management, accounting, finance, treasury, tax, information systems, construction and design, purchasing, legal, risk management, human resources and training. Although our corporate headquarters is located in Irving, Texas, we have organized our owned hotel operations into 15 regions. Management for each region, which is located within each region and reports directly to our senior management, is responsible for the day-to-day operations, guest experience and profitability of their hotels.
129
Table of Contents
Each owned hotel is operated as an individual profit center, generally with an on-site general manager who oversees all day-to-day operations. Our general managers focus their attention on delivering our “Here For You” guest experience, maintaining clean and comfortable guest rooms and achieving profitable operations. Their responsibilities also include recruiting, training and supervising the hotel’s staff. A typical owned hotel has approximately 20 to 25 employees, including the general manager, housekeepers, laundry attendants, maintenance staff, front desk guest service representatives and a night auditor.
Our general managers receive a comprehensive five-week training program through LQUniversity, our nationally recognized training and development program. Our team of trainers has both training and operational experience. LQUniversity offers comprehensive training solutions to enable our owned hotels to operate more successfully and deliver on our “Here For You” guest experience. Many of these same programs are made available to franchisees. We also utilize assistant managers to support the general managers at certain hotels, which provide a pool of experienced candidates to fill open general manager positions as needed and as we grow our portfolio.
We use target-driven operational budgets, prepared by our general managers, that are deployed after review with our senior management. Under the direction of our revenue management team, the hotel general managers, field leadership team and senior management continually review our room rates and price rooms into the demand curve based on the prevailing market conditions at each owned hotel. Each general manager can earn financial incentives based upon achieving favorable results in comparison to revenue and profit targets and upon achieving targeted goals in their RevPAR Index and Net Promoter scores for their respective hotel. Our Net Promoter score, which measures a guest’s intent to recommend our brand, is calculated through guest satisfaction surveys that are conducted by an independent market research company. These surveys provide guest feedback on each of our hotels. Financial incentives reward our general managers for improvements in Net Promoter scores which are indicative of guest satisfaction levels. We believe this incentive program increases our general managers’ focus on operating efficient, well-maintained and profitable hotels and on delivering a “Here For You” guest experience.
Our franchising operations
From 2003 through September 30, 2014, our franchise system has grown at an 17% compounded annual growth rate.
Our franchising activities include franchising both newly constructed hotels and existing hotels converted to meet our brand standards. La Quinta Inn & Suites represents the next generation standard for La Quinta and has largely been the exclusive focus of franchise growth since 2007. As of September 30, 2014, there were 501 open and operating franchised La Quinta lodging facilities in the United States, Canada and Mexico and an active pipeline of 196 locations, 176 of which were domestic and 20 of which were international.
Franchising sales
As of September 30, 2014, we employed twelve franchise sales personnel who market our franchise programs to qualified applicants, two of whom focus exclusively on our international franchise operations. We believe that hotel owners and operators choose to become a franchisee of a lodging brand based primarily on the perceived value and quality of that brand and the franchisor’s services, and the extent to which affiliation with that franchisor may increase the
130
Table of Contents
franchisee’s profitability. Because a significant portion of the costs of owning and operating a hotel are generally fixed, increases in revenues generated by affiliation with a franchise lodging chain can improve a hotel’s financial performance. We offer our franchisees our strong brand awareness supported by well-developed infrastructure that includes reservation, national advertising, training and systems-related services.
Franchising agreements and fees
A prospective franchisee is required to pay us a nonrefundable application fee of $5,000 when an application is made for a La Quinta franchise. We evaluate franchise applicants on the basis of their hotel operating experience and ability, financial resources strength and credit history, among other factors. Upon execution of a franchise agreement, our current form of franchise agreement provides that approved franchise applicants will pay us an initial fee of $55,000, against which the application fee is credited, for up to 100 authorized guest rooms, plus $550 per guest room over 100. Historically, we have modified this initial fee to adapt to differing circumstances, such as the size and type of hotel facility, the location of the hotel site, and the experience and creditworthiness of the applicant. During our fiscal year ended December 31, 2013, the initial fees paid by franchisees ranged from $5,000 to $63,500. Additionally, a franchisee may expand the number of guest rooms in a hotel with our approval, which requires payment of the then-standard per room initial fee per guest room. A franchisee may also transfer ownership of a hotel with our approval, which may require payment of a transfer fee.
Approved franchise applicants are granted rights (subject to the terms of their franchise agreement) to operate their hotels under the La Quinta Inn & Suites name, to obtain reservations through our central reservation system and to use our hotel designs, operating systems and procedures, among other rights. Our franchise agreements generally restrict our ability to open a new owned or franchised hotel in a limited area near the franchised hotel, which can range from several city blocks in an urban area to several square miles in less populated areas.
Our franchise agreements for existing franchised hotels generally require a franchisee to pay a royalty fee of 4.0% of gross room revenues (as defined in the franchise agreement) during the first two years of operating under our brand and 4.5% of gross room revenues for all periods thereafter. Our current form of franchise agreement for newly franchised hotels requires a franchisee to pay a royalty fee of 4.5% of gross room revenues during the first two years of operating under our brand and 5.0% of gross room revenues for all periods thereafter. After the first two years, a franchisee can receive a rebate of 0.5% of gross room revenues if, in any calendar year, the franchised hotel achieves superior results in guest satisfaction as measured and defined by results of surveys conducted by an independent market research firm. However, our current form of franchise agreement for newly franchised international hotels does not include a royalty fee ramp up or rebates for guest satisfaction results. In addition to royalty fees, a franchisee generally pays, as a percentage of gross room revenues, a marketing fund contribution fee of 2.5% for brand advertising and other promotional efforts and a reservation fee of 2.0% to support the cost of reservation services provided to the hotels. Franchisees also pay us other fees, such as fees to participate in our online LQConnect intra-net, attend training programs and participate in our La Quinta Returns program. We also provide franchisees the option to purchase revenue management services for their hotel, at fees ranging from $800 to $5,000 per month depending on the size of the hotel and services provided.
Our franchise agreements generally have an initial term of 20 years. We, and the franchisee generally, have a right to terminate the agreement on the tenth and fifteenth anniversary of the
131
Table of Contents
opening date of the franchised hotel and, if the hotel was converted from a competing brand, additionally on the fifth such anniversary. The franchisee may also terminate the agreement if the hotel is not meeting predetermined occupancy levels, which may, under certain circumstances, require payment of specified termination fees to us. Additionally, we have the right to terminate a franchise agreement if a franchisee fails to meet our quality standards or fulfill other contractual obligations, which may, under certain circumstances, require payment by the franchisee of specified liquidated damages to us. Since the inception of our franchising program, we have retained approximately 90% of our franchise properties and the majority of the terminations were initiated by us. During the twelve months ended September 30, 2014, five franchise agreements for open locations were terminated, and all five of such terminations were initiated by us (in each case, excluding temporary franchise agreements provided to owners of disposition properties who were given the option to continue using the La Quinta brand for up to three to six months while they transitioned to a new brand).
Franchising operations support
As of September 30, 2014, the average size of our franchised hotels is approximately 81 rooms. Before a franchised hotel opens, we inspect the hotel to confirm that it meets our quality specifications. Once a franchised hotel opens, we strive to provide continued sales support and operational assistance. Each franchised hotel must adhere to the same rigorous brand standards of design, maintenance and guest service as an owned hotel and is inspected periodically by a franchise service director to assure that the franchised hotel adheres to our brand standards. Competition for franchise agreements, however, may require us to reduce the level of hotel improvements required for a particular hotel. As of September 30, 2014, we employed eleven franchise service directors to assist franchisees with pre-opening and ongoing brand standard issues.
Financial assistance and incentives to new franchisees
We do not presently have a company-funded financial assistance program for franchisees. However, on occasion we have provided, and at our discretion may occasionally provide in the future, franchisees with various forms of financial incentives or assistance upon varying terms, depending upon a number of factors. These factors include: the number of hotels involved and their locations, the number of rooms involved, relevant market conditions and other factors that may warrant providing financial incentives or assistance.
Our pipeline
As of September 30, 2014, we had a pipeline of 196 future franchised hotels, representing approximately 16,100 rooms. Each hotel in our pipeline is represented by an executed 20-year franchise agreement. Eighty-three percent of our pipeline represents new construction and the remaining 17% represents the conversion of an existing hotel into a La Quinta-branded hotel. As of September 30, 2014, approximately 32% of the new construction and conversion has commenced. Although, based on historical experience, converted hotels in our pipeline can generally become operational between 12 to 18 months from the date of execution of the franchise agreement, and newly constructed hotels in our pipeline can generally become operational between 36 to 48 months from the date of execution of the franchise agreement, openings may be delayed, or abandoned, due to economic conditions, weather, construction and permit delays and other factors. Moreover, the commitments of owners and developers with whom we have agreements are subject to numerous conditions, and the eventual development
132
Table of Contents
and construction of our pipeline not currently under construction is subject to numerous risks, including, in certain cases, the ability of the franchisee to obtain governmental and regulatory approvals and adequate financing.
Additionally, because revenues from franchised hotels are principally derived from franchise fees rather than room rentals, as we grow our system by increasing the number of franchised hotels, our revenues and expenses will increase at a significantly slower rate than if we were growing our system through an increase in number of owned hotels.
The size of our pipeline has remained relatively steady over the past several years. At December 31, 2010, our pipeline numbered 178 hotels and as of September 30, 2014, our pipelined numbered 196 hotels. The size of our pipeline is a function of both the number of new agreements signed and the pace of opening hotels in the pipeline and, accordingly, will fluctuate over time. Moreover, we periodically evaluate our pipeline to determine whether to terminate any contracts and/or seek new franchisees in any particular locations. We opened 15% of the hotels in our pipeline as of the end of 2011 in 2012 and 19% of the hotels in our pipeline as of the end of 2012 in 2013.
Our marketing operation
Brand marketing. We implement a brand marketing strategy by using consumer insight studies and guest feedback. Our strategy to reach and influence our marketplace is shaped by our goals to:
| • | drive brand awareness and perception that will generate first-time and repeat bookings and loyalty; |
| • | focus communications and media on the most relevant guest segment to increase revenue and penetration over our competitive market segment; |
| • | deliver on our distinctive positioning via break-through advertising; |
| • | create brand differentiation through cutting-edge guest insight and innovation; and |
| • | support and evolve our “Here For You” guest experience. |
The La Quinta brand is promoted through national, regional and local marketing. We advertise our brand on television through national cable and spot TV as well as national network radio, on the web through online advertising, search marketing and email campaigns and in print through newspapers and magazines. We also conduct direct marketing to potential and former guests, including La Quinta Returns members. Our marketing is primarily supported through fee contributions, calculated as a percentage of gross room revenues, from our owned and franchised hotels to our marketing programs, including La Quinta Returns and the BMF.
Our international marketing efforts are intended to reinforce general brand awareness while targeting local market needs. With five hotels opened in Mexico, a portion of the fees paid to the BMF by Mexico franchisees will be devoted to a Mexico marketing program.
We have also launched a system-wide military initiative that supports hiring of military veterans, community outreach, franchise growth, sourcing and Returns loyalty program tiers geared towards the military community.
La Quinta returns. As of September 30, 2014, we had approximately ten million members in our La Quinta Returns loyalty program, 2.5 million of which we consider active members (which
133
Table of Contents
generally refers to our loyalty program members who earn or redeem La Quinta Returns points within the previous 18 months). Our La Quinta Returns active members have delivered continued year-over-year increases in room revenues from 2008 to 2013, and generated 47% of room revenues at our owned and franchised hotels for the year ended December 31, 2013. We believe our loyalty program is favored by our members because of:
| • | rapid accumulation of rewards, including free nights at La Quinta locations, airline miles and credits and gift cards and certificates from national restaurant chains and retailers; |
| • | rapid achievement of Gold and Elite status, after as few as 10 nights in a calendar year; and |
| • | instant Gold status for military personnel and their families. |
Our Returns program helps expedite the reservation and check-in process and improves administrative efficiency of our reservation agents and front desk staff by providing a personal profile of each Returns member. This profile includes information such as email and mailing address and preferred method of payment that we use to market directly to Returns members.
Internet & mobile. We provide guests with the ability to shop and reserve rooms on the Internet through our brand website, www.LQ.com, and through mobile via the LQ Instant Hold platform. Our website provides guests with real-time information through hotel micro-sites that contain Trip Advisor scores, location, descriptions, amenities, special promotions, rates and availability for specific La Quinta hotels. Hotel photographs are prominently displayed on the hotel information pages along with dynamic maps and driving directions, information on nearby attractions and local weather information. Multiple search options are offered, including searches by city, attraction, zip code and trip routing from origin or destination. In addition to our proprietary brand website, we distribute our lodging product via third party travel websites.
The following graph reflects the percentage of our revenue that is attributable to each of our internal and external distribution channels in 2013.
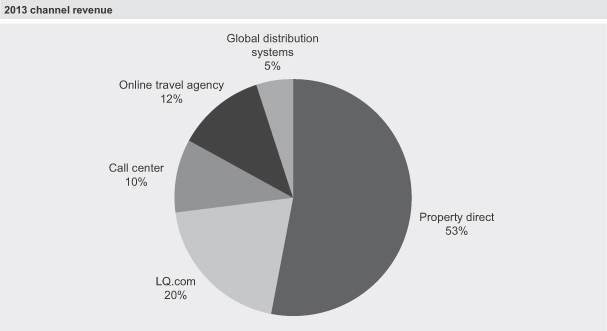
134
Table of Contents
Our global sales operation
Global & regional sales. As of September 30, 2014, we employed a direct sales force consisting of approximately 70 members. The direct sales force consists of approximately 34 global sales managers, funded by the BMF, who call on Fortune 500 companies and mid-tier businesses to increase our corporate travel base. These accounts typically have a significant number of travelers in the regions in which we operate and need a high volume of room-nights. Global sales managers also seek to increase room sales through inclusion in approved or preferred lodging lists of corporate travel managers and travel agencies operating on a national basis. We also form and continue to seek alliances with national travel and consumer organizations, such as AAA and AARP, and offer special rates or promotions to such organizations’ guests. In addition to the global effort, approximately 32 of our sales managers, funded by our owned hotels, are based in our regional markets. These regional sales managers call on local businesses, governmental agencies, hospitals and other organizations that can generate room-nights for our hotels.
Central reservations and global distribution systems. We promote and operate our own central reservation system, as well as toll-free numbers to accept reservations. Our reservation system provides reservation agents with information about hotel locations, available rooms and prices in order to assist guests in reserving rooms. Our reservations agents are trained in telephone sales techniques. Through our computer network, we continually update the number of rooms sold at each hotel to maximize the sale of available rooms through either the individual hotel or the reservation center. We market our reservation services to travel agents and corporate travel planners who may make reservations through global airline reservation distribution systems. We also have specialized reservation agents for large group sales, motor coach sales and special service bookings.
Our information systems
In today’s world, technology drives almost every business process. We have created an innovative technology deployment methodology that has enabled a collaborative environment where cross departmental business partners work very closely and effectively with technology teams and third parties to innovate, design and deploy technology-enabled improvements. More than 150 projects have been successfully completed using this methodology over the past 6 years.
We have been systematically moving away from in-house development of technology solutions and instead partnering with the best of breed software-as-a-service providers. We have also moved away from deployment of technology hosted at hotels and moved all key systems like hotel management systems, phone switches, back office, financials and HR functions to Cloud based environments, resulting in a significant reduction in IT operating and maintenance costs. In 2012, La Quinta won the Hospitality Technology Visionary Award “for leveraging technology beyond standard practices to improve overall hotel operations” and realized reductions in operating costs through our Cloud and Software as a Service (SaaS) technology deployment strategy. This also helps lower the start-up investment costs for franchise owners (for example, no capital investment for phone switches at each hotel is necessary).
Our trademarks
All of the intellectual property used for the La Quinta brand is owned by La Quinta Worldwide, LLC, a wholly owned subsidiary of the Issuer. “La Quinta,” “La Quinta Inn,” “La Quinta Inn & Suites,” “LQ Instant Hold,” “LQ” and “Returns” are our primary trademarks. Our material
135
Table of Contents
trademarks and many secondary marks are registered in various combinations of word and logo marks with the U.S. Patent and Trademark Office (“USPTO”) for hotel and motel services. In the United States, certain of our marks are subject to an agreement with the owner of a resort known as “La Quinta Resort & Club,” located in La Quinta, California. The agreement, among other things, geographically divides use of the trademark “La Quinta,” granting the resort owner the exclusive right to use the mark “La Quinta” in connection with facilities located within a 37 mile radius of the La Quinta Resort & Club, subject to certain exceptions, and the right to open three more facilities using certain of our marks, subject to certain exceptions, conditions and restrictions. As between the resort owner and us and our affiliates, we and our affiliates have the right to use the trademark in all other areas. The agreement is perpetual in duration.
Certain pending applications by us for registrations of variations of our primary marks, including certain logo forms, have been suspended by the USPTO pending resolution of litigation and related USPTO proceedings brought by us against the owners of a chain of hotels in Mexico called “Quinta Real.” After a trial on the merits in a federal court in Tucson in 2012, Quinta Real was generally prohibited from using the Quinta name to expand into the United States. The decision was appealed to the 9th Circuit U.S. Court of Appeals. In August 2014, the 9th Circuit U.S. Court of Appeals affirmed the finding of trademark infringement; however, the Court concluded that the district court did not provide a sufficient analysis balancing the equities in its decision to grant a permanent injunction and, therefore, remanded the case to district court for further analysis on that issue. We anticipate that, regardless of the ultimate outcome of that litigation or the related USPTO proceedings, the pending applications will ultimately proceed to registration.
We have also registered certain of our trademarks for hotel and motel services with the appropriate governmental agencies in certain foreign jurisdictions.
We consider all of these trademarks and the associated name recognition to be important to our business.
Our employees
As a service-oriented business, our employees are important to our success. Recruiting for general managers and corporate employees is coordinated through our corporate human resources department. All owned hotel employees, including hourly employees, receive training through LQUniversity when hired as well as ongoing training to improve their skills. Our online training system provides consistent and effective orientation, training and testing across our brand. Prior to assuming responsibility for a hotel, our general managers participate in a five-week training program that emphasizes operations, hospitality, rate management, legal and risk management issues, interviewing, employee relations, training and budgeting.
We provide all of our full-time employees and their families, including hourly hotel employees, the opportunity to participate in a benefits package, which includes health, dental and vision coverage. We believe these benefits provide a competitive advantage in recruiting hourly hotel employees, as compared to competing select-service hotels. Our salaried employees are also able to earn financial incentives based on achieving targeted goals, such as RevPAR Index, profitability, Net Promoter scores and personal development goals. In addition, recognition programs have been established to acknowledge our employees’ outstanding service and achievement. We believe our scale and size also provide career opportunities for our employees to advance within the organization.
136
Table of Contents
As of September 30, 2014, we employed 7,917 employees. Of these employees, 6,805 were full-time and 1,112 were part-time. Three hundred sixty four were employed as corporate associates and 7,553 were employed at our hotels. Our employees are not currently represented by labor unions and we have never experienced an organized work stoppage. We believe that ongoing labor relations with our employees are good.
Competition
As of September 30, 2014 the U.S. hotel sector comprised approximately 53,290 hotels with approximately 5.0 million rooms. Of these rooms, approximately 69% were affiliated with a brand. The hotel industry is highly fragmented, with no one entity controlling a majority of hotel rooms in the U.S.
La Quinta is a select-service hotel brand that competes primarily against other select-service hotels in both the upper-midscale and the midscale segments, and we consider our main STR competitive set to be Comfort, Holiday Inn Express and Hampton. However, our owned and franchised hotels generally operate in markets that contain numerous competitors, including a wide range of lodging facilities offering full-service, select-service and all-suite lodging options. Hotels in other market segments, such as full-service hotels, may lower their rates to a level comparable to those of select-service hotels such as ours that, in turn, may further increase competitive pressure in our markets. Our owned and franchised hotels generally compete for guests on the basis of room rates, quality of accommodations, name recognition, service levels, convenience of locations and reward program offerings. Additionally, an increasing supply of hotel rooms in La Quinta’s market segment, and consolidations in the lodging industry generally, have resulted in the creation of several large, multi-branded hotel chains with diversified operations and greater marketing and financial resources than we have, which has increased competition for guests in the markets in which our owned and franchised hotels operate.
We compete for franchise agreements based primarily on brand name recognition and reputation, the room rate that can be realized, royalty fees charged and other contract terms. Some of our competitors may have substantially greater marketing and financial resources, greater brand distribution and awareness and/or greater financial incentives than we do. Other competitive factors for franchise agreements include relationships with hotel owners and investors, including institutional owners of multiple hotels, availability and affordability of financing, marketing support, reservation and e-commerce system capacity and efficiency and the ability to make investments that may be necessary to obtain franchise agreements. The terms of our franchise agreements for each of our franchised hotels are also influenced by contract terms offered by our competitors, among other things. As a result, the terms of new franchise agreements may not be as favorable as our existing franchise agreements. For example, competition may require us to reduce or change fee structures, make greater use of key money or provide other financial incentives such as loans and guarantees to franchisees and/or reduce the level of hotel improvements required to conform to brand standards. In addition, if the availability of suitable locations for new hotels decreases, planning or other local regulations change or the availability or affordability of financing is limited, the supply of suitable hotels for franchising could be diminished. Additionally, an excess supply of hotel rooms or unfavorable borrowing conditions may discourage potential franchisees from expanding or constructing new hotels, thereby limiting a source of growth of the franchise fees received by us. Our franchise agreements generally restrict our ability to open a new owned or franchised hotel in a limited area near the franchised hotel, which can range from several city blocks in an urban area to
137
Table of Contents
several square miles in less populated areas. If the hotels that we franchise perform less successfully than those of our competitors, if we are unable to offer terms as favorable as those offered by our competitors, or if the availability of suitable hotels is limited, our ability to compete effectively for new franchise agreements could be reduced.
We believe we compete effectively, and our competitive position is protected due to our strong brand, owner, operator and franchisor business model and experienced management team.
Environmental matters
We are subject to certain requirements and potential liabilities under various foreign, federal, state and local environmental, health and safety laws and regulations, and incur costs in complying with such requirements. These laws and regulations govern actions including air emissions, the use, storage and disposal of hazardous and toxic substances, and wastewater disposal. In addition to investigation and remediation liabilities that could arise under such laws, we may also face personal injury, property damage or other claims by third parties concerning environmental compliance or contamination. We use and store hazardous and toxic substances, such as cleaning materials, pool chemicals, heating oil and fuel for back-up generators at some of our facilities, and we generate certain wastes in connection with our operations. Some of our hotels include older buildings, and some may have, or may historically have had, dry-cleaning facilities and underground storage tanks for heating oil and back-up generators. We have from time to time been responsible for investigating and remediating contamination at some of our facilities, such as contamination that has been discovered when we have removed underground storage tanks, and we could be held responsible for any contamination resulting from the disposal of wastes that we generate, including at locations where such wastes have been sent for disposal. Some laws may regard us as having liability as an operator by virtue of how we may implement our franchise agreements, rendering us potentially responsible for addressing environmental or other conditions existing at our franchised hotels. In some cases, we may be entitled to indemnification from the party that caused the contamination, or pursuant to our franchise agreements, but there can be no assurance that we would be able to recover all or any costs we incur in addressing such problems. From time to time, we may be required to manage, abate, remove or contain mold, lead, asbestos-containing materials, radon gas or other hazardous conditions found in or on our hotels. We have implemented an on-going operations and maintenance plan at each of our owned hotels that seeks to identify and remediate these conditions as appropriate. Although we have incurred, and expect that we will continue to incur, costs relating to the investigation, identification and remediation of hazardous materials known or discovered to exist at our hotels, those costs have not had, and are not expected to have, a material adverse effect on our financial condition, results of operations or cash flow.
Regulation
The hotel industry is subject to extensive federal, state and local governmental regulations in the United States and the other countries in which our owned and franchised hotels operate, including those relating to building and zoning requirements and those relating to the preparation and sale of food. Hotels and their owners and operators are also subject to licensing and regulation by state and local departments relating to health, sanitation, fire and safety standards, and to laws governing their relationships with employees, including minimum wage requirements, overtime, working conditions and citizenship requirements. In connection with the
138
Table of Contents
continued operation or remodeling of certain of our hotels, we or our franchisees may be required to expend funds to meet federal, state and local regulations. Any failure to obtain or maintain any such licenses or any publicity resulting from actual or alleged violations of any such laws and regulations could have an adverse effect on our results of operations. Our franchisees are responsible for compliance with all laws and government regulations applicable to the hotels they own and operate. We believe that our businesses are conducted in substantial compliance with applicable laws and regulations.
The Federal Trade Commission (the “FTC”), various states and certain other foreign jurisdictions (including Canada and Mexico) regulate the sale of franchises. The FTC and the foreign jurisdictions require franchisors to make extensive disclosure to prospective franchisees but do not require registration of the franchise offer. A number of U.S. states in which we offer franchises require both registration and disclosure in connection with franchise offers and sales. In addition, several states have “franchise relationship laws” that limit the ability of the franchisor to terminate franchise agreements or to withhold consent to the renewal or transfer of these agreements. While our franchising operations have not been materially adversely affected by such regulations, we cannot predict the effect of future regulation or legislation.
Legal proceedings
We are a party to a number of pending claims and lawsuits arising in the normal course of business, including proceedings involving tort and other general liability claims, workers’ compensation and other employee claims and intellectual property claims.
We maintain general and other liability insurance; however, certain costs of defending lawsuits, such as those below the insurance deductible amount, are not covered by or are only partially covered by insurance policies, and our insurance carriers could refuse to cover certain claims in whole or in part. We regularly evaluate our ultimate liability costs with respect to such claims and lawsuits. We accrue costs from litigation as they become probable and estimable.
We do not consider our ultimate liability with respect to any single claim or lawsuit, or the aggregate of such claims and lawsuits, to be material in relation to our combined financial condition, results of operations, or our cash flows taken as a whole.
139
Table of Contents
Executive officers and directors
The following table sets forth the names, ages and positions of our executive officers, directors and director nominees as of the date of this prospectus. Messrs. Gray and Stein have informed the Company that, upon consummation of this offering, they will resign from our board of directors. We expect that the board of directors will appoint Mr. Shah to serve as chairman of the board of directors effective upon Mr. Stein’s resignation. In addition, Messrs. Cutaia and Kim have consented to be named as director nominees in this prospectus, and we expect that the board of directors will elect Messrs. Cutaia and Kim to the board prior to the consummation of this offering.
| Name | Age | Position(s) | ||||
|
| ||||||
| Wayne B. Goldberg |
54 | Director, President and Chief Executive Officer | ||||
| Keith A. Cline |
44 | Executive Vice President and Chief Financial Officer | ||||
| Rajiv K. Trivedi |
51 | Executive Vice President and Chief Development Officer | ||||
| Angelo J. Lombardi |
43 | Executive Vice President and Chief Operating Officer | ||||
| Mark M. Chloupek |
43 | Executive Vice President, Secretary and General Counsel | ||||
| Julie M. Cary |
49 | Executive Vice President and Chief Marketing Officer | ||||
| James H. Forson |
47 | Senior Vice President, Chief Accounting Officer and Treasurer | ||||
| William J. Stein* |
52 | Chairman of the Board of Directors | ||||
| Glenn Alba |
42 | Director | ||||
| Alan J. Bowers |
59 | Director | ||||
| Henry G. Cisneros |
67 | Director | ||||
| Giovanni Cutaia |
41 | Director nominee | ||||
| Jonathan D. Gray* |
44 | Director | ||||
| Brian Kim |
35 | Director nominee | ||||
| Michael Nash |
53 | Director | ||||
| Mitesh B. Shah |
45 | Director | ||||
| Gary M. Sumers |
61 | Director | ||||
|
| ||||||
| * | Messrs. Stein and Gray will resign from our board of directors upon consummation of this offering. |
Wayne B. Goldberg
Wayne B. Goldberg has served on the boards of directors of certain of our Predecessor Entities since 2006 and on our board of directors since 2013. In addition, Mr. Goldberg has served as our President and Chief Executive Officer since 2006. Mr. Goldberg joined us in 2000 as Group Vice President of Operations and served the positions of Senior Vice President of Operations and Executive Vice President of Operations. Prior to joining La Quinta, Mr. Goldberg was Chief Operating Officer for BridgeStreet Accommodations, a worldwide corporate housing provider, from January 2000 to June 2000. Prior to BridgeStreet, Mr. Goldberg served in various roles at Red Roof Inns, Inc. from 1979 to 1999, including Group Vice President, District Vice President, Regional Manager, Area Manager and General Manager. Mr. Goldberg currently serves as a director for the Texas (FFA) Future Farmers of America Foundation. Mr. Goldberg graduated from the University of Louisville with a B.A. in communications/business organizations.
140
Table of Contents
Keith A. Cline
Keith A. Cline has served as our Executive Vice President and Chief Financial Officer since January 2013. From 2011 to 2013, prior to joining us, Mr. Cline was Chief Administrative Officer and Chief Financial Officer at Charming Charlie, Inc. and, from 2006 to 2011, Mr. Cline was Senior Vice President of Finance at Express, Inc. Mr. Cline began his career at Arthur Anderson & Company and held financial leadership roles at The J.M. Smucker Company, FedEx Custom Critical and Limited Brands. Mr. Cline is a summa cum laude graduate of the University of Akron with a B.S. in Accounting and a M.B.A. in Finance.
Rajiv K. Trivedi
Rajiv K. Trivedi joined La Quinta in 2000 and has served as Executive Vice President since 2006 and as Executive Vice President and Chief Development Officer since 2009. Prior to joining us, from 1992 to 2000, Mr. Trivedi served as Vice President of Franchise Operations at Cendant Corporation and in a variety of key management roles in the hotel industry, including Cendant Corporation. Mr. Trivedi is active in numerous civic and industry organizations including the Asian American Hotel Owners Association (AAHOA). Mr. Trivedi graduated from the Maharaja Sayajirao University of Baroda with an M.S. in Math and Business.
Angelo J. Lombardi
Angelo J. Lombardi joined La Quinta in 2001 as Vice President Revenue Management and has served as Executive Vice President and Chief Operating Officer since 2006. Prior to joining La Quinta, from 1989 to 2000, Mr. Lombardi held several positions at Red Roof Inns, Inc., including General Manager, Director of Revenue Management and Vice President Operations.
Mark M. Chloupek
Mark M. Chloupek joined La Quinta as Executive Vice President and General Counsel in 2006 and was named Secretary in 2013. Prior to joining us, from 1999 through 2006, Mr. Chloupek served as Vice President and Senior Vice President and Chief Counsel of Operations for Wyndham International, Inc. Prior to joining Wyndham, from 1996 to 1999, Mr. Chloupek worked for Locke Lord LLP (formerly Locke Purrell Rain Harrell—a professional corporation), a Dallas-based law firm. Additionally, Mr. Chloupek served on the Boards of Directors for the Juvenile Diabetes Research Foundation and The Texas General Counsel Forum. Mr. Chloupek received a B.A. in economics from the College of William and Mary, where he graduated Phi Beta Kappa and summa cum laude, and received a J.D. from the University of Virginia School of Law.
Julie M. Cary
Julie M. Cary joined La Quinta in 2006 as Executive Vice President and Chief Marketing Officer. Prior to joining La Quinta, from 2004 to 2006, Ms. Cary served as Vice President at Brinker International, as Vice President of Marketing at Dean Foods from 2003 to 2004, as Senior Manager of Marketing until promoted to Vice President of Marketing at Gerber Products Company from 1998 to 2003 and as Assistant Brand Manager until promoted to Brand Manager at Ralston Purina from 1991 to 1997. Ms. Cary holds an M.B.A. from Washington University and a bachelor’s degree in business administration from the University of Illinois.
141
Table of Contents
James H. Forson
James H. Forson has served as our Senior Vice President, Chief Accounting Officer and Treasurer since 2012. Prior to that role, Mr. Forson was Vice President and Controller from 2010, when he joined La Quinta, to 2012 and also served as Acting Chief Financial Officer from 2012 to 2013. Prior to joining La Quinta, Mr. Forson was Audit Senior Manager with Grant Thornton LLP from 2006 through 2010. Mr. Forson graduated from the University of Virginia’s McIntire School of Commerce with a B.S. degree in Commerce with distinction, and is a Certified Public Accountant in Texas.
Glenn Alba
Glenn Alba has served on the boards of directors of certain of our Predecessor Entities since 2006 and on our board of directors since 2013. Mr. Alba is a Managing Director in the Real Estate Group of Blackstone based in New York. Since joining Blackstone in 1997, Mr. Alba has been involved in the asset management of a broad range of Blackstone’s real estate investments in the US and Europe including office, hotel, multi-family and industrial assets. While based in the London office from 2001 to 2004, Mr. Alba managed a diverse set of assets in London, Paris and other cities in France as well as portfolio investments across Germany. More recently, Mr. Alba has been primarily involved in the hotel sector with management responsibility for various full-service and limited service hotels in the LXR Luxury Resorts portfolio and in us as well as global portfolio management duties. Mr. Alba received a B.S. in Accounting from Villanova University. Mr. Alba currently serves as a member of the Doubletree Hotels Owner Advisory Council and the Villanova University Real Estate Advisory Council.
Alan J. Bowers
Alan J. Bowers has served on the boards of directors of certain of our Predecessor Entities since 2013 and on our board of directors since February 2014. Mr. Bowers most recently served as President, Chief Executive Officer and a board member of Cape Success, LLC from 2001 to 2004 and of Marketsource Corporation from 2000 to 2001. From 1995 to 1999, Mr. Bowers served as President, Chief Executive Officer and a board member of MBL Life Assurance Corporation. Mr. Bowers held various positions, including Audit and Area Managing Partner, at Coopers & Lybrand, L.L.P. where he worked from 1978 to 1995 and also worked at Laventhol & Horwath, CPAs from 1976 to 1978. Mr. Bowers also serves on the boards of directors of Walker & Dunlop, Inc., American Achievement Corp. and Quadel Consulting, Inc. Mr. Bowers holds a B.S. in Accounting, from Montclair State University and an M.B.A., Finance and Economics, from St. John’s University and is a Certified Public Accountant in New Jersey.
Henry G. Cisneros
Henry G. Cisneros has served on the boards of directors of certain of our Predecessor Entities since 2013 and on our board of directors since February 2014. Mr. Cisneros currently serves as Chairman of the CityView companies, which he joined in 2003. Mr. Cisneros served as the Secretary of the U.S. Department of Housing and Urban Development from 1992 to 1997 and, prior to that, Mr. Cisneros served four terms as Mayor of San Antonio, Texas. Mr. Cisneros has served as President of the National League of Cities, as Deputy Chair of the Federal Reserve Bank of Dallas and is currently an officer of Habitat for Humanity International. Mr. Cisneros is also currently Chairman of the San Antonio Economic Development Foundation and a member of the advisory boards of the Bill and Melinda Gates Foundation and the Broad Foundation. Mr. Cisneros holds a Bachelor of Arts and a Master’s degree in Urban and Regional Planning from Texas A&M University. Mr. Cisneros also holds a Master’s degree in Public Administration from Harvard University and a Doctorate in Public Administration from George Washington University.
142
Table of Contents
Giovanni Cutaia
Giovanni Cutaia is a nominee to our board of directors. Mr. Cutaia is a senior managing director and Chief Operating Officer of Asset Management in the real estate group at Blackstone. Prior to joining Blackstone in 2014, Mr. Cutaia was at Lone Star Funds where he was a Senior Managing Director and Co-Head of Commercial Real Estate Investments Americas from 2009 to 2014. Prior to Lone Star, Mr. Cutaia spent over 12 years at Goldman Sachs in its Real Estate Principal Investments Area as a Managing Director in its New York and London offices. Mr. Cutaia received a B.A. from Colgate University and an M.B.A. from the Tuck School of Business at Dartmouth College.
Jonathan D. Gray
Jonathan D. Gray has served on the boards of directors of certain of our Predecessor Entities since 2006 and on our board of directors since February 2014. Mr. Gray has served as Blackstone’s global head of real estate since January 2012 and a member of the board of directors of Blackstone since February 2012. He also sits on Blackstone’s management and executive committees. Prior to being named global head of real estate at Blackstone, Mr. Gray served as a senior managing director and co-head of real estate from January 2005 to December 2011. Since joining Blackstone in 1992, Mr. Gray has helped build the largest private equity real estate platform in the world with $79 billion in investor capital under management as of December 31, 2013. Mr. Gray received a B.S. in Economics from the Wharton School, as well as a B.A. in English from the College of Arts and Sciences at the University of Pennsylvania, where he graduated magna cum laude and was elected to Phi Beta Kappa. He currently serves as a board member of Hilton Worldwide Holdings Inc., Brixmor Property Group Inc., the Pension Real Estate Association and Trinity School and is Chairman of the Board of Harlem Village Academies. Mr. Gray and his wife, Mindy, recently established the Basser Research Center at the University of Pennsylvania School of Medicine focused on the prevention and treatment of certain genetically caused breast and ovarian cancers.
Brian Kim
Brian Kim is a nominee to our board of directors. Mr. Kim is a managing director in the real estate group at Blackstone. Before joining Blackstone and GSO Capital Partners in 2006, Mr. Kim was an associate at Apollo Real Estate Advisors. Prior to that, Mr. Kim worked for Max Capital Management Corp., a New York City-based real estate investment and management firm, and before Max Capital, he was an analyst in the Investment Banking Group of Credit Suisse First Boston. Mr. Kim received an A.B. in Biology from Harvard College. He is the Chief Financial Officer, Vice President and Managing Director of BRE Select Hotels Corp. and currently serves on its board of directors.
Michael Nash
Michael Nash has served on our board of directors since February 2014. Mr. Nash is a Senior Managing Director in the Real Estate Group of Blackstone and the Chief Investment Officer of Blackstone Real Estate Debt Strategies, each based in New York. He is also a member of the Real Estate Investment Committee for both Blackstone Real Estate Debt Strategies and Blackstone Real Estate Advisors. Prior to joining Blackstone, Mr. Nash was with Merrill Lynch from 1997 to 2007 where he led the firm’s Real Estate Principal Investment Group—Americas. Mr. Nash also serves as the executive chairman of the board of directors of Blackstone Mortgage Trust Inc. Mr. Nash received a B.S. in Accounting from State University of New York at Albany, as well as an M.B.A. in Finance from the Stern School of Business at New York University.
143
Table of Contents
Mitesh B. Shah
Mitesh B. Shah has served on the boards of directors of certain of our Predecessor Entities since 2013 and on our board of directors since February 2014. Mr. Shah currently serves as Chief Executive Officer and Senior Managing Principal of Noble Investment Group, which he founded in 1993 and which specializes in making opportunistic investments in the lodging and hospitality real estate sector. Mr. Shah currently serves as president of the Marriott International North America franchise board, is a member of the owner and franchise board for Hyatt Hotels Corporation and is a member of the Industry Real Estate Finance Advisory Council of the American Hotel and Lodging Association. Mr. Shah also serves as Vice Chairman and executive committee member of the Board of Trustees of Wake Forest University, where he chairs the audit, compliance and risk committee and the nominating committee and is a member of the compensation committee and the Medical Center board. In addition, he is an executive committee member of Woodward Academy’s governing board and a trustee of the University System of Georgia Foundation. Mr. Shah holds a Bachelor of Arts in Economics from Wake Forest University.
William J. Stein
William J. Stein has served on the boards of directors of certain of our Predecessor Entities since 2006 and on our board of directors since 2013. Mr. Stein is a senior managing director and global head of asset management in Blackstone’s real estate group. Since joining Blackstone in 1997, Mr. Stein has been involved in the direct asset management and asset management oversight of Blackstone’s global real estate assets. Before joining Blackstone, Mr. Stein was a Vice President at Heitman Real Estate Advisors and JMB Realty Corp. Mr. Stein currently serves as a board member of Hilton Worldwide Holdings Inc. and Brixmor Property Group Inc. Mr. Stein received a B.B.A. from the University of Michigan and an M.B.A. from the University of Chicago.
Gary M. Sumers
Gary M. Sumers has served on our board of directors since February 2014. Mr. Sumers was most recently a Senior Managing Director and Chief Operating Officer in the Real Estate Group of Blackstone. From joining Blackstone in 1995 until his retirement at the end of 2013, Mr. Sumers’ activities included heading Blackstone Real Estate Advisors’ (BREA) Strategic Asset Management Group, oversight of all financial reporting activities and responsibility for the property disposition activities. From 1993 to 1995, Mr. Sumers was Chief Operating Officer of General Growth Properties, a publicly traded regional mall REIT. Mr. Sumers also serves on the Washington University board of trustees. Mr. Sumers received an A.B. from Washington University in St. Louis, received his law degree from Northwestern University and attended the London School of Economics.
Our corporate governance
We have structured our corporate governance in a manner we believe closely aligns our interests with those of our stockholders. Notable features of our corporate governance include:
| • | prior to the IPO, Blackstone advised us that, when it ceases to own a majority of our common stock, it will ensure that its employees no longer constitute a majority of our board of directors; |
| • | our board of directors is not classified and each of our directors is subject to re-election annually; |
144
Table of Contents
| • | under our amended and restated bylaws and our corporate governance guidelines, directors (other than directors designated pursuant to our stockholders’ agreement) who fail to receive a majority of the votes cast in uncontested elections will be required to submit their resignation to our board of directors; |
| • | we have fully independent audit, compensation and nominating and corporate governance committees and our independent directors meet regularly in executive sessions without the presence of our corporate officers or non-independent directors; |
| • | at least one of our directors qualifies as an “audit committee financial expert” as defined by the SEC; |
| • | we do not have a stockholder rights plan, and if our board of directors were ever to adopt a stockholder rights plan in the future without prior stockholder approval, our board of directors would either submit the plan to stockholders for ratification or cause the rights plan to expire within one year; and |
| • | we have implemented a range of other corporate governance best practices, including placing limits on the number of directorships held by our directors to prevent “overboarding” and implementing a robust director education program. |
Composition of the board of directors
Our amended and restated certificate of incorporation and our amended and restated bylaws provide that our board of directors consists of such number of directors as may from time to time be fixed by our board of directors. So long as Blackstone continues to beneficially own at least 5% of the total shares of our common stock entitled to vote generally in the election of our directors as of the record date of such meeting, we will agree to nominate individuals designated by Blackstone for election as directors as specified in our stockholders’ agreement and Blackstone must consent to any change to the number of our directors. Each director will serve until our next annual meeting and until his or her successor is duly elected and qualifies or until the director’s earlier death, resignation or removal. For a description of Blackstone’s right to require us to nominate its designees to our board of directors, see “Certain relationships and related party transactions—Stockholders’ agreement.”
Background and experience of directors
When considering whether directors and nominees have the experience, qualifications, attributes or skills, taken as a whole, to enable our board of directors to satisfy its oversight responsibilities effectively in light of our business and structure, our board of directors focused primarily on each person’s background and experience as reflected in the information discussed in each of the directors’ individual biographies set forth above. We believe that our directors provide an appropriate mix of experience and skills relevant to the size and nature of our business. In particular, the members of our board of directors considered the following important characteristics, among others:
| • | Mr. Alba—his affiliation with Blackstone, his significant experience in working with companies controlled by private equity sponsors, particularly in the real estate industry, his experience in working with the management of various other companies owned by Blackstone’s funds, including in the hospitality industry, his experience with real estate investing and his extensive financial background. |
145
Table of Contents
| • | Mr. Bowers—his experience in accounting and executive management, including his substantial experience on the audit committees of private and public companies alike. |
| • | Mr. Cisneros—his significant experience in the housing and homebuilding industries and his background in executive management. |
| • | Mr. Cutaia—his affiliation with Blackstone, his significant experience in working with companies in the real estate industry, his experience involving oversight of real estate assets, his experience with real estate investing and his extensive financial background. |
| • | Mr. Goldberg—his experience as an executive in the hospitality industry, particularly in the select service segment. Furthermore, we also considered how his additional role as our President and Chief Executive Officer would bring management perspective to board deliberations and provide valuable information about the status of our day-to-day operations. |
| • | Mr. Gray—his affiliation with Blackstone, his significant experience in working with companies controlled by private equity sponsors, particularly in the real estate industry, his experience in working with the management of various other companies owned by Blackstone’s funds, his experience with real estate investing and his extensive financial background. |
| • | Mr. Kim—his affiliation with Blackstone, his significant experience in working with companies in the real estate industry, his experience with real estate management and investing and his extensive financial background. |
| • | Mr. Nash—his affiliation with Blackstone, his significant experience in real estate investing, his role as chairman of Blackstone Mortgage Trust, Inc. and his extensive financial advisory background. |
| • | Mr. Shah—his experience with investing in the lodging and hospitality real estate sector and his significant experience in the hospitality industry, including with respect to franchising. |
| • | Mr. Stein—his 16-year tenure with Blackstone involving the direct asset management and asset management oversight of Blackstone’s global real estate assets, his extensive financial background and experience as an asset manager focusing on real estate and hospitality investments. |
| • | Mr. Sumers—his affiliation with Blackstone, including his tenure as chief operating officer in the real estate group, his significant experience in asset management, particularly in the real estate industry, and his extensive financial background. |
Controlled company exception
After the completion of this offering, Blackstone will beneficially own approximately 47.5% of our common stock (or 45.2% if the underwriters exercise in full their option to purchase additional shares from the selling stockholders). As a result, we will no longer be a “controlled company” within the meaning of the NYSE corporate governance standards. The NYSE corporate governance standards require that we appoint a majority of independent directors to our board of directors within one year of the date we no longer qualify as a “controlled company.” The NYSE corporate governance standards also require that we have at least one independent director on each of our compensation and nominating and corporate governance committees on the date that we no longer qualify as a “controlled company,” at least a majority of independent directors within 90 days of such date and fully independent committees within one year of such
146
Table of Contents
date. Upon completion of this offering, we will have a majority of independent directors on our board of directors and will have fully independent audit, compensation and nominating and corporate governance committees.
Committees of the board of directors
Our board of directors has established an audit committee, a compensation committee and a nominating and corporate governance committee, each of which has the composition and responsibilities described below. Our board of directors adopted written charters for the committees that comply with current federal law and applicable NYSE rules relating to corporate governance matters, which are available on our website. Our board of directors may also establish from time to time any other committees that it deems necessary or desirable.
Audit committee
Our audit committee consists of Messrs. Bowers, Cisneros, and Shah, with Mr. Bowers serving as chair. Messrs. Bowers, Cisneros and Shah qualify as independent directors under the NYSE governance standards and the independence requirements of Rule 10A-3 of the Exchange Act. The audit committee has oversight responsibilities regarding:
| • | the adequacy and integrity of our financial statements and our financial reporting and disclosure practices; |
| • | the soundness of our system of internal controls regarding finance and accounting compliance; |
| • | the annual independent audit of our combined financial statements; |
| • | the independent registered public accounting firm’s qualifications and independence; |
| • | the engagement of the independent registered public accounting firm; |
| • | the performance of our internal audit function and independent registered public accounting firm; |
| • | our compliance with legal and regulatory requirements in connection with the foregoing; and |
| • | compliance with our Code of Business Conduct & Ethics. |
The audit committee shall also prepare the report of the committee required by the rules and regulations of the SEC to be included in our annual proxy statement.
Compensation committee
Our compensation committee currently consists of Messrs. Shah, Stein and Sumers, with Mr. Stein serving as chair. Upon consummation of this offering, we expect our compensation committee will consist of Messrs. Cutaia, Shah and Sumers, with Mr. Sumers serving as chair. Messrs. Cutaia, Shah and Sumers qualify as independent directors under the NYSE governance standards. The compensation committee is authorized to discharge the board’s responsibilities relating to:
| • | the establishment, maintenance and administration of compensation and benefit policies designed to attract, motivate and retain personnel with the requisite skills and abilities to contribute to the long term success of the Company; |
147
Table of Contents
| • | the goals, objectives and compensation of our President and Chief Executive Officer, including evaluating the performance of the President and Chief Executive Officer in light of those goals; |
| • | the compensation of our other executives and non-management directors; |
| • | our compliance with the compensation rules, regulations and guidelines promulgated by the NYSE, the SEC and other law, as applicable; and |
| • | the issuance of an annual report on executive compensation for inclusion in our annual proxy statement, once required. |
Nominating and corporate governance committee
Our nominating and corporate governance committee consists of Messrs. Alba, Bowers and Nash, with Mr. Alba serving as chair. Messrs. Alba, Bowers and Nash qualify as independent directors under the NYSE governance standards. The nominating and corporate governance committee is authorized to:
| • | advise the board concerning the appropriate composition of the board and its committees; |
| • | identify individuals qualified to become board members; |
| • | recommend to the board the persons to be nominated by the board for election as directors at any meeting of stockholders; |
| • | recommend to the board the members of the board to serve on the various committees of the board; |
| • | develop and recommend to the board a set of corporate governance guidelines and assist the board in complying with them; and |
| • | oversee the evaluation of the board, the board’s committees and management. |
Compensation committee interlocks and insider participation
None of the members of our compensation committee has at any time been one of our executive officers or employees. None of our executive officers currently serves, or has served during the last completed fiscal year, on the compensation committee or board of directors of any other entity that has one or more executive officers serving as a member of our board of directors or compensation committee.
Code of ethics
We adopted a Code of Business Conduct & Ethics that applies to all of our directors, officers and employees, including our principal executive officer, principal financial officer and principal accounting officer, which is available on our website. Our Code of Business Conduct & Ethics is a “code of ethics,” as defined in Item 406(b) of Regulation S-K. Please note that our Internet website address is provided as an inactive textual reference only.
We will make any legally required disclosures regarding amendments to, or waivers of, provisions of our code of ethics on our Internet website.
148
Table of Contents
Executive compensation
From 2006 until the time of our IPO, our Sponsor (the “Compensation Manager”), as the manager of LQ Management L.L.C., one of the Predecessor Entities, administered our compensation and benefit policies. In connection with our IPO, our board of directors established a compensation committee that is responsible for establishing, maintaining and administering compensation and benefit policies.
As used in this “Executive compensation” section, the terms “we,” “our,” “us” and the “Company,” with respect to historical matters prior to our IPO, refer to the Predecessor Entities and, with respect to matters post our IPO, refer to La Quinta Holdings Inc. and its consolidated subsidiaries after giving effect to the Pre-IPO Transactions. In addition, as used in this “Executive compensation” section, the term “Compensation Adjusted EBITDA” when used to describe the financial performance measure for the annual bonus awards means Adjusted EBITDA (as described under “Summary historical combined financial data”), as further adjusted for unusual expenses as determined by the Compensation Manager.
Summary compensation table
The following table sets forth summary information concerning the compensation paid to or accrued by our principal executive officer serving during 2013 and our two other most highly compensated persons serving as executive officers as of December 31, 2013. We refer to these executives as our “named executive officers.”
| Name and principal position | Year | Salary ($)(1) |
Bonus ($)(2) |
Non-equity ($)(3) |
All other compensation ($)(4) |
Total ($) |
||||||||||||||||||
|
|
||||||||||||||||||||||||
| Wayne B. Goldberg President and Chief Executive Officer |
2013 | 500,000 | 80,000 | 920,000 | 133,241 | 1,633,241 | ||||||||||||||||||
| 2012 | 500,000 | 1,747,911 | 900,000 | 14,352 | 3,162,263 | |||||||||||||||||||
| Keith A. Cline Executive Vice President and Chief Financial Officer |
2013 | 343,269 | 251,356 | 298,644 | 125,968 | 1,019,237 | ||||||||||||||||||
| Angelo J. Lombardi Executive Vice President and Chief Operating Officer |
2013 | 325,000 | 63,375 | 424,125 | 70,505 | 883,005 | ||||||||||||||||||
| 2012 | 325,000 | 436,978 | 438,750 | 14,038 | 1,214,766 | |||||||||||||||||||
|
|
||||||||||||||||||||||||
| (1) | Mr. Cline commenced employment as our Executive Vice President and Chief Financial Officer on January 7, 2013, and the amount reported in this column for Mr. Cline reflects the portion of his annual base salary earned in 2013 from such date. |
| (2) | Amounts in this column for 2013 include discretionary bonuses awarded to the named executive officers as described under “Narrative disclosure to summary compensation table—2013 bonus compensation” and, for Mr. Cline, includes a $150,000 relocation bonus pursuant to the terms of his letter agreement described under “Narrative disclosure to summary compensation table—Employment agreements.” |
| (3) | Amounts in this column represent the amounts earned under the annual bonus plan. See “Narrative disclosure to summary compensation table—2013 bonus compensation.” |
| (4) | All other compensation for 2013 includes for each named executive officer: employer-paid life and disability insurance; the employer’s 401(k) matching contributions; and the employer-paid executive physical. The amounts for Messrs. Goldberg and Lombardi also include (1) $105,781 and $43,770, respectively, for the reimbursements of employment-related taxes and personal state tax liability incurred due to the legal structure of the Company and (2) payments by the Company for air travel, lodging, food and entertainment for family members accompanying these executives on business trips. The amount for Mr. Cline also includes $115,233 paid by the Company for relocation expenses incurred and an associated tax gross-up. |
149
Table of Contents
Narrative disclosure to summary compensation table
Employment agreements
Mr. Goldberg
Mr. Goldberg’s employment agreement, dated as of September 30, 2003, as amended as of November 9, 2005 and January 25, 2006, provides that he is to serve as Chief Executive Officer, is eligible to receive a base salary of $500,000, subject to annual adjustments as may be approved (but in no event less than $500,000), and a target bonus of 100% (or such higher amount as may be approved, which, for 2013, was 200%) of his base salary. In addition, Mr. Goldberg’s employment agreement provides him with a $1,100 monthly auto allowance, a benefit which he did not take advantage of in 2013. The employment agreement provides for an initial three-year employment term that extends automatically for additional one-year periods, unless we or the executive elects not to extend the term. Mr. Goldberg is also entitled to participate in all employee benefit plans, programs and arrangements made available to other executive officers generally.
Pursuant to the terms of Mr. Goldberg’s employment agreement, upon a termination by us without cause, or by Mr. Goldberg for good reason or as a result of death or disability, and subject to his signing a general release of claims, he is entitled to receive a lump-sum payment equal to three times the sum of his then-current annual base salary and bonus calculated at 100% of his then-current annual base salary for the year of his termination, subject to continued compliance with the restrictive covenants described below. In addition, Mr. Goldberg would be entitled to receive continued healthcare coverage for 12 months following such termination, or until such earlier time that Mr. Goldberg receives comparable coverage. In the event that Mr. Goldberg’s employment is terminated as a result of his death, his spouse and his eligible dependents are entitled to receive continued healthcare coverage for 12 months. Mr. Goldberg’s employment agreement also provides for reimbursement by us on a “grossed up” basis for all taxes incurred in connection with all payments or benefits provided to him upon a change in control that are determined by us to be subject to the excise tax imposed by Section 4999 of the Internal Revenue Code, or any similar federal or state excise tax, FICA tax or interest penalties with respect to such excise tax.
Mr. Goldberg’s employment agreement also contains restrictive covenants, including an indefinite covenant not to disclose confidential information, and, during Mr. Goldberg’s employment and for the one-year period following the termination of his employment, covenants related to non-competition (other than a termination by the Company without cause or by Mr. Goldberg for good reason) and non-solicitation of employees of the Company, and a covenant not to disparage the Company.
Mr. Cline
Mr. Cline’s letter agreement, dated as of November 29, 2012, provides that he is to serve as our Chief Financial Officer commencing on January 7, 2013. Pursuant to the terms of his letter agreement, Mr. Cline is entitled to a base salary of $350,000 and is eligible to receive a target bonus of 100% of his annual base salary. Mr. Cline also was entitled to receive a relocation bonus of $150,000 and reimbursement up to $100,000 for expenses incurred in connection with the relocation of his primary residence. In addition to his cash compensation, Mr. Cline was granted Units (as described below) that would provide a minimum in distributions (which could include a
150
Table of Contents
mix of cash and securities) of $2,400,000, subject to the terms of the long-term incentive awards described below. See “Compensation Elements—Long-term incentive awards” for a description of the Units.
Pursuant to the terms of Mr. Cline’s severance agreement, dated as of January 7, 2013, in the event Mr. Cline is terminated for reasons other than “cause” (as defined in the agreement), Mr. Cline is eligible to receive severance in an amount equal to the amount, if any, by which $2,400,000 exceeds the total value of his Units plus any prior distributions with respect to the Units, at the time of his termination. For purposes of calculating Mr. Cline’s severance amount, from and after the IPO, the value of Mr. Cline’s Units is calculated based upon the fair market value of each Unit as of the date such Unit vested based upon the fair market value of the Company’s common stock as of the date such Units vested, or, as described below under “Long-term incentive awards”, to the extent the conversion of his Units resulted in the receipt of unvested shares of restricted stock, the fair market value of our common stock as of the date such shares vest.
2013 bonus compensation
Our annual cash incentive compensation plan for the year ended December 31, 2013 compensated and rewarded successful achievement of both short-term financial and non-financial goals that were closely aligned with the long-term goals of the Company. The payout under the 2013 annual incentive program was based on a combination of (1) financial performance of the Company and (2) individual performance. For Mr. Goldberg, each of the financial component and the individual performance component composed 50% of his total award opportunity, for Mr. Cline, the financial component composed 75% of his total award opportunity and the individual component composed 25% of his total award opportunity and, for Mr. Lombardi, the financial component composed 67% of his total award opportunity and the individual performance component composed 33% of his total award opportunity.
The financial component of each named executive officer’s annual bonus opportunity was based on (1) Compensation Adjusted EBITDA, (2) guest satisfaction/Net Promoter and (3) RevPAR Index change. For fiscal 2013, Compensation Adjusted EBITDA composed 70% of the financial component, guest satisfaction/Net Promoter composed 15% and RevPAR Index change composed 15%. Each of the three elements of the financial component (Compensation Adjusted EBITDA, guest satisfaction/Net Promoter and RevPAR Index change) are independent of one another. The financial component of Messrs. Goldberg’s and Cline’s annual bonus opportunity was based on Company-wide goals and, due to the division in which he works, the financial component of Mr. Lombardi’s annual bonus opportunity was based on goals related to the owned hotels.
The individual performance component for our named executive officers was based on a variety of individual achievement factors, including actual achievement of individual goals, actual achievement of divisional objectives, the economic environment as a whole as compared to overall and individual results, developed initiatives and lost opportunities.
Each named executive officer’s target annual bonus is expressed as a percentage of his base salary and, for the year ended December 31, 2013, the named executive officers’ target bonus opportunity as a percentage of such executive’s base salary were as follows: for Mr. Goldberg, 200% of his base salary, for Mr. Cline, 100% of his base salary earned in 2013 and for Mr. Lombardi, 150% of his base salary.
For the year ended December 31, 2013, the potential payout percentage under the Compensation Adjusted EBITDA portion of the financial component for Messrs. Goldberg and
151
Table of Contents
Cline was zero if the Company-wide Compensation Adjusted EBITDA was more than $27.5 million below budgeted Company-wide Compensation Adjusted EBITDA; was measured on a linear basis between 35% and 67.5% if the Company-wide Compensation Adjusted EBITDA achieved was between $27.5 million below budgeted Company-wide Compensation Adjusted EBITDA and $2 million below budgeted Company-wide Compensation Adjusted EBITDA; was measured on a linear basis between 67.5% and 80% if the Company-wide Compensation Adjusted EBITDA achieved was between $2 million below budgeted Company-wide Compensation Adjusted EBITDA and budgeted Company-wide Compensation Adjusted EBITDA and was measured on a linear basis between 80% and 100% if the Company-wide Compensation Adjusted EBITDA achieved was between budgeted Company-wide Compensation Adjusted EBITDA and $10 million above budgeted Company-wide Compensation Adjusted EBITDA.
For the year ended December 31, 2013, the potential payout percentage under the Compensation Adjusted EBITDA portion of the financial component for Mr. Lombardi was zero if the owned hotels’ Compensation Adjusted EBITDA was more than $27.5 million below budgeted owned hotels’ Compensation Adjusted EBITDA; was measured on a linear basis between 35% and 67.5% if the owned hotels’ Compensation Adjusted EBITDA achieved was between $27.5 million below budgeted owned hotels’ Compensation Adjusted EBITDA and $2 million below budgeted owned hotels’ Compensation Adjusted EBITDA; was measured on a linear basis between 67.5% and 80% if the owned hotels’ Compensation Adjusted EBITDA achieved was between $2 million below budgeted owned hotels’ Compensation Adjusted EBITDA and budgeted owned hotels’ Compensation Adjusted EBITDA; and was measured on a linear basis between 80% and 100% if the owned hotels’ Compensation Adjusted EBITDA achieved was between budgeted owned hotels’ Compensation Adjusted EBITDA and $10 million above budgeted owned hotels’ Compensation Adjusted EBITDA.
For the year ended December 31, 2013, the actual Company Compensation Adjusted EBITDA achieved, after adjusting for costs related to loss contingency expenses and costs related to property taxes, resulted in an approximate 97.5% payout under the Compensation Adjusted EBITDA financial component of Messrs. Goldberg’s and Cline’s award opportunity. The actual owned hotels’ Compensation Adjusted EBITDA achieved, after adjusting for costs related to loss contingency expenses and costs related to property taxes, resulted in an approximate 93% payout under the Compensation Adjusted EBITDA financial component of Mr. Lombardi’s award opportunity.
There was no scale for the guest satisfaction/Net Promoter or the RevPAR Index change for any of the three named executive officers, and the named executive officers were eligible for payouts under these measures if the stated goals were achieved. For the year ended December 31, 2013, the goals for RevPar Index change were achieved, which resulted in a 100% payout under the RevPar Index change financial component for each named executive officer. As the guest satisfaction/Net Promoter goals on a Company-wide basis and for the owned hotels were not met, no payment was received for this financial component under the annual incentive plan.
The remaining 50% of Mr. Goldberg’s potential total award opportunity, the remaining 25% of Mr. Cline’s potential total award opportunity and the remaining 33% of Mr. Lombardi’s potential total award opportunity were based on individual achievement factors. As to Mr. Goldberg, the Compensation Manager considered the goals achieved in the Company’s marketing, design and construction, legal, sales, finance, operations, employee relations, technology, revenue management and franchise development departments. For Mr. Cline, the Compensation Manager considered his design and implementation of the accounting and tax department
152
Table of Contents
survey plan, his financial leadership in alternative financing activities, his efforts involving property collateral and debt restructuring initiatives and his contribution to corporate tax matters. For Mr. Lombardi, the Compensation Manager considered the property revenue and EBITDA achieved, the reduction in turnover of the general managers and in the field, the increased employee engagement and improved employee satisfaction and the level of promotions of assistant general managers.
As detailed in the following table, actual amounts paid under the annual bonus plan were calculated by multiplying each named executive officer’s base salary by his target bonus potential, which was then adjusted by an achievement factor based on the combined achievement of the financial component and the individual performance component. Based on the performance achieved, each of the named executive officers earned an annual bonus for 2013 under the annual cash incentive compensation plan as follows, which amounts are reflected in the “Non-equity incentive plan compensation” column of the “Summary compensation table” above:
| Name | 2013 base salary |
Target bonus as a percentage of base salary |
Target bonus potential |
Combined achievement factor as a percentage of target |
2013 annual bonus |
|||||||||||||||
|
|
||||||||||||||||||||
| Wayne B. Goldberg |
$ | 500,000 | 200% | $ | 1,000,000 | 92% | $ | 920,000 | ||||||||||||
| Keith A. Cline |
$ | 343,269 | 100% | $ | 343,269 | 87% | $ | 298,644 | ||||||||||||
| Angelo J. Lombardi |
$ | 325,000 | 150% | $ | 487,500 | 87% | $ | 424,125 | ||||||||||||
|
|
||||||||||||||||||||
In addition to the non-equity incentive plan awards described above, the Compensation Manager also awarded discretionary bonuses to the named executive officers based on the difference between the actual achievement and 100% achievement of the financial component of their total award opportunity. In addition, the Compensation Manager determined to award Messrs. Cline and Lombardi discretionary bonuses in recognition of their contribution to the preparation and execution of the IPO. Amounts related to these discretionary awards are reflected in the “Bonus” column of the “Summary compensation table” above.
Long-term incentive awards
Some of our management employees, including each of our named executive officers, were granted long-term incentive awards in the form of units (the “Units”) in LQ Services L.L.C. (“LQ Services”), which prior to the IPO held interests in several of the Predecessor Entities, which Units were intended to be treated as “profits interests” for U.S. tax purposes. Units were typically granted by our Chief Executive Officer, in consultation with our Sponsor, to key employees upon hire. Unit levels may also have been adjusted to recognize changing job responsibilities.
As a condition to receiving the Units, each named executive officer was required to become party to LQ Services’ amended and restated limited liability company agreement (the “LLC Agreement”). The LLC Agreement generally governed the named executive officers’ rights with respect to their Units. The LLC Agreement also contained restrictive covenants, including an indefinite covenant on confidentiality of information and covenants related to non-solicitation of employees of the Company at all times during the executive’s employment, and for a period ending on the earlier of three years from (A) the executive’s termination for cause or voluntary resignation and (B) a sale, transfer or disposition of all or substantially all of the assets of the specified Predecessor Entities which results in distributions being payable to the Unit holders.
153
Table of Contents
The Units granted to our named executive officers were designed to promote our interests by providing our management employees with the opportunity to participate in increases in the value of our business, thereby incentivizing them to remain as employees. The amounts available for payment on the Units was determined based on the net amount received by the Sponsor pursuant to a Liquidity Event (as defined below), net of specified debt and return of equity to the Sponsor. In 2012, the calculation of the amounts available for payment on the Units was amended, and the Units allocated to Messrs. Goldberg and Lombardi were increased. Under the LLC Agreement, all of the Units were exit-vesting and would vest on the date when there was a sale, transfer or disposition of all or substantially all of the assets of specified Predecessor Entities which resulted in distributions being payable to the holders of the Units (a “Liquidity Event”), subject to the named executive officer’s continued employment on such date. In addition, if the executive’s employment was terminated without cause or as a result of death or disability, then 20% of the executive’s Units would be deemed to have vested ratably in equal, annual installments over five years, beginning on January 26, 2006, and the executive would be entitled to an amount equal to the value of the executive’s vested Units at the then fair market value. Accordingly, if the executive was terminated without cause or was terminated because of death or disability, then the executive would be vested in, and entitled to, all of their Units at their then fair market value. However, if the executive was terminated for cause or voluntarily resigned prior to a Liquidity Event, all of the executive’s Units would be forfeited. In addition, if within six months of such a termination, a distribution was made under the LLC Agreement, the executive would be deemed fully vested with respect to that distribution, meaning that the distribution would be made as though any unvested Units had not been forfeited.
The following table provides information regarding the percentage of Units held by our named executive officers as of December 31, 2013, and the value of these Units based on the IPO price of $17.00 per share.
| Name | Percentage of Units (%) | Value of Units ($) | ||||||
|
|
||||||||
| Wayne B. Goldberg |
28.0 | 14,950,320 | ||||||
| Keith A. Cline |
11.5 | (1) | 2,815,866 | |||||
| Angelo J. Lombardi |
7.0 | 3,709,152 | ||||||
|
|
||||||||
| (1) | Mr. Cline’s percentage reflects participation in the Units above $35,000,000 in value. |
The Units were converted into vested shares of our common stock and unvested shares of restricted stock in connection with the Pre-IPO Transactions. The number of vested shares of common stock and unvested shares of restricted stock delivered was determined in a manner intended to replicate the respective economic value associated with the Units based on the valuation derived from the IPO price. A portion of the shares that would have been issued to Messrs. Goldberg and Lombardi were used to repay Blackstone and certain other holders in satisfaction of an advance and accrued interest thereon in respect of the Units as described below, and the remainder of the shares for Mr. Goldberg and Mr. Lombardi, and all of the shares for Mr. Cline were issued to these executives as follows: (1) 40% of the shares received were vested shares of common stock; (2) 40% were unvested shares of restricted stock that will vest on the first anniversary of the date that is on or about the consummation of the IPO (the “effective date”), contingent upon continued employment through that date; and (3) 20% were unvested shares of restricted stock that will vest on the earlier of, the date that Blackstone and its affiliates cease to own 50% or more of the shares of the Issuer or the seventh anniversary of the effective date, contingent upon continued employment at that date. If the executive’s (other than Mr. Cline’s) employment is terminated without cause (as defined in the LLC Agreement) or
154
Table of Contents
as a result of disability (as defined in the LLC Agreement) or death, or in the event of change of control (as defined in the 2014 Omnibus Incentive Plan described below) all outstanding shares of restricted stock will vest. As to Mr. Cline, it is expected that his unvested shares of restricted stock will receive the same treatment upon a change in control as that of the other executives and will fully vest, but, if he is terminated without cause or as a result of death or disability, rather than full vesting, a number of his then-unvested shares of restricted stock will vest as necessary so that he is vested as to all of his shares received in the conversion in no less than a percentage of the shares equal to 20% multiplied by each year that has elapsed from commencement of his employment in January 2013 through the date of such termination.
The following table sets forth the number of shares and value of our common stock and restricted stock at the IPO price of $17.00 per share that each of our named executive officers received in respect of their Units.
| Vested common stock received in exchange for Units |
Unvested restricted stock received in exchange for Units |
|||||||||||||||
| Name | (#) | ($) | (#) | ($) | ||||||||||||
| Wayne B. Goldberg |
351,773 | (1) | 5,980,141 | 527,658 | 8,970,179 | |||||||||||
| Keith A. Cline |
66,256 | 1,126,352 | 99,384 | 1,689,514 | ||||||||||||
| Angelo J. Lombardi |
87,275 | (2) | 1,483,675 | 130,911 | 2,225,477 | |||||||||||
|
|
||||||||||||||||
| (1) | Excludes 100,335 shares that were used to repay Blackstone and certain other holders in satisfaction of an advance and accrued interest thereon allocated to Mr. Goldberg in respect of the Units. |
| (2) | Excludes 26,756 shares that were used to repay Blackstone and certain other holders in satisfaction of an advance and accrued interest thereon allocated to Mr. Lombardi in respect of the Units. |
In addition to the Units described above, Messrs. Goldberg and Lombardi, as well as other members of management, purchased, directly or indirectly, for cash at fair market value interests in some of the Predecessor Entities, which interests had economic characteristics similar to those of shares of common stock in a corporation and had no vesting schedule. These interests were converted to shares of our common stock in connection with the Pre-IPO Transactions and are reflected under “Security ownership of certain beneficial owners and management.”
Retirement plan
The Company maintains a tax-qualified 401(k) plan, under which the Company matches each employee’s contributions dollar-for-dollar up to 3% of such employee’s eligible earnings and $0.50 for every $1.00 for the next 2% of the employee’s eligible earnings. The maximum match available under the 401(k) plan is 4% of the employee’s eligible earnings. All matching contributions by us are always fully vested.
Potential payments upon termination or change in control
Under the LLC Agreement, upon a Liquidity Event or a termination without cause or as result of death or disability, all of the Units of our named executive officers would fully vest. The value of the Units held by our named executive officers as of December 31, 2013 is described under “Long-term incentive awards” above.
Upon a termination, our named executive officers would be entitled to receive payment for their accrued but unused vacation days, and, in the event of death of a named executive officer, the named executive officer will receive benefits from third-party payors under our employer-paid premium life insurance plans. All of our named executive officers are eligible for three times their regular annual eligible wages at death (up to $1,000,000).
155
Table of Contents
In addition to the foregoing, upon a termination without cause, for good reason or as a result of death or disability, Mr. Goldberg’s employment agreement provides for cash severance benefits and continued healthcare coverage. See “Narrative disclosure to summary compensation table—Employment agreements.” If Mr. Goldberg had been terminated without cause, for good reason or as a result of death or disability on December 31, 2013, he would have been entitled to receive $4,500,000 in severance and approximately $22,055 in continued healthcare coverage based on 2014 rates. In the event of a change in control, Mr. Goldberg’s employment agreement also provides for the Company’s reimbursement of taxes on a “grossed up” basis. If Mr. Cline had been terminated without cause, Mr. Cline would be entitled to receive severance in the amount, if any, by which $2,400,000 exceeded the value of his Units plus any prior distributions with respect to the Units.
Compensation Actions Taken in Fiscal 2014
IPO Grants
In addition to converting the Units held by our named executive officers into vested shares of our common stock and unvested shares of restricted stock in connection with the Pre-IPO Transactions as described above under “Long-term incentive awards,” in connection with the IPO, we made grants of vested shares of our common stock and unvested shares of restricted stock to Messrs. Goldberg and Lombardi in an amount equal to approximately $1,700,000 and $455,000 respectively. These grants were made under the 2014 Omnibus Incentive Plan described below and in the following amounts: Mr. Goldberg, 100,336 shares, and Mr. Lombardi, 26,757 shares. The shares were issued as follows: (1) 50% of each award was immediately vested, (2) 40% of each award will vest on the first anniversary of the date of grant, contingent upon continued employment through that date, and (3) 10% of each award will vest on the earlier of, the date that Blackstone and its affiliates cease to own 50% or more of the shares of the Issuer or the seventh anniversary of the date of grant, contingent upon continued employment at that date. If the executive’s employment is terminated without cause or as a result of disability or death, or in the event of a change of control (each as defined in the 2014 Omnibus Incentive Plan) all outstanding shares of restricted stock will vest.
Post-IPO Compensation Actions
In June 2014, we increased the base salaries of certain of the Company’s executive officers, including Messrs. Goldberg, Cline and Lombardi. Also in June 2014, the Company granted equity-based retention awards and annual equity-based awards to executive officers and other employees of the Company, including our named executive officers, under the 2014 Omnibus Incentive Plan.
Increases to Base Salaries. The Company increased the base salaries of the following named executive officers in the following amounts, which increases had a commencement date of June 1, 2014. Mr. Goldberg’s salary was increased to $800,000, Mr. Cline’s salary was increased to $460,000 and Mr. Lombardi’s salary was increased to $450,000.
Equity-Based Awards. The Company granted (i) retention awards consisting of restricted stock (“retention restricted stock”), (ii) time-vesting restricted stock (“time-vesting restricted stock”) and (iii) performance-vesting performance share units (“performance share units”) to the following named executive officers in the following amounts.
156
Table of Contents
Retention Restricted Stock. The retention restricted stock vests in three equal annual installments, with the required service period beginning on June 1, 2014, and the first one-third of the total number of shares granted vesting on June 1, 2015, the second one-third of the total number of shares granted vesting on June 1, 2016, and the remainder of the total number of shares granted vesting on June 1, 2017, subject to the executive’s continued employment through the applicable vesting date. If the executive’s employment terminates for any reason other than as described below, all unvested retention restricted stock will be forfeited. Upon termination of an executive’s employment without cause or an executive’s termination of his or her employment with good reason, termination due to the executive’s death or disability or upon a change in control all unvested retention restricted stock will immediately vest.
The retention restricted stock was granted to the following executives in the following amounts: Mr. Goldberg was granted 266,949 shares of restricted stock, Mr. Cline was granted 76,271 shares of restricted stock and Mr. Lombardi was granted 73,411 shares of restricted stock.
Time-Vesting Restricted Stock. The time-vesting restricted stock vests in three equal annual installments, with the required service period beginning on December 31, 2014, and the first one-third of the total number of shares granted vesting on December 31, 2014, the second one-third of the total number of shares granted vesting on December 31, 2015, and the remainder of the number of shares granted vesting on December 31, 2016, subject to the executive’s continued employment through the applicable vesting date. If the executive’s employment terminates for any reason other than as described below, all unvested time-vesting restricted stock will be forfeited. Upon termination of an executive’s employment without cause or with good reason on or following a change in control or upon termination of an executive’s employment due to the executive’s death or disability, all unvested time-vesting restricted stock will immediately vest. In addition, upon termination of an executive’s employment without cause or with good reason prior to a change in control, the number of shares of time-vesting restricted stock that would have vested on the next scheduled vesting date following such termination will immediately vest.
The time-vesting restricted stock was granted to the following executives in the following amounts: Mr. Goldberg was granted 35,295 shares of restricted stock, Mr. Cline was granted 13,530 shares of restricted stock and Mr. Lombardi was granted 9,927 shares of restricted stock.
Performance Share Units. The performance share units vest over a performance period beginning on April 8, 2014 and ending on December 31, 2016. The performance share units are settled at the end of the performance period based on (1) the Company’s total shareholder return relative to the total shareholder returns of members of a peer company group (“relative total shareholder return”) and (2) the Company’s absolute compound annual growth rate total shareholder return (“Absolute CAGR TSR”). The actual value of the performance share units that become vested based on each performance measure (relative total shareholder return and Absolute CAGR TSR) is based on an achievement factor which, in each case, ranges from a 33% payout for threshold performance, to 100% for target performance, to 167% for maximum performance. For actual performance between the specified threshold, target and maximum levels, the resulting payout percentage will be adjusted on a linear basis. 70% of the final performance share unit value will be determined subject to achievement under the relative total shareholder return measure, and 30% of the final performance share unit value will be determined subject to achievement under the Absolute CAGR TSR measure.
Once calculated, the final performance share unit value will be delivered to the executive, subject to the executive’s continued employment through the date of determination, in the form of
157
Table of Contents
shares of Company common stock determined by dividing the final performance share unit value by the price of the Company’s common stock at which shares were initially offered to the public in connection with the IPO ($17.00 per share).
If the executive’s employment terminates for any reason other than as described below, the executive’s performance share unit will be forfeited. Upon the executive’s termination of his or her employment for good reason or termination of the executive’s employment without cause, or the executive’s death or disability during the performance period, the performance share unit will immediately vest at pro-rated target levels, with such pro-ration based on the number of days in the performance period that have elapsed. Upon a change in control during the performance period, the performance share unit will immediately vest with the final value of the performance share unit determined based on actual performance through the date of the change in control, but the Committee will have the discretion to settle such performance share unit in either cash or shares of Company common stock.
The performance share units were granted to the following executives in the following amounts, and such amounts assume that the target level of performance is achieved (with the actual value of the performance share unit to be earned based on the performance criteria described above): Mr. Goldberg was granted a target performance share unit value of $1,800,000, Mr. Cline was granted a target performance share unit value of $690,000 and Mr. Lombardi was granted a target performance share unit value of $506,250.
Ownership guidelines
In June 2014, we adopted an executive stock ownership policy for our named executive officers, which provides the following guidelines relating to stock ownership by each of our named executive officers within five years of the later of (x) the date on which we make our first broad-based equity incentive grants following the IPO or (y) the date he or she first becomes subject to the stock ownership policy:
| • | Chief Executive Officer: 4 times base salary |
| • | All other executive officers: 2 times base salary |
Compensation of directors
For the year ended December 31, 2013, each of our non-employee directors other than those affiliated with our Sponsor who served as directors of some of the Predecessor Entities received an annual cash retainer of $115,000 (or $125,000 in the case of Mr. Bowers) payable quarterly and were reimbursed for reasonable travel and related expenses associated with attendance at board or committee meetings. Our employee directors and Sponsor-affiliated directors receive no additional compensation for serving on the board of directors or committees thereof.
Following the IPO, each outside director (other than the directors employed by our Sponsor) is entitled to annual compensation as follows:
| • | Annual cash retainer of $60,000 payable quarterly; |
| • | Additional cash retainer payable quarterly for serving on committees or as the chairperson of specified committees as follows: |
| • | members (other than the chairperson of the audit committee and the compensation committee) of the audit committee, the compensation committee and the nominating and |
158
Table of Contents
| corporate governance committee will receive an additional $5,000 for serving on more than one committee; and |
| • | the chairperson of each of the audit committee and the compensation committee will receive an additional $10,000 annually. |
| • | Equity award payable annually having a fair market value of $100,000 with vesting terms to be determined and where such award must be held until the earlier of the director’s termination or the date the director meets the stock ownership guidelines described below. |
In addition, following consummation of this offering, if the outside director referred to above is also chairman of our board of directors, we expect that he shall receive an additional annual cash retainer of $25,000 payable quarterly and an additional annual equity award having a fair market value of $50,000.
Our directors will not be paid any fees for attending meetings, however, our directors will be reimbursed for reasonable travel and related expenses associated with attendance at board or committee meetings.
We adopted a stock ownership policy effective upon the consummation of the IPO. Each of our non-employee directors is required to own stock in an amount equal to five times his or her annual cash retainer, provided that a non-employee director who is employed by a stockholder of the Company that meets the ownership requirements for a non-employee director shall be exempt from such requirement. Each director is expected to meet these ownership guidelines within five years from the later of the date of the first annual grant to such directors following the consummation of the IPO and when the director first becomes subject to the policy.
In June 2014, we granted each of Messrs. Bowers and Cisneros 5,348 restricted stock units. The restricted stock units vest in three equal annual installments from the date of grant, with the first one-third of the number of restricted stock units granted vesting on June 11, 2015, the second one-third of the total number of restricted stock units granted vesting on June 11, 2016, and the remainder of the number of restricted stock units granted vesting on June 11, 2017, subject to the director’s continued service through the applicable vesting date. If the director’s service terminates for any reason other than as described below, all unvested restricted stock units will be forfeited. Upon termination of a director’s service due to the director’s death or disability, or upon the occurrence of a change in control, all unvested restricted stock units will immediately vest.
Omnibus incentive plan
In connection with the IPO, our board of directors adopted, and our stockholders approved, our 2014 Omnibus Incentive Plan (as defined below).
Purpose. The purpose of the La Quinta Holdings Inc. 2014 Omnibus Incentive Plan (our “2014 Omnibus Incentive Plan”) is to provide a means through which to attract and retain key personnel and to provide a means whereby our directors, officers, employees, consultants and advisors can acquire and maintain an equity interest in us, or be paid incentive compensation, including incentive compensation measured by reference to the value of our common stock, thereby strengthening their commitment to our welfare and aligning their interests with those of our stockholders.
159
Table of Contents
Administration. Our 2014 Omnibus Incentive Plan is administered by the compensation committee of our board of directors or such other committee of our board of directors to which it has delegated power, or if no such committee or subcommittee thereof exists, our board of directors (as applicable, the “Committee”). The Committee is authorized to interpret, administer, reconcile any inconsistency in, correct any defect in and/or supply any omission in our 2014 Omnibus Incentive Plan and any instrument or agreement relating to, or any award granted under, our 2014 Omnibus Incentive Plan; establish, amend, suspend, or waive any rules and regulations and appoint such agents as the Committee deems appropriate for the proper administration of our 2014 Omnibus Incentive Plan; and to make any other determination and take any other action that the Committee deems necessary or desirable for the administration of our 2014 Omnibus Incentive Plan. Except to the extent prohibited by applicable law or the applicable rules and regulations of any securities exchange or inter-dealer quotation system on which our securities are listed or traded, the Committee may allocate all or any portion of its responsibilities and powers to any one or more of its members and may delegate all or any part of its responsibilities and powers to any person or persons selected by it in accordance with the terms of our 2014 Omnibus Incentive Plan. Unless otherwise expressly provided in our 2014 Omnibus Incentive Plan, all designations, determinations, interpretations, and other decisions under or with respect to our 2014 Omnibus Incentive Plan or any award or any documents evidencing awards granted pursuant to our 2014 Omnibus Incentive Plan are within the sole discretion of the Committee, may be made at any time and are final, conclusive and binding upon all persons or entities, including, without limitation, us, any participant holder or beneficiary of any award, and any of our stockholders.
Shares Subject to our 2014 Omnibus Incentive Plan. Our 2014 Omnibus Incentive Plan provides that the total number of shares of common stock that may be issued under our 2014 Omnibus Incentive Plan is 13,000,000. Of this amount, the maximum number of shares for which incentive stock options may be granted is 13,000,000; the maximum number of shares for which options or stock appreciation rights may be granted to any individual participant during any single fiscal year is 900,000; the maximum number of shares for which performance compensation awards denominated in shares may be granted to any individual participant in respect of a single fiscal year is 3,500,000 (or if any such awards are settled in cash, the maximum amount may not exceed the fair market value of such shares on the last day of the performance period to which such award relates); the maximum number of shares of common stock granted during a single fiscal year to any non-employee director, taken together with any cash fees paid to such non-employee director during the fiscal year, shall not exceed $500,000 in total value; and the maximum amount that may be paid to any individual participant for a single fiscal year under a performance compensation award denominated in cash is $10,000,000. Except for substitute awards (as described below), in the event any award terminates, lapses, or is settled without the payment of the full number of shares subject to such award, including as a result of net share settlement of the award or as a result of the award being settled in cash, the undelivered shares may be granted again under our 2014 Omnibus Incentive Plan, unless the shares are surrendered after the termination of our 2014 Omnibus Incentive Plan, and only if stockholder approval is not required under the then-applicable rules of the exchange on which the shares of common stock are listed. Awards may, in the sole discretion of the Committee, be granted in assumption of, or in substitution for, outstanding awards previously granted by an entity directly or indirectly acquired by us or with which we combine (referred to as “substitute awards”), and such substitute awards shall not be counted against the total number of shares that may be issued under our 2014 Omnibus Incentive Plan, except that substitute awards intended to qualify as “incentive stock options” shall count against
160
Table of Contents
the limit on incentive stock options described above. No award may be granted under our 2014 Omnibus Incentive Plan after the tenth anniversary of the effective date (as defined therein), but awards theretofore granted may extend beyond that date.
Options. The Committee may grant non-qualified stock options and incentive stock options, under our 2014 Omnibus Incentive Plan, with terms and conditions determined by the Committee that are not inconsistent with our 2014 Omnibus Incentive Plan; provided, that all stock options granted under our 2014 Omnibus Incentive Plan are required to have a per share exercise price that is not less than 100% of the fair market value of our common stock underlying such stock options on the date such stock options are granted (other than in the case of options that are substitute awards), and all stock options that are intended to qualify as incentive stock options must be granted pursuant to an award agreement expressly stating that the options are intended to qualify as an incentive stock option, and will be subject to the terms and conditions that comply with the rules as may be prescribed by Section 422 of the Internal Revenue Code. The maximum term for stock options granted under our 2014 Omnibus Incentive Plan will be ten years from the initial date of grant, or with respect to any stock options intended to qualify as incentive stock options, such shorter period as prescribed by Section 422 of the Internal Revenue Code. However, if a non-qualified stock option would expire at a time when trading of shares of common stock is prohibited by our insider trading policy (or “blackout period” imposed by us), the term will automatically be extended to the 30th day following the end of such period. The purchase price for the shares as to which a stock option is exercised may be paid to us, to the extent permitted by law (i) in cash or its equivalent at the time the stock option is exercised; (ii) in shares having a fair market value equal to the aggregate exercise price for the shares being purchased and satisfying any requirements that may be imposed by the Committee; or (iii) by such other method as the Committee may permit in its sole discretion, including without limitation, (A) in other property having a fair market value on the date of exercise equal to the purchase price; (B) if there is a public market for the shares at such time, through the delivery of irrevocable instructions to a broker to sell the shares being acquired upon the exercise of the stock option and to deliver to us the amount of the proceeds of such sale equal to the aggregate exercise price for the shares being purchased; or (C) through a “net exercise” procedure effected by withholding the minimum number of shares needed to pay the exercise price and all applicable required withholding taxes. Any fractional shares of common stock will be settled in cash.
Stock Appreciation Rights. The Committee may grant stock appreciation rights, with terms and conditions determined by the Committee that are not inconsistent with our 2014 Omnibus Incentive Plan. Generally, each stock appreciation right will entitle the participant upon exercise to an amount (in cash, shares or a combination of cash and shares, as determined by the Committee) equal to the product of (i) the excess of (A) the fair market value on the exercise date of one share of common stock, over (B) the strike price per share, times (ii) the number of shares of common stock covered by the stock appreciation right. The strike price per share of a stock appreciation right will be determined by the Committee at the time of grant but in no event may such amount be less than the fair market value of a share of common stock on the date the stock appreciation right is granted (other than in the case of stock appreciation rights granted in substitution of previously granted awards).
Restricted Shares and Restricted Stock Units. The Committee may grant restricted shares of our common stock or restricted stock units, representing the right to receive, upon the expiration of the applicable restricted period, one share of common stock for each restricted stock unit, or, in its sole discretion of the Committee, the cash value thereof (or any combination thereof). As to
161
Table of Contents
restricted shares of our common stock, subject to the other provisions of our 2014 Omnibus Incentive Plan, the holder will generally have the rights and privileges of a stockholder as to such restricted shares of common stock, including, without limitation, the right to vote such restricted shares of common stock (except, that if the lapsing of restrictions with respect to such restricted shares of common stock is contingent on satisfaction of performance conditions other than or in addition to the passage of time, any dividends payable on such restricted shares of common stock will be retained, and delivered without interest to the holder of such shares when the restrictions on such shares lapse).
Other Stock-Based Awards. The Committee may issue unrestricted common stock, rights to receive grants of awards at a future date, or other awards denominated in shares of common stock (including, without limitation, performance shares or performance units), under our 2014 Omnibus Incentive Plan, including performance-based awards, with terms and conditions determined by the Committee that are not inconsistent with our 2014 Omnibus Incentive Plan.
Performance Compensation Awards. The Committee may also designate any award as a “performance compensation award” intended to qualify as “performance-based compensation” under Section 162(m) of the Internal Revenue Code. The Committee also has the authority to make an award of a cash bonus to any participant and designate such award as a performance compensation award under our 2014 Omnibus Incentive Plan. The Committee has sole discretion to select the length of any applicable performance periods, the types of performance compensation awards to be issued, the applicable performance criteria and performance goals, and the kinds and/or levels of performance goals that are to apply. The performance criteria that will be used to establish the performance goals may be based on the attainment of specific levels of our performance (and/or one or more affiliates, divisions or operational and/or business units, product lines, brands, business segments, administrative departments, or any combination of the foregoing) and are limited to specific goals enumerated in our 2014 Omnibus Incentive Plan.
Effect of Certain Events on 2014 Omnibus Incentive Plan and Awards. In the event of (a) any dividend (other than regular cash dividends) or other distribution (whether in the form of cash, shares of common stock, other securities or other property), recapitalization, stock split, reverse stock split, reorganization, merger, consolidation, split-up, split-off, spin-off, combination, repurchase or exchange of our shares of common stock or other securities, issuance of warrants or other rights to acquire our shares of common stock or other securities, or other similar corporate transaction or event (including, without limitation, a change in control, as defined in our 2014 Omnibus Incentive Plan) that affects the shares of common stock, or (b) unusual or nonrecurring events (including, without limitation, a change in control) affecting us, any affiliate, or the financial statements of us or any affiliate, or changes in applicable rules, rulings, regulations or other requirements of any governmental body or securities exchange or inter-dealer quotation system, accounting principles or law, such that in either case an adjustment is determined by the Committee in its sole discretion to be necessary or appropriate, then the Committee must make any such adjustments in such manner as it may deem equitable, including without limitation, any or all of: (i) adjusting any or all of (A) the share limits applicable under our 2014 Omnibus Incentive Plan with respect to the number of awards which may be granted thereunder; (B) the number of our shares of common stock or other securities which may be issued in respect of awards or with respect to which awards may be granted under our 2014 Omnibus Incentive Plan and (C) the terms of any outstanding award, including, without limitation, (1) the number of shares of common stock or other securities subject to outstanding awards or to which outstanding awards relate; (2) the exercise price or strike price with respect
162
Table of Contents
to any award; or (3) any applicable performance measures; (ii) providing for a substitution or assumption of awards, accelerating the exercisability of, lapse of restrictions on, or termination of, awards or providing for a period of time for participants to exercise outstanding awards prior to the occurrence of such event; and (iii) cancelling any one or more outstanding awards and causing to be paid to the holders holding vested awards (including any awards that would vest as a result of the occurrence of such event but for such cancellation) the value of such awards, if any, as determined by the Committee (which if applicable may be based upon the price per share of common stock received or to be received by other holders of our stock in such event), including without limitation, in the case of options and stock appreciation rights, a cash payment equal to the excess, if any, of the fair market value of the shares of common stock subject to the option or stock appreciation right over the aggregate exercise price or strike price thereof.
Nontransferability of Awards. An award will not be transferable or assignable by a participant other than by will or by the laws of descent and distribution and any such purported assignment, alienation, pledge, attachment, sale, transfer or encumbrance will be void and unenforceable against us or any affiliate. However, the Committee may, in its sole discretion, permit awards (other than incentive stock options) to be transferred, including transfer to a participant’s family members, any trust established solely for the benefit of a participant or such participant’s family members, any partnership or limited liability company of which a participant, or such participant and such participant’s family members, are the sole member(s), and a beneficiary to whom donations are eligible to be treated as “charitable contributions” for tax purposes.
Amendment and Termination. Our board of directors may amend, alter, suspend, discontinue, or terminate our 2014 Omnibus Incentive Plan or any portion thereof at any time; provided, that no such amendment, alteration, suspension, discontinuation or termination may be made without stockholder approval if (i) such approval is necessary to comply with any regulatory requirement applicable to our 2014 Omnibus Incentive Plan or for changes in GAAP to new accounting standards; (ii) it would materially increase the number of securities which may be issued under our 2014 Omnibus Incentive Plan (except for adjustments in connection with certain corporate events); or (iii) it would materially modify the requirements for participation in our 2014 Omnibus Incentive Plan; provided, further, that any such amendment, alteration, suspension, discontinuance or termination that would materially and adversely affect the rights of any participant or any holder or beneficiary of any award shall not to that extent be effective without such individual’s consent.
The Committee may, to the extent consistent with the terms of any applicable award agreement, waive any conditions or rights under, amend any terms of, or alter, suspend, discontinue, cancel or terminate, any award granted or the associated award agreement, prospectively or retroactively, subject to the consent of the affected participant if any such waiver, amendment, alteration, suspension, discontinuance, cancellation or termination would materially and adversely affect the rights of any participant with respect to such award; provided that without stockholder approval, except as otherwise permitted in our 2014 Omnibus Incentive Plan, (i) no amendment or modification may reduce the exercise price of any option or the strike price of any stock appreciation right; (ii) the Committee may not cancel any outstanding option or stock appreciation right and replace it with a new option or stock appreciation right (with a lower exercise price or strike price, as the case may be) or other award or cash payment that is greater than the value of the cancelled option or stock appreciation right; and (iii) the Committee may not take any other action which is considered a “repricing” for purposes of the stockholder approval rules of any securities exchange or inter-dealer quotation system on which our securities are listed or quoted.
163
Table of Contents
Dividends and Dividend Equivalents. The Committee in its sole discretion may provide part of an award with dividends or dividend equivalents, on such terms and conditions as may be determined by the Committee in its sole discretion; provided, that no dividends or dividend equivalents shall be payable in respect of outstanding (i) options or stock appreciation rights or (ii) unearned performance compensation awards or other unearned awards subject to performance conditions (other than or in addition to the passage of time) (although dividends or dividend equivalents may be accumulated in respect of unearned awards and paid within 15 days after such awards are earned and become payable or distributable).
Clawback/Forfeiture. An award agreement may provide that the Committee may in its sole discretion cancel such award if the participant, while employed by or providing services to us or any affiliate or after termination of such employment or service, violates a non-competition, non-solicitation or non-disclosure covenant or agreement or otherwise has engaged in or engages in other detrimental activity that is in conflict with or adverse to our interests or the interests of any affiliate, including fraud or conduct contributing to any financial restatements or irregularities, as determined by the Committee in its sole discretion. Without limiting the foregoing, all awards shall be subject to reduction, cancellation, forfeiture or recoupment to the extent necessary to comply with applicable law.
164
Table of Contents
Certain relationships and related party transactions
Stockholders’ agreement
In connection with the IPO, we entered into a stockholders’ agreement with Blackstone. This agreement required us to nominate a number of individuals designated by Blackstone for election as our directors at any meeting of our stockholders, each a “Sponsor Director,” such that, upon the election of each such individual, and each other individual nominated by or at the direction of our board of directors or a duly-authorized committee of the board, as a director of our Company, the number of Sponsor Directors serving as directors of our Company will be equal to: (1) if Blackstone continues to beneficially own at least 50% of the shares of our common stock entitled to vote generally in the election of our directors as of the record date for such meeting, the lowest whole number that is greater than 50% of the total number of directors comprising our board of directors; (2) if Blackstone continues to beneficially own at least 40% (but less than 50%) of the shares of our common stock entitled to vote generally in the election of our directors as of the record date for such meeting, the lowest whole number that is at least 40% of the total number of directors comprising our board of directors; (3) if Blackstone continues to beneficially own at least 30% (but less than 40%) of the total shares of our common stock entitled to vote generally in the election of our directors as of the record date for such meeting, the lowest whole number that is at least 30% of the total number of directors comprising our board of directors; (4) if Blackstone continues to beneficially own at least 20% (but less than 30%) of the total shares of our common stock entitled to vote generally in the election of our directors as of the record date for such meeting, the lowest whole number that is at least 20% of the total number of directors comprising our board of directors; and (5) if Blackstone continues to beneficially own at least 5% (but less than 20%) of the total shares of our common stock entitled to vote generally in the election of our directors as of the record date for such meeting, the lowest whole number that is at least 10% of the total number of directors comprising our board of directors. For so long as the stockholders’ agreement remains in effect, Sponsor Directors may be removed only with the consent of Blackstone. In the case of a vacancy on our board created by the removal or resignation of a Sponsor Director, the stockholders’ agreement will require us to nominate an individual designated by our Sponsor for election to fill the vacancy.
The stockholders’ agreement will remain in effect until our Sponsor is no longer entitled to nominate a Sponsor Director pursuant to the stockholders’ agreement, unless our Sponsor requests that it terminate at an earlier date.
After the completion of this offering, Blackstone will beneficially own approximately 47.5% of our common stock (or 45.2% if the underwriters’ exercise their option in full to purchase additional shares from the selling stockholders).
Registration rights agreement
In connection with the IPO, we entered into a registration rights agreement that provides Blackstone an unlimited number of “demand” registrations and customary “piggyback” registration rights. The registration rights agreement also provides that we will pay certain expenses relating to such registrations and indemnify the registration rights holders against (or make contributions in respect of) certain liabilities which may arise under the Securities Act. This offering is being made pursuant to the registration rights agreement.
165
Table of Contents
Indemnification agreements
In connection with the IPO, we entered into indemnification agreements with our directors and executive officers. These agreements require us to indemnify these individuals to the fullest extent permitted by Delaware law against liabilities that may arise by reason of their service to us, and to advance expenses incurred as a result of any proceeding against them as to which they could be indemnified. Insofar as indemnification for liabilities arising under the Securities Act may be permitted to directors or executive officers, we have been informed that in the opinion of the SEC such indemnification is against public policy and is therefore unenforceable.
There is currently no pending material litigation or proceeding involving any of our directors, officers or employees for which indemnification is sought.
Pre-IPO Transactions
On April 14, 2014 and as part of the Pre-IPO Transactions, Holdco III, our subsidiary, entered into an agreement to purchase the limited liability company interests of a Blackstone affiliate that owns, directly or indirectly, the Previously Managed Portfolio. As consideration for such purchase and subject to adjustment as provided in the agreement, our affiliate received a net amount equal to $76.9 million in cash and 4,348,284 shares of common stock of the Issuer. The agreement provides for customary representations and warranties. In addition, the agreement provides certain indemnifications of both the purchaser and seller, which in some cases will be subject to a liability cap.
On April 14, 2014 and as part of the Pre-IPO Transactions, La Quinta Intermediate Holdings L.L.C. acquired La Quinta Management L.L.C., of which Wayne B. Goldberg owned 70% and Angelo J. Lombardi owned 30%, for a purchase price of $815,000 in cash.
Some of our management employees, including our named executive officers, were granted long-term incentive awards, or Units, in LQ Services, that were designed to promote our interests by providing our management employees with the opportunity to participate in increases in the value of our business, thereby incentivizing them to remain as employees. These Units were converted into vested shares of our common stock and unvested shares of restricted stock in connection with the Pre-IPO Transactions. See “Management—Executive compensation—Long-term incentive awards” for a further discussion of these Units and the conversion.
Products and services
Alliant Insurance Services, Inc., or Alliant, which had been owned by Blackstone until 2012, provides us certain broker service, claims support services, risk management support and other services. In consideration for Alliant’s services, our payments to Alliant totaled $0.4 million, $0.6 million, $0.2 million and $0.7 million, respectively, for the nine months ended September 30, 2014 and fiscal years ended December 31, 2013, 2012 and 2011.
Entities affiliated with Travelport, LP, or Travelport, in which certain Blackstone entities have an interest, provide computerized reservations and ticketing and other services to travel agencies and others in the travel industry. We are party to a master services agreement with Travelport whereby we agree to pay specified fees per hotel booking and to purchase certain advertising services. Our payments for services from Travelport totaled $1.5 million, $2.2 million, $2.1 million and $2.0 million, respectively, for the nine months ended September 30, 2014 and fiscal years ended December 31, 2013, 2012 and 2011.
166
Table of Contents
Debt and interest payments
As of September 30, 2014, approximately $46.8 million aggregate principal amount of our senior secured term loan facility was owned by affiliates of Blackstone. We make periodic interest and principal payments on such debt in accordance with its terms. See “Description of indebtedness—Senior secured credit facilities.”
Advisory services
We have engaged Blackstone Advisory Partners L.P., an affiliate of Blackstone, to provide certain financial consulting services in connection with this offering. We have agreed to pay Blackstone Advisory Partners L.P., only upon successful completion of this offering, a fee of approximately $485,000.
Other
See note 9 to the condensed consolidated financial statements of La Quinta Holdings Inc. as of and for the nine months ended September 30, 2014 and 2013 and note 13 to the combined financial statements of the Predecessor Entities, in each case, included elsewhere in this prospectus for information regarding the management agreements between the Predecessor Entities and the owners of the Previously Managed Portfolio.
Blackstone Advisory Partners L.P., an affiliate of Blackstone, received aggregate compensation of approximately $3.0 million for acting as underwriter or co-manager in connection with financing transactions by us, including our IPO, during year to date 2014.
Statement of policy regarding transactions with related persons
Our board of directors has adopted a written statement of policy regarding transactions with related persons, which we refer to as our “related person policy.” Our related person policy requires that a “related person” (as defined as in paragraph (a) of Item 404 of Regulation S-K) must promptly disclose to our General Counsel any “related person transaction” (defined as any transaction that is anticipated would be reportable by us under Item 404(a) of Regulation S-K in which we were or are to be a participant and the amount involved exceeds $120,000 and in which any related person had or will have a direct or indirect material interest) and all material facts with respect thereto. The General Counsel will then promptly communicate that information to our board of directors. No related person transaction will be executed without the approval or ratification of our board of directors or a duly authorized committee of our board of directors. It is our policy that directors interested in a related person transaction will recuse themselves from any vote on a related person transaction in which they have an interest.
167
Table of Contents
Principal and selling stockholders
The following table and accompanying footnotes set forth information regarding the beneficial ownership of shares of our common stock as of November 13, 2014 by (1) the selling stockholders, (2) each person known by us to own beneficially more than 5% of our outstanding common stock, (3) each of our directors, director nominees and named executive officers and (4) all of our directors, director nominees and executive officers as a group.
Beneficial ownership is determined in accordance with the rules of the SEC.
Unless otherwise provided, the address of each individual listed below is c/o La Quinta Holdings Inc., 909 Hidden Ridge, Suite 600, Irving, Texas 75038.
| Number of shares beneficially owned |
Percentage of shares beneficially owned | |||||||||||||||
| Prior to this offering |
After this offering | |||||||||||||||
| Name | Assuming not exercised |
Assuming the underwriters’ option is exercised in full |
||||||||||||||
|
|
||||||||||||||||
| Principal and Selling Stockholders: |
||||||||||||||||
|
|
||||||||||||||||
| Blackstone(2) |
(1 | ) | 62.8% | 47.5% | 45.2% | |||||||||||
| Directors and Named Executive Officers: |
||||||||||||||||
| Wayne B. Goldberg(3) |
1,368,976 | 1.0% | 1.0% | 1.0% | ||||||||||||
| Keith A. Cline(4) |
255,441 | * | * | * | ||||||||||||
| Angelo J. Lombardi(5) |
227,637 | * | * | * | ||||||||||||
| Glenn Alba(6) |
— | — | — | — | ||||||||||||
| Alan J. Bowers |
— | — | — | — | ||||||||||||
| Henry G. Cisneros |
— | — | — | — | ||||||||||||
| Giovanni Cutaia(6) |
— | — | — | — | ||||||||||||
| Jonathan D. Gray(6) |
— | — | — | — | ||||||||||||
| Brian Kim(6) |
— | — | — | — | ||||||||||||
| Michael Nash(6) |
— | — | — | — | ||||||||||||
| Mitesh B. Shah |
— | — | — | — | ||||||||||||
| William J. Stein(6) |
— | — | — | — | ||||||||||||
| Gary M. Sumers(7) |
— | — | — | — | ||||||||||||
| Directors, director nominees and executive officers as a group (17 persons)(8) |
2,649,539 | 2.0% | 2.0% | 2.0% | ||||||||||||
|
|
||||||||||||||||
| * | Less than 1% |
| (1) | Prior to this offering, Blackstone beneficially owned 82,035,576 shares. After this offering, Blackstone will beneficially own 62,035,576 shares (assuming the underwriters’ option is not exercised) or 59,035,576 shares (assuming the underwriters’ option is exercised in full). |
| The selling stockholders in this offering are Blackstone Real Estate Partners IV L.P. (598,680 and 688,482 shares), Blackstone Real Estate Partners (DC) IV.TE.3-A L.P. (345,808 and 397,679 shares), Blackstone Real Estate Partners (DC) IV.TE.2 L.P. (297,976 and 342,673 shares), Blackstone Real Estate Partners (DC) IV.TE.1 L.P. (216,928 and 249,468 shares), Blackstone Real Estate Partners IV.F L.P. (201,344 and 231,546 shares), Blackstone Real Estate Holdings IV L.P. (101,398 and 116,607 shares), Blackstone Real Estate Partners IV.TE.2 L.P. (81,461 and 93,680 shares), Blackstone Real Estate Partners V L.P. (3,463,640 and 3,983,186 shares), Blackstone Real Estate Partners V.TE.2 L.P. (3,204,685 and 3,685,388 shares), Blackstone Real Estate Partners V.TE.1 L.P. (1,247,358 and 1,434,461 shares), Blackstone Real Estate Partners V.F L.P. (876,268 and 1,007,709 shares), Blackstone Real Estate Holdings V L.P. (505,271 and 581,062 shares), Blackstone Real Estate Partners (AIV) V L.P. (100,408 and 115,469 shares), BRE/LQJV-NQ L.L.C. (7,698,678 and 8,853,478 shares) and BRE/Prime Mezz 2 L.L.C. (1,060,097 and 1,219,112 shares). For each selling stockholder, the parenthetical following their name discloses, first, the number of shares sold by such selling stockholder assuming the underwriters’ option is not exercised and, second, the number of shares sold by such selling stockholder assuming the underwriters’ option is exercised in full. |
168
Table of Contents
| (2) | Reflects shares of our common stock directly held by BRE/LQJV-NQ L.L.C., BRE/ Prime Mezz 2 L.L.C., Blackstone Real Estate Partners IV L.P., Blackstone Real Estate Partners IV.F L.P., Blackstone Real Estate Partners IV.TE.2 L.P., Blackstone Real Estate Partners (DC) IV.TE.1 L.P., Blackstone Real Estate Partners (DC) IV.TE.2 L.P., Blackstone Real Estate Partners (DC) IV.TE.3-A L.P., Blackstone Real Estate Holdings IV L.P., Blackstone Real Estate Partners V L.P., Blackstone Real Estate Partners V.F L.P., Blackstone Real Estate Partners V.TE.1 L.P., Blackstone Real Estate Partners V.TE.2 L.P., Blackstone Real Estate Partners (AIV) V L.P., and Blackstone Real Estate Holdings V L.P. (together, the “Blackstone Funds”). |
| The managing members of BRE/LQJV-NQ L.L.C. are Blackstone Real Estate Partners IV L.P. and Blackstone Real Estate Partners V L.P. |
| The managing member of BRE/Prime Mezz 2 L.L.C. is BRE/Prime Mezz 3-A L.L.C. The managing member of BRE/Prime Mezz 3-A L.L.C. is BRE/Prime Holdings L.L.C. The managing member of BRE/Prime Holdings L.L.C. is WIH Hotels L.L.C. The managing member of WIH Hotels L.L.C. is Blackstone Real Estate Partners IV L.P. |
| The general partner of each of Blackstone Real Estate Partners IV L.P., Blackstone Real Estate Partners IV.F L.P., Blackstone Real Estate Partners IV.TE.2 L.P., Blackstone Real Estate Partners (DC) IV.TE.1 L.P., Blackstone Real Estate Partners (DC) IV.TE.2 L.P. and Blackstone Real Estate Partners (DC) IV.TE.3-A L.P. is Blackstone Real Estate Associates IV L.P. The general partner of Blackstone Real Estate Associates IV L.P. is BREA IV L.L.C. |
| The general partner of each of Blackstone Real Estate Partners V L.P., Blackstone Real Estate Partners V.F L.P., Blackstone Real Estate Partners V.TE.1 L.P., Blackstone Real Estate Partners V.TE.2 L.P., Blackstone Real Estate Partners (AIV) V L.P. is Blackstone Real Estate Associates V L.P. The general partner of each of Blackstone Real Estate Associates V L.P. is BREA V L.L.C. |
| The general partner of Blackstone Real Estate Holdings V L.P. is BREP V Side-by-Side GP L.L.C. The general partner of Blackstone Real Estate Holdings IV L.P. is BREP IV Side-by-Side GP L.L.C. |
| The sole member of each of BREP IV Side-by-Side GP L.L.C. and BREP V Side-by-Side GP L.L.C. and managing member of each of BREA IV L.L.C. and BREA V L.L.C is Blackstone Holdings II L.P. The general partner of Blackstone Holdings II L.P. is Blackstone Holdings I/II GP Inc. The sole shareholder of Blackstone Holdings I/II GP Inc. is The Blackstone Group L.P. The general partner of The Blackstone Group L.P. is Blackstone Group Management L.L.C. Blackstone Group Management L.L.C. is wholly-owned by Blackstone’s senior managing directors and controlled by its founder, Stephen A. Schwarzman. Each of the entities that may be deemed to directly or indirectly control shares held by the Blackstone Funds and Mr. Schwarzman may be deemed to beneficially own such shares directly or indirectly controlled by it or him, but each disclaims beneficial ownership of such shares (other than the Blackstone Funds to the extent of their direct holdings). The address of each of Mr. Schwarzman and each of the other entities listed in this footnote is c/o The Blackstone Group L.P., 345 Park Avenue, New York, New York 10154. |
| (3) | Includes 880,070 shares of unvested restricted stock, 11,765 shares of which was granted pursuant to the 2014 Omnibus Incentive Plan and will vest on December 31, 2014 and 185,918 shares of which was received in respect of the Units held by Mr. Goldberg or granted pursuant to the 2014 Omnibus Incentive Plan and will vest on the date that Blackstone ceases to own 50% or more of our common stock, in each case, subject to Mr. Goldberg’s continued employment. Does not include shares issuable upon settlement of performance-vesting restricted stock granted to Mr. Goldberg. |
| (4) | Includes 189,185 shares of unvested restricted stock, 4,510 shares of which was granted pursuant to the 2014 Omnibus Incentive Plan and will vest on December 31, 2014 and 33,128 shares of which was received in respect of the Units held by Mr. Cline and will vest on the date that Blackstone ceases to own 50% or more of our common stock, in each case, subject to Mr. Cline’s continued employment. Does not include shares issuable upon settlement of performance-vesting restricted stock granted to Mr. Cline. |
| (5) | Includes 227,627 shares of unvested restricted stock, 3,309 shares of which was granted pursuant to the 2014 Omnibus Incentive Plan and will vest on December 31, 2014 and 46,311 shares of which was received in respect of the Units held by Mr. Lombardi or granted pursuant to the 2014 Omnibus Incentive Plan and will vest on the date that Blackstone ceases to own 50% or more of our common stock, in each case, subject to Mr. Lombardi’s continued employment. Does not include shares issuable upon settlement of performance-vesting restricted stock granted to Mr. Lombardi. |
| (6) | Messrs. Alba, Cutaia, Gray, Kim, Nash and Stein are each employees of Blackstone, but each disclaims beneficial ownership of the shares beneficially owned by Blackstone. |
| (7) | Mr. Sumers is an advisor of Blackstone, but disclaims beneficial ownership of the shares beneficially owned by Blackstone. |
| (8) | Includes 1,919,579 shares of unvested restricted stock, 29,475 shares of which was granted to our directors and executive officers as a group pursuant to the 2014 Omnibus Incentive Plan and will vest on December 31, 2014 and 383,916 shares of which was received in respect of the Units held by our directors and executive officers as a group or granted to our directors and executive officers as a group pursuant to the 2014 Omnibus Incentive Plan and will vest on the date that Blackstone ceases to own 50% or more of our common stock, in each case, subject to the applicable director or executive officer’s continued employment. Does not include shares issuable upon settlement of performance-vesting restricted stock units granted to our executive officers. |
169
Table of Contents
Senior secured credit facilities
Concurrently with the IPO, on April 14, 2014, we entered into a credit agreement with JPMorgan Chase Bank, N.A., as administrative agent, collateral agent, swing line lender and L/C issuer, J.P. Morgan Securities LLC, Morgan Stanley Senior Funding, Inc., Merrill Lynch, Pierce, Fenner & Smith Incorporated, Citigroup Global Markets Inc., Credit Suisse Securities (USA) LLC, Deutsche Bank Securities Inc., Goldman Sachs Bank USA and Wells Fargo Securities, LLC, as joint lead arrangers and joint bookrunners, and the other agents and lenders from time to time party thereto.
The credit agreement provides for senior secured credit facilities consisting of:
| • | a $2.1 billion senior secured term loan facility, which will mature in 2021; and |
| • | a $250.0 million senior secured revolving credit facility, $50 million of which is available in the form of letters of credit, which will mature in 2019. |
Our wholly owned subsidiary, La Quinta Intermediate Holdings L.L.C., is the borrower under the senior secured credit facilities. The revolving credit facility includes borrowing capacity available for letters of credit and for short-term borrowings referred to as the swing line borrowings. In addition, the senior secured credit facilities also provide the borrower with the option to raise incremental credit facilities (including an uncommitted incremental facility that provides the borrower the option to increase the amount available under the term loan facilities and/or the revolving credit facility by an aggregate of up to $350.0 million, subject to additional increases upon achievement of a consolidated first lien net leverage ratio of less than or equal to 6.00 to 1.00 (or, after the first anniversary of the closing date, 5.75 to 1.00)), refinance the loans with debt incurred outside the credit agreement and extend the maturity date of the revolving credit facility and term loans, subject to certain limitations.
In June 2014 and September 2014, we made voluntary prepayments of $80.0 million and $75 million, respectively, on the term loan facility. As of September 30, 2014, we had $5.7 million outstanding in a letter of credit through our revolving credit facility, with $244.3 million available under our revolving credit facility.
Interest rate and fees
Borrowings under the term loans bear interest, at the borrower’s option, at a rate equal to a margin over either (a) a base rate determined by reference to the highest of (1) the administrative agent’s prime lending rate, (2) the federal funds effective rate plus 1/2 of 1.00% and (3) the LIBOR rate for a one-month interest period plus 1.00% or (b) a LIBOR rate determined by reference to the Reuters LIBOR rate for the interest period relevant to such borrowing. The margin for the term loans is 2.00%, in the case of base rate loans, and 3.00% in the case of LIBOR rate loans, subject to one step-down of 0.25% upon the achievement of a consolidated first lien net leverage ratio (as defined in the credit agreement) of less than or equal to 4.50 to 1.00, subject to a base rate floor of 2.00%, and a LIBOR floor of 1.00%.
Borrowings under the revolving credit facility bear interest, at the borrower’s option, at a rate equal to a margin over either (a) a base rate determined by reference to the highest of (1) the administrative agent’s prime lending rate, (2) the federal funds effective rate plus 1/2 of 1.00% and (3) the LIBOR rate for a one-month interest period plus 1.00% or (b) a LIBOR rate determined by reference to the Reuters LIBOR rate for the interest period relevant to such borrowing. The
170
Table of Contents
margin for the revolving credit facility is 1.50%, in the case of base rate loans, and 2.50%, in the case of LIBOR rate loans, subject to three step-downs of 0.25% each upon the achievement of a consolidated first lien net leverage ratio of less than or equal to 5.00 to 1.00, 4.50 to 1.00 and 4.00 to 1.00, respectively.
In addition, the borrower is required to pay a commitment fee to the lenders under the revolving credit facility in respect of the unutilized commitments thereunder. The commitment fee rate is 0.50% per annum subject to a step-down to 0.375%, upon achievement of a consolidated first lien net leverage ratio of less than or equal to 5.00 to 1.00. The borrower is also required to pay customary letter of credit fees.
The borrower incurred a ticking fee of approximately $1.8 million for the period between the date the allocations were notified to the lenders, February 21, 2014, and the closing date of April 14, 2014.
Prepayments
The senior secured term loan facility requires us to prepay outstanding term loans, subject to certain exceptions, with:
| • | 50% (which percentage will be reduced to 25% and 0%, as applicable, subject to achievement of a consolidated first lien net leverage ratio of less than or equal to 5.25 to 1.00 and 4.00 to 1.00, respectively) of annual excess cash flow, calculated in accordance with the credit agreement; |
| • | 100% of the net cash proceeds (including insurance and condemnation proceeds) of all non-ordinary course asset sales or other dispositions of property by the borrower and its restricted subsidiaries, subject to de minimis thresholds, if those net cash proceeds are not reinvested in assets to be used in the borrower’s business or to make certain other permitted investments (a) within 12 months of the receipt of such net cash proceeds or (b) if the borrower commits to reinvest such net cash proceeds within 12 months of the receipt thereof, within 180 days of the date of such commitment; and |
| • | 100% of the net proceeds of any incurrence of debt by the borrower or any of its restricted subsidiaries, other than debt permitted to be incurred or issued under the senior secured credit facilities. |
Each lender of term loans has the right to reject its pro rata share of mandatory prepayments described above, in which case we may retain the amounts so rejected.
The foregoing mandatory prepayments are applied to installments of term loans in direct order of maturity.
The borrower has the ability to voluntarily repay outstanding loans at any time without premium or penalty, other than a prepayment premium of 1.0% on the voluntary prepayment of term loans in connection with a repricing transaction on or prior to the date which is six months after the closing of the senior secured credit facilities and customary “breakage” costs with respect to LIBOR loans.
Amortization
The borrower is required to repay installments on the term loans in quarterly installments equal to 0.25% of the original principal amount of the term loans, with the remaining amount payable on the applicable maturity date with respect to the term loans.
171
Table of Contents
Guarantees and security
The obligations under the senior secured credit facilities will be unconditionally and irrevocably guaranteed by each of the Issuer, any subsidiary of the Issuer that directly or indirectly owns any issued and outstanding equity interests of the borrower, and, subject to certain exceptions, each of the borrower’s existing and future material domestic wholly owned subsidiaries (collectively referred to as the “credit agreement guarantors”). In addition, the senior secured credit facilities are collateralized by first priority or equivalent security interests in (i) all the capital stock of, or other equity interests in, the borrower and each of the borrower’s and guarantors’ material direct or indirect wholly owned restricted domestic subsidiaries and 65% of the voting stock (and 100% of the non-voting stock) of, or other equity interests in, each of the borrower’s or any subsidiary guarantors’ material direct wholly owned first-tier restricted foreign subsidiaries and (ii) certain tangible and intangible assets of the borrower (other than real property except for certain real property described in the credit agreement) and those of the credit agreement guarantors (subject to certain exceptions and qualifications).
As of the closing date for the senior secured credit facilities, we do not expect any of our foreign subsidiaries, our non-wholly owned domestic subsidiaries that are restricted subsidiaries or our immaterial subsidiaries to guarantee the senior secured credit facilities. The borrower also has the ability to designate certain subsidiaries as unrestricted subsidiaries utilizing its investment capacity under the credit agreement.
Certain covenants and events of default
The senior secured credit facilities contain a number of significant affirmative and negative covenants and customary events of default. Such covenants, among other things, limit or restrict, subject to certain exceptions, the ability of (i) La Quinta Holdings Inc., the direct parent of the borrower, to engage in any material operating or business activities other than the ownership of the equity interests of the borrower and (ii) the borrower and its restricted subsidiaries to:
| • | incur additional indebtedness and make guarantees; |
| • | create liens on assets; |
| • | enter into sale and leaseback transactions; |
| • | engage in mergers or consolidations; |
| • | sell assets; |
| • | make fundamental changes; |
| • | pay dividends and distributions or repurchase our capital stock; |
| • | make investments, loans and advances, including acquisitions; |
| • | engage in certain transactions with affiliates; |
| • | make changes in the nature of their business; and |
| • | make prepayments of junior debt. |
In addition, if, on the last day of any period of four consecutive quarters on or after June 30, 2014, the aggregate principal amount of revolving credit loans, swing line loans and/or letters of
172
Table of Contents
credit (excluding up to $20 million of letters of credit and certain other letters of credit that have been cash collateralized or back-stopped) that are issued and/or outstanding is greater than 25% of the revolving credit facility, the credit agreement requires the borrower to maintain a consolidated first lien net leverage ratio not to exceed 8.0 to 1.0.
During the period in which the rating with respect to the senior secured credit facilities is equal to or higher than Baa3 (or the equivalent) according to Moody’s Investors Service, Inc. or BBB- (or the equivalent) according to Standard & Poor’s Ratings Services and no default has occurred and is continuing, the restrictions in the senior secured credit facilities regarding incurring additional indebtedness, dividends and distributions or repurchases of capital stock and transactions with affiliates will not apply to the borrower and its restricted subsidiaries during such period.
Our senior secured credit facilities also contain certain customary representations and warranties, affirmative covenants and events of default. If an event of default occurs, the lenders under the senior secured credit facilities will be entitled to take various actions, including the acceleration of amounts due under the senior secured credit facilities and all actions permitted to be taken by a secured creditor.
Term facility interest rate swap
On April 14, 2014, the borrower entered into an interest rate swap agreement with an aggregate notional amount of $850.0 million that expires on April 14, 2019. This agreement swaps the LIBOR rate in effect under the term loan facility for this portion of the loan to a fixed-rate of 2.0311%, which includes the 1% LIBOR floor. Management has elected to designate this interest rate swap as a cash flow hedge for accounting purposes.
Letters of credit
In April 2014, we obtained letters of credit through our revolving credit facility aggregating to approximately $5.7 million. We are required to pay a fee of 2.63% per annum related to this letter of credit.
173
Table of Contents
The following is a description of the material terms of, and is qualified in its entirety by, our amended and restated certificate of incorporation and amended and restated bylaws, each as in effect as of the date of this prospectus, copies of which are filed as exhibits to the registration statement of which this prospectus forms a part. Under “Description of capital stock,” “we,” “us,” “our,” and “our company” refer to La Quinta Holdings Inc. and not to any of its subsidiaries.
Our purpose is to engage in any lawful act or activity for which corporations may now or hereafter be organized under the General Corporation Law of the State of Delaware, or DGCL. Our authorized capital stock consists of 2,000,000,000 shares of common stock, par value $0.01 per share, and 100,000,000 shares of preferred stock, par value $0.01 per share. Unless our board of directors determines otherwise, we will issue all shares of our capital stock in uncertificated form.
Common stock
Holders of our common stock are entitled to one vote for each share held of record on all matters on which stockholders are entitled to vote generally, including the election or removal of directors. The holders of our common stock do not have cumulative voting rights in the election of directors.
Upon our liquidation, dissolution or winding up and after payment in full of all amounts required to be paid to creditors and to the holders of preferred stock having liquidation preferences, if any, the holders of our common stock will be entitled to receive pro rata our remaining assets available for distribution. All shares of our common stock that will be outstanding at the time of the completion of any offering to which this prospectus relates will be fully paid and non-assessable. The common stock will not be subject to further calls or assessment by us. Holders of our common stock do not have preemptive, subscription, redemption or conversion rights. There will be no redemption or sinking fund provisions applicable to the common stock. The rights, powers, preferences and privileges of holders of our common stock will be subject to those of the holders of any shares of our preferred stock or any other series or class of stock we may authorize and issue in the future.
Preferred stock
As of the date of this prospectus, we had no shares of preferred stock issued or outstanding. Our amended and restated certificate of incorporation authorizes our board of directors to establish one or more series of preferred stock (including convertible preferred stock). Unless required by law or any stock exchange, the authorized shares of preferred stock will be available for issuance without further action by the holders of our common stock. Our board of directors is able to determine, with respect to any series of preferred stock, the powers (including voting powers), preferences and relative, participating, optional or other special rights, and the qualifications, limitations or restrictions thereof, including, without limitation:
| • | the designation of the series; |
| • | the number of shares of the series, which our board of directors may, except where otherwise provided in the preferred stock designation, increase (but not above the total number of authorized shares of the class) or decrease (but not below the number of shares then outstanding); |
174
Table of Contents
| • | whether dividends, if any, will be cumulative or non-cumulative and the dividend rate of the series; |
| • | the dates at which dividends, if any, will be payable; |
| • | the redemption rights and price or prices, if any, for shares of the series; |
| • | the terms and amounts of any sinking fund provided for the purchase or redemption of shares of the series; |
| • | the amounts payable on shares of the series in the event of any voluntary or involuntary liquidation, dissolution or winding-up of the affairs of the Company; |
| • | whether the shares of the series will be convertible into shares of any other class or series, or any other security, of the Company or any other entity, and, if so, the specification of the other class or series or other security, the conversion price or prices or rate or rates, any rate adjustments, the date or dates as of which the shares will be convertible and all other terms and conditions upon which the conversion may be made; |
| • | restrictions on the issuance of shares of the same series or of any other class or series; and |
| • | the voting rights, if any, of the holders of the series. |
We could issue a series of preferred stock that could, depending on the terms of the series, impede or discourage an acquisition attempt or other transaction that some, or a majority, of the holders of our common stock might believe to be in their best interests or in which the holders of our common stock might receive a premium over the market price of the common stock. Additionally, the issuance of preferred stock may adversely affect the holders of our common stock by restricting dividends on the common stock, diluting the voting power of the common stock or subordinating the liquidation rights of the common stock. As a result of these or other factors, the issuance of preferred stock could have an adverse impact on the market price of our common stock.
Dividends
The DGCL permits a corporation to declare and pay dividends out of “surplus” or, if there is no “surplus,” out of its net profits for the fiscal year in which the dividend is declared and/or the preceding fiscal year. “Surplus” is defined as the excess of the net assets of the corporation over the amount determined to be the capital of the corporation by its board of directors. The capital of the corporation is typically calculated to be (and cannot be less than) the aggregate par value of all issued shares of capital stock. Net assets equals the fair value of the total assets minus total liabilities. The DGCL also provides that dividends may not be paid out of net profits if, after the payment of the dividend, remaining capital would be less than the capital represented by the outstanding stock of all classes having a preference upon the distribution of assets.
Declaration and payment of any dividend will be subject to the discretion of our board of directors.
175
Table of Contents
Stockholder meetings
Our amended and restated certificate of incorporation and amended and restated bylaws provide that annual stockholder meetings will be held at a date, time and place, if any, as exclusively selected by our board of directors. Our amended and restated bylaws provide that special meetings of the stockholders may be called only by or at the direction of the board of directors, the chairman of our board or the chief executive officer, upon the request of holders of not less than a majority of the total voting power of all the then outstanding shares of our capital stock. To the extent permitted under applicable law, we may conduct meetings by remote communications, including by webcast.
Anti-takeover effects of our amended and restated certificate of incorporation and amended and restated bylaws and certain provisions of Delaware law
Undesignated preferred stock
The ability to authorize undesignated preferred stock will make it possible for our board of directors to issue preferred stock with super majority voting, special approval, dividend or other rights or preferences on a discriminatory basis that could impede the success of any attempt to acquire us or otherwise effect a change in control of us. These and other provisions may have the effect of deferring, delaying or discouraging hostile takeovers, or changes in control or management of our company.
We do not have a stockholder rights plan or any series of preferred stock designated in connection with such a plan, and if our board of directors were ever to adopt a stockholder rights plan in the future without prior stockholder approval, our board of directors would either submit the plan to stockholders for ratification or cause the rights plan to expire within one year.
Requirements for advance notification of stockholder meetings, nominations and proposals
Our amended and restated bylaws establish advance notice procedures with respect to stockholder proposals and the nomination of candidates for election as directors, other than nominations made by or at the direction of the board of directors or a committee of the board of directors. For any matter to be “properly brought” before a meeting, a stockholder will have to comply with advance notice requirements and provide us with certain information. Additionally, vacancies and newly created directorships may be filled only by a vote of a majority of the directors then in office, even though less than a quorum, and not by the stockholders. Our amended and restated bylaws allow the presiding officer at a meeting of the stockholders to adopt rules and regulations for the conduct of meetings which may have the effect of precluding the conduct of certain business at a meeting if the rules and regulations are not followed. These provisions may also defer, delay or discourage a potential acquirer from conducting a solicitation of proxies to elect the acquirer’s own slate of directors or otherwise attempting to influence or obtain control of our company.
Our amended and restated certificate of incorporation provides that the board of directors is expressly authorized to make, alter, or repeal our amended and restated bylaws and that our stockholders may only amend our amended and restated bylaws with the approval of 80% or more of all of the outstanding shares of our capital stock entitled to vote.
176
Table of Contents
No cumulative voting
The DGCL provides that stockholders are not entitled to the right to cumulate votes in the election of directors unless our amended and restated certificate of incorporation provides otherwise. Our amended and restated certificate of incorporation does not provide for cumulative voting.
Stockholder action by written consent
Pursuant to Section 228 of the DGCL, any action required to be taken at any annual or special meeting of the stockholders may be taken without a meeting, without prior notice and without a vote if a consent or consents in writing, setting forth the action so taken, is signed by the holders of outstanding stock having not less than the minimum number of votes that would be necessary to authorize or take such action at a meeting at which all shares of our stock entitled to vote thereon were present and voted, unless the company’s certificate of incorporation provides otherwise. Our amended and restated certificate of incorporation provides that from and after the date on which the parties to our stockholders’ agreement cease to beneficially own at least 40% of the total voting power of all the then outstanding shares of our capital stock, any action required or permitted to be taken by our stockholders may not be effected by consent in writing by stockholders unless such action is recommended in advance by all directors then in office.
Delaware anti-takeover statute
We have opted out of Section 203 of the DGCL. Section 203 provides that, subject to certain exceptions specified in the law, a publicly-held Delaware corporation shall not engage in certain “business combinations” with any “interested stockholder” for a three-year period after the date of the transaction in which the person became an interested stockholder. These provisions generally prohibit or delay the accomplishment of mergers, assets or stock sales or other takeover or change-in-control attempts that are not approved by a company’s board of directors.
However, our amended and restated certificate of incorporation and amended and restated bylaws provide that in the event the parties to our stockholders’ agreement cease to beneficially own at least 5% of the then outstanding shares of our common stock, we will automatically become subject to Section 203 of the DGCL. In general, Section 203 prohibits a publicly-held Delaware corporation from engaging, under certain circumstances, in a business combination with an interested stockholder for a period of three years following the date the person became an interested stockholder unless:
| • | prior to the date of the transaction, the board of directors of the corporation approved either the business combination or the transaction that resulted in the stockholder becoming an interested stockholder; |
| • | upon completion of the transaction that resulted in the stockholder becoming an interested stockholder, the stockholder owned at least 85% of the voting stock of the corporation outstanding at the time the transaction commenced, excluding for purposes of determining the number of shares outstanding (1) shares owned by persons who are directors and also officers and (2) shares owned by employee stock plans in which employee participants do not have the right to determine confidentially whether shares held subject to the plan will be tendered in a tender or exchange offer; or |
177
Table of Contents
| • | on or subsequent to the date of the transaction, the business combination is approved by the board and authorized at an annual or special meeting of stockholders, and not by written consent, by the affirmative vote of at least 66 2/3% of the outstanding voting stock which is not owned by the interested stockholder. |
Generally, a business combination includes a merger, asset or stock sale, or other transaction resulting in a financial benefit to the interested stockholder. An interested stockholder is a person who, together with affiliates and associates, owns or, within three years prior to the determination of interested stockholder status, did own 15% or more of a corporation’s outstanding voting stock.
Under certain circumstances, Section 203 makes it more difficult for a person who would be an “interested stockholder” to effect various business combinations with a corporation for a three-year period. Accordingly, Section 203 could have an anti-takeover effect with respect to certain transactions our board of directors does not approve in advance. The provisions of Section 203 may encourage companies interested in acquiring the Company to negotiate in advance with our board of directors because the stockholder approval requirement would be avoided if our board of directors approves either the business combination or the transaction that results in the stockholder becoming an interested stockholder. However, Section 203 also could discourage attempts that might result in a premium over the market price for the shares of common stock held by stockholders. These provisions also may make it more difficult to accomplish transactions that stockholders may otherwise deem to be in their best interests.
Dissenters’ rights of appraisal and payment
Under the DGCL, with certain exceptions, our stockholders will have appraisal rights in connection with a merger or consolidation of our company. Pursuant to the DGCL, stockholders who properly request and perfect appraisal rights in connection with such merger or consolidation will have the right to receive payment of the fair value of their shares as determined by the Delaware Court of Chancery.
Stockholders’ derivative actions
Under the DGCL, any of our stockholders may bring an action in our name to procure a judgment in our favor, also known as a derivative action, provided that the stockholder bringing the action is a holder of our shares at the time of the transaction to which the action relates or such stockholder’s stock thereafter devolved by operation of law.
Exclusive forum
Our amended and restated certificate of incorporation provides that unless we consent to the selection of an alternative forum, the Court of Chancery of the State of Delaware shall be the sole and exclusive forum for any (i) derivative action or proceeding brought on behalf, to the fullest extent permitted by law, of our company, (ii) action asserting a claim of breach of a fiduciary duty owed by any director or officer of our company to our company or our stockholders, (iii) action asserting a claim against our company or any director or officer of our company arising pursuant to any provision of the DGCL or our amended and restated certificate of incorporation or our amended and restated bylaws, or (iv) action asserting a claim against our company or any director or officer of our company governed by the internal affairs doctrine, in
178
Table of Contents
each such case subject to said Court of Chancery having personal jurisdiction over the indispensable parties named as defendants therein. Any person or entity purchasing or otherwise acquiring any interest in shares of capital stock of our company shall be deemed to have notice of and consented to the forum provisions in our amended and restated certificate of incorporation. However, it is possible that a court could find our forum selection provision to be inapplicable or unenforceable.
Conflicts of interest
Delaware law permits corporations to adopt provisions renouncing any interest or expectancy in certain opportunities that are presented to the corporation or its officers, directors or stockholders, and certain of our directors are, and our directors may in the future be, engaged in the hospitality industry. Our amended and restated certificate of incorporation, to the maximum extent permitted from time to time by Delaware law, renounces any interest or expectancy that we have in, or right to be offered an opportunity to participate in, specified business opportunities that are from time to time presented to our officers, directors or stockholders or their respective affiliates, other than those officers, directors, stockholders or affiliates who are our or our subsidiaries’ employees. Our amended and restated certificate of incorporation provide that, to the fullest extent permitted by law, none of Blackstone or any director who is not employed by us (including any non-employee director who serves as one of our officers in both his director and officer capacities) or his or her affiliates will have any duty to refrain from (i) engaging in a corporate opportunity in the same or similar lines of business in which we or our affiliates now engage or propose to engage or (ii) otherwise competing with us or our affiliates. In addition, to the fullest extent permitted by law, in the event that Blackstone or any non-employee director acquires knowledge of a potential transaction or other business opportunity which may be a corporate opportunity for itself or himself or its or his affiliates or for us or our affiliates, such person will have no duty to communicate or offer such transaction or business opportunity to us or any of our affiliates and they may take any such opportunity for themselves or offer it to another person or entity. Our amended and restated certificate of incorporation does not renounce our interest in any business opportunity that is expressly offered to a non-employee director solely in his or her capacity as a director or officer of the Company. To the fullest extent permitted by law, no business opportunity will be deemed to be a potential corporate opportunity for us unless we would be permitted to undertake the opportunity under our amended and restated certificate of incorporation, we have sufficient financial resources to undertake the opportunity and the opportunity would be in line with our business.
Limitations on liability and indemnification of officers and directors
The DGCL authorizes corporations to limit or eliminate the personal liability of directors to corporations and their stockholders for monetary damages for breaches of directors’ fiduciary duties, subject to certain exceptions. Our amended and restated certificate of incorporation includes a provision that eliminates the personal liability of directors for monetary damages for any breach of fiduciary duty as a director, except to the extent such exemption from liability or limitation thereof is not permitted under the DGCL. The effect of these provisions is to eliminate the rights of us and our stockholders, through stockholders’ derivative suits on our behalf, to recover monetary damages from a director for breach of fiduciary duty as a director, including breaches resulting from grossly negligent behavior. However, exculpation does not apply to any director if the director has acted in bad faith, knowingly or intentionally violated the law, authorized illegal dividends or redemptions or derived an improper benefit from his or her actions as a director.
179
Table of Contents
Our amended and restated bylaws provide that we must indemnify and advance expenses to our directors and officers to the fullest extent authorized by the DGCL. We also are expressly authorized to carry directors’ and officers’ liability insurance providing indemnification for our directors, officers and certain employees for some liabilities. We believe that these indemnification and advancement provisions and insurance are useful to attract and retain qualified directors and executive officers.
The limitation of liability, indemnification and advancement provisions in our amended and restated certificate of incorporation and amended and restated bylaws may discourage stockholders from bringing a lawsuit against directors for breach of their fiduciary duty. These provisions also may have the effect of reducing the likelihood of derivative litigation against directors and officers, even though such an action, if successful, might otherwise benefit us and our stockholders. In addition, your investment may be adversely affected to the extent we pay the costs of settlement and damage awards against directors and officers pursuant to these indemnification provisions.
There is currently no pending material litigation or proceeding involving any of our directors, officers or employees for which indemnification is sought.
Indemnification agreements
We have entered into indemnification agreements with each of our directors and executive officers as described in “Certain relationships and related party transactions—Indemnification agreements.” Insofar as indemnification for liabilities arising under the Securities Act may be permitted to directors or executive officers, we have been informed that in the opinion of the SEC such indemnification is against public policy and is therefore unenforceable.
Transfer agent and registrar
The transfer agent and registrar for shares of our common stock is Computershare Trust Company, N.A.
Listing
Our common stock is listed on the NYSE under the symbol “LQ.”
180
Table of Contents
Shares eligible for future sale
We cannot predict the effect, if any, future sales of shares of common stock, or the availability for future sale of shares of common stock, will have on the market price of shares of our common stock prevailing from time to time. The sale of substantial amounts of shares of our common stock in the public market, or the perception that such sales could occur, could harm the prevailing market price of shares of our common stock and could impair our future ability to raise capital through the sale of our equity or equity-related securities at a time and price that we deem appropriate. See “Risk factors—Risks related to this offering and ownership of our common stock—Future issuances of common stock by us, and the availability for resale of shares held by our pre-IPO owners, could cause the market price of our common stock to decline.”
As of November 13, 2014, we had a total of 130,722,563 shares of our common stock outstanding. Of the outstanding shares, the shares sold in the IPO and in this offering will be freely tradable without restriction or further registration under the Securities Act, except that any shares held by our affiliates, as that term is defined under Rule 144 of the Securities Act, may be sold only in compliance with the limitations described below. The remaining outstanding 65,128,185 shares of common stock held by our pre-IPO owners after this offering will be deemed restricted securities under the meaning of Rule 144 and may be sold in the public market only if registered or if they qualify for an exemption from registration, including the exemptions pursuant to Rule 144, which we summarize below.
In addition, a total of 13,000,000 shares of our common stock was reserved for issuance under our 2014 Omnibus Incentive Plan, of which 11,606,875 shares of common stock remain available for future issuance at November 13, 2014 (which amount includes shares issuable upon settlement of time-vesting restricted stock units and performance-vesting restricted stock). We filed a registration statement on Form S-8 under the Securities Act to register shares of our common stock or securities convertible into or exchangeable for shares of common stock issued pursuant to our 2014 Omnibus Incentive Plan. Accordingly, subject to applicable vesting restrictions or lock-up restrictions (described below), shares registered under such registration statement will be available for sale in the open market.
Registration rights
In connection with the IPO, we entered into a registration rights agreement that provides Blackstone an unlimited number of “demand” registrations and customary “piggyback” registration rights. The registration rights agreement also provides that we will pay certain expenses relating to such registrations and indemnify the registration rights holders against certain liabilities which may arise under the Securities Act. Securities registered under any such registration statement will be available for sale in the open market unless restrictions apply. See “Certain relationships and related party transactions—Registration rights agreement.” This offering is being made pursuant to the registration rights agreement.
10b5-1 plans
Some of our employees, including our executive officers, have entered into or intend to enter into trading plans pursuant to Rule 10b5-1 under the Exchange Act regarding sales of shares of our common stock. These plans permit the automatic trading of our common stock by an independent person (such as a stockbroker) who is not aware of material, nonpublic information at the time of the trade. Sales of shares by our executive officers under plans that were established prior to the execution of the 90-day lock-up agreements described below may be made during the 90-day lock-up period.
181
Table of Contents
Lock-up agreements
We will agree with the underwriters, subject to certain exceptions, that we will not offer, sell, contract to sell, pledge or otherwise dispose of, directly or indirectly, or file with the SEC a registration statement under the Securities Act relating to, any shares of our common stock or securities convertible into or exchangeable or exercisable for any shares of our common stock, or publicly disclose the intention to make any such offer, sale, pledge, disposition or filing, without the prior written consent of J.P. Morgan Securities LLC and Morgan Stanley & Co. LLC for a period starting on the date of the prospectus and continuing for 90 days following the date of this prospectus. However, in the event that either (1) during the last 17 days of the lock-up period, we issue an earnings release or material news or a material event relating to us occurs or (2) prior to the expiration of the lock-up period, we announce that we will release earnings results or become aware that material news or a material event will occur during the 16-day period beginning on the last day of the lock-up period, then in either case the expiration of the lock-up will be extended until the expiration of the 18-day period beginning on the issuance of the earnings release or the occurrence of the material news or material event, unless J.P. Morgan Securities LLC and Morgan Stanley & Co. LLC waive, in writing, such an extension.
Our executive officers and directors and Blackstone, which includes the selling stockholders, will sign lock-up agreements with the underwriters providing, subject to certain exceptions, that they will not offer, sell, contract to sell, pledge or otherwise dispose of, directly or indirectly, any shares of our common stock or securities convertible into or exchangeable or exercisable for any shares of our common stock, enter into a transaction that would have the same effect, or enter into any swap, hedge or other arrangement that transfers, in whole or in part, any of the economic consequences of ownership of our common stock, whether any of these transactions are to be settled by delivery of our common stock or other securities, in cash or otherwise, or publicly disclose the intention to make any such offer, sale, pledge or disposition, or to enter into any transaction, swap, hedge or other arrangement, without, in each case, the prior written consent of J.P. Morgan Securities LLC and Morgan Stanley & Co. LLC for a period starting on the date of the prospectus and continuing for 90 days following the date of this prospectus. However, in the event that either (1) during the last 17 days of the lock-up period, we issue an earnings release or material news or a material event relating to us occurs or (2) prior to the expiration of the lock-up period, we announce that we will release earnings results or become aware that material news or a material event will occur during the 16-day period beginning on the last day of the lock-up period, then in either case the expiration of the lock-up will be extended until the expiration of the 18-day period beginning on the issuance of the earnings release or the occurrence of the material news or material event, unless J.P. Morgan Securities LLC and Morgan Stanley & Co. LLC waive, in writing, such an extension.
Rule 144
In general, under Rule 144, as currently in effect, a person who is not deemed to be our affiliate for purposes of Rule 144 or to have been one of our affiliates at any time during the three months preceding a sale and who has beneficially owned the shares of common stock proposed to be sold for at least six months, including the holding period of any prior owner other than our affiliates, is entitled to sell those shares of common stock without complying with the manner of sale, volume limitation or notice provisions of Rule 144, subject to compliance with the public information requirements of Rule 144. If such a person has beneficially owned the shares of common stock proposed to be sold for at least one year, including the holding period of any
182
Table of Contents
prior owner other than our affiliates, then that person is entitled to sell those shares of common stock without complying with any of the requirements of Rule 144. In general, six months after the effective date of the registration statement of which this prospectus forms a part, under Rule 144, as currently in effect, our affiliates or persons selling shares of common stock on behalf of our affiliates are entitled to sell, within any three-month period, a number of shares of common stock that does not exceed the greater of (1) 1% of the number of shares of common stock then outstanding and (2) the average weekly trading volume of the shares of common stock during the four calendar weeks preceding the filing of a notice on Form 144 with respect to that sale. Sales under Rule 144 by our affiliates or persons selling shares of common stock on behalf of our affiliates are also subject to certain manner of sale provisions and notice requirements and to the availability of current public information about us.
183
Table of Contents
Certain United States federal income and estate tax consequences to non-U.S. holders
The following is a summary of certain United States federal income and estate tax consequences to a non-U.S. holder (as defined below) of the purchase, ownership and disposition of our common stock issued pursuant to this offering. Except where noted, this summary deals only with common stock that is held as a capital asset.
A “non-U.S. holder” means a person (other than a partnership) that is not for United States federal income tax purposes any of the following:
| • | an individual citizen or resident of the United States; |
| • | a corporation (or any other entity treated as a corporation for United States federal income tax purposes) created or organized in or under the laws of the United States, any state thereof or the District of Columbia; |
| • | an estate the income of which is subject to United States federal income taxation regardless of its source; or |
| • | a trust if it (1) is subject to the primary supervision of a court within the United States and one or more United States persons have the authority to control all substantial decisions of the trust or (2) has a valid election in effect under applicable United States Treasury regulations to be treated as a United States person. |
This summary is based upon provisions of the Internal Revenue Code of 1986, as amended (the “Code”), and regulations, rulings and judicial decisions as of the date hereof. Those authorities may be changed, perhaps retroactively, so as to result in United States federal income and estate tax consequences different from those summarized below. This summary does not address all aspects of United States federal income and estate taxes and does not deal with foreign, state, local or other tax considerations that may be relevant to non-U.S. holders in light of their particular circumstances. In addition, it does not represent a detailed description of the United States federal income tax consequences applicable to you if you are subject to special treatment under the United States federal income tax laws (including if you are a United States expatriate, “controlled foreign corporation,” “passive foreign investment company” or a partnership or other pass-through entity for United States federal income tax purposes). We cannot assure you that a change in law will not alter significantly the tax considerations that we describe in this summary.
If a partnership holds our common stock, the tax treatment of a partner will generally depend upon the status of the partner and the activities of the partnership. If you are a partner of a partnership holding our common stock, you should consult your tax advisors.
If you are considering the purchase of our common stock, you should consult your own tax advisors concerning the particular United States federal income and estate tax consequences to you of the ownership of the common stock, as well as the consequences to you arising under the laws of any other taxing jurisdiction or under any applicable income tax treaty.
184
Table of Contents
Dividends
If we make distributions of cash or property on our common stock, such distributions will constitute dividends for United States federal income tax purposes to the extent paid from our current or accumulated earnings and profits, as determined under United States federal income tax principles. Amounts not treated as dividends for United States federal income tax purposes will constitute a return of capital and first be applied against and reduce a non-U.S. holder’s adjusted tax basis in its common stock, but not below zero. Any excess will be treated as capital gain and will be treated as described below under “—Gain on disposition of common stock.”
Dividends paid to a non-U.S. holder of our common stock generally will be subject to withholding of United States federal income tax at a 30% rate or such lower rate as may be specified by an applicable income tax treaty. However, dividends that are effectively connected with the conduct of a trade or business by the non-U.S. holder within the United States (and, if required by an applicable income tax treaty, are attributable to a United States permanent establishment of the non-U.S. holder) are not subject to the withholding tax, provided certain certification and disclosure requirements are satisfied. Instead, such dividends are subject to United States federal income tax on a net income basis in the same manner as if the non-U.S. holder were a United States person as defined under the Code. Any such effectively connected dividends received by a foreign corporation may be subject to an additional “branch profits tax” at a 30% rate or such lower rate as may be specified by an applicable income tax treaty.
A non-U.S. holder of our common stock who wishes to claim the benefit of an applicable treaty rate for dividends will be required (a) to complete the applicable Internal Revenue Service Form W-8 and certify under penalty of perjury that such holder is not a United States person as defined under the Code and is eligible for treaty benefits or (b) if our common stock is held through certain foreign intermediaries, to satisfy the relevant certification requirements of applicable United States Treasury regulations. Special certification and other requirements apply to certain non-U.S. holders that are pass-through entities rather than corporations or individuals.
A non-U.S. holder of our common stock eligible for a reduced rate of United States withholding tax pursuant to an income tax treaty may obtain a refund of any excess amounts withheld by timely filing an appropriate claim for refund with the Internal Revenue Service.
Gain on disposition of common stock
Any gain realized on the disposition of our common stock generally will not be subject to United States federal income tax unless:
| • | the gain is effectively connected with a trade or business of the non-U.S. holder in the United States (and, if required by an applicable income tax treaty, is attributable to a United States permanent establishment of the non-U.S. holder); |
| • | the non-U.S. holder is an individual who is present in the United States for 183 days or more in the taxable year of that disposition, and certain other conditions are met; or |
| • | we are or have been a “United States real property holding corporation” for United States federal income tax purposes. |
Gain derived by a non-U.S. holder described in the first bullet point immediately above will be subject to United States federal income tax on a net income basis under regular graduated
185
Table of Contents
United States federal income tax rates. If a non-U.S. holder that is a foreign corporation falls under the first bullet point immediately above, it may also be subject to the branch profits tax equal to 30% of its effectively connected earnings and profits or at such lower rate as may be specified by an applicable income tax treaty. An individual non-U.S. holder described in the second bullet point immediately above will be subject to a flat 30% tax on the gain derived from the sale, which may be offset by United States source capital losses, even though the individual is not considered a resident of the United States.
We believe that we are currently a “United States real property holding corporation” for United States federal income tax purposes. So long as our common stock continues to be regularly traded on an established securities market (within the meaning of applicable United States Treasury regulations), only a non-U.S. holder who holds or held (at any time during the shorter of the five year period preceding the date of disposition or the holder’s holding period) more than 5% of our common stock will be subject to United States federal income tax on the disposition of our common stock.
Federal estate tax
Common stock held by an individual non-U.S. holder at the time of death will be included in such holder’s gross estate for United States federal estate tax purposes, unless an applicable estate tax treaty provides otherwise.
Information reporting and backup withholding
We must report annually to the Internal Revenue Service and to each non-U.S. holder the amount of dividends paid to such holder and the tax withheld with respect to such dividends, regardless of whether withholding was required. Copies of the information returns reporting such dividends and withholding may also be made available to the tax authorities in the country in which the non-U.S. holder resides under the provisions of an applicable income tax treaty.
A non-U.S. holder will be subject to backup withholding for dividends paid to such holder unless such holder certifies under penalty of perjury that it is a non-U.S. holder (such as by furnishing a valid IRS Form W-8BEN, W-8BEN-E or W-8ECI) and the payor does not have actual knowledge or reason to know that such holder is a United States person as defined under the Code, or such holder otherwise establishes an exemption.
Information reporting and, depending on the circumstances, backup withholding will apply to the proceeds of a sale of our common stock within the United States or conducted through certain United States-related financial intermediaries, unless the beneficial owner certifies under penalty of perjury that it is a non-U.S. holder (such as by furnishing a valid IRS Form W-8BEN, W-8BEN-E or W-8ECI) and the payor does not have actual knowledge or reason to know that the beneficial owner is a United States person as defined under the Code, or such owner otherwise establishes an exemption.
Backup withholding is not an additional tax. Any amounts withheld under the backup withholding rules may be allowed as a refund or a credit against a non-U.S. holder’s United States federal income tax liability provided the required information is timely furnished to the Internal Revenue Service.
186
Table of Contents
Additional withholding requirements
Under legislation enacted in 2010 and administrative guidance, a 30% United States federal withholding tax may apply to dividends and, beginning January 1, 2017, to the gross proceeds from a disposition of our common stock, in each case paid to (i) a “foreign financial institution” (as specifically defined in the legislation), whether such foreign financial institution is the beneficial owner or an intermediary, unless such foreign financial institution agrees to verify, report and disclose its United States “account” holders (as specifically defined in the legislation) and meets certain other specified requirements or (ii) a non-financial foreign entity, whether such non-financial foreign entity is the beneficial owner or an intermediary, unless such entity provides a certification that the beneficial owner of the payment does not have any substantial United States owners or provides the name, address and taxpayer identification number of each such substantial United States owner and certain other specified requirements are met. In certain cases, the relevant foreign financial institution or non-financial foreign entity may qualify for an exemption from, or be deemed to be in compliance with, these rules. You should consult your own tax advisor regarding this legislation and whether it may be relevant to your ownership and disposition of our common stock.
187
Table of Contents
We are offering the shares of common stock described in this prospectus through a number of underwriters. J.P. Morgan Securities LLC and Morgan Stanley & Co. LLC are acting as representatives of the underwriters. We and the selling stockholders have entered into an underwriting agreement with the underwriters. Subject to the terms and conditions of the underwriting agreement, the selling stockholders have agreed to sell to the underwriters, and each underwriter has severally agreed to purchase from the selling stockholders, at the public offering price less the underwriting discounts and commissions set forth on the cover page of this prospectus, the number of shares of common stock listed next to its name in the following table:
| Name | Number of shares |
|||
|
|
||||
| J.P. Morgan Securities LLC |
||||
| Morgan Stanley & Co. LLC |
||||
| Merrill Lynch, Pierce, Fenner & Smith Incorporated |
||||
| Citigroup Global Markets Inc. |
||||
| Credit Suisse Securities (USA) LLC |
||||
| Deutsche Bank Securities Inc |
||||
| Goldman, Sachs & Co. |
||||
| Wells Fargo Securities, LLC |
||||
| EA Markets Securities LLC |
||||
| Evercore Group L.L.C. |
||||
| JMP Securities LLC |
||||
| Lebenthal & Co., LLC |
||||
| Loop Capital Markets LLC |
||||
| Mischler Financial Group, Inc. |
||||
| Samuel A. Ramirez & Company, Inc. |
||||
| Raymond James & Associates, Inc. |
||||
| RBC Capital Markets, LLC |
||||
| Stifel, Nicolaus & Company, Incorporated |
||||
|
|
|
|||
| Total |
20,000,000 | |||
|
|
||||
The underwriters are committed to purchase all the common shares offered by the selling stockholders if they purchase any shares. The underwriting agreement also provides that if an underwriter defaults, the purchase commitments of non-defaulting underwriters may also be increased or the offering may be terminated. The offering of the shares by the underwriters is subject to receipt and acceptance and subject to the underwriters’ right to reject any order in whole or in part.
The underwriters propose to offer the common shares directly to the public at the public offering price set forth on the cover page of this prospectus and to certain dealers at that price less a concession not in excess of $ per share. After this offering, the offering price and other selling terms may be changed by the underwriters. Sales of shares made outside of the United States may be made by affiliates of the underwriters.
The underwriters have an option to buy up to 3,000,000 additional shares of common stock from the selling stockholders to cover sales of shares by the underwriters which exceed the number of
188
Table of Contents
shares specified in the table above. The underwriters have 30 days from the date of this prospectus to exercise this option to purchase additional shares. If any shares are purchased with this option, the underwriters will purchase shares in approximately the same proportion as shown in the table above. If any additional shares of common stock are purchased, the underwriters will offer the additional shares on the same terms as those on which the shares are being offered.
The underwriting fee is equal to the public offering price per share of common stock less the amount paid by the underwriters to the selling stockholders per share of common stock. The underwriting fee is $ per share. The following table shows the per share and total underwriting discounts and commissions to be paid to the underwriters assuming both no exercise and full exercise of the underwriters’ option to purchase additional shares.
| Without option exercise |
With full option exercise |
|||||||
|
|
||||||||
| Per Share |
$ | $ | ||||||
| Total |
$ | $ | ||||||
|
|
||||||||
Pursuant to the registration rights agreement entered into in connection with our IPO, we will pay certain expenses (other than underwriting discounts and commissions of the selling stockholders) in connection with this offering. The expenses of this offering that are payable by us are estimated to be approximately $1.3 million (excluding underwriting discounts and commissions), including approximately $15,000 in connection with the qualification of this offering with FINRA by counsel to the underwriters.
A prospectus in electronic format may be made available on the web sites maintained by one or more underwriters participating in the offering. The underwriters may agree to allocate a number of shares to underwriters for sale to their online brokerage account holders. Internet distributions will be allocated by the representatives to underwriters that may make Internet distributions on the same basis as other allocations.
We will agree with the underwriters, subject to certain exceptions, that we will not offer, sell, contract to sell, pledge or otherwise dispose of, directly or indirectly, or file with the SEC a registration statement under the Securities Act relating to, any shares of our common stock or securities convertible into or exchangeable or exercisable for any shares of our common stock, or publicly disclose the intention to make any such offer, sale, pledge, disposition or filing, without the prior written consent of J.P. Morgan Securities LLC and Morgan Stanley & Co. LLC for a period starting on the date of the prospectus and continuing for 90 days following the date of this prospectus. However, in the event that either (1) during the last 17 days of the lock-up period, we issue an earnings release or material news or a material event relating to us occurs or (2) prior to the expiration of the lock-up period, we announce that we will release earnings results or become aware that material news or a material event will occur during the 16-day period beginning on the last day of the lock-up period, then in either case the expiration of the lock-up will be extended until the expiration of the 18-day period beginning on the issuance of the earnings release or the occurrence of the material news or material event, unless J.P. Morgan Securities LLC and Morgan Stanley & Co. LLC waive, in writing, such an extension.
Our executive officers and directors and Blackstone, which includes the selling stockholders, will enter into lock-up agreements with the underwriters prior to the commencement of this offering pursuant to which each of these persons or entities, subject to certain exceptions, for a period
189
Table of Contents
starting on the date of the prospectus and continuing for 90 days following the date of this prospectus, may not, without the prior written consent of J.P. Morgan Securities LLC and Morgan Stanley & Co. LLC, offer, sell, contract to sell, pledge or otherwise dispose of, directly or indirectly, any shares of our common stock or securities convertible into or exchangeable or exercisable for any shares of our common stock, enter into a transaction that would have the same effect, or enter into any swap, hedge or other arrangement that transfers, in whole or in part, any of the economic consequences of ownership of our common stock, whether any of these transactions are to be settled by delivery of our common stock or other securities, in cash or otherwise, or publicly disclose the intention to make any such offer, sale, pledge or disposition, or to enter into any transaction, swap, hedge or other arrangement. However, in the event that either (1) during the last 17 days of the lock-up period, we issue an earnings release or material news or a material event relating to us occurs or (2) prior to the expiration of the lock-up period, we announce that we will release earnings results or become aware that material news or a material event will occur during the 16-day period beginning on the last day of the lock-up period, then in either case the expiration of the lock-up will be extended until the expiration of the 18-day period beginning on the issuance of the earnings release or the occurrence of the material news or material event, unless J.P. Morgan Securities LLC and Morgan Stanley & Co. LLC waive, in writing, such an extension.
We and the selling stockholders have agreed to indemnify the underwriters against certain liabilities, including liabilities under the Securities Act of 1933.
Our common stock is listed on the NYSE under the symbol “LQ”.
In connection with this offering, the underwriters may engage in stabilizing transactions, which involves making bids for, purchasing and selling shares of common stock in the open market for the purpose of preventing or retarding a decline in the market price of the common stock while this offering is in progress. These stabilizing transactions may include making short sales of the common stock, which involves the sale by the underwriters of a greater number of shares of common stock than they are required to purchase in this offering, and purchasing shares of common stock on the open market to cover positions created by short sales. Short sales may be “covered” shorts, which are short positions in an amount not greater than the underwriters’ option to purchase additional shares referred to above, or may be “naked” shorts, which are short positions in excess of that amount. The underwriters may close out any covered short position either by exercising their option to purchase additional shares, in whole or in part, or by purchasing shares in the open market. In making this determination, the underwriters will consider, among other things, the price of shares available for purchase in the open market compared to the price at which the underwriters may purchase shares through the option referred to above. A naked short position is more likely to be created if the underwriters are concerned that there may be downward pressure on the price of the common stock in the open market that could adversely affect investors who purchase in this offering. To the extent that the underwriters create a naked short position, they will purchase shares in the open market to cover the position.
The underwriters have advised us that, pursuant to Regulation M of the Securities Act of 1933, they may also engage in other activities that stabilize, maintain or otherwise affect the price of the common stock, including the imposition of penalty bids. This means that if the representatives of the underwriters purchase common stock in the open market in stabilizing transactions or to cover short sales, the representatives can require the underwriters that sold those shares as part of this offering to repay the underwriting discount received by them.
190
Table of Contents
These activities may have the effect of raising or maintaining the market price of the common stock or preventing or retarding a decline in the market price of the common stock, and, as a result, the price of the common stock may be higher than the price that otherwise might exist in the open market. If the underwriters commence these activities, they may discontinue them at any time. The underwriters may carry out these transactions on the NYSE, in the over-the-counter market or otherwise.
Neither we nor the underwriters can assure investors that the shares will trade in the public market at or above the public offering price listed on the cover of this prospectus.
Other than in the United States, no action has been taken by us or the underwriters that would permit a public offering of the securities offered by this prospectus in any jurisdiction where action for that purpose is required. The securities offered by this prospectus may not be offered or sold, directly or indirectly, nor may this prospectus or any other offering material or advertisements in connection with the offer and sale of any such securities be distributed or published in any jurisdiction, except under circumstances that will result in compliance with the applicable rules and regulations of that jurisdiction. Persons into whose possession this prospectus comes are advised to inform themselves about and to observe any restrictions relating to the offering and the distribution of this prospectus. This prospectus does not constitute an offer to sell or a solicitation of an offer to buy any securities offered by this prospectus in any jurisdiction in which such an offer or a solicitation is unlawful.
This document is only being distributed to and is only directed at (i) persons who are outside the United Kingdom or (ii) to investment professionals falling within Article 19(5) of the Financial Services and Markets Act 2000 (Financial Promotion) Order 2005 (the “Order”) or (iii) high net worth entities, and other persons to whom it may lawfully be communicated, falling with Article 49(2)(a) to (d) of the Order (all such persons together being referred to as “relevant persons”). The securities are only available to, and any invitation, offer or agreement to subscribe, purchase or otherwise acquire such securities will be engaged in only with, relevant persons. Any person who is not a relevant person should not act or rely on this document or any of its contents.
In relation to each Member State of the European Economic Area which has implemented the Prospectus Directive (each, a ‘‘Relevant Member State’’), from and including the date on which the European Union Prospectus Directive (the ‘‘EU Prospectus Directive’’) was implemented in that Relevant Member State (the ‘‘Relevant Implementation Date’’) an offer of securities described in this prospectus may not be made to the public in that Relevant Member State prior to the publication of a prospectus in relation to the shares which has been approved by the competent authority in that Relevant Member State or, where appropriate, approved in another Relevant Member State and notified to the competent authority in that Relevant Member State, all in accordance with the EU Prospectus Directive, except that, with effect from and including the Relevant Implementation Date, an offer of securities described in this prospectus may be made to the public in that Relevant Member State at any time:
| • | to any legal entity which is a qualified investor as defined under the EU Prospectus Directive; |
| • | to fewer than 100 or, if the Relevant Member State has implemented the relevant provision of the 2010 PD Amending Directive, 150 natural or legal persons (other than qualified investors as defined in the EU Prospectus Directive); or |
| • | in any other circumstances falling within Article 3(2) of the EU Prospectus Directive, provided that no such offer of securities described in this prospectus shall result in a requirement for the publication by us of a prospectus pursuant to Article 3 of the EU Prospectus Directive. |
191
Table of Contents
For the purposes of this provision, the expression an ‘‘offer of securities to the public’’ in relation to any securities in any Relevant Member State means the communication in any form and by any means of sufficient information on the terms of the offer and the securities to be offered so as to enable an investor to decide to purchase or subscribe for the securities, as the same may be varied in that Member State by any measure implementing the EU Prospectus Directive in that Member State. The expression “EU Prospectus Directive” means Directive 2003/71/EC (and any amendments thereto, including the 2010 PD Amending Directive, to the extent implemented in the Relevant Member State) and includes any relevant implementing measure in each Relevant Member State, and the expression “2010 PD Amending Directive” means Directive 2010/73/EU.
Other relationships
Certain of the underwriters and their affiliates have provided in the past to us and our affiliates and may provide from time to time in the future certain commercial banking, financial advisory, investment banking and other services for us and such affiliates in the ordinary course of their business, for which they have received and may continue to receive customary fees and commissions. For example, each of the underwriters acted as an underwriter in our IPO. In addition, an affiliate of J.P. Morgan Securities LLC is the administrative agent, collateral agent, swing line lender and letter of credit issuer under our senior secured credit facilities. In addition, J.P. Morgan Securities LLC, Morgan Stanley & Co. LLC, Merrill Lynch, Pierce, Fenner & Smith Incorporated, Citigroup Global Markets Inc., Credit Suisse Securities (USA) LLC, Deutsche Bank Securities Inc., Goldman, Sachs & Co. and Wells Fargo Securities, LLC and/or their respective affiliates were joint lead arrangers, joint bookrunners and lenders under our senior secured credit facilities. In addition, most recently, each of J.P. Morgan Securities LLC, Morgan Stanley & Co. LLC, Merrill Lynch, Pierce, Fenner & Smith Incorporated, Citigroup Capital Markets Inc., Credit Suisse Securities (USA) LLC, Deutsche Bank Securities Inc., Goldman, Sachs & Co. and Raymond James & Associates, Inc. or their respective affiliates acted as financial advisor and underwriter to our Sponsor in a variety of transactions including financings and loan originations, loan syndications, initial public offerings, secondary equity offerings, debt offerings and mergers and acquisitions, and, with respect to Morgan Stanley & Co. LLC and Raymond James & Associates, Inc. or their respective affiliates, distributions of funds; Wells Fargo Securities, LLC or its affiliates acted as broker, financial advisor and underwriter to our Sponsor in a variety of transactions, including property purchases and sales, financings and loan originations, loan syndications, initial public offerings, secondary equity offerings, debt offerings and mergers and acquisitions; RBC Capital Markets, LLC or its affiliates acted as financial advisor and underwriter to our Sponsor in a variety of transactions including financings and loan originations, loan syndications, initial public offerings, secondary equity offerings and debt offerings; and JMP Securities LLC or its affiliates acted as underwriter to our Sponsor in a secondary equity offering. In addition, from time to time, certain of the underwriters and their affiliates may effect transactions for their own account or the account of customers, and hold on behalf of themselves or their customers, long or short positions in our debt or equity securities or loans, and may do so in the future.
The underwriters have agreed to reimburse us for certain of our out-of-pocket expenses incurred in connection with this offering.
192
Table of Contents
The validity of the shares of common stock offered by this prospectus will be passed upon for us by Simpson Thacher & Bartlett LLP, New York, New York. Certain legal matters relating to this offering will be passed upon for the underwriters by Latham & Watkins LLP, New York, New York. An investment vehicle comprised of selected partners of Simpson Thacher & Bartlett LLP, members of their families, related persons and others owns an interest representing less than 1% of the capital commitments of funds affiliated with The Blackstone Group L.P.
The combined financial statements of the Predecessor Entities as of December 31, 2013 and 2012, and for each of the three years in the period ended December 31, 2013, included in this prospectus, have been audited by Deloitte & Touche LLP, an independent registered public accounting firm, as stated in their report appearing herein. Such combined financial statements have been so included in reliance upon the report of such firm given upon their authority as experts in accounting and auditing.
The combined financial statements of WIH La Quinta Inn Hotels as of December 31, 2013 and 2012, and for each of the three years in the period ended December 31, 2013 included in this prospectus have been audited by Deloitte & Touche LLP, independent auditors, as stated in their report herein, and are included in reliance upon the report of such firm given upon their authority as experts in accounting and auditing.
The balance sheet of La Quinta Holdings Inc. as of December 31, 2013 included in this prospectus has been audited by Deloitte & Touche LLP, an independent registered public accounting firm, as stated in their report appearing herein. Such balance sheet has been so included in reliance upon the report of such firm given upon their authority as experts in accounting and auditing.
193
Table of Contents
Where you can find more information
We have filed with the SEC a registration statement on Forms S-1 under the Securities Act with respect to the common stock offered by this prospectus. This prospectus is a part of the registration statement and does not contain all of the information set forth in the registration statement and its exhibits and schedules, portions of which have been omitted as permitted by the rules and regulations of the SEC. For further information about us and our common stock, you should refer to the registration statement and its exhibits and schedules.
We file annual, quarterly and special reports and other information with the SEC. Our filings with the SEC are available to the public on the SEC’s website at www.sec.gov. Those filings are also available to the public on, or accessible through, our website under the heading “Investor Relations” at www.lq.com. The information we file with the SEC or contained on or accessible through our corporate website or any other website that we may maintain is not part of this prospectus or the registration statement of which this prospectus is a part. You may also read and copy, at SEC prescribed rates, any document we file with the SEC, including the registration statement (and its exhibits) of which this prospectus is a part, at the SEC’s Public Reference Room located at 100 F Street, N.E., Washington D.C. 20549. You can call the SEC at 1-800-SEC-0330 to obtain information on the operation of the Public Reference Room.
194
Table of Contents
F-1
Table of Contents
Report of independent registered public accounting firm
To the Board of Directors and Members of
Lodge Holdco I L.L.C, Lodge Holdco II L.L.C, and Lodge Holdco III L.L.C.
Irving, Texas
We have audited the accompanying combined balance sheets of Lodge Holdco I L.L.C. and subsidiaries, Lodge Holdco II L.L.C. and subsidiaries and Lodge Holdco III L.L.C. and subsidiaries, (the “Company”), all of which are under common control, as of December 31, 2013 and 2012, and the related combined statements of operations, equity, and cash flows for each of the three years in the period ended December 31, 2013. These financial statements are the responsibility of the Company’s management. Our responsibility is to express an opinion on the financial statements based on our audits.
We conducted our audits in accordance with the standards of the Public Company Accounting Oversight Board (United States). Those standards require that we plan and perform the audit to obtain reasonable assurance about whether the financial statements are free of material misstatement. The Company is not required to have, nor were we engaged to perform, an audit of its internal control over financial reporting. Our audits included consideration of internal control over financial reporting as a basis for designing audit procedures that are appropriate in the circumstances, but not for the purpose of expressing an opinion on the effectiveness of the Company’s internal control over financial reporting. Accordingly, we express no such opinion. An audit also includes examining, on a test basis, evidence supporting the amounts and disclosures in the financial statements, assessing the accounting principles used and significant estimates made by management, as well as evaluating the overall financial statement presentation. We believe that our audits provide a reasonable basis for our opinion.
In our opinion, such combined financial statements present fairly, in all material respects, the financial position of Lodge Holdco I L.L.C. and subsidiaries, Lodge Holdco II L.L.C. and subsidiaries and Lodge Holdco III L.L.C. and subsidiaries at December 31, 2013 and 2012, and the results of their operations and their cash flows for each of the three years in the period ended December 31, 2013, in conformity with accounting principles generally accepted in the United States of America.
/s/ Deloitte & Touche LLP
Dallas, Texas
February 26, 2014
F-2
Table of Contents
La Quinta Predecessor Entities
As of December 31, 2013 and 2012
| (In thousands) | 2013 | 2012 | ||||||
|
|
||||||||
| Assets |
||||||||
| Current assets: |
||||||||
| Cash and cash equivalents |
$ | 33,412 | $ | 40,813 | ||||
| Restricted cash |
97,126 | 104,814 | ||||||
| Accounts receivable, net of allowance for doubtful accounts of $4,369 and $4,888 |
32,678 | 36,917 | ||||||
| Receivables from affiliates |
11,181 | 8,261 | ||||||
| Assets held for sale |
7,332 | — | ||||||
| Other current assets |
17,087 | 10,097 | ||||||
|
|
|
|||||||
| Total current assets |
198,816 | 200,902 | ||||||
|
|
|
|||||||
| Property and equipment, net of accumulated depreciation |
2,761,457 | 2,940,128 | ||||||
| Intangible assets, net of accumulated amortization |
179,486 | 180,913 | ||||||
| Deferred costs, net of accumulated amortization |
10,153 | 11,407 | ||||||
| Restricted cash |
6,900 | 8,593 | ||||||
| Deferred tax assets |
3,008 | 3,090 | ||||||
| Other non-current assets |
10,014 | 11,287 | ||||||
|
|
|
|||||||
| Total non-current assets |
2,971,018 | 3,155,418 | ||||||
|
|
|
|||||||
| Total assets |
$ | 3,169,834 | $ | 3,356,320 | ||||
|
|
|
|||||||
| Liabilities and equity |
||||||||
| Current liabilities: |
||||||||
| Current portion of long-term debt |
$ | 2,720,286 | $ | 61,292 | ||||
| Accounts payable |
30,490 | 33,784 | ||||||
| Accrued expenses and other liabilities |
53,571 | 53,381 | ||||||
| Accrued payroll and employee benefits |
26,302 | 29,867 | ||||||
| Accrued real estate taxes |
19,577 | 20,002 | ||||||
|
|
|
|||||||
| Total current liabilities |
2,850,226 | 198,326 | ||||||
|
|
|
|||||||
| Long-term debt |
— | 2,838,673 | ||||||
| Other long-term liabilities |
13,947 | 15,489 | ||||||
| Deferred tax liabilities |
408 | 447 | ||||||
|
|
|
|||||||
| Total liabilities |
2,864,581 | 3,052,935 | ||||||
|
|
|
|||||||
| Commitments and Contingencies |
— | — | ||||||
| Equity: |
||||||||
| Members’ equity |
319,096 | 315,255 | ||||||
| Noncontrolling interests |
(13,843 | ) | (11,870 | ) | ||||
|
|
|
|||||||
| Total equity |
305,253 | 303,385 | ||||||
|
|
|
|||||||
| Total liabilities and equity |
$ | 3,169,834 | $ | 3,356,320 | ||||
|
|
||||||||
The accompanying notes are an integral part of these combined financial statements.
F-3
Table of Contents
La Quinta Predecessor Entities
Combined statements of operations
For the years ended December 31, 2013, 2012 and 2011
| (In thousands) | 2013 | 2012 | 2011 | |||||||||
|
|
||||||||||||
| Revenues: |
||||||||||||
| Room revenues |
$ | 757,699 | $ | 714,143 | $ | 660,816 | ||||||
| Franchise and other fee-based revenues |
79,180 | 69,206 | 59,314 | |||||||||
| Other hotel revenues |
17,949 | 17,506 | 16,229 | |||||||||
|
|
|
|||||||||||
| 854,828 | 800,855 | 736,359 | ||||||||||
| Brand marketing fund revenues from franchise and managed properties |
19,065 | 17,157 | 15,182 | |||||||||
|
|
|
|||||||||||
| Total revenues |
873,893 | 818,012 | 751,541 | |||||||||
| Operating expenses: |
||||||||||||
| Direct lodging expenses |
344,515 | 334,394 | 330,205 | |||||||||
| Depreciation and amortization |
164,077 | 155,879 | 149,356 | |||||||||
| General and administrative expenses |
74,794 | 74,111 | 61,578 | |||||||||
| Other lodging and operating expenses |
56,068 | 58,266 | 47,791 | |||||||||
| Marketing, promotional and other advertising expenses |
59,193 | 48,610 | 45,580 | |||||||||
|
|
|
|||||||||||
| 698,647 | 671,260 | 634,510 | ||||||||||
| Brand marketing fund expenses from franchise and managed properties |
19,065 | 17,157 | 15,182 | |||||||||
|
|
|
|||||||||||
| Total operating expenses |
717,712 | 688,417 | 649,692 | |||||||||
|
|
|
|||||||||||
| Operating income |
156,181 | 129,595 | 101,849 | |||||||||
| Other income (expenses): |
||||||||||||
| Interest expense, net |
(148,615 | ) | (103,124 | ) | (51,611 | ) | ||||||
| Other income (loss) |
1,048 | (7,440 | ) | (662 | ) | |||||||
| Gain on extinguishment of debt, net |
— | 1,192 | 11,451 | |||||||||
|
|
|
|||||||||||
| Total other income (expenses) |
(147,567 | ) | (109,372 | ) | (40,822 | ) | ||||||
|
|
|
|||||||||||
| Income from continuing operations before income taxes |
8,614 | 20,223 | 61,027 | |||||||||
| Income tax expense |
(3,598 | ) | (3,135 | ) | (2,332 | ) | ||||||
|
|
|
|||||||||||
| Income from continuing operations, net of tax |
5,016 | 17,088 | 58,695 | |||||||||
| Gain (loss) on discontinued operations, net of tax |
(2,495 | ) | (52,852 | ) | 244 | |||||||
|
|
|
|||||||||||
| Net income (loss) |
2,521 | (35,764 | ) | 58,939 | ||||||||
| Loss from noncontrolling interests in continuing operations, net of tax |
1,455 | 4,810 | 4,574 | |||||||||
| Loss from noncontrolling interests in discontinued operations, net of tax |
— | — | — | |||||||||
|
|
|
|||||||||||
| Net loss attributable to noncontrolling interests |
1,455 | 4,810 | 4,574 | |||||||||
|
|
|
|||||||||||
| Amounts attributable to the company |
||||||||||||
| Income from continuing operations, net of tax |
6,471 | 21,898 | 63,269 | |||||||||
| Income (loss) from discontinued operations, net of tax |
(2,495 | ) | (52,852 | ) | 244 | |||||||
|
|
|
|||||||||||
| Net income (loss) attributable to the company |
$ | 3,976 | $ | (30,954 | ) | $ | 63,513 | |||||
|
|
|
|||||||||||
| Pro forma income from continuing operations data (unaudited): |
||||||||||||
| Income from continuing operations before provision for income taxes |
$ | 8,614 | $ | 20,223 | $ | 61,027 | ||||||
| Pro forma provision for income taxes |
3,446 | 8,089 | 24,411 | |||||||||
|
|
|
|||||||||||
| Pro forma income from continuing operations |
$ | 5,168 | $ | 12,134 | $ | 36,616 | ||||||
|
|
||||||||||||
The accompanying notes are an integral part of these combined financial statements.
F-4
Table of Contents
La Quinta Predecessor Entities
Combined statements of equity
For the years ended December 31, 2013, 2012 and 2011
| (In thousands) | Members’ equity |
Noncontrolling interests |
Total equity |
|||||||||
|
|
||||||||||||
| Balance as of January 1, 2011 |
$ | 41,096 | $ | (1,499 | ) | 39,597 | ||||||
| Net income (loss) |
63,513 | (4,574 | ) | 58,939 | ||||||||
| Capital contributions |
85,000 | — | 85,000 | |||||||||
| Distributions |
(24 | ) | (417 | ) | (441 | ) | ||||||
|
|
|
|||||||||||
| Balance as of December 31, 2011 |
$ | 189,585 | $ | (6,490 | ) | 183,095 | ||||||
|
|
|
|||||||||||
| Net loss |
(30,954 | ) | (4,810 | ) | (35,764 | ) | ||||||
| Capital contributions |
174,862 | — | 174,862 | |||||||||
| Distributions |
(18,238 | ) | (570 | ) | (18,808 | ) | ||||||
|
|
|
|||||||||||
| Balance as of December 31, 2012 |
$ | 315,255 | $ | (11,870 | ) | $ | 303,385 | |||||
|
|
|
|||||||||||
| Net income (loss) |
3,976 | (1,455 | ) | 2,521 | ||||||||
| Distributions |
(135 | ) | (518 | ) | (653 | ) | ||||||
|
|
|
|||||||||||
| Balance as of December 31, 2013 |
$ | 319,096 | $ | (13,843 | ) | $ | 305,253 | |||||
|
|
||||||||||||
The accompanying notes are an integral part of these combined financial statements.
F-5
Table of Contents
La Quinta Predecessor Entities
Combined statements of cash flows
For the years ended December 31, 2013, 2012 and 2011
| (In thousands) | 2013 | 2012 | 2011 | |||||||||
|
|
||||||||||||
| Cash flows from operating activities: |
||||||||||||
| Net income (loss) |
$ | 2,521 | $ | (35,764 | ) | $ | 58,939 | |||||
| Adjustment to reconcile net income (loss) to net cash provided by operating activities: |
||||||||||||
| Depreciation and amortization |
168,498 | 169,122 | 161,819 | |||||||||
| Amortization of other non-current assets |
723 | 805 | 1,597 | |||||||||
| Amortization of intangible assets |
1,210 | 1,287 | 1,372 | |||||||||
| Gain on extinguishment of debt, net |
— | (1,192 | ) | (11,451 | ) | |||||||
| Interest expense added to long-term debt |
52,877 | 32,332 | — | |||||||||
| Amortization of long-term debt reduction |
(4,595 | ) | (4,595 | ) | (383 | ) | ||||||
| Loss (gain) related to casualty disasters |
(468 | ) | 5,279 | (2,367 | ) | |||||||
| Write off of deferred costs |
27 | — | 1,705 | |||||||||
| Write off of non-current assets |
— | 165 | — | |||||||||
| Amortization of leasehold interests |
(572 | ) | (676 | ) | (676 | ) | ||||||
| Amortization of deferred costs |
10,399 | 7,317 | 9,280 | |||||||||
| Financing costs expensed as incurred |
— | 7,749 | — | |||||||||
| Impairment loss |
19,533 | 53,228 | — | |||||||||
| Gain on sale from discontinued operations |
(10,714 | ) | — | — | ||||||||
| Loss on sale or retirement of assets |
359 | 1,562 | 2,168 | |||||||||
| Deferred taxes |
43 | 34 | 67 | |||||||||
| Loss on interest rate caps |
135 | 97 | 168 | |||||||||
| Amortization of premium on subordinated notes |
— | — | (29 | ) | ||||||||
| Provision for doubtful accounts |
1,554 | 1,904 | 2,153 | |||||||||
| Changes in assets and liabilities: |
||||||||||||
| Accounts receivable |
2,203 | (5,186 | ) | (5,901 | ) | |||||||
| Other current assets |
(143 | ) | (47 | ) | (560 | ) | ||||||
| Receivables from affiliates |
(2,920 | ) | (332 | ) | 566 | |||||||
| Other non-current assets |
(563 | ) | (1,277 | ) | (354 | ) | ||||||
| Accounts payable |
(4,027 | ) | 6,439 | (393 | ) | |||||||
| Accrued payroll and employee benefits |
(3,565 | ) | 733 | 3,335 | ||||||||
| Accrued real estate taxes |
(425 | ) | 451 | (1,155 | ) | |||||||
| Accrued expenses and other liabilities |
419 | 7,921 | (698 | ) | ||||||||
| Other long-term liabilities |
349 | 831 | 1,227 | |||||||||
|
|
|
|||||||||||
| Net cash provided by operating activities |
232,858 | 248,187 | 220,429 | |||||||||
F-6
Table of Contents
La Quinta Predecessor Entities
Combined statements of cash flows—(continued)
For the years ended December 31, 2013, 2012 and 2011
| (In thousands) | 2013 | 2012 | 2011 | |||||||||
|
|
||||||||||||
| Cash flows from investing activities: |
||||||||||||
| Capital expenditures |
$ | (115,529 | ) | $ | (102,886 | ) | $ | (95,552 | ) | |||
| (Increase) decrease in restricted cash |
9,381 | (52,662 | ) | 498 | ||||||||
| Increase in investments |
— | (11 | ) | (2 | ) | |||||||
| Insurance proceeds on casualty disasters |
2,833 | 2,843 | 2,853 | |||||||||
| Purchase of intangible assets, net |
(103 | ) | (13 | ) | (600 | ) | ||||||
| Proceeds from sale of assets |
105,837 | 1,755 | — | |||||||||
| Repayment (payment) of franchise incentives |
(700 | ) | 22 | 33 | ||||||||
| Proceeds from other non-current assets |
— | — | 324 | |||||||||
|
|
|
|||||||||||
| Net cash provided by (used in) investing activities |
1,719 | (150,952 | ) | (92,446 | ) | |||||||
|
|
|
|||||||||||
| Cash flows from financing activities: |
||||||||||||
| Proceeds from long-term debt |
— | 484,918 | — | |||||||||
| Repayment of long-term debt |
(227,961 | ) | (765,908 | ) | (150,557 | ) | ||||||
| Payment of deferred costs |
(13,229 | ) | (22,246 | ) | (12,099 | ) | ||||||
| Investment in interest rate caps |
(135 | ) | (97 | ) | (168 | ) | ||||||
| Distributions to members |
(135 | ) | (18,238 | ) | (24 | ) | ||||||
| Distributions to noncontrolling interests |
(518 | ) | (570 | ) | (417 | ) | ||||||
| Members’ contributions |
— | 174,862 | 85,000 | |||||||||
|
|
|
|||||||||||
| Net cash used in financing activities |
(241,978 | ) | (147,279 | ) | (78,265 | ) | ||||||
|
|
|
|||||||||||
| Increase (decrease) in cash and cash equivalents |
(7,401 | ) | (50,044 | ) | 49,718 | |||||||
| Cash and cash equivalents at the beginning of the year |
40,813 | 90,857 | 41,139 | |||||||||
|
|
|
|||||||||||
| Cash and cash equivalents at the end of the year |
$ | 33,412 | $ | 40,813 | $ | 90,857 | ||||||
|
|
|
|||||||||||
| Supplemental cash flow information: |
||||||||||||
| Interest paid during the year |
$ | 90,572 | $ | 65,601 | $ | 43,372 | ||||||
|
|
|
|||||||||||
| Income taxes paid during the year, net of refunds |
$ | 3,459 | $ | 2,408 | $ | 2,305 | ||||||
|
|
|
|||||||||||
| Supplemental non-cash disclosure: |
||||||||||||
| Capital expenditures included in accounts payable |
$ | 2,120 | $ | 3,079 | $ | 10,290 | ||||||
|
|
|
|||||||||||
| Receivable for capital assets damaged by casualty disasters |
$ | 2,413 | $ | 3,096 | $ | 615 | ||||||
|
|
||||||||||||
The accompanying notes are an integral part of these combined financial statements.
F-7
Table of Contents
La Quinta Predecessor Entities
Notes to combined financial statements
For the years ended December 31, 2013, 2012 and 2011
Note 1. Organization
The accompanying combined financial statements include the accounts of Lodge Holdco I L.L.C. (“Holdco I”), Lodge Holdco II L.L.C. (“Holdco II”), Lodge Holdco III L.L.C. (“Holdco III”) (collectively herein, the “Holdcos” or “La Quinta Predecessor Entities”) and all related wholly-owned and majority owned subsidiaries. The Holdcos may also be referred to herein as “La Quinta”, “we”, “us”, “our”, or the “Company”.
Holdco I and Holdco II, Delaware limited liability companies, were formed on January 4, 2006. Holdco III, a Delaware limited liability company, was formed on March 17, 2006. Since those dates, we have been owned and controlled by Blackstone Real Estate Partners IV L.P. and affiliates (“BREP IV”) and Blackstone Real Estate Partners V L.P. and affiliates (“BREP V”). BREP IV and BREP V are affiliates of The Blackstone Group L.P. (collectivity referred to herein as the “Funds” or “Blackstone”).
We own and operate hotels, some of which are subject to ground leases, located in the United States under the La Quinta and Baymont brands, and franchise and manage hotels currently operating in the United States, Canada, and Mexico. As of December 31, 2013, 2012 and 2011, total owned, franchised, and managed hotels, and approximate number of associated rooms were as follows (unaudited):
| 2013 | 2012 | 2011 | ||||||||||||||||||||||
| # of hotels | # of rooms | # of hotels | # of rooms | # of hotels | # of rooms | |||||||||||||||||||
|
|
||||||||||||||||||||||||
| Owned—La Quinta(1) |
342 | 43,500 | 371 | 47,000 | 371 | 47,000 | ||||||||||||||||||
| Owned—Baymont(1) |
— | — | 11 | 1,200 | 12 | 1,300 | ||||||||||||||||||
| Joint Venture—La Quinta |
1 | 200 | 1 | 200 | 1 | 200 | ||||||||||||||||||
| Managed—La Quinta(2) |
14 | 1,700 | 14 | 1,700 | 14 | 1,700 | ||||||||||||||||||
| Franchised—La Quinta |
477 | 38,300 | 449 | 35,800 | 430 | 34,100 | ||||||||||||||||||
|
|
|
|||||||||||||||||||||||
| Totals |
834 | 83,700 | 846 | 85,900 | 828 | 84,300 | ||||||||||||||||||
|
|
||||||||||||||||||||||||
| (1) | See discussion of discontinued operations in Note 6. |
| (2) | These hotels are owned by affiliates of the Funds and are referred to herein as the “Managed Hotels”. (See Note 13). |
Lodging operations are particularly sensitive to adverse economic and competitive conditions and trends, which could adversely affect the Company’s business, financial condition, and results of operations.
We are contemplating participating in an initial public offering (“IPO”) by a newly formed holding company, La Quinta Holdings Inc. (“Holdings”), which, as part of the IPO, would become our ultimate parent. Holdings is a “C” corporation for Federal income tax purposes. We also anticipate completing certain transactions simultaneous with or prior to the effectiveness of the IPO including obtaining replacement financing or extension of our existing debt due in July 2014 (See Note 8), and the acquisition of the Managed Hotels.
F-8
Table of Contents
Note 2. Basis of presentation and significant accounting policies
Basis of presentation and consolidations—The accompanying combined financial statements include the accounts of the Holdcos, our wholly and majority owned subsidiaries, and entities in which we have a controlling financial interest, including variable interest entities (“VIEs”) where we are the primary beneficiary. The Holdcos have been presented on a combined historical cost basis due to their common ownership and control. Holdco I and Holdco II are owned 79.5% by BREP V and 19.9% by BREP IV. Holdco III is owned 99.4% by BREP V.
The accompanying combined financial statements and footnotes include LQ Management L.L.C.
(“LQM”), a VIE, in which we have a significant variable financial interest, no ownership interest, and are the primary beneficiary. LQM received no member or other capital contribution, or equity investment upon formation or thereafter. LQM’s sole purpose is to manage all of our day-to-day operations, as well as to provide day to day management of the Managed Hotels. In return for providing these management services, we and the Managed Hotels pay LQM a management fee and reimburse LQM for costs incurred on our behalf, and on behalf of the Managed Hotels, in accordance with management and service agreements in place. La Quinta is the primary beneficiary of LQM as the management and service agreements in place provide for La Quinta to reimburse LQM for its expenses in a manner that allows LQM to realize a reasonable profit. We have not provided financial or other support to LQM during the periods presented that we were not contractually required to provide, and LQM’s agreements with its vendors are structured as non-recourse to our general credit. Our maximum exposure to a loss as a result of involvement with LQM is related to the need to secure alternative management services and systems support if LQM were unable to fulfill its management agreement.
As of December 31, 2013 and 2012, LQM’s assets and liabilities were as follows:
| (In thousands) | 2013 | 2012 | ||||||
|
|
||||||||
| Cash and cash equivalents |
$ | 2,609 | $ | 630 | ||||
| Restricted cash |
6,700 | 8,193 | ||||||
| Receivables from affiliates |
49,027 | 58,214 | ||||||
| Other current assets |
4,472 | 4,021 | ||||||
| Property and equipment, net |
21,005 | 17,362 | ||||||
| Intangible assets, net |
347 | 413 | ||||||
| Accounts payable |
25,259 | 26,920 | ||||||
| Accrued expenses and other liabilities |
25,670 | 25,975 | ||||||
| Accrued payroll and employee benefits |
26,052 | 29,464 | ||||||
| Capital lease obligation (related party) |
23,852 | 21,287 | ||||||
|
|
||||||||
The accompanying combined financial statements and footnotes are prepared in conformity with accounting principles generally accepted in the United States of America (“GAAP”). All intercompany accounts and transactions have been eliminated.
Going concern—The accompanying combined financial statements have been prepared assuming that we will continue as a going concern, which contemplates the realization of assets and extinguishment of liabilities in the normal course of business. All of our debt matures on July 6, 2014 (See Note 8). On February 21, 2014, our affiliate agreed with certain banks, acting as joint lead arranger, on the terms of a new debt agreement to replace the existing debt agreement and the joint lead arrangers allocated participation in the facilities under the new agreement to lenders, subject to customary closing conditions and consummation of the IPO. If the IPO does
F-9
Table of Contents
not become effective, management’s plan includes obtaining other financing to replace the existing debt in place prior to the maturity of the current debt agreements. The accompanying combined financial statements do not include any adjustments that might result from the outcome of this uncertainty.
Use of estimates—The preparation of the combined financial statements in conformity with GAAP requires management to make certain estimates and assumptions that may affect the reported amounts of our assets and liabilities and disclosure of contingent assets and liabilities at the date of our combined financial statements, as well as the reported amounts of our revenues and expenses during the reporting year. Actual results could differ from such estimates. Significant estimates included within our financial statements include items related to recoverability of assets such as allowance for doubtful accounts, supplies and linen inventory obsolescence, estimated value and lives of property, equipment and intangibles, and valuation allowances for deferred tax assets, as well as estimated number of redeemed points from our customer loyalty program, deferred revenues, insurance reserves, estimated claims from losses, revenue recognition, allocated costs, and future incentive commitments.
Revenue recognition—Revenues primarily consist of room rentals, franchise fees and other hotel revenues. We defer a portion of our revenue from franchisees at the time the franchise agreement is signed and recognize the remainder when the franchised property opens.
Room revenues are derived from room rentals at our owned hotels. We recognize room revenue on a daily basis based on an agreed-upon daily rate after the guest has stayed at one of our hotels. Customer incentive discounts, cash rebates, and refunds are recognized as a reduction of room revenues. Occupancy, hotel, and sales taxes collected from customers and remitted to the taxing authorities are excluded from revenues in the accompanying combined statements of operations.
Included in franchise and other fee-based revenues are franchise fee revenues, which primarily consist of revenues from franchisees for application, affiliation, royalty, reservations, and training, as well as fees related to our guest loyalty program (“Returns”). We recognize franchise fee revenue on a gross basis because we (1) are the primary obligor in these arrangements, (2) have latitude in establishing rates, (3) perform the services delivered, (4) have some discretion over supplier selection, and (5) determine the specification of services delivered. The different types of franchise fee revenues are described as follows:
| • | Upon execution of a franchise agreement, a franchisee is required to pay us an initial fee. We recognize the initial fee as revenue when substantial performance of our obligations to the franchisee with respect to the initial fee has been achieved. In most cases, the vast majority of the initial fee is recognized as revenue when each franchise agreement is signed as, after that date, our remaining obligations to the franchisee are limited to (1) pre-opening inspections, for which we defer $2,500, and (2) if mandated by us or agreed to with the franchisee, preopening training and marketing support related to entry into the La Quinta brand, for which we defer $5,000. These amounts represent an estimate of the value provided to the franchisee related to the services provided, and are based on our experience with time, materials, and third-party costs necessary to provide these services. We recognize the remaining deferred initial fee as revenue when the franchised property opens as the remaining service obligations have been fulfilled. |
| • | For franchise agreements entered into prior to April 1, 2013, we collect a monthly royalty fee from franchisees generally equal to 4.0% of their room revenues until the franchisee has |
F-10
Table of Contents
| operated as a La Quinta for twenty-four consecutive months. Beginning in the twenty-fifth month of operation, the franchisee monthly royalty fee increases to 4.5%. For franchise agreements entered into on or after April 1, 2013, for new franchisees, we began charging a royalty fee from franchisees equal to 4.5% of their room revenues until the franchisee has operated as a La Quinta for twenty-four consecutive months. Beginning in the twenty-fifth month of operation, the franchisee monthly royalty fee increases to 5.0%. In these cases, the franchisee has the opportunity to earn the additional 0.5% back via rebate by achieving certain defined customer satisfaction results. |
| • | We receive reservation and technology fees, as well as fees related to Returns, in connection with franchising our La Quinta brand. Such fees are recognized based on a percentage of the franchisee’s hotel room revenues or the hotel’s room count. We perform certain other services for franchisees such as training and revenue management. Revenue for these services is recognized at the time the services are performed. |
Included in franchise and other fee-based revenues are management fees of approximately $2.3 million for the year ended December 31, 2013, $2.0 million for the year ended December 31, 2012 and $1.8 million for the years ended December 31, 2011, which represent fees earned from the Managed Hotels under long-term contracts with the property owners. Management fees from hotels include a base fee, which is generally a percentage of hotel revenues. (See Note 13).
Other hotel revenues include revenues generated by the incidental support of hotel operations for owned hotels and other rental income. We record rental income from operating leases associated with leasing space for restaurants, billboards, and cell towers. Rental income is recognized on a straight-line basis over the life of the respective lease agreement.
Brand marketing fund revenues from franchise and managed properties represent fees collected from franchised and managed hotels related to maintaining our Brand Marketing Fund (“BMF”). LQM maintains the BMF on behalf of all La Quinta branded hotel properties, including our owned hotels, from which national marketing and advertising campaign expenses are paid. Each La Quinta branded hotel is charged a percentage of its room revenue from which the expenses of the fund are covered. The corresponding expenditures of the BMF fees collected from franchised and managed hotels are presented as other expenses from franchised and managed hotels in our combined statements of operations, resulting in no impact to operating income (loss) or net income (loss).
During 2013, 2012 and 2011, we collected BMF fees from franchisees totaling $18.1 million, $16.3 million and $14.4 million, respectively. During 2013, 2012, and 2011, we collected BMF fees from the Managed Hotels totaling $1.0 million, $0.9 million, and $0.8 million, respectively.
Non-controlling interests—Non-controlling interests are recognized within total equity in our combined balance sheets, reflected in net loss attributable to non-controlling interests in our combined statements of operations, and included in our combined statement of equity.
Cash and cash equivalents—We consider all cash on hand, demand deposits with financial institutions, and short-term highly liquid investments with original maturities of three months or less to be cash equivalents. Cash and cash equivalents consist of highly liquid investments that are stated at cost, which approximates fair market value. Certain balances in cash and cash equivalents exceed the Federal Deposit Insurance Corporation limit of $250,000; however, we believe credit risk related to these deposits is minimal.
F-11
Table of Contents
Restricted cash—Restricted cash classified as current assets consists of cash restricted under the terms of our mortgage loans and held in collateral property hotel depositories, escrow accounts primarily for the payment of capital expenditures, taxes, debt service, insurance losses, and ground leases, and a cash deposit for a letter of credit (See Note 8). Restricted cash classified as non-current includes restricted cash related to certain loss deductibles and self-insured retention under a former insurance program. Restricted cash consists of cash and cash equivalents that are stated at cost, which approximates fair market value. Classification of restricted cash is based on the nature of the restrictions associated with the underlying assets.
Accounts receivable—Accounts receivable primarily consists of receivables due from franchisees, hotel guests, and credit card companies. Accounts receivable are carried at estimated collectable amounts. We periodically evaluate our receivables for collectability based on historical experience, the length of time receivables are past due, and the general economy. We provide an allowance for doubtful accounts, after considering factors that might affect the collection of accounts receivable, including historical losses and the ability of the party to meet its obligations to us. Accounts receivable are written off when determined to be uncollectable.
Property and equipment—Property and equipment are stated at cost less accumulated depreciation computed using a straight-line method over the estimated useful life of each asset. Property and equipment consists of the following:
| Buildings and improvements |
10 to 40 years | |
| Hotel equipment, automobiles, furniture, and fixtures |
2 to 10 years | |
| Leasehold improvements |
shorter of the lease term or the estimated useful life | |
|
| ||
We periodically review the useful lives of our long-lived assets based on current assessments of the remaining utility of our assets. Such changes are accounted for prospectively and would either increase or decrease depreciation expense in the accompanying combined statements of operations.
We capitalize expenditures that increase the overall value of an asset or extend an asset’s life, typically associated with hotel refurbishment, renovation, and major repairs. Such costs primarily include third party contract labor, professional design and construction costs, including associated materials, and other direct and indirect costs, such as sales and use tax and interest costs, incurred during the redevelopment and renovation period. The capitalization period begins when the activities related to development have begun and ceases when the project is substantially complete and the assets are held available for use or occupancy. Once a redevelopment project is substantially complete and the associated assets are ready for intended use, costs related to the redevelopment project are no longer capitalized. Additionally, we capitalize costs such as construction administration, cost accounting, design and other various office costs that clearly relate to projects under development or construction (“Indirect Costs”). Total capitalized Indirect Costs were $3.0 million, $2.7 million, and $1.8 million for the years ended December 31, 2013, 2012, and 2011, respectively.
Normal maintenance and repair costs are expensed as incurred. When depreciable property is retired or disposed, the related cost and accumulated depreciation or amortization is removed from the applicable accounts and any gain or loss is reflected in the accompanying combined statements of operations.
F-12
Table of Contents
Assets held for sale—Long-lived assets are classified as held for sale when all of the following criteria are met:
| • | Management commits to a plan to sell the asset and does not expect significant changes to the plan or that the plan will be withdrawn |
| • | The asset is available for immediate sale in its present condition |
| • | The asset is being actively marketed |
| • | The sale of the asset is probable within one year |
When we identify a long-lived asset as held for sale, depreciation of the asset is discontinued and the carrying value is reduced, if necessary, to the estimated sales price less costs to sell by recording a charge to current earnings, reflected within discontinued operations. All assets held for sale are monitored through the date of sale for potential adjustments based on offers we are willing to take under serious consideration and continued review of facts and circumstances. An impairment loss on the disposition is recorded to the extent that the amounts ultimately received for the sale of assets differ from the adjusted book values of the assets. Gains on sales are recognized at the time the assets are sold, provided there is reasonable assurance the sales price will be collected and any future activities to be performed by the Company relating to the assets sold are expected to be insignificant.
Fair value measurements—Fair value is defined as the price that would be received to sell an asset or pay to transfer a liability in the principal or most advantageous market for the asset or liability in an orderly transaction between market participants at the measurement date. In evaluating the fair value of both financial and non-financial assets and liabilities, we use the accounting guidance that establishes a fair value hierarchy, which prioritizes the inputs used in measuring fair value into three broad levels, which are as follows:
| • | Level 1—Quoted prices in active markets for identical assets or liabilities. |
| • | Level 2—Observable inputs other than Level 1 prices, such as quoted prices for similar assets or liabilities; quoted prices in markets that are not active; or other inputs that are observable or can be corroborated by observable market data for substantially the full term of the assets or liabilities. Valuations in this category are inherently less reliable than quoted market prices due to the degree of subjectivity involved in determining appropriate methodologies and the applicable underlying observable market assumptions. |
| • | Level 3—Unobservable inputs that are supported by little or no market activity and that are significant to the fair value of the assets and liabilities. These inputs cannot be validated by readily determinable market data and generally involve considerable judgment by management. |
We use the highest observable market data if such data is available without undue cost and effort.
Valuation and impairment of long-lived assets—We annually review the performance of long-lived assets for impairment, as well as when events or changes in circumstances indicate that the carrying amount of an asset may not be recoverable. We also identify properties we intend to sell and properties we intend to hold for use. For each asset or group of assets held for use with indicators of impairment, we compare the sum of the expected future cash flows (undiscounted and without interest charges) generated by the asset or group of assets with its associated net carrying value.
F-13
Table of Contents
If the net carrying value of the asset or group of assets exceeds expected undiscounted future cash flows, the excess of the net book value over estimated fair value is charged to impairment loss in the accompanying combined statements of operations. Properties held for sale are reported at the lower of their carrying amount or their estimated sales price, less estimated costs to sell.
We estimate fair value primarily using Level 3 inputs by (1) calculating the discounted expected future cash flows, and (2) calculating expected liquidated sales proceeds, relying on common hotel valuation methods such as multiples of room revenues or per room valuations. Our estimate of fair value of the asset using these Level 3 inputs then becomes the new basis of the asset or group of assets and this new basis is then depreciated over the asset’s remaining useful life. We may be subject to impairment charges in the future, in the event that operating results of individual hotel operations are materially different from its forecasts, the economy or the lodging industry weakens, or if the assumed holding period of a hotel is shortened.
Intangible assets—Intangible assets consist of trademarks, franchise agreements and management contracts, Returns membership list, and leasehold interests. Owned trademarks are not amortized but are tested for impairment annually or more frequently if events or changes in circumstances indicate that the asset might be impaired.
Intangible assets with a definite life are amortized on a straight-line basis over their estimated useful lives, which consist of the following:
| Franchise agreements, management contracts and other |
3 to 20 years | |
| Returns membership list |
3 years | |
| Leasehold interests—hotels, restaurants, office |
2 to 49 years | |
|
| ||
Derivative instruments—We do not enter into financial instruments for trading or speculative purposes. However, we are required by our current debt agreements to enter into interest rate cap agreements, which are considered to be derivative instruments that limit or cap interest expense related to our long-term debt. We do not designate these derivatives as hedges and accordingly account for such interest rate caps at fair value in the accompanying combined balance sheets, with adjustments to fair value recorded as a gain or loss on interest rate caps in the accompanying combined statements of operations.
Insurance and self-insurance programs—We purchase insurance to limit the risk of loss associated with our lodging operations and use paid loss retrospective insurance for exposures covered under commercial general liability, automobile liability, and workers’ compensation insurance policies. Predetermined loss deductibles and self-insured retentions and liability limits have been selected to limit the per occurrence cash outlay.
We have a self-insurance program for major medical and hospitalization coverage offered to employees and their dependents that is partially funded by payroll deductions from our employees. Under the self-insurance program, payments for major medical and hospitalization to individual participants which are below specified deductible amounts are paid by us through a third party administrator.
F-14
Table of Contents
As of December 31, 2013 and 2012, we accrued the following liabilities related to our insurance programs:
| (In thousands) | 2013 | 2012 | ||||||
|
|
||||||||
| Automobile and general liability insurance |
$ | 21,290 | $ | 20,308 | ||||
| Workers’ compensation |
8,941 | 12,152 | ||||||
| Health insurance |
950 | 820 | ||||||
|
|
|
|||||||
| $ | 31,181 | $ | 33,280 | |||||
|
|
||||||||
The liability for automobile and general liability insurance is included in accrued expenses and other liabilities and the liability for workers’ compensation and health insurance is included in accrued payroll and employee benefits in the accompanying combined balance sheets.
Customer loyalty program—We administer Returns, which allows members to earn points based on certain dollars spent. Members may redeem points earned for free night certificates, gift cards, airline miles, and a variety of other awards. We account for the economic impact of points earned by accruing an estimate of its liability for unredeemed points. The expense related to this estimate includes the incremental cost of the stay at one of our hotels or the value of awards purchased from program partners. We estimate the future redemption obligation based upon historical experience, including an estimate of “breakage” for points that will never be redeemed. The estimate is based on a calculation that includes an assumption for the redemption rate, redemption type (whether for a free night certificate or other award), and rate of redemption at Company-owned hotels versus franchised hotels. The expenses of the Returns program are charged to marketing, promotional and other advertising expenses in the accompanying combined statements of operations.
As of December 31, 2013 and 2012, the total liability for Returns points was approximately $13.3 million and $12.1 million, respectively, of which $5.3 million and $4.7 million are included in accrued expenses and other liabilities, representing the estimated points expected to be redeemed in the next year. The remainder is included within other long-term liabilities in the accompanying combined balance sheets.
Actual financial results of the Returns program may vary from our estimate due primarily to variances from assumptions used in the calculation of the obligation for future redemptions and changes in member behavior. These variances are accounted for as changes in estimates and are charged to operations as they become known.
Direct lodging expenses—Direct lodging expenses primarily consist of direct labor costs, repairs and maintenance, utilities, and other advertising costs to operate our owned hotels.
Other lodging and operating expenses—Other lodging and operating expenses consist of indirect costs to operate our owned hotels such as property taxes and insurance.
General and administrative expenses—General and administrative expenses consist of items such as corporate operating expenses including operations, information technology, accounting, legal, and human resources.
Marketing, promotional and other advertising expenses—Marketing, promotional, and other advertising expenses consist of BMF expenses not paid for with funds received from franchised or managed hotels, expenses related to other customer loyalty programs such as Returns, and other advertising expenses.
F-15
Table of Contents
Advertising costs—We incur advertising costs associated with general promotion of the La Quinta brand and specific advertising and marketing support for our operation and for the operations of our franchisees. We expense the production cost of advertising the first time the advertising is publicly displayed.
For the years ended December 31, 2013, 2012 and 2011, we incurred advertising and promotional expenses included within the following in the accompanying combined statements of operations:
| (In thousands) | 2013 | 2012 | 2011 | |||||||||
|
|
||||||||||||
| Direct lodging expenses |
$ | 6,300 | $ | 6,417 | $ | 7,188 | ||||||
| Other lodging and operating expenses |
167 | 311 | 292 | |||||||||
| General and administrative expenses |
1,324 | 1,521 | 1,449 | |||||||||
| Marketing, promotional and other advertising expenses |
47,796 | 38,723 | 33,678 | |||||||||
|
|
|
|||||||||||
| Total |
$ | 55,587 | $ | 46,972 | $ | 42,607 | ||||||
|
|
||||||||||||
Long-term debt amendments—We may elect to amend, extend, repay, or otherwise modify the terms of our long-term debt arrangements. When such a transaction occurs, we determine the appropriate accounting treatment primarily by first determining whether we have been fully relieved of our obligation by the creditor. If so, we recognize an extinguishment of debt and calculate a gain or loss which is reflected as gain or loss on extinguishment of debt in the accompanying combined statements of operations. If we are not fully relieved of our obligation by the creditor, we consider whether the amended debt agreement has substantially different terms, generally defined as a change in cash flows, on a present value basis, of 10 percent or greater. If the terms are not substantially different, we account for the change as a modification. If the terms are substantially different, we account for the change as an extinguishment of the old debt and the issuance of a new debt instrument. The determination of modification or extinguishment status then governs the expense versus deferral treatment of third party costs paid related to the modification.
Income taxes—The combined financial statements include taxable entities, limited liability companies, and REIT entities. Limited liability companies and REITs are not subject to federal income taxes at the entity level. For our taxable subsidiaries, we account for income taxes using the asset and liability approach for financial accounting and reporting purposes. For financial reporting purposes, income tax expense or benefit is based on reported financial accounting income or loss before non-controlling interests and income taxes related to our taxable subsidiaries. Deferred tax assets and liabilities reflect the temporary differences between assets and liabilities recognized for financial reporting and the analogous amounts recognized for tax purposes using the statutory tax rates expected to be in effect for the year in which the differences are expected to reverse, within the taxable subsidiaries.
In connection with the IPO (See Note 1), our new parent would be subject to additional entity-level taxes that will be reflected in our financial statements. The unaudited pro forma income information gives effect to an adjustment for income tax expense as if we had been a “C” Corporation at the beginning of each year presented at an assumed combined federal and state income tax rate of 40%. This rate approximates the calculated effective assumed statutory combined tax rates for years presented. In addition, as a result of the IPO, because we would cease to operate as a pass-through entity for income tax purposes we would recognize a net deferred tax liability and corresponding income tax expense to establish our initial deferred tax balances.
F-16
Table of Contents
We evaluate the probability of realizing the future benefits of deferred tax assets and provide a valuation allowance for the portion of any deferred tax assets where the likelihood of realizing an income tax benefit in the future does not meet the more-likely-than-not criteria for recognition.
We recognize the financial statement benefit of a tax position only after determining that the relevant tax authority would more likely than not sustain the position following an audit. For tax positions meeting the more-likely-than-not threshold, the amount recognized in the financial statements is the largest benefit that has a greater than 50 percent likelihood of being realized upon ultimate settlement with the relevant tax authority. As of and for the years ended December 31, 2013, 2012 and 2011, we did not recognize any previously unrecorded uncertain tax positions.
The State of Texas imposes a margin tax, with an effective rate of 0.7%, based on the prior year’s Texas-sourced gross receipts. This tax is treated as an income tax and accrued in the accounting period in which the taxable gross receipts are recognized.
We are required by certain foreign jurisdictions to have franchisees withhold up to 30% of revenues related to royalties and certain other revenues. This tax is treated as an income tax and expensed in the period in which the taxable gross receipts are recognized.
Comprehensive income—Comprehensive income is defined as the change in equity of a business enterprise during a period from transactions and other events and circumstances from non-owner sources and includes all changes in equity during a period, except those resulting from investments by owners and distributions to owners. We have no significant components of comprehensive income other than net income.
Concentrations of credit risk and business risk—Financial instruments, which potentially subject us to concentrations of credit risk, consist principally of cash and cash equivalents, and restricted cash. We utilize financial institutions that we consider to be of high credit quality and consider the risk of default to be minimal. We also monitor the credit-worthiness of our customers and financial institutions before extending credit or making investments.
Geographic concentrations, which potentially subject us to concentrations of business risk, relate primarily to locations of hotels and the revenue recognized in various states within the United States. We have a concentration of hotels operating in Texas and Florida.
The percentages of our total revenues, including revenue from discontinued operations, from these states for the years ended December 31, 2013, 2012 and 2011 are as follows:
| 2013 | 2012 | 2011 | ||||||||||
|
|
||||||||||||
| Texas |
26% | 25% | 25% | |||||||||
| Florida |
13% | 13% | 13% | |||||||||
|
|
|
|||||||||||
| Total |
39% | 38% | 38% | |||||||||
|
|
||||||||||||
Subsequent events—In connection with the preparation of the accompanying combined financial statements, we have evaluated events and transactions occurring after December 31, 2013, for potential recognition or disclosure through February 26, 2014, the date the accompanying combined financial states were available to be issued.
F-17
Table of Contents
Note 3. Recently issued accounting standards
Newly issued accounting standards
In February 2013, the Financial Accounting Standards Board (“FASB”) issued Accounting Standards Update (“ASU”) No. 2013-02. This ASU amends existing guidance by requiring companies to report the effect of significant reclassifications out of accumulated other comprehensive income on the respective line items in net income if the amount being reclassified is required to be reclassified in its entirety to net income in the same reporting period. For amounts which are not required to be reclassified in their entirety to net income in the same reporting period, companies will be required to cross reference other disclosures that provide information about those amounts. We adopted ASU 2013-02 prospectively as of January 1, 2013. The adoption of this ASU did not have a material impact on our financial condition, results of operations, cash flows, or disclosures.
In July 2013, the FASB issued ASU No. 2013-11. This ASU provides guidance on the financial statement presentation of an unrecognized tax benefit when a net operating loss carryforward, a similar tax loss, or a tax credit carryforward exists in the applicable jurisdiction to settle any additional income taxes that would result from disallowance of the tax position. The provisions of ASU 2013-11 are effective for fiscal years, and interim periods within those years, beginning after December 15, 2013. When adopted, ASU 2013-11 is not expected to materially impact our financial condition, results of operations, cash flows, or disclosures.
Newly adopted accounting standards
From time to time, new accounting standards are issued by the FASB or other standards setting bodies, which we adopt as of the specified effective date. Unless otherwise discussed, we believe the impact of recently issued standards that are not yet effective will not have a material impact on our combined financial statements upon adoption.
Note 4. Non-controlling interests
As of December 31, 2013 and 2012, we recorded non-controlling interest deficits totaling approximately $13.8 million and $11.9 million, respectively, in the accompanying combined balance sheets. Non-controlling interests primarily consist of the following:
| • | We hold a 60% controlling equity interest in a joint venture. The joint venture owns and operates one hotel in New Orleans, Louisiana. The non-controlling interest, totaling 40%, represents the external partner’s interest in the joint venture of approximately $2.5 million as of December 31, 2013 and 2012, respectively. Total distributions to the non-controlling interest holder were approximately $0.4 million, $0.5 million and $0.3 million for the years ended December 31, 2013, 2012 and 2011, respectively. |
| • | As described in Note 2, we consolidate LQM, and LQM’s results of operations and net equity or deficit are presented as a non-controlling interest. As of December 31, 2013 and 2012, LQM had a members’ deficit of approximately $16.7 million and $14.8 million, respectively. |
F-18
Table of Contents
Note 5. Intangible assets
Intangible assets consist of both finite-lived and indefinite-lived assets. The following is a summary of our intangible assets as of December 31, 2013 and 2012:
| 2013 | 2012 | |||||||||||||||
| (In thousands) | Weighted average remaining life |
Amount | Weighted average remaining life |
Amount | ||||||||||||
|
|
||||||||||||||||
| Finite-lived assets: |
||||||||||||||||
| Favorable leasehold interests—hotels, restaurants, offices |
31 years | $ | 8,320 | 32 years | $ | 8,320 | ||||||||||
| Franchise agreements, management contracts and other |
7 years | 18,015 | 8 years | 17,912 | ||||||||||||
| Returns membership list |
— | (1) | 3,200 | — | (1) | 3,200 | ||||||||||
| Accumulated amortization |
(19,483 | ) | (17,953 | ) | ||||||||||||
|
|
|
|||||||||||||||
| Total finite—lived assets |
10,052 | 11,479 | ||||||||||||||
| Indefinite-lived assets: |
||||||||||||||||
| Trademarks—La Quinta |
169,434 | 169,434 | ||||||||||||||
|
|
|
|||||||||||||||
| Total |
$ | 179,486 | $ | 180,913 | ||||||||||||
|
|
||||||||||||||||
| (1) | As of December 31, 2013 and 2012 the Returns membership list has been fully amortized. |
| For the years ended December 31, | ||||||||||||
| (In thousands) | 2013 | 2012 | 2011 | |||||||||
|
|
||||||||||||
| Amortization expense related to intangible assets: |
||||||||||||
| Depreciation and amortization expense |
$ | 1,210 | $ | 1,287 | $ | 1,372 | ||||||
| Direct lodging operations |
320 | 321 | 327 | |||||||||
|
|
|
|||||||||||
| Total amortization expense |
$ | 1,530 | $ | 1,608 | $ | 1,699 | ||||||
|
|
||||||||||||
As of December 31, 2013, estimated amortization expense related to intangible assets for the years ending December 31 is as follows (in thousands):
| 2014 |
$ | 1,335 | ||
| 2015 |
1,153 | |||
| 2016 |
936 | |||
| 2017 |
863 | |||
| 2018 |
751 | |||
| Thereafter |
5,014 | |||
|
|
|
|||
| $ | 10,052 | |||
|
|
||||
The accumulated amortization and related amortization expense described above do not include the impact of unfavorable leasehold interests which are reflected within other non-current liabilities in the accompanying combined balance sheets. For the year ended December 31, 2013, approximately $0.9 million and for the years ended 2012 and 2011, approximately $1.0 million of amortization expense, related to unfavorable leasehold interests, was reported as a reduction of depreciation and amortization expenses in the accompanying combined statements of operations.
F-19
Table of Contents
Note 6. Assets held for sale and discontinued operations
In September 2012, we entered into a definitive agreement to sell one of our Baymont-branded hotels for approximately $1.8 million. As of that date, the hotel was classified as an asset held for sale, an impairment charge of $1.7 million was recognized to bring its carrying value to the lower of cost or estimated sales price, less estimated closing costs, and the results of its operations have been presented within discontinued operations for the years ended December 31, 2012 and 2011 in the accompanying combined statements of operations. In December 2012, the sale of this hotel was completed.
During 2012, we began an exercise to identify hotel assets in our portfolio which, for a variety of reasons, we determined detracted from our brand. As a result of a tentative disposal list of hotels being identified, and the resulting change in assumed holding period for these assets, an impairment charge of $51.5 million was recognized as part of our annual testing for impairment of long-lived assets. However, the assets did not meet all of the criteria for classification as assets held for sale as of December 31, 2012.
During the second quarter of 2013, the disposal list was finalized, causing 44 of our hotels, including all 11 of our Baymont-branded hotels, to meet all of the criteria to be classified as assets held for sale. As such, these hotels were classified as assets held for sale, and the results of their operations have accordingly been presented within discontinued operations for all periods presented in the accompanying combined statements of operations. In addition, for these assets held for sale an impairment charge was recorded for any differences between the estimated selling price less associated closing costs and the carrying amount of the assets. Any gains on sale from discontinued operations were recorded when the sales were completed.
During 2013, 40 of these hotels, including all of the Baymont-branded hotels were sold. As of December 31, 2013, the remaining four hotels are reflected in the accompanying combined balance sheet as assets held for sale.
As of December 31, 2013, the carrying amounts of the major classes of assets for the assets held for sale are as follows:
| (In thousands) | 2013 | |||
|
|
||||
| Current assets |
$ | 118 | ||
| Property and equipment, net |
7,134 | |||
| Other non-current assets |
80 | |||
|
|
|
|||
| Total assets |
$ | 7,332 | ||
|
|
||||
Subsequent to December 31, 2013, the four remaining hotels held for sale were sold. Estimated closing costs of approximately $0.1 million are included as a reduction of assets held for sale in the accompanying combined balance sheets (See Note 10).
In accordance with the terms of our loan agreements, all proceeds associated with the sale of these hotels have been used to make principal payments on our long term-debt. (See Note 8).
F-20
Table of Contents
The following table summarizes the operating results for discontinued operations:
| For the years ended December 31, | ||||||||||||
| (In thousands) | 2013 | 2012 | 2011 | |||||||||
|
|
||||||||||||
| Hotel revenues |
$ | 41,477 | $ | 53,753 | $ | 51,611 | ||||||
| Direct lodging expenses |
25,780 | 34,391 | 33,664 | |||||||||
| Other lodging and operating expenses |
4,317 | 5,132 | 4,544 | |||||||||
|
|
|
|||||||||||
| Operating income |
11,380 | 14,230 | 13,403 | |||||||||
| Depreciation and amortization |
(5,056 | ) | (13,854 | ) | (13,159 | ) | ||||||
| Impairment charge (see note 10) |
(19,533 | ) | (53,228 | ) | — | |||||||
| Gain on sale from discontinued operations |
10,714 | — | — | |||||||||
|
|
|
|||||||||||
| Gain (loss) on discontinued operations |
$ | (2,495 | ) | $ | (52,852 | ) | $ | 244 | ||||
|
|
||||||||||||
Note 7. Property and equipment
The following is a summary of property and equipment as of December 31, 2013 and 2012:
| (In thousands) | 2013 | 2012 | ||||||
|
|
||||||||
| Land |
$ | 808,960 | $ | 843,671 | ||||
| Buildings and improvements |
2,635,651 | 2,720,351 | ||||||
| Furniture, fixtures, equipment and other |
369,235 | 356,566 | ||||||
|
|
|
|||||||
| Total property and equipment |
3,813,846 | 3,920,588 | ||||||
| Less accumulated depreciation |
(1,053,910 | ) | (987,520 | ) | ||||
|
|
|
|||||||
| Property and equipment, net |
2,759,936 | 2,933,068 | ||||||
| Construction in progress . |
1,521 | 7,060 | ||||||
|
|
|
|||||||
| Total property and equipment, net of accumulated depreciation |
$ | 2,761,457 | $ | 2,940,128 | ||||
|
|
||||||||
Depreciation and amortization expense related to property and equipment was $160.9 million, $162.9 million and $156.2 million for the years ended December 31, 2013, 2012 and 2011, respectively. Construction in progress includes capitalized costs for ongoing projects that have not yet been put into service. With the exception of the joint venture operating a hotel in New Orleans, Louisiana and three other hotels, all of our hotels are pledged as collateral for our long-term debt. (See Note 8).
F-21
Table of Contents
Note 8. Long-term debt
Long-term debt as of December 31, 2013 and 2012 was as follows:
| (In thousands) | Interest rate | Maturity date |
2013 | 2012 | ||||||||
|
|
||||||||||||
| Current: |
||||||||||||
| Holdco I Mortgage Loan |
LIBOR + 2.892%(1) | (2) | $ | 1,941,238 | $ | 56,250 | ||||||
| Holdco III Mortgage Loan |
(3) | (4) | 208,909 | 5,042 | ||||||||
| Holdco I Mezzanine Loans |
LIBOR + 9.0% to 13.9%(5) | (5) | 570,139 | — | ||||||||
|
|
|
|||||||||||
| Current portion of long-term debt |
$ | 2,720,286 | $ | 61,292 | ||||||||
|
|
|
|||||||||||
| Long-term: |
||||||||||||
| Holdco I Mortgage Loan |
LIBOR + 2.892%(1) | July 2014(6) | — | 2,092,864 | ||||||||
| Holdco III Mortgage Loan |
(3) | July 2014(7) | — | 228,547 | ||||||||
| Holdco I Mezzanine Loans |
LIBOR + 9.0% to 13.9%(5) | July 2014(6) | — | 517,262 | ||||||||
|
|
|
|||||||||||
| Long-term debt |
$ | — | $ | 2,838,673 | ||||||||
|
|
||||||||||||
| (1) | As of December 31, 2013 and 2012, the 30 day United States dollar London Interbank Offering Rate (“LIBOR”) was 0.17% and 0.21%, respectively. As more fully described below, portions of the Holdco I Mortgage Loan, with principal totaling $1.03 billion as of December 31, 2013, carry interest at LIBOR plus a spread of 0.55%. The remaining Holdco I Mortgage Loan balances, with principal totaling approximately $0.9 billion, are subject to a LIBOR floor of 1.0% plus spreads ranging from 3.891% to 6.803%. The total weighted average spread for the Holdco I Mortgage loan was 2.892% as of December 31, 2013 and 2.664% as of December 31, 2012. |
| (2) | The terms of the Holdco I Mortgage Loan require us to make quarterly principal payments beginning with the first payment date following September 30, 2012. Final maturity is July 2014. |
| (3) | The interest rate for the Holdco III Mortgage Loan through December 31, 2011 was LIBOR with a floor of 1.0% plus a spread of 4.0% and remained at this rate until the initial maturity of July 6, 2012. The interest rate for the Holdco III Mortgage loan as of July 6, 2012 and through December 31, 2013 was LIBOR with a floor of 1.0% plus a spread of 4.5%. |
| (4) | Principal payments are required quarterly equal to the amount of excess cash flows, as defined, held in escrowed accounts over a specified floor. |
| (5) | The Holdco I Mezzanine Loans bear interest at LIBOR plus current payment spreads ranging from 1.0% to 2.15%, and deferred payment spreads ranging from 8.0% to 11.75%, payable at maturity. Any difference between current LIBOR and the LIBOR floor of 1% is deferred to maturity. The total weighted average spread for the Holdco I Mezzanine Loans was 11.590% as of December 31, 2013 and 2012. No principal payments are required prior to the maturity date. |
| (6) | In accordance with the May 2012 amendment, the maturity date was extended to July 2014. |
| (7) | The original scheduled maturity date was July 2013. However, in July 2013, we exercised our option to extend the maturity date to July 2014. Included in the Holdco III Mortgage Loan as of December 31, 2013 and 2012 is an unamortized long-term debt reduction of $2,297 and $6,892, respectively, which is being amortized using an imputed interest rate of 3.45%. |
Holdco I debt
On July 6, 2007, we borrowed $2.40 billion under a mortgage loan agreement (“Mortgage Loan”) with Merrill Lynch Mortgage Lending, UBS Real Estate Securities, Inc. and Bank of America, N.A. (“B of A”). In December 2007, a portion of the Mortgage Loan was refinanced with a $50 million senior mezzanine loan, reducing the Mortgage Loan to $2.35 billion.
In July 2007, we entered into five unsecured, mezzanine loans, totaling $700 million in aggregate. The senior mezzanine loan and the five unsecured, mezzanine loans are collectively referred to herein as the “Mezzanine Loans”.
In July 2011, the Funds made a contribution of $85 million which we used, along with $30 million of available cash, to settle portions of two of the Mezzanine Loans for $60.2 million and $45.2 million, respectively, resulting in a net gain on debt extinguishment of approximately $9.6 million.
F-22
Table of Contents
In November 2011, we settled an additional portion of two of the Mezzanine Loans for a total of $23.1 million, resulting in a net gain on debt extinguishment of approximately $1.9 million.
In May 2012, the terms of the Mortgage Loan and the Mezzanine Loans (together, the “Loans”) were amended (“Amendment”). Pursuant to the Amendment, certain interest rate spreads were increased, additional assets were pledged as collateral, cash distributions to Holdco I equity holders are prohibited, and we obtained the right, at our option, to one two-year term extension following the original maturity date of July 2012. On May 24, 2012, we exercised the option to extend the maturity date of the Loans for a period of two years to the current maturity date of July 6, 2014.
In connection with the Amendment, the Funds made a cash contribution to us of approximately $175 million. We used this contribution, along with approximately $101 million of available cash, to (1) make a principal payment of $180 million on the Mortgage Loan, (2) settle a portion of the Mezzanine Loans for approximately $69.8 million, resulting in a gain on early debt extinguishment of approximately $5.2 million, and (3) pay associated closing costs of which (i) $7.7 million was expensed as incurred and is included in other income (loss) in the accompanying combined statements of operations, and (ii) $4.0 million related to Mezzanine Loans was treated as loss on extinguishment and is included within gain on extinguishment of debt, net in the accompanying combined statements of operations.
In accordance with the Amendment, we are obligated to make principal payments on the Mortgage Loan in an amount equal to (i) $12.5 million on the first scheduled debt service payment date following the last day of each of the calendar quarters ending in September 2012, December 2012, and March 2013, and (ii) $15.625 million on the first scheduled debt service payment date following the last day of each of the calendar quarters ending in June 2013, September 2013, December 2013, and March 2014.
As of and for the years ended December 31, 2013 and 2012, the Loans are collateralized by 314 and 354 of the Company’s owned hotel properties, respectively. Concurrently with the closing of the Amendment, a newly created limited liability company, BRE/LQ Franchise Sub-Holdings, LLC (“Franchise Holdco”), was formed which assumed ownership of the net assets of our franchising and other brand-related operations. In connection with the Amendment, 100% of the member interests of Franchise Holdco were pledged as collateral for the Loans. In addition, upon closing of the Amendment, the Lenders were granted a first-priority security interest in the cash assets of the entities owned by Franchise Holdco. The Loans may be prepaid in full without penalty. Subject to certain defined premiums, individual properties may be released as collateral after prepayment of a defined portion of the Loans.
In connection with the Amendment, interest for portions of the Mortgage Loan are subject to a LIBOR floor of 1.0%, plus interest rate spreads ranging from 0.55% to 6.803%, resulting in a weighted average spread of 2.892% as of December 31, 2013, with all interest to be paid currently. In addition, interest for the Mezzanine Loans is subject to a LIBOR floor of 1.0%, plus interest rate spreads ranging from 9.0% to 13.9%, resulting in a weighted average spread of 11.59% as of December 31, 2013. For the Mezzanine Loans, any difference between current LIBOR and the LIBOR floor, as well as the increase in the spreads as a result of the Amendment is deferred until the maturity date of the Mezzanine Loans. Such deferred interest is not to be treated as part of the principal amount of the Mezzanine Loans for any calculation of interest or any other purpose, although it is considered debt under the Mezzanine Loans and secured accordingly.
F-23
Table of Contents
Holdco III debt
In February 2007, subsidiaries of Holdco III entered into a $101.3 million mortgage loan (“Olympus Loan”) with B of A. The Olympus Loan was collateralized by eight hotels owned by us.
Pursuant to the terms of the Olympus Loan, the Olympus Loan matured in February 2009; however, the Olympus Loan allowed us to extend the maturity date of the Olympus Loan for three successive one-year extensions, at our option. In February 2009, we exercised the first extension option, extending the maturity of the Olympus Loan to February 2010. In February 2010, we exercised the second extension option, extending the maturity of the Olympus Loan to February 2011. In February 2011, we exercised the third extension option, extending the maturity of the Olympus Loan to February 2012. The Olympus Loan required monthly interest payments based upon LIBOR plus a spread of 1.4%.
In June 2009, we extended the maturity date of our existing $250.0 million revolving credit facility (“Revolver”) with B of A and other lenders (“Revolver Lenders”) to June 26, 2010. The Revolver was collateralized by 20 hotels owned by us.
In June 2010, we obtained a new mortgage loan (“HCIII Loan”) in the amount of $177.9 million which replaced the expiring Revolver, and the Funds concurrently made a contribution of $34.6 million which was used to release three collateralized properties. As a result, the HCIII Loan was collateralized by 17 of our hotels. Under the terms of the HCIII Loan, we were required to make monthly interest payments at LIBOR with a floor of 1.0% plus 3.5%.
In December 2011, we amended and restated the HCIII Loan. Under the new terms of the loan, the Olympus Loan and HCIII Loan were combined into one mortgage loan (“Holdco III Mortgage Loan”) with an outstanding balance of $237.3 million, and the maturity date was extended to June 2013. The Holdco III Mortgage Loan is collateralized by 25 hotels owned by us.
In connection with the closing of the Holdco III Mortgage Loan in December 2011, we made a principal payment on the Holdco III Mortgage Loan of approximately $7.8 million, paid fees of approximately $1.2 million and wrote off approximately $0.5 million of deferred financing costs, which is included in other income (loss) in the combined statements of operations. Further, B of A agreed to reduce the principal amount outstanding by approximately $11.9 million. The carrying amount of the Holdco III Mortgage Loan has not been changed as a result of this reduction. The reduction in the amount outstanding is being amortized as a reduction in interest expense through the extended maturity date using a straight-line basis, which approximates the effective interest method.
In June 2013, we exercised our extension option and extended the maturity date of the Holdco III Mortgage Loan to July 2014. Under the terms of the Holdco III Mortgage Loan, we are required to make monthly interest payments at LIBOR with a floor of 1.0% plus a spread of 4.0% through July 2012, and thereafter at LIBOR with a floor of 1.0% plus a spread of 4.5%.
F-24
Table of Contents
Under the terms of the loans discussed above, we are required to make deposits into certain escrow accounts for the payments of debt service, taxes, insurance, and ground leases. As of December 31, 2013 and 2012, amounts held in escrow and included in current restricted cash were as follows:
| (In thousands) | 2013 | 2012 | ||||||
|
|
||||||||
| Taxes escrow fund |
$ | 22,191 | $ | 27,040 | ||||
| Operational and capital replacement reserve |
30,521 | 25,201 | ||||||
| Excess cash flow reserve |
42,251 | 51,919 | ||||||
| Ground lease reserve escrow |
2,163 | 654 | ||||||
|
|
|
|||||||
| Total |
$ | 97,126 | $ | 104,814 | ||||
|
|
||||||||
Interest rate caps
Pursuant to the terms of the Loans and the Holdco III Mortgage Loan, we are required to maintain interest rate caps under certain defined conditions until the maturity date. The effect of the interest rate cap agreements is to limit our maximum interest rate exposure with respect to increases in LIBOR through the maturity date. We have purchased and maintained the required interest rate caps during 2013, 2012, and 2011, and the related gain or loss on these investments is reflected within other income (loss) in the accompanying statements of operations.
As of December 31, 2013, 2012 and 2011, the interest rate caps we held are estimated to have no value. Management expects that, should it be necessary, the counter parties will fully perform under the terms of the interest rate cap agreements.
Subordinated notes
In conjunction with the Company being acquired by Blackstone in January 2006, we assumed approximately $7.6 million principal amount of unsecured, subordinated notes (the “Subordinated Notes”). The Subordinated Notes, originally issued in March 2003, bore interest at an annual interest rate of 8.875%, and required semiannual interest only payments in March and September of each year. The Subordinated Notes matured and were paid on March 15, 2011.
At the date of acquisition, the Subordinated Notes were valued at approximately $7.6 million, including a premium of $0.6 million, representing fair value. The premium was amortized on a straight-line basis, which approximates the effective interest method. The premium amortization is reflected within interest expense, net in the accompanying combined statements of operations.
Letters of credit
In April 2010, we obtained two letters of credit through Wells Fargo Bank, N.A. aggregating approximately $9.2 million. In January 2012, the Company and Wells Fargo Bank, N.A. agreed to reduce the two letters of credit by $2.0 million, to approximately $7.2 million. In October 2013, the Company and Wells Fargo Bank, N.A. agreed to reduce the two letters of credit by $1.5 million, to approximately $5.7 million. We are required to pay a fee of 2.0% per annum related to these letters of credit, and paid fees of approximately $0.2 million, $0.2 million and $0.3 million for years ended December 31, 2013, 2012 and 2011, respectively.
F-25
Table of Contents
Interest expense, net
Interest expense consisted of the following for the years ended December 31, 2013, 2012 and 2011:
| Description | 2013 | 2012 | 2011 | |||||||||
|
|
||||||||||||
| (In thousands) | ||||||||||||
| Mortgage Loan |
$ | 69,203 | $ | 47,553 | $ | 26,113 | ||||||
| Holdco III Mortgage Loan |
12,121 | 12,390 | 9,983 | |||||||||
| Mezzanine Loans: |
||||||||||||
| Current |
9,025 | 8,590 | 7,186 | |||||||||
| Deferred |
52,877 | 32,332 | — | |||||||||
| Amortization of long-term debt reduction |
(4,595 | ) | (4,595 | ) | (384 | ) | ||||||
| Subordinated Notes |
— | — | 45 | |||||||||
| Amortization of premium on Subordinated Notes |
— | — | (29 | ) | ||||||||
| Amortization of deferred financing costs |
10,155 | 7,046 | 9,046 | |||||||||
| Other interest |
22 | 26 | 26 | |||||||||
| Interest income |
(193 | ) | (218 | ) | (375 | ) | ||||||
|
|
|
|||||||||||
| Total interest expense, net |
$ | 148,615 | $ | 103,124 | $ | 51,611 | ||||||
|
|
||||||||||||
New credit agreement
Subject to customary closing conditions and consummation of the IPO (See Note 1), Holdings will become our parent. Concurrently with, and subject to the completion of the IPO, Holdings’ wholly owned subsidiary, La Quinta Intermediate Holdings L.L.C. (the “Borrower”) intends to enter into a new credit agreement (the “Agreement”) with JPMorgan Chase Bank, N.A. (“JPM”), as administrative agent, collateral agent, swingline lender and L/C issuer, J.P. Morgan Securities LLC, Morgan Stanley Senior Funding, Inc., Merrill Lynch, Pierce, Fenner & Smith Incorporated, Citigroup Global Markets Inc., Credit Suisse Securities (USA) LLC, Deutsche Bank Securities Inc., Goldman Sachs Bank USA, and Wells Fargo Securities, LLC, as joint lead arrangers and joint book runners, and the other agents and lenders from time to time party thereto.
The credit agreement provides for senior secured credit facilities (collectively the “Senior Facilities”) consisting of:
| • | $2.1 billion senior secured term loan facility (the “Term Facility”), which will mature in 2021; and |
| • | $250 million senior secured revolving credit facility (the “Revolving Facility”), $50 million of which is available in the form of letters of credit, which will mature in 2019. |
On February 21, 2014, the Borrower agreed with the joint lead arrangers on the terms of the Agreement and the joint lead arrangers allocated participation in the Senior Facilities to the lenders.
The Revolving Facility includes borrowing capacity available for letters of credit and for short-term borrowings referred to as the swing line borrowings. In addition, the Senior Facilities also provide the Borrower with the option to raise incremental credit facilities including an uncommitted incremental facility that provides the Borrower the option to increase the amounts available under the Term Facility and/or the Revolving Facility by an aggregate of up to $350 million, subject to additional increases upon achievement of a consolidated first lien net leverage
F-26
Table of Contents
ratio of less than or equal to 6.00 to 1.00 (or, after the first anniversary of the closing date, 5.75 to 1.00), refinance the loans with debt incurred outside the Senior Facilities, and extend the maturity date of the Revolving Credit Facility and Term Facility, subject to certain limitations.
It is our expectation that, the proceeds of the Term Facility, together with the net cash proceeds of the IPO, will be used to repay the Loans and the Holdco III Mortgage Loan along with the acquisition of the Managed Hotels. The proceeds of the Revolving Facility will be used for general corporate purposes as needed. If the IPO is not successful, management intends to obtain other financing to replace the existing debt in place.
Interest Rate and Fees—Borrowings under the Term Facility bear interest, at the Borrower’s option, at a rate equal to a margin over either (a) a base rate determined by reference to the highest of (1) the JPM prime lending rate, (2) the Federal Funds Effective Rate plus 1/2 of 1.00% and (3) the adjusted LIBOR rate for a one-month interest period plus 1.00% or (b) a LIBOR rate determined by reference to the Reuters LIBOR rate for the interest period relevant to such borrowing. The margin for the Term Facility is 2.00%, in the case of base rate loans, and 3.00%, in the case of LIBOR rate loans, subject to one step-down of 0.25% upon the achievement of a consolidated first lien net leverage ratio (as defined in the Agreement) of less than or equal to 4.50 to 1.00, subject to a base rate floor of 2.00% and a LIBOR floor of 1.00%.
Borrowings under the Revolving Facility will bear interest, at the Borrower’s option, at a rate equal to a margin over either (a) a base rate determined by reference to the highest of (1) the JPM prime lending rate, (2) the Federal Funds Effective Rate plus 1/2 of 1.00% and (3) the adjusted LIBOR rate for a one-month interest period plus 1.00% or (b) a LIBOR rate determined by reference to the Reuters LIBOR rate for the interest period relevant to such borrowing. The margin for the Revolving Facility is 1.50%, in the case of base rate loans, and 2.50%, in the case of LIBOR rate loans, subject to three step-downs of 0.25% each upon the achievement of a consolidated first lien net leverage ratio of less than or equal to 5.00 to 1.00, 4.50 to 1.00 and 4.00 to 1.00, respectively.
In addition, the Borrower is required to pay a commitment fee to the lenders under the Revolving Facility in respect of the unutilized commitments thereunder. The commitment fee rate is 0.50% per annum subject to a step-down to 0.375%, upon achievement of a consolidated first lien net leverage ratio less than or equal to 5.00 to 1.00. The Borrower is also required to pay customary letter of credit fees.
The Borrower will also be subject to a ticking fee (“Ticking Fee”) on the average daily amount of the allocations for the period between the date the allocations are notified to the lenders until the earlier of the closing date or the date of termination of the allocations. The Ticking Fee will be as follows:
| Number of days after allocation | Ticking fee per annum |
|||
|
|
||||
| 0-30 |
0.00% | |||
| 31-75 |
1.50% | |||
| Over 75 |
3.00% | |||
|
|
||||
F-27
Table of Contents
Prepayments—The Term Facility requires mandatory prepayments, subject to certain exceptions, with:
| • | 50% (which percentage will be reduced to 25% and 0%, as applicable, subject to achievement of a consolidated first lien net leverage ratio of less than or equal to 5.25 to 1.00 and 4.00 to 1.00, respectively) of annual excess cash flow, calculated in accordance with the Agreement; |
| • | 100% of the net cash proceeds (including insurance and condemnation proceeds) of all non-ordinary course asset sales or other dispositions of property by the Borrower and its restricted subsidiaries subject to de minimus thresholds, if those net cash proceeds are not reinvested in assets to be used in the Borrower’s business or to make certain other permitted investments (a) within 12 months of the receipt of such net cash proceeds or (b) if the borrower commits to reinvest such net cash proceeds within 12 months of the receipt thereof, within 180 days of the date of such commitment; and |
| • | 100% of the net proceeds of any incurrence of debt by the Borrower or any of its restricted subsidiaries, other than debt permitted to be incurred or issued under the Senior Facilities. |
Each lender of the Term Facility will have the right to reject its pro rata share of mandatory prepayments described above, in which case the Borrower may retain the amounts so rejected.
The foregoing mandatory prepayments will be applied to installments of the Term Facility in direct order of maturity.
The Borrower has the ability to voluntarily repay outstanding loans at any time without premium or penalty, other than prepayment premium of 1.0% on voluntary prepayment of Term Facility in connection with a repricing transaction on or prior to the date which is six months after the closing of the Senior Facilities and customary “breakage” costs with respect to LIBOR loans.
Amortization—The Borrower is required to repay installments on the Term Facility in quarterly installments equal to 0.25% of the original principal amount of the Term Facility, with the remaining amount payable on the applicable maturity date with respect to the Term Facility.
Guarantees and security—The obligations under the Senior Facilities will be unconditionally and irrevocably guaranteed by Holdings, any subsidiary of Holdings that directly or indirectly owns any issued and outstanding equity interests of the Borrower, and, subject to certain exceptions, each of the Borrower’s existing and future material domestic wholly owned subsidiaries (collectively, the “Guarantors”). In addition, the Senior Facilities will be collateralized by first priority or equivalent security interests in (i) all the capital stock, or other equity interests in, the Borrower and each of the Borrower’s and the Guarantors’ material direct or indirect wholly owned restricted domestic subsidiaries, and 65% of the voting stock (and 100% of the nonvoting stock) of, or other equity interests in, each of the Borrower’s or any subsidiary guarantors’ material direct wholly owned first-tier restricted foreign subsidiaries, and (ii) certain tangible and intangible assets of the Borrower (other than real property except for certain real property described in the credit agreement) and Guarantors (subject to certain exceptions and qualifications).
As of the closing date for the Senior Facilities, Holdings does not expect any of its foreign subsidiaries, non-wholly owned domestic subsidiaries that are restricted subsidiaries or immaterial subsidiaries to guarantee the Senior Facilities. The Borrower will also have the ability to designate certain subsidiaries as unrestricted subsidiaries utilizing its investment capacity under the Agreement.
F-28
Table of Contents
Certain covenants and events of default—The Agreement contains a number of significant affirmative and negative covenants and customary events of default. Such covenants, among other things, will limit or restrict, subject to certain exceptions, the ability of (i) Holdings, the direct parent of the Borrower, to engage in any material operating or business activities other than the ownership of the equity interests of the Borrower and (ii) the Borrower and its restricted subsidiaries to:
| • | incur additional indebtedness and make guarantees |
| • | create liens on assets; |
| • | enter into sale and leaseback transactions; |
| • | engage in mergers or consolidations; |
| • | sell certain assets; |
| • | make fundamental changes; |
| • | pay dividends and distributions or repurchase capital stock; |
| • | make investments, loans and advances; |
| • | engage in certain transactions with affiliates; |
| • | make changes in the nature of their business; and |
| • | make prepayments of junior debt. |
In addition, if, on the last day of any period of four consecutive quarters on or after the first full fiscal quarter following the closing of the Senior Facilities, the aggregate principal amount of the Revolving Facility, swing line loans and/or letters of credit (excluding up to $20 million of letters of credit and certain other letters of credit that have been cash collateralized or back-stopped) that are issued and/or outstanding is greater than 25% of the Revolving Facility, the Agreement will require the Borrower to maintain a consolidated first lien net leverage ratio not to exceed 8.0 to 1.0.
During the period in which Holdings’ corporate issuer rating is equal to or higher than Baa3 (or the equivalent) according to Moody’s Investors Service, Inc. or BBB- (or the equivalent) according to Standard & Poor’s Ratings Services and no default has occurred and is continuing, the restrictions in the Senior Facility regarding incurring additional indebtedness, dividends and distributions or repurchases of capital stock and transactions with affiliates will not apply to the Borrower and its restricted subsidiaries during such period.
The Senior Facilities also contain certain customary representations and warranties, affirmative covenants and events of default. If an event of default occurs, the lenders under the Senior Facilities will be entitled to take various actions, including the acceleration of amounts due under the Senior Facilities and actions permitted to be taken by a secured creditor.
F-29
Table of Contents
Note 9. Accrued expenses and other liabilities
Accrued expenses and other liabilities include the following as of December 31, 2013 and 2012:
| (In thousands) | 2013 | 2012 | ||||||
|
|
||||||||
| Accrued automobile and general liability insurance |
$ | 21,290 | $ | 20,308 | ||||
| Accrued sales and occupancy taxes |
11,567 | 11,661 | ||||||
| Accrued guest loyalty program points |
5,330 | 4,717 | ||||||
| Accrued interest |
5,583 | 5,787 | ||||||
| Other accrued expenses |
9,801 | 10,908 | ||||||
|
|
|
|||||||
| Total accrued expenses and other liabilities |
$ | 53,571 | $ | 53,381 | ||||
|
|
||||||||
Note 10. Fair value measurements
The carrying amount and estimated fair values of our financial assets and liabilities, which include related current portions, were as follows:
| December 31, 2013 | December 31, 2012 | |||||||||||||||
| (In thousands) | Carrying amount |
Fair value | Carrying amount |
Fair value | ||||||||||||
|
|
||||||||||||||||
| Cash and cash equivalents(1) |
$ | 33,412 | $ | 33,412 | $ | 40,813 | $ | 40,813 | ||||||||
| Restricted cash(1) |
104,026 | 104,026 | 113,407 | 113,407 | ||||||||||||
| Long-term debt(2) |
2,720,286 | 2,715,695 | 2,899,965 | 2,889,328 | ||||||||||||
|
|
||||||||||||||||
| (1) | Classified as Level 1 under the fair value hierarchy. |
| (2) | Classified as Level 3 under the fair value hierarchy. |
We believe the carrying amounts of our cash and cash equivalents approximated fair value as of December 31, 2013 and 2012. Our estimates of the fair values were determined using available market information and valuation methods appropriate in the circumstances. Considerable judgment is necessary to interpret market data and develop estimated fair values. Proper placement of fair value measurements within the valuation hierarchy is considered each reporting period. Third-party information received for calculating Level 3 fair value measurements is reviewed to ensure it is in accordance with GAAP. The use of different market assumptions or estimation methods may have a material effect on the estimated fair value amounts.
Restricted cash is primarily comprised of short-term interest-bearing money market funds with maturities of less than 90 days and time deposits. The estimated fair values were based on available market pricing information of similar financial instruments.
We estimate the fair value of our long-term debt using discounted cash flow analysis based on current market inputs for similar types of arrangements. The primary sensitivity in these calculations is based on the selection of appropriate discount rates. As of December 31, 2013 and 2012 we estimated the discount rate to be approximately 5.3% and 5.0%, respectively. Fluctuations in these assumptions will result in different estimates of fair value.
We test long-lived assets, which include property and equipment and other intangible assets, for impairment annually or more frequently if events or changes in circumstances indicate that the asset might be impaired. For the year ended December 31, 2013, no impairment was recorded on our assets held for use. In connection with the impairment test in 2012, we determined that
F-30
Table of Contents
property and equipment related to certain of our owned hotels, which became assets held for sale during the second quarter of 2013 (See Note 6), were partially impaired primarily due to changes in the assumed holding period and, as a result, we recorded an impairment loss of approximately $51.5 million for the year ended December 31, 2012. For the year ended December 31, 2011, no impairment was recorded on our assets held for use. The impairment losses for 2012 are included within discontinued operations in the accompanying combined statements of operations.
For these purposes, fair value of the properties was estimated primarily using comparable market transactions. One of the significant inputs to these fair value estimates, the per-key cost required at the time of asset transfer, is considered to be Level 3 within the fair value measurement hierarchy. A cost of $3,000 per room was utilized for this unobservable input.
We estimate the fair value of hotels classified as held for sale using the lower of cost or estimated fair value. The inputs used in determining the fair value are considered to be Level 2 and Level 3 within the fair value measurement hierarchy. Level 2 reflects our sales price as determined by contract with the buyer, less associated closing costs. Level 3 reflects our sales price as determined by contract with buyer, less estimated associated closing costs. For the year ended December 31, 2013, we recorded an impairment loss of approximately $19.5 million related to hotels classified as held for sale which are included within discontinued operations in the accompanying combined statements of operations.
The following fair value hierarchy table presents information of our hotels classified as assets held for sale measured at fair value on a non-recurring basis as of December 31, 2013, and related impairment charges recorded:
| December 31, 2013 | Level 1 | Level 2 | Level 3 | Total fair value | Impairment charge |
|||||||||||||||
|
|
||||||||||||||||||||
| (In thousands) | ||||||||||||||||||||
| 4 La Quinta Inns |
$ | — | $ | — | $ | 7,134 | $ | 7,134 | $ | 1,113 | ||||||||||
|
|
|
|||||||||||||||||||
| $ | — | $ | — | $ | 7,134 | $ | 7,134 | $ | 1,113 | |||||||||||
|
|
||||||||||||||||||||
The following fair value hierarchy table presents information of our hotels measured at fair value on a non-recurring basis as of December 31, 2012, and related impairment charges recorded:
| December 31, 2012 | Level 1 | Level 2 | Level 3 | Total fair value | Impairment charge |
|||||||||||||||
|
|
||||||||||||||||||||
| (In thousands) | ||||||||||||||||||||
| 7 Baymont hotels(1) |
$ | — | $ | 1,755 | $ | 12,600 | $ | 14,355 | $ | 13,561 | ||||||||||
| 14 La Quinta Inns |
— | — | 31,104 | 31,104 | 39,115 | |||||||||||||||
| 1 La Quinta Inn and Suites |
— | — | 2,603 | 2,603 | 552 | |||||||||||||||
|
|
|
|||||||||||||||||||
| $ | — | $ | 1,755 | $ | 46,307 | $ | 48,062 | $ | 53,228 | |||||||||||
|
|
||||||||||||||||||||
| (1) | Includes one hotel located in Detroit, Michigan that was sold in December 2012. (See Note 6) |
Note 11. Third party lease commitments
Rental Income—We act as a lessor and lease properties we own to third parties, which are primarily operated as restaurants. These leases are accounted for as operating leases and mature on various dates through 2039. The leases provide for minimum and contingent rental income based on a percentage of the lessee’s annual sales in excess of stipulated amounts.
F-31
Table of Contents
As of December 31, 2013, approximate future minimum rental income to be received under non-cancelable operating leases, in excess of one-year, is as follows:
| Year ending December 31, | Operating lease income |
|||
|
|
||||
| (In thousands) | ||||
| 2014 |
$ | 4,480 | ||
| 2015 |
4,236 | |||
| 2016 |
3,772 | |||
| 2017 |
3,214 | |||
| 2018 |
2,758 | |||
| Thereafter |
5,423 | |||
|
|
|
|||
| $ | 23,883 | |||
|
|
||||
Total rental revenue was approximately $3.8 million, of which $0.3 million related to contingent rents, for the year ended December 31, 2013. Total rental revenue was approximately $4.5 million, of which $0.3 million related to contingent rents, for the year ended December 31, 2012. Total rental revenue was approximately $4.6 million, of which $0.3 million related to contingent rents, for the year ended December 31, 2011. Rental revenue is included within other hotel revenues.
Rental Expense—We maintain ground lease arrangements with third parties for certain hotel properties that contain contingent rent provisions based upon the respective hotel’s revenues. Many of these lease agreements contain renewal options at fair market value at the conclusion of the initial lease terms. The leases extend for varying periods through 2096.
| Year ending December 31, | Operating ground lease commitments |
|||
|
|
||||
| (In thousands) | ||||
| 2014 |
$ | 3,489 | ||
| 2015 |
3,451 | |||
| 2016 |
3,482 | |||
| 2017 |
3,100 | |||
| 2018 |
2,906 | |||
| Thereafter |
94,921 | |||
|
|
|
|||
| $ | 111,349 | |||
|
|
||||
Total rent expense for ground leases included in other lodging and operating expenses was approximately $3.7 million, of which $0.1 million related to contingent rents, for the year ended December 31, 2013. Total rent expense was approximately $3.7 million, of which $0.2 million related to contingent rents, for the year ended December 31, 2012. Total rent expense was approximately $3.6 million, of which $0.1 million related to contingent rents, for the year ended December 31, 2011.
Note 12. Income taxes
Each of the Holdcos is a limited liability company that is treated as a partnership for federal income tax purposes and, as such, is not subject to federal and most state income taxes. Accordingly, no federal or state income taxes (with the exception described in the following
F-32
Table of Contents
paragraphs) have been recorded in the accompanying combined financial statements. For federal and state income tax purposes, the operating results of each of the Holdcos are reportable by their respective members.
Certain of our subsidiaries have elected to be treated as REITs for federal income tax purposes under the United States Internal Revenue Code. To qualify as REITs, these subsidiaries must meet all of the required organizational and operational requirements, including a requirement that the REIT distribute at least 90% of its regular taxable income to its shareholders as dividends eligible for the dividends paid deduction. The REIT subsidiaries intend to adhere to these requirements. If the REIT subsidiaries fail to qualify as REITs in any taxable year, they would be subject to federal income taxes at regular corporate rates (including any applicable alternative minimum tax) and might not qualify as REITs for the four subsequent taxable years. For this reason, one of our REITs formed taxable subsidiaries to hold certain assets that could otherwise adversely affect its REIT status. These taxable subsidiaries are subject to federal and state income taxes.
LQM is a limited liability company, which is not subject to federal income taxes. For federal income tax purposes, the operating results of LQM are reportable by LQM’s members.
For financial reporting purposes, the combined income tax expense is based on combined reported financial accounting income or loss before non-controlling interests and income taxes.
The components of our income tax provision are as follows:
| (In thousands) | 2013 | 2012 | 2011 | |||||||||
|
|
||||||||||||
| Current provision: |
||||||||||||
| Federal |
$ | 874 | $ | 812 | $ | 182 | ||||||
| State(1). |
2,543 | 1,940 | 2,187 | |||||||||
| Foreign |
205 | 497 | — | |||||||||
|
|
|
|||||||||||
| Total current |
3,622 | 3,249 | 2,369 | |||||||||
| Deferred provision: |
||||||||||||
| Federal |
(34 | ) | (43 | ) | (7 | ) | ||||||
| State |
77 | 77 | 74 | |||||||||
|
|
|
|||||||||||
| Total deferred |
43 | 34 | 67 | |||||||||
|
|
|
|||||||||||
| Total provision for income taxes |
$ | 3,665 | $ | 3,283 | $ | 2,436 | ||||||
|
|
||||||||||||
| (1) | The State current provision contains approximately $67,000, $148,000 and $140,000 included in gain (loss) on discontinued operations for the years ended December 31, 2013, 2012 and 2011. |
Deferred tax assets and liabilities reflect the temporary differences between the carrying amounts of our combined assets and liabilities for financial reporting purposes and the amounts used for income tax reporting purposes.
F-33
Table of Contents
Significant components of our combined deferred tax assets and liabilities are as follows:
| (In thousands) | 2013 | 2012 | ||||||
|
|
||||||||
| Current deferred tax assets (liabilities): |
||||||||
| Accrued liabilities |
$ | 13,460 | $ | 14,623 | ||||
| Bad debt allowance |
1,180 | 987 | ||||||
|
|
|
|||||||
| Total current deferred tax assets |
14,460 | 15,610 | ||||||
| Less valuation allowance |
(14,460 | ) | (15,610 | ) | ||||
|
|
|
|||||||
| Net current deferred tax assets |
$ | — | $ | — | ||||
|
|
|
|||||||
| Long-term deferred tax assets (liabilities): |
||||||||
| Net operating loss carry forwards |
$ | 115,526 | $ | 207,387 | ||||
| Texas margin tax credit |
2,990 | 3,070 | ||||||
| Alternative minimum tax credit carry forward, net |
6,733 | 5,621 | ||||||
| Partnership investment |
(12 | ) | (51 | ) | ||||
| Other |
18 | 20 | ||||||
| Installment sale |
(396 | ) | (396 | ) | ||||
|
|
|
|||||||
| Total long-term deferred tax assets |
124,859 | 215,651 | ||||||
| Less valuation allowance |
(122,259 | ) | (213,008 | ) | ||||
|
|
|
|||||||
| Net long-term deferred tax assets (liabilities) |
$ | 2,600 | $ | 2,643 | ||||
|
|
||||||||
As of December 31, 2013 and 2012, certain subsidiaries of ours have available federal net operating loss carryforwards (“NOLs”) totaling approximately $318.1 million and $586.5 million,
respectively. Generally, NOL carryforwards expire 20 years after the year in which they arise. Our NOLs will expire between 2016 and 2033. We also have alternative minimum tax (“AMT”) credit carry forwards, as of December 31, 2013 and 2012, in the gross amount of $7.0 million and $5.9 million, respectively, which do not expire. We maintain valuation allowances for our NOLs and AMT credit carry forwards as we believe the more-likely-than-not realization criteria are not met and therefore realization is not reasonably assured. When assessing the adequacy of the valuation allowance, the Company considers both anticipated reversals of deferred tax liabilities within applicable carryforward periods and other potential sources of taxable income within those periods. In 2013, we concluded that the likelihood of utilizing certain loss carryforwards in future periods was remote. Accordingly, we wrote off the deferred tax assets and associated valuation allowances relate to those carryforwards. The reduction in these deferred tax assets and related valuation allowances has no net impact our financial condition, results of operations or cash flows. The Company has open tax years dating back to 2010 (See Note 14).
The state of Texas imposes a margin tax, with an effective rate of 0.7%, based on the prior year’s Texas-sourced gross receipts, as defined, less a statutory percentage of available Texas margin tax credits. As of December 31, 2013 and 2012, we had approximately $3.0 million and $3.1 million, respectively, of Texas margin tax credits that meet the more-likely-than-not criteria to be recognized as a benefit against future margin tax. The credits are scheduled to be utilized annually over a period ending in 2026. This tax is treated as an income tax and accrued in the accounting period in which the taxable gross receipts are recognized.
F-34
Table of Contents
The following is a reconciliation of the statutory federal income tax rate to the effective tax rate reported in the combined financial statements:
| (In thousands) | 2013 | 2012 | 2011 | |||||||||
|
|
||||||||||||
| Statutory U.S federal income tax provision |
35.0% | 35.0% | 35.0% | |||||||||
| Income not subject to tax at the Predecessor Entities level |
(33.9 | ) | (34.5 | ) | (34.8 | ) | ||||||
| State income taxes |
29.6 | 9.2 | 3.5 | |||||||||
| Foreign income taxes |
2.4 | 2.5 | — | |||||||||
| Increase in AMT valuation allowances |
7.1 | 2.8 | — | |||||||||
| Other, net |
1.6 | 0.5 | 0.1 | |||||||||
|
|
|
|||||||||||
| Effective income tax rate |
41.8% | 15.5% | 3.8% | |||||||||
|
|
||||||||||||
Note 13. Related party transactions
We maintain various agreements and enter into certain transactions with affiliates of the Funds. These affiliates own the 14 La Quinta-branded Managed Hotels which are managed by LQM. The following is a discussion of these arrangements and resulting transactions:
Management and service agreements
Hotel management agreements—Pursuant to hotel management agreements (“LQM Management Agreements”), LQM provides management services to the Managed Hotels, including supervision, direction, operation, management and promotion. The LQM Management Agreements will expire in July 2027, but may be terminated by either party at any time and for any reason. Under the terms of the LQM Management Agreements, LQM is entitled to receive from hotels it manages a management fee of 1.67% of gross operating revenue, as well as reimbursement for certain shared group costs.
Management fees earned by LQM from the Managed Hotels, for the years ended December 31, 2013, 2012 and 2011 were approximately $0.6 million. These management fees are included within franchise and other fee-based revenues in the accompanying combined statements of operations.
In addition, in accordance with the LQM Management Agreements, LQM also provides certain group services for Managed Hotels including group and administrative services, information systems support, training, and other field services and is reimbursed for the cost of providing these services. During 2013, LQM earned from Managed Hotels approximately $1.6 million of group services reimbursements. During 2012, LQM earned from Managed Hotels approximately $1.5 million of group services reimbursements. During 2011, LQM earned from Managed Hotels approximately $1.3 million of group services reimbursements. These fees are included within franchise and other fees-based revenues in the accompanying combined statements of operations.
Other fees and funding
Brand management fund—We maintain the BMF on behalf of our franchisees and the hotel properties we own and manage, and we charge these hotels a fee of 2.5% of room revenue, which is then used by the BMF to fund national advertising promotions and campaigns (See Note 2). BMF fees collected from franchised and Managed Hotels, and the related expenses, are reflected as other revenues and expenses from franchise and managed hotels in the accompanying combined statements of operations.
F-35
Table of Contents
Customer loyalty program—We administer Returns, and charge participating hotels a fee to administer the program equal to 5% of the Returns members’ eligible room rate per night. These fees are recorded within franchise and other fees-based revenues in the accompanying combined statements of operations. We recorded fees related to Returns from the Managed Hotels of approximately $0.9 million, $0.7 million and $0.6 million during 2013, 2012 and 2011, respectively.
Trademark licenses—In accordance with our Management Agreements with the Managed Hotels, we charge a royalty fee of 0.33% of the Managed Hotels’ gross revenues. During 2013, 2012 and 2011, royalty fees charged to Managed Hotels, under these agreements, were approximately $0.1 million, respectively. This royalty fee is recorded within franchise and other fee-based revenues in the accompanying combined statements of operations.
Receivables from affiliates—As of December 31, 2013 and 2012, receivables from the parent company of the Managed Hotels, which is an affiliate of the Funds, were approximately $10.9 million and $8.3 million, respectively. These receivables occur in the ordinary course of business and are settled from time to time.
We also purchase products and services from entities affiliated with or owned by Blackstone. The fees paid for these products and services were approximately $4.0 million, $3.3 million and $3.1 million, during the years ended December 31, 2013, 2012 and 2011, respectively.
Note 14. Commitments and contingencies
Environmental—We are subject to certain requirements and potential liabilities under various federal, state and local environmental laws, ordinances, and regulations. Such requirements often impose liability without regard to whether the current or previous owner or operator knew of, or was responsible for, the presence of such hazardous or toxic substances. Although we have incurred and expect to incur remediation and other environmental costs during the ordinary course of operations, we anticipate that such costs will not have a material effect on our operations or our combined financial condition, results of operations, or cash flows.
Litigation—We are also party to a number of other pending claims and lawsuits arising in the normal course of business. We maintain general and other liability insurance; however, certain costs of defending lawsuits, such as those below the insurance deductible amount, are not covered by or are only partially covered by insurance policies, or the insurance carriers could refuse to cover certain claims in whole or in part. We regularly evaluate our ultimate liability costs with respect to such claims and lawsuits. We accrue costs incurred from defending litigation as they become determinable. We do not consider our ultimate liability with respect to any single claim or lawsuit, or the aggregate of such claims and lawsuits, to be material in relation to our combined financial condition, results of operations, or our cash flows taken as a whole.
Casualty losses—We maintain insurance for property and casualty damage, subject to deductibles and policy terms and conditions, attributable to wind, flood, and earthquakes. We also maintain business interruption insurance.
In 2013, one of our hotels in Minnesota sustained damage from wind and another in Louisiana sustained damage from a tornado. In 2012, one of our hotels in Oklahoma and another in Ohio sustained damage from wind. In addition, four of our hotels in Missouri and five in Texas sustained damage from hail storms. Additionally, 23 hotels in Florida, Louisiana, Alabama, Massachusetts, Rhode Island, New York and Connecticut were impacted by hurricanes.
F-36
Table of Contents
We have filed insurance claims with our insurance carriers related to these casualty disasters. As of December 31, 2013 and 2012, we have a receivable due from insurance carriers for expected insurance proceeds of approximately $0.4 million and $0.9 million, respectively, for property damage, which is included within accounts receivable in the accompanying combined balance sheets. During 2013 and 2012, we recorded a loss of approximately $0.5 million and $5.3 million, respectively, related to property damage which is included in other lodging and operating expenses in the accompanying combined statements of operations.
Tax contingencies—We are subject to regular audits by federal and state tax authorities. These audits may result in additional tax liabilities. The Internal Revenue Service (“IRS”) is currently auditing the tax returns of one of our REITs and a taxable REIT subsidiary for the tax years ended December 31, 2011 and 2010. On January 9, 2014, we received a draft notice of proposed adjustment from the IRS in the amount of $158 million for the periods under audit in which the IRS has preliminarily asserted that the rent charged for these periods under the lease of hotel properties from the REIT to the taxable REIT subsidiary exceeded an arm’s length rent. We have reviewed the draft notice from the IRS, considered its content, and intend to seek additional input from the IRS. However, we continue to believe that the positions reported on our tax returns under audit by the IRS are, based on their technical merits, more-likely-than-not to be sustained upon examination. Accordingly, as of December 31, 2013, we have not established any reserves related to this draft proposed adjustment or any other issues reflected on the returns under examination.
We believe that we have appropriately provided for taxes in the accompanying combined financial statements. Several factors drive the calculation of our tax reserves. Some of these factors include: (i) the expiration of various statutes of limitations, (ii) changes in tax law and regulations, (iii) issuance of tax rulings, and (iv) settlements with tax authorities. Changes in any of these factors may result in adjustments to our reserves, which could materially impact our combined financial statements.
Purchase commitments—As of December 31, 2013, we had approximately $53.9 million of purchase commitments related to certain continuing redevelopment and renovation projects and other contractual obligations.
Franchise commitments—Under certain franchise agreements, we are committed to provide certain incentive payments, reimbursements, rebates, and other payments to help defray certain franchisee costs. Our obligation to fund these commitments is contingent upon certain conditions set forth in the respective franchise agreement. Our franchise agreements generally require that, in the event that the franchise relationship is terminated, the franchisee is required to pay any outstanding balance owing to us, including the unamortized portion of any incentive payment. As of December 31, 2013, we had approximately $0.5 million in outstanding commitments owed to various franchisees for such financial assistance.
Long-term incentives—Certain members of our management and others associated with Blackstone (the “LTI Participants”) are eligible to receive long-term incentives evidenced by units (the “Units”) in LQ Services L.L.C. (“LQ Services”), which indirectly holds interests in the Company, which Units are intended to be treated as “profits interests” for U.S. tax purposes. Units are typically granted by our Chief Executive Officer, in consultation with Blackstone, to key employees upon hire. Unit levels may also be adjusted to recognize changing job responsibilities. All of the Units are subject to exit-based vesting and will vest on the date when there is a sale, transfer or disposition of all or substantially all of the assets of the Holdcos to an unaffiliated
F-37
Table of Contents
entity which results in distributions being payable to the holders of the Units (a “Liquidity Event”), subject to an LTI Participant’s continued employment on such date. The value in respect of Units is determined based upon the amounts received by Blackstone pursuant to a Liquidity Event, net of certain debt repayments and return of equity to Blackstone. As payments in respect of the Units are contingent on occurrence of a Liquidity Event, which is not assessed to be probable as of the date of the financial statements, no expense has been accrued or recognized for Units granted as of or for the years ended December 31, 2013, 2012, or 2011. Any expense that could result in respect of the Units would be recorded at the time of a Liquidity Event.
Note 15. Employee benefit plans
We maintain a deferred savings plan covering substantially all of our employees that qualify under Section 401(k) of the United States Internal Revenue Code. Our deferred savings plan has an employer matching contribution of 100% of the first 3% and 50% of the next 2% of an employee’s eligible earnings, which vests immediately. We paid employer contributions of approximately $1.9 million, $1.7 million and $1.6 million, respectively, during the years ended December 31, 2013, 2012 and 2011, respectively.
Note 16. Segments
Our operating segments are components of the business which are managed discretely and for which discrete financial information is reviewed regularly by our chief operating decision maker to assess performance and make decisions regarding the allocation of resources. Our chief operating decision maker is our Chief Executive Officer. Our operating and reportable segments are defined as follows:
| • | Owned hotels—This segment derives its earnings from the operation of owned hotel properties located in the United States. |
| • | Franchise and management—This segment derives its earnings primarily from revenues earned under various franchise and management agreements relating to our owned, franchised, and managed hotels, which provide for us to earn compensation for the licensing of our brand to franchisees, as well as for services rendered, such as hotel management and providing access to certain shared services and marketing programs such as reservations, Returns, and property management systems. |
Corporate and other includes revenues generated and operating expenses incurred in connection with the overall support and brand management of our owned, managed, and franchised hotels and operations.
The performance of our operating segments is evaluated primarily based upon Adjusted EBITDA, which should not be considered an alternative to net income (loss) or other measures of financial performance or liquidity derived in accordance with GAAP. We define Adjusted EBITDA as our net income (exclusive of non-controlling interests) before interest expense, income tax expense (benefit), and depreciation and amortization, further adjusted to exclude certain items, including, but not limited to: gains, losses, and expenses in connection with: (i) asset dispositions; (ii) debt modifications/retirements; (iii) non-cash impairment charges; (iv) discontinued operations; and (v) other items.
F-38
Table of Contents
The table below shows summarized combined financial information by segment:
| (In thousands) | 2013 | 2012 | 2011 | |||||||||
|
|
||||||||||||
| Revenues |
||||||||||||
| Owned hotels |
$ | 778,898 | $ | 734,547 | $ | 679,843 | ||||||
| Franchise and management |
55,542 | 50,086 | 44,064 | |||||||||
|
|
|
|||||||||||
| Segment revenues |
834,440 | 784,633 | 723,907 | |||||||||
| Other fee-based revenues from franchise and managed properties |
19,065 | 17,157 | 15,182 | |||||||||
| Corporate and other revenues(1) |
97,177 | 88,870 | 76,178 | |||||||||
| Intersegment elimination(2) |
(76,789 | ) | (72,648 | ) | (63,726 | ) | ||||||
|
|
|
|||||||||||
| Total revenues |
$ | 873,893 | $ | 818,012 | $ | 751,541 | ||||||
|
|
|
|||||||||||
| Adjusted EBITDA |
||||||||||||
| Owned hotels |
311,809 | 285,974 | $ | 250,701 | ||||||||
| Franchise and management |
55,542 | 50,086 | 44,064 | |||||||||
|
|
|
|||||||||||
| Segment adjusted EBITDA |
367,351 | 336,060 | 294,765 | |||||||||
| Corporate and other |
(40,544 | ) | (38,237 | ) | (36,376 | ) | ||||||
|
|
|
|||||||||||
| Adjusted EBITDA |
$ | 326,807 | $ | 297,823 | $ | 258,389 | ||||||
|
|
||||||||||||
| (1) | Includes revenues related to our brand management programs and other cost reimbursements. The portion of these fees that are charged to our owned hotels, which totaled $53.7 million, $51.1 million and 44.1 million for the years ended December 31, 2013, 2012 and 2011, respectively, are eliminated in our combined financial statements. |
| (2) | Includes management, royalty, intellectual property royalty fees, and other cost reimbursements totaling $76.8 million, $72.6 million, and $63.7 million for the years ended December 31, 2013, 2012, and 2011, respectively, which are charged as a cost to our owned hotels and eliminated in our combined financial statements. |
The table below provides a reconciliation of Adjusted EBITDA to EBITDA, and EBITDA to net income attributable to the Company:
| (In thousands) | 2013 | 2012 | 2011 | |||||||||
|
|
||||||||||||
| Adjusted EBITDA |
$ | 326,807 | $ | 297,823 | $ | 258,389 | ||||||
| Fixed asset impairment loss |
(19,533 | ) | (53,228 | ) | — | |||||||
| Income from discontinued operations |
8,636 | 12,723 | 13,543 | |||||||||
| Gain on sale from discontinued operations |
10,714 | — | — | |||||||||
| Loss on retirement of assets |
(359 | ) | (1,562 | ) | (2,168 | ) | ||||||
| Gain (loss) related to casualty disasters |
1,825 | (4,730 | ) | 3,447 | ||||||||
| Gain on extinguishment of debt, net |
— | 1,192 | 11,451 | |||||||||
| Off-cycle management bonus related to debt amendment |
— | (4,932 | ) | — | ||||||||
| Financing costs expensed as incurred |
— | (7,749 | ) | (1,668 | ) | |||||||
| Other gains (losses), net(1) |
(2,697 | ) | 4,111 | 850 | ||||||||
| Termination of long-term contract |
— | — | (5,152 | ) | ||||||||
| EBITDA |
325,393 | 243,648 | 278,692 | |||||||||
| Interest expense |
(148,806 | ) | (103,342 | ) | (51,986 | ) | ||||||
| Income tax expense |
(3,665 | ) | (3,283 | ) | (2,472 | ) | ||||||
| Depreciation and amortization |
(170,401 | ) | (172,787 | ) | (165,295 | ) | ||||||
| Non-controlling interests |
1,455 | 4,810 | 4,574 | |||||||||
|
|
|
|||||||||||
| Net income (loss) attributable to the company |
$ | 3,976 | $ | (30,954 | ) | $ | 63,513 | |||||
|
|
||||||||||||
| (1) | Other losses, net primarily consists of loss on interest rate caps, net income (loss) attributable to the BMF (which, over time, runs at a break-even level, but may reflect a profit or loss from year to year) and litigation reserve adjustments. |
F-39
Table of Contents
The following table presents total assets for our reportable segments, reconciled to consolidated amounts:
| (In thousands) | 2013 | 2012 | ||||||
|
|
||||||||
| Owned hotels |
$ | 2,925,882 | $ | 3,122,256 | ||||
| Franchise and management fees |
192,191 | 191,875 | ||||||
|
|
|
|||||||
| Total segment assets |
3,118,073 | 3,314,131 | ||||||
| Corporate and other |
51,761 | 42,189 | ||||||
|
|
|
|||||||
| Total assets |
$ | 3,169,834 | $ | 3,356,320 | ||||
|
|
||||||||
The following table presents total capital expenditures for our reportable segments, reconciled to our consolidated amounts:
| (In thousands) | 2013 | 2012 | 2011 | |||||||||
|
|
||||||||||||
| Owned hotels |
$ | 97,336 | $ | 89,429 | $ | 85,278 | ||||||
| Franchise and management fees |
— | — | — | |||||||||
|
|
|
|||||||||||
| Total segment capital expenditures |
97,336 | 89,429 | 85,278 | |||||||||
| Corporate and other |
18,193 | 13,457 | 10,274 | |||||||||
|
|
|
|||||||||||
| Total |
$ | 115,529 | $ | 102,886 | $ | 95,552 | ||||||
|
|
||||||||||||
**********
F-40
Table of Contents
Condensed Consolidated Balance Sheets (Unaudited)
As of September 30, 2014 and December 31, 2013
| September 30, 2014 |
December 31, 2013 |
|||||||
|
|
||||||||
| (in thousands, except share data) | ||||||||
| ASSETS |
||||||||
| Current Assets: |
||||||||
| Cash and cash equivalents |
$ | 108,488 | $ | 33,412 | ||||
| Restricted cash |
— | 97,126 | ||||||
| Accounts receivable, net of allowance for doubtful accounts of $5,217 and $4,369 |
38,286 | 32,678 | ||||||
| Receivables from affiliates |
— | 11,181 | ||||||
| Assets held for sale |
— | 7,332 | ||||||
| Deferred tax assets |
5,665 | — | ||||||
| Other current assets |
10,925 | 17,087 | ||||||
|
|
|
|||||||
| Total Current Assets |
163,364 | 198,816 | ||||||
|
|
|
|||||||
| Property and equipment, net of accumulated depreciation |
2,857,128 | 2,761,457 | ||||||
| Intangible assets, net of accumulated amortization |
179,768 | 179,486 | ||||||
| Deferred costs, net of accumulated amortization |
29,318 | 10,153 | ||||||
| Restricted cash |
— | 6,900 | ||||||
| Deferred tax assets |
— | 3,008 | ||||||
| Other non-current assets |
11,527 | 10,014 | ||||||
|
|
|
|||||||
| Total Non-Current Assets |
3,077,741 | 2,971,018 | ||||||
|
|
|
|||||||
| Total Assets |
$ | 3,241,105 | $ | 3,169,834 | ||||
|
|
|
|||||||
| LIABILITIES AND EQUITY |
||||||||
| Current Liabilities: |
||||||||
| Current portion of long-term debt |
$ | 19,450 | $ | 2,720,286 | ||||
| Accounts payable |
23,038 | 30,490 | ||||||
| Payable to affiliates |
1,022 | — | ||||||
| Accrued expenses and other liabilities |
70,700 | 53,571 | ||||||
| Accrued payroll and employee benefits |
31,925 | 26,302 | ||||||
| Accrued real estate taxes |
23,582 | 19,577 | ||||||
|
|
|
|||||||
| Total Current Liabilities |
169,717 | 2,850,226 | ||||||
|
|
|
|||||||
| Long-term debt |
1,910,756 | — | ||||||
| Other long-term liabilities |
19,425 | 13,947 | ||||||
| Deferred tax liabilities |
342,689 | 408 | ||||||
|
|
|
|||||||
| Total Liabilities |
2,442,587 | 2,864,581 | ||||||
|
|
|
|||||||
| Commitments and Contingencies |
||||||||
| Equity: |
||||||||
| Preferred Stock, $0.01 par value; 100,000,000 shares authorized and none outstanding as of September 30, 2014 |
— | — | ||||||
| Common Stock, $0.01 par value; 2,000,000,000 shares authorized as of September 30, 2014, 130,778,665 shares issued and 130,722,563 shares outstanding as of September 30, 2014 |
1,307 | — | ||||||
| Additional paid-in-capital |
1,111,410 | — | ||||||
| Accumulated deficit |
(316,890 | ) | — | |||||
| Treasury stock at cost, 56,102 shares as of September 30, 2014 |
(943 | ) | — | |||||
| Accumulated other comprehensive income |
582 | — | ||||||
| Members’ equity |
— | 319,096 | ||||||
| Noncontrolling interests |
3,052 | (13,843 | ) | |||||
|
|
|
|||||||
| Total Equity |
798,518 | 305,253 | ||||||
|
|
|
|||||||
| Total Liabilities and Equity |
$ | 3,241,105 | $ | 3,169,834 | ||||
|
|
||||||||
The accompanying notes are an integral part of these unaudited condensed consolidated financial statements.
F-41
Table of Contents
Condensed Consolidated Statements of Operations (Unaudited)
For the three and nine months ended September 30, 2014 and 2013
| Three Months Ended | Nine Months Ended | |||||||||||||||
| September 30, 2014 |
September 30, 2013 |
September 30, 2014 |
September 30, 2013 |
|||||||||||||
|
|
||||||||||||||||
| (in thousands, except per share data) | ||||||||||||||||
| REVENUES: |
||||||||||||||||
| Room revenues |
$ | 234,658 | $ | 205,741 | $ | 649,181 | $ | 585,294 | ||||||||
| Franchise and other fee-based revenues |
25,224 | 22,226 | 68,215 | 59,846 | ||||||||||||
| Other hotel revenues |
5,078 | 4,657 | 14,809 | 13,650 | ||||||||||||
|
|
|
|||||||||||||||
| 264,960 | 232,624 | 732,205 | 658,790 | |||||||||||||
| Brand marketing fund revenues from franchise and managed properties |
6,158 | 5,411 | 16,511 | 14,594 | ||||||||||||
|
|
|
|||||||||||||||
| Total Revenues |
271,118 | 238,035 | 748,716 | 673,384 | ||||||||||||
| OPERATING EXPENSES: |
||||||||||||||||
| Direct lodging expenses |
101,076 | 91,567 | 285,430 | 264,208 | ||||||||||||
| Depreciation and amortization |
45,086 | 41,484 | 129,948 | 122,694 | ||||||||||||
| General and administrative expenses |
32,251 | 12,989 | 100,863 | 49,724 | ||||||||||||
| Other lodging and operating expenses |
15,589 | 13,346 | 46,124 | 39,666 | ||||||||||||
| Marketing, promotional and other advertising expenses |
16,639 | 21,560 | 50,170 | 54,226 | ||||||||||||
| Impairment loss |
— | — | 5,157 | — | ||||||||||||
|
|
|
|||||||||||||||
| 210,641 | 180,946 | 617,692 | 530,518 | |||||||||||||
| Brand marketing fund expenses from franchise and managed properties |
6,158 | 5,411 | 16,511 | 14,594 | ||||||||||||
|
|
|
|||||||||||||||
| Total Operating Expenses |
216,799 | 186,357 | 634,203 | 545,112 | ||||||||||||
|
|
|
|||||||||||||||
| Operating Income |
54,319 | 51,678 | 114,513 | 128,272 | ||||||||||||
| OTHER INCOME (EXPENSES): |
||||||||||||||||
| Interest expense, net |
(24,495 | ) | (38,228 | ) | (97,260 | ) | (110,746 | ) | ||||||||
| Loss on extinguishment of debt, net |
— | — | (2,030 | ) | — | |||||||||||
| Other income (loss) |
(795 | ) | 591 | (1,096 | ) | 1,057 | ||||||||||
|
|
|
|||||||||||||||
| Total Other Income (Expenses) |
(25,290 | ) | (37,637 | ) | (100,386 | ) | (109,689 | ) | ||||||||
|
|
|
|||||||||||||||
| Income from Continuing Operations Before Income Taxes |
29,029 | 14,041 | 14,127 | 18,583 | ||||||||||||
| Income tax provision |
(16,162 | ) | (1,006 | ) | (21,860 | ) | (2,526 | ) | ||||||||
| Recognition of net deferred tax liabilities upon C-corporation conversion |
— | — | (321,054 | ) | — | |||||||||||
|
|
|
|||||||||||||||
| Net Income (Loss) from Continuing Operations, net of tax |
12,867 | 13,035 | (328,787 | ) | 16,057 | |||||||||||
| Income (Loss) on Discontinued Operations, net of tax |
— | 9,941 | (503 | ) | (6,303 | ) | ||||||||||
|
|
|
|||||||||||||||
| NET INCOME (LOSS) |
12,867 | 22,976 | (329,290 | ) | 9,754 | |||||||||||
| Income from noncontrolling interests in continuing operations |
(50 | ) | (406 | ) | (3,814 | ) | (1,106 | ) | ||||||||
| Income from noncontrolling interests in discontinued operations |
— | — | — | — | ||||||||||||
|
|
|
|||||||||||||||
| Net income attributable to noncontrolling interests |
(50 | ) | (406 | ) | (3,814 | ) | (1,106 | ) | ||||||||
|
|
|
|||||||||||||||
| Amounts attributable to La Quinta Holdings’ stockholders |
||||||||||||||||
| Income (loss) from continuing operations |
12,817 | 12,629 | (332,601 | ) | 14,951 | |||||||||||
| Income (loss) from discontinued operations |
— | 9,941 | (503 | ) | (6,303 | ) | ||||||||||
|
|
|
|||||||||||||||
| Net Income (Loss) attributable to La Quinta Holdings’ stockholders |
$ | 12,817 | $ | 22,570 | $ | (333,104 | ) | $ | 8,648 | |||||||
|
|
|
|||||||||||||||
| Earnings per share: |
||||||||||||||||
| Basic and diluted |
$ | 0.10 | $ | 0.19 | $ | (2.65 | ) | $ | 0.07 | |||||||
|
|
||||||||||||||||
The accompanying notes are an integral part of these unaudited condensed consolidated financial statements.
F-42
Table of Contents
Condensed Consolidated Statements of Comprehensive Income (Loss) (Unaudited)
For the three and nine months ended September 30, 2014 and 2013
| Three Months Ended | Nine Months Ended | |||||||||||||||
| September 30, 2014 |
September 30, 2013 |
September 30, 2014 |
September 30, 2013 |
|||||||||||||
|
|
||||||||||||||||
| NET INCOME (LOSS) |
$ | 12,867 | $ | 22,976 | $ | (329,290 | ) | $ | 9,754 | |||||||
| Cash flow hedge adjustment, net of tax |
3,118 | — | 582 | — | ||||||||||||
|
|
|
|||||||||||||||
| COMPREHENSIVE NET INCOME (LOSS) |
15,985 | 22,976 | (328,708 | ) | 9,754 | |||||||||||
| Comprehensive net (income) loss attributable to noncontrolling interests |
(50 | ) | (406 | ) | (3,814 | ) | (1,106 | ) | ||||||||
|
|
|
|||||||||||||||
| Comprehensive net income (loss) attributable to La Quinta Holdings’ stockholders |
$ | 15,935 | $ | 22,570 | $ | (332,522 | ) | $ | 8,648 | |||||||
|
|
||||||||||||||||
The accompanying notes are an integral part of these unaudited condensed consolidated financial statements.
F-43
Table of Contents
Condensed Consolidated Statements of Equity (Unaudited)
For the nine months ended September 30, 2014 and 2013
| Members’ Equity |
Equity Attributable to La Quinta Holdings Inc. Stockholders | Noncontrolling Interests |
Total Equity |
|||||||||||||||||||||||||||||||||
| Common Stock | Treasury Stock |
Additional Paid in Capital |
Accumulated Deficit |
Accumulated Loss |
||||||||||||||||||||||||||||||||
| Shares | Amount | |||||||||||||||||||||||||||||||||||
|
|
||||||||||||||||||||||||||||||||||||
| (in thousands, except share data) | ||||||||||||||||||||||||||||||||||||
| Balance as of January 1, 2013 |
$ | 315,255 | — | $ | — | $ | — | $ | — | $ | — | $ | — | $ | (11,870 | ) | $ | 303,385 | ||||||||||||||||||
| Net income |
8,648 | — | — | — | — | — | — | 1,106 | 9,754 | |||||||||||||||||||||||||||
| Distributions |
(135 | ) | — | — | — | — | — | — | (459 | ) | (594 | ) | ||||||||||||||||||||||||
|
|
|
|||||||||||||||||||||||||||||||||||
| Balance as of September 30, 2013 |
$ | 323,768 | — | $ | — | $ | — | $ | — | $ | — | $ | — | $ | (11,223 | ) | $ | 312,545 | ||||||||||||||||||
|
|
|
|||||||||||||||||||||||||||||||||||
| Balance as of January 1, 2014 |
$ | 319,096 | — | $ | — | $ | — | $ | — | $ | — | $ | — | $ | (13,843 | ) | $ | 305,253 | ||||||||||||||||||
| Net income (loss) |
(16,214 | ) | — | — | — | — | (316,890 | ) | — | 3,814 | (329,290 | ) | ||||||||||||||||||||||||
| Capital contributions |
21,516 | — | — | — | — | — | — | — | 21,516 | |||||||||||||||||||||||||||
| Distributions |
(106 | ) | — | — | — | — | — | — | (4,398 | ) | (4,504 | ) | ||||||||||||||||||||||||
| Issuance of common stock |
— | 43,987,500 | 440 | — | 692,781 | — | — | — | 693,221 | |||||||||||||||||||||||||||
| Equity based compensation |
— | 4,434,867 | 44 | — | 39,534 | — | — | — | 39,578 | |||||||||||||||||||||||||||
| Repurchase of common stock |
— | (56,102 | ) | (1 | ) | (943 | ) | — | — | — | — | (944 | ) | |||||||||||||||||||||||
| Acquisitions |
— | 4,348,284 | 44 | — | 73,062 | — | — | — | 73,106 | |||||||||||||||||||||||||||
| Cash flow hedge adjustment, net of tax |
— | — | — | — | — | — | 582 | — | 582 | |||||||||||||||||||||||||||
| La Quinta Predecessor Entities reorganization |
(324,292 | ) | 78,008,014 | 780 | — | 306,033 | — | — | 17,479 | — | ||||||||||||||||||||||||||
|
|
|
|||||||||||||||||||||||||||||||||||
| Balance as of September 30, 2014 |
$ | — | 130,722,563 | $ | 1,307 | $ | (943 | ) | $ | 1,111,410 | $ | (316,890 | ) | $ | 582 | $ | 3,052 | $ | 798,518 | |||||||||||||||||
|
|
||||||||||||||||||||||||||||||||||||
The accompanying notes are an integral part of these unaudited condensed consolidated financial statements.
F-44
Table of Contents
Condensed Consolidated Statements of Cash Flows (Unaudited)
For the nine months ended September 30, 2014 and 2013
| Nine Months Ended | ||||||||
| September 30, 2014 |
September 30, 2013 |
|||||||
|
|
||||||||
| (in thousands) | ||||||||
| Cash flows from operating activities: |
||||||||
| Net income (loss) |
$ | (329,290 | ) | $ | 9,754 | |||
| Adjustment to reconcile net income (loss) to net cash provided by operating activities: |
||||||||
| Depreciation and amortization |
129,568 | 127,289 | ||||||
| Amortization of other non-current assets |
736 | 630 | ||||||
| Amortization of intangible assets |
807 | 901 | ||||||
| Loss on extinguishment of debt, net |
2,030 | — | ||||||
| Interest expense added to long-term debt |
18,601 | 39,525 | ||||||
| Amortization of long-term debt reduction |
(1,532 | ) | (3,446 | ) | ||||
| Gain related to casualty disasters |
(1,125 | ) | (1,254 | ) | ||||
| Write off of deferred incentive costs |
— | 27 | ||||||
| Amortization of leasehold interests |
(427 | ) | (449 | ) | ||||
| Amortization of deferred costs |
6,807 | 7,028 | ||||||
| Loss on sale or retirement of assets |
— | 47 | ||||||
| Gain on sale from discontinued operations |
— | (7,694 | ) | |||||
| Impairment loss |
5,308 | 19,913 | ||||||
| Equity based compensation |
39,578 | — | ||||||
| Deferred income taxes |
18,257 | 24 | ||||||
| Recognition of net deferred tax liabilities upon C-corporation conversion |
321,054 | — | ||||||
| Loss on interest rate caps |
— | 135 | ||||||
| Provision for doubtful accounts |
1,556 | 1,385 | ||||||
| Changes in assets and liabilities: |
||||||||
| Accounts receivable |
(5,675 | ) | (7,693 | ) | ||||
| Other current assets |
3,066 | 809 | ||||||
| Receivables from / payable to affiliates |
1,298 | (2,343 | ) | |||||
| Other non-current assets |
(285 | ) | (356 | ) | ||||
| Accounts payable |
(8,391 | ) | (5,052 | ) | ||||
| Accrued payroll and employee benefits |
5,623 | 10,078 | ||||||
| Accrued real estate taxes |
4,005 | 1,571 | ||||||
| Accrued expenses and other liabilities |
15,241 | 1,027 | ||||||
| Other long-term liabilities |
868 | 1,163 | ||||||
|
|
|
|||||||
| Net cash provided by operating activities |
227,678 | 193,019 | ||||||
| Cash flows from investing activities: |
||||||||
| Acquisitions, net of cash acquired |
(77,667 | ) | — | |||||
| Capital expenditures |
(65,832 | ) | (82,979 | ) | ||||
| Decrease (increase) in restricted cash |
103,026 | (23,189 | ) | |||||
| Decrease in other non-current assets |
382 | — | ||||||
| Insurance proceeds on casualty disasters |
997 | 2,808 | ||||||
| Purchase of intangible assets, net |
— | (103 | ) | |||||
| Payment of franchise incentives |
(400 | ) | (700 | ) | ||||
| Proceeds from sale of assets |
7,053 | 65,296 | ||||||
|
|
|
|||||||
| Net cash used in investing activities |
(32,441 | ) | (38,867 | ) | ||||
F-45
Table of Contents
La Quinta Holdings Inc.
Condensed Consolidated Statements of Cash Flows (Unaudited)—(continued)
For the nine months ended September 30, 2014 and 2013
| Nine Months Ended | ||||||||
| September 30, 2014 |
September 30, 2013 |
|||||||
|
|
||||||||
| (in thousands) | ||||||||
| Cash flows from financing activities: |
||||||||
| Proceeds from long-term debt |
2,100,000 | — | ||||||
| Repayment of long-term debt |
(2,896,452 | ) | (136,301 | ) | ||||
| Payment of deferred costs |
(27,255 | ) | (8,981 | ) | ||||
| Payment of original issue discount |
(10,500 | ) | — | |||||
| Proceeds from issuance of common stock, net |
697,978 | — | ||||||
| Purchase of treasury stock |
(944 | ) | — | |||||
| Investment in interest rate caps |
— | (135 | ) | |||||
| Distributions to members |
(106 | ) | (135 | ) | ||||
| Distributions to noncontrolling interests |
(4,398 | ) | (459 | ) | ||||
| Capital contributions |
21,516 | — | ||||||
|
|
|
|||||||
| Net cash used in financing activities |
(120,161 | ) | (146,011 | ) | ||||
|
|
|
|||||||
| Increase in cash and cash equivalents |
75,076 | 8,141 | ||||||
| Cash and cash equivalents at the beginning of the period |
33,412 | 40,813 | ||||||
|
|
|
|||||||
| Cash and cash equivalents at the end of the period |
$ | 108,488 | $ | 48,954 | ||||
|
|
|
|||||||
| SUPPLEMENTAL CASH FLOW INFORMATION: |
||||||||
| Interest paid during the period |
$ | 78,838 | $ | 68,355 | ||||
|
|
|
|||||||
| Income taxes paid during the period, net of refunds |
$ | 3,733 | $ | 2,754 | ||||
|
|
|
|||||||
| SUPPLEMENTAL NON-CASH DISCLOSURE: |
||||||||
| Capital expenditures included in accounts payable |
$ | 2,166 | $ | 920 | ||||
|
|
|
|||||||
| Deferred costs included in proceeds from issuance of common stock |
$ | 4,757 | $ | — | ||||
|
|
|
|||||||
| Cash flow hedge adjustment, net of tax |
$ | 582 | $ | — | ||||
|
|
|
|||||||
| Receivable for capital assets damaged by casualty disasters |
$ | 1,574 | $ | 2,127 | ||||
|
|
||||||||
The accompanying notes are an integral part of these unaudited condensed consolidated financial statements.
F-46
Table of Contents
Notes to Condensed Consolidated Financial Statements (Unaudited)
As of and for the three and nine months ended September 30, 2014
NOTE 1. ORGANIZATION AND BASIS OF PRESENTATION
Organization
Effective April 14, 2014 (the “IPO Effective Date”), La Quinta Holdings Inc. (“Holdings”) completed its initial public offering (“IPO”) in which Holdings issued and sold 44.0 million shares of common stock at an initial public offering price of $17.00 per share. Holdings was incorporated in the state of Delaware on December 9, 2013 and, prior to the IPO Effective Date, had no operations. In connection with the IPO, we completed certain transactions including, among others, refinancing our existing debt, acquiring 14 previously managed hotels (the “Previously Managed Hotels”), and contributing the La Quinta Predecessor Entities (as defined below) into Holdings, which resulted in the La Quinta Predecessor Entities becoming owned by a “C” corporation for federal income tax purposes.
Lodge Holdco I L.L.C. (“Holdco I”) and Lodge Holdco II L.L.C. (“Holdco II”), each a Delaware limited liability company, were formed on January 4, 2006. Lodge Holdco III L.L.C. (“Holdco III”), a Delaware limited liability company, was formed March 17, 2006. We refer collectively to Holdco I, Holdco II, and Holdco III as the “La Quinta Predecessor Entities”. Since those dates and prior to the completion of our IPO, the La Quinta Predecessor Entities were owned and controlled by Blackstone Real Estate Partners IV L.P. and affiliates (“BREP IV”) and Blackstone Real Estate Partners V L.P. and affiliates (“BREP V”). BREP IV and BREP V are affiliates of The Blackstone Group L.P. (collectivity, the “Funds” or “Blackstone”).
As it pertains to the periods prior to completion of our IPO, the accompanying condensed consolidated financial statements include the accounts of each of the La Quinta Predecessor Entities, and all related wholly and majority owned subsidiaries and consolidated Variable Interest Entities (“VIE”). For these periods, the La Quinta Predecessor Entities have been presented on a combined historical basis due to their prior common ownership and control. In connection with the IPO, the Funds and other pre-IPO owners contributed their equity interests in the La Quinta Predecessor Entities to Holdings in exchange for an aggregate of 81.06 million shares of common stock of Holdings. Holdings then transferred such equity interests to its wholly-owned subsidiary which pledged these interests as security for borrowings under a new credit agreement. As a result, as it pertains to the period subsequent to completion of our IPO, the accompanying condensed consolidated financial statements also include the accounts of Holdings, the Previously Managed Hotels, and all other wholly and majority owned subsidiaries created in connection with the IPO. The combined or consolidated entity presented may also be referred to herein as “La Quinta”, “we”, “us”, “our”, or the “Company”, as the context requires, when we refer to our historical operations and financial performance.
F-47
Table of Contents
We own and operate hotels, some of which are subject to a land lease, located in the United States under the La Quinta and, through August 8, 2013, the Baymont brands. We also franchise and, until the acquisition of the Previously Managed Hotels upon completion of our IPO, managed hotels under the La Quinta brand, with franchised hotels currently operating in the United States (“US”), Canada, and Mexico. As of September 30, 2014 and 2013, total owned, franchised, and managed hotels, and the approximate number of associated rooms were as follows:
| September 30, 2014 | September 30, 2013 | |||||||||||||||
| # of hotels | # of rooms | # of hotels | # of rooms | |||||||||||||
|
|
||||||||||||||||
| Owned(1) |
352 | 44,800 | 355 | 45,200 | ||||||||||||
| Joint Venture |
1 | 200 | 1 | 200 | ||||||||||||
| Previously Managed Hotels(2) |
— | — | 14 | 1,700 | ||||||||||||
| Franchised |
501 | 40,500 | 466 | 37,300 | ||||||||||||
|
|
|
|||||||||||||||
| Totals |
854 | 85,500 | 836 | 84,400 | ||||||||||||
|
|
||||||||||||||||
| (1) | See discussion of discontinued operations in Note 3. |
| (2) | These hotels were, as of September 30, 2013, owned by affiliates of the Funds. On April 14, 2014, these hotels were acquired by Holdco III. (See Notes 4 and 9) |
Basis of Presentation and Use of Estimates
The accompanying unaudited condensed consolidated financial statements have been prepared in accordance with accounting principles generally accepted in the United States of America (“GAAP”) for interim financial information, the instructions to Form 10-Q and Article 10 of Regulation S-X. Accordingly, they do not include all information or footnotes required by GAAP for complete annual financial statements. Although we believe the disclosures made are adequate to prevent the information presented from being misleading, these financial statements should be read in conjunction with the La Quinta Predecessor Entities combined financial statements and notes thereto for the years ended December 31, 2013, 2012, and 2011, which are included in our prospectus, dated April 8, 2014, filed by Holdings with the Securities and Exchange Commission on April 9, 2014. All intercompany transactions have been eliminated. In our opinion, the accompanying condensed consolidated financial statements reflect all adjustments, including normal recurring items, considered necessary for a fair presentation of the interim periods. The preparation of financial statements in conformity with GAAP requires management to make estimates and assumptions that affect the amounts reported and, accordingly, ultimate results could differ from those estimates. Interim results are not necessarily indicative of full year performance because of the impact of seasonal and short-term variations.
Effective April 14, 2014, Holdings’ wholly owned subsidiary, La Quinta Intermediate Holdings L.L.C., acquired 100% of the ownership interests of LQ Management L.L.C. (“LQM”) for $0.8 million in cash. Prior to April 14, 2014, LQM was a VIE, in which the La Quinta Predecessor Entities had a significant variable financial interest, and were the primary beneficiary. LQM received no member or other capital contribution, or equity investment upon formation or thereafter. LQM’s sole purpose is to manage all of our day-to-day operations, as well as to provide, prior to the IPO, day to day management of the Previously Managed Hotels. In return for providing these management services, we and, prior to the IPO, the Previously Managed Hotels pay LQM a management fee and reimburse LQM for costs incurred on our behalf, and, prior to the IPO, on behalf of the Previously Managed Hotels, in accordance with management and service agreements in place prior to the IPO. The La Quinta Predecessor Entities were the primary
F-48
Table of Contents
beneficiary of LQM as the management and service agreements in place provided for the La Quinta Predecessor Entities to reimburse LQM for its expenses in a manner that allowed LQM to realize a reasonable profit. We have not provided financial or other support to LQM during the periods presented that we were not contractually required to provide, and LQM’s agreements with its vendors are structured as non-recourse to our general credit. On April 14, 2014, LQM became a wholly owned subsidiary of Holdings and, as a result, is no longer a VIE.
As of December 31, 2013, LQM’s assets and liabilities were as follows (in thousands):
| Cash and cash equivalents |
$ | 2,609 | ||
| Restricted cash |
6,700 | |||
| Receivables from affiliates |
49,027 | |||
| Other current assets |
4,472 | |||
| Property and equipment, net |
21,005 | |||
| Intangible assets, net |
347 | |||
| Accounts payable |
25,259 | |||
| Accrued expenses and other liabilities |
25,670 | |||
| Accrued payroll and employee benefits |
26,052 | |||
| Capital lease obligation (related party) |
23,852 | |||
|
|
||||
NOTE 2. SIGNIFICANT ACCOUNTING POLICIES AND RECENTLY ISSUED ACCOUNTING STANDARDS
Revenue Recognition—Revenues primarily consist of room rentals, franchise fees and other hotel revenues. We defer a portion of our revenue from franchisees at the time the franchise agreement is signed and recognize the remainder upon hotel opening.
Room revenues are derived from room rentals at our owned hotels. We recognize room revenue on a daily basis based on an agreed-upon daily rate after the guest has stayed at one of our hotels. Customer incentive discounts, cash rebates, and refunds are recognized as a reduction of room revenues. Occupancy, hotel, and sales taxes collected from customers and remitted to the taxing authorities are excluded from revenues in the accompanying condensed consolidated statements of operations.
Included in franchise and other fee-based revenues are franchise fee revenues, which primarily consist of revenues from franchisees for application and initial fees, royalty, reservations, and training, as well as fees related to our guest loyalty program (“Returns”). We recognize franchise fee revenue on a gross basis because we (1) are the primary obligor in these arrangements, (2) have latitude in establishing rates, (3) perform the services delivered, (4) have some discretion over supplier selection, and (5) determine the specification of services delivered. The different types of franchise fee revenues are described as follows:
| • | Upon execution of a franchise agreement, a franchisee is required to pay us an initial fee. We recognize the initial fee as revenue when substantial performance of our obligations to the franchisee with respect to the initial fee has been achieved. In most cases, the vast majority of the initial fee is recognized as revenue when each franchise agreement is signed as, after that date, our remaining obligations to the franchisee are limited to (1) pre-opening inspections, for which we defer $2,500, and (2) if mandated by us or agreed to with the franchisee, preopening training and marketing support related to entry into the La Quinta brand, for which we defer $5,000. These amounts represent an estimate of the value provided to the |
F-49
Table of Contents
| franchisee related to the services provided, and are based on our experience with time, materials, and third-party costs necessary to provide these services. We recognize the remaining deferred initial fee as revenue when the franchised property opens as the remaining service obligations have been fulfilled. |
| • | For franchise agreements entered into prior to April 1, 2013, we collect a monthly royalty fee from franchisees generally equal to 4.0% of their room revenues until the franchisee has operated as a La Quinta hotel for twenty-four consecutive months. Beginning in the twenty-fifth month of operation, the franchisee monthly royalty fee increases to 4.5%. Pursuant to franchise agreements entered into with new US franchisees on or after April 1, 2013, we collect a royalty fee from franchisees equal to 4.5% of their room revenues until the franchisee has operated as a La Quinta hotel for twenty-four consecutive months. Beginning in the twenty-fifth month of operation, the franchisee monthly royalty fee increases to 5.0%. In each of these cases, the franchisee has the opportunity to earn the additional 0.5% back via rebate by achieving certain defined customer satisfaction results. Pursuant to franchise agreements entered into with franchisees outside of the US on or after April 1, 2013, we generally collect a royalty fee from franchisees equal to 4.5% of their room revenues throughout the term. |
| • | We receive reservation and technology fees, as well as fees related to Returns, in connection with franchising our La Quinta brand. Such fees are recognized based on a percentage of the franchisee’s eligible hotel room revenues or room count. We also perform certain other services for franchisees such as training and revenue management. Revenue for these services is recognized at the time the services are performed. |
Included in franchise and other fee-based revenues are management fees of approximately $0.5 million for the three months ended September 30, 2013, and approximately $0.7 million and $1.7 million for the nine months ended September 30, 2014 and 2013, respectively, which represent fees earned from the Previously Managed Hotels, prior to their acquisition on April 14, 2014. Management fees from hotels include a base fee, which is generally a percentage of hotel revenues. (See Note 9)
Other hotel revenues include revenues generated by the incidental support of hotel operations for owned hotels and other rental income. We record rental income from operating leases associated with leasing space for restaurants, billboards, and cell towers. Rental income is recognized on a straight-line basis over the life of the respective lease agreement.
Brand marketing fund revenues from franchise and managed properties represent fees collected from franchised and managed hotels related to maintaining our Brand Marketing Fund (“BMF”). We maintain the BMF on behalf of all La Quinta branded hotel properties, including our owned hotels, from which national marketing and advertising campaign expenses are paid. Each La Quinta branded hotel is charged a percentage of its room revenue from which the expenses of the fund are covered. The corresponding expenditures of the BMF fees collected from franchised and managed hotels are presented as brand marketing fund expenses from franchised and managed hotels in our condensed consolidated statements of operations, resulting in no net impact to operating income or net loss.
Lodging operations are particularly sensitive to adverse economic and competitive conditions and trends, which could adversely affect the Company’s business, financial condition, and results of operations.
F-50
Table of Contents
Derivative Instruments—We use derivative instruments as part of our overall strategy to manage our exposure to market risks associated with fluctuations in interest rates. We regularly monitor the financial stability and credit standing of the counterparties to our derivative instruments. We do not enter into derivative financial instruments for trading or speculative purposes.
We record all derivatives at fair value. On the date the derivative contract is entered, we designate the derivative as one of the following: a hedge of a forecasted transaction or the variability of cash flows to be paid (“cash flow hedge”), a hedge of the fair value of a recognized asset or liability (“fair value hedge”), or an undesignated hedge instrument. Changes in the fair value of a derivative that is qualified, designated and highly effective as a cash flow hedge or net investment hedge are recorded in the condensed consolidated statements of comprehensive income (loss) until they are reclassified into earnings in the same period or periods during which the hedged transaction affects earnings. Changes in the fair value of a derivative that is qualified, designated and highly effective as a fair value hedge, along with the gain or loss on the hedged asset or liability that is attributable to the hedged risk, are recorded in current period earnings. Changes in the fair value of undesignated derivative instruments and the ineffective portion of designated derivative instruments are reported in current period earnings. Cash flows from designated derivative financial instruments are classified within the same category as the item being hedged in the condensed consolidated statements of cash flows.
If we determine that we qualify for and will designate a derivative as a hedging instrument at the designation date, we formally document all relationships between hedging activities, including the risk management objective and strategy for undertaking various hedge transactions. This process includes matching all derivatives that are designated as cash flow hedges to specific forecasted transactions, linking all derivatives designated as fair value hedges to specific assets and liabilities in our condensed consolidated balance sheets, and determining the foreign currency exposure of net investment of the foreign operation for a net investment hedge.
On a quarterly basis, we assess the effectiveness of our designated hedges in offsetting the variability in the cash flows or fair values of the hedged assets or obligations via use of a statistical regression approach. Additionally, we measure ineffectiveness using the hypothetical derivative method. This method compares the cumulative change in fair value of each hedging instrument to the cumulative change in fair value of a hypothetical hedging instrument, which has terms that identically match the critical terms of the respective hedged transactions. Thus, the hypothetical hedging instrument is presumed to perfectly offset the hedged cash flows. Ineffectiveness results when the cumulative change in the fair value of the hedging instrument exceeds the cumulative change in the fair value of the hypothetical hedging instrument. We discontinue hedge accounting prospectively when the derivative is not highly effective as a hedge, the underlying hedged transaction is no longer probable, or the hedging instrument expires, is sold, terminated or exercised.
Equity Based Compensation—We recognize the cost of services received in an equity based payment transaction with an employee as services are received and record either a corresponding increase in equity or a liability, depending on whether the instruments granted satisfy the equity or liability classification criteria.
The measurement objective for these equity awards is the estimated fair value at the grant date of the equity instruments that we are obligated to issue when employees have rendered the requisite service and satisfied any other conditions necessary to earn the right to benefit from
F-51
Table of Contents
the instruments. The compensation cost for an award classified as an equity instrument is recognized ratably over the requisite service period, including an estimate of forfeitures. The requisite service period is the period during which an employee is required to provide service in exchange for an award.
Compensation cost for awards with performance conditions is recognized over the requisite service period if it is probable that the performance condition will be satisfied. If such performance conditions are not considered probable until they occur, no compensation expense for these awards is recognized.
Income Taxes—The accompanying condensed consolidated financial statements include taxable entities, limited liability companies, and, through April 14, 2014, REIT entities. Limited liability companies and REITs generally are not subject to federal income taxes at the entity level. For our taxable subsidiaries, we account for income taxes using the asset and liability approach for financial accounting and reporting purposes. For financial reporting purposes, income tax expense or benefit is based on reported financial accounting income or loss before non-controlling interests and income taxes related to our taxable subsidiaries. Deferred tax assets and liabilities reflect the temporary differences between assets and liabilities recognized for financial reporting and the analogous amounts recognized for tax purposes using the statutory tax rates expected to be in effect for the year in which the differences are expected to reverse, within the taxable subsidiaries.
Prior to the IPO, certain of our subsidiaries had elected to be treated as REITs for federal income tax purposes under the United States Internal Revenue Code. To qualify as REITs, these subsidiaries had to meet all of the required organizational and operational requirements, including a requirement that the REIT distribute at least 90% of its regular taxable income to its shareholders as dividends eligible for the dividends paid deduction. As of April 14, 2014, the REIT subsidiaries adhered to these requirements. If the REIT subsidiaries fail to qualify as REITs in any taxable year, they would be subject to federal income taxes at regular corporate rates (including any applicable alternative minimum tax) and might not qualify as REITs for the four subsequent taxable years. For this reason, one of our REITs formed taxable subsidiaries to hold certain assets that could otherwise adversely affect its REIT status. These taxable subsidiaries are subject to federal and state income taxes.
On April 14, 2014, the La Quinta Predecessor Entities were contributed to Holdings, a “C” corporation, the shares of capital stock held by third-party shareholders of our REIT entities were redeemed for cash totaling approximately $3.9 million, and our REITs were converted into limited liability companies. As a result of these transactions, we have become subject to additional entity-level taxes and, as of April 14, 2014, we recorded a one-time net deferred tax expense of $321.1 million, which reflects the establishment of the associated net deferred tax liability.
Newly Issued Accounting Standards
In April 2014, the Financial Accounting Standards Board (“FASB”) issued Accounting Standards Update (“ASU”) No. 2014-08. Under the new guidance, only a disposal of a component that represents a major strategic shift of an organization qualifies for discontinued operations reporting. The guidance also requires expanded disclosures about discontinued operations and new disclosures in regards to individually significant disposals that do not qualify for discontinued operations reporting. This guidance is effective for the first interim or annual
F-52
Table of Contents
period beginning on or after December 15, 2014. Early adoption is permitted, but only for disposals that have not been reported in previously-issued financial statements. We are currently evaluating the impact this guidance will have on our financial statements when adopted.
In May 2014, FASB issued ASU No. 2014-09. The new guidance on revenue from contracts with customers will supersede most current revenue recognition guidance, including industry-specific guidance. The underlying principle is that an entity will recognize revenue to depict the transfer of goods or services to customers at an amount that the entity expects to be entitled to in exchange for those goods or services. The guidance provides a five-step analysis of transactions to determine when and how revenue is recognized. Other major provisions include capitalization of certain contract costs, consideration of time value of money in the transaction price, and allowing estimates of variable consideration to be recognized before contingencies are resolved in certain circumstances. The guidance also requires enhanced disclosures regarding the nature, amount, timing and uncertainty of revenue and cash flows arising from an entity’s contracts with customers. The guidance is effective for the interim and annual periods beginning on or after December 15, 2016; early adoption is not permitted. The guidance permits the use of either a retrospective or cumulative effect transition method. We have not yet selected a transition method and are currently evaluating the impact of the amended guidance on our consolidated financial position, results of operations and related disclosures.
In June 2014, FASB issued ASU No. 2014-12. The new guidance requires that a performance target that affects vesting, and that could be achieved after the requisite service period, be treated as a performance condition. As such, the performance target should not be reflected in estimating the grant date fair value of the award. This update further clarifies that compensation cost should be recognized in the period in which it becomes probable that the performance target will be achieved and should represent the compensation cost attributable to the period(s) for which the requisite service has already been rendered. The guidance is effective for the interim and annual periods beginning on or after December 15, 2015; early adoption is permitted. We do not anticipate that the adoption of this standard will have a material impact on our financial position, results of operations and related disclosures.
In August 2014, FASB issued ASU No. 2014-15. The new guidance establishes management’s responsibility to evaluate whether there is substantial doubt about an entity’s ability to continue as a going concern or to provide related footnote disclosures. The amendments require management to assess an entity’s ability to continue as a going concern by incorporating and expanding upon certain principles in U.S. auditing standards. Specifically, ASU 2014-15 provides a definition of the term substantial doubt and requires an assessment for a period of one year after the date that the financial statements are issued or available to be issued. It also requires certain disclosures when substantial doubt is alleviated as a result of consideration of management’s plans and requires an express statement and other disclosures when substantial doubt is not alleviated. The guidance is effective for the interim and annual periods beginning on or after December 15, 2016; early adoption is permitted. We do not anticipate that the adoption of this standard will have a material impact on our financial position, results of operations and related disclosures.
Newly Adopted Accounting Standards
In July 2013, FASB issued ASU No. 2013-11. This ASU provides guidance on the financial statement presentation of an unrecognized tax benefit when a net operating loss carryforward, a similar tax loss, or a tax credit carryforward exists in the applicable jurisdiction to settle any additional
F-53
Table of Contents
income taxes that would result from disallowance of the tax position. We adopted ASU 2013-11 prospectively as of January 1, 2014. The adoption of this ASU did not have a material impact on our financial condition, results of operations, cash flows, or disclosures.
From time to time, new accounting standards are issued by FASB or other standards setting bodies, which we adopt as of the specified effective date. Unless otherwise discussed, we believe the impact of recently issued standards that are not yet effective will not have a material impact on our consolidated financial statements upon adoption.
NOTE 3. ASSETS HELD FOR SALE AND DISCONTINUED OPERATIONS
During the second quarter of 2013, 44 of our hotels, including all 11 of our Baymont-branded hotels, were classified as assets held for sale, and the results of their operations have accordingly been presented within discontinued operations for all periods presented in the accompanying condensed consolidated statements of operations.
During the third and fourth quarters of 2013, 40 of these hotels, including all of the Baymont-branded hotels, were sold. The four remaining hotels were reflected in the accompanying condensed consolidated balance sheet as assets held for sale.
As of December 31, 2013, the carrying amounts of the major classes of assets for the assets held for sale were as follows:
| December 31, 2013 |
||||
|
|
||||
| (in thousands) | ||||
| Current assets |
$ | 118 | ||
| Property and equipment, net |
7,134 | |||
| Other non-current assets |
80 | |||
|
|
|
|||
| Total assets |
$ | 7,332 | ||
|
|
||||
On February 6, 2014, the four remaining hotels were sold. In accordance with the terms of our loan agreements existing at the time of such sale, all proceeds associated with the sale of these hotels were used to make principal payments on our long-term debt.
The following table summarizes the operating results of the discontinued operations:
| For the three months ended September 30, |
For the nine months ended September 30, |
|||||||||||||||
| 2014 | 2013 | 2014 | 2013 | |||||||||||||
|
|
||||||||||||||||
| (in thousands) | ||||||||||||||||
| Hotel revenues |
$ | — | $ | 9,647 | $ | 361 | $ | 38,128 | ||||||||
| Direct lodging expenses |
— | 6,190 | 651 | 23,329 | ||||||||||||
| Other lodging and operating expenses |
— | 1,210 | 62 | 3,836 | ||||||||||||
|
|
|
|||||||||||||||
| Operating income (loss) |
— | 2,247 | (352 | ) | 10,963 | |||||||||||
| Depreciation and amortization |
— | — | — | (5,047 | ) | |||||||||||
| Impairment loss |
— | — | (151 | ) | (19,913 | ) | ||||||||||
| Gain on sale from discontinued operations |
— | 7,694 | — | 7,694 | ||||||||||||
|
|
|
|||||||||||||||
| Income (loss) on discontinued operations, net of tax |
$ | — | $ | 9,941 | $ | (503 | ) | $ | (6,303 | ) | ||||||
|
|
||||||||||||||||
F-54
Table of Contents
NOTE 4. ACQUISITIONS
In connection with the acquisitions described below, we record the assets acquired and liabilities assumed at fair value as of the acquisition date. Furthermore, acquisition-related costs, such as due diligence, legal and accounting fees, are expensed in the period incurred and are not capitalized or applied in determining the fair value of the acquired assets.
Acquisition of the Previously Managed Hotels and LQ Management L.L.C.
On April 14, 2014, we acquired BRE/Prime Mezz L.L.C. and BRE/Wellesley Properties L.L.C., which owned the Previously Managed Hotels, for a purchase price of $161.7 million. Total net consideration paid was $150.8 million, which equals the total purchase price of $161.7 million less $10.9 million owed by the parent of BRE/Prime Mezz L.L.C. and BRE/Wellesley Properties L.L.C. to the La Quinta Predecessor Entities. The total net consideration was paid in the form of $76.9 million of cash and $73.9 million of equity in the form of common stock of Holdings. Of the total $161.7 million purchase price, significant assets acquired consist of $166.5 million of property and equipment and $1.4 million in intangible assets for favorable leasehold interests. Other significant long term liabilities acquired include unfavorable leasehold interests of $5.3 million. Additionally on April 14, 2014, we acquired 100% of the ownership interests of LQM for $0.8 million in cash.
The following unaudited pro forma results of operations reflect our results as if the acquisition of the Previously Managed Hotels had occurred on January 1, 2013. In our opinion, all significant adjustments necessary to reflect the effects of the acquisitions have been made (in thousands, except per share data):
| For the three months ended September 30, |
For the nine months ended September 30, |
|||||||||||||||
| 2014 | 2013 | 2014 | 2013 | |||||||||||||
|
|
||||||||||||||||
| (in thousands) | ||||||||||||||||
| Total revenues |
$ | 271,118 | $ | 246,488 | $ | 760,636 | $ | 700,417 | ||||||||
| Net income (loss) attributable to La Quinta Holdings’ stockholders |
12,836 | 24,156 | (329,525 | ) | 13,975 | |||||||||||
| Basic and diluted earnings per share |
0.10 | 0.20 | (2.62 | ) | 0.11 | |||||||||||
|
|
||||||||||||||||
NOTE 5. PROPERTY AND EQUIPMENT
The following is a summary of property and equipment as of September 30, 2014 and December 31, 2013:
| September 30, 2014 |
December 31, 2013 |
|||||||
|
|
||||||||
| (in thousands) | ||||||||
| Land |
$ | 836,525 | $ | 808,960 | ||||
| Buildings and improvements |
2,781,783 | 2,635,651 | ||||||
| Furniture, fixtures, equipment and other |
413,110 | 369,235 | ||||||
|
|
|
|||||||
| Total property and equipment |
4,031,418 | 3,813,846 | ||||||
| Less accumulated depreciation |
(1,177,356 | ) | (1,053,910 | ) | ||||
|
|
|
|||||||
| Property and equipment, net |
2,854,062 | 2,759,936 | ||||||
| Construction in progress |
3,066 | 1,521 | ||||||
|
|
|
|||||||
| Total property and equipment, net of accumulated depreciation |
$ | 2,857,128 | $ | 2,761,457 | ||||
|
|
||||||||
F-55
Table of Contents
Depreciation and amortization expense related to property and equipment was $43.1 million and $39.6 million for the three months ended September 30, 2014 and 2013, respectively. Depreciation and amortization expense related to property and equipment was $124.1 million and $121.7 million for the nine months ended September 30, 2014 and 2013, respectively. Construction in progress includes capitalized costs for ongoing projects that have not yet been put into service.
NOTE 6. LONG-TERM DEBT
Long-term debt as of September 30, 2014 and December 31, 2013 was as follows:
| September 30, 2014 |
December 31, 2013 |
|||||||
|
|
||||||||
| (in thousands) | ||||||||
| Current: |
||||||||
| Holdco I & III Mortgage & Mezzanine Loans(1)(2) |
$ | — | $ | 2,720,286 | ||||
| Term Facility(3) |
19,450 | — | ||||||
|
|
|
|||||||
| Current portion of long-term debt |
$ | 19,450 | $ | 2,720,286 | ||||
|
|
|
|||||||
| Non-current: |
||||||||
| Term Facility(3) |
1,910,756 | — | ||||||
|
|
|
|||||||
| Total debt |
$ | 1,930,206 | $ | 2,720,286 | ||||
|
|
||||||||
| (1) | As of September 30, 2014 and December 31, 2013, the 30 day United States dollar London Interbank Offering Rate (“LIBOR”) was 0.15% and 0.17%, respectively. The Mortgage and Mezzanine Loans bore interest as follows: |
| • | Through April 14, 2014, portions of the Holdco I Mortgage Loan, with principal totaling $1.03 billion, carried interest at LIBOR plus a spread of 0.55%. The remaining mortgage loan balances, with principal totaling approximately $0.9 billion, were subject to a LIBOR floor of 1.0% plus spreads ranging from 3.891% to 6.803%. The total weighted average spread was 2.892% as of December 31, 2013. |
| • | The interest rate for the Holdco III Mortgage Loan as of July 6, 2012 and through April 14, 2014 was LIBOR with a floor of 1.0% plus a spread of 4.5%. Included in the Holdco III Mortgage Loan as of December 31, 2013 is an unamortized long-term debt reduction of $2.3 million, which through April 14, 2014, was amortized using an initial imputed interest rate of 3.45%. |
| • | The interest rate for the Mezzanine Loans as of December 31, 2013 was LIBOR plus spreads ranging from 9.0% to 13.9%. |
| (2) | As of September 30, 2013, the maturity date and principal payments on the Holdco I & III Mortgage & Mezzanine Loans were as follows: |
| • | The modified terms of the Holdco I Mortgage Loan required us to make certain principal payments upon closing and quarterly beginning on the first scheduled loan payment date following September 30, 2012. Concurrently with the consummation of the IPO, the Holdco I Mortgage Loan and Mezzanine Loans were refinanced. |
| • | Principal payments on the Holdco III Mortgage Loan were required quarterly equal to the amount of excess cash flows, as defined, held in escrowed accounts over a specified floor. Concurrently with the consummation of the IPO, the Holdco III Mortgage Loan was refinanced. |
| (3) | As of September 30, 2014, the interest rate, maturity date and principal payments on the Term Facility were as follows: |
| • | The terms of the Term Facility require us to make certain scheduled principal payments quarterly beginning September 30, 2014. Final maturity is April 2021. In June and September 2014, we made voluntary principal pre-payments of $80.0 million and $75.0 million, respectively. Also in September 2014, we made a quarterly scheduled principal payment of $4.9 million. |
| • | The interest rate for the Term Facility through September 30, 2014 was LIBOR with a floor of 1.0% plus a spread of 3.0%. Included in the Term Facility as of September 30, 2014 is an unamortized original issue discount of $9.9 million, which is being amortized using an initial imputed interest rate of 4.0%. As of September 30, 2014 we had $19.0 million in accrued interest included within accrued expenses and other liabilities on the accompanying condensed consolidated balance sheet. |
Term Facility
On April 14, 2014, Holdings’ wholly owned subsidiary, La Quinta Intermediate Holdings L.L.C. (the “Borrower”), entered into a new credit agreement (the “Agreement”) with JPMorgan Chase
F-56
Table of Contents
Bank, N.A. (“JPM”), as administrative agent, collateral agent, swingline lender and L/C issuer, J.P. Morgan Securities LLC, Morgan Stanley Senior Funding, Inc., Merrill Lynch, Pierce, Fenner & Smith Incorporated, Citigroup Global Markets Inc., Credit Suisse Securities (USA) LLC, Deutsche Bank Securities Inc., Goldman Sachs Bank USA, and Wells Fargo Securities, LLC, as joint lead arrangers and joint book runners, and the other agents and lenders from time to time party thereto.
The credit agreement provides for senior secured credit facilities (collectively the “Senior Facilities”) consisting of:
| • | $2.1 billion senior secured term loan facility (the “Term Facility”), which will mature in 2021; and |
| • | $250 million senior secured revolving credit facility (the “Revolving Facility”), $50 million of which is available in the form of letters of credit, which will mature in 2019. |
The Revolving Facility includes borrowing capacity available for letters of credit and for short-term borrowings referred to as the swing line borrowings. In addition, the Senior Facilities also provide the Borrower with the option to (1) raise incremental credit facilities including an uncommitted incremental facility that provides the Borrower the option to increase the amounts available under the Term Facility and/or the Revolving Facility by an aggregate of up to $350 million, subject to additional increases upon achievement of a consolidated first lien net leverage ratio of less than or equal to 6.00 to 1.00 (or, after the first anniversary of the closing date, 5.75 to 1.00), (2) refinance the loans with debt incurred outside the Senior Facilities, and (3) extend the maturity date of the Revolving Credit Facility and Term Facility, subject to certain limitations.
The proceeds of the Term Facility, together with the net cash proceeds of the IPO and other cash on hand, were used to repay the Holdco I Mortgage Loan and Mezzanine Loans (collectively the “Holdco I Loans”) and the Holdco III Mortgage Loan, and to acquire the Previously Managed Hotels. Upon completion of the refinancing, we recognized a $2.0 million loss on extinguishment of debt in our condensed consolidated statement of operations. We also incurred $28.7 million of debt issuance costs for the Senior Facilities, which is being amortized over the terms of the underlying debt agreement. As of September 30, 2014, the net balance of these debt issuance costs included in our condensed consolidated balance sheet was $27.1 million.
Interest Rate and Fees—Borrowings under the Term Facility bear interest, at the Borrower’s option, at a rate equal to a margin over either (a) a base rate determined by reference to the highest of (1) the JPM prime lending rate, (2) the Federal Funds Effective Rate plus 1/2 of 1.00% and (3) the adjusted LIBOR rate for a one-month interest period plus 1.00% or (b) a LIBOR rate determined by reference to the Reuters LIBOR rate for the interest period relevant to such borrowing. The margin for the Term Facility is 2.00%, in the case of base rate loans, and 3.00%, in the case of LIBOR rate loans, subject to one step-down of 0.25% upon the achievement of a consolidated first lien net leverage ratio (as defined in the Agreement) of less than or equal to 4.50 to 1.00, subject to a base rate floor of 2.00% and a LIBOR floor of 1.00%.
Borrowings under the Revolving Facility bear interest, at the Borrower’s option, at a rate equal to a margin over either (a) a base rate determined by reference to the highest of (1) the JPM prime lending rate, (2) the Federal Funds Effective Rate plus 1/2 of 1.00% and (3) the adjusted LIBOR rate for a one-month interest period plus 1.00% or (b) a LIBOR rate determined by reference to the Reuters LIBOR rate for the interest period relevant to such borrowing. The margin for the Revolving Facility is 1.50%, in the case of base rate loans, and 2.50%, in the case of LIBOR rate
F-57
Table of Contents
loans, subject to three step-downs of 0.25% each upon the achievement of a consolidated first lien net leverage ratio of less than or equal to 5.00 to 1.00, 4.50 to 1.00 and 4.00 to 1.00, respectively.
In addition, the Borrower is required to pay a commitment fee to the lenders under the Revolving Facility in respect of the unutilized commitments thereunder. The commitment fee rate is 0.50% per annum subject to a step-down to 0.375%, upon achievement of a consolidated first lien net leverage ratio less than or equal to 5.00 to 1.00. The Borrower is also required to pay customary letter of credit fees.
The Borrower incurred a ticking fee of approximately $1.8 million for the period between the date the allocations were notified to the lenders, February 21, 2014, and the closing date of the Senior Facilities of April 14, 2014.
Prepayments—The Term Facility requires mandatory prepayments, subject to certain exceptions, with:
| • | 50% (which percentage will be reduced to 25% and 0%, as applicable, subject to achievement of a consolidated first lien net leverage ratio of less than or equal to 5.25 to 1.00 and 4.00 to 1.00, respectively) of annual excess cash flow, calculated in accordance with the Agreement; |
| • | 100% of the net cash proceeds (including insurance and condemnation proceeds) of all non-ordinary course asset sales or other dispositions of property by the Borrower and its restricted subsidiaries subject to de minimus thresholds, if those net cash proceeds are not reinvested in assets to be used in the Borrower’s business or to make certain other permitted investments (a) within 12 months of the receipt of such net cash proceeds or (b) if the borrower commits to reinvest such net cash proceeds within 12 months of the receipt thereof, within 180 days of the date of such commitment; and |
| • | 100% of the net proceeds of any incurrence of debt by the Borrower or any of its restricted subsidiaries, other than debt permitted to be incurred or issued under the Senior Facilities. |
Each lender of the Term Facility will have the right to reject its pro rata share of mandatory prepayments described above, in which case the Borrower may retain the amounts so rejected. The foregoing mandatory prepayments will be applied to installments of the Term Facility in direct order of maturity.
The Borrower has the ability to voluntarily repay outstanding loans at any time without premium or penalty, other than prepayment premium of 1.0% on voluntary prepayment of Term Facility in connection with a repricing transaction on or prior to the date which is six months after the closing of the Senior Facilities and customary “breakage” costs with respect to LIBOR loans.
Amortization—Beginning September 2014, the Borrower is required to repay installments on the Term Facility in quarterly installments equal to 0.25% of the original principal amount less any voluntary prepayments on the Term Facility, with the remaining amount payable on the applicable maturity date with respect to the Term Facility.
Guarantees and security—The obligations under the Senior Facilities will be unconditionally and irrevocably guaranteed by Holdings, any subsidiary of Holdings that directly or indirectly owns any issued and outstanding equity interests of the Borrower, and, subject to certain exceptions, each of the Borrower’s existing and future material domestic wholly owned subsidiaries (collectively, the “Guarantors”). In addition, the Senior Facilities will be collateralized by first
F-58
Table of Contents
priority or equivalent security interests in (i) all the capital stock, or other equity interests in, the Borrower and each of the Borrower’s and the Guarantors’ material direct or indirect wholly owned restricted domestic subsidiaries, and 65% of the voting stock (and 100% of the nonvoting stock) of, or other equity interests in, each of the Borrower’s or any subsidiary guarantors’ material direct wholly owned first-tier restricted foreign subsidiaries, and (ii) certain tangible and intangible assets of the Borrower (other than real property except for certain real property described in the credit agreement) and Guarantors (subject to certain exceptions and qualifications).
As of the closing date for the Senior Facilities, Holdings did not have any of its foreign subsidiaries, non-wholly owned domestic subsidiaries that are restricted subsidiaries or immaterial subsidiaries guarantee the Senior Facilities. The Borrower will also have the ability to designate certain subsidiaries as unrestricted subsidiaries utilizing its investment capacity under the Agreement.
Certain covenants and events of default—The Agreement contains a number of significant affirmative and negative covenants and customary events of default. Such covenants, among other things, will limit or restrict, subject to certain exceptions, the ability of (i) Holdings, the direct parent of the Borrower, to engage in any material operating or business activities other than the ownership of the equity interests of the Borrower and (ii) the Borrower and its restricted subsidiaries to:
| • | incur additional indebtedness and make guarantees; |
| • | create liens on assets; |
| • | enter into sale and leaseback transactions; |
| • | engage in mergers or consolidations; |
| • | sell certain assets; |
| • | make fundamental changes; |
| • | pay dividends and distributions or repurchase capital stock; |
| • | make investments, loans and advances; |
| • | engage in certain transactions with affiliates; |
| • | make changes in the nature of their business; and |
| • | make prepayments of junior debt. |
In addition, if, on the last day of any period of four consecutive quarters on or after the first full fiscal quarter following the closing of the Senior Facilities, the aggregate principal amount of the Revolving Facility, swing line loans and/or letters of credit (excluding up to $20 million of letters of credit and certain other letters of credit that have been cash collateralized or back-stopped) that are issued and/or outstanding is greater than 25% of the Revolving Facility, the Agreement will require the Borrower to maintain a consolidated first lien net leverage ratio not to exceed 8.0 to 1.0. During any period in which Holdings’ corporate issuer rating is equal to or higher than Baa3 (or the equivalent) according to Moody’s Investors Service, Inc. or BBB- (or the equivalent) according to Standard & Poor’s Ratings Services and no default has occurred and is continuing, the restrictions in the Senior Facility regarding incurring additional indebtedness, dividends and distributions or repurchases of capital stock and transactions with affiliates will not apply to the Borrower and its restricted subsidiaries.
F-59
Table of Contents
The Senior Facilities also contain certain customary representations and warranties, affirmative covenants and events of default. If an event of default occurs, the lenders under the Senior Facilities will be entitled to take various actions, including the acceleration of amounts due under the Senior Facilities and actions permitted to be taken by a secured creditor. As of September 30, 2014, we were in compliance with all covenants under the Senior Facilities.
Letters of Credit
In April 2014, we obtained letters of credit through our Revolving Facility aggregating to approximately $5.7 million. We are required to pay a fee of 2.63% per annum related to this letter of credit.
Interest Expense, Net
Net interest expense, including the impact of our interest rate swap (see Note 7), consisted of the following for the three and nine months ended September 30, 2014 and 2013:
| For the three months ended September 30, |
For the nine months ended September 30, |
|||||||||||||||
| Description | 2014 | 2013 | 2014 | 2013 | ||||||||||||
|
|
||||||||||||||||
| (in thousands) | ||||||||||||||||
| Term Facility |
$ | 23,222 | $ | — | $ | 43,583 | $ | — | ||||||||
| Mortgage Loan |
— | 17,408 | 23,754 | 51,984 | ||||||||||||
| Holdco III Mortgage Loan |
— | 3,075 | 3,206 | 9,238 | ||||||||||||
| Mezzanine Loans: |
||||||||||||||||
| Current |
— | 2,272 | 3,107 | 6,774 | ||||||||||||
| Deferred |
— | 13,330 | 18,601 | 39,525 | ||||||||||||
| Amortization of long-term debt reduction |
— | (1,148 | ) | (1,532 | ) | (3,446 | ) | |||||||||
| Amortization of deferred financing costs |
1,274 | 3,345 | 6,571 | 6,811 | ||||||||||||
| Other interest |
4 | 4 | 10 | 18 | ||||||||||||
| Interest income |
(5 | ) | (58 | ) | (40 | ) | (158 | ) | ||||||||
|
|
|
|||||||||||||||
| Total interest expense, net |
$ | 24,495 | $ | 38,228 | $ | 97,260 | $ | 110,746 | ||||||||
|
|
||||||||||||||||
NOTE 7. DERIVATIVE INSTRUMENTS AND HEDGING ACTIVITIES
During the three and nine months ended September 30, 2014 and 2013, derivatives were used to hedge the interest rate risk associated with our variable-rate debt.
Term Facility Interest Rate Swap
On April 14, 2014, the Borrower entered into an interest rate swap agreement with an aggregate notional amount of $850.0 million that expires on April 14, 2019. This agreement swaps the LIBOR rate in effect under the new credit agreement for this portion of the loan to a fixed-rate of 2.0311%, which includes a 1% LIBOR floor. Management has elected to designate this interest rate swap as a cash flow hedge for accounting purposes.
Interest Rate Caps
Pursuant to the terms of the Holdco I Loans and the Holdco III Mortgage Loan, we were required to maintain interest rate caps. The effect of these interest rate cap agreements was to limit our
F-60
Table of Contents
maximum interest rate exposure with respect to increases in LIBOR. We purchased and maintained these interest rate caps during the periods ended June 30, 2014 and 2013, and the related gain or loss on these investments is reflected within other income (loss) in the accompanying condensed consolidated statements of operations. We did not elect to designate any of these interest rate caps as effective hedging instruments.
Fair Value of Derivative Instruments
The effects of our derivative instruments on our condensed consolidated balance sheets were as follows:
| September 30, 2014 | December 31, 2013 | |||||||||||
| Balance Sheet Classification |
Fair Value | Balance Sheet Classification |
Fair Value | |||||||||
|
|
||||||||||||
| (in thousands) | ||||||||||||
| Cash Flow Hedges: |
||||||||||||
| Interest rate swap |
Other non- current assets |
$ | 895 | N/A | N/A | |||||||
| Non-designated Hedges: |
||||||||||||
| Interest rate caps(1) |
Other non- current assets |
N/A | Other non- current assets |
$ | — | |||||||
|
|
||||||||||||
| (1) | The fair values of our interest rate caps were immaterial as December 31, 2013. The interest rate caps expired in July 2014. |
Earnings Effect of Derivative Instruments
The effects of our derivative instruments on our condensed consolidated statements of operations and condensed consolidated statements of comprehensive income, net of the effect for income taxes, were as follows:
| Classification of Gain (Loss) Recognized |
For the three months ended September 30, |
For the nine months ended September 30, |
||||||||||||||||
| 2014 | 2013 | 2014 | 2013 | |||||||||||||||
|
|
||||||||||||||||||
| (in thousands) | ||||||||||||||||||
| Cash Flow Hedges: |
||||||||||||||||||
| Interest rate swap(1) |
Other comprehensive income |
$ | 3,118 | $ | — | $ | 582 | $ | — | |||||||||
| Non-designated Hedges: |
||||||||||||||||||
| Interest rate caps |
Other income (loss) | — | (135 | ) | — | (135 | ) | |||||||||||
|
|
||||||||||||||||||
| (1) | There were no amounts recognized in earnings related to hedge ineffectiveness or amounts excluded from hedge effectiveness testing during the three and nine months ended September 30, 2014. |
F-61
Table of Contents
NOTE 8. FAIR VALUE MEASUREMENTS
The carrying amount and estimated fair values of our financial assets and liabilities, which include related current portions, were as follows:
| September 30, 2014 | December 31, 2013 | |||||||||||||||
| Carrying Amount |
Fair Value | Carrying Amount |
Fair Value | |||||||||||||
|
|
||||||||||||||||
| (in thousands) | ||||||||||||||||
| Cash and cash equivalents(1) |
$ | 108,488 | $ | 108,488 | $ | 33,412 | $ | 33,412 | ||||||||
| Restricted Cash(1) |
— | — | 104,026 | 104,026 | ||||||||||||
| Interest rate swaps(2) |
895 | 895 | — | — | ||||||||||||
| Long-term debt(3) |
1,930,206 | 1,899,630 | 2,720,286 | 2,715,695 | ||||||||||||
|
|
||||||||||||||||
| (1) | Classified as Level 1 under the fair value hierarchy. |
| (2) | Classified as Level 2 under the fair value hierarchy. |
| (3) | Classified as Level 3 under the fair value hierarchy. |
We believe the carrying amounts of our cash and cash equivalents and restricted cash approximated fair value as of September 30, 2014 and December 31, 2013, as applicable. Our estimates of the fair values were determined using available market information and valuation methods appropriate in the circumstances. Considerable judgment is necessary to interpret market data and develop estimated fair values. Proper placement of fair value measurements within the valuation hierarchy is considered each reporting period. Third-party information received for calculating Level 3 fair value measurements is reviewed to ensure it is in accordance with GAAP. The use of different market assumptions or estimation methods may have a material effect on the estimated fair value amounts.
Restricted cash is primarily comprised of short-term interest-bearing money market funds with maturities of less than 90 days and time deposits. The estimated fair values were based on available market pricing information of similar financial instruments.
The fair values of interest rate swaps are determined using widely accepted valuation techniques including discounted cash flow analysis on the expected cash flows of each instrument. This analysis reflects the contractual terms of the agreements, including the period to maturity, and uses observable market-based inputs, including forward interest rate curves. We incorporate credit valuation adjustments to appropriately reflect both our own nonperformance risk and the respective counterparty’s nonperformance risk in the fair value measurements.
We estimate the fair value of our long-term debt using discounted cash flow analysis based on current market inputs for similar types of arrangements. The primary sensitivity in these calculations is based on the selection of appropriate discount rates. We estimated the discount rate to be approximately 4.3% and 5.3%, as of September 30, 2014 and December 31, 2013, respectively. Fluctuations in these assumptions will result in different estimates of fair value.
We test long-lived assets for impairment annually or more frequently if events or changes in circumstances indicate that the asset might be impaired. In June 2014, we determined that the long-lived assets associated with one of our owned hotels were partially impaired primarily due to unfavorable expected terms of the upcoming underlying ground lease renewal and the likelihood of the Company abandoning the hotel upon expiration of the ground lease. As a result, we recorded an impairment loss of approximately $5.2 million for the nine months ended September 30, 2014. For the three months ended September 30, 2014, and the three and nine months ended September 30, 2013, no impairment was recorded.
F-62
Table of Contents
For this purpose, fair value of the property was estimated primarily using expected present value of future cash flows. The fair value estimate is considered to be Level 3 within the fair value measurement hierarchy.
The following fair value hierarchy table presents information about assets measured at fair value on a nonrecurring basis during the period ended September 30, 2014:
| September 30, 2014 | Level 1 | Level 2 | Level 3 | Total Fair Value |
Impairment Charge |
|||||||||||||||
|
|
||||||||||||||||||||
| (in thousands) | ||||||||||||||||||||
| 1 La Quinta Inn |
$ | — | $ | — | $ | 249 | $ | 249 | $ | 5,157 | ||||||||||
|
|
||||||||||||||||||||
We estimate the fair value of hotels classified as held for sale using the lower of cost or estimated fair value. The inputs used in determining the fair value are considered to be Level 2 and Level 3 within the fair value measurement hierarchy. Level 2 reflects our sales price as determined by contract with the buyer, less associated closing costs. Level 3 reflects our sales price as determined by contract with the buyer, less estimated associated closing costs.
The following fair value hierarchy table presents information of our hotels classified as assets held for sale measured at fair value on a non-recurring basis as of December 31, 2013, and related impairment charges recorded:
| December 31, 2013 | Level 1 | Level 2 | Level 3 | Total Fair Value |
Impairment Charge |
|||||||||||||||
|
|
||||||||||||||||||||
| (in thousands) | ||||||||||||||||||||
| 4 La Quinta Inns |
$ | — | $ | — | $ | 7,134 | $ | 7,134 | $ | 1,113 | ||||||||||
|
|
||||||||||||||||||||
NOTE 9. RELATED PARTY TRANSACTIONS
We maintain various agreements and enter into certain transactions with affiliates of the Funds. Prior to April 14, 2014 these affiliates owned the Previously Managed Hotels (see Note 4), which were managed by LQM. The following is a discussion of these arrangements and resulting transactions from January 1, 2014 to April 14, 2014:
Management and Service Agreements
Hotel Management Agreements—Pursuant to hotel management agreements with affiliates of the Funds in existence prior to the IPO (“LQM Management Agreements”), LQM provided management services to the Previously Managed Hotels until the IPO, including supervision, direction, operation, management and promotion. The LQM Management Agreements would have expired in July 2027, but could have been terminated by either party at any time and for any reason and were terminated in connection with the IPO. Under the terms of the LQM Management Agreements, LQM was entitled to recover a management fee of 1.67% of gross operating revenue from the Previously Managed Hotels, as well as reimbursement for certain shared group costs.
Management fees earned by LQM from the Previously Managed Hotels, for the period from January 1, 2014 to April 14, 2014 were $0.2 million. For the three and nine month periods ended September 30, 2013, management fees earned from the Previously Managed Hotels were approximately $0.2 million and $0.5 million, respectively. These management fees are included within franchise and other fee-based revenues in the accompanying condensed consolidated statements of operations.
F-63
Table of Contents
In addition, in accordance with the LQM Management Agreements, LQM also provided certain group services for hotels it managed, including group and administrative services, information systems support, training, and other field services, and was reimbursed for the cost of providing these services. For the period from January 1, 2014 to April 14, 2014, LQM earned group services reimbursements from the Previously Managed Hotels of approximately $0.2 million. During the three and nine month periods ended September 30, 2013, LQM earned group services reimbursements from the Previously Managed Hotels of approximately $0.2 million and $0.5 million, respectively. These fees are included within franchise and other fee-based revenues in the accompanying condensed consolidated statements of operations.
Other Fees and Funding
Brand Marketing Fund (BMF)—We maintain the BMF on behalf of our franchisees and the hotel properties we own and manage, and we charge these hotels a fee of 2.5% of gross room revenue, which is then used by the BMF to fund national advertising promotions and campaigns. BMF fees collected from franchised and managed hotels, and the related expenses, are reflected as brand marketing fund revenues and expenses from franchise and managed hotels in the accompanying condensed consolidated statements of operations.
Customer Loyalty Program—We administer a customer loyalty program, La Quinta Returns (“Returns”), and charge participating hotels a fee to administer the program equal to 5% of the Returns members’ eligible room rate per night. Returns fees collected from franchised and managed hotels are reflected within franchise and other fees-based revenues in the accompanying condensed consolidated statements of operations. We recorded revenues related to Returns from the Previously Managed Hotels of approximately $0.3 million for the period from January 1, 2014 to April 14, 2014. We recorded revenues related to Returns from the Previously Managed Hotels of approximately $0.2 million and $0.7 million during the three and nine month periods ended September 30, 2013.
Trademark Licenses—In accordance with our management agreements with the Previously Managed Hotels existing until their acquisition on April 14, 2014, we charged a royalty fee of 0.33% of the Previously Managed Hotels’ gross room revenues. For the period January 1, 2014 to April 14, 2014, royalty fees charged to the Previously Managed Hotels under these agreements were approximately $0.1 million. During each of the three and nine month periods ended September 30, 2013, royalty fees charged to the Previously Managed Hotels under these agreements were approximately $0.1 million. These royalty fees are reflected within franchise and other fee-based revenues in the accompanying condensed consolidated statements of operations.
Receivables from / Payable to Affiliates—As of September 30, 2014, the payable balance to the parent company of the Previously Managed Hotels was approximately $1.0 million. This payable balance reflects amounts we owe to the seller of the Previously Managed Hotels related to post-closing working capital true-up calculations. As of December 31, 2013, the receivable balance from the parent company of the Previously Managed Hotels was approximately $10.9 million. This receivable occurred in the normal course of business and was settled in connection with the purchase of the Previously Managed Hotels by the La Quinta Predecessor Entities. (See Note 4)
We also purchase products and services from entities affiliated with or owned by Blackstone. The fees paid for these products and services were approximately $0.8 million during each of the
F-64
Table of Contents
three months ended September 30, 2014 and 2013. The fees paid for these products and services were approximately $2.3 million and $2.4 million during the nine months ended September 30, 2014 and 2013, respectively.
NOTE 10. COMMITMENTS AND CONTINGENCIES
Environmental—We are subject to certain requirements and potential liabilities under various federal, state and local environmental laws, ordinances, and regulations. Such requirements often impose liability without regard to whether the current or previous owner or operator knew of, or was responsible for, the presence of such hazardous or toxic substances. Although we have incurred and expect to incur remediation and other environmental costs during the ordinary course of operations, we anticipate that such costs will not have a material effect on our financial condition, results of operations, or cash flows.
Litigation—We are party to a number of pending claims and lawsuits arising in the normal course of business. We maintain general and other liability insurance; however, certain costs of defending lawsuits, such as those below the insurance deductible amount, are not covered by or are only partially covered by insurance policies, or the insurance carriers could refuse to cover certain claims in whole or in part. We regularly evaluate ultimate liability costs with respect to such claims and lawsuits. We accrue costs incurred from defending litigation as they become determinable. We do not consider our ultimate liability with respect to any single claim or lawsuit, or the aggregate of such claims and lawsuits, to be material in relation to our condensed consolidated balance sheets, results of operations, or cash flows taken as a whole.
Casualty Losses—We maintain insurance for property and casualty damage, subject to deductibles and policy terms and conditions, attributable to wind, flood, and earthquakes. We also maintain business interruption insurance.
Tax Contingencies—We are subject to regular audits by federal and state tax authorities. These audits may result in additional tax liabilities. The Internal Revenue Service (the “IRS”) is currently auditing the tax returns of La Quinta Corporation, one of our former REITs prior to the Pre-IPO Transactions, and BRE/LQ Operating Lessee Inc., one of our former taxable REIT subsidiaries prior to the Pre-IPO Transactions, in each case for the tax years ended December 31, 2010 and 2011. We received a draft notice of proposed adjustment from the IRS on January 9, 2014, and the notice of proposed adjustment was issued to us on June 2, 2014. We submitted a timely response to the notice of proposed adjustment and, on July 7, 2014, we received an IRS 30-Day Letter proposing to impose a 100% tax on the REIT totaling $158 million for the periods under audit in which the IRS has asserted that the rent charged for these periods under the lease of hotel properties from the REIT to the taxable REIT subsidiary exceeded an arm’s length rent. In addition, the IRS proposed to eliminate $89 million of net operating loss carryforwards for the taxable REIT subsidiary for the tax years 2006 through 2009; however, in an IRS rebuttal received on September 26, 2014, the IRS conceded its proposed adjustment on this point was incorrect. We disagree with the IRS’ position with respect to rents charged by the REIT to its taxable REIT subsidiary and have appealed the proposed tax and adjustments to the IRS Appeals Office. In determining amounts payable by our taxable REIT subsidiary under the lease, we engaged a third party to prepare a transfer pricing study contemporaneous with the lease which concluded that the lease terms were consistent with an arm’s length rent as required by relevant provisions of the Internal Revenue Code of 1986 (the “Internal Revenue Code”) and applicable Treasury Regulations. We believe the IRS transfer pricing methodologies applied in the audits contain flaws and that the IRS proposed tax and adjustments are inconsistent with the U.S. federal tax
F-65
Table of Contents
laws related to REITs. We have concluded that the positions reported on our tax returns under audit by the IRS are, based on their technical merits, more-likely-than-not to be sustained upon examination. Accordingly, as of September 30, 2014, we have not established any reserves related to this proposed adjustment or any other issues reflected on the returns under examination.
Purchase Commitments—As of September 30, 2014, we had approximately $22.0 million of purchase commitments related to certain continuing redevelopment and renovation projects.
Franchise Commitments—Under certain franchise agreements, we are committed to provide certain incentive payments, reimbursements, rebates, and other payments to help defray certain costs. Our obligation to fund these commitments is contingent upon certain conditions set forth in the respective franchise agreement. The franchise agreements generally require that, in the event that the franchise relationship is terminated, the franchisee is required to repay any outstanding balance plus any unamortized portion of any incentive payment. As of September 30, 2014, we had $1.6 million in outstanding commitments owed to various franchisees for such financial assistance.
NOTE 11: INCOME TAXES
Prior to our IPO on April 14, 2014, we operated primarily as limited liability companies treated as partnerships for U.S. federal income tax purposes, REIT entities, and taxable entities. As a result, we were not subject to U.S. federal and most state income taxes for our limited liability companies and our REIT entities. Our partnership and REIT status terminated in connection with the IPO, as the La Quinta Predecessor Entities were contributed to Holdings, a “C” corporation, the shares of capital stock held by third-party shareholders of our REIT entities were redeemed for cash totaling approximately $3.9 million, and our REITs were converted into limited liability companies. As a result of these transactions, we have become subject to additional entity-level taxes and, during the second quarter, we recorded a one-time net deferred tax expense of $321.1 million, which established the associated net deferred tax liability on our balance sheet, and reflects the future tax consequences attributable to differences between the financial statement carrying amounts of existing assets and liabilities and their respective tax bases at the estimated blended statutory U.S. federal and state income tax rate of 38.1%. More specifically, this initial deferred tax expense is primarily driven by (1) the recognition of additional deferred tax liabilities totaling approximately $462.3 million which are primarily related to differences between the book and tax basis for our fixed and intangible assets and related depreciation and (2) the recognition of additional deferred tax assets totaling approximately $141.2 million which are primarily related to the expected realization of federal net operating loss carryforwards.
The Company recorded a provision for federal, state and foreign income taxes of approximately $16.1 million for the three months ended September 30, 2014, excluding the effect of the one-time recognition of the net deferred tax liabilities upon C-corporation conversion, and approximately $1.0 million for the three months ended September 30, 2013. For the nine months ended September 30, 2014 the Company recorded a provision for federal, state and foreign income taxes of approximately $21.9 million, excluding the effect of the recognition of the one-time net deferred tax liabilities upon C-corporation conversion, and approximately $2.5 million for the nine months ended September 30, 2013. The provisions for the three and nine month periods ended September 30, 2014 reflect the impacts of a loss in the pre-IPO period for which no tax benefit has been recorded as well as certain equity compensation charges that are not deductible for income tax purposes, as applicable.
F-66
Table of Contents
NOTE 12. EMPLOYEE BENEFIT PLANS
We maintain a deferred savings plan covering substantially all of our employees that qualified under Section 401(k) of the Internal Revenue Code. Our deferred savings plan has an employer matching contribution of 100% of the first 3% and 50% of the next 2% of an employee’s eligible earnings, which vests immediately. We paid employer contributions of approximately $0.6 million and $0.5 million during the three months ended September 30, 2014 and 2013, respectively. We paid employer contributions of approximately $1.5 million and $1.4 million during the nine months ended September 30, 2014 and 2013, respectively.
NOTE 13. EQUITY BASED COMPENSATION
Promote Plan
Prior to the IPO Effective Date, certain members of our management and others associated with Blackstone (the “Promote Participants”) were eligible to receive long-term incentives evidenced by units (the “Units”) in LQ Services L.L.C. (“LQ Services”), which indirectly held interests in the Company, which Units were intended to be treated as “profits interests” for U.S. tax purposes (the “Promote Plan”). Units were typically granted by our Chief Executive Officer, in consultation with Blackstone, to key employees upon hire. Unit levels could also be adjusted to recognize changing job responsibilities. All of the Units were subject to exit-based vesting on the date when there was a sale, transfer or disposition of all or substantially all of the assets of the La Quinta Predecessor Entities to an unaffiliated entity which resulted in distributions being payable to the holders of the Units (a “Liquidity Event”), subject to a Promote Participant’s continued employment on such date. The value in respect of Units would have been determined based upon the amounts received by Blackstone pursuant to a Liquidity Event, net of certain debt repayments and return of equity to Blackstone. As payments in respect of the Units were contingent on occurrence of a Liquidity Event, which was not assessed to be probable prior to the date of our IPO, no expense was accrued or recognized for the Units prior to April 14, 2014.
On the IPO Effective Date, Units that were outstanding under the Promote Plan at the time of the offering were exchanged for 3.1 million vested and unvested shares of common stock of Holdings of equivalent economic value, using the initial public offering price of Holdings shares of $17.00 per share and issued as follows: (1) 40% of the shares received were vested shares of common stock; (2) 40% of the shares received were unvested shares of restricted stock that will vest on the first anniversary of the IPO Effective Date, contingent upon continued employment through that date; and (3) 20% of the shares received were unvested shares of restricted stock that will vest on the earlier of the date that Blackstone and its affiliates cease to own 50% or more of Holdings or the seventh anniversary of the IPO Effective Date, contingent upon continued employment at that date.
Total compensation expense under the Promote Plan was $5.4 million and $31.7 million during the three and nine months ended September 30, 2014, respectively. Unrecognized compensation expense as of September 30, 2014 was $20.1 million. As of September 30, 2014, 9,658 shares have been forfeited from the Promote Plan.
2014 Omnibus Incentive Plan
In connection with, and prior to completion of, the IPO, our Board of Directors adopted, and our stockholders approved, the La Quinta Holdings Inc. 2014 Omnibus Incentive Plan (the “2014
F-67
Table of Contents
Omnibus Incentive Plan”). The 2014 Omnibus Incentive Plan provides for the granting of stock options, restricted stock and other equity based or performance-based awards denominated in cash or in stock to directors, officers, employees, consultants and advisors of Holdings and its affiliates.
2014 Omnibus Incentive Plan Grant I (“Grant I”)—Effective on the IPO Effective Date, Holdings issued 0.35 million shares of Holdings common stock under our 2014 Omnibus Incentive Plan with a grant date fair value of $16.65 per share to certain of our employees as follows: (1) 50% of the shares granted were vested shares of common stock; (2) 40% of the shares granted were unvested shares of restricted stock that will vest on the first anniversary of the IPO Effective Date, contingent upon continued employment through that date; and (3) 10% of the shares granted were unvested shares of restricted stock that will vest on the earlier of the date that Blackstone and its affiliates cease to own 50% or more of Holdings or the seventh anniversary of the IPO Effective Date, contingent upon continued employment through that date.
2014 Omnibus Incentive Plan Grant II (“Grant II”)—On June 11, 2014, Holdings issued 1.01 million shares of Holdings common stock under our 2014 Omnibus Incentive Plan with a grant date fair value of $18.70 per share to certain of our employees. Grant II is a time-based vesting award with multiple tranches that vest on various dates with a remaining weighted average life of 1.6 years as of September 30, 2014. The fair value of Grant II will be recognized on a straight-line basis over the requisite service period of each tranche included in the award.
2014 Omnibus Incentive Plan Director Unit Grant (“2014 Director Unit Grant”)—On June 11, 2014, we granted 16,044 restricted stock units (“RSUs”) to our independent directors under our 2014 Omnibus Incentive Plan, as part of our regular annual compensation of our independent directors. The 2014 Director Unit Grant vests in three equal installments on the first, second and third anniversaries of the grant date. The grant date fair value was $18.70 per RSU. The fair value of the RSUs will be recognized on a straight-line basis over the requisite service period for the entire award. Vested RSUs will be settled with shares of our common stock.
2014 Omnibus Incentive Plan Performance Unit Grant (“2014 Performance Unit Grant”)—On June 11, 2014, we issued 109 performance-based RSUs (the “PSUs”), which represent 0.5 million shares of common stock to certain of our employees. The performance period for the 2014 Performance Unit Grant ends December 31, 2016, with a remaining life of 2.3 years as of September 30, 2014. The calculation of the value of the units granted under the 2014 Performance Unit Grant is weighted as follows: 70% based on the Company’s total shareholder return (“TSR”) relative to the total shareholder returns of a defined set of peer companies (“Relative Shareholder Return”); and 30% based on the Company’s absolute TSR compound annual growth rate (“TSR CAGR”). The number of common shares issued in exchange for each PSU at the end of the performance period is determined based on a calculated multiple of defined target amounts for TSR CAGR and Relative Shareholder Return. Possible payout multiples range from 33% of target, which represents the threshold and below which no payout is given, and 167% of target, which represents the maximum payout. The 2014 Performance Unit Grant PSUs will be settled with shares of the Company’s common stock.
F-68
Table of Contents
The grant date fair value of the 2014 Performance Unit Grant was $19.80 per share, which was determined using a Monte Carlo simulation valuation model with the following assumptions:
| Expected volatility(1) |
24.05% | |||
| Dividend yield(2) |
—% | |||
| Risk-free rate(3) |
0.70% | |||
| Expected term (in years)(4) |
2.6 | |||
|
|
||||
| (1) | Due to limited trading history for our common stock, we did not have sufficient information available on which to base a reasonable and supportable estimate of the expected volatility of our share price. As a result, we used an average historical volatility of our peer group over a time period consistent with our expected term assumption. Our peer group was determined based upon companies in our industry with similar business models and is included with those used to benchmark our executive compensation. |
| (2) | We have no foreseeable plans to pay dividends during the expected term of these performance shares. |
| (3) | Based on the yields of U.S. Department of Treasury instruments with similar expected lives. |
| (4) | Midpoint of the 30-calendar day period preceding the end of the performance period. |
During the three and nine months ended September 30, 2014, total compensation expense for awards under the 2014 Omnibus Incentive Plan was $3.2 million and $7.9 million, respectively, excluding related taxes. Unrecognized compensation expense as of September 30, 2014 was $25.7 million. As of September 30, 2014, 620 shares have been forfeited from awards made under the 2014 Omnibus Incentive Plan.
As of September 30, 2014, there were 11.6 million shares of common stock available for future issuance under the 2014 Omnibus Incentive Plan.
NOTE 14. EARNINGS PER SHARE
Basic earnings per share is computed by dividing net income available to common stockholders by the weighted average number of shares of the Company’s unrestricted common stock outstanding. Diluted earnings per share is computed by dividing net income available to common stockholders, as adjusted for potentially dilutive securities, by the weighted average number of shares of the Company’s unrestricted common stock outstanding plus other potentially dilutive securities. Dilutive securities include equity based awards issued under long-term incentive plans.
As discussed in Note 1, on April 14, 2014, the Company completed its IPO. For purposes of computing net income per share, it is assumed that our IPO and ownership reorganization had occurred for all periods presented and therefore the outstanding shares have been adjusted to reflect the conversion of shares that took place in connection with the IPO. Accordingly, the denominators in the computations of basic and diluted net income per share reflect our IPO and ownership reorganization for all periods presented.
F-69
Table of Contents
The calculations of basic and diluted earnings per share are as follows:
| For the three months ended September 30, |
For the nine months ended September 30, |
|||||||||||||||
| 2014 | 2013 | 2014 | 2013 | |||||||||||||
|
|
||||||||||||||||
| (in thousands, except per share data) | ||||||||||||||||
| Numerator: |
||||||||||||||||
| Income (loss) from continuing operations attributable to La Quinta Holdings’ stockholders |
$ | 12,817 | $ | 12,629 | $ | (332,601 | ) | $ | 14,951 | |||||||
| Income (loss) from discontinued operations attributable to La Quinta Holdings’ stockholders |
— | 9,941 | (503 | ) | (6,303 | ) | ||||||||||
|
|
|
|||||||||||||||
| Net income (loss) attributable to La Quinta Holdings’ stockholders |
$ | 12,817 | $ | 22,570 | $ | (333,104 | ) | $ | 8,648 | |||||||
|
|
|
|||||||||||||||
| Denominator: |
||||||||||||||||
| Weighted average number of shares outstanding, basic |
127,734 | 121,996 | 125,542 | 121,996 | ||||||||||||
| Weighted average number of shares outstanding, diluted |
128,494 | 121,996 | 125,542 | 121,996 | ||||||||||||
| Income (loss) from continuing operations attributable to La Quinta Holdings’ stockholders per common share, basic and diluted |
$ | 0.10 | $ | 0.11 | $ | (2.65 | ) | $ | 0.12 | |||||||
| Income (loss) from discontinued operations attributable to La Quinta Holdings’ stockholders per common share, basic and diluted |
— | 0.08 | — | (0.05 | ) | |||||||||||
|
|
|
|||||||||||||||
| Basic and diluted earnings (loss) per share |
$ | 0.10 | $ | 0.19 | $ | (2.65 | ) | $ | 0.07 | |||||||
|
|
||||||||||||||||
Approximately 0.3 million shares and 1.2 million shares for the three months and nine months ended September 30, 2014, respectively, were excluded from the computation of diluted shares, as their impact would have been anti-dilutive. For the three and nine months ended September 30, 2013, no shares were considered anti-dilutive.
NOTE 15. SEGMENTS
Our operating segments are components of the business which are managed discretely and for which discrete financial information is reviewed regularly by our Chief Executive Officer, who is our chief operating decision maker, to assess performance and make decisions regarding the allocation of resources. Our operating and reportable segments are defined as follows:
| • | Owned hotels—This segment derives its earnings from the operation of owned hotel properties located in the United States. |
| • | Franchise and management—This segment derives its earnings primarily from revenues earned under various franchise and management agreements relating to our owned, franchised, and managed hotels, which provide for us to earn compensation for the licensing of our brand to franchisees, as well as for services rendered, such as hotel management and providing access to certain shared services and marketing programs such as reservations, Returns, and property management systems. |
F-70
Table of Contents
Corporate and other includes revenues generated and operating expenses incurred in connection with the overall support and brand management of our owned, managed, and franchised hotels and operations.
The performance of our operating segments is evaluated primarily based upon Adjusted EBITDA, which should not be considered an alternative to net income (loss) or other measures of financial performance or liquidity derived in accordance with GAAP. We define Adjusted EBITDA as our net income (exclusive of non-controlling interests) before interest expense, income tax expense (benefit), and depreciation and amortization, further adjusted to exclude certain items, including, but not limited to: gains, losses, and expenses in connection with: (i) asset dispositions; (ii) debt modifications/retirements; (iii) non-cash impairment charges; (iv) discontinued operations; (v) equity based compensation and (vi) other items.
The table below shows summarized consolidated financial information by segment for the three and nine months ended September 30, 2014 and 2013:
| For the three months ended September 30, |
For the nine months ended September 30, |
|||||||||||||||
| 2014 | 2013 | 2014 | 2013 | |||||||||||||
|
|
||||||||||||||||
| (in thousands) | ||||||||||||||||
| Revenues |
||||||||||||||||
| Owned hotels |
$ | 241,266 | $ | 211,569 | $ | 667,564 | $ | 601,504 | ||||||||
| Franchise and management(1) |
29,054 | 15,233 | 68,977 | 42,232 | ||||||||||||
|
|
|
|||||||||||||||
| Segment revenues |
270,320 | 226,802 | 736,541 | 643,736 | ||||||||||||
| Other fee-based revenues from franchise and managed properties |
6,158 | 5,411 | 16,511 | 14,594 | ||||||||||||
| Corporate and other(2) |
34,026 | 26,733 | 88,054 | 74,424 | ||||||||||||
| Intersegment elimination(3) |
(39,386 | ) | (20,911 | ) | (92,390 | ) | (59,370 | ) | ||||||||
|
|
|
|||||||||||||||
| Total revenues |
$ | 271,118 | $ | 238,035 | $ | 748,716 | $ | 673,384 | ||||||||
|
|
|
|||||||||||||||
| Adjusted EBITDA |
||||||||||||||||
| Owned hotels |
$ | 87,951 | $ | 88,997 | $ | 249,226 | $ | 246,171 | ||||||||
| Franchise and management |
29,054 | 15,233 | 68,977 | 42,232 | ||||||||||||
|
|
|
|||||||||||||||
| Segment Adjusted EBITDA |
117,005 | 104,230 | 318,203 | 288,403 | ||||||||||||
| Corporate and other |
(7,708 | ) | (10,483 | ) | (27,944 | ) | (32,188 | ) | ||||||||
|
|
|
|||||||||||||||
| Adjusted EBITDA |
$ | 109,297 | $ | 93,747 | $ | 290,259 | $ | 256,215 | ||||||||
|
|
||||||||||||||||
| (1) | This segment includes intercompany fees which are charged to our owned hotels to reflect that certain functions, such as licensing and management, are included in the franchise and management segment. Prior to the IPO, we charged aggregate fees of 2.0% (0.33% license fees for trademark rights and 1.67% management fee for management services) to our owned hotels. In connection with the IPO, we entered into a new franchise agreement with our owned hotels, which covers certain services as well as trademark rights, and a new management agreement and terminated the existing agreements with our owned hotels. The new agreements, which commenced April 14, 2014, provide for a franchise fee of 4.5% of gross room revenues and a management fee of 2.5% of gross operating revenue for our owned hotels. Our consolidated financial information by segment for periods prior to April 14, 2014 presented herein reflects the historical aggregate fees of 2.0%. |
| (2) | Includes revenues related to our brand management programs and other cost reimbursements. The portions of these fees that are charged to our owned hotels, which totaled $51.0 million and $41.4 million for the nine months ended September 30, 2014 and 2013, respectively, and $20.1 million and $14.4 million for the three months ended September 30, 2014 and 2013, respectively, are eliminated in the accompanying condensed consolidated financial statements. The franchise agreement we entered into with our owned hotels upon effectiveness of the IPO also includes a reservation fee of 2.0% of gross room revenues, which is reflected in corporate and other. |
| (3) | Includes management, license, franchise, BMF, Returns and other cost reimbursements totaling $39.4 million and $20.9 million for each of the three months periods ended September 30, 2014 and 2013, respectively and $92.4 million and $59.4 million for each of the nine month periods ended September 30, 2014 and 2013, respectively. These fees are charged to owned hotels and are eliminated in the accompanying condensed consolidated financial statements. |
F-71
Table of Contents
The table below provides a reconciliation of Adjusted EBITDA to EBITDA and EBITDA to net loss attributable to La Quinta Holdings’ stockholders for the three and nine months ended September 30, 2014 and 2013:
| For the three months ended September 30, |
For the nine months ended September 30, |
|||||||||||||||
| 2014 | 2013 | 2014 | 2013 | |||||||||||||
|
|
||||||||||||||||
| (in thousands) | ||||||||||||||||
| Adjusted EBITDA |
$ | 109,297 | $ | 93,747 | $ | 290,259 | $ | 256,215 | ||||||||
| Income (loss) from discontinued operations |
— | 1,533 | (377 | ) | 8,420 | |||||||||||
| Impairment loss |
— | — | (5,308 | ) | (19,913 | ) | ||||||||||
| Gain on sale from discontinued operations |
— | 7,694 | — | 7,694 | ||||||||||||
| Gain (loss) on retirement of assets |
— | 4 | — | (47 | ) | |||||||||||
| Gain related to casualty disasters |
108 | 739 | 1,106 | 2,611 | ||||||||||||
| Loss on extinguishment of debt, net |
— | — | (2,030 | ) | — | |||||||||||
| Equity based compensation |
(8,600 | ) | — | (39,703 | ) | — | ||||||||||
| Other gains (losses), net(1) |
(1,924 | ) | 314 | (2,312 | ) | (3,034 | ) | |||||||||
|
|
|
|||||||||||||||
| EBITDA |
98,881 | 104,031 | 241,635 | 251,946 | ||||||||||||
| Interest expense |
(24,500 | ) | (38,290 | ) | (97,300 | ) | (110,908 | ) | ||||||||
| Income tax provision |
(16,162 | ) | (969 | ) | (21,860 | ) | (2,573 | ) | ||||||||
| Recognition of net deferred tax liabilities upon C-corporation conversion |
— | — | (321,054 | ) | — | |||||||||||
| Depreciation and amortization |
(45,352 | ) | (41,796 | ) | (130,711 | ) | (128,711 | ) | ||||||||
| Noncontrolling interests |
(50 | ) | (406 | ) | (3,814 | ) | (1,106 | ) | ||||||||
|
|
|
|||||||||||||||
| Net income (loss) attributable to La Quinta Holdings’ stockholders |
$ | 12,817 | $ | 22,570 | $ | (333,104 | ) | $ | 8,648 | |||||||
|
|
||||||||||||||||
| (1) | Other gains (losses), net primarily consists of net income (loss) attributable to the BMF (which, over time, runs at a break-even level, but may reflect a profit or loss from period to period) and litigation reserve adjustments. |
The following table presents assets for our reportable segments, reconciled to consolidated amounts as of September 30, 2014 and December 31, 2013:
| September 30, 2014 |
December 31, 2013 |
|||||||
|
|
||||||||
| (in thousands) | ||||||||
| Total Assets |
||||||||
| Owned hotels |
$ | 2,913,039 | $ | 2,925,882 | ||||
| Franchise and management |
193,257 | 192,191 | ||||||
|
|
|
|||||||
| Total segments assets |
3,106,296 | 3,118,073 | ||||||
| Corporate and other |
134,809 | 51,761 | ||||||
|
|
|
|||||||
| Total |
$ | 3,241,105 | $ | 3,169,834 | ||||
|
|
||||||||
F-72
Table of Contents
The following table presents capital expenditures for our reportable segments, reconciled to our consolidated amounts for the nine months ended September 30, 2014 and 2013:
| For the nine months ended September 30, |
||||||||
| 2014 | 2013 | |||||||
|
|
||||||||
| Capital Expenditures |
| |||||||
| Owned hotels |
$ | 52,019 | $ | 70,625 | ||||
| Franchise and management |
— | — | ||||||
|
|
|
|||||||
| Total segment capital expenditures |
52,019 | 70,625 | ||||||
| Corporate and other |
13,813 | 12,354 | ||||||
|
|
|
|||||||
| Total |
$ | 65,832 | $ | 82,979 | ||||
|
|
||||||||
************
F-73
Table of Contents
To the Managing Member of
WIH La Quinta Inn Hotels:
We have audited the accompanying combined financial statements of WIH La Quinta Inn Hotels (the “Company”), which comprise the combined balance sheets as of December 31, 2013 and 2012, and the related combined statements of operations, changes in member’s equity (deficit), and cash flows for each of the three years in the period ended December 31, 2013, and the related notes to the combined financial statements. The combined financial statements include the accounts of La Quinta Inn—Fairfield, La Quinta Inn—Armonk, La Quinta Inn—Coral Springs, La Quinta Inn—Deerfield, La Quinta Inn—Sunrise, La Quinta Inn—Miami Lakes, La Quinta Inn—Naples, La Quinta Inn—Plantation, La Quinta Inn—Sarasota, La Quinta Inn—Wayne, La Quinta Inn—West Palm Beach, La Quinta Inn—Ft. Lauderdale, La Quinta Inn—Clifton, and La Quinta Inn—Elmsford. These entities are under common ownership and common management.
Management’s responsibility for the combined financial statements
Management is responsible for the preparation and fair presentation of these combined financial statements in accordance with accounting principles generally accepted in the United States of America; this includes the design, implementation, and maintenance of internal control relevant to the preparation and fair presentation of combined financial statements that are free from material misstatement, whether due to fraud or error.
Auditors’ responsibility
Our responsibility is to express an opinion on these combined financial statements based on our audits. We conducted our audits in accordance with auditing standards generally accepted in the United States of America. Those standards require that we plan and perform the audit to obtain reasonable assurance about whether the combined financial statements are free from material misstatement.
An audit involves performing procedures to obtain audit evidence about the amounts and disclosures in the combined financial statements. The procedures selected depend on the auditor’s judgment, including the assessment of the risks of material misstatement of the combined financial statements, whether due to fraud or error. In making those risk assessments, the auditor considers internal control relevant to the Company’s preparation and fair presentation of the combined financial statements in order to design audit procedures that are appropriate in the circumstances, but not for the purpose of expressing an opinion on the effectiveness of the Company’s internal control. Accordingly, we express no such opinion. An audit also includes evaluating the appropriateness of accounting policies used and the reasonableness of significant accounting estimates made by management, as well as evaluating the overall presentation of the combined financial statements.
We believe that the audit evidence we have obtained is sufficient and appropriate to provide a basis for our audit opinion.
F-74
Table of Contents
Opinion
In our opinion, the combined financial statements referred to above present fairly, in all material respects, the financial position of WIH La Quinta Inn Hotels as of December 31, 2013 and 2012, and the results of their operations and their cash flows for each of the three years in the period ended December 31, 2013, in accordance with accounting principles generally accepted in the United States of America.
/s/ Deloitte & Touche LLP
Miami, Florida
February 26, 2014
F-75
Table of Contents
Combined Balance Sheets
As of December 31, 2013 and 2012
| (In thousands) | 2013 | 2012 | ||||||
|
|
||||||||
| ASSETS |
||||||||
| CURRENT ASSETS: |
||||||||
| Cash and cash equivalents |
$ | 42 | $ | 27 | ||||
| Restricted cash |
2 | — | ||||||
| Accounts receivable—net |
936 | 1,565 | ||||||
| Inventory |
243 | 245 | ||||||
| Prepaid expenses and other |
490 | 273 | ||||||
|
|
|
|||||||
| Total current assets |
1,713 | 2,110 | ||||||
| PROPERTY AND EQUIPMENT—Net |
86,195 | 88,725 | ||||||
| OTHER ASSETS |
101 | 101 | ||||||
|
|
|
|||||||
| TOTAL |
$ | 88,009 | $ | 90,936 | ||||
|
|
|
|||||||
| LIABILITIES AND MEMBER’S EQUITY |
||||||||
| CURRENT LIABILITIES: |
||||||||
| Accounts payable and accrued expenses |
$ | 2,873 | $ | 3,738 | ||||
| Mortgage loan and mezzanine loan |
61,103 | — | ||||||
|
|
|
|||||||
| Total current liabilities |
63,976 | 3,738 | ||||||
|
|
|
|||||||
| MORTGAGE LOAN AND MEZZANINE LOAN |
— | 67,455 | ||||||
|
|
|
|||||||
| Total liabilities |
63,976 | 71,193 | ||||||
|
|
|
|||||||
| COMMITMENTS AND CONTINGENCIES (Note 6) |
||||||||
| MEMBER’S EQUITY |
24,033 | 19,743 | ||||||
|
|
|
|||||||
| TOTAL |
$ | 88,009 | $ | 90,936 | ||||
|
|
||||||||
See notes to combined financial statements.
F-76
Table of Contents
Combined statements of operations
For the years ended December 31, 2013, 2012, and 2011
| (In thousands) | 2013 | 2012 | 2011 | |||||||||
|
|
||||||||||||
| REVENUE: |
||||||||||||
| Room |
$ | 38,316 | $ | 35,328 | $ | 32,562 | ||||||
| Retail and other |
455 | 488 | 510 | |||||||||
|
|
|
|||||||||||
| Total revenue |
38,771 | 35,816 | 33,072 | |||||||||
|
|
|
|||||||||||
| OPERATING EXPENSES: |
||||||||||||
| Room |
8,548 | 8,532 | 7,953 | |||||||||
| Retail and other |
282 | 271 | 276 | |||||||||
| Management, marketing and related party fees |
1,863 | 1,632 | 1,515 | |||||||||
| Selling, general, and administrative |
14,253 | 14,102 | 13,966 | |||||||||
| Depreciation |
4,685 | 4,450 | 4,678 | |||||||||
|
|
|
|||||||||||
| Total operating expenses |
29,631 | 28,987 | 28,388 | |||||||||
|
|
|
|||||||||||
| (LOSS) GAIN ON DISPOSAL OF PROPERTY AND EQUIPMENT |
(322 | ) | (695 | ) | 4 | |||||||
|
|
|
|||||||||||
| OPERATING INCOME |
8,818 | 6,134 | 4,688 | |||||||||
| INTEREST EXPENSE |
(1,663 | ) | (1,551 | ) | (2,060 | ) | ||||||
| GAIN ON EXTINGUISHMENT OF DEBT |
— | — | 6,705 | |||||||||
|
|
|
|||||||||||
| NET INCOME |
$ | 7,155 | $ | 4,583 | $ | 9,333 | ||||||
|
|
||||||||||||
See notes to combined financial statements.
F-77
Table of Contents
Combined statements of changes in member’s equity (deficit)
For the years ended December 31, 2013, 2012, and 2011
| (In thousands) | ||||
|
|
||||
| BALANCE—January 1, 2011 |
$ | (5,201 | ) | |
| Net income |
9,333 | |||
| Contributions |
31,132 | |||
| Distributions |
(16,927 | ) | ||
|
|
|
|||
| BALANCE—December 31, 2011 |
18,337 | |||
| Net income |
4,583 | |||
| Contributions |
2,916 | |||
| Distributions |
(6,093 | ) | ||
|
|
|
|||
| BALANCE—December 31, 2012 |
19,743 | |||
| Net income |
7,155 | |||
| Contributions |
6,352 | |||
| Distributions |
(9,217 | ) | ||
|
|
|
|||
| BALANCE—December 31, 2013 |
$ | 24,033 | ||
|
|
||||
See notes to combined financial statements.
F-78
Table of Contents
Combined statements of cash flows
For the years ended December 31, 2013, 2012, and 2011
| (In thousands) | 2013 | 2012 | 2011 | |||||||||
|
|
||||||||||||
| CASH FLOWS FROM OPERATING ACTIVITIES: |
||||||||||||
| Net income |
$ | 7,155 | $ | 4,583 | $ | 9,333 | ||||||
| Adjustments to reconcile net income to net cash provided by operating activities: |
||||||||||||
| Depreciation |
4,685 | 4,450 | 4,678 | |||||||||
| Gain on extinguishment of debt |
— | — | (6,705 | ) | ||||||||
| Loss (gain) on disposal of property and equipment |
322 | 695 | (4 | ) | ||||||||
| Reversal of provision for bad debts |
(62 | ) | (45 | ) | (25 | ) | ||||||
| Amortization of deferred financing costs |
226 | 333 | 598 | |||||||||
| Changes in operating assets and liabilities: |
||||||||||||
| Accounts receivable |
691 | (164 | ) | 86 | ||||||||
| Inventory |
2 | — | 3 | |||||||||
| Prepaid expenses and other |
(9 | ) | (83 | ) | 91 | |||||||
| Other assets |
— | — | (1 | ) | ||||||||
| Accounts payable and accrued expenses |
(865 | ) | 1,416 | 344 | ||||||||
|
|
|
|||||||||||
| Net cash provided by operating activities |
12,145 | 11,185 | 8,398 | |||||||||
|
|
|
|||||||||||
| CASH FLOWS FROM INVESTING ACTIVITIES: |
||||||||||||
| Capital expenditures |
(2,477 | ) | (5,092 | ) | (1,408 | ) | ||||||
| Change in restricted cash |
(2 | ) | 2 | 54 | ||||||||
|
|
|
|||||||||||
| Net cash used in investing activities |
(2,479 | ) | (5,090 | ) | (1,354 | ) | ||||||
|
|
|
|||||||||||
| CASH FLOWS FROM FINANCING ACTIVITIES: |
||||||||||||
| Payments for deferred financing costs |
(434 | ) | — | (931 | ) | |||||||
| Distributions to Parent |
(9,217 | ) | (6,093 | ) | (16,927 | ) | ||||||
| Contributions from Parent |
— | — | 10,816 | |||||||||
|
|
|
|||||||||||
| Net cash used in financing activities |
(9,651 | ) | (6,093 | ) | (7,042 | ) | ||||||
|
|
|
|||||||||||
| INCREASE IN CASH AND CASH EQUIVALENTS |
15 | 2 | 2 | |||||||||
| CASH AND CASH EQUIVALENTS: |
||||||||||||
| Beginning of year |
27 | 25 | 23 | |||||||||
|
|
|
|||||||||||
| End of year |
$ | 42 | $ | 27 | $ | 25 | ||||||
|
|
|
|||||||||||
| SUPPLEMENTAL DISCLOSURES OF CASH FLOW INFORMATION—Cash paid for interest during the year |
$ | 1,410 | $ | 1,223 | $ | 1,494 | ||||||
|
|
|
|||||||||||
| SUPPLEMENTAL DISCLOSURE OF NONCASH—FINANCING INFORMATION—Noncash contribution from Parent resulting from Parent’s paydown of the Company’s mortgage loan and mezzanine loan |
$ | 6,352 | $ | 2,916 | $ | 20,316 | ||||||
|
|
||||||||||||
See notes to combined financial statements
F-79
Table of Contents
Notes to combined financial statements
As of December 31, 2013 and 2012, and for the years ended
December 31, 2013, 2012, and 2011
1. Organization and nature of operations
The accompanying financial statements are the combined financial statements of WIH La Quinta Inn Hotels (the “Company”). WIH La Quinta Inn Hotels is comprised of 14 hotel properties that are owned, directly or indirectly, by WIH Hotels, L.L.C. WIH Hotels, L.L.C. (or “Parent”) was formed on September 21, 2004, under the laws of the State of Delaware and is owned, managed, and advised by Blackstone Real Estate Partners IV, L.P., Blackstone Real Estate Partners IV TE.2 L.P., Blackstone Real Estate Partners IV F L.P., Blackstone Real Estate Partners IV TE.1 (DC) L.P., Blackstone Real Estate Partners IV TE.2 (DC) L.P., Blackstone Real Estate Partners IV TE.3-A (DC) L.P. and Blackstone Real Estate Holdings IV L.P., (collectively, the “Fund”) and their affiliates. The accompanying combined financial statements include the accounts of the following hotels:
La Quinta Inn—Fairfield
La Quinta Inn—Armonk
La Quinta Inn—Coral Springs
La Quinta Inn—Deerfield
La Quinta Inn—Sunrise
La Quinta Inn—Miami Lakes
La Quinta Inn—Naples
La Quinta Inn—Plantation
La Quinta Inn—Sarasota
La Quinta Inn—Wayne
La Quinta Inn—West Palm Beach
La Quinta Inn—Ft. Lauderdale
La Quinta Inn—Clifton
La Quinta Inn—Elmsford
Financial Condition—The Company’s Parent and its subsidiaries are in discussions with its lenders to extend the maturity date of the mortgage loan and mezzanine loan if the indebtedness is not otherwise fully retired prior to maturity. The total outstanding debt of the Parent and its subsidiaries was $118.9 million as of December 31, 2013. Although the credit environment has not yet returned to levels experienced prior to the credit crisis, management of the Company believes that the credit markets continue to improve and given the estimated value and operating performance of the assets that collateralize the mortgage loan and mezzanine loan, management of the Company believes that an extension would be secured. However, this event will likely result in the payment of loan related fees and potentially an overall increase to the interest rate, a principal payment in connection with the execution of the extension, and/or additional principal payments during the term of the extension. In the event the potential sale of the 14 hotel properties to La Quinta Holdings Inc. is not consummated and in the event the mortgage loan and mezzanine loan cannot be extended with the current lender, management believes the assets securing the mortgage loan and mezzanine loan have value in excess of the outstanding mortgage loan and mezzanine loan and can be underwritten based on commercially accepted underwriting requirements with respect to expected debt yields, debt service coverage
F-80
Table of Contents
ratios, and loan to value expectations. In addition to pursuing the loan extension with the current lender, the Parent and its subsidiaries are continuing to explore additional options available with respect to refinancing the mortgage loan and mezzanine loan. While substantial doubt regarding the Company’s ability to continue as a going concern does not exist, there is the potential risk that the mortgage loan and mezzanine loan may not be extended or otherwise refinanced prior to the maturity date on terms acceptable to the Parent and its subsidiaries. Accordingly, there can be no assurances that the Parent and its subsidiaries will be able to successfully negotiate an extension of the maturity date of the mortgage loan or otherwise refinance the mortgage loan and mezzanine loan on terms acceptable to the Parent and its subsidiaries as it becomes due. If the Parent and its subsidiaries are unable to extend or refinance the mortgage loan and mezzanine loan, the lender could pursue foreclosure or other remedies legally available to them under the mortgage and mezzanine arrangements, which could significantly affect the Company’s future operations, liquidity, and cash flows.
2. Summary of significant accounting policies
Basis of presentation—The accompanying combined financial statements have been prepared in conformity with accounting principles generally accepted in the United States of America (GAAP). All intercompany transactions and balances have been eliminated.
The preparation of financial statements in conformity with GAAP requires management to make estimates and assumptions that affect the reported amounts of assets and liabilities and disclosure of contingent assets and liabilities at the date of the combined financial statements and the reported amounts of revenues and expenses during the reporting period. Actual results could differ from those estimates.
Cash and cash equivalents—Cash and cash equivalents primarily consist of cash in banks and highly liquid investments with original maturities of three months or less when purchased.
Restricted cash—Restricted cash represents cash collected and held in restricted depository accounts or in escrow accounts for the payment of property taxes and debt service under the mortgage arrangements.
Accounts receivable—net—Accounts receivable are primarily due from major credit card companies and other large corporations. A provision for possible bad debts is made when collection of receivables is considered doubtful. The allowance is estimated based on specific review of customer accounts, as well as historical collection experience and current economic and business conditions. The allowance for doubtful accounts was approximately $58,400 and $62,000, as of December 31, 2013 and 2012, respectively.
Inventory—Inventory consists of unused operating supplies, which are stated at the lower of cost or market value. Cost is determined using the first-in, first-out method. Provisions are made, as necessary, to reduce excess or obsolete inventories to their net realizable values.
Prepaid expenses—Prepaid expenses primarily consist of prepaid insurance, prepaid maintenance contracts, and prepaid advertising. Advertising costs are expensed when the advertisement is run.
Distributions to and contributions from Parent—Distributions to Parent or BRE/Prime Holdings LLC, a holding company also owned by WIH Hotels L.L.C., represent the cash generated by the Company that is transferred to the Parent through sweep arrangements under the provisions of the mortgage loan and mezzanine loan agreements discussed in Note 5. The Parent
F-81
Table of Contents
controls the sweep accounts and uses the cash in these accounts to pay down the mortgage loan and mezzanine loan. Contributions from Parent represent subsequent funding by Parent to pay the obligations, including operating expenses, of the Company. Additionally, any net cash position advanced to Parent is forgiven each year and therefore is accounted for as an equity distribution.
Property and equipment—net—Property and equipment were valued at acquisition based on their estimated fair values at the date of acquisition of the related properties. Subsequent additions are recorded at cost. Expenditures for maintenance, repairs, and renewals of items that do not extend the service life or increase the capacity of assets are charged to expense as incurred. Expenditures that increase the life or utility of property and equipment are capitalized. The Company recorded a loss on disposal of $322,000 in 2013, $695,000 in 2012, and a gain on disposal of $4,000 in 2011. Depreciation has been computed using the straight-line method using useful lives as follows:
| Years | ||||
|
|
||||
| Building and improvements |
15–40 | |||
| Land improvements |
15–20 | |||
| Furniture, fixtures, and equipment |
3–10 | |||
|
|
||||
Long-lived assets and assets to be disposed of—Long-lived assets are reviewed for impairment whenever events or changes in circumstances indicate that the carrying amount of an asset may not be recoverable. Recoverability of assets to be held and used is determined by a comparison of the carrying amount of an asset to future net undiscounted cash flows expected to be generated by the asset. If the carrying value of the assets exceeds such cash flows, the assets are considered impaired. The impairment charge to be recognized is measured by the amount by which the carrying amount of the assets exceeds their estimated fair value. Assets to be disposed of are reported at the lower of their carrying amount or estimated fair value less costs to sell. Fair value is determined using management’s best estimate of the discounted net cash flows over the remaining life of the asset. No impairments of long-lived assets were recorded in 2013, 2012, and 2011.
Subsequent events—The Company has evaluated subsequent events through February 26, 2014, the date the financial statements were available to be issued.
Fair value of financial instruments—Cash and cash equivalents, restricted cash, accounts receivable, accounts payable and accrued expenses are carried at cost, which approximates fair value based on their short-term or highly liquid nature. The outstanding balance of the mortgage loan and mezzanine loan bears a variable interest rate and, accordingly, the carrying amounts approximate their fair value.
Revenue recognition—Revenue associated with room rentals, retail and other sales at the hotels is recognized when services are rendered and goods are provided. Room revenue is generated by the rental of rooms and retail and other revenues from the sale of goods and other services provided by the hotels. Advance deposits arise as a normal part of business due to advance payments from hotel guests for accommodations. Such amounts are deferred until the related services are provided.
F-82
Table of Contents
Income taxes—The WIH La Quinta Inn Hotels are limited partnerships for federal income tax purposes. As such, the income tax effects of the results of operations of the WIH La Quinta Inn Hotels accrue directly to the member. Accordingly, the accompanying combined financial statements do not include a provision for income taxes.
Fair value measurements—In accordance with the authoritative guidance on fair value measurements and disclosures, the Company measures nonfinancial assets and liabilities subject to non-recurring measurement and financial assets and liabilities subject to recurring measurement based on a hierarchy that prioritizes inputs to valuation techniques used to measure the fair value. Inputs used in determining fair value should be from the highest level available in the following hierarchy:
Level 1—Inputs based on quoted market prices in active markets for identical assets or liabilities that the reporting entity has the ability to access.
Level 2—Inputs based on quoted prices for similar assets or liabilities, quoted market prices in markets that are not active, or other inputs that are observable or can be corroborated by observable data for substantially the full term of the assets or liabilities.
Level 3—Inputs are unobservable for the asset or liability and typically based on an entity’s own assumptions as there is little, if any, related market activity.
The Company generally determines or calculates the fair value of financial instruments using quoted market prices in active markets when such information is available or using appropriate present value or other valuation techniques, such as discounted cash flow analysis, incorporating available market discount rate information for similar types of instruments and the Company’s estimates for non-performance and liquidity risk. These techniques are significantly affected by the assumptions used, including the discount rate, credit spreads, and estimates of future cash flows.
At December 31, 2013 and 2012, the WIH La Quinta Inn Hotels had assets that under certain conditions would be subject to measurement at fair value on a non-recurring basis, such as long-lived assets subject to fair value measurement when an impairment loss is recorded. Recognition of these assets at their fair value would be determined utilizing Level 3 inputs.
For the years ended December 31, 2013, 2012, and 2011, the Company did not have assets for which it recorded impairment. As a result, the Company did not have assets measured at fair value on a nonrecurring basis during the years December 31, 2013, 2012, and 2011.
3. Property and equipment—net
A summary of property and equipment as of December 31, 2013 and 2012, is as follows (in thousands):
| 2013 | 2012 | |||||||
|
|
||||||||
| Land and land improvements |
$ | 17,936 | $ | 17,936 | ||||
| Buildings and improvements |
85,432 | 84,258 | ||||||
| Furniture, fixtures, and equipment |
16,630 | 16,229 | ||||||
| Construction in progress |
226 | 679 | ||||||
|
|
|
|||||||
| Total property and equipment |
120,224 | 119,102 | ||||||
| Less: accumulated depreciation |
(34,029 | ) | (30,377 | ) | ||||
|
|
|
|||||||
| Property and equipment—net |
$ | 86,195 | $ | 88,725 | ||||
|
|
||||||||
F-83
Table of Contents
Depreciation expense for the years ended December 31, 2013, 2012, and 2011, was approximately $4.7 million, $4.5 million, and $4.7 million, respectively.
4. Accounts payable and accrued expenses
Accounts payable and accrued expenses as of December 31, 2013 and 2012, consist of the following (in thousands):
| 2013 | 2012 | |||||||
|
|
||||||||
| Accounts payable |
$ | 1,185 | $ | 1,279 | ||||
| Accrued payroll and related |
618 | 995 | ||||||
| Other accrued liabilities |
657 | 901 | ||||||
| Accrued sales, use and occupancy tax |
413 | 563 | ||||||
|
|
|
|||||||
| Total |
$ | 2,873 | $ | 3,738 | ||||
|
|
||||||||
5. Mortgage loan and mezzanine loan
The WIH La Quinta Inn Hotels were acquired in a series of transactions. Mortgage and mezzanine loans were originated in connection with a financing involving the WIH La Quinta Inn Hotels and certain other properties. The total outstanding debt of the Parent and its subsidiaries with respect to such loans at December 31, 2013 and 2012, was $118.9 million and $131.5 million, respectively. At December 31, 2013 and 2012, $108.4 million and $120.1 million, respectively, represented the mortgage loan and $10.5 million and $11.4 million, respectively, represented the mezzanine loan. The 14 hotel properties have individual release price allocations. The portion of the loans associated with the assets being presented, and the related interest expense, represent the equivalent proportion with respect to the Parent and its subsidiaries’ outstanding mortgage loan, mezzanine loan and interest expense amounts allocated based on each property’s release amount. On May 10, 2011, the Parent and its subsidiaries under the mortgage and mezzanine loans entered into loan modification agreements with their lenders, which provided for the release of La Quinta Inn—Armonk from the mortgage loan. The loan modification further required that the La Quinta Inn—Armonk, La Quinta Inn—Clifton and La Quinta Inn—Elmsford secure the mezzanine loan only. In connection with this loan modification, a portion of the mezzanine loan was paid off at a discount resulting in a gain on extinguishment of debt. The portion of the gain attributed to the Company was $6.7 million. The amendment also extended the term of the loans for two successive one-year terms through May 10, 2013, and required the Parent to make quarterly principal payments of approximately $1.7 million through the final maturity date to be applied to the mortgage loan until fully repaid. The Company’s payments of this balance are reflected as distributions to Parent.
On May 9, 2013, the Parent and its subsidiaries under the mortgage loan and mezzanine loan entered into loan extension agreements, which extended the maturity date of the loans through June 11, 2013. On June 7, 2013, the Parent and its subsidiaries under the mortgage loan entered into the Third Modification of Loan Agreement and Omnibus Amendment and the Parent and its subsidiaries under the mezzanine loan entered into the Third Modification of Mezzanine Loan Agreement and Omnibus Amendment which, among other things, provide an extension of the maturity date of the mortgage and mezzanine loans through the payment date on July 7, 2014.
Prior to June 7, 2013, the mortgage and mezzanine loans paid interest at the one-month London InterBank Offered Rate (LIBOR) plus a spread on a blended basis of 1.67%, from June 7, 2013 and thereafter, the spread on a blended basis increased to 3.148%.
F-84
Table of Contents
Cash flows from the mortgaged properties, in excess of amounts due on the mortgage and mezzanine loans, amounts required to be deposited into reserve accounts and amounts released to the Company for operating expenses for the mortgaged properties, are placed in restricted cash accounts which can be used as additional collateral to pay down the loans or certain other permitted uses.
Pursuant to the terms of the mortgage and mezzanine loans, the borrowers were also required to enter into an interest rate cap agreement with respect to each loan. An interest rate cap provides that a counterparty is obligated to pay any interest attributable to LIBOR over a set rate on a specified notional principal amount for a specific term. The value of the interest rate cap was not material at December 31, 2013 and 2012.
6. Commitments and contingencies
Insurance—The Company participates in a comprehensive insurance program on its properties, including liability, business interruption, fire, and extended coverage including windstorm and flood, in the types and amounts management believes are customary for the resort and hotel industry. Certain insurance risks for medical and workers’ compensation are self-insured by property management companies of the WIH La Quinta Inn Hotels (see Note 8) subject to certain stop-loss thresholds and therefore those property management companies direct bill medical, dental, and workers’ compensation costs to the hotel properties.
Litigation—The Company is not a party to any significant litigation or claims, other than routine matters arising out of the ordinary course of business. The Company believes that the results of all claims and litigation, individually or in the aggregate, will not have a material adverse effect on the Company’s combined financial statements.
Leases—The Company leases land under agreements, expiring through 2030, that provide for monthly payments of rent and are accounted for as operating leases for financial reporting purposes. Future minimum lease obligations under various noncancelable operating leases with initial terms in excess of one year at December 31, 2013, are set forth as follows (in thousands):
| Years ending December 31 | ||||
|
|
||||
| 2014 |
$ | 936 | ||
| 2015 |
936 | |||
| 2016 |
936 | |||
| 2017 |
936 | |||
| 2018 |
936 | |||
| Thereafter |
7,500 | |||
|
|
|
|||
| Total |
$ | 12,180 | ||
|
|
||||
Rent expense for the years ended December 31, 2013, 2012, and 2011, was approximately $1.7 million, $1.4 million, and $1.6 million, respectively.
7. Franchise agreement
The Company has franchise agreements, which became effective on April 11, 2006, and expire on April 11, 2026, with La Quinta Franchising, LLC (“La Quinta Franchising”). La Quinta Franchising is an affiliate of the Fund. Under the franchise agreements, the Company is required to pay a sales and marketing fee equal to 2.5% of the corresponding properties’ annual revenue and a royalty fee equal to 0.33% of the respective properties’ annual revenue upon opening under the La
F-85
Table of Contents
Quinta brand. Total sales and marketing and royalty fees were approximately $1.1 million, $1.1 million, and $0.9 million for 2013, 2012, and 2011, respectively, and were included in management, marketing and related party fees in the accompanying combined statements of operations.
8. Management of properties
On April 1, 2006, the Company engaged LQ Management LLC (LQ), a management company who primarily manages La Quinta franchised hotels, to provide hospitality management services to all of its limited-service hotels. LQ is an affiliate of the Fund. The hospitality management fee payable to LQ is based on 1.67% of the corresponding properties’ annual revenue. The hospitality management agreements expire on April 1, 2026, but may be terminated by either party at any time for any reason upon 30 days written notice.
Hospitality management fees under the agreements totaled approximately $0.6 million, $0.6 million, and $0.6 million for the years ended December 31, 2013, 2012, and 2011, respectively, and are reflected as a component of management, marketing and related party fees in the accompanying combined statements of operations.
******
F-86
Table of Contents
COMBINED BALANCE SHEETS
AS OF MARCH 31, 2014 AND DECEMBER 31, 2013
| (In thousands) | 2014 | 2013 | ||||||
| (unaudited) | ||||||||
|
|
||||||||
| ASSETS |
||||||||
| CURRENT ASSETS: |
||||||||
| Cash and cash equivalents |
$ | 55 | $ | 42 | ||||
| Restricted cash |
19 | 2 | ||||||
| Accounts receivable—net |
1,345 | 936 | ||||||
| Inventory |
333 | 243 | ||||||
| Prepaid expenses and other |
271 | 490 | ||||||
|
|
|
|||||||
| Total current assets |
2,023 | 1,713 | ||||||
| PROPERTY AND EQUIPMENT—Net |
85,746 | 86,195 | ||||||
| OTHER ASSETS |
101 | 101 | ||||||
|
|
|
|||||||
| TOTAL |
$ | 87,870 | $ | 88,009 | ||||
|
|
|
|||||||
| LIABILITIES AND MEMBER’S EQUITY |
||||||||
| CURRENT LIABILITIES: |
||||||||
| Accounts payable and accrued expenses |
$ | 3,252 | $ | 2,873 | ||||
| Mortgage loan and mezzanine loan |
59,353 | 61,103 | ||||||
|
|
|
|||||||
| Total liabilities |
62,605 | 63,976 | ||||||
| COMMITMENTS AND CONTINGENCIES (Note 6) |
||||||||
| MEMBER’S EQUITY |
25,265 | 24,033 | ||||||
|
|
|
|||||||
| TOTAL |
$ | 87,870 | $ | 88,009 | ||||
|
|
||||||||
See notes to unaudited combined financial statements.
F-87
Table of Contents
UNAUDITED COMBINED STATEMENTS OF OPERATIONS
FOR THE THREE MONTHS ENDED MARCH 31, 2014 AND 2013
| (In thousands) | 2014 | 2013 | ||||||
|
|
||||||||
| REVENUE: |
||||||||
| Room |
$ | 11,278 | $ | 10,513 | ||||
| Retail and other |
135 | 111 | ||||||
|
|
|
|||||||
| Total revenue |
11,413 | 10,624 | ||||||
|
|
|
|||||||
| OPERATING EXPENSES: |
||||||||
| Room |
2,307 | 2,146 | ||||||
| Retail and other |
71 | 69 | ||||||
| Management, marketing and related party fees |
542 | 532 | ||||||
| Selling, general, and administrative |
3,692 | 3,678 | ||||||
| Depreciation |
1,146 | 1,146 | ||||||
|
|
|
|||||||
| Total operating expenses |
7,758 | 7,571 | ||||||
|
|
|
|||||||
| LOSS ON DISPOSAL OF PROPERTY AND EQUIPMENT |
— | (6 | ) | |||||
|
|
|
|||||||
| OPERATING INCOME |
3,655 | 3,047 | ||||||
| INTEREST EXPENSE |
(396 | ) | (291 | ) | ||||
|
|
|
|||||||
| NET INCOME |
$ | 3,259 | $ | 2,756 | ||||
|
|
||||||||
See notes to unaudited combined financial statements.
F-88
Table of Contents
UNAUDITED COMBINED STATEMENTS OF CHANGES IN MEMBER’S EQUITY
FOR THE THREE MONTHS ENDED MARCH 31, 2014 AND 2013
| (In thousands) | ||||
|
|
||||
| BALANCE—January 1, 2013 |
$ | 19,743 | ||
| Distributions |
(3,035 | ) | ||
| Net income |
2,756 | |||
|
|
|
|||
| BALANCE—March 31, 2013 |
$ | 19,464 | ||
|
|
|
|||
| BALANCE—January 1, 2014 |
$ | 24,033 | ||
| Contributions |
1,751 | |||
| Distributions |
(3,778 | ) | ||
| Net income |
3,259 | |||
|
|
|
|||
| BALANCE—March 31, 2014 |
$ | 25,265 | ||
|
|
||||
See notes to unaudited combined financial statements.
F-89
Table of Contents
UNAUDITED COMBINED STATEMENTS OF CASH FLOWS
FOR THE THREE MONTHS ENDED MARCH 31, 2014 AND 2013
| (In thousands) | 2014 | 2013 | ||||||
|
|
||||||||
| CASH FLOWS FROM OPERATING ACTIVITIES: |
||||||||
| Net income |
$ | 3,259 | $ | 2,756 | ||||
| Adjustments to reconcile net income to net cash provided by operating activities: |
||||||||
| Depreciation |
1,146 | 1,146 | ||||||
| Loss on disposal of property and equipment |
— | 6 | ||||||
| Provision for bad debts |
(3 | ) | (4 | ) | ||||
| Amortization of deferred financing costs |
68 | — | ||||||
| Changes in operating assets and liabilities: |
||||||||
| Accounts receivable |
(407 | ) | 11 | |||||
| Inventory |
(90 | ) | 1 | |||||
| Prepaid expenses and other |
152 | 106 | ||||||
| Accounts payable and accrued expenses |
380 | (149 | ) | |||||
|
|
|
|||||||
| Net cash provided by operating activities |
4,505 | 3,873 | ||||||
|
|
|
|||||||
| CASH FLOWS FROM INVESTING ACTIVITIES: |
||||||||
| Capital expenditures |
(697 | ) | (813 | ) | ||||
| Change in restricted cash |
(17 | ) | (22 | ) | ||||
|
|
|
|||||||
| Net cash used in investing activities |
(714 | ) | (835 | ) | ||||
|
|
|
|||||||
| CASH FLOWS FROM FINANCING ACTIVITIES: |
||||||||
| Distributions to Parent |
(3,778 | ) | (3,035 | ) | ||||
|
|
|
|||||||
| Net cash used in financing activities |
(3,778 | ) | (3,035 | ) | ||||
|
|
|
|||||||
| INCREASE IN CASH AND CASH EQUIVALENTS |
13 | 3 | ||||||
| CASH AND CASH EQUIVALENTS: |
||||||||
| Beginning of period |
42 | 27 | ||||||
|
|
|
|||||||
| End of period |
$ | 55 | $ | 30 | ||||
|
|
|
|||||||
| SUPPLEMENTAL DISCLOSURE OF CASH FLOW INFORMATION—Cash paid for interest during the period |
$ | 396 | $ | 291 | ||||
|
|
|
|||||||
| SUPPLEMENTAL DISCLOSURE OF NONCASH—Financing information: |
||||||||
| Noncash contribution from Parent resulting from Parent’s paydown of the Company’s mortgage loan and mezzanine loan |
$ | 1,751 | $ | — | ||||
|
|
||||||||
See notes to unaudited combined financial statements.
F-90
Table of Contents
NOTES TO UNAUDITED COMBINED FINANCIAL STATEMENTS
AS OF MARCH 31, 2014 AND DECEMBER 31, 2013, AND
FOR THE THREE MONTHS ENDED MARCH 31, 2014 AND 2013
1. ORGANIZATION AND NATURE OF OPERATIONS
The accompanying financial statements represent the combined financial statements of WIH La Quinta Inn Hotels (the “Company”). WIH La Quinta Inn Hotels is comprised of 14 hotel properties that are owned, directly or indirectly, by WIH Hotels, L.L.C. WIH Hotels, L.L.C. (or “Parent”) was formed on September 21, 2004, under the laws of the State of Delaware and is owned, managed, and advised by Blackstone Real Estate Partners IV, L.P., Blackstone Real Estate Partners IV TE.2 L.P., Blackstone Real Estate Partners IV F L.P., Blackstone Real Estate Partners IV TE.1 (DC) L.P., Blackstone Real Estate Partners IV TE.2 (DC) L.P., Blackstone Real Estate Partners IV TE.3-A (DC) L.P. and Blackstone Real Estate Holdings IV L.P., (collectively, the “Fund”) and their affiliates. The accompanying combined financial statements include the accounts of the following hotels:
La Quinta Inn—Fairfield
La Quinta Inn—Armonk
La Quinta Inn—Coral Springs
La Quinta Inn—Deerfield
La Quinta Inn—Sunrise
La Quinta Inn—Miami Lakes
La Quinta Inn—Naples
La Quinta Inn—Plantation
La Quinta Inn—Sarasota
La Quinta Inn—Wayne
La Quinta Inn—West Palm Beach
La Quinta Inn—Ft. Lauderdale
La Quinta Inn—Clifton
La Quinta Inn—Elmsford
2. SUMMARY OF SIGNIFICANT ACCOUNTING POLICIES
Basis of Presentation—The accompanying unaudited combined financial statements have been prepared in accordance with accounting principles generally accepted in the United States of America (“GAAP”) for interim financial information. Accordingly, they do not include all information or footnotes required by GAAP for complete annual financial statements. Although we believe the disclosures made are adequate to prevent the information presented from being misleading, these financial statements should be read in conjunction with the combined WIH La Quinta Inn Hotels financial statements and notes thereto for the years ended December 31, 2013, 2012, and 2011 which are included in the prospectus, dated April 8, 2014 filed by La Quinta Holdings Inc. with the Securities & Exchange Commission on April 9, 2014.
All intercompany transactions have been eliminated. In our opinion, the accompanying combined financial statements reflect all adjustments, including normal recurring items, considered necessary for a fair presentation of the interim periods.
F-91
Table of Contents
The preparation of financial statements in conformity with GAAP requires management to make estimates and assumptions that affect the amounts reported and, accordingly, ultimate results could differ from those estimates. Interim results are not necessarily indicative of full year performance because of the impact of seasonal and short-term variations.
Cash and Cash Equivalents—Cash and cash equivalents primarily consist of cash in banks and highly liquid investments with original maturities of three months or less when purchased.
Restricted Cash—Restricted cash represents cash collected and held in restricted depository accounts or in escrow for the payment of property taxes and debt service under the mortgage arrangements.
Accounts Receivable—Net—Accounts receivable are primarily due from major credit card companies and other large corporations. A provision for possible bad debts is made when collection of receivables is considered doubtful. The allowance is estimated based on specific review of customer accounts, as well as historical collection experience and current economic and business conditions. The allowance for doubtful accounts was approximately $44,000 and $58,000, as of March 31, 2014 and December 31, 2013, respectively.
Inventory—Inventory consists of unused operating supplies, which are stated at the lower of cost or market value. Cost is determined using the first-in, first-out method. Provisions are made, as necessary, to reduce excess or obsolete inventories to their net realizable values.
Prepaid Expenses—Prepaid expenses primarily consist of prepaid insurance, prepaid maintenance contracts, and prepaid advertising. Advertising costs are expensed when the advertisement is run.
Distributions to and Contributions from Parent—Distributions to Parent or BRE/Prime Holdings LLC, a holding company also owned by WIH Hotels L.L.C., represent the cash generated by the Company that is transferred to the Parent through sweep arrangements under the provisions of the mortgage loan and mezzanine loan agreements discussed in Note 5. The Parent controls the sweep accounts and uses the cash in these accounts to pay down the mortgage loan and mezzanine loan. Contributions from Parent represent subsequent funding by Parent to pay the obligations, including operating expenses, of the Company. Additionally, any net cash position advanced to Parent is forgiven each year and therefore is accounted for as an equity distribution.
Property and Equipment—Net—Property and equipment were valued at acquisition based on their estimated fair values at the date of acquisition. Subsequent additions are recorded at cost. Expenditures for maintenance, repairs, and renewals of items that do not extend the service life or increase the capacity of assets are charged to expense as incurred. Expenditures that increase the life or utility of property and equipment are capitalized. The Company recorded a loss on disposals of $6,000 during the three months ended March 31, 2013. Depreciation has been computed using the straight-line method using useful lives as follows:
| Years | ||||
|
|
||||
| Building and improvements |
15–40 | |||
| Land improvements |
15–20 | |||
| Furniture, fixtures, and equipment |
3–10 | |||
|
|
||||
Long-Lived Assets and Assets to be Disposed of—Long-lived assets are reviewed for impairment whenever events or changes in circumstances indicate that the carrying amount of an asset may
F-92
Table of Contents
not be recoverable. Recoverability of assets to be held and used is determined by a comparison of the carrying amount of an asset to future net undiscounted cash flows expected to be generated by the asset. If the carrying value of the assets exceeds such cash flows, the assets are considered impaired. The impairment charge to be recognized is measured as the amount by which the carrying amount of the assets exceeds their estimated fair value. Assets to be disposed of are reported at the lower of their carrying amount or estimated fair value less costs to sell. Fair value is determined using management’s best estimate of the discounted net cash flows over the remaining life of the asset. No impairments of long-lived assets were recorded during the three months ended March 31, 2014 and 2013.
Subsequent Events—The Company has evaluated subsequent events through May 20, 2014, the date the financial statements were available to be issued, see Note 9.
Fair Value of Financial Instruments—Cash and cash equivalents, restricted cash, accounts receivables, accounts payable and accrued expenses are carried at cost, which approximates fair value based on their short-term or highly liquid nature. The outstanding balance of mortgage loan and mezzanine loan bears a variable interest rate and, accordingly, the carrying amounts approximate their fair value.
Revenue Recognition—Revenue associated with room rentals, retail and other sales at the hotels is recognized when services are rendered and goods are provided. Room revenue is generated by the rental of rooms and retail and other revenues from the sale of goods and other services provided by the hotels. Advance deposits arise as a normal part of business due to advance payments from hotel guests for accommodations. Such amounts are deferred until the related services are provided.
Income Taxes—The WIH La Quinta Inn Hotels are limited partnerships for federal income tax purposes. As such, the income tax effects of the results of operations of the WIH La Quinta Inn Hotels accrue directly to the member. Accordingly, the accompanying combined financial statements do not include a provision for income taxes.
Fair Value Measurements—In accordance with the authoritative guidance on fair value measurements and disclosures, the Company measures nonfinancial assets and liabilities subject to non-recurring measurement and financial assets and liabilities subject to recurring measurement based on a hierarchy that prioritizes inputs to valuation techniques used to measure the fair value. Inputs used in determining fair value should be from the highest level available in the following hierarchy:
Level 1—Inputs based on quoted market prices in active markets for identical assets or liabilities that the reporting entity has the ability to access.
Level 2—Inputs based on quoted prices for similar assets or liabilities, quoted market prices in markets that are not active, or other inputs that are observable or can be corroborated by observable data for substantially the full term of the assets or liabilities.
Level 3—Inputs are unobservable for the asset or liability and typically based on an entity’s own assumptions as there is little, if any, related market activity.
The Company generally determines or calculates the fair value of financial instruments using quoted market prices in active markets when such information is available or using appropriate present value or other valuation techniques, such as discounted cash flow analysis, incorporating
F-93
Table of Contents
available market discount rate information for similar types of instruments and the Company’s estimates for non-performance and liquidity risk. These techniques are significantly affected by the assumptions used, including the discount rate, credit spreads, and estimates of future cash flows.
At March 31, 2014 and December 31, 2013, the WIH La Quinta Inn Hotels had assets that under certain conditions would be subject to measurement at fair value on a non-recurring basis, such as long-lived assets subject to fair value measurement when an impairment loss is recorded. Recognition of these assets at their fair value would be determined utilizing Level 3 inputs.
For the three months ended March 31, 2014 and 2013, the Company did not have assets for which it recorded impairment. As a result, the Company did not have assets measured at fair value on a nonrecurring basis during the three months ended March 31, 2014 and 2013.
3. PROPERTY AND EQUIPMENT—NET
A summary of property and equipment as of March 31, 2014 and December 31, 2013, is as follows (in thousands):
| 2014 | 2013 | |||||||
|
|
||||||||
| Land and land improvements |
$ | 17,936 | $ | 17,936 | ||||
| Buildings and improvements |
86,868 | 85,432 | ||||||
| Furniture, fixtures, and equipment |
17,150 | 16,630 | ||||||
| Construction in progress |
— | 226 | ||||||
|
|
|
|||||||
| Total property and equipment |
121,954 | 120,224 | ||||||
| Less accumulated depreciation |
(36,208 | ) | (34,029 | ) | ||||
|
|
|
|||||||
| Property and equipment—net |
$ | 85,746 | $ | 86,195 | ||||
|
|
||||||||
Depreciation expense for the three months ended March 31, 2014 and 2013 was approximately $1.1 million each period.
4. ACCOUNTS PAYABLE AND ACCRUED EXPENSES
Accounts payable and accrued expenses as of March 31, 2014 and December 31, 2013, consist of the following (in thousands):
| 2014 | 2013 | |||||||
|
|
||||||||
| Accounts payable |
$ | 1,198 | $ | 1,185 | ||||
| Accrued payroll and related amounts |
665 | 618 | ||||||
| Accrued real estate taxes |
242 | — | ||||||
| Accrued sales, use and occupancy tax |
534 | 413 | ||||||
| Other accrued liabilities |
613 | 657 | ||||||
|
|
|
|||||||
| Total |
$ | 3,252 | $ | 2,873 | ||||
|
|
||||||||
5. MORTGAGE LOAN AND MEZZANINE LOAN
The WIH La Quinta Inn Hotels were acquired in a series of transactions. Mortgage and mezzanine loans were originated in connection with a financing involving the WIH La Quinta Inn Hotels and certain other properties. The total outstanding debt of the Parent and its subsidiaries with
F-94
Table of Contents
respect to such loans at March 31, 2014 and December 31, 2013, was $115.1 million and $118.9 million, respectively. At March 31, 2014 and December 31, 2013, $104.6 million and $108.4 million, respectively, represented the mortgage loan and $10.5 million and $10.5 million, respectively, represented the mezzanine loan. The 14 hotel properties have individual release price allocations. The portion of the loans associated with the assets being presented and the related interest expense, represent the equivalent proportion with respect to the Parent and its subsidiaries’ outstanding mortgage loan, mezzanine loan and interest expense amounts allocated based on each hotel properties’ release amount. On May 10, 2011, the Parent and its subsidiaries under the mortgage and mezzanine loans entered into loan modification agreements with their lenders, which provided for the release of La Quinta Inn—Armonk from the mortgage loan. The loan modification further required that the La Quinta Inn—Armonk, La Quinta Inn—Clifton and La Quinta Inn—Elmsford secure the mezzanine loan only. In connection with this loan modification, a portion of the mezzanine loan was paid off at a discount resulting in a gain on extinguishment of debt. The portion of the gain attributed to the Company was $6.7 million. The amendment also extended the term of the loans for two successive one-year terms through May 10, 2013 and required the Parent to make quarterly principal payments of approximately $1.7 million through the final maturity date to be applied to the mortgage loan until fully repaid. The Parent’s payments of this balance are reflected as contributions by the Parent.
On May 9, 2013, the Parent and its subsidiaries under the mortgage loan and mezzanine loan entered into loan extension agreements, which extended the maturity date of the loans through June 11, 2013. On June 7, 2013 the Parent and its subsidiaries under the mortgage loan entered into the Third Modification of Loan Agreement and Omnibus Amendment, and the Parent and its subsidiaries under the mezzanine loan entered into the Third Modification of Mezzanine Loan Agreement and Omnibus Amendment which, among other things, provide an extension of the maturity date of the mortgage and mezzanine loans through the payment date occurring in July 2014. An additional principal payment of $3.8 million was made in February 2014 by the Parent. Of this amount $1.7 million represents the principal payment attributable to the Company. This amount is recorded by the Company as a capital contribution by the Parent.
Prior to June 7, 2013, the mortgage and mezzanine loans paid interest at the one-month London InterBank Offered Rate (LIBOR) plus a spread on a blended basis of 1.677%, from June 7, 2013 and thereafter, the spread on a blended basis increased to 3.148%.
Cash flows from the mortgaged properties in excess of amounts due on the mortgage and mezzanine loans are required to be deposited into reserve accounts, and amounts released to the Company for operating expenses for the mortgaged properties are placed in restricted cash accounts which can be used as additional collateral to pay down the loans or certain other permitted uses.
Pursuant to the terms of the mortgage and mezzanine loans, the borrowers were also required to enter into an interest rate cap agreement with respect to each loan. An interest rate cap provides that a counterparty is obligated to pay any interest attributable to LIBOR over a set rate on a specified notional principal amount for a specific term. The value of the interest rate cap is not material at March 31, 2014 and December 31, 2013.
6. COMMITMENTS AND CONTINGENCIES
Insurance—The Company participates in a comprehensive insurance program on its properties, including liability, business interruption, fire, and extended coverage including windstorm and
F-95
Table of Contents
flood, in the types and amounts management believes are customary for the resort and hotel industry. Certain insurance risks for medical and workers’ compensation are self-insured by property management companies of the WIH La Quinta Inn Hotels (see Note 8) subject to certain stop-loss thresholds and therefore those property management companies direct bill medical, dental, and workers’ compensation costs to the hotel properties.
Litigation—The Company is not a party to any significant litigation or claims, other than routine matters arising out of the ordinary course of business. The Company believes that the results of all claims and litigation, individually or in the aggregate, will not have a material adverse effect on the Company’s combined financial statements.
Leases—The Company leases land under agreements, expiring through 2030, that provide for monthly payments of rent and are accounted for as operating leases for financial reporting purposes. Future minimum lease obligations under various noncancelable operating leases with initial terms in excess of one year at March 31, 2014, are set forth as follows (in thousands):
| Years Ending March 31 | ||||
|
|
||||
| 2015 |
$ | 936 | ||
| 2016 |
936 | |||
| 2017 |
936 | |||
| 2018 |
936 | |||
| 2019 |
936 | |||
| Thereafter |
6,566 | |||
|
|
|
|||
| Total |
$ | 11,246 | ||
|
|
||||
Rent expense for the three months ended March 31, 2014 and 2013, was approximately $0.4 million each period.
7. FRANCHISE AGREEMENT
The Company has franchise agreements, which became effective on April 11, 2006 and expire on April 11, 2026 with La Quinta Franchising, LLC (“La Quinta Franchising”). La Quinta Franchising is an affiliate of the Fund. Under the franchise agreements, the Company is required to pay a sales and marketing fee equal to 2.5% of the corresponding properties’ annual revenue and a royalty fee equal to 0.33% of the respective properties’ annual revenue upon opening under the La Quinta brand. Total sales and marketing and royalty fees were approximately $0.4 million for each of the three months ended March 31, 2014 and 2013, and were included in management, marketing and related party fees in the accompanying combined statements of operations.
8. MANAGEMENT OF PROPERTIES
On April 1, 2006, the Company engaged LQ Management LLC (“LQ”), a management company who primarily manages La Quinta franchised hotels, to provide hospitality management services to all of its limited-service hotels. LQ is an affiliate of the Fund. The hospitality management fee payable to LQ is based on 1.67% of the corresponding properties’ annual revenue. The hospitality management agreements expire on April 1, 2026, but may be terminated by either party at any time for any reason upon 30 days written notice.
Hospitality management fees under the agreements totaled approximately $0.2 million for each of the three months ended March 31, 2014 and 2013, and are reflected as a component of management, marketing and related party fees in the accompanying combined statements of operations.
F-96
Table of Contents
9. SUBSEQUENT EVENTS
On April 14, 2014, the 14 properties were sold to La Quinta Holdings Inc. for $161.7 million and the outstanding mortgage and mezzanine loans were paid in full.
******
F-97
Table of Contents
Report of independent registered public accounting firm
To the Board of Directors and Stockholders of
La Quinta Holdings Inc.
Irving, Texas
We have audited the accompanying balance sheet of La Quinta Holdings Inc. (the “Company”) as of December 31, 2013. This financial statement is the responsibility of the Company’s management. Our responsibility is to express an opinion on this financial statement based on our audit.
We conducted our audit in accordance with the standards of the Public Company Accounting Oversight Board (United States). Those standards require that we plan and perform the audit to obtain reasonable assurance about whether the balance sheet is free of material misstatement. The Company is not required to have, nor were we engaged to perform, an audit of its internal control over financial reporting. Our audit included consideration of internal control over financial reporting as a basis for designing audit procedures that are appropriate in the circumstances, but not for the purpose of expressing an opinion on the effectiveness of the Company’s internal control over financial reporting. Accordingly, we express no such opinion. An audit also includes examining, on a test basis, evidence supporting the amounts and disclosures in the financial statement, assessing the accounting principles used and significant estimates made by management, as well as evaluating the overall balance sheet presentation. We believe that our audit provides a reasonable basis for our opinion.
In our opinion, such balance sheet presents fairly, in all material respects, the financial position of La Quinta Holdings Inc. at December 31, 2013 in conformity with accounting principles generally accepted in the United States of America.
/s/ Deloitte & Touche LLP
Dallas, Texas
February 26, 2014
F-98
Table of Contents
Balance sheet
As of December 31, 2013
| Assets |
||||
| Current assets: |
||||
| Cash |
$ | 350 | ||
| Deferred costs |
650 | |||
|
|
|
|||
| Total current assets |
1,000 | |||
|
|
|
|||
| Total assets |
$ | 1,000 | ||
|
|
|
|||
| Liabilities and equity |
||||
| Commitments and Contingencies |
— | |||
| Equity: |
||||
| Common stock, $0.01 par value; 1,000 shares authorized, 100 shares issued and outstanding |
$ | 1 | ||
| Additional paid-in capital |
999 | |||
|
|
|
|||
| Total equity |
$ | 1,000 | ||
|
|
||||
The accompanying notes are an integral part of this balance sheet.
F-99
Table of Contents
Notes to balance sheet
As of December 31, 2013
Note 1. Organization
La Quinta Holdings Inc. (the “Company”) was incorporated in the state of Delaware on December 9, 2013, and was initially capitalized with the issuance of 100 shares of common stock with $0.01 par value. The Company has had minimal operations since its formation. The Company plans to file a registration statement on Form S-1 with the Securities and Exchange Commission for the purpose of registering and issuing common stock (“IPO”).
If the IPO is successful, the Company will initially own and operate 353 hotels and own certain trade names, trademarks and franchise agreements.
The accompanying balance sheet has been prepared in accordance with accounting principles generally accepted in the United State of America (“U.S. GAAP”).
Note 2. Summary of significant accounting policies
Use of estimates—The preparation of the accompanying balance sheet in conformity with U.S. GAAP requires management to make estimates and assumptions that affect the reported amounts of assets and liabilities and disclosures of contingent assets and liabilities at the date of the balance sheet. Actual results could differ from those estimates.
Subsequent events—In connection with the preparation of the accompanying balance sheet as of December 31, 2013, the Company has evaluated events and transactions occurring after December 31, 2013, for potential recognition or disclosure through February 26, 2014, the date that the accompanying balance sheet was issued.
Note 3. Commitments and contingencies
Legal contingencies—The Company is not a party to any litigation or claims, other than routine matters arising in the ordinary course of business, that are incidental to the operation of the business of the Company. The Company believes that the results of all claims and litigation, individually or in the aggregate, will not have a material adverse effect on its business or financial position.
Organizational costs and offering expenses—The Company’s organizational costs and offering expenses, other than selling commissions and underwriter fees, which are included in deferred costs and are expected to be offset against the proceeds of the IPO, are paid by the predecessor entities on the Company’s behalf. Organizational costs and offering expenses include all costs other than selling commissions and underwriter fees to be paid by the predecessor entities in connection with the IPO. As of December 31, 2013, certain organizational costs and offering expenses are not recorded in the accompanying balance sheet because such costs are not a liability of the Company until completion of the IPO. When recorded, the organizational expenses will be expensed as incurred, and direct offering expenses will be charged to equity.
F-100
Table of Contents
Note 4. Equity
On December 17, 2013, the Company issued 100 shares of common stock, $0.01 par value, each at $10.00 per share to a subsidiary of the Blackstone Group L.P. Consideration for the shares was $1,000 of cash.
On February 10, 2014, our parent contributed $200,000 to the Company to fund anticipated fees related to the IPO.
F-101
Table of Contents

Table of Contents
20,000,000 Shares
La Quinta Holdings Inc.
Common Stock
J.P. Morgan
Morgan Stanley
BofA Merrill Lynch
Citigroup
Credit Suisse
Deutsche Bank Securities
Goldman, Sachs & Co.
Wells Fargo Securities
EA Markets
Evercore ISI
JMP Securities
Lebenthal Capital Markets
Loop Capital Markets
Mischler Financial Group, Inc.
Ramirez & Co., Inc.
Raymond James
RBC Capital Markets
Stifel
Table of Contents
Part II
Information not required in prospectus
Item 13. Other expenses of issuance and distribution.
The following table sets forth the expenses payable by the Registrant expected to be incurred in connection with the issuance and distribution of the shares of common stock being registered hereby (other than underwriting discount and commissions). All amounts shown are estimates except the SEC registration fee and the Financial Industry Regulatory Authority filing fee.
| Filing Fee—Securities and Exchange Commission |
$ | 53,052 | ||
| Fee—Financial Industry Regulatory Authority |
68,983 | |||
| Fees and Expenses of Counsel |
550,000 | |||
| Printing Expenses |
200,000 | |||
| Fees and Expenses of Accountants |
400,000 | |||
| Miscellaneous Expenses |
27,965 | |||
|
|
|
|||
| Total |
$ | 1,300,000 | ||
|
|
||||
Item 14. Indemnification of directors and officers.
Section 102(b)(7) of the Delaware General Corporation Law, or DGCL, allows a corporation to provide in its certificate of incorporation that a director of the corporation will not be personally liable to the corporation or its stockholders for monetary damages for breach of fiduciary duty as a director, except where the director breached the duty of loyalty, failed to act in good faith, engaged in intentional misconduct or knowingly violated a law, authorized the payment of a dividend or approved a stock repurchase in violation of Delaware corporate law or obtained an improper personal benefit. Our amended and restated certificate of incorporation will provide for this limitation of liability.
Section 145 of the DGCL, or Section 145, provides, among other things, that a Delaware corporation may indemnify any person who was, is or is threatened to be made, party to any threatened, pending or completed action, suit or proceeding, whether civil, criminal, administrative or investigative (other than an action by or in the right of such corporation), by reason of the fact that such person is or was an officer, director, employee or agent of such corporation or is or was serving at the request of such corporation as a director, officer, employee or agent of another corporation or enterprise. The indemnity may include expenses (including attorneys’ fees), judgments, fines and amounts paid in settlement actually and reasonably incurred by such person in connection with such action, suit or proceeding, provided such person acted in good faith and in a manner he or she reasonably believed to be in or not opposed to the corporation’s best interests and, with respect to any criminal action or proceeding, had no reasonable cause to believe that his or her conduct was illegal. A Delaware corporation may indemnify any persons who were or are a party to any threatened, pending or completed action or suit by or in the right of the corporation by reason of the fact that such person is or was a director, officer, employee or agent of another corporation or enterprise. The indemnity may include expenses (including attorneys’ fees) actually and reasonably incurred by such person in connection with the defense or settlement of such action or suit, provided such person acted in good faith and in a manner he or she reasonably believed to be in or not opposed to the corporation’s best interests, provided further that no indemnification is
II-1
Table of Contents
permitted without judicial approval if the officer, director, employee or agent is adjudged to be liable to the corporation. Where an officer or director is successful on the merits or otherwise in the defense of any action referred to above, the corporation must indemnify him against the expenses which such officer or director has actually and reasonably incurred.
Section 145 further authorizes a corporation to purchase and maintain insurance on behalf of any person who is or was a director, officer, employee or agent of the corporation or is or was serving at the request of the corporation as a director, officer, employee or agent of another corporation or enterprise, against any liability asserted against him and incurred by him in any such capacity, or arising out of his or her status as such, whether or not the corporation would otherwise have the power to indemnify him or her under Section 145.
Our amended and restated bylaws provide that we must indemnify our directors and officers to the fullest extent authorized by the DGCL and must also pay expenses incurred in defending any such proceeding in advance of its final disposition upon delivery of an undertaking, by or on behalf of an indemnified person, to repay all amounts so advanced if it should be determined ultimately that such person is not entitled to be indemnified under our amended and restated bylaws or otherwise.
The indemnification rights set forth above shall not be exclusive of any other right which an indemnified person may have or hereafter acquire under any statute, provision of our amended and restated certificate of incorporation, our amended and restated bylaws, agreement, vote of stockholders or disinterested directors or otherwise.
We maintain standard policies of insurance that provide coverage (1) to our directors and officers against losses arising from claims made by reason of breach of duty or other wrongful act and (2) to us with respect to indemnification payments that we may make to such directors and officers.
We are party to indemnification agreements with our directors and executive officers. These agreements require us to indemnify these individuals to the fullest extent permitted under Delaware law against liabilities that may arise by reason of their service to us, and to advance expenses incurred as a result of any proceeding against them as to which they could be indemnified. Insofar as indemnification for liabilities arising under the Securities Act may be permitted to directors or executive officers, we have been informed that, in the opinion of the Securities and Exchange Commission, such indemnification is against public policy and is therefore unenforceable.
The proposed form of Underwriting Agreement filed as Exhibit 1.1 to this Registration Statement provides for indemnification to our directors and officers by the underwriters against certain liabilities.
Item 15. Recent sales of unregistered securities.
None.
Item 16. Financial statements and exhibits.
(a) See Page F-1 for an index of the financial statements that are being filed as part of this registration statement on Form S-1.
(b) Following is a list of exhibits being filed as part of this registration statement on Form S-1.
II-2
Table of Contents
Exhibit index
|
|
| |||
| Exhibit No. | Description | |||
|
|
| |||
| 1.1 | Form of Underwriting Agreement | |||
| 3.1 | Amended and Restated Certificate of Incorporation of La Quinta Holdings Inc. (incorporated by reference to Exhibit 3.1 to the Registrant’s Current Report on Form 8-K filed on April 14, 2014 (File no. 001-36412)) | |||
| 3.2 | Amended and Restated By-Laws of La Quinta Holdings Inc. (incorporated by reference to Exhibit 3.2 to the Registrant’s Current Report on Form 8-K filed on April 14, 2014 (File no. 001-36412)) | |||
| 5.1 | * | Opinion of Simpson Thacher & Bartlett LLP | ||
| 10.1 | Stockholders’ Agreement, dated as of April 14, 2014, by and among La Quinta Holdings Inc. and certain of its stockholders (incorporated by reference to Exhibit 10.1 to the Registrant’s Current Report on Form 8-K filed on April 14, 2014 (File no. 001-36412)) | |||
| 10.2 | Registration Rights Agreement, dated as of April 14, 2014, by and among La Quinta Holdings Inc. and certain of its stockholders (incorporated by reference to Exhibit 10.2 to the Registrant’s Current Report on Form 8-K filed on April 14, 2014 (File no. 001-36412)) | |||
| 10.3 | ** | Omnibus Incentive Plan (incorporated by reference to Exhibit 10.3 to the Registrant’s Registration Statement on Form S-1 (File no. 333-193860)) | ||
| 10.4 | ** | Amended and Restated Employment Agreement, dated September 30, 2003, between La Quinta Corporation and Wayne B. Goldberg (incorporated by reference to Exhibit 10.8 to the Registrant’s Registration Statement on Form S-1 (File no. 333-193860)) | ||
| 10.5 | ** | First Amendment to Amended and Restated Employment Agreement, dated November 9, 2005, between La Quinta Corporation and Wayne B. Goldberg (incorporated by reference to Exhibit 10.8 to the Registrant’s Registration Statement on Form S-1 (File no. 333-193860)) | ||
| 10.6 | ** | Second Amendment to Amended and Restated Employment Agreement, dated January 25, 2006, between LQ Management L.L.C. and Wayne B. Goldberg (incorporated by reference to Exhibit 10.8 to the Registrant’s Registration Statement on Form S-1 (File no. 333-193860)) | ||
| 10.7 | ** | Letter and Severance Agreement, dated January 7, 2013, between LQ Management L.L.C. and Keith Cline (incorporated by reference to Exhibit 10.8 to the Registrant’s Registration Statement on Form S-1 (File no. 333-193860)) | ||
| 10.8 | ** | Form of Director and Officer Indemnification Agreement (incorporated by reference to Exhibit 10.8 to the Registrant’s Registration Statement on Form S-1 (File no. 333-193860)) | ||
| 10.9 | Credit Agreement, dated April 14, 2014, among La Quinta Holdings Inc., La Quinta Intermediate Holdings L.L.C., as borrower, the other guarantors party thereto from time to time, JPMorgan Chase Bank, N.A., as administrative agent, collateral agent, swing line lender and L/C lender, and the other lenders party thereto from time to time (incorporated by reference to Exhibit 10.9 to the Registrant’s Registration Statement on Form S-1 (File no. 333-193860)) | |||
II-3
Table of Contents
| Exhibit No. | Description | |||
|
|
| |||
| 10.10 | Security Agreement, dated April 14, 2014, among the grantors identified therein and JPMorgan Chase Bank, N.A., as collateral agent (incorporated by reference to Exhibit 10.10 to the Registrant’s Registration Statement on Form S-1 (File no. 333-193860)) | |||
| 10.11 | ** | Form of La Quinta Holdings Inc. Share Distribution Acknowledgement (incorporated by reference to Exhibit 10.11 to the Registrant’s Registration Statement on Form S-1 (File no. 333-193860)) | ||
| 10.12 | ** | Form of Restricted Stock Grant Notice under the Omnibus Incentive Plan (incorporated by reference to Exhibit 10.12 to the Registrant’s Registration Statement on Form S-1 (File no. 333-193860)) | ||
| 10.13 | Agreement of Purchase and Sale, dated as of April 8, 2014, between BRE/Prime Mezz 2 L.L.C., as seller, and Lodge Holdco III L.L.C., as buyer (incorporated by reference to Exhibit 10.3 to the Registrant’s Current Report on Form 8-K filed on April 14, 2014) | |||
| 10.14 | ** | Form of Performance Share Unit Agreement (incorporated by reference to Exhibit 10.1 to the Registrant’s Quarterly Report on Form 10-Q for the quarter ended September 30, 2014 (File no. 001-36412) | ||
| 10.15 | ** | Form of Restricted Stock Grant Notice (Retention Award) (incorporated by reference to Exhibit 10.2 to the Registrant’s Quarterly Report on Form 10-Q for the quarter ended September 30, 2014 (File no. 001-36412) | ||
| 10.16 | ** | Form of Restricted Stock Grant Notice (Time-Based Vesting Award) (incorporated by reference to Exhibit 10.3 to the Registrant’s Quarterly Report on Form 10-Q for the quarter ended September 30, 2014 (File no. 001-36412) | ||
| 10.17 | ** | Form of Restricted Stock Unit Grant Notice (incorporated by reference to Exhibit 10.4 to the Registrant’s Quarterly Report on Form 10-Q for the quarter ended September 30, 2014 (File no. 001-36412) | ||
| 21.1 | List of Subsidiaries (incorporated by reference to Exhibit 21.1 to the Registrant’s Registration Statement on Form S-1 (File No. 333-193860)) | |||
| 23.1 | * | Consent of Simpson Thacher & Bartlett LLP (included as part of Exhibit 5.1) | ||
| 23.2 | Consent of Deloitte & Touche LLP as to Lodge Holdco I L.L.C. and subsidiaries, Lodge Holdco II L.L.C. and subsidiaries and Lodge Holdco III L.L.C. and subsidiaries | |||
| 23.3 | Consent of Deloitte & Touche LLP as to WIH La Quinta Inn Hotels | |||
| 23.4 | Consent of Deloitte & Touche LLP as to La Quinta Holdings Inc. | |||
| 23.5 | Consent of Giovanni Cutaia to be named as a director nominee | |||
| 23.6 | Consent of Brian Kim to be named as a director nominee | |||
| 24.1 | * | Power of Attorney (included on the signature pages to this Registration Statement) | ||
| 101.INS | *** | XBRL Instance Document | ||
| 101.SCH | *** | XBRL Taxonomy Extension Schema Document | ||
| 101.CAL | *** | XBRL Taxonomy Extension Calculation Linkbase Document | ||
| 101.DEF | *** | XBRL Taxonomy Extension Definition Linkbase Document | ||
| 101.LAB | *** | XBRL Taxonomy Extension Label Linkbase Document | ||
| 101.PRE | *** | XBRL Taxonomy Extension Presentation Linkbase Document | ||
|
|
| |||
| * | Previously filed. |
| ** | This document has been identified as a management contract or compensatory plan or arrangement. |
| *** | XBRL (Extensible Business Reporting Language) information is furnished and not filed for purposes of Sections 11 and 12 of the Securities Act of 1933 and Section 18 of the Securities Exchange Act of 1934. |
II-4
Table of Contents
Item 37. Undertakings.
(a) Insofar as indemnification for liabilities arising under the Securities Act of 1933 may be permitted to directors, officers and controlling persons of the registrant pursuant to the foregoing provisions, or otherwise, the registrant has been advised that in the opinion of the Securities and Exchange Commission such indemnification is against public policy as expressed in the Securities Act of 1933 and is, therefore, unenforceable. In the event that a claim for indemnification against such liabilities (other than the payment by the registrant of expenses incurred or paid by a director, officer or controlling person of the registrant in the successful defense of any action, suit or proceeding) is asserted by such director, officer or controlling person in connection with the securities being registered, the registrant will, unless in the opinion of their counsel the matter has been settled by controlling precedent, submit to a court of appropriate jurisdiction the question of whether such indemnification by them is against public policy as expressed in the Securities Act of 1933 and will be governed by the final adjudication of such issue.
(c) The undersigned registrant hereby undertakes that:
| (1) | For purposes of determining any liability under the Securities Act of 1933, the information omitted from the form of prospectus filed as part of this registration statement in reliance upon Rule 430A and contained in a form of prospectus filed by the registrant pursuant to Rule 424(b) (1) or (4) or 497(h) under the Securities Act shall be deemed to be part of this registration statement as of the time it was declared effective. |
| (2) | For the purpose of determining any liability under the Securities Act of 1933, each post-effective amendment that contains a form of prospectus shall be deemed to be a new registration statement relating to the securities offered therein, and the offering of such securities at that time shall be deemed to be the initial bona fide offering thereof. |
II-5
Table of Contents
Signatures
Pursuant to the requirements of the Securities Act of 1933, as amended, the Registrant, has duly caused this registration statement to be signed on its behalf by the undersigned, thereunto duly authorized, in the City of Irving, Texas, on November 17, 2014.
| La Quinta Holdings Inc. | ||
| By: |
/s/ Wayne B. Goldberg | |
| Name: Wayne B. Goldberg Title: President and Chief Executive Officer | ||
Pursuant to the requirements of the Securities Act of 1933, this Registration Statement has been signed by the following persons in the capacities indicated on November 17, 2014.
| Signature |
Capacity | |
| /s/ Wayne B. Goldberg Wayne B. Goldberg |
President and Chief Executive Officer and Director (principal executive officer) | |
| /s/ Keith A. Cline Keith A. Cline |
Executive Vice President and Chief Financial Officer (principal financial officer) | |
| /s/ James H. Forson James H. Forson |
Senior Vice President, Chief Accounting Officer and Treasurer (principal accounting officer) | |
| * Glenn Alba |
Director | |
| * Alan J. Bowers |
Director | |
| * Henry G. Cisneros |
Director | |
| * Jonathan D. Gray |
Director | |
| * Michael Nash |
Director | |
| * Mitesh B. Shah |
Director | |
II-6
Table of Contents
| Signature |
Capacity | |
| * William J. Stein |
Director | |
| * Gary M. Sumers |
Director | |
| *By: | /s/ Wayne B. Goldberg | |
| Name: Wayne B. Goldberg | ||
| Title: Attorney-in-Fact |
II-7