Attached files
| file | filename |
|---|---|
| EX-99.1 - EX-99.1 - La Quinta Holdings Inc. | lq-ex991_451.htm |
| EX-32.2 - EX-32.2 - La Quinta Holdings Inc. | lq-ex322_409.htm |
| EX-32.1 - EX-32.1 - La Quinta Holdings Inc. | lq-ex321_408.htm |
| EX-31.2 - EX-31.2 - La Quinta Holdings Inc. | lq-ex312_410.htm |
| EX-31.1 - EX-31.1 - La Quinta Holdings Inc. | lq-ex311_411.htm |
| EX-23.1 - EX-23.1 - La Quinta Holdings Inc. | lq-ex231_407.htm |
| EX-21.1 - EX-21.1 - La Quinta Holdings Inc. | lq-ex211_406.htm |
| EX-10.19 - EX-10.19 - La Quinta Holdings Inc. | lq-ex1019_452.htm |
UNITED STATES
SECURITIES AND EXCHANGE COMMISSION
Washington, D.C. 20549
Form 10-K
(Mark One)
|
☒ |
ANNUAL REPORT PURSUANT TO SECTION 13 OR 15(d) OF THE SECURITIES EXCHANGE ACT OF 1934 |
For the fiscal year ended December 31, 2016
or
|
☐ |
TRANSITION REPORT PURSUANT TO SECTION 13 OR 15(d) OF THE SECURITIES EXCHANGE ACT OF 1934 |
For the transition period from to
Commission File Number 001-36412
La Quinta Holdings Inc.
(Exact name of registrant as specified in its charter)
|
|
|
|
|
Delaware |
|
99-1032961 |
|
(State or other jurisdiction of incorporation or organization) |
|
(I.R.S. Employer Identification No.) |
909 Hidden Ridge, Suite 600
Irving, Texas 75038
(Address of Principal Executive Offices) (Zip Code)
Registrant’s telephone number, including area code: (214) 492-6600
Securities registered pursuant to Section 12(b) of the Act:
|
(Title of each class) |
|
(Name of each exchange on which registered) |
|
Common Stock, $0.01 par value per share |
|
New York Stock Exchange |
Securities registered pursuant to Section 12(g) of the Act: None
Indicate by check mark if the registrant is a well-known seasoned issuer, as defined in Rule 405 of the Securities Act. Yes ☒ No ☐
Indicate by check mark if the registrant is not required to file reports pursuant to Section 13 or Section 15(d) of the Act. Yes ☐ No ☒
Indicate by check mark whether the registrant (1) has filed all reports required to be filed by Section 13 or 15(d) of the Securities Exchange Act of 1934 during the preceding 12 months (or for such shorter period that the registrant was required to file such reports), and (2) has been subject to such filing requirements for the past 90 days. Yes ☒ No ☐
Indicate by check mark whether the registrant has submitted electronically and posted on its corporate Web site, if any, every Interactive Data File required to be submitted and posted pursuant to Rule 405 of Regulation S-T (§ 232.405 of this chapter) during the preceding 12 months (or for such shorter period that the registrant was required to submit and post such files). Yes ☒ No ☐
Indicate by check mark if disclosure of delinquent filers pursuant to Item 405 of Regulation S-K (§ 229.405 of this chapter) is not contained herein, and will not be contained, to the best of registrant’s knowledge, in definitive proxy or information statements incorporated by reference in Part III of this Form 10-K or any amendment to this Form 10-K. ☐
Indicate by check mark whether the registrant is a large accelerated filer, an accelerated filer, a non-accelerated filer, or a smaller reporting company. See definitions of “large accelerated filer,” “accelerated filer” and “smaller reporting company” in Rule 12b-2 of the Exchange Act. (Check one):
|
|
|
|
|
|
|
|
|
Large accelerated filer |
|
☒ |
|
Accelerated filer |
|
☐ |
|
|
|
|
|
|||
|
Non-accelerated filer |
|
☐ (Do not check if a smaller reporting company) |
|
Smaller reporting company |
|
☐ |
Indicate by check mark whether the registrant is a shell company (as defined in Rule 12b-2 of the Exchange Act). Yes ☐ No ☒
As of June 30, 2016, the aggregate market value of the registrant’s common stock held by non-affiliates of the registrant was approximately $916.3 million (based upon the closing sale price of the common stock on that date on the New York Stock Exchange).
The number of shares of common stock outstanding on February 24, 2017 was 117,039,146.
DOCUMENTS INCORPORATED BY REFERENCE
Items 10, 11, 12, 13 and 14 of Part III incorporate information by reference from the registrant’s definitive proxy statement relating to its 2017 annual meeting of stockholders to be filed with the Securities and Exchange Commission within 120 days after the close of the registrant’s fiscal year.
FORM 10-K
YEAR ENDED DECEMBER 31, 2016
|
|
|
|
Page No. |
|
|
|
|
|
|
|
|
|
|
|
1 |
|
|
|
|
|||
|
|
|
|
2 |
|
|
|
|
|||
|
|
|
|
3 |
|
|
|
|
|||
|
|
|
|
3 |
|
|
|
|
|||
|
PART I
|
|
|
|
|
|
Item 1. |
|
|
4 |
|
|
|
|
|||
|
Item 1A. |
|
|
16 |
|
|
|
|
|||
|
Item 1B. |
|
|
40 |
|
|
|
|
|||
|
Item 2. |
|
|
40 |
|
|
|
|
|||
|
Item 3. |
|
|
42 |
|
|
|
|
|||
|
Item 4. |
|
|
42 |
|
|
|
|
|
|
|
|
PART II |
|
|
|
|
|
|
||||
|
|
|
43 |
||
|
|
|
|||
|
Item 6. |
|
|
44 |
|
|
|
|
|||
|
Item 7. |
|
Management’s Discussion and Analysis of Financial Condition and Results of Operations |
|
47 |
|
|
|
|||
|
Item 7A. |
|
|
72 |
|
|
|
|
|||
|
Item 8. |
|
|
74 |
|
|
|
|
|||
|
Item 9. |
|
Changes in and Disagreements with Accountants on Accounting and Financial Disclosure |
|
114 |
|
|
|
|||
|
Item 9A. |
|
|
114 |
|
|
|
|
|||
|
Item 9B. |
|
|
116 |
|
|
|
||||
|
PART III |
|
|
|
|
|
|
|
|
|
|
|
|
|
117 |
||
|
|
|
|||
|
Item 11. |
|
|
117 |
|
|
|
|
|||
|
Item 12. |
|
Security Ownership of Certain Beneficial Owners and Management and Related Stockholder Matters |
|
117 |
|
|
|
|||
|
Item 13. |
|
Certain Relationships and Related Transactions and Director Independence |
|
117 |
|
|
|
|||
|
Item 14. |
|
|
117 |
|
|
|
||||
|
PART IV |
|
|
|
|
|
|
|
|
|
|
|
Item 15. |
|
|
118 |
|
|
|
|
|||
|
Item 16. |
|
|
119 |
|
|
|
|
|
|
|
|
|
|
|
120 |
|
This Annual Report on Form 10-K contains “forward-looking statements” within the meaning of the federal securities laws. All statements, other than statements of historical facts included in this Annual Report on Form 10-K, including statements concerning our plans, objectives, goals, beliefs, business strategies, future events, business conditions, results of operations, financial position and our business outlook, business trends and other information referred to in this Annual Report on Form 10-K are forward-looking statements. When used in this Annual Report on Form 10-K, the words “estimates,” “expects,” “contemplates,” “anticipates,” “projects,” “plans,” “intends,” “believes,” “forecasts,” “may,” “should” and variations of such words or similar expressions are intended to identify forward-looking statements. The forward-looking statements are not historical facts, and are based upon our current expectations, beliefs, estimates and projections, and various assumptions, many of which, by their nature, are inherently uncertain and beyond our control. Our expectations, beliefs, estimates and projections are expressed in good faith and we believe there is a reasonable basis for them. However, there can be no assurance that management’s expectations, beliefs, estimates and projections will result or be achieved and actual results may vary materially from what is expressed in or indicated by the forward-looking statements.
There are a number of risks, uncertainties and other important factors, many of which are beyond our control, that could cause our actual results to differ materially from the forward-looking statements contained in this Annual Report on Form 10-K. Such risks, uncertainties and other important factors include, among others, the following risks, uncertainties and factors:
|
|
• |
business, financial, and operating risks inherent to the hospitality industry; |
|
|
• |
macroeconomic and other factors beyond our control can adversely affect and reduce demand for hotel rooms; |
|
|
• |
contraction in the global economy or low levels of economic growth; |
|
|
• |
inability to compete effectively; |
|
|
• |
any deterioration in the quality or reputation of our brand; |
|
|
• |
inability to develop our pipeline; |
|
|
• |
the geographic concentration of our hotels; |
|
|
• |
delays or increased expense relating to our efforts to develop, redevelop, sell or renovate our hotels; |
|
|
• |
inability by us or our franchisees to make necessary investments to maintain the quality and reputation of our brand; |
|
|
• |
inability to access capital necessary for growth; |
|
|
• |
seasonal and cyclical volatility in the hotel industry; |
|
|
• |
inability to maintain good relationships with our franchisees; |
|
|
• |
inability to protect our brand standards; |
|
|
• |
risks resulting from significant investments in owned real estate; |
|
|
• |
failure to keep pace with developments in technology; |
|
|
• |
failures or interruptions in, material damage to, or difficulties in updating, our information technology systems, software or websites; |
|
|
• |
inability to protect our guests’ personal information; |
|
|
• |
failure to comply with marketing and advertising laws; |
|
|
• |
disruptions to our reservation system; |
|
|
• |
failure to protect our trademarks and other intellectual property; |
|
|
• |
risks of doing business internationally; |
|
|
• |
the loss of senior executives or key field personnel; |
|
|
• |
the results of the audit by the Internal Revenue Service; |
|
|
• |
our substantial indebtedness; |
|
|
• |
risks related to pursuing the separation of our businesses; and |
|
|
• |
Blackstone’s significant influence over us. |
1
There may be other factors that may cause our actual results to differ materially from the forward-looking statements, including factors disclosed under the sections entitled “Part I—Item 1A. Risk Factors” and “Part II—Item 7. Management’s Discussion and Analysis of Financial Condition and Results of Operations” in this Annual Report on Form 10-K. You should evaluate all forward-looking statements made in this Annual Report on Form 10-K in the context of these risks and uncertainties.
We caution you that the risks, uncertainties and other factors referenced above may not contain all of the risks, uncertainties and other factors that are important to you. In addition, we cannot assure you that we will realize the results, benefits or developments that we expect or anticipate or, even if substantially realized, that they will result in the consequences or affect us or our business in the way expected. All forward-looking statements in this Annual Report on Form 10-K apply only as of the date made and are expressly qualified in their entirety by the cautionary statements included in this Annual Report on Form 10-K. We undertake no obligation to publicly update or revise any forward-looking statements to reflect subsequent events or circumstances.
Basis of Presentation in this Annual Report on Form 10-K
On April 14, 2014, we completed our initial public offering (the “IPO”), in which we issued and sold approximately 44.0 million shares of common stock of La Quinta Holdings Inc. Our business prior to the IPO was conducted, and our hotel properties were owned, through multiple entities (including the entities owned by the Company at the completion of the IPO and previously under common control or otherwise consolidated for financial reporting purposes and their consolidated subsidiaries (the “Predecessor Entities”) and the entities that owned the 14 La Quinta hotels managed by the Predecessor Entities (the “Previously Managed Portfolio”), collectively, the “Existing Entities”). Prior to the IPO, certain of our Existing Entities operated as real estate investment trusts (“REITs”) for U.S. federal income tax purposes.
To effectuate the IPO, we effected a series of transactions that resulted in a reorganization of our business (the “Pre-IPO Transactions”). Specifically, among other transactions, one of the Predecessor Entities purchased the Previously Managed Portfolio and we purchased the management company for the Predecessor Entities and the equity interests in the Predecessor Entities held by the pre-IPO owners were exchanged by the pre-IPO owners for shares of common stock of the Registrant. Additionally, all of the shares of capital stock held by third-party stockholders of the Existing Entities that were REITs were redeemed for cash and the REITs were converted into limited liability companies. Following the IPO, neither we nor any of our subsidiaries were operated as a REIT, and we are taxed as a “C” corporation at the federal and state level. See “Part I—Item 1. Business—Corporate History and Structure.”
Unless otherwise indicated or the context otherwise requires, all information in this Annual Report on Form 10-K reflects the consummation of the Pre-IPO Transactions and references in this Annual Report on Form 10-K to “we,” “our,” “us” and the “Company” refer to La Quinta Holdings Inc. and its consolidated subsidiaries, and references to “La Quinta Holdings Inc.” and the “Registrant” refer only to La Quinta Holdings Inc. exclusive of its subsidiaries.
As of December 31, 2013, four of our La Quinta-branded hotels were designated as assets held for sale and the results of their operations together with the operations of the 29 hotels sold during 2013, have been classified as discontinued operations (collectively, the “Hotels Designated for Sale”). Sales of these four hotels closed in February 2014.
Presentation of historical non-financial data. Unless otherwise indicated or the context otherwise requires, operating and other non-financial data, including number of hotels and related data, disclosed in the sections of this Annual Report on Form 10-K other than the Financial Statement Sections (as defined below):
|
|
• |
reflects the combined and consolidated business and operations of the Predecessor Entities; and |
|
|
• |
treats the Previously Managed Portfolio as owned hotels, which were acquired by the Predecessor Entities at the time of the IPO. |
Presentation of combined financial information and certain other non-financial data. Unless otherwise indicated, or the context otherwise requires, for periods prior to the completion of the IPO, (i) the historical financial data in this Annual Report on Form 10-K and (ii) the operating and other non-financial data, including number of hotels and related data, disclosed in “Part II—Item 6. Selected Financial Data” and “Part II—Item 7. Management’s Discussion and Analysis of Financial Condition and Results of Operations” (collectively, the “Financial Statement Sections”):
|
|
• |
reflects the combined and consolidated business and operations of the Predecessor Entities (including the management company, which was consolidated for financial reporting purposes); and |
|
|
• |
treats the Previously Managed Portfolio as franchised and managed hotels. |
2
Terms Used in this Annual Report on Form 10-K
The following are definitions of certain terms used in this Annual Report on Form 10-K:
|
|
• |
“ADR” or “average daily rate” means hotel room revenues divided by total number of rooms sold in a given period; |
|
|
• |
“Blackstone” means The Blackstone Group L.P. and its affiliates; |
|
|
• |
“Comfort” refers to Comfort Inns and Comfort Suites collectively; |
|
|
• |
“comparable hotels” means hotels that: were active and operating in our system for at least one full calendar year as of the end of the applicable period and were active and operating as of January 1st of the previous year, except for (i) hotels that sustained substantial property damage or other business interruption, (ii) owned hotels that become subject to a purchase and sale agreement, or (iii) hotels in which comparable results are otherwise not available. Management uses comparable hotels as the basis upon which to evaluate ADR, occupancy, RevPAR and RevPAR Index on a system-wide basis and for each of our reportable segments; |
|
|
• |
“franchised hotels” refers to La Quinta-branded hotels which are owned and operated by third party franchisees under franchise agreements with us; |
|
|
• |
“Hampton” refers to Hampton Inns and Hampton Inn & Suites collectively; |
|
|
• |
“main STR competitive set” refers to Comfort, Holiday Inn Express, and/or Hampton, the brands most often included in our STR competitive sets; |
|
|
• |
“occupancy” means the total number of rooms sold in a given period divided by the total number of rooms available at a hotel or group of hotels; |
|
|
• |
“owned hotels” and “owned portfolio” refer to our hotels located on properties in which we have an ownership interest or leasehold interest; |
|
|
• |
“pipeline” means our portfolio of future La Quinta-branded hotels, each of which is represented by an executed franchise agreement; |
|
|
• |
“pre-IPO owners” refers to Blackstone and the members of our management and consultants that owned, directly or indirectly, interests in the Predecessor Entities; |
|
|
• |
“RevPAR” or “revenue per available room” means the product of the ADR charged and the average daily occupancy achieved; |
|
|
• |
“RevPAR Index” measures a hotel’s fair market share of its competitive set’s revenue per available room. See “Market and Industry Data”; |
|
|
• |
“system-wide” refers collectively to our owned, franchised and managed hotel portfolios; and |
|
|
• |
“team members” refers to our employees at our owned hotels and the employees of our franchisees at our franchised hotels. |
Within this Annual Report on Form 10-K, we reference information and statistics regarding the hotel industry and various segments within such industry. We have obtained this information and statistics from various independent third-party sources, including independent industry publications, reports by market research firms and other independent sources. Smith Travel Research (“STR”) is the primary source for third-party market data and industry statistics. STR does not guarantee the performance of any company about which it collects and provides data. Nothing in the STR data should be construed as advice. Some data and other information are also based on our good faith estimates, which are derived from our review of internal surveys and independent sources. We believe that these external sources and estimates are reliable, but have not independently verified them.
RevPAR Index, which measures a hotel’s fair market share of its competitive set’s revenue per available room, is stated as a percentage and is calculated for a hotel by comparing the hotel’s RevPAR to the aggregate RevPAR of a group of competing hotels generally in the same market (referred to as a “competitive set”); and when presented for a group of hotels is a weighted average of the individual hotel results. The manager for each of our owned hotels and each franchisee exercises discretion, subject to (i) adherence to certain guidelines published by STR and described below and (ii) review by La Quinta management to ensure system-wide consistency, in identifying the competitive set of properties for each such hotel. They consider such factors as physical proximity, competition for similar customers, services and amenities, quality and average daily rate, with location being the most significant factor. Competitive set makeup is initially determined when a new hotel enters our system and is reviewed for continuing appropriateness as non-La Quinta hotels enter and leave our markets. Each La Quinta hotel’s competitive set complies with the
3
following four STR published guidelines, each of which places limitations on properties that may be included in a competitive set: (1) each competitive set must include a minimum of three participating properties, in addition to the subject property; (2) no single property or brand can account for more than 40% of the total participating room supply of a competitive set, excluding the rooms of the subject property; (3) no single company can account for more than 60% of the total participating room supply of a competitive set, excluding the rooms of the subject property; and (4) each competitive set must include a minimum of two companies other than that of the subject property. We may include certain competitors in a hotel property’s competitive set and those competitors may or may not include our hotel in their competitive set. We provide, for each La Quinta hotel, our proposed competitive set to STR for publication. STR confirms that each proposed competitive set complies with their published guidelines and then uses that information, along with ADR and RevPAR for each such hotel (which ADR and RevPAR may be calculated differently than we or our competitors do for internal purposes) to calculate RevPAR Index. STR calculates RevPAR Index for the current period and prior periods based on the competitive sets existing as of the date of the STR report for the current period of such report. Accordingly, our future filings may disclose historical RevPAR Index for prior periods that differ from those disclosed in this Annual Report on Form 10-K.
PART I
Overview
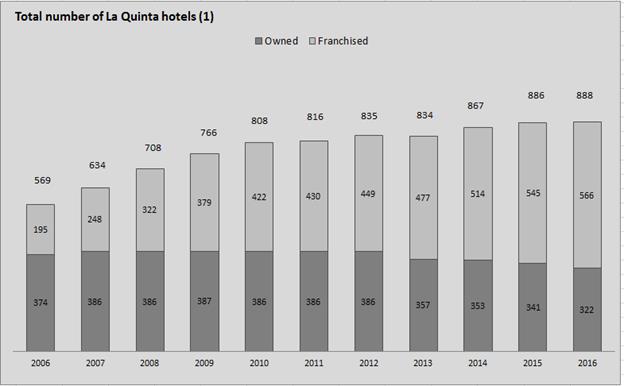
Our system-wide portfolio, as of December 31, 2016, consisted of 888 hotels representing approximately 87,200 rooms located predominantly in 48 states across the U.S., as well as in Canada, Mexico, Honduras and Colombia, of which 322 hotels were owned and operated and 566 were franchised. We also have a pipeline of 248 franchised hotels as of December 31, 2016, to be located in the United States, Mexico, Colombia, Nicaragua, Guatemala, Chile and El Salvador (90% of which represents new construction as opposed to the conversion of an existing hotel).
As illustrated by the following table, from 2006 to December 31, 2016, we have grown our total number of owned and franchised hotels worldwide from 569 properties to 888 properties.
|
(1) |
Information as of last day of each fiscal year presented. Certain of our owned hotels were previously operated by us as non-La Quinta hotels and are not included in this table until such time as they were converted to La Quinta-branded hotels. From the Acquisition (defined below) through December 31, 2016 and primarily in 2006, we converted 128 such hotels. |
4
La Quinta was founded in San Antonio, Texas in 1968 and has a 48-year history of owning and operating hotels. From 1973 to January 2006, we operated through our predecessors as a public company. In January 2006, we were acquired by Blackstone (the “Acquisition”). At the time of the Acquisition, we had a total of 425 hotels, of which 267 were owned hotels and 158 were franchised hotels. Since the Acquisition and through December 31, 2016, we expanded our franchise system by over three times, growing from 158 franchised hotels to 566 franchised hotels. We also established a franchise presence in Mexico, Central America and South America, with 38 hotels either open or in the pipeline in those regions.
Our brand and hotels
We operate our business across two segments: owned hotels and franchise and management. These segments are components of the business which are managed discretely and for which discrete financial information is reviewed regularly by our CEO, who is our chief operating decision maker, to assess performance and make decisions regarding the allocation of resources. For more information regarding our segments, see “Part II—Item 7. Management’s Discussion and Analysis of Financial Condition and Results of Operations” and Note 18: “Segments” in our audited consolidated financial statements included elsewhere in this Annual Report on Form 10-K.
The table below sets forth the number of hotels and rooms as of December 31, 2016:
|
|
|
Owned |
|
|
Franchised |
|
|
Total |
|
|||||||||||||||
|
|
|
# of hotels |
|
|
# of rooms |
|
|
# of hotels |
|
|
# of rooms |
|
|
# of hotels |
|
|
# of rooms |
|
||||||
|
Texas |
|
|
70 |
|
|
|
9,441 |
|
|
159 |
|
|
|
11,746 |
|
|
229 |
|
|
|
21,187 |
|
||
|
Florida |
|
|
50 |
|
|
|
6,125 |
|
|
|
23 |
|
|
|
2,062 |
|
|
|
73 |
|
|
|
8,187 |
|
|
California |
|
|
21 |
|
|
|
3,127 |
|
|
|
36 |
|
|
|
3,179 |
|
|
|
57 |
|
|
|
6,306 |
|
|
Georgia |
|
|
14 |
|
|
|
1,696 |
|
|
|
24 |
|
|
|
1,866 |
|
|
|
38 |
|
|
|
3,562 |
|
|
Louisiana |
|
|
13 |
|
|
|
1,796 |
|
|
|
17 |
|
|
|
1,103 |
|
|
|
30 |
|
|
|
2,899 |
|
|
Colorado |
|
|
15 |
|
|
|
1,894 |
|
|
|
13 |
|
|
|
1,134 |
|
|
|
28 |
|
|
|
3,028 |
|
|
Tennessee |
|
|
8 |
|
|
|
988 |
|
|
|
19 |
|
|
|
1,495 |
|
|
|
27 |
|
|
|
2,483 |
|
|
Oklahoma |
|
|
2 |
|
|
|
236 |
|
|
|
23 |
|
|
|
1,695 |
|
|
|
25 |
|
|
|
1,931 |
|
|
Illinois |
|
|
8 |
|
|
|
1,097 |
|
|
|
10 |
|
|
|
876 |
|
|
|
18 |
|
|
|
1,973 |
|
|
New Mexico |
|
|
8 |
|
|
|
914 |
|
|
|
11 |
|
|
|
758 |
|
|
|
19 |
|
|
|
1,672 |
|
|
Other states |
|
|
113 |
|
|
|
13,922 |
|
|
|
219 |
|
|
|
18,676 |
|
|
|
332 |
|
|
|
32,598 |
|
|
United States Total |
|
|
322 |
|
|
|
41,236 |
|
|
|
554 |
|
|
|
44,590 |
|
|
|
876 |
|
|
|
85,826 |
|
|
Mexico |
|
|
— |
|
|
|
— |
|
|
|
8 |
|
|
|
1,132 |
|
|
|
8 |
|
|
|
1,132 |
|
|
Canada |
|
|
— |
|
|
|
— |
|
|
|
2 |
|
|
|
133 |
|
|
|
2 |
|
|
|
133 |
|
|
Honduras |
|
|
— |
|
|
|
— |
|
|
|
1 |
|
|
|
110 |
|
|
|
1 |
|
|
|
110 |
|
|
Colombia |
|
|
— |
|
|
|
— |
|
|
|
1 |
|
|
|
82 |
|
|
|
1 |
|
|
|
82 |
|
|
Total |
|
|
322 |
|
|
|
41,236 |
|
|
|
566 |
|
|
|
46,047 |
|
|
|
888 |
|
|
|
87,283 |
|
We own our owned hotels through wholly owned subsidiaries except for one hotel, which is owned by a joint venture in which we own a controlling interest. Generally, our owned hotels include the land, related easements and rights, buildings, improvements, furniture, fixtures and equipment, though certain of our owned hotels are located on land leased by us pursuant to ground leases with third parties.
We own, operate and franchise all of our hotels under the La Quinta Inn, La Quinta Inn & Suites and LQ Hotel trademarks. As of December 31, 2016, the hotels in our system consisted of 673 La Quinta Inn & Suites hotels, which include guest suites and are generally our newer hotels with interior corridors, 205 La Quinta Inns, 110 of which include interior corridors and 10 LQ Hotels, which is the primary trademark under which our hotels are identified in Mexico and Central and South America. When STR’s price points by segment are applied to each of our hotels, approximately 31% would be considered upper-midscale, approximately 51% would be considered midscale, approximately 8% would be considered economy (principally our owned hotels) and the balance would be considered in the segments above upper-midscale. We are focused on providing clean and comfortable guest rooms at affordable prices in convenient locations. Our hotels typically include common areas with amenities such as a great room (including breakfast seating area, lobby with seating area and business center), swimming pool and vending areas, and typically offer a complimentary breakfast. Our guest mix includes both business and leisure travelers. As of December 31, 2016, the hotels in our owned portfolio have an average age of 28 years, and the hotels in our franchise portfolio have an average age of 14 years, with over 30% being in our system less than five years.
Current designs for new La Quinta hotels are typically four story structures and approximately 56,900 square feet with approximately 85 to 120 interior corridor guest rooms. International La Quinta hotels generally also include expanded breakfast offerings, full-service restaurants and between 85 and 165 rooms. Certain of our owned hotels are larger than our typical design. For
5
example, our hotel in downtown Chicago, which was converted from office space to a La Quinta-branded hotel in 2009, is approximately 141,000 square feet with 241 guest rooms. All new franchised hotels are La Quinta Inn & Suites in the U.S., and Canada. Franchised hotels in Mexico, Central and South America, use the “LQ Hotel” as the primary mark.
At both our La Quinta Inn & Suites and La Quinta Inn hotels in the U.S. and Canada, our guests typically have convenient access to food service at nearby freestanding restaurants, which include many national chains. We own approximately 60 buildings that are adjacent to some of our owned hotels, which we generally lease to third party restaurant operators.
We regularly repair and maintain our owned hotels, and annually review each hotel to assess the need for renovations based on asset condition. Maintenance and renovation capital expenditures are comprised of repair and maintenance in ordinary course operations, customary cycle renovations and ongoing maintenance of our technology infrastructure in order to keep it current. Customary cycle renovations can range from design renovations to full renovations and can include, among other things, replacement of mattresses, seating, fixtures or carpet, repainting, window treatments and improvements in the common areas. We maintain a variety of designs and décor scheme options for our rooms and select the room scheme for a given hotel’s cycle renovation based on market factors and our review of the optimal return for the capital invested.
On an ongoing basis, we evaluate additional capital projects such as accelerating renovation cycles for our owned hotels as well as investing in technology innovation that enhances our guest experience, and we will invest in those projects that we believe will provide an appropriate return on capital invested and increase RevPAR Index. In 2016, we undertook a review of our owned hotel portfolio to identify properties that, with the appropriate scope of capital investment and renovation, have the opportunity to re-position upwards within a market, capturing occupancy and additional rate while being measured against new, higher-quality competitive sets. Renovations of approximately 50 properties identified in this review commenced in the fourth quarter of 2016. For additional information, see “Item 7. Management’s Discussion and Analysis of Financial Condition and Results of Operations―Key components and factors affecting our results of operations―Revenues.”
In addition, our franchise agreements allow us to require franchised hotels to replace furnishings every five to seven years and require upgrades to meet then-current brand standards at any time, but under these agreements, we may not require substantial upgrading or remodeling more often than once every five years.
We continually evaluate our owned hotel portfolio and, from time to time, we may sell certain hotels or groups of hotels that we determine are not consistent with our overall brand experience. In 2016, as part of a strategic review of our owned hotel portfolio, we identified approximately 50 hotels as candidates for sale and entered into agreements to sell six of those hotels, three of which were sold during 2016. Also in 2016 we entered into agreements to sell five additional owned hotels, three of which were sold during 2016 and two of which were sold subsequent to 2016 year-end. In 2015, we conducted a review of our portfolio of owned hotels and subsequently entered into a definitive purchase and sale agreement for 24 of our owned hotels, 11 of which were sold in the fourth quarter of 2015 and the remaining 13 were sold throughout 2016.
6
The following table summarizes our key operating statistics for our owned, franchised and managed hotels for the past five years (1):
|
|
|
As of and for the year ended December 31, |
|
|||||||||||||||||
|
|
|
2016 |
|
|
2015 |
|
|
2014 |
|
|
2013 |
|
|
2012 |
|
|||||
|
Number of Hotels in Operation |
|
|
|
|
|
|
|
|
|
|
|
|
|
|
|
|
|
|
|
|
|
Company Owned Hotels(1) |
|
|
|
|
|
|
|
|
|
|
|
|
|
|
|
|
|
|
|
|
|
La Quinta Inn & Suites (interior corridor) |
|
|
180 |
|
|
|
183 |
|
|
|
184 |
|
|
|
184 |
|
|
|
185 |
|
|
La Quinta Inn & Suites (exterior corridor) |
|
|
3 |
|
|
|
3 |
|
|
|
3 |
|
|
|
3 |
|
|
|
3 |
|
|
La Quinta Inns (interior corridor) |
|
|
46 |
|
|
|
51 |
|
|
|
56 |
|
|
|
56 |
|
|
|
56 |
|
|
La Quinta Inns (exterior corridor) |
|
|
93 |
|
|
|
104 |
|
|
|
110 |
|
|
|
114 |
|
|
|
142 |
|
|
Total Owned |
|
|
322 |
|
|
|
341 |
|
|
|
353 |
|
|
|
357 |
|
|
|
386 |
|
|
Franchised/Managed Hotels |
|
|
|
|
|
|
|
|
|
|
|
|
|
|
|
|
|
|
|
|
|
La Quinta Inn & Suites (interior corridor) |
|
|
486 |
|
|
|
459 |
|
|
|
417 |
|
|
|
373 |
|
|
|
349 |
|
|
La Quinta Inn & Suites (exterior corridor) |
|
|
4 |
|
|
|
3 |
|
|
|
3 |
|
|
|
5 |
|
|
|
3 |
|
|
La Quinta Inns (interior corridor) |
|
|
64 |
|
|
|
77 |
|
|
|
84 |
|
|
|
89 |
|
|
|
92 |
|
|
La Quinta Inns (exterior corridor) |
|
|
2 |
|
|
|
4 |
|
|
|
10 |
|
|
|
10 |
|
|
|
5 |
|
|
LQ Hotel (interior corridor) (2) |
|
|
10 |
|
|
|
2 |
|
|
|
— |
|
|
|
— |
|
|
|
— |
|
|
Total Franchised/Managed |
|
|
566 |
|
|
|
545 |
|
|
|
514 |
|
|
|
477 |
|
|
|
449 |
|
|
Total |
|
|
888 |
|
|
|
886 |
|
|
|
867 |
|
|
|
834 |
|
|
|
835 |
|
|
Occupancy Percentage |
|
|
|
|
|
|
|
|
|
|
|
|
|
|
|
|
|
|
|
|
|
Company Owned Hotels |
|
|
65.5 |
% |
|
|
67.0 |
% |
|
|
66.5 |
% |
|
|
64.4 |
% |
|
|
62.7 |
% |
|
Franchised/Managed Hotels |
|
|
67.7 |
% |
|
|
68.2 |
% |
|
|
67.3 |
% |
|
|
64.3 |
% |
|
|
62.8 |
% |
|
Total |
|
|
66.5 |
% |
|
|
67.5 |
% |
|
|
66.8 |
% |
|
|
64.4 |
% |
|
|
62.7 |
% |
|
Average Daily Rate |
|
|
|
|
|
|
|
|
|
|
|
|
|
|
|
|
|
|
|
|
|
Company Owned Hotels |
|
$ |
84.68 |
|
|
$ |
82.05 |
|
|
$ |
78.81 |
|
|
$ |
75.09 |
|
|
$ |
70.55 |
|
|
Franchised/Managed Hotels |
|
$ |
92.99 |
|
|
$ |
91.08 |
|
|
$ |
88.33 |
|
|
$ |
84.96 |
|
|
$ |
81.80 |
|
|
Total |
|
$ |
88.73 |
|
|
$ |
86.21 |
|
|
$ |
83.02 |
|
|
$ |
79.46 |
|
|
$ |
75.21 |
|
|
RevPAR |
|
|
|
|
|
|
|
|
|
|
|
|
|
|
|
|
|
|
|
|
|
Company Owned Hotels |
|
$ |
55.44 |
|
|
$ |
54.95 |
|
|
$ |
52.40 |
|
|
$ |
48.36 |
|
|
$ |
44.21 |
|
|
Franchised/Managed Hotels |
|
$ |
62.92 |
|
|
$ |
62.15 |
|
|
$ |
59.41 |
|
|
$ |
54.61 |
|
|
$ |
51.37 |
|
|
Total |
|
$ |
59.03 |
|
|
$ |
58.23 |
|
|
$ |
55.48 |
|
|
$ |
51.14 |
|
|
$ |
47.17 |
|
|
|
(1) |
This table treats the Previously Managed Portfolio as “Company Owned Hotels.” See “Basis of Presentation in this Annual Report on Form 10-K.” |
|
|
(2) |
During the second quarter of 2016, we converted all Mexico locations to the “LQ Hotel” trademark as the primary hotel identifier, with the “La Quinta” tag line. |
In addition, we have an active advisory Brand Council that includes both Company and franchisee representation and meets three to four times a year to discuss ways to strengthen our brand. Franchise representatives are elected from their geographical areas. Through the Brand Council, we often test new concepts at both owned and franchised hotels.
Our owned hotel operations
Centralized corporate services for our owned hotels include marketing, global and regional sales, revenue management, accounting, finance, treasury, tax, information systems, construction and design, purchasing, legal, risk management, human resources and training. During 2016, we reorganized our Owned Hotels leadership to include new levels of field leadership support to provide additional operational leadership to our general managers. These regional and district managers are responsible for the oversight of day-to-day owned hotel operations, on-site guest experience, and certain regional and local financial and other operational metrics for their assigned hotels and areas.
Each owned hotel is operated as an individual profit center, generally with an on-site general manager who oversees all day-to-day operations. Our general managers focus their attention on delivering our “Here For You” guest experience, maintaining clean and comfortable guest rooms and achieving profitable operations. Their responsibilities also include recruiting, training and supervising the hotel’s staff. A typical owned hotel has approximately 20 to 25 employees, including the general manager, housekeepers, laundry attendants, maintenance staff, front desk guest service representatives and a night auditor. We also utilize assistant managers to support the general managers at certain hotels, which provides a pool of experienced candidates to fill open general manager positions as needed.
7
Our general managers receive a comprehensive five-week training program through LQUniversity, our nationally recognized training and development program. Our team of trainers has both training and operational experience. LQUniversity offers comprehensive training solutions to enable our owned hotels to operate more successfully and deliver on our “Here For You” guest experience. Many of these same programs are made available to franchisees.
We use target-driven operational budgets, prepared by our general managers, that are deployed after review with our senior management. Under the direction of our revenue management team, the hotel general managers, field leadership team and senior management continually review our room rates and price rooms into the demand curve based on the prevailing market conditions at each owned hotel. Each general manager can earn financial incentives based upon achieving favorable results in comparison to revenue and profit targets and upon achieving targeted goals in their RevPAR Index and Net Promoter scores for their respective hotel. Our Net Promoter score, which measures a guest’s intent to recommend our brand, is calculated through guest satisfaction surveys that are conducted by an independent market research company. These surveys provide guest feedback on each of our hotels. Financial incentives reward our general managers for improvements in Net Promoter scores which are indicative of guest satisfaction levels. From time to time, we may adjust the labor model at specific hotels in order to help ensure consistent delivery of our guest experience. We believe this operating model and incentive program increase our general managers’ focus on operating efficient, well-maintained and profitable hotels and on delivering a “Here For You” guest experience.
Our franchising operations
Our franchising activities include franchising both newly constructed hotels and existing hotels converted to meet our brand standards. La Quinta Inn & Suites represents the current standard for La Quinta in the United States and Canada and has largely been the exclusive focus of franchise growth since 2007. Franchised hotels in Mexico, Central, and South America utilize the LQ Hotel primary trademark. As of December 31, 2016, there were 566 open and operating franchised La Quinta lodging facilities in the United States, Canada, Mexico, Honduras and Colombia and a pipeline of 248 locations, each represented by an executed franchise agreement. Twenty-eight of these properties are to be located in Mexico, Colombia, Nicaragua, Guatemala, Chile and El Salvador. The remaining properties are to be located throughout the United States, with 69 in Texas, 16 in Florida, 15 in California, 14 in New York, and the remaining 106 properties dispersed among 29 other states.
Franchising sales
We believe that hotel owners and operators choose to become a franchisee of a lodging brand based primarily on the perceived value and quality of that brand and the franchisor’s services, and the extent to which affiliation with that franchisor may increase the franchisee’s profitability. Because a significant portion of the costs of owning and operating a hotel are generally fixed, increases in revenues generated by affiliation with a franchise lodging chain can improve a hotel’s financial performance. We offer our franchisees our strong brand awareness supported by well-developed infrastructure that includes reservation, national advertising, training and systems-related services.
Franchising agreements and fees
A prospective franchisee is required to pay us a nonrefundable application fee of $5,000 when an application is made for a La Quinta franchise. We evaluate franchise applicants on the basis of their hotel operating experience and ability, financial resources strength and credit history, among other factors. Our current form of franchise agreement provides that approved franchise applicants will pay us an initial fee of $55,000, against which the application fee is credited, for up to 100 authorized guest rooms, plus $550 per guest room over 100. Historically, we have modified this initial fee to adapt to differing circumstances, such as the size and type of hotel facility, the location of the hotel site, and the experience and creditworthiness of the applicant. During our fiscal year ended December 31, 2016, franchisees were charged initial fees up to $59,400. For certain of these agreements, the Company determined that the circumstances warranted waiving the initial fee in its entirety. Additionally, a franchisee may expand the number of guest rooms in a hotel with our approval, which generally requires payment of the then-standard per room initial fee per guest room. A franchisee may also transfer ownership of a hotel with our approval, which may require payment of a transfer fee.
Approved franchise applicants are granted rights (subject to the terms of their franchise agreement) to operate their hotels under our trademarks and system, to obtain reservations through our central reservation system and to use our hotel designs, operating systems and procedures, among other rights. Our franchise agreements generally restrict our ability to open a new owned or franchised hotel in a limited area near the franchised hotel, which can range from several city blocks in an urban area to several square miles in less populated areas.
Our franchise agreements for existing franchised hotels in the United States generally require a franchisee to pay a royalty fee of 4.0% of gross room revenues (as defined in the franchise agreement) during the first two years of operating under our brand and 4.5% of gross room revenues for all periods thereafter. Our current form of franchise agreement for newly franchised hotels in the United States requires a franchisee to pay a royalty fee of 4.5% of gross room revenues during the first two years of operating under our brand
8
and 5.0% of gross room revenues for all periods thereafter. After the first two years, a U. S. franchisee can receive a rebate of 0.5% of gross room revenues if, in any calendar year, the franchised hotel achieves superior results in guest satisfaction as measured and defined by results of surveys conducted by an independent market research firm. However, our current form of franchise agreement for newly franchised hotels outside of the United States does not include a royalty fee ramp up or rebates for guest satisfaction results. In addition to royalty fees, a franchisee generally pays, as a percentage of gross room revenues, a marketing fee of 2.5% for brand advertising and other promotional efforts and a reservation fee of 2.0% to support the cost of reservation services provided to the hotels. Franchisees also pay us other fees, such as fees to participate in our online LQConnect intranet, computer related fees, attend training programs and participate in our La Quinta Returns program. We also provide franchisees the option to purchase revenue management services for their hotel, at fees ranging from $800 to $5,000 per month depending on the size of the hotel and services provided.
Our franchise agreements generally have an initial term of 20 years, and, as of December 31, 2016, the average remaining term of our existing franchise contracts for open locations was approximately 14 years. We, and the franchisee, generally have a right to terminate the agreement on the tenth and fifteenth anniversary of the opening date of the franchised hotel and, if the hotel was converted from a competing brand, additionally on the fifth such anniversary. The franchisee may also terminate the agreement if the hotel is not meeting predetermined occupancy levels, which may, under certain circumstances, require payment of specified termination fees to us. Additionally, we have the right to terminate a franchise agreement if a franchisee fails to meet our quality standards or fulfill other contractual obligations, which may, under certain circumstances, require payment by the franchisee of specified liquidated damages to us. Since the inception of our franchising program, excluding temporary franchised locations, we have retained approximately 82% of our franchise properties and the majority of the terminations were initiated by us. During the fiscal year ended December 31, 2016, 25 franchise agreements for open locations terminated. Seventeen of these terminations were initiated by us, seven were initiated by the franchisee, and one expired by its terms. In addition, we had four temporary franchise agreements that terminated. The temporary franchise agreements were provided to owners of disposition properties (who were given the option to continue using the La Quinta brand while they transitioned to a new brand) which expired by their terms or were mutually terminated.
Franchising operations support
As of December 31, 2016, the average size of our franchised hotels is approximately 81 rooms. Before a franchised hotel opens, we inspect the hotel to confirm that it meets our quality specifications. Once a franchised hotel opens, we strive to provide continued sales support and operational assistance. Each franchised hotel must adhere to rigorous brand standards of design, maintenance and guest service and is inspected periodically by a franchise service director to assure that the franchised hotel adheres to our brand standards. Competition for franchise agreements, however, may require us to reduce the level of hotel improvements required for a particular hotel.
Financial assistance and incentives to new franchisees
We do not presently have a company-funded financial assistance program for franchisees. However, on occasion we have provided, and at our discretion may occasionally provide in the future, franchisees with various forms of financial incentives or assistance upon varying terms, depending upon a number of factors. These factors include: the number of hotels involved and their locations, the number of rooms involved, relevant market conditions and other factors that may warrant providing financial incentives or assistance.
Our pipeline
As of December 31, 2016, we had a pipeline of 248 future franchised hotels, representing approximately 23,100 rooms. Each hotel in our pipeline is represented by an executed 20-year franchise agreement. Ninety percent of our pipeline represents new construction and the remaining 10% represents the conversion of an existing hotel into a La Quinta-branded hotel. As of December 31, 2016, approximately 29% of the new construction and conversion of hotels in our pipeline had commenced. However, based on historical experience, while converted hotels in our pipeline can generally become operational between 12 to 18 months from the date of execution of the franchise agreement, and newly constructed hotels in our pipeline can generally become operational between 36 to 48 months from the date of execution of the franchise agreement, openings may be delayed, or abandoned, due to economic conditions, weather, construction and permit delays and other factors. Moreover, the commitments of owners and developers with whom we have agreements are subject to numerous conditions, and the eventual development and construction of our pipeline not currently under construction is subject to numerous risks, including, in certain cases, the ability of the franchisee to obtain governmental and regulatory approvals and adequate financing.
Additionally, because revenues from franchised hotels are principally derived from franchise fees rather than room rentals, as we grow our system by increasing the number of franchised hotels, our revenues and expenses will increase at a significantly slower rate than if we were growing our system through an increase in number of owned hotels.
9
As of December 31, 2014, 2015 and 2016 our pipeline numbered 207, 228 and 248 future franchised hotels, respectively. The size of our pipeline is a function of both the number of new agreements signed and the pace of opening hotels in the pipeline and, accordingly, will fluctuate over time. Moreover, we periodically evaluate our pipeline to determine whether to terminate any contracts and/or seek new franchisees in any particular locations. We opened 23% of the hotels in our pipeline as of the end of 2014 in 2015 and 18% of the hotels in our pipeline as of the end of 2015 in 2016.
Our mission
We are guided by two primary goals that we believe contribute to a high level of employee and guest engagement:
1. Live our core values, which are defined by our people:
|
|
• |
People : People are the heart of everything we do. Make coming to work the best part of their day. Treat everyone with respect. |
|
|
• |
Passion : Approach each work day with a sense of ownership and personal pride. Always do “whatever it takes.” |
|
|
• |
Integrity : Always do the right thing, even when no one is watching. |
|
|
• |
Excellence : Do ordinary things extraordinarily well. Good is not good enough; strive for the best in all you do. |
|
|
• |
Unique : La Quinta is big but acts small. We are not afraid to be different. |
2. Delight our guests with an experience that makes them feel:
|
|
• |
Assured : Secure, confident they made the right choice with La Quinta. |
|
|
• |
Settled in : Comfortable, relaxed in their surroundings. |
|
|
• |
Optimistic : Ready to take on the new day—whatever it holds. |
Our two goals can be summarized using a single phrase—“Here For You.” It is not a program or a slogan, but a way of life at La Quinta that is built upon the purpose and core values that guide us. Our values are delivered by people who have a unique passion to enhance our guests’ experience and create enduring relationships by striving for excellence and serving with integrity every day. “Here For You” creates meaningful and differentiated experiences that are uniquely La Quinta and provides us with a powerful business advantage. “Here For You” provides valuable insight into not only what motivates our team members and drives them to perform and innovate; it also helps to inform our strategies through a better understanding of guest preferences which drives business results.
Our marketing operation
Brand marketing . We implement a brand marketing strategy by using consumer insight studies and guest feedback. Our strategy to reach and influence our marketplace is shaped by our goals to:
|
|
• |
drive brand awareness and perception that will generate first-time and repeat bookings and loyalty; |
|
|
• |
focus communications and media on the most relevant guest segment to increase revenue and penetration over our competitive market segment; |
|
|
• |
deliver on our distinctive positioning via break-through advertising; |
|
|
• |
create brand differentiation through guest insight and innovation; and |
|
|
• |
support and evolve our “Here For You” guest experience. |
The La Quinta brand is promoted through national, regional and local marketing. We advertise our brand on television through national cable and spot TV as well as national network radio, on the web through online advertising, social media, search marketing and email campaigns and in print through newspapers and magazines. We also conduct direct marketing to potential and former guests, including La Quinta Returns members. Our marketing is primarily supported through fee contributions, calculated as a percentage of gross room revenues, from our owned and franchised hotels to our marketing programs, including La Quinta Returns and the Brand Marketing Fund (“BMF”).
Our international marketing efforts are intended to reinforce general brand awareness while targeting local market needs. With eight hotels opened in Mexico, a portion of the fees paid to the BMF by Mexico franchisees will be devoted to a Mexico marketing program.
10
We have also launched a system-wide military initiative that supports hiring of military veterans, community outreach, franchise growth, sourcing and La Quinta Returns loyalty program tiers geared towards the military community.
La Quinta Returns. As of December 31, 2016, we had over 13 million members in our La Quinta Returns loyalty program, approximately three million of which we consider active members (which generally refers to our loyalty program members who earn or redeem La Quinta Returns points within the previous 18 months). We believe our loyalty program is favored by our members because of:
|
|
• |
rapid accumulation of rewards, including free nights at La Quinta locations, free nights at thousands of resort properties worldwide, airline miles and credits, magazine subscriptions, and gift cards from national restaurant chains and retailers; |
|
|
• |
rapid achievement of Gold and Elite status, after as few as 10 nights in a calendar year; |
|
|
• |
instant Gold status for military personnel and their families and for our La Quinta Returns Visa Card Holders; and |
|
|
• |
ability for Visa Card Holders to redeem their La Quinta Returns points anytime using their mobile phones for everyday purchases at over one million U.S. retail locations, including places like grocery stores, restaurants and coffee shops. |
Our Returns program helps expedite the reservation and check-in process and improves administrative efficiency of our reservation agents and front desk staff by providing a personal profile of each Returns member. This profile includes information such as email and mailing address and preferred method of payment that we use to market directly to Returns members.
Our sales operation
Sales. As of December 31, 2016, we employed a direct sales force consisting of approximately 70 professionals. The direct sales force consists of approximately 35 global sales managers, funded by the BMF, who call on Fortune 500 companies and mid-tier businesses to increase our corporate travel base. For the year ended December 31, 2016, corporate accounts, including government and military accounts, generated approximately 24% of system-wide consumed room revenues. These accounts typically have a significant number of travelers in the regions in which we operate and need a high volume of room-nights. Global sales managers also seek to increase room sales through inclusion in approved or preferred lodging lists of corporate travel managers and travel agencies operating on a national basis. We also maintain and continue to seek alliances with national travel and consumer organizations, such as AAA and AARP, and offer special rates or promotions to such organizations’ guests. In addition to the global effort, approximately 32 of our sales managers, funded by our owned hotels, are based in our regional markets. These regional sales managers call on local businesses, governmental agencies, hospitals and other organizations that can generate room-nights for our hotels.
The following graph reflects the percentage of comparable system-wide consumed room revenues that is attributable to each of our internal and external distribution channels in 2016.
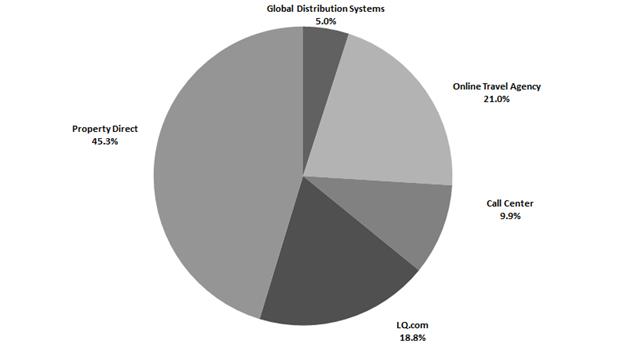
11
Property direct and call center. Property direct reservations are made by guests calling the property directly or “walking in” to the property without a previously made reservation. Our call center consists of our own central reservation system, as well as toll-free numbers to accept reservations. Our reservation system provides reservation agents with information about hotel locations, available rooms and prices in order to assist guests in reserving rooms. Our reservations agents are trained in telephone sales techniques. Through our computer network, we continually update the number of rooms sold at each hotel to maximize the sale of available rooms through either the individual hotel or the reservation center.
LQ internet & mobile (LQ.com). We provide guests with the ability to shop and reserve rooms on the Internet through our brand website, www.LQ.com, and through mobile via the La Quinta app and the LQ Instant Hold platform. The LQ Instant Hold feature (patent pending) permits our guests to use a mobile application to hold a room for up to four hours from any smart device by just entering a phone number. Our website and app provide guests with real-time information through hotel micro-sites that contain Trip Advisor scores, location, descriptions, amenities, special promotions, rates and availability for each La Quinta hotel. Hotel photographs are prominently displayed on the hotel information pages along with dynamic maps and driving directions, information on nearby attractions and local weather information. Multiple search options are offered, including searches by city, attraction, zip code and trip routing from origin or destination. Guests who book through www.LQ.com and our mobile site can also take advantage of our innovative and industry-leading Ready For YouTM option and receive a notice on their smart devices that their room is ready for check in.
Online travel agency and global distribution systems. In addition to our proprietary brand website, we distribute our lodging product via third party travel websites. We market our reservation services to both online and offline travel agents and corporate travel planners who may make reservations through global airline reservation distribution systems. We also have specialized reservation agents for large group sales, motor coach sales and special service bookings.
Our information systems
We have created an innovative technology deployment methodology that has enabled a collaborative environment where cross departmental business partners work very closely and effectively with technology teams and third parties to innovate, design and deploy technology-enabled improvements.
We employ an appropriate blend of in-house development of technology solutions and third-party best of breed software-as-a-service providers. We have also moved away from deployment of technology hosted at hotels and moved key systems such as hotel management systems, phone switches, back office, financials and HR functions to Cloud based environments, resulting in efficient and scalable IT operating and maintenance costs.
Our trademarks
All of the intellectual property used for La Quinta hotels is owned by La Quinta Worldwide, LLC, a wholly owned subsidiary of the Registrant. “La Quinta,” “LQ,” “Returns,” “LQ Hotel” and the sunburst Q symbol are our primary trademarks. Our primary trademarks and many secondary marks are registered in various combinations of word and logo marks with the U.S. Patent and Trademark Office (“USPTO”) and the trademark offices of various other countries for hotel and motel services and other trademark classes. In the United States, certain of our marks are subject to an agreement with the owner of a resort known as “La Quinta Resort & Club,” located in La Quinta, California. The agreement, among other things, geographically divides use of the trademark “La Quinta,” granting the resort owner the exclusive right to use the mark “La Quinta” in connection with facilities located within a 37 mile radius of the La Quinta Resort & Club, subject to certain exceptions, and the right to open three more facilities using certain of our marks, subject to certain exceptions, conditions and restrictions. As between the resort owner and us and our affiliates, we and our affiliates have the right to use the trademark in all other areas. The agreement is perpetual in duration.
Certain pending applications by us for registrations of variations of our primary marks, including certain logo forms, have been suspended by the USPTO pending resolution of litigation and related USPTO proceedings brought by us against the owners of a chain of hotels in Mexico called “Quinta Real.” After a trial on the merits in a federal court in Tucson in 2012, Quinta Real was generally prohibited from using the Quinta name to expand into the United States. The decision was appealed to the 9th Circuit U.S. Court of Appeals. In August 2014, the 9th Circuit U.S. Court of Appeals affirmed the finding of trademark infringement; however, the Court concluded that the district court did not provide a sufficient analysis balancing the equities in its decision to grant a permanent injunction and, therefore, remanded the case to district court for further analysis on that issue. The district court accepted additional evidence and legal arguments from the parties and in 2015 once again entered a permanent injunction in favor of La Quinta. Quinta Real appealed that decision. All briefs in the second appeal were filed and the 9th Circuit scheduled oral arguments in the case. Rather than proceed to oral argument, Quinta Real has dismissed its appeal and we have mutually dismissed the USPTO proceedings. The injunction has become permanent and we expect that the pending applications will ultimately proceed to registration.
We consider all of these trademarks and the associated name recognition to be important to our business.
12
Our employees
As a service-oriented business, our employees are important to our success. Recruiting for general managers and corporate office employees is coordinated through our corporate human resources department. All owned hotel employees, including hourly employees, receive training through LQUniversity when hired as well as ongoing training to improve their skills. Our online training system provides consistent and effective orientation, training and testing across our brand. Prior to assuming responsibility for a hotel, our general managers participate in a three-week training program that emphasizes operations, hospitality, rate management, legal and risk management issues, interviewing, employee relations, training and budgeting. Within 120 days of hire, new managers also attend a one-week training program which is conducted at the Company’s headquarters which is focused on reinforcing the core competencies of the position as well as delivering excellence in product and service quality.
We provide all of our full-time employees and their families, including hourly hotel employees, the opportunity to participate in a benefits package, which includes health, dental and vision coverage. We believe these benefits provide a competitive advantage in recruiting hourly hotel employees, as compared to competing select-service hotels. Our full-time employees are also able to earn financial incentives based on achieving targeted goals, such as RevPAR Index, profitability, Net Promoter scores and personal and departmental development goals. In addition, recognition programs have been established to acknowledge our employees’ outstanding service and achievement. We believe our scale and size also provide career opportunities for our employees to advance within the organization.
As of December 31, 2016, we employed 7,333 employees. Of these employees, 6,504 were full-time and 829 were part-time. Four hundred fifteen were employed as corporate associates and 6,918 were employed at our hotels. Our employees are not currently represented by labor unions, and we have never experienced an organized work stoppage. We believe that ongoing labor relations with our employees are good.
Competition
As of December 31, 2016 the U.S. hotel sector comprised approximately 54,580 hotels with approximately 5.1 million rooms. Of these rooms, approximately 70% were affiliated with a brand. The hotel industry is highly fragmented, with no one entity controlling a majority of hotel rooms in the U.S.
La Quinta is a select-service hotel brand that competes primarily against other select-service hotels in both the upper-midscale and the midscale segments, and we consider our main STR competitive set to be Comfort, Holiday Inn Express and Hampton. However, our owned and franchised hotels generally operate in markets that contain numerous competitors, including a wide range of lodging facilities offering full-service, select-service and all-suite lodging options. Hotels in other market segments, such as full-service hotels, may lower their rates to a level comparable to those of select-service hotels such as ours that, in turn, may further increase competitive pressure in our markets. Our owned and franchised hotels generally compete for guests on the basis of room rates, quality of accommodations, name recognition, service levels, convenience of locations and reward program offerings. We have also seen the emergence of a sharing economy with the increasing availability of online short term rentals. Additionally, an increasing supply of hotel rooms in La Quinta’s market segment, and consolidations in the lodging industry generally, have resulted in the creation of several large, multi-branded hotel chains with diversified operations and greater marketing and financial resources than we have, which has increased competition for guests in the markets in which our owned and franchised hotels operate.
We compete for franchise agreements based primarily on brand name recognition and reputation, the room rate that can be realized, royalty fees charged and other contract terms. Some of our competitors may have substantially greater marketing and financial resources, greater brand distribution and awareness and/or greater financial incentives than we do. Other competitive factors for franchise agreements include relationships with hotel owners and investors, including institutional owners of multiple hotels, availability and affordability of financing, marketing support, reservation and e-commerce system capacity and efficiency and the ability to make investments that may be necessary to obtain franchise agreements. The terms of our franchise agreements for each of our franchised hotels are also influenced by contract terms offered by our competitors, among other things. As a result, the terms of new franchise agreements in the future may not be as favorable as our existing franchise agreements. For example, competition may require us to reduce or change fee structures, make greater use of key money or provide other financial incentives such as loans and guarantees to franchisees and/or reduce the level of hotel improvements required to conform to brand standards. In addition, if the availability of suitable locations for new hotels decreases, planning or other local regulations change or the availability or affordability of financing is limited, the supply of suitable hotels for franchising could be diminished. Additionally, an excess supply of hotel rooms or unfavorable borrowing conditions may discourage potential franchisees from expanding or constructing new hotels, thereby limiting a source of growth of the franchise fees received by us. Our franchise agreements generally restrict our ability to open a new owned or franchised hotel in a limited area near the franchised hotel, which can range from several city blocks in an urban area to several square miles in less populated areas. If the hotels that we franchise perform less successfully than those of our competitors, if we are unable to offer terms as favorable as those offered by our competitors, or if the availability of suitable hotels is limited, our ability to compete effectively for new franchise agreements could be reduced.
13
We believe we compete effectively, and our competitive position is protected due to our strong brand, owner, operator and franchisor business model and experienced management team.
Seasonality and cyclicality
The hotel industry is seasonal in nature. Generally, our revenues are greater in the second and third quarters than in the first and fourth quarters. The timing of holidays can also impact our quarterly results. The periods during which our properties experience higher revenues vary from property to property and depend principally upon location. This seasonality can be expected to cause quarterly fluctuations in revenue, profit margins and net earnings. Additionally, our first or second quarter results may be further adversely affected by the timing of certain of our marketing production expenditures. Further, the timing of opening of newly constructed or franchised hotels and the timing of any hotel acquisitions or dispositions may cause a variation of revenue and earnings from quarter to quarter.
Environmental matters
We are subject to certain requirements and potential liabilities under various foreign, federal, state and local environmental, health and safety laws and regulations, and incur costs in complying with such requirements. These laws and regulations govern actions including air emissions, the use, storage and disposal of hazardous and toxic substances, and wastewater disposal. In addition to investigation and remediation liabilities that could arise under such laws, we may also face personal injury, property damage or other claims by third parties concerning environmental compliance or contamination. We use and store hazardous and toxic substances, such as cleaning materials, pool chemicals, heating oil and fuel for back-up generators at some of our facilities, and we generate certain wastes in connection with our operations. Some of our hotels include older buildings, and some may have, or may historically have had, dry-cleaning facilities and underground storage tanks for heating oil and back-up generators. We have from time to time been responsible for investigating and remediating contamination at some of our facilities, such as contamination that has been discovered when we have removed underground storage tanks, and we could be held responsible for any contamination resulting from the disposal of wastes that we generate, including at locations where such wastes have been sent for disposal. Some laws may regard us as having liability as an operator by virtue of how we may implement our franchise agreements, rendering us potentially responsible for addressing environmental or other conditions existing at our franchised hotels. In some cases, we may be entitled to indemnification from the party that caused the contamination, or pursuant to our franchise agreements, but there can be no assurance that we would be able to recover all or any costs we incur in addressing such problems. From time to time, we may be required to manage, abate, remove or contain mold, lead, asbestos-containing materials, radon gas or other hazardous conditions found in or on our hotels. We are required to have operations and maintenance plans that seek to identify and remediate these conditions as appropriate. Although we have incurred, and expect that we will continue to incur, costs relating to the investigation, identification and remediation of hazardous materials known or discovered to exist at our hotels, those costs have not had, and are not expected to have, a material adverse effect on our financial condition, results of operations or cash flow.
Regulation
The hotel industry is subject to extensive federal, state and local governmental regulations in the United States and the other countries in which our owned and franchised hotels operate, including those relating to building and zoning requirements and those relating to the preparation and sale of food. Hotels and their owners and operators are also subject to licensing and regulation by state and local departments relating to health, sanitation, fire and safety standards, and to laws governing their relationships with employees, including minimum wage requirements, overtime, working conditions and citizenship requirements. In connection with the continued operation or remodeling of certain of our hotels, we or our franchisees may be required to expend funds to meet federal, state and local regulations. Any failure to obtain or maintain any such licenses or any publicity resulting from actual or alleged violations of any such laws and regulations could have an adverse effect on our results of operations. Our franchisees are responsible for compliance with all laws and government regulations applicable to the hotels they own and operate. We believe that our businesses are conducted in substantial compliance with applicable laws and regulations.
The Federal Trade Commission (the “FTC”), various states and certain foreign jurisdictions (including Canada and Mexico) regulate the sale of franchises. The FTC and the foreign jurisdictions require franchisors to make extensive disclosure to prospective franchisees but do not require registration of the franchise offer. A number of U.S. states in which we offer franchises require both registration and disclosure in connection with franchise offers and sales. In addition, several states have “franchise relationship laws” that limit the ability of the franchisor to terminate franchise agreements or to withhold consent to the renewal or transfer of these agreements. While our franchising operations have not been materially adversely affected by such regulations, we cannot predict the effect of future regulation or legislation.
14
Insurance
We maintain insurance coverage for general liability, property, including business interruption, terrorism, workers’ compensation and other risks with respect to our business for all of our owned hotels. Our insurance provides coverage related to claims arising out of the operations of our hotels. Most of our insurance policies are written with self-insured retentions or deductibles that are common in the insurance market for similar risks. These policies provide coverage for claim amounts that exceed our self-insured retentions or deductibles, subject to the terms and limits of the policies.
For our franchised locations, our franchise agreements require the properties to be insured at coverage levels generally consistent with the coverage levels under our insurance programs, including liability, property coverage, business interruption coverage and workers’ compensation insurance. In addition, our franchise agreements typically include provisions requiring the owner of the property to indemnify us against losses arising from the design, development and operation of their hotels.
Corporate History and Structure
La Quinta Holdings Inc. was incorporated in Delaware on December 9, 2013. Through our predecessors, La Quinta was founded in San Antonio, Texas in 1968. From 1973 to January 2006, we operated as a public company. In January 2006, we were acquired by Blackstone. We completed our initial public offering in April 2014 and our common stock is listed on the New York Stock Exchange under the symbol “LQ”. Our principal executive offices are located at 909 Hidden Ridge, Suite 600, Irving, Texas 75038, and our telephone number is (214) 492-6600.
The simplified chart below summarizes our corporate structure.
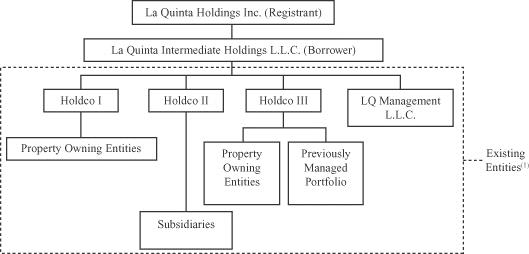
|
(1) |
All Existing Entities other than the Previously Managed Portfolio constituted the Predecessor Entities. |
Where You Can Find More Information
We file annual, quarterly and current reports, proxy statements and other information with the Securities and Exchange Commission (“SEC”). Our SEC filings are available to the public over the internet at the SEC’s website at http://www.sec.gov. Our SEC filings are also available on our website at http://www.lq.com as soon as reasonably practicable after they are filed with or furnished to the SEC. You may also read and copy any filed document at the SEC’s public reference room in Washington, D.C. at 100 F Street, N.E., Washington, D.C. 20549. Please call the SEC at 1-800-SEC-0330 for further information about public reference rooms. We will provide, without charge, to each person upon written or oral request of such person, a copy of this Annual Report on Form 10-K, including the financial statements and financial statement schedules included therein. You should direct requests for those documents to:
15
La Quinta Holdings Inc.
909 Hidden Ridge, Suite 600
Irving, Texas 75038
Attn: Investor Relations
Tel.: (214) 492-6600
Email: investor.relations@laquinta.com
We maintain an internet site at http://www.lq.com. From time to time, we may use our website as a distribution channel of material company information. Financial and other important information regarding us is routinely accessible through and posted on our website at www.lq.com/investorrelations. In addition, you may automatically receive email alerts and other information about us when you enroll your email address by visiting the Email Notification section at www.lq.com/investorrelations. Our website and the information contained on or connected to that site are not incorporated into this Annual Report on Form 10-K.
In addition to the other information in this Annual Report on Form 10-K, the following risk factors should be considered carefully in evaluating our company and our business. Any of the following risks could materially and adversely affect our business, financial condition and results of operations. Unless the context otherwise requires, references in this “Risk Factors” section to “our hotels,” “our rooms” and similar phrases refer to hotels that we own or franchise.
Risks related to our business and industry
We are subject to the business, financial and operating risks inherent to the hospitality industry, any of which could reduce profits and limit opportunities for growth.
Our business is subject to a number of business, financial and operating risks inherent to the hospitality industry, including:
|
|
• |
changes in operating costs, including energy, food, compensation, benefits, insurance and unanticipated costs resulting from force majeure events; |
|
|
• |
increases in costs due to inflation or other factors that may not be fully offset by price and fee increases in our business; |
|
|
• |
changes in taxes and governmental regulations that influence or set wages, prices, interest rates or construction and maintenance procedures and costs; |
|
|
• |
the costs and administrative burdens associated with complying with applicable laws and regulations; |
|
|
• |
the costs or desirability of complying with local practices and customs; |
|
|
• |
significant increases in cost for health care coverage for employees and potential government regulation with respect to health coverage, such as costs associated with the compliance of the requirements of the Patient Protection and Affordable Care Act; |
|
|
• |
shortages of labor or labor disruptions; |
|
|
• |
the availability and cost of capital necessary for us and our franchisees to fund investments, capital expenditures and service debt obligations; |
|
|
• |
delays in or cancellations of planned or future development or renovation projects; |
|
|
• |
the quality of services provided by franchisees; |
|
|
• |
the financial condition of franchisees; |
|
|
• |
relationships with franchisees, including the risk that our franchise agreements may be terminated early; |
|
|
• |
changes in desirability of particular geographic locations and shortages of desirable locations for development; |
|
|
• |
changes in lodging preferences and travel patterns of our guests and geographic concentration of our operations and guests; |
|
|
• |
changes in the supply and demand for hotel services; |
|
|
• |
foreign tax treaties, or lack thereof, with the United States; |
|
|
• |
foreign exchange rate fluctuations or restructurings; |
16
|
|
• |
decreased business travel as a result of improvements to the alternatives to in-person meetings, including virtual meetings hosted on-line or over private teleconferencing networks; and |
|
|
• |
the ability of third-party internet and other travel intermediaries to attract and retain guests. |
Any of these factors could limit or reduce the prices we and our franchisees are able to charge for rooms. These factors can also increase costs or affect the ability to develop new hotels or maintain and operate existing hotels. As a result, any of these factors can reduce our profits and limit opportunities for growth.
Macroeconomic and other factors beyond our control can adversely affect and reduce demand for rooms at hotels that we own or franchise.
Macroeconomic and other factors beyond our control can reduce demand for rooms at hotels that we own or franchise. These factors include, but are not limited to:
|
|
• |
changes in general economic conditions, including the severity and duration of any downturn in the U.S. or global economy and financial markets; |
|
|
• |
war, political conditions or civil unrest, violence or terrorist activities or threats and heightened travel security measures instituted in response to these events; |
|
|
• |
outbreaks of pandemic or contagious diseases, such as Zika virus, measles, Ebola, legionella bacteria, avian flu, severe acute respiratory syndrome (SARS) and H1N1 (swine flu); |
|
|
• |
natural or man-made disasters, such as earthquakes, tsunamis, tornadoes, hurricanes, typhoons, floods, oil spills and nuclear incidents; |
|
|
• |
decreased corporate or government travel-related budgets and spending and cancellations, deferrals or renegotiations of group business; |
|
|
• |
low consumer confidence, high levels of unemployment or depressed real estate prices; |
|
|
• |
the financial condition and general business condition of the airline, automotive and other transportation-related industries and its impact on travel; |
|
|
• |
decreased airline capacities and routes; |
|
|
• |
travel-related accidents; |
|
|
• |
oil prices and travel costs; |
|
|
• |
statements, actions or interventions by governmental officials related to travel and corporate travel-related activities and the resulting negative public perception of such travel and activities; |
|
|
• |
governmental action and legislation, as well as political debate, conflicts and compromises related to such actions, to the extent that they negatively impact the financial markets and consumer confidence and spending or adversely impact the U.S. economy or international travel; |
|
|
• |
climate change and resource scarcity, such as water and energy scarcity; |
|
|
• |
domestic and international political and geo-political conditions; and |
|
|
• |
cyclical over-building in the hotel and lodging industries. |
These factors, and the reputational repercussions of these factors, can adversely affect, and from time to time have adversely affected, individual hotels, particular regions and our business, financial condition and results of operations as a whole. Any one or more of these factors could limit or reduce the demand, or the rates that we are able to charge, for rooms. Declines in ADR and occupancy relating to declines in consumer demand will lower RevPAR and may adversely affect our business, financial condition and results of operations. In addition, these factors could increase our operating costs or affect our ability to develop or franchise new hotels or to maintain and operate our existing hotels.
Contraction in the global economy or low levels of economic growth could adversely affect our revenues and profitability as well as limit or slow our future growth.
Consumer demand for our rooms is closely linked to the performance of the general economy and is sensitive to business and personal discretionary spending levels. Decreased demand can be especially pronounced during periods of economic contraction or
17
low levels of economic growth, and the recovery period in our industry may lag overall economic improvement. Declines in consumer demand due to adverse general economic conditions could negatively impact our business by decreasing the revenues and profitability of our owned hotels and limiting the amount of franchising fee revenues we are able to generate from our franchised hotels. For example, for the year ended December 31, 2009, our revenues declined approximately $136 million, or 17%, from revenues of $816 million for the year December 31, 2008, and our Adjusted EBITDA declined approximately 30%. In addition, many of the expenses associated with our business, including personnel costs, interest, rent, property taxes, insurance and utilities, are relatively fixed. During a period of overall economic weakness, if we are unable to meaningfully decrease these costs as demand for our hotels decreases, our business operations and financial performance may be adversely affected.
Varying economic conditions in different regions of the world make it difficult to predict future profitability levels. Moreover, if economic weakness in the markets in which we operate were to occur, it could have an adverse impact on our revenues and negatively affect our profitability.
In addition to general economic conditions, new hotel room supply is an important factor that can affect the hospitality industry’s performance and overbuilding has the potential to further exacerbate the negative impact of an economic downturn. Room rates and occupancy, and thus RevPAR, tend to increase when demand growth exceeds supply growth. A reduction or slowdown in growth of lodging demand or increased growth in lodging supply could result in returns that are substantially below expectations or result in losses, which could materially and adversely affect our revenues and profitability as well as limit or slow future growth.
Our hotels are geographically concentrated, which exposes our business to the effects of regional events and occurrences.
We have a concentration of hotels in Texas, Florida and California. Specifically, as of December 31, 2016, approximately 41% of rooms in our system were located in Texas, Florida and California with approximately 24% of rooms in our system located in Texas. In addition, as of December 31, 2016, approximately 28% of our pipeline properties are to be located in Texas. The concentration of hotels in one region or a limited number of markets may expose us to risks of adverse economic developments that are greater than if our portfolio were more geographically diverse. These economic developments include regional economic downturns, significant increases in the number of our competitors’ hotels in these markets and potentially higher local property, sales and income taxes in the geographic markets in which we are concentrated. Given our concentration of hotels in Texas, the downturn in the oil and gas industry has significantly affected demand in certain markets in Texas such as Houston and South and West Texas, materially adversely affecting our business in those markets, and a further decline could further adversely affect our business in those markets. In addition, our hotels are subject to the effects of adverse acts of nature, such as winter storms, hurricanes, hail storms, strong winds, earthquakes and tornados, which have in the past caused damage such as flooding and other damage to our hotels in specific geographic locations, including in the Texas, Florida and California markets. Depending on the severity of these acts of nature, the damage to our hotels could require us to close all or substantially all of our hotels in one or more markets for a period of time while the necessary repairs and renovations, as applicable, are undertaken. Additionally, we cannot assure you that the amount of our hurricane, windstorm, earthquake, flood or other casualty insurance we maintain would entirely cover damages caused by any such event.
As a result of our geographic concentration of hotels, we will face a greater risk of a negative impact on our revenues in the event these areas are more severely impacted by adverse economic and competitive conditions and extreme weather than other areas in the United States.
Because we operate in a highly competitive industry, our revenues or profits could be harmed if we are unable to compete effectively.
Competition for hotel guests
The segments of the hotel industry in which we operate are subject to intense competition. La Quinta is a select-service hotel brand that competes primarily against other select-service hotels in both the upper-midscale and the midscale segments. However, our owned and franchised hotels generally operate in segments that contain numerous competitors, including a wide range of lodging facilities offering full-service, select-service and all-suite lodging options. Hotels in other market segments, such as full-service hotels, may lower their rates to a level comparable to those of select-service hotels such as ours that, in turn, may further increase competitive pressure in our segments. Our owned and franchised hotels generally compete for guests on the basis of room rates, quality of accommodations, name recognition, service levels, convenience of locations and reward program offerings. We have also seen the emergence of a sharing economy with the increasing availability of online short term rentals. Additionally, an increasing supply of hotel rooms in La Quinta’s market segments, and consolidations in the lodging industry generally, have resulted in the creation of several large, multi-branded hotel chains with diversified operations and greater marketing and financial resources than we have, which has increased competition for guests in the segments in which our owned and franchised hotels operate. If we are unable to compete successfully for hotel guests, our revenues or profits may decline.
18
Competition for franchise agreements
A primary component of our growth strategy entails increasing our system-wide portfolio of franchised hotels and further growing our franchise fee-based business. We compete for franchise agreements based primarily on brand name recognition and reputation, the room rate that can be realized, royalty fees charged and other contract terms. Some of our competitors may have substantially greater marketing and financial resources, greater brand distribution and awareness and/or offer greater financial incentives than we do. Other competitive factors for franchise agreements include relationships with hotel owners and investors, including institutional owners of multiple hotels, availability and affordability of financing, marketing support, reservation and e-commerce system capacity and efficiency and the ability to make investments that may be necessary to obtain franchise agreements. The terms of our franchise agreements for each of our franchised hotels are also influenced by contract terms offered by our competitors, among other things. As a result, the terms of new franchise agreements in the future may not be as favorable as our current franchise agreements. For example, competition may require us to reduce or change fee structures, make greater use of key money or provide other financial incentives such as loans and guarantees to franchisees and/or reduce the level of hotel improvements required to conform to brand standards. In addition, if the availability of suitable locations for new hotels decreases, planning or other local regulations change or the availability or affordability of financing is limited, the supply of suitable hotels for franchising could be diminished. Additionally, an excess supply of hotel rooms or unfavorable borrowing conditions may discourage potential franchisees from expanding or constructing new hotels, thereby limiting a source of growth of the franchise fees received by us. Our franchise agreements generally restrict our ability to open a new owned or franchised hotel in a limited area near the franchised hotel, which can range from several city blocks in an urban area to several square miles in less populated areas. We may be prohibited from franchising or owning hotels in areas where opportunities exist due to these restrictions. If the hotels that we franchise perform less successfully than those of our competitors, if we are unable to offer terms as favorable as those offered by our competitors, or if the availability of suitable hotels is limited, our ability to compete effectively for new franchise agreements could be reduced. If we are unable to compete successfully for franchisees, our revenues or profits may decline.
Any deterioration in the quality or reputation of our brand could have an adverse impact on our reputation, business, financial condition or results of operations.
Our brand and our reputation are among our most important assets. The success of our hotel business and our ability to attract and retain guests and franchise partners depends on brand recognition and reputation, including the consistency of our brand experience amongst our portfolio of hotels. Such dependence makes our hotel business susceptible to reputational damage and to competition from other hotel management and franchise companies. Additionally, for our franchised hotels, the continued success of a hotel owner’s business and its ability to make payments to us for our services may directly depend on the strength and reputation of our franchised hotels and our brand. We cannot assure you that the prior performance of our owned or franchised hotels will be indicative of future results or that competition from other brands will not adversely affect our market position or financial performance.
In addition, the brand recognition and support that provide much of the basis for the successful operation of our owned hotels and our franchise business can also mean that changes or problems with La Quinta (e.g., changes in ownership or management or management practices, or acts or omissions that adversely affect our business), or within our hotel business or at other locations (e.g., crime, scandal, litigation, negative publicity, catastrophic fires or similar events or accidents and injuries or other harm to our guests or our team members) can have a substantial negative impact on the operations of otherwise successful individual locations, and can cause a loss of consumer confidence in La Quinta and other hotels in our segment. Adverse incidents have occurred in the past and may occur in the future. The considerable expansion in the use of social media over recent years has compounded the potential scope of the negative publicity that could be generated by such incidents. We could also face legal claims and adverse publicity from a variety of events or conditions, many of which are beyond our control. If the reputation or perceived quality of our brand declines, our reputation, business, financial condition or results of operations could be adversely affected.
Some of our existing development pipeline may not be developed into La Quinta hotels, which could adversely affect our growth prospects.
As of December 31, 2016, we had a total of 248 franchised hotels in our pipeline, each of which is represented by an executed 20-year franchise agreement. Approximately 90% of the pipeline represents new construction, rather than the conversion of an existing hotel, and, as of December 31, 2016, approximately 29% of the conversions and new construction has commenced. The commitments of owners and developers with whom we have agreements are subject to numerous conditions, and the eventual development and construction of our pipeline not currently under construction is subject to numerous risks, including, in certain cases, the ability of the franchisee to obtain governmental and regulatory approvals and adequate financing. As a result, we cannot assure you that our entire pipeline will develop into new hotels. Any of these risks could have an adverse impact on the growth of our business and future operating results.
19
Our efforts to renovate, redevelop or develop our hotels could be delayed or become more expensive, which could reduce profits or impair our ability to compete effectively.
We must maintain and renovate our hotels to remain competitive, maintain the value and brand standards of these hotels and comply with applicable laws and regulations. From time to time, we evaluate our hotels to determine whether additional capital expenditures are required and will provide an acceptable return on investment. For example, in 2016 we undertook a review of our owned hotel portfolio to identify properties that, with the appropriate scope of capital investment and renovation, we believe have the opportunity to re-position within a market, capturing occupancy and additional rate while being measured against new, higher-quality competitive sets. As a result of this review, we identified approximately 50 owned hotels on which we expect to make additional capital expenditures and we may identify additional hotels as part of our on-going review.
Our strategy includes maintenance and renovation of our hotels and may include redevelopment, development and conversion of hotels, which is subject to a number of risks, including:
|
|
• |
the inability to obtain financing upon favorable terms or at all; |
|
|
• |
construction delays or cost overruns (including labor and materials) that may increase project costs; |
|
|
• |
lack of availability of rooms for revenue-generating activities during construction, modernization or renovation projects; |
|
|
• |
changes in economic conditions that may result in weakened or lack of demand for improvements that we make or negative project returns for improvements that we make; |
|
|
• |
the inability to find appropriate, strategically located hotels at commercially reasonable prices; |
|
|
• |
obtaining zoning, occupancy, and other required permits or authorizations; |
|
|
• |
governmental restrictions on the size or kind of development; |
|
|
• |
force majeure events, including earthquakes, tornadoes, hurricanes, floods or tsunamis, or acts of terrorism; and |
|
|
• |
design defects that could increase costs. |
Furthermore, we generally rely heavily on local contractors, who may be inadequately capitalized or understaffed. The inability or failure of one or more local contractors to perform its obligations may result in construction or remodeling delays, increased costs and loss of revenues. As a result, we may not increase our revenues or generate expected profits and cash flows from the renovation, redevelopment or development of hotels.
If we are not able to begin operating hotels under renovation or development as scheduled, or if renovation investments adversely affect or fail to improve performance, our ability to compete effectively could be diminished and revenues could be reduced. Further, due to the lengthy development cycle, adverse economic conditions may alter or impede our development plans, thereby resulting in incremental costs to us or potential impairment charges. If the cost of funding these renovations or developments exceeds budgeted amounts, profits could be reduced. Moreover, during the early stages of operations, charges related to interest expense and depreciation may substantially detract from, or even outweigh, the profitability of certain new hotel investments.
The hospitality industry is subject to seasonal and cyclical volatility, which may contribute to fluctuations in our financial condition and results of operations.
The hospitality industry is seasonal in nature. The periods during which our hotels experience higher revenues vary from hotel to hotel, depending principally upon location. Generally, our hotel revenues are greater in the second and third quarters than in the first and fourth quarters. The timing of holidays can also impact our quarterly results. This seasonality can be expected to cause quarterly fluctuations in revenue, profit margins and net earnings. Additionally, our quarterly results may be further affected by the timing of certain of our marketing production expenditures. In addition, the opening of newly constructed or franchised hotels and the timing of any hotel acquisitions or dispositions may cause a variation of revenue from quarter to quarter. The seasonality and cyclicality of our industry may contribute to fluctuations in our financial condition and results of operations.
Our business is capital intensive and our failure or the failure of our franchisees to make necessary investments could adversely affect the quality and reputation of our brand.
The hotels in our owned portfolio have an average age of 28 years, and the hotels in our franchise portfolio have an average age of 14 years. For our owned and franchised hotels to remain attractive and competitive, we and the owners of our franchised hotels have to make periodic investments to keep the hotels well maintained, modernized and refurbished. This creates an ongoing need for capital. We and the owners of our franchised hotels may be unable to access capital or unwilling to spend available capital when necessary, even if required by the terms of our franchise agreements. To the extent that owners of franchised hotels and we cannot
20
fund expenditures from cash generated by the operation of the hotels, funds must be borrowed or otherwise obtained, which may be difficult to obtain. Failure to make the investments necessary to maintain or improve hotels, act in accordance with applicable brand standards or project a consistent brand image could adversely affect the quality and reputation of our brand.
If our franchisees are unable to access the capital necessary to implement plans for growth, including our existing pipeline, our revenues may be reduced and our ability to compete effectively may be diminished.
Our franchisees depend on capital to buy and develop new franchised hotels, and our franchisees may be unable to access capital as expected. The availability of funds for development depends in large measure on capital markets and liquidity factors. Instability in the worldwide financial markets and the contraction of available liquidity may constrain the capital markets for hotel and real estate investments. As a result, while lenders have shown willingness to work with borrowers to extend relief in the short to medium term, many current and prospective hotel owners may struggle to find new hotel financing on commercially viable terms. The inability of our existing or future franchisees’ to obtain adequate funding could result in the decrease, delay or stoppage of development of new franchised hotels, including our existing pipeline.
If we are unable to maintain good relationships with our franchisees, revenues could decrease and we may be unable to expand our presence.
As of December 31, 2016, approximately 64% of our hotels were operated as franchised hotels. Our franchisees pay us a franchise fee and certain other fees pursuant to our franchise agreements. The viability of the franchising business depends on our ability to establish and maintain good relationships with our franchisees. Franchisees are focused on maximizing the value of their investment and working with a franchisor that can help them be successful in the ownership of their respective hotel investments. The value of our brand and the rapport that we maintain with our franchisees affect renewals of existing agreements and are important factors for potential franchisees considering doing business with us. Our relationships with franchisees generate additional hotel development opportunities that support growth. If we are unable to maintain good relationships with franchisees, we may be unable to renew existing franchise agreements or expand relationships with them. Additionally, opportunities for developing new relationships with additional franchisees may be adversely affected. This, in turn, could have an adverse effect on our results of operations and our ability to execute our growth strategy.
Franchise agreement standards are important to protecting our brand reputation and perception, and if our franchisees fail to make investments necessary to maintain or improve their hotels, guest preference for the La Quinta brand and reputation could suffer or the franchise agreements with those parties could terminate.
Substantially all of our franchise agreements require our franchisees to comply with standards that are essential to maintaining brand integrity and reputation and protecting the quality guests ascribe to the La Quinta brand. We depend on our franchisees to comply with these requirements by maintaining and improving hotels through investments, including investments in furniture, fixtures, equipment, amenities, personnel and branding elements.
Franchisees may be unable to access capital or unwilling to spend available capital when necessary, even if required by the terms of their agreements with us. If our franchisees fail to make investments necessary to maintain or improve the hotels that we franchise, guest preference for our brand and our reputation could suffer. Moreover, our franchisees may be unwilling or unable to incur the cost of complying with brand standards as brand standards may evolve from time to time. In addition, if our franchisees breach the terms of their agreements with us, we may elect to exercise our termination rights, which would eliminate revenues from these hotels and cause us to incur expenses related to terminating these relationships. We may be unable to find suitable or offsetting replacements for any terminated relationships. These risks become more pronounced during economic downturns.
Contractual and other disagreements with franchisees could make us liable to them or result in litigation costs or other expenses.
Our franchise agreements require us and our franchisees to comply with operational and performance conditions that are subject to interpretation and could result in disagreements. At any given time, we may be in disputes with one or more of our franchisees. Any dispute we have with our franchisees could result in arbitration or litigation, which could be very expensive for us even if the outcome is ultimately in our favor. We cannot predict the outcome of any such arbitration or litigation, the effect of any adverse judgment against us or the amount of any settlement that we may enter into with any franchisee. An adverse result in any such proceeding could adversely impact our results of operations and prospects.
21
If our franchise agreements terminate prematurely or expire in accordance with their terms, our revenues could decrease and our costs could increase.
Our franchise agreements may be terminated, renegotiated or expire, but typically have an initial term of 20 years. The continuation of a franchise agreement is subject to the franchisee adhering to certain standards and other applicable terms and conditions (including the obligation to pay certain fees to us). While our franchise agreements generally provide for liquidated damages to be paid to us by franchisees whose agreements have been terminated as the result of a violation of the provisions of the agreement, these damage amounts are typically less than the fees we would have received if the terminated franchisee fulfilled its contractual obligations.
Our franchise agreements also typically contain provisions permitting either party to terminate the franchise agreement after five, ten or fifteen years under certain circumstances without payment of damages. These agreements also provide early termination rights to the franchisees upon the failure to meet a specified performance test, which is typically based on the hotel’s occupancy rates. Franchisees also may attempt to terminate franchise agreements with us prior to their scheduled expiration date. If that happens, we may have difficulty recovering any resulting damages from the owner or replacing the revenues lost as a result of the termination. In addition, if a franchisee files for bankruptcy or goes into receivership, our franchise agreements may be terminable under applicable law.
If any of our franchise agreements are terminated or expire, we cannot assure you that we can obtain new or replacement franchise agreements at the same time that those other agreements are terminated or expire. As a result, we could lose the revenues we derive from that agreement or incur costs related to ending our relationship with the franchisee.
Deterioration in the general financial condition of our franchisees may adversely affect our results.
Our operating results are impacted by the ability of our franchisees to generate revenues at hotels they franchise from us. Our franchisees compete for guests with other hotels in their geographic markets. Some of their competitors may have substantially greater marketing and financial resources than our franchisees, and they may construct new hotels or improve their existing hotels, reduce their prices or expand and improve their marketing programs in ways that adversely affect our franchisees’ operating results and financial condition. In addition, the ability of our franchisees to compete for guests directly impacts the desirability of our brand to current and prospective franchisees.
These factors, among others, could adversely affect the operating results and financial condition of our franchisees. This could result in the financial failure of our franchise owners and result in a termination of the franchisee for non-payment of franchise fees and/or declines in franchise fees and other revenues derived from our franchising business.
If our franchisees are unable to repay or refinance loans secured by the mortgaged hotels, our revenues, profits and capital resources could be reduced and our business could be harmed.
Many of the hotels owned by our franchisees are pledged as collateral for mortgage loans entered into when such hotels were purchased or refinanced by them. If our franchisees are unable to repay or refinance maturing indebtedness on favorable terms or at all, the lenders could declare a default, accelerate the related debt and repossess the hotel. Debt defaults could lead franchisees to sell the hotel on unfavorable terms or to convey the mortgaged hotels to the lender. Any such sale or conveyance could, in certain cases, result in the termination of our franchise agreements or eliminate any anticipated income and cash flows from such hotel, which could negatively affect our business and results of operations.
We are exposed to the risks resulting from significant investments in owned real estate, which could increase our costs, reduce our profits and limit our ability to respond to market conditions.
Real estate ownership is subject to risks not applicable to franchised and managed hotels, including:
|
|
• |
governmental regulations relating to real estate ownership or operations, including tax, environmental, zoning and eminent domain laws; |
|
|
• |
loss in value or functionality, or unanticipated liabilities, due to environmental conditions, governmental takings, uninsured casualties or restrictive changes in zoning and similar land use laws and regulations or in health, safety and environmental laws, rules and regulations and other governmental and regulatory action; |
|
|
• |
changes in tax laws and property taxes, even if the hotel level cash flows remain the same or decrease; |
|
|
• |
increased potential civil liability for accidents or other occurrences on owned hotels; |
|
|
• |
the ongoing need for owner funded capital improvements and expenditures to maintain or upgrade hotels; |
22
|
|
• |
periodic total or partial closures due to renovations and hotel improvements; |
|
|
• |
risks associated with mortgage debt, including the possibility of default, fluctuating interest rate levels and uncertainties in the availability of replacement financing; |
|
|
• |
risks associated with the possibility that cost increases will outpace revenue increases and that in the event of an economic slowdown, the high proportion of fixed costs will make it difficult to reduce costs to the extent required to offset declining revenues; |
|
|
• |
acts of God, including earthquakes, hurricanes, floods, winter storms and other natural disasters (that may result in uninsured losses); |
|
|
• |
fluctuations in real estate values or potential impairments in the value of our assets; |
|
|
• |
maintaining tenants for leased properties; and |
|
|
• |
contingent liabilities that exist after we have exited a property. |
Additionally, real estate investments are relatively illiquid and, therefore, cannot be purchased or sold rapidly in response to changes in economic or other conditions. Buyers may not be identified quickly or be able to secure suitable financing to consummate a transaction or we may not be able to sell hotels on terms favorable to us. Furthermore, sales of certain appreciated hotels could generate material adverse tax consequences, which may affect our ability to sell hotels in response to market conditions and adversely affect our ability to generate cash flows.
Any of the forgoing risks could increase our costs, reduce our profits and limit our ability to respond to market conditions.
Changes in local market or neighborhood conditions may diminish the value of real property.
Hotels may be difficult to convert to other uses if changes in market conditions or in the area in which the hotel is located make hotel use unattractive for any reason. In such cases, large capital investments in real estate may prove difficult to recover. Hotels may be completely undamaged, but may lose significant value that cannot be recovered through insurance or operational changes because of disasters occurring nearby.
The negative impact on profitability and cash flow generation from a decline in revenues is more pronounced in owned hotels because we, as the owner, bear the risk of their high fixed-cost structure. The need to maintain and renovate owned hotels can present challenges, especially when cash generated from operations has declined due to decreased revenues or increased costs, or when government regulations or other factors require expenditures on property improvements that cannot be recovered through rate increases. The effectiveness of any cost-cutting efforts is limited by the fixed-cost nature of our business. As a result, we may not be able to offset revenue reductions through cost cutting, which could further reduce our margins. Further, during times of economic distress, declining demand and declining earnings often result in declining asset values.
In an unfavorable market, we may not be able to sell hotels in the short term. Accordingly, we may not be able to adjust our portfolio promptly in response to economic or other conditions. Similarly, unfavorable markets may make it difficult to refinance mortgage debt as it comes due.
Failure to keep pace with developments in technology could adversely affect our operations or competitive position.
The hospitality industry demands the use of sophisticated technology and systems for hotel management, brand assurance and compliance, procurement, reservation systems, operation of our loyalty program, distribution of hotel resources to current and future guests and guest amenities. These technologies require refinements, including compliance with privacy regulations and requirements of third parties such as the payment card industry. The development and maintenance of these technologies may require significant capital. We cannot assure you that as various systems and technologies become outdated or new technology is required, we will be able to replace or introduce them as quickly as our competition or in a cost-effective and timely manner. We also cannot assure you that we will achieve the benefits we may have been anticipating from any new technology or system.
23
Failures in, material damage to, or interruptions in our information technology systems, software or websites, including as a result of cyber-attacks, and difficulties in updating our existing software or developing or implementing new software could have a material adverse effect on our business or results of operations.
We depend heavily upon our information technology systems in the conduct of our business. For example, we own, license or otherwise contract for sophisticated technology and systems for hotel management, procurement, reservations, phone switches and the operation of our Returns program. Those systems are subject to damage or interruption from power outages, computer and telecommunications failures, computer viruses, security breaches and natural and manmade disasters. In particular, from time to time we and third parties who serve us experience cyber-attacks, attempted breaches of our or their information technology systems and networks or similar events, which could result in a loss of sensitive business or customer information, systems interruption or the disruption of our operations. The techniques that are used to obtain unauthorized access, disable or degrade service or sabotage systems change frequently and may be difficult to detect for long periods of time, and accordingly we may be unable to anticipate and prevent all data security incidents. We may be required to expend capital and other resources to protect against such security breaches or cyber-attacks or to alleviate problems caused by such breaches or attacks. While we maintain cyber liability insurance that provides liability and insurance coverages, subject to limitations and conditions of the policies, our insurance may not be sufficient to protect against all losses or costs related to any future breaches of our systems.
Damage or interruption to our information systems may require a significant investment to fix or replace them, and we may suffer interruptions in our operations in the interim. In addition, costs and potential problems and interruptions associated with the implementation of new or upgraded systems and technology or with maintenance or adequate support of existing systems could also disrupt or reduce the efficiency of our operations. Any material interruptions or failures in our systems, including those that may result from our failure to adequately develop, implement and maintain a robust disaster recovery plan and backup systems could severely affect our ability to conduct normal business operations and, as a result, may have a material adverse effect on our business or results of operations.
We are vulnerable to various risks and uncertainties associated with our website, including changes in required technology interfaces, website downtime and other technical failures, costs and technical issues as we upgrade our website software, computer viruses, changes in applicable federal and state regulation, security breaches, legal claims related to our website operations and e-commerce fulfillment and other consumer privacy concerns. Our failure to successfully respond to these risks and uncertainties could reduce website sales and have a material adverse effect on our business or results of operations.
Failure of third party technology providers or vendors to provide services and technology in a satisfactory manner could adversely affect our business.
We rely on third parties for the performance of a significant portion of our information technology functions worldwide and the provision of information technology and business process services. The success of our business depends in part on maintaining our relationships with these third parties and their continuing ability to perform these functions and services in a timely and satisfactory manner. If we experience a loss or disruption in the provision of any of these functions or services, or they are not performed in a satisfactory manner, we may have difficulty in finding alternate providers on terms favorable to us, in a timely manner or at all, and our business could be adversely affected.
We rely on certain software vendors to maintain and periodically upgrade many of our information technology systems so that they can continue to support our business. The software programs supporting many of our systems were licensed to us by independent software developers. The inability of these developers or us to continue to maintain and upgrade these information systems and software programs would disrupt or reduce the efficiency of our operations if we were unable to convert to alternate systems in an efficient and timely manner.
We may be exposed to risks and costs associated with protecting the integrity and security of our guests’ personal information.
We are subject to various risks associated with the collection, handling, storage and transmission of sensitive information, including risks related to compliance with U.S. and foreign data collection and privacy laws and other contractual obligations, as well as the risk that our systems collecting such information could be compromised. We collect and maintain information relating to our employees and guests for various business purposes, including managing our workforce and marketing and promotion purposes of our hotel business. Our various information technology systems enter, process, summarize and report such data, including credit card numbers and other personally identifiable information. A significant number of guest purchases are made using credit cards. Additionally, as of December 31, 2016, approximately 18.8% of our guest reservations are placed through our website, including through mobile devices and those reservations made via LQ Instant Hold. In order for our business to function successfully, we must be able to handle and transmit confidential information, including credit card information, securely.
24
Privacy regulation is an evolving area in which different jurisdictions may subject us to increasingly demanding or inconsistent compliance requirements. Compliance with applicable privacy laws, regulations and policies may increase our operating costs and/or adversely affect our ability to service hotel guests and market our products, hotels and services to hotel guests. In addition, our failure to comply with applicable privacy laws and regulations, with our own privacy policies or with third-party requirements (or in some circumstances non-compliance by third parties engaged by us), or a breach of security in which personal data are compromised, could result in fines, litigation, adverse reputation impacts, remedial and other expenses, criminal sanctions, or restrictions on the use or transfer of data, which could adversely affect our business. We cannot assure you that our business will always be conducted in compliance with these laws, regulations and policies.
Even if we are fully compliant with such legal standards, we may not be able to prevent security breaches involving guest transaction data and identity theft. In addition, efforts to hack or breach security measures, failures of systems or software to operate as designed or intended, viruses, operator error, or inadvertent releases of data all threaten our information systems and records. Our reliance on computer, Internet-based and mobile systems and communications and the frequency and sophistication of efforts by hackers to gain unauthorized access to such systems have increased in recent years. Any breach, theft, loss, or fraudulent use of guest, employee or Company data could cause consumers to lose confidence in the security of our website and choose not to purchase from us. If a computer hacker or other criminal is able to circumvent our security measures, he or she could destroy or steal valuable information or disrupt our operations. Any security breach could expose us to risks of data loss, litigation and action for damage and could seriously disrupt our operations and harm our reputation, any of which could adversely affect our business.
Failure to comply with marketing and advertising laws, including with regard to direct marketing, could result in fines or place restrictions on our business.
We rely on a variety of direct marketing techniques, including telemarketing, email and social media marketing and postal mailings. Any further restrictions in laws and court or agency interpretation of such laws, such as the Telephone Consumer Protection Act of 1991, the Telemarketing Sales Rule, CAN-SPAM Act of 2003, and various U.S. state laws, or new federal laws, regarding marketing and solicitation or international data protection laws that govern these activities could adversely affect current or planned marketing activities and could force further changes in our marketing strategy. If this occurs, we may not be able to develop adequate alternative marketing strategies. We also obtain access to potential guests from travel service providers or other companies with whom we have substantial relationships. We market to some individuals on these lists directly or through other companies’ marketing materials. If access to these lists was prohibited or otherwise restricted, our ability to develop new guests, and introduce them to our hotels could be impaired.
The growth of internet reservation channels could adversely affect our business and profitability.
A significant percentage of hotel rooms for individual guests is booked through internet travel intermediaries. We contract with such intermediaries and pay them various commissions and transaction fees for sales of our rooms through their system. Search engines and peer-to-peer inventory sources also provide online travel sources that compete with our business. Recently, bookings through internet travel intermediaries have been increasing. In 2015, such bookings represented 18.3% of our total bookings. In 2016, such bookings represented 21.0% of our total bookings. As such bookings increase, these intermediaries may be able to obtain higher commissions, reduced room rates or other significant contract concessions from us or our franchisees. These hospitality intermediaries also may reduce these bookings by de-ranking our hotels in search results on their platforms, and other online providers may divert business away from our hotels. Although our agreements with many hospitality intermediaries limit transaction fees for our hotels, there can be no assurance that we will be able to renegotiate these agreements upon their expiration with terms as favorable as the provisions that existed before the expiration, replacement or renegotiation. Moreover, hospitality intermediaries generally employ aggressive marketing strategies, including expending significant resources for online and television advertising campaigns to drive consumers to their websites. Further, some of these internet travel intermediaries are attempting to commoditize hotel rooms by increasing the importance of price and general indicators of quality at the expense of brand identification.
Consumers may develop brand loyalties to the intermediaries’ websites and reservations systems rather than to the La Quinta brand. If this happens, our business and profitability may be significantly harmed as shifting guest loyalties divert bookings away from our websites, or as the fees charged by third-party websites increase the overall cost of internet bookings for our hotels. Consolidation of internet travel intermediaries, and the entry of major internet companies into the internet travel bookings business, also could divert bookings away from our website and increase our hotels’ cost of sales.
In addition, recent class action litigation against several online travel intermediaries and lodging companies challenges the legality under antitrust law of certain provisions in contracts with third party intermediaries. While the travel intermediaries and lodging companies are vigorously defending this litigation and believe the contract provisions are lawful, the courts will ultimately determine this issue and an adverse outcome could force hotel companies, including us, to alter their business arrangements with these third parties which could have a negative impact on our financial condition and results of operations.
25
Our reservation system is an important component of the La Quinta brand and a disruption to its functioning could have an adverse effect on our hotels.
We license software from unaffiliated third parties for the La Quinta hotels reservation system. Losing these licenses may adversely affect our ability to maintain a technically adequate reservations system, which, in the absence of suitable alternatives, would inhibit our ability to conduct our business (including our ability to attract and retain franchise arrangements) and, ultimately, diminish our ability to generate revenue.
We manage a reservation system that communicates reservations to our owned and franchised hotels that have been made by individuals directly, either online or by telephone to our call centers or through devices via our mobile applications, or through intermediaries like travel agents, internet travel web sites and other distribution channels. The cost, speed, efficacy and efficiency of the reservation system, as well as protection of personal or confidential information of its users, are important aspects of the business and are major considerations of franchisees in choosing to affiliate with the La Quinta brand. Any degradation of, failure of adequate development relative to, or security breach of, our reservation system may adversely affect our business.
Our reservation system relies on data communications networks operated by unaffiliated third parties. Any significant interruption of the function of our reservation system (or significant parts of our reservation system) may adversely affect our business as well as our ability to generate revenues.
The cessation, reduction or taxation of program benefits of our Returns loyalty program could adversely affect the La Quinta brand and guest loyalty.
We manage the Returns program for the La Quinta brand. Our owned and franchised hotels contribute a percentage of the guest’s room rate per night to the program for each hotel stay of a Returns program member. We arrange with service providers such as airlines to exchange monetary value represented by points for program awards and we may charge a license fee to such service providers for use of the La Quinta brand trademarks. Returns program members accumulate points based on eligible stays and hotel charges and redeem the points for a range of benefits, including free rooms, airline miles and other items of value. The Returns program is an important aspect of our business and of the affiliation value for hotel owners under franchise agreements. Currently, the program benefits are not taxed as income to members. If the program awards and benefits are materially altered, curtailed or taxed and, as a result, a material number of Returns members choose to stay at non-La Quinta-branded hotels, our business could be adversely affected.
Any failure to protect our trademarks and other intellectual property could reduce the value of our brand and harm our business.
The recognition and reputation of our brand are important to our success. We rely on trademark laws to protect our proprietary rights. The success of our business depends in part upon our continued ability to use our trademarks to increase brand awareness and further develop our brand in both domestic and international markets. From time to time, we apply to have certain trademarks registered; however, we cannot assure you that those trademark or other intellectual property registrations will be granted or that the steps we take to use, control or protect our trademarks or other intellectual property in the United States and other jurisdictions will always be adequate to prevent third parties, including former employees, from copying or using the trademarks or other intellectual property without authorization or in a manner where authorization may not be required. We may also fail to obtain and maintain trademark protection for our brand in all jurisdictions. For example, in certain jurisdictions, third parties have registered or otherwise have the right to use certain trademarks that are the same as or similar to our trademarks, which could prevent us from registering trademarks and opening hotels in that jurisdiction. In addition, “la quinta” is a commonly used term in Central and South America and, as such, we may face greater difficulty protecting our “La Quinta” registered trademarks in those regions. Third parties in those countries may also challenge our rights to certain trademarks or oppose our trademark applications. Defending against any such proceedings may be costly, and if unsuccessful, could result in the loss of important intellectual property rights. Obtaining and maintaining trademark protection for multiple brands in multiple jurisdictions is also expensive, and we may therefore elect not to apply for or to maintain certain trademarks. See “Item 1. Business—Our trademarks.”
Our intellectual property is also vulnerable to unauthorized copying or use in some jurisdictions outside the United States, where local law, or lax enforcement of law, may not adequately protect it. If our trademarks or other intellectual property are misappropriated, or otherwise used in a manner where authorization may not be required, the La Quinta brand, including its value and reputation, could be harmed.
We monitor the unauthorized copying or use of intellectual property in the United States and other countries in which we operate or plan to operate. However, it is difficult to protect against every possible unauthorized use of our trademarks or other intellectual property and there are times where we have resorted, and may in the future resort, to litigation to enforce our intellectual property rights. Litigation of this type could be costly, force us to divert our resources, lead to counterclaims or other claims against us or otherwise harm our business or reputation. In addition, we license certain of our trademarks to third parties. For example, we grant
26
our franchisees a right to use certain of our trademarks in connection with their operation of the applicable hotel. If a franchisee or other licensee fails to maintain the quality of the goods and services used in connection with the licensed trademarks, our rights to, and the value of, our trademarks could potentially be harmed. Negative publicity relating to the franchisee or licensee could also be incorrectly associated with us, which could harm our business. Failure to maintain, control and protect our trademarks and other intellectual property would likely adversely affect the ability of our hotels to generate revenues or our ability to enter into new franchise agreements.
Third-party claims that we infringe patent, trademark, copyright or other intellectual property rights or misappropriate trade secrets of others could subject us to damages and other costs and expenses.
Third parties may make claims against us for infringing their patent, trademark, copyright or other intellectual property rights or for misappropriating their trade secrets. We have been and are currently party to such claims and may receive additional claims in the future. Any such claims, even those without merit, could:
|
|
• |
be expensive and time consuming to defend; |
|
|
• |
force us to stop using the intellectual property that is being challenged, or to stop providing products or services that use the challenged intellectual property; |
|
|
• |
force us to redesign or rebrand our services; |
|
|
• |
divert management’s attention and resources; |
|
|
• |
force us to enter into royalty, licensing, co-existence or other agreements to obtain the right to use a third party’s intellectual property; |
|
|
• |
limit the use or the scope of our intellectual property or other rights; |
|
|
• |
force us to pay significant damages; and |
|
|
• |
limit where we can open future hotels. |
In addition, we may be required to indemnify franchisees for any losses they incur as a result of any such infringement claims. All necessary royalty, licensing or other agreements may not be available to us at all or on acceptable terms. Any costs, lost revenues, changes to our business or diversion of management attention related to intellectual property claims against us, whether successful or not, could adversely affect our business.
Because a component of our strategy is to continue to grow our franchise business internationally, the risks of doing business internationally could lower our revenues, increase our costs, reduce our profits or disrupt our business.
At December 31, 2016, 12 of our 566 franchised hotels were located outside of the United States, which represented approximately 2% of our total franchised hotels. As part of our strategic plan, we plan to increase the number of franchised hotels located outside of the United States in the coming years, with approximately 11% of our pipeline relating to hotels located outside the United States. As a result, we are and will be, on an increasing basis, subject to the risks of doing business outside the United States, including:
|
|
• |
recessionary trends or economic instability in international markets; |
|
|
• |
changes in foreign currency exchange rates or currency restructurings and hyperinflation or deflation in the countries in which we operate; |
|
|
• |
the imposition of restrictions on currency conversion or the transfer of funds or limitations on our ability to repatriate non-U.S. earnings in a tax effective manner; |
|
|
• |
the presence and acceptance of varying levels of business corruption in international markets; |
|
|
• |
the impact of various anti-corruption and other laws; |
|
|
• |
the ability to comply with, or impact of complying with, complex and changing laws, regulations and policies of foreign governments that may affect investments or operations, including foreign ownership restrictions, import and export controls, tariffs, embargoes, licensing requirements and regulations, increases in taxes paid and other changes in applicable tax laws; |
|
|
• |
uncertainties as to local laws and enforcement of contract and intellectual property rights; |
|
|
• |
the difficulties involved in managing an organization doing business in many different countries; |
27
|
|
• |
rapid changes in governmental, economic and political policies, political or civil unrest, acts of terrorism or the threat of international boycotts or U.S. anti-boycott legislation; |
|
|
• |
increases in anti-American sentiment and the identification of the licensed brands as American brands; |
|
|
• |
forced nationalization of franchised hotels by local, state or national governments; |
|
|
• |
the effect of disruptions caused by severe weather, natural disasters, outbreak of disease or other events that make travel to a particular region less attractive or more difficult; and |
|
|
• |
political and economic instability. |
Any or all of these factors may adversely affect the income from and the market value of our hotels located in international markets. In addition, the economy of any region in which our hotels are located may be adversely affected to a greater degree than that of other areas of the country or the world by certain developments affecting industries concentrated in that region or country. A decline in the general economic condition in regions or countries in which our hotels are located could result in a decrease in hotel demand in the region, and the income from and market value of these hotels may be adversely affected. Over time, room rates in regions can fluctuate and have historically fluctuated widely. While these factors and the impact of these factors are difficult to predict, any one or more of them could lower our revenues, increase our costs, reduce our profits or disrupt our business, and as our international operations increase, these risks will become more pronounced.
A number of our owned hotels are subject to ground leases; if we are found to be in breach of a ground lease or are unable to renew a ground lease, we could be adversely affected.
Eighteen of our owned hotels are either completely or partially on land subject to ground leases. If we are found to be in breach of a ground lease or ground sublease, such ground lease or sublease could be terminated. Assuming that we exercise all available options to extend the terms of our ground leases and ground subleases, all of our ground leases and ground subleases will expire between 2017 and 2102, one of which will expire in 2017. However, in certain cases, our ability to exercise such options is subject to the condition that we are not in default under the terms of the ground lease or ground sublease, as applicable, at the time that we exercise such options and/or the time such extension occurs, and we can provide no assurances that we will be able to exercise our options at such time. Furthermore, we can provide no assurances that we will be able to renew our ground leases and ground subleases upon expiration or at satisfactory economic terms. If a ground lease or ground sublease expires or is terminated, we would be unable to derive income from such hotel, which could adversely affect us.
If an appropriate opportunity becomes available, we may seek to expand through acquisitions of and investments in other businesses and hotels, or through alliances. We have also divested some of our owned portfolio and may also seek to divest additional owned hotels. These acquisition and disposition activities may be unsuccessful or divert management’s attention.
We may consider strategic and complementary acquisitions of and investments in other hotel or hospitality brands, businesses, hotels or other assets. Furthermore, we may pursue these opportunities in alliance with existing or prospective owners of franchised hotels. In many cases, we will be competing for these opportunities with third parties that may have substantially greater financial resources than us. Acquisitions or investments in brands, businesses, hotels or assets as well as these alliances are subject to risks that could affect our business, including risks related to:
|
|
• |
issuing shares of stock that could dilute the interests of our existing stockholders; |
|
|
• |
spending cash and incurring debt; |
|
|
• |
assuming contingent liabilities; or |
|
|
• |
creating additional expenses. |
We cannot assure you that we will be able to identify opportunities or complete transactions on commercially reasonable terms or at all, or that we will actually realize any anticipated benefits from such acquisitions, investments or alliances. There may be high barriers to entry in certain key markets and scarcity of available development and investment opportunities in desirable locations. Similarly, we cannot assure you that we will be able to obtain financing for acquisitions or investments on attractive terms or at all, or that the ability to obtain financing will not be restricted by the terms of our indebtedness.
28
The success of any such acquisitions or investments also will depend, in part, on our ability to integrate the acquisition or investment with our existing operations. We may experience difficulty with integrating acquired businesses, hotels or other assets, including difficulties relating to:
|
|
• |
coordinating sales, distribution, and marketing functions; |
|
|
• |
integrating technology information systems; and |
|
|
• |
preserving the important guest, labor and other relationships of the acquired assets. |
During 2016, we sold 19 hotels. Divestment of these hotels and future divestments of hotels will impact our revenue and EBITDA. In some circumstances, sales of hotels may result in losses. Upon a sale of hotels, we may become subject to contractual indemnity obligations, incur material losses, including impairment charges, or tax liabilities or, as a result of required debt repayment, face a shortage of liquidity.
In addition, any acquisitions, investments, dispositions or alliances could demand significant attention from management that would otherwise be available for business operations, which could harm our business.
Governmental regulation may adversely affect the operation of our hotels.
The hotels that we and our franchisees operate are subject to extensive local, regional and national regulations and, on a periodic basis, must obtain various licenses and permits. The laws and regulations of states, counties, cities, provinces and other political subdivisions may also require certain registration, disclosure statements and other practices with respect to the franchising of hotels. Any failure to identify, obtain or maintain required licenses and permits could result in adverse consequences.
The hotel industry is subject to extensive federal, state and local governmental regulations in the United States and the other countries in which our franchised hotels operate, including those relating to building and zoning requirements and those relating to the preparation and sale of food. Hotels and their owners and operators are also subject to licensing and regulation by state and local departments relating to health, sanitation, fire and safety standards, and to laws governing their relationships with employees, including minimum wage requirements, overtime, working conditions and citizenship requirements. In connection with the continued operation or remodeling of certain of our hotels, we or our franchisees may be required to expend funds to meet federal, state and local regulations. For example, we may incur significant costs complying with the Americans with Disabilities Act (“ADA”), which requires that all public accommodations meet certain federal requirements related to access and use by disabled persons. The regulations also mandate certain operational requirements that hotel operators must observe. If, pursuant to the ADA, we are required to make substantial alterations to, and capital expenditures for, our hotels, including removal of access barriers, it could increase our expenditures and, in turn, could reduce our earnings. Any failure to obtain or maintain any such licenses or any publicity resulting from actual or alleged violations of any such laws and regulations could result in injunctive relief, fines, damage awards or capital expenditures and could have an adverse effect on our results of operations. Moreover, new or revised laws and regulations or new interpretations of existing laws and regulations could affect the operation of our hotels or result in significant additional expense and operating restrictions on us and our franchisees.
In addition, we may be subject to certain laws and regulations that govern the offer and sale of franchises, including regulations promulgated by the Federal Trade Commission (the “FTC”). Many franchise laws impose substantive requirements on franchise agreements, including limitations on provisions concerning the termination or non-renewal of a franchise. The FTC requires franchisors to make extensive disclosure to prospective franchisees but does not require registration. Some franchise laws require that certain materials be registered before franchises can be offered or sold in that state. The failure to obtain or retain licenses or approvals to sell franchises could adversely affect us and our franchisees.
Failure to comply with laws and regulations applicable to our international operations may increase costs, reduce profits, limit growth or subject us to broader liability.
Our business operations in countries outside the United States are subject to a number of U.S. federal laws and regulations, including restrictions imposed by the Foreign Corrupt Practices Act (“FCPA”) as well as trade sanctions administered by the Office of Foreign Assets Control (“OFAC”) and the Commerce Department. The FCPA is intended to prohibit bribery of foreign officials or parties and requires us to keep books and records that accurately and fairly reflect our transactions. OFAC and the Commerce Department administer and enforce economic and trade sanctions based on U.S. foreign policy and national security goals against targeted foreign states, organizations and individuals. Some of our business operations are also subject to the laws and regulations of non-U.S. jurisdictions, including anti-corruption legislation in the countries in which we conduct operations. If we fail to comply with these laws and regulations, we could be exposed to claims for damages, financial penalties, reputational harm, incarceration of our employees or restrictions on our operation, ownership or franchising of hotels, including the termination of our franchise and ownership rights. In addition, in certain circumstances, the actions of parties affiliated with us (including our owners, joint venture
29
partners, employees and agents) may expose us to liability under the FCPA, U.S. sanctions or other laws. These restrictions could increase our costs of operations, reduce our profits or cause us to forgo development opportunities that would otherwise support our growth.
In August 2012, Congress enacted the Iran Threat Reduction and Syria Human Rights Act of 2012 (“ITRSHRA”), which expands the scope of U.S. sanctions against Iran and Syria. More specifically, Section 219 of the ITRSHRA amended the Exchange Act to require companies subject to SEC reporting obligations under Section 13 of the Exchange Act to disclose in their periodic reports specified dealings or transactions involving Iran or other individuals and entities targeted by certain OFAC sanctions engaged in by the reporting company or any of its affiliates. These companies are required to separately file with the SEC a notice that such activities have been disclosed in the relevant periodic report, and the SEC is required to post this notice of disclosure on its website and send the report to the U.S. President and certain U.S. Congressional committees. The U.S. President thereafter is required to initiate an investigation and, within 180 days of initiating such an investigation with respect to certain disclosed activities, to determine whether sanctions should be imposed.
Under ITRSHRA, we are required to report if we or any of our “affiliates” knowingly engaged in certain specified activities during the period covered by one of our Annual Reports on Form 10-K or Quarterly Reports on Form 10-Q. In addition, because the SEC defines the term “affiliate” broadly, we may be deemed to be a controlled affiliate of Blackstone, affiliates of Blackstone may also be considered our affiliates. Other affiliates of Blackstone have in the past and may in the future be required to make disclosures pursuant to ITRSHRA, including the activities discussed in the disclosures included on Exhibit 99.1 to this Annual Report on Form 10-K, which disclosures are hereby incorporated by reference herein. Disclosure of such activities by us or our affiliates, even if such activities are not subject to sanctions under applicable law, and any sanctions imposed on us or our affiliates as a result of these activities, could harm our reputation and have a negative effect on our business.
Foreign or U.S. environmental laws and regulations may cause us to incur substantial costs or subject us to potential liabilities.
We are subject to certain compliance costs and potential liabilities under various foreign and U.S. federal, state and local environmental, health and safety laws and regulations. These laws and regulations govern actions including air emissions, the use, storage and disposal of hazardous and toxic substances, and wastewater disposal. Our failure to comply with such laws, including any required permits or licenses, could result in substantial fines or possible revocation of our authority to conduct some of our operations. We could also be liable under such laws for the costs of investigation, removal or remediation of hazardous or toxic substances at our currently or formerly owned, operated or franchised hotels or at third-party locations in connection with our waste disposal operations, regardless of whether or not we knew of, or caused, the presence or release of such substances. Some laws may regard us as having liability as an operator by virtue of how we may implement our franchise agreements, rendering us potentially responsible for addressing environmental or other conditions existing at our franchised hotels. In some cases, we may be entitled to indemnification from the party that caused the contamination, or pursuant to our franchise agreements, but there can be no assurance that we would be able to recover all or any costs we incur in addressing such problems. From time to time, we may be required to remediate such substances or remove, abate or manage asbestos, mold, radon gas, lead or other hazardous conditions at our hotels. The presence or release of such toxic or hazardous substances could result in third-party claims for personal injury, property or natural resource damages, business interruption or other losses. Such claims and the need to investigate, remediate, or otherwise address hazardous, toxic or unsafe conditions could adversely affect our operations, the value of any affected hotel, or our ability to sell, lease or assign our rights in any such hotel, or could otherwise harm our business or reputation. Environmental, health and safety requirements have also become increasingly stringent, and our costs may increase as a result. For example, Congress, the U.S. Environmental Protection Agency (“EPA”), and some states are considering or have undertaken actions to regulate and reduce greenhouse gas emissions. New or revised laws and regulations or new interpretations of existing laws and regulations, such as those related to climate change, could affect the operation of our owned and franchised hotels or result in significant additional expense and operating restrictions on us and our franchisees.
Asbestos, lead-based paint, mold and other hotel related issues could expose us to substantial liability.
Certain U.S. and foreign laws impose liability for the release of asbestos containing materials into the air or require the removal or containment of asbestos containing materials, and third parties may seek recovery from owners or operators of real properties for personal injury associated with exposure to toxic or hazardous substances. Some of our owned hotels may have asbestos containing materials, and if such materials are discovered, we are required to take action as and when required by applicable law. Such laws require that, as owners or operators of buildings containing asbestos, we must (i) properly manage and maintain the asbestos, (ii) notify and train certain employees regarding the presence of asbestos and the related hazards and (iii) undertake special precautions, including removal or other abatement, if asbestos would be disturbed during renovation or demolition of a building. Such laws may impose fines and penalties on us if we fail to comply with these requirements and may allow third parties to seek recovery for personal injury associated with exposure to asbestos fibers, which could significantly increase our operating costs and reduce our earnings.
30
In addition, certain laws impose liability for lead based paint, and third parties may seek recovery from owners or operators of real properties for personal injury associated with lead based paint. Limits are placed on the amount of lead that may be present in public drinking water supplies, and third parties may seek recovery from owners or operators of real properties for injuries arising from exposure to high lead concentration.
Other materials used in the construction of our owned hotels that are currently thought to be safe may in the future be determined to be hazardous, and could expose us to substantial liability for damages, injuries, adverse health effects or removal and disposal costs. In addition, other building supplies thought to be appropriate for their use, while not toxic, have been discovered to be defective (such as fire-retardant plywood or polybutylene piping). Defects in such supplies have resulted in substantial costs on the part of the owners or operators of affected hotels to remove and replace the defective materials. Materials currently thought to be appropriate or safe may in the future prove to be defective, and could result in substantial costs or losses.
Problems associated with mold may pose risks to our hotels and also may be the basis for personal injury claims against us. There is no generally accepted standard for the assessment of mold. If left unchecked or inadequately addressed, the growth of mold could result in litigation and remediation expenses, or in a closure of some or all of a hotel, that could adversely affect revenues from an individual hotel. We have discovered that some of our owned hotels have problems with mold. The presence of mold at some of our owned hotels has required us to undertake a remediation program to remove the mold from the affected hotels. The cost of remediation to date has not been material. However, remediation costs may substantially increase if there is mold in our other hotels or if costs related to mold such as legal and insurance expense continue to increase rapidly, which could significantly increase our operating costs and reduce our earnings.
Additionally, the EPA has identified certain health risks associated with elevated radon gas in buildings, and has recommended that certain mitigating measures be considered. It is possible that other environmental conditions not currently known, or known but not currently thought to be dangerous, may in the future be determined to present a risk to health or safety, such as with respect to possible exposure to waterborne pathogens.
Franchisees are exposed to the same risks with respect to the hotels that they own and operate. Additionally, some laws may regard us as having liability as an operator by virtue of how we may implement our franchise agreements, rendering us potentially responsible for addressing environmental or other conditions existing at our franchised hotels. Our franchise agreements typically require our franchisees to assume and indemnify us against such liabilities, but there can be no assurance that governmental authorities will not look directly to us to address such matters or that we would be able to recover from our hotel owners any costs we incur in doing so.
For all of these reasons, the presence of, or potential for contamination by, such hazardous or toxic substances, or exposure to pathogens, at, on, under, adjacent to, emanating from, or in any of our hotels could materially adversely affect the operations, the value of such hotel or the ability to attract guests to such hotel, or could otherwise harm our business or reputation.
We are subject to risks from litigation filed by or against us.
In the normal course of our business, we are often involved in various legal proceedings. We cannot predict with certainty the cost of defense, the cost of prosecution or the ultimate outcome of these legal proceedings. Additionally, legal or governmental proceedings brought by or on behalf of franchisees, employees, stockholders or guests may adversely affect our financial results. On April 25, 2016, a purported stockholder class action lawsuit, captioned Beisel v. La Quinta Holdings Inc. et al., was filed in the U.S. District Court for the Southern District of New York against us, certain of our current and former officers and certain current and former members of our board of directors on behalf of purchasers of our common stock pursuant to our March 24, 2015 secondary public offering (the “March Secondary Offering”) and on behalf of purchasers of the Company’s common stock from November 19, 2014 through October 29, 2015 (the “Class Period”). The lawsuit alleges, among other things, that, in violation of the federal securities laws, the registration statement and prospectus filed in connection with the March Secondary Offering contained materially false and misleading information or omissions and that the Company as well as certain current and former officers made false and misleading statements in earnings releases and to analysts during the Class Period. The plaintiff seeks unspecified compensatory damages and other relief. In addition, in recent years, a number of hospitality companies have been subject to lawsuits, including class action lawsuits, alleging violations of federal laws and regulations regarding workplace and employment matters, consumer protection claims and other commercial matters. A number of these lawsuits have resulted in the payment of substantial damages by the defendants through adverse judgments or settlement agreements. Similar lawsuits have been and may be instituted against us from time to time, and we may incur substantial damages and expenses resulting from lawsuits of this type, which could have a material adverse effect on our business. From time to time, we may also be engaged in lawsuits against franchisees. Similarly, we may from time to time institute legal proceedings on behalf of ourselves or others. The ultimate outcome of any such lawsuits or legal proceedings could cause us to incur substantial damages and expenses, which could have a material adverse effect on our business.
31
The loss of senior executives or key field personnel, such as general managers, could significantly harm our business.
Our ability to maintain our competitive position depends to a large degree on the efforts and skills of our senior executives. On average, our executive management team members have 18 years of experience in lodging and lodging related industries or have other relevant experience; however, we cannot guarantee that these individuals will remain with us. Finding suitable replacements for senior executives could be difficult. We currently do not have a life insurance policy or key person insurance policy with respect to any of our senior executives. Any failure of our management to work together to effectively manage our operations, any departures of senior executives, our inability to hire other key management, and any failure to effectively integrate new management into our controls, systems and procedures may adversely affect our business, results of operations and financial condition.
We also rely on the general managers at each of our owned hotels to manage daily operations and oversee the efforts of their team members. These general managers are trained professionals in the hospitality industry and have extensive experience in many markets worldwide. The failure to retain, train or successfully manage general managers for our owned hotels could negatively affect our operations.
Labor shortages and increase in minimum wage rates could restrict our ability to operate our hotels or grow our business or result in increased labor costs that could reduce our profits.
Our success depends in large part on our ability to attract, retain, train, manage and engage employees. If we are unable to attract, retain, train, manage and engage skilled employees, our ability to manage and staff the owned hotels adequately could be impaired, which could reduce guest satisfaction. In addition, the inability of our franchisees to attract, retain, train, manage and engage skilled employees for the franchised hotels could adversely affect our business. Staffing shortages also could hinder our ability to grow and expand our businesses. Because payroll costs are a major component of the operating expenses at our hotels, a shortage of skilled labor could also require higher wages that would increase labor costs, which could adversely affect our profits and the profits of our franchisees. In addition, increases in minimum wage rates could result in significantly increased costs and reduced profits for us and our franchisees.
Higher health care costs could adversely affect our business.
With the passage in 2010 of the U.S. Patient Protection and Affordable Care Act (the “Act”), we are required to provide affordable coverage, as defined in the Act, to all employees, or otherwise be subject to a payment per employee based on the affordability criteria in the Act. Many of these requirements are being phased in over a period of time. Additionally, some states and localities have passed state and local laws mandating the provision of certain levels of health benefits by some employers. Increased health care and insurance costs could have an adverse effect on our business, financial condition and results of operations.
Attempts by labor organizations to organize groups of our employees or changes in labor laws could disrupt our operations, increase our labor costs or interfere with the ability of our management to focus on implementing our business strategies.
Although none of our employees are currently covered under collective bargaining agreements, we cannot guarantee that our employees will not elect to be represented by labor unions in the future. We may become subject to collective bargaining agreements, similar agreements or regulations enforced by governmental entities in the future. Changes in the federal regulatory scheme could make it easier for unions to organize groups of our employees. If relationships with our employees become adverse, our hotels could experience labor disruptions such as strikes, lockouts and public demonstrations. Additionally, if such changes take effect, our employees could be subject to organizational efforts, which could potentially lead to disruptions or require our management’s time to address unionization issues. If a portion of our workforce were to become unionized, it may also hinder our ability to resolve employment matters and disputes directly with our employees.
Labor regulation could also lead to higher wage and benefit costs, changes in work rules that raise operating expenses and legal costs, and limit our ability to take cost saving measures during economic downturns. In addition, the National Labor Relations Board has revised its standard for joint employee relationships, which could increase our risk of being considered a joint employer with our franchisees. Consequently, we may be held liable along with our franchisees for labor, minimum wage, wage and hour, union-organizing and other employment related violations committed by any of our franchisees against its employees.
These or similar agreements, legislation or changes in regulations could disrupt our operations, hinder our ability to cross-train and cross-promote our employees due to prescribed work rules and job classifications, reduce our profitability or interfere with the ability of our management to focus on executing our business and operating strategies.
32
If the insurance that we or our franchisees carry does not sufficiently cover damage or other potential losses or liabilities to third parties involving our hotels, our profits could be reduced.
We carry, and we require our franchisees to carry, insurance from insurance carriers that we believe is adequate for foreseeable first and third party losses and with terms and conditions that we believe are reasonable and customary. Nevertheless, market forces beyond our control could limit the scope of the insurance coverage that we and our franchisees can obtain or restrict our or our franchisees’ ability to buy insurance coverage at reasonable rates. In the event of a substantial loss, the insurance coverage that we or our franchisees carry may not be sufficient to reimburse us in full for our losses or pay the full value of financial obligations, liabilities or the replacement cost of any lost investment or property loss, which could adversely affect our profits. In addition, risks that may fall outside the general coverage terms and limits of the policies and certain types of losses that are significantly uncertain, or generally of a catastrophic nature, such as hurricanes, earthquakes and floods or terrorist acts, may be uninsurable or not economically insurable. If such losses or events occur, they could cause substantial damage to our hotels or our franchised hotels or the surrounding area, without any insurance coverage. Further, we and our franchisees may not be able to obtain or renew insurance policies or, if we or our franchisees are able to obtain or renew our coverage, it may be at a significantly higher cost than the historic cost.
In addition, insurance coverage for our hotels and for casualty losses does not customarily cover damages that are characterized as punitive or similar damages. As a result, any claims or legal proceedings, or settlement of any such claims or legal proceedings that result in damages that are characterized as punitive or similar damages may not be covered by our insurance. If these types of damages are substantial, our financial condition and results of operation may be adversely affected.
In some cases, these factors could result in certain losses being completely uninsured. As a result, we or our franchisees could lose some or all of the capital invested in a hotel, as well as the anticipated future revenues and profits from the hotel. We or our franchisees could suffer an uninsured or underinsured loss, and we may not have sufficient insurance to cover awards of damages resulting from claims made against us.
Terrorism insurance may not be available at commercially reasonable rates or at all.
Following the September 11, 2001 terrorist attacks in New York City and the Washington, D.C. area, Congress passed the Terrorism Risk Insurance Act of 2002, which established the Terrorism Risk Insurance Program (the “Program”) to provide insurance capacity for terrorist acts. The Program expired at the end of 2014 but was reauthorized, with some adjustments to its provisions, in January 2015 for six years through December 31, 2020. We carry, and we require our franchisees to carry, insurance from insurance carriers to respond to both first-party and third-party liability losses related to terrorism. We purchase our first-party property damage and business interruption insurance from a stand-alone market in place of and to supplement insurance from government run pools. If the Program is not extended or renewed upon its expiration in 2020, or if there are changes to the Program that would negatively affect insurance carriers, premiums for terrorism insurance coverage will likely increase and/or the terms of such insurance may be materially amended to increase stated exclusions or to otherwise effectively decrease the scope of coverage available, perhaps to the point where it is effectively unavailable.
Terrorist attacks and military conflicts may adversely affect the hospitality industry.
The September 11, 2001 terrorist attacks in New York City and the Washington, D.C. area and the November 13, 2015 terrorist attacks in Paris, France underscore the possibility that large public facilities or economically important assets could become the target of terrorist attacks in the future. The occurrence or the possibility of terrorist attacks or military conflicts could, among other things, generally reduce travel to affected areas for tourism and business or adversely affect the willingness of guests to stay in or avail themselves of hotel services and result in higher costs for security and insurance premiums or diminish the availability of insurance coverage for losses related to terrorist attacks, all of which could adversely affect our financial condition and results of operations.
Changes to estimates or projections used to assess the fair value of our assets, or operating results that are lower than our current estimates at certain locations, may cause us to incur impairment charges that could adversely affect our results of operations.
Our total assets include intangible assets with an indefinite life, other intangible assets with finite useful lives, and substantial amounts of long-lived assets, principally property and equipment, including hotels. We analyze our assets for impairment on an annual basis or more frequently if events or changes in circumstances indicate that an asset might be impaired. Our evaluation of impairment requires us to make certain estimates and assumptions including projections of future results. After performing our evaluation for impairment, including an analysis to determine the recoverability of long-lived assets, we will record an impairment loss when the carrying value of the underlying asset, asset group or reporting unit exceeds its fair value. Decisions to divest hotels could result in the requirement to record an impairment charge due to, among other factors, a decrease in the assumed holding period for the hotel. For example, during 2016, as part of the strategic review of our owned hotel portfolio, we identified approximately 50 hotels as candidates for sale in the near term. After considering the shortened holding period and probability of selling these hotels, we determined that the estimated cash flows were less than the carrying value of certain hotels and therefore we reduced the carrying values to their estimated
33
fair value. This resulted in an impairment charge of approximately $80.4 million. Also during 2016, we entered into agreements to sell 11 of our owned hotels and recorded an impairment charge of $19.3 million to adjust the value of these assets to their fair value, less transaction costs. We also recorded $1.1 million of additional impairment for hotels included in assets held for sale and recorded impairment charges of $3.5 million related to two owned hotels for which we determined that the carrying amount would not be recoverable due to changes in market and economic conditions. Further divestitures could result in additional impairment charges. In addition, if the estimates or assumptions used in our evaluation of impairment change, we may be required to record additional impairment charges on certain of our assets. During times of economic distress, declining demand and declining earnings often result in declining asset values. If any impairment losses we recognize are significant, our financial condition and results of operations would be adversely affected.
Changes in federal, state, local or foreign tax law or interpretations of existing tax law, or adverse determinations by tax authorities, could increase our tax burden or otherwise adversely affect our financial condition, results of operations or cash flows.
We are subject to taxation at the federal, state and local levels in the U.S. and other countries and jurisdictions. Our future effective tax rate could be affected by changes in the composition of earnings in jurisdictions with differing tax rates, changes in statutory rates and other legislative changes, changes in the valuation of our deferred tax assets and liabilities, or changes in determinations regarding the jurisdictions in which we are subject to tax. From time to time, the U.S. federal, state and local and foreign governments make substantive changes to tax rules and their application, which could result in materially higher taxes than would be incurred under existing tax law or interpretation and could adversely affect our profitability, financial condition, results of operations or cash flows. State and local tax authorities have also increased their efforts to increase revenues through changes in tax law and audits. Such changes and proposals, if enacted, could increase our future effective income tax rates. We are subject to ongoing and periodic tax audits and disputes in various jurisdictions. An unfavorable outcome from any tax audit could result in higher tax costs, penalties and interest, thereby adversely impacting our financial condition, results of operations or cash flows.
34
We are currently under audit by the Internal Revenue Service and may be required to pay additional taxes.
The Internal Revenue Service (the “IRS”) is currently auditing the tax returns of La Quinta Corporation, one of our former REITs prior to the Pre-IPO Transactions, and BRE/LQ Operating Lessee Inc., one of our former taxable REIT subsidiaries prior to the Pre-IPO Transactions, in each case for the tax years ended December 31, 2010, 2011, 2012 and 2013. With respect to the audits of the 2010 and 2011 tax returns, we received a draft notice of proposed adjustment from the IRS on January 9, 2014, and the notice of proposed adjustment was issued to us on June 2, 2014. We submitted a timely response to the notice of proposed adjustment and, on July 7, 2014, we received an IRS 30-Day Letter proposing to impose a 100% tax on the REIT totaling $158 million for the periods under audit in which the IRS has asserted that the rent charged for these periods under the lease of hotel properties from the REIT to the taxable REIT subsidiary exceeded an arm’s length rent. In addition, the IRS proposed to eliminate $89 million of net operating loss carryforwards for the taxable REIT subsidiary for the tax years 2006 through 2009; however, in an IRS rebuttal received on September 26, 2014, the IRS conceded its proposed adjustment on this point was incorrect. We disagree with the IRS’ position with respect to rents charged by the REIT to its taxable REIT subsidiary and have appealed the proposed tax and adjustments to the IRS Appeals Office. In determining amounts payable by our taxable REIT subsidiary under the lease, we engaged a third party to prepare a transfer pricing study contemporaneous with the lease which concluded that the lease terms were consistent with an arm’s length rent as required by relevant provisions of the Internal Revenue Code of 1986 (the “Internal Revenue Code”) and applicable Treasury Regulations. Attorneys and others representing the Company conducted preliminary discussions regarding the appeal with the IRS Appeals Office team on March 31, 2015 and April 1, 2015. In response to a supplemental analysis submitted by the IRS economist to IRS Appeals and provided to us on August 18, 2015, we submitted responses dated September 3, 2015 and October 1, 2015. Our most recent meeting with the IRS Appeals Office team occurred on January 25, 2017. Our discussions with IRS Appeals are ongoing. We believe the IRS transfer pricing methodologies applied in the audits contain flaws and that the IRS proposed tax and adjustments are inconsistent with the U.S. federal tax laws related to REITs. We have concluded that the positions reported on our tax returns under audit by the IRS are, based on their technical merits, more-likely-than-not to be sustained upon examination. Accordingly, as of December 31, 2016, we have not established any reserves related to this proposed adjustment or any other issues reflected on the returns under examination. If, however, we are unsuccessful in challenging the IRS, an excise tax would be imposed on the REIT equal to 100% of the excess rent and we could owe additional income taxes, interest and penalties, which could adversely affect our financial condition, results of operations and cash flow and the price of our common stock. Such adjustments could also give rise to additional state income taxes.
On November 25, 2014, we were notified that the IRS intended to examine the tax returns of the same entities subject to the 2010 and 2011 audit in each case for the tax years ended December 31, 2012 and 2013. We have received several draft notices of proposed adjustment proposing a transfer-pricing related assessment of approximately $18 million for 2013 and adjustments to our net operating losses for the years 2006 through 2009. Based on our analysis of these draft notices, we believe the IRS transfer pricing methodologies and NOL disallowances applied in the 2012-2013 audit contain the same flaws present in the 2010-2011 audit and that the IRS proposed tax and adjustments are inconsistent with U.S. transfer pricing principles and the U.S. federal tax laws related to REITs. We have concluded that the positions reported on our tax returns under audit by the IRS are, based on their technical merits, more-likely-than-not to be sustained upon examination. Accordingly, as of December 31, 2016, we have not established any reserves related to this proposed adjustment or any other issues reflected on the returns under examination
On November 1, 2016, the Internal Revenue Service notified the Company that it intends to audit the return of one of its subsidiaries, Lodge Holdco II L.L.C., for the short taxable year ended April 13, 2014. The audit is in its early stages and no issues have been communicated to us at this point. As Lodge Holdco II L.L.C. was treated as a partnership for the taxable year ended April 13, 2014, any tax resulting from this examination would be assessed at the partner level rather than against the Company. Accordingly, no provision has been recorded for this examination.
If the IRS were successful in its challenges relating to our 2010-2013 tax years, we could owe additional income taxes, interest and penalties, which could adversely affect our financial condition, results of operations and cash flow and the price of our common stock.
Although neither we nor any of our subsidiaries has been a REIT for United States federal income tax purposes following the IPO, there can be no assurance that the IRS will not challenge the Existing Entities’ REIT status for previous years in which they elected REIT status. If the IRS were to successfully challenge the previous REIT status of any such entity, we may be required to pay additional taxes.
Certain of the Existing Entities elected to be treated as REITs for United States federal income tax purposes for taxable years ended on and prior to the date of the IPO. Following consummation of the IPO, neither we nor any of our subsidiaries has been a REIT for United States federal income tax purposes. However, there can be no assurance that the IRS will not challenge the Existing Entities’ REIT qualification for previous years in which they elected REIT status. Qualification as a REIT involves the application of highly technical and complex provisions of the Internal Revenue Code for which only a limited number of judicial or administrative
35
interpretations exist. Although we believe that each of the Existing Entities that elected to be treated as a REIT met all of these requirements and qualified as a REIT in each of the years REIT status was elected, if the IRS were to successfully challenge the previous REIT status of any such entity, we could be liable for additional income taxes, interest and penalties, which could adversely affect our financial condition, results of operations and cash flow and the price of our common stock.
Changes to accounting rules or regulations may adversely affect our results of operations.
New accounting rules or regulations and varying interpretations of existing accounting rules or regulations have occurred and may occur in the future. A change in accounting rules or regulations may require retrospective application and affect our reporting of transactions completed before the change is effective, and future changes to accounting rules or regulations may adversely affect our financial condition and results of operations. See Note 2: "Basis of Presentation and Summary of Significant Accounting Policies" in our audited consolidated financial statements included elsewhere in this Annual Report on Form 10-K for a summary of accounting standards issued but not yet adopted.
Risks related to pursuing the separation of our businesses
Executing on a strategy of a separating our real estate business from our franchise and management business, which could include a spin-off of our owned real estate assets, is contingent upon the satisfaction of a number of conditions, may require significant time and attention of our management, and may have a material adverse effect on us whether or not the strategy is completed.
On January 18, 2017, we announced a plan to pursue a separation into two stand-alone publicly traded companies of our real estate business, consisting primarily of our owned hotels located in the U.S. (the "real estate business”), and our franchise and management businesses. The separation could include spinning off our real estate business as a separate company. The proposed separation is subject to customary conditions, including, but not limited to, effectiveness of appropriate filings with the SEC and final approval by our board of directors. In addition, ability to execute the transaction as intended, unanticipated developments or changes in the macroeconomic environment, U.S. tax policy, credit markets and equity markets, as well as other market conditions, may affect the execution of our separation strategy. For these and other reasons, we may not complete the separation as expected or at all.
Whether or not we complete the separation, our ongoing businesses may be adversely affected and we may be subject to certain risks and consequences as a result of pursuing the separation, including, among others, the following:
|
|
|
|
• |
execution of the proposed separation will require significant time and attention from management, which may distract them from the operation of our business and the execution of other initiatives that may have been beneficial to us; |
|
|
|
|
• |
our employees may be distracted due to uncertainty about their future roles with each of the separate companies pending the completion of the separation; |
|
|
|
|
• |
we will be required to pay significant costs and expenses relating to the separation, such as legal, accounting and other professional fees, whether or not the separation is completed; and |
|
|
|
|
• |
we may experience negative reactions from the financial markets if we fail to complete the separation. |
Any of these factors could have a material adverse effect on our business, financial condition, results of operations, cash flows or the price of our common stock.
We may be unable to achieve some or all of the benefits that we expect to achieve from the separation.
Although we believe that separating our real estate business from our franchise and management businesses will provide financial, operational, managerial and other benefits to us and our stockholders, the separation may not provide results on the scope or scale we anticipate, and we may not realize any or all of the intended benefits. For example, if the statutory and regulatory requirements relating to REITs are not met in 2018, the benefits of separating our real estate business from our franchise and management businesses or spinning off our owned real estate assets may be reduced or may be unavailable to us and our stockholders. In addition, we will incur one-time costs and ongoing costs in connection with, or as a result of, the separation, including costs of operating as independent, publicly-traded companies that the real estate business will no longer be able to share. Those costs may exceed our estimates or could negate some of the benefits we expect to realize. If we do not realize the intended benefits of the separation or if our costs exceed our estimates, the Company or the stand-alone real estate business could suffer a material adverse effect on their business, financial condition, results of operations and cash flows.
36
If the proposed separation is completed, the trading price of our common stock will decline.
We expect the trading price of our common stock immediately following any separation transaction, which will only represent the value of the remaining business or businesses, to be lower than immediately prior to any separation because the trading price for our common stock would no longer reflect the value of the separated business or businesses.
Following the separation, the aggregate value of your common stock of the Company and any stand-alone business that may be spun off may be less than the aggregate value at which the Company's common stock might have traded prior to any spin-off.
The common stock of the Company and any stand-alone business that may be spun off that you may hold following the separation may collectively trade at an aggregate value less than the value at which the Company's common stock might have traded had the separation not occurred due to, among other factors, the expected or actual future performance of either the Company or any businesses that are spun off as separate, independent companies and the future stockholder base and market for the Company's common stock and the shares of any businesses that are spun off.
The proposed separation could result in substantial tax liability to our stockholders.
If the separation is completed as a taxable transaction as presently contemplated, each holder of our common stock who receives shares of the new spin-off company would generally be treated as receiving a taxable distribution of property in an amount equal to the fair market value of the shares received.
Risks relating to our indebtedness
Our substantial indebtedness could adversely affect our financial condition, our ability to raise additional capital to fund our operations, our ability to operate our business, our ability to react to changes in the economy or our industry and our ability to pay our debts and could expose us to interest rate risk to the extent of our variable debt and divert our cash flow from operations to make debt payments.
We have a significant amount of indebtedness. As of December 31, 2016, our total indebtedness was approximately $1.7 billion. Our substantial debt could have important consequences, including:
|
|
• |
requiring a substantial portion of cash flow from operations to be dedicated to the payment of principal and interest on our indebtedness, thereby reducing our ability to use our cash flow to fund our operations, capital expenditures and pursue future business opportunities; |
|
|
• |
increasing our vulnerability to adverse economic, industry or competitive developments; |
|
|
• |
exposing us to increased interest expense, as our degree of leverage may cause the interest rates of any future indebtedness (whether fixed or floating rate interest) to be higher than they would be otherwise; |
|
|
• |
exposing us to the risk of increased interest rates because certain of our indebtedness is at variable rates of interest; |
|
|
• |
making it more difficult for us to satisfy our obligations with respect to our indebtedness, and any failure to comply with the obligations of any of our debt instruments, including restrictive covenants, could result in an event of default that accelerates our obligation to repay indebtedness; |
|
|
• |
restricting us from making strategic acquisitions or causing us to make non-strategic divestitures; |
|
|
• |
limiting our ability to obtain additional financing for working capital, capital expenditures, hotel development, satisfaction of debt service requirements, acquisitions and general corporate or other purposes; and |
|
|
• |
limiting our flexibility in planning for, or reacting to, changes in our business or market conditions and placing us at a competitive disadvantage compared to our competitors who may be better positioned to take advantage of opportunities that our leverage prevents us from exploiting. |
In addition, we are a holding company and substantially all of our consolidated assets are owned by, and most of our business is conducted through, our subsidiaries. Revenues from these subsidiaries are our primary source of funds for debt payments and operating expenses. If our subsidiaries are restricted from making distributions to us, that may impair our ability to meet our debt service obligations or otherwise fund our operations. Moreover, there may be restrictions on payments by subsidiaries to their parent companies under applicable laws, including laws that require companies to maintain minimum amounts of capital and to make
37
payments to stockholders only from profits. As a result, although a subsidiary of ours may have cash, we may not be able to obtain that cash to satisfy our obligation to service our outstanding debt or fund our operations.
Servicing our indebtedness will require a significant amount of cash. Our ability to generate sufficient cash depends on many factors, some of which are not within our control.
Our ability to make payments on our indebtedness and to fund planned capital expenditures will depend on our ability to generate cash in the future. To a certain extent, this is subject to general economic, financial, competitive, legislative, regulatory and other factors that are beyond our control. If we are unable to generate sufficient cash flow to service our debt and meet our other commitments, we may need to restructure or refinance all or a portion of our debt, sell material assets or operations or raise additional debt or equity capital. We may not be able to affect any of these actions on a timely basis, on commercially reasonable terms or at all, and these actions may not be sufficient to meet our capital requirements. In addition, the terms of our existing or future debt arrangements may restrict us from affecting any of these alternatives. Our failure to make the required interest and principal payments on our indebtedness would result in an event of default under the agreement governing such indebtedness, which may result in the acceleration of some or all of our outstanding indebtedness.
Despite our current level of indebtedness, we may be able to incur substantially more debt and enter into other transactions, which could further exacerbate the risks to our financial condition described above.
We may be able to incur significant additional indebtedness in the future. Although the credit agreement governing the senior secured credit facilities will contain restrictions on the incurrence of additional indebtedness and entering into certain types of other transactions, these restrictions are subject to a number of qualifications and exceptions. Additional indebtedness incurred in compliance with these restrictions could be substantial. These restrictions also do not prevent us from incurring obligations, such as trade payables, that do not constitute indebtedness as defined under our debt instruments. To the extent new debt is added to our current debt levels, the substantial leverage risks described in the preceding two risk factors would increase.
The credit agreement governing the senior secured credit facilities contains, and future debt agreements may contain, restrictions that may limit our flexibility in operating our business.
The credit agreement governing the senior secured credit facilities contains operating covenants that limit the discretion of management with respect to certain business matters. These covenants place restrictions on, among other things, our ability to incur additional indebtedness and make guarantees, create liens on assets, enter into sale and leaseback transactions, engage in mergers and consolidations, sell assets, make fundamental changes, pay dividends and distributions or repurchase our capital stock, make investments, loans and advances, including acquisitions, engage in certain transactions with affiliates, make changes in the nature of our business and make prepayments of junior debt. In addition, under our senior secured credit facilities, if, on the last day of any period of four consecutive quarters, the aggregate principal amount of revolving credit loans, swing line loans and/or letters of credit (excluding up to $20 million of letters of credit and certain other letters of credit that have been cash collateralized or back-stopped) that are issued and/or outstanding is greater than 25% of the revolving credit facility, the credit agreement requires the borrower to maintain a consolidated first lien net leverage ratio not to exceed 8.0 to 1.0. Additionally, the documents governing our future indebtedness may place additional restrictions on us and may require us to meet certain financial ratios and tests. Our ability to comply with these and other provisions of our new credit agreement and future debt agreements is dependent on our future performance, which will be subject to many factors, some of which are beyond our control. The breach of any of these covenants or non-compliance with any of these financial ratios and tests could result in an event of default under the debt agreements, which, if not cured or waived, could result in acceleration of the related debt and the acceleration of debt under other instruments evidencing indebtedness that may contain cross-acceleration or cross-default provisions.
Risks related to ownership of our common stock
Blackstone may exercise significant influence over us and its interests may conflict with ours or yours in the future.
As of February 24, 2017, Blackstone beneficially owned approximately 30.1% of our common stock. Moreover, under our amended and restated bylaws and the stockholders’ agreement with Blackstone, we have agreed to nominate to our board individuals designated by Blackstone, whom we refer to as the “Sponsor Directors,” according to the following scale: (1) if Blackstone continues to beneficially own at least 30% (but less than 40%) of our stock, the lowest whole number that is at least 30% of the total number of directors comprising our board of directors; (2) if Blackstone continues to beneficially own at least 20% (but less than 30%) of our stock, the lowest whole number that is at least 20% of the total number of directors comprising our board of directors; and (3) if Blackstone continues to beneficially own at least 5% (but less than 20%) of our stock, the lowest whole number that is at least 10% of the total number of directors comprising our board of directors. We have three directors on our board that are current employees of Blackstone and one director on our board that is a retired employee of Blackstone. Although Blackstone does not own shares of our stock representing a majority of our total voting power, Blackstone is able to significantly influence the composition of our board of
38
directors and the approval of actions requiring stockholder approval. Accordingly, Blackstone has and will continue to have significant influence with respect to our management, business plans and policies, including the appointment and removal of our officers. For example, for so long as Blackstone continues to own a significant percentage of our stock, Blackstone may be able to influence whether or not a change of control of our Company or a change in the composition of our board of directors occurs. In addition, Blackstone may be engaged from time to time in discussions relating to dispositions of its holdings of our common stock, which could include the sale of a significant percentage to a single buyer. If such significant sale were to occur, the buyer could have influence over the management of our company, including through board representation. Any such concentration of ownership could deprive you of an opportunity to receive a premium for your shares of common stock as part of a sale of our Company and ultimately might affect the market price of our common stock.
Blackstone engages in a broad spectrum of activities, including investments in real estate generally and in the hospitality industry in particular. In the ordinary course of their business activities, Blackstone may engage in activities where their interests conflict with our interests or those of our stockholders. For example, Blackstone owns interests in Extended Stay America, Inc., Hilton Worldwide Holdings Inc., Park Hotels & Resorts Inc., Hilton Grand Vacations Inc. and G6 Hospitality, LLC, and certain other investments in the hotel industry that may compete directly or indirectly with us. As a result, they could have interests that could conflict with ours. Additionally, some of our directors are, and our directors may in the future be, engaged in the hospitality industry. Our amended and restated certificate of incorporation provides that none of Blackstone or any director who is not employed by us (including any non-employee director who serves as one of our officers in both his director and officer capacities) or his or her affiliates has any duty to refrain from engaging, directly or indirectly, in the same business activities or similar business activities or lines of business in which we operate. Blackstone also may pursue acquisition opportunities that may be complementary to our business, and, as a result, those acquisition opportunities may not be available to us. In addition, Blackstone may have an interest in having the Company pursue acquisitions, divestitures and other transactions that, in its judgment, could enhance its investment in the Company, even though such transactions might involve risks to you.
Because we have no current plans to pay cash dividends on our common stock, you may not receive any return on your investment unless you sell your common stock for a price greater than that which you paid for it.
We have no current plans to pay any cash dividends. The declaration, amount and payment of any future dividends on shares of common stock will be at the sole discretion of our board of directors. Our board of directors may take into account, among other things, our financial condition, results of operations, level of indebtedness, capital requirements, restrictions in our debt agreements, other contractual restrictions and the terms of any preferred stock, our business prospects and other factors that our board of directors may deem relevant.
Future issuances of common stock by us, and the resale of shares held by Blackstone, could cause the market price of our common stock to decline.
We have approximately 1,868,000,000 shares of common stock authorized but unissued under our amended and restated certificate of incorporation. We are authorized to issue these shares of common stock and options, rights, warrants and appreciation rights relating to common stock for consideration and on terms and conditions established by our board of directors in its sole discretion, whether in connection with acquisitions or otherwise.
In the future, we may issue our securities in connection with investments or acquisitions. The amount of shares of our common stock issued in connection with an investment or acquisition could constitute a material portion of our then outstanding shares of common stock. Any issuance of additional securities, including in connection with investments or acquisitions, may result in dilution to our existing stockholders.
In addition, the sale of substantial amounts of shares of our common stock in the public market, or the perception that such sales could occur, could harm the prevailing market price of shares of our common stock. Pursuant to a registration rights agreement, we have granted our Sponsor the right to cause us, in certain instances, at our expense, to file registration statements under the Securities Act covering resales of our common stock held by them. These shares represented approximately 30.1% of our outstanding common stock as of February 24, 2017. These shares also may be sold pursuant to Rule 144 under the Securities Act, subject to volume, manner of sale and other limitations under Rule 144. As restrictions on resale end or if these stockholders exercise their registration rights, the market price of our stock could decline if the holders of restricted shares sell them or are perceived by the market as intending to sell them.
We have reserved a total of 13,000,000 shares for issuance under our 2014 Omnibus Incentive Plan. As of February 24, 2017, 11.4 million shares of common stock remain available for future awards. We have filed a registration statement on Form S-8 under the Securities Act to register shares of our common stock or securities convertible into or exchangeable for shares of our common stock issued pursuant to our 2014 Omnibus Incentive Plan. Accordingly, shares registered under such registration statement will be available for sale in the open market.
39
In addition, our board and stockholders have approved the adoption of our 2015 Employee Stock Purchase Plan (the “ESPP”), and we have reserved a total of 2,600,000 shares for issuance thereunder. We have filed a registration statement on Form S-8 under the Securities Act to register such shares and any shares purchased under our ESPP will be available for sale in the open market.
Any common stock that we issue, including under our 2014 Omnibus Incentive Plan, ESPP or other equity incentive plans that we may adopt in the future, would dilute your ownership interest in us.
As restrictions on resale end, the market price of our shares of common stock could drop significantly if the holders of these restricted shares sell them or are perceived by the market as intending to sell them. These factors could also make it more difficult for us to raise additional funds through future offerings of our shares of common stock or other securities.
Anti-takeover provisions in our organizational documents and Delaware law might discourage or delay acquisition attempts for us that you might consider favorable.
Our amended and restated certificate of incorporation and amended and restated bylaws contain provisions that may make the merger or acquisition of our Company more difficult without the approval of our board of directors. Among other things:
|
|
• |
although we do not have a stockholder rights plan, and would either submit any such plan to stockholders for ratification or cause such plan to expire within a year, these provisions would allow us to authorize the issuance of undesignated preferred stock in connection with a stockholder rights plan or otherwise, the terms of which may be established and the shares of which may be issued without stockholder approval, and which may include super voting, special approval, dividend, or other rights or preferences superior to the rights of the holders of common stock; |
|
|
• |
these provisions prohibit stockholder action by written consent from and after the date on which the parties to our stockholders’ agreement cease to beneficially own at least 40% of the total voting power of all then outstanding shares of our capital stock unless such action is recommended in advance by all directors then in office, the parties to our stockholders’ agreement beneficially own less than 40% of our outstanding common stock and, accordingly, stockholder action is not permitted by written consent; |
|
|
• |
these provisions provide that the board of directors is expressly authorized to make, alter or repeal our amended and restated bylaws and that our stockholders may only amend our amended and restated bylaws with the approval of 80% or more of all of the outstanding shares of our capital stock entitled to vote; and |
|
|
• |
these provisions establish advance notice requirements for nominations for elections to our board or for proposing matters that can be acted upon by stockholders at stockholder meetings. |
Further, as a Delaware corporation, we are also subject to provisions of Delaware law, which may impair a takeover attempt that our stockholders may find beneficial. These anti-takeover provisions and other provisions under Delaware law could discourage, delay or prevent a transaction involving a change in control of our Company, including actions that our stockholders may deem advantageous, or negatively affect the trading price of our common stock. These provisions could also discourage proxy contests and make it more difficult for you and other stockholders to elect directors of your choosing and to cause us to take other corporate actions you desire.
None.
As of December 31, 2016, we owned 322 hotels, representing 41,236 rooms. Five of 322 hotels are held for sale as of December 31, 2016. Eighteen of our owned hotels are either completely or partially on land subject to ground leases. All of the remaining hotel properties and grounds are fully owned (except for a La Quinta Inn in New Orleans, Louisiana, which is owned by a joint venture in which we have a controlling interest).
40
Owned Hotels
|
State |
|
Hotels |
|
|
Number of Rooms |
|
||
|
Texas |
|
|
70 |
|
|
|
9,441 |
|
|
Florida |
|
|
50 |
|
|
|
6,125 |
|
|
California |
|
|
21 |
|
|
|
3,127 |
|
|
Colorado |
|
|
15 |
|
|
|
1,894 |
|
|
Louisiana |
|
|
13 |
|
|
|
1,796 |
|
|
Georgia |
|
|
14 |
|
|
|
1,696 |
|
|
Arizona |
|
|
11 |
|
|
|
1,421 |
|
|
North Carolina |
|
|
10 |
|
|
|
1,297 |
|
|
Wisconsin |
|
|
13 |
|
|
|
1,262 |
|
|
Illinois |
|
|
8 |
|
|
|
1,097 |
|
|
Tennessee |
|
|
8 |
|
|
|
988 |
|
|
Ohio |
|
|
9 |
|
|
|
962 |
|
|
New Mexico |
|
|
8 |
|
|
|
914 |
|
|
Alabama |
|
|
6 |
|
|
|
737 |
|
|
South Carolina |
|
|
5 |
|
|
|
675 |
|
|
New York |
|
|
5 |
|
|
|
605 |
|
|
New Jersey |
|
|
3 |
|
|
|
553 |
|
|
Nevada |
|
|
3 |
|
|
|
509 |
|
|
Massachusetts |
|
|
4 |
|
|
|
504 |
|
|
Utah |
|
|
4 |
|
|
|
466 |
|
|
Arkansas |
|
|
3 |
|
|
|
460 |
|
|
Indiana |
|
|
4 |
|
|
|
441 |
|
|
Minnesota |
|
|
2 |
|
|
|
420 |
|
|
Washington |
|
|
3 |
|
|
|
419 |
|
|
Connecticut |
|
|
3 |
|
|
|
414 |
|
|
Maryland |
|
|
3 |
|
|
|
366 |
|
|
Missouri |
|
|
3 |
|
|
|
327 |
|
|
Michigan |
|
|
3 |
|
|
|
304 |
|
|
Virginia |
|
|
2 |
|
|
|
266 |
|
|
Pennsylvania |
|
|
2 |
|
|
|
239 |
|
|
Oklahoma |
|
|
2 |
|
|
|
236 |
|
|
Nebraska |
|
|
2 |
|
|
|
222 |
|
|
Vermont |
|
|
2 |
|
|
|
185 |
|
|
Kentucky |
|
|
1 |
|
|
|
129 |
|
|
Rhode Island |
|
|
1 |
|
|
|
115 |
|
|
Kansas |
|
|
1 |
|
|
|
106 |
|
|
Maine |
|
|
1 |
|
|
|
105 |
|
|
New Hampshire |
|
|
1 |
|
|
|
105 |
|
|
Wyoming |
|
|
1 |
|
|
|
105 |
|
|
Iowa |
|
|
1 |
|
|
|
102 |
|
|
Mississippi |
|
|
1 |
|
|
|
101 |
|
|
|
|
|
322 |
|
|
|
41,236 |
|
For further information regarding our hotels, see “Item 1. Business—Our brand and our hotels.”
Corporate Headquarters
Our corporate headquarters are located at 909 Hidden Ridge, Suite 600, Irving, Texas 75038. These offices consist of approximately 67,000 square feet of leased space. The lease for this property initially expires in 2022, with options to renew.
We believe that our corporate headquarters are in good condition and are sufficient and suitable for the conduct of our business. In the event we need to expand our operations, we believe that suitable space will be available on commercially reasonable terms.
41
On April 25, 2016, a purported stockholder class action lawsuit, captioned Beisel v. La Quinta Holdings Inc. et al., was filed in the U.S. District Court for the Southern District of New York on behalf of purchasers of the Company’s common stock pursuant to the Company’s March 24, 2015 secondary public offering (the “March Secondary Offering”) and on behalf of purchasers of the Company’s common stock from November 19, 2014 through October 29, 2015 (the “Class Period”). On July 22, 2016, the court appointed lead plaintiff, and on September 30, 2016, lead plaintiff filed an amended complaint. The amended complaint names as defendants the Company, certain current and former Company officers, and certain current and former members of the board of directors, among others. The complaint alleges, among other things, that, in violation of the federal securities laws, the registration statement and prospectus filed in connection with the March Secondary Offering contained materially false and misleading information or omissions and that the Company as well as certain current and former officers made false and misleading statements in earnings releases and to analysts during the Class Period. Plaintiff seeks unspecified compensatory damages and other relief. The Company believes that the putative class action lawsuit is without merit and intends to defend the lawsuit vigorously; however, there can be no assurance regarding the ultimate outcome of this lawsuit.
In addition, we are a party to a number of pending claims and lawsuits arising in the normal course of business, including proceedings involving tort and other general liability claims, workers’ compensation and other employee claims and intellectual property claims. We do not consider our ultimate liability with respect to any single claim or lawsuit, or the aggregate of such claims and lawsuits, to be material in relation to our combined financial condition, results of operations, or our cash flows taken as a whole
We maintain general and other liability insurance; however, certain costs of defending lawsuits, such as those below the retention or insurance deductible amount, are not covered by or are only partially covered by insurance policies, and our insurance carriers could refuse to cover certain claims in whole or in part. We regularly evaluate our ultimate liability costs with respect to such claims and lawsuits. We accrue costs from litigation as they become probable and estimable.
Not applicable.
42
|
Item 5. |
Market for Registrant’s Common Equity, Related Stockholder Matters and Issuer Purchases of Equity Securities |
Market Information
Our common stock began trading publicly on the NYSE under the symbol “LQ” on April 9, 2014. Prior to that time, there was no public market for our common stock. As of February 24, 2017, there were approximately 141 holders of record of our common stock. This stockholder figure does not include a substantially greater number of holders whose shares are held of record by banks, brokers and other financial institutions. The following table sets forth the high and low sales prices for our common stock as reported by the NYSE for the indicated periods:
|
|
|
Stock Price |
|
|||||
|
|
|
High |
|
|
Low |
|
||
|
Fiscal Year Ended December 31, 2015 |
|
|
|
|
|
|
|
|
|
First Quarter |
|
$ |
24.38 |
|
|
$ |
19.76 |
|
|
Second Quarter |
|
$ |
24.94 |
|
|
$ |
22.37 |
|
|
Third Quarter |
|
$ |
24.18 |
|
|
$ |
15.36 |
|
|
Fourth Quarter |
|
$ |
17.46 |
|
|
$ |
13.32 |
|
|
Fiscal Year Ended December 31, 2016 |
|
|
|
|
|
|
|
|
|
First Quarter |
|
$ |
13.50 |
|
|
$ |
9.42 |
|
|
Second Quarter |
|
$ |
13.75 |
|
|
$ |
10.25 |
|
|
Third Quarter |
|
$ |
12.79 |
|
|
$ |
10.40 |
|
|
Fourth Quarter |
|
$ |
14.51 |
|
|
$ |
9.73 |
|
Dividends
We have no current plans to pay dividends on our common stock. Any decision to declare and pay dividends in the future will be made at the sole discretion of our board of directors and will depend on, among other things, our financial condition, results of operations, cash requirements, contractual restrictions and other factors that our board of directors may deem relevant. Because we are a holding company, and have no direct operations, we will only be able to pay dividends from funds we receive from our subsidiaries.
We have not declared or paid any dividends on our common stock since consummation of the IPO.
Issuer Purchases of Equity Securities
The following table sets forth information with respect to shares of our common stock purchased by the Company during the periods indicated:
|
Period |
|
Total Number of Shares Purchased (1) |
|
|
Weighted Average Price Paid per Share |
|
|
Total Number of Shares Purchased as Part of Publicly Announced Plans or Programs |
|
|
Maximum Number ( or Approximate Dollar Value) of Shares that May Yet Be Purchased Under the Plans or Programs |
|
||||
|
October 1 through October 31, 2016 |
|
|
1,883 |
|
|
$ |
11.62 |
|
|
|
— |
|
|
$ |
— |
|
|
November 1 through November 30, 2016 |
|
|
912 |
|
|
|
10.92 |
|
|
|
— |
|
|
|
— |
|
|
December 1 through December 31, 2016 |
|
|
60,591 |
|
|
|
14.19 |
|
|
|
— |
|
|
|
— |
|
|
Total |
|
|
63,386 |
|
|
$ |
14.07 |
|
|
|
— |
|
|
|
|
|
43
|
|
(1) |
Includes 1,883, 912 and 60,591 shares for the periods from October 1 through October 31, 2016, November 1 through November 30, 2016 and December 1 through December 31, 2016, respectively, repurchased to satisfy tax withholding obligations incurred upon the vesting of restricted stock awarded under the Company’s Amended and Restated 2014 Omnibus Incentive Plan. |
Recent Sales of Unregistered Securities
During the year ended December 31, 2016, we did not sell any equity securities that were not registered under the Securities Act.
Performance Graph
The following graph compares the cumulative total stockholder return since April 9, 2014, the date our common stock began trading on the NYSE, with the S&P 500 Index (“S&P 500”) and the S&P Hotels, Resorts & Cruise Lines Index (“S&P Hotel”). The graph assumes that the value of the investment in our common stock and each index was $100 on April 9, 2014 and that all dividends and other distributions were reinvested. The stock price performance of the following graph is not necessarily indicative of future stock price performance.
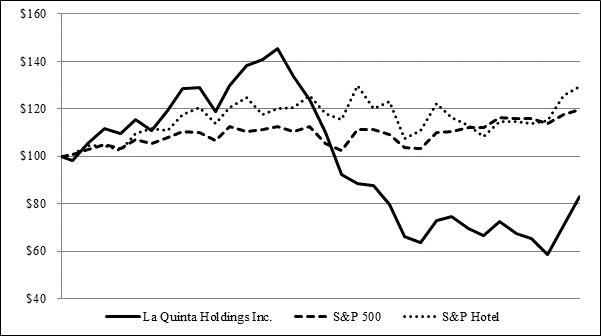
|
Date |
|
La Quinta Holdings Inc. |
|
|
S&P 500 |
|
|
S&P Hotel |
|
|||
|
April 9, 2014 |
|
$ |
100.00 |
|
|
$ |
100.00 |
|
|
$ |
100.00 |
|
|
December 31, 2014 |
|
|
128.86 |
|
|
|
109.97 |
|
|
|
120.59 |
|
|
December 31, 2015 |
|
|
79.50 |
|
|
|
109.17 |
|
|
|
122.98 |
|
|
December 31, 2016 |
|
|
83.00 |
|
|
|
119.58 |
|
|
|
129.32 |
|
This performance graph and related information shall not be deemed to be “soliciting material” or to be “filed” with the SEC, and shall not be deemed to be incorporated by reference into any filing of the Registrant under the Securities Act or Exchange Act.
We derived the selected statement of operations data for the years ended December 31, 2016, 2015 and 2014 and the selected balance sheet data as of December 31, 2016 and 2015 from our audited consolidated financial statements included elsewhere in this Annual Report on Form 10-K. We derived the selected statement of operations data for the years ended December 31, 2013 and 2012 and the selected balance sheet data as of December 31, 2014, 2013 and 2012 from our consolidated financial statements which are not included in this Annual Report on Form 10-K. Our historical results are not necessarily indicative of the results expected for any future period.
44
Our historical financial statements for the periods prior to the IPO were prepared by consolidating the financial results of the entities owned by the Company at the completion of the IPO, including those entities under common control and their consolidated subsidiaries, which corresponds to the results of operations for the Company on a prospective basis after giving effect to the consummation of the Pre-IPO Transactions and the IPO. The table below for the periods prior to the completion of the IPO does not include the Previously Managed Portfolio. Prior to their acquisition as part of the Pre-IPO Transactions, the Previously Managed Portfolio were not under common control.
Additionally, prior to December 31, 2014, assets held for sale and the results of their operations have been classified as discontinued operations. As of December 31, 2016 and 2015, five and 13 of our La Quinta-branded hotels and one restaurant parcel were classified as assets held for sale, respectively. The sale of these assets does not represent a major strategic shift and does not qualify for discontinued operations reporting under the current accounting standards.
In the first quarter of 2016, the Company elected to adopt ASU No, 2015-05, “Intangibles – Goodwill and Other – Internal-Use Software (Subtopic 350-40): Customer’s Accounting for Fees Paid in a Cloud Computing Agreement”. Accordingly, software license amortizations which were formerly classified as a depreciation and amortization expenses have been reclassified to general and administrative expenses in the table below.
The selected financial data below should be read together with the audited consolidated financial statements including the related notes thereto, and “Part II—Item 7. Management’s Discussion and Analysis of Financial Condition and Results of Operations” included elsewhere in this Annual Report on Form 10-K.
|
|
|
Years ended December 31, |
|
|||||||||||||||||
|
(in thousands) |
|
2016 |
|
|
2015 |
|
|
2014 |
|
|
2013 |
|
|
2012 |
|
|||||
|
Statement of Operations Data: |
|
|
|
|
|
|
|
|
|
|
|
|
|
|
|
|
|
|
|
|
|
Revenues: |
|
|
|
|
|
|
|
|
|
|
|
|
|
|
|
|
|
|
|
|
|
Room revenues |
|
$ |
855,302 |
|
|
$ |
887,358 |
|
|
$ |
846,203 |
|
|
$ |
757,699 |
|
|
$ |
714,143 |
|
|
Franchising and other fee-based revenues |
|
|
106,468 |
|
|
|
100,069 |
|
|
|
89,718 |
|
|
|
79,180 |
|
|
|
69,206 |
|
|
Other hotel revenues |
|
|
19,334 |
|
|
|
19,343 |
|
|
|
19,536 |
|
|
|
17,949 |
|
|
|
17,506 |
|
|
|
|
|
981,104 |
|
|
|
1,006,770 |
|
|
|
955,457 |
|
|
|
854,828 |
|
|
|
800,855 |
|
|
Brand marketing fund revenues from franchised and managed properties |
|
|
25,150 |
|
|
|
23,204 |
|
|
|
21,481 |
|
|
|
19,065 |
|
|
|
17,157 |
|
|
Total revenues |
|
|
1,006,254 |
|
|
|
1,029,974 |
|
|
|
976,938 |
|
|
|
873,893 |
|
|
|
818,012 |
|
|
Operating Expenses: |
|
|
|
|
|
|
|
|
|
|
|
|
|
|
|
|
|
|
|
|
|
Direct lodging expenses |
|
|
409,886 |
|
|
|
398,828 |
|
|
|
378,705 |
|
|
|
344,515 |
|
|
|
334,394 |
|
|
Depreciation and amortization |
|
|
147,081 |
|
|
|
166,642 |
|
|
|
165,887 |
|
|
|
156,528 |
|
|
|
149,720 |
|
|
General and administrative expenses |
|
|
115,715 |
|
|
|
125,697 |
|
|
|
149,894 |
|
|
|
82,343 |
|
|
|
80,270 |
|
|
Other lodging and operating expenses |
|
|
62,281 |
|
|
|
63,513 |
|
|
|
56,984 |
|
|
|
56,068 |
|
|
|
58,266 |
|
|
Marketing, promotional and other advertising expenses |
|
|
68,327 |
|
|
|
69,810 |
|
|
|
62,161 |
|
|
|
59,193 |
|
|
|
48,610 |
|
|
Impairment loss |
|
|
104,258 |
|
|
|
50,121 |
|
|
|
5,157 |
|
|
|
— |
|
|
|
— |
|
|
(Gain) loss on sales |
|
|
(4,908 |
) |
|
|
4,088 |
|
|
|
— |
|
|
|
— |
|
|
|
— |
|
|
|
|
|
902,640 |
|
|
|
878,699 |
|
|
|
818,788 |
|
|
|
698,647 |
|
|
|
671,260 |
|
|
Brand marketing fund expenses from franchised and managed properties |
|
|
25,150 |
|
|
|
23,204 |
|
|
|
21,481 |
|
|
|
19,065 |
|
|
|
17,157 |
|
|
Total operating expenses |
|
|
927,790 |
|
|
|
901,903 |
|
|
|
840,269 |
|
|
|
717,712 |
|
|
|
688,417 |
|
|
Operating Income |
|
|
78,464 |
|
|
|
128,071 |
|
|
|
136,669 |
|
|
|
156,181 |
|
|
|
129,595 |
|
45
|
|
|
Years ended December 31, |
|
|||||||||||||||||
|
(in thousands) |
|
2016 |
|
|
2015 |
|
|
2014 |
|
|
2013 |
|
|
2012 |
|
|||||
|
Other Income (Expenses): |
|
|
|
|
|
|
|
|
|
|
|
|
|
|
|
|
|
|
|
|
|
Interest expense, net |
|
|
(81,419 |
) |
|
|
(86,504 |
) |
|
|
(120,945 |
) |
|
|
(148,615 |
) |
|
|
(103,124 |
) |
|
Other income (loss) |
|
|
2,345 |
|
|
|
7,632 |
|
|
|
3,261 |
|
|
|
1,048 |
|
|
|
(7,440 |
) |
|
(Loss) gain on extinguishment of debt, net |
|
|
— |
|
|
|
— |
|
|
|
(2,030 |
) |
|
|
— |
|
|
|
1,192 |
|
|
Total other income (expenses) |
|
|
(79,074 |
) |
|
|
(78,872 |
) |
|
|
(119,714 |
) |
|
|
(147,567 |
) |
|
|
(109,372 |
) |
|
(Loss) income from continuing operations before income taxes |
|
|
(610 |
) |
|
|
49,199 |
|
|
|
16,955 |
|
|
|
8,614 |
|
|
|
20,223 |
|
|
Income tax expense |
|
|
(493 |
) |
|
|
(22,487 |
) |
|
|
(28,805 |
) |
|
|
(3,598 |
) |
|
|
(3,135 |
) |
|
Recognition of net deferred tax liabilities upon C-corporation conversion |
|
|
— |
|
|
|
— |
|
|
|
(321,054 |
) |
|
|
— |
|
|
|
— |
|
|
(Loss) income from continuing operations, net of tax |
|
|
(1,103 |
) |
|
|
26,712 |
|
|
|
(332,904 |
) |
|
|
5,016 |
|
|
|
17,088 |
|
|
Loss on discontinued operations, net of tax |
|
|
— |
|
|
|
— |
|
|
|
(503 |
) |
|
|
(2,495 |
) |
|
|
(52,852 |
) |
|
Net (Loss) Income |
|
$ |
(1,103 |
) |
|
$ |
26,712 |
|
|
$ |
(333,407 |
) |
|
$ |
2,521 |
|
|
$ |
(35,764 |
) |
|
Net (Income) Loss Attributable to Noncontrolling Interests |
|
|
(185 |
) |
|
|
(347 |
) |
|
|
(3,890 |
) |
|
|
1,455 |
|
|
|
4,810 |
|
|
Net (Loss) Income Attributable to the Company |
|
$ |
(1,288 |
) |
|
$ |
26,365 |
|
|
$ |
(337,297 |
) |
|
$ |
3,976 |
|
|
$ |
(30,954 |
) |
|
Basic (loss) earnings per share |
|
$ |
(0.01 |
) |
|
$ |
0.21 |
|
|
$ |
(2.67 |
) |
|
$ |
0.03 |
|
|
$ |
(0.25 |
) |
|
Diluted (loss) earnings per share |
|
$ |
(0.01 |
) |
|
$ |
0.20 |
|
|
$ |
(2.67 |
) |
|
$ |
0.03 |
|
|
$ |
(0.25 |
) |
|
|
|
As of December 31, |
|
|||||||||||||||||
|
(in thousands) |
|
2016 |
|
|
2015 |
|
|
2014 |
|
|
2013 |
|
|
2012 |
|
|||||
|
Selected Balance Sheet Data: |
|
|
|
|
|
|
|
|
|
|
|
|
|
|
|
|
|
|
|
|
|
Cash and cash equivalents |
|
|
160,596 |
|
|
|
86,709 |
|
|
|
109,857 |
|
|
|
33,412 |
|
|
|
40,813 |
|
|
Restricted cash |
|
|
— |
|
|
|
— |
|
|
|
— |
|
|
|
104,026 |
|
|
|
113,407 |
|
|
Total assets |
|
|
2,892,523 |
|
|
|
2,985,844 |
|
|
|
3,179,773 |
|
|
|
3,161,711 |
|
|
|
3,346,512 |
|
|
Total debt (1) |
|
|
1,699,950 |
|
|
|
1,712,099 |
|
|
|
1,859,511 |
|
|
|
2,712,163 |
|
|
|
2,890,157 |
|
|
Total equity |
|
|
657,837 |
|
|
|
746,512 |
|
|
|
808,455 |
|
|
|
305,253 |
|
|
|
303,385 |
|
|
(1) |
Includes current portion |
46
The following discussion and analysis of our financial condition and results of operations should be read in conjunction with our financial statements and related notes included elsewhere in this Annual Report on Form 10-K. For our Basis of Presentation, please see the information under the headings “Organization” and “Basis of Presentation and Use of Estimates” in Note 1 to our audited consolidated financial statements included in Part II, Item 8 of this report.
The following discussion contains forward-looking statements that reflect our plans, estimates and beliefs and involve numerous risks and uncertainties, including but not limited to those described in the “Risk Factors” section of this Annual Report on Form 10-K. Actual results may differ materially from those contained in any forward-looking statements. You should carefully read “Risk Factors” and “Special Note Regarding Forward-Looking Statements.”
Overview
Our business
We are a leading owner, operator and franchisor of select-service hotels primarily serving the midscale and upper-midscale segments under the La Quinta brand. All new franchised hotels in the U.S. and Canada are La Quinta Inn & Suites. Building on this strong brand identity, in the second quarter of 2016, we converted all Mexico locations to the “LQ Hotel” trademark as the primary hotel identifier, with the “La Quinta” tag line. All new franchised locations in Mexico and in Central and South America will now use the “LQ Hotel” as their primary trademark. Our system-wide portfolio, as of December 31, 2016, consisted of 888 hotels representing approximately 87,200 rooms located predominantly across 48 U.S. states, as well as in Canada, Mexico, Honduras and Colombia, of which 322 hotels were owned and operated and 566 were franchised. We also have a pipeline of 248 franchised hotels in the United States, Mexico, Colombia, Nicaragua, Guatemala, Chile and El Salvador. We primarily derive our revenues from owned hotel operations and fees generated from franchised hotels.
All of our long-lived assets are located in the United States and, for the year ended December 31, 2016, we derived over 99% of our revenue from within the United States.
Segments
Our operating segments are components of the business which are managed discretely and for which discrete financial information is reviewed regularly by our Chief Executive Officer, who is our chief operating decision maker, to assess performance and make decisions regarding the allocation of resources. We define our reportable segments as follows:
|
|
• |
Owned hotels —This segment derives its earnings from the operation of owned hotel properties located in the United States. |
|
|
• |
Franchise and management —This segment derives its earnings primarily from fees earned under various license, franchise and management agreements relating to our owned and franchised hotels. These agreements provide for us to earn compensation for the licensing of our brand to franchisees, for providing certain services (including hotel management services) and for providing access to certain shared services and marketing programs such as reservations, La Quinta Returns, and property management systems. Other than with respect to the Previously Managed Portfolio, which are reflected as managed hotels prior to their acquisition in connection with the IPO in this “Management’s Discussion and Analysis of Financial Condition and Results of Operations” section, we do not currently generate, and did not generate over the periods presented, any revenue from the management of hotel operations for third parties. This segment includes intercompany fees, which are charged to our owned portfolio to reflect that certain functions, such as franchise, licensing and management, are included in the franchise and management segment. Prior to the IPO, we charged aggregate fees of 2.0% (0.33% license fee for trademark rights and 1.67% management fee for management services) to our owned hotels (as well as having certain cost reimbursement arrangements). Upon effectiveness of the IPO, we entered into new franchise and management agreements covering our owned portfolio, which cover certain services as well as trademark rights, and terminated the agreements that existed prior to the IPO. The new agreements provide for a franchise fee of 4.5% of gross room revenues and a management fee of 2.5% of gross operating revenue for our owned hotels. We set the franchise fee on a basis that reflects the services and rights covered by the new franchise agreements and because, as a public company with two segments that may be valued differently by investors, we believe it is meaningful to investors to show a franchise fee on our owned portfolio that is consistent with the franchise fee we charge our franchisees. We set the management fee on a basis that reflects current market rates for select service hotels, the current composition of our owned portfolio and the services to be provided. For purposes of this “Management’s Discussion and Analysis of Financial Condition and Results of Operations” section, we have reflected the historical aggregate intercompany fees of 2.0% prior to the IPO date, and the new rates for the period from April 14, 2014 to December 31, 2016 |
47
Our segment information also reflects corporate and other, which includes revenues generated by and related to operating expenses incurred in connection with the overall support and brand management of our owned, managed and franchised hotels and operations. The franchise agreements with our owned hotels also include a reservation fee of 2.0% of gross room revenues, which is reflected in corporate and other for the period from April 14, 2014 to December 31, 2016.
We currently have a business model that involves both ownership of properties and franchising of third-party owned properties. This provides us with diversified revenue and income streams that balance both the advantages and risks associated with these lines of business.
As an owner of hotels, we can capture the full benefit of increases in operating profits during periods of increasing demand or ADR. The cost structure of our typical hotel is more fixed than variable, so as demand and ADR increase over time, the pace of increase in operating profits typically is higher than the pace of increase of revenues. Hotel ownership is, however, more capital intensive than granting franchise agreements to third-party hotel owners, as we are responsible for the costs and capital expenditures for our Owned Hotels. The profits realized by us in our Owned Hotels segment are generally more significantly affected by economic downturns and declines in revenues than the results of our Franchise hotels. See also “—Key components and factors affecting our results of operations—Expenses” and “Risk Factors—Risks related to our business and industry.”
As a franchisor of hotels, growth in the number of franchised hotels and earnings from franchises typically results in higher overall returns on invested capital because the capital required to build and maintain franchised hotels is typically provided by the owner of the respective property with minimal or no capital required by us, as franchisor. During periods of increasing demand, we do not, however, share in most of the benefits of increases in profits from franchised hotels because franchisees do not pay us fees based on profits. A principal component of our current growth strategy is to focus our expansion on our franchise business.
On January 18, 2017, we announced that we are pursuing the possibility of separating our real estate business from our franchise and management businesses, which could prove to be the most logical next step as we continue to execute on our key strategic initiatives and create value for our stakeholders. This separation of our businesses could enable greater strategic clarity and allow us to take advantage of growth opportunities that naturally flow from each business model. This could also enable shareholders to own and value each business independently, allowing each company to attract the investor base most appropriate for its distinct investment profile. There is no assurance that the separation of our business will occur. See “Risk Factors—Risks related to pursuing the separation of our businesses.”
For purposes of this “Management’s Discussion and Analysis of Financial Condition and Results of Operations,” the following table sets forth the number of net owned, franchised and managed hotels as of December 31, 2016, 2015 and 2014.
|
|
|
As of December 31, |
|
|||||||||
|
|
|
2016 |
|
|
2015 |
|
|
2014 |
|
|||
|
Owned Hotels: |
|
|
|
|
|
|
|
|
|
|
|
|
|
Owned Hotels (1) |
|
|
322 |
|
|
|
341 |
|
|
|
353 |
|
|
Franchised Hotels (2) |
|
|
566 |
|
|
|
545 |
|
|
|
514 |
|
|
Total Net Owned and Franchised/Managed Hotels |
|
|
888 |
|
|
|
886 |
|
|
|
867 |
|
|
(1) |
Owned Hotels as of December 31, 2016, 2015 and 2014 includes 18 properties that are subject to ground leases; we include these 18 properties as “Owned Hotels” throughout this Management’s Discussion and Analysis of Financial Condition and Results of Operations. Owned Hotels also includes one hotel owned via a joint venture in which we have a controlling interest. As of December 31, 2016 and 2015, Owned Hotels includes five and 13 hotels designated as assets held for sale, which are subject to definitive purchase agreements, respectively. |
|
(2) |
As of December 31, 2016 and 2015, Franchised Hotels includes five and one hotels, respectively, that are temporary franchise agreements related to owned hotels that are in the process of exiting the system. |
Seasonality
The hotel industry is seasonal in nature. Generally, our revenues are greater in the second and third quarters than in the first and fourth quarters. The timing of holidays can also impact our quarterly results. The periods during which our properties experience higher revenues vary from property to property and depend principally upon location. This seasonality can be expected to cause quarterly fluctuations in revenue, profit margins and net earnings. Additionally, our quarterly results may be further affected by the timing of certain of our marketing production expenditures. Further, the timing of opening of newly constructed or franchised hotels and the timing of any hotel acquisitions or dispositions may cause a variation of revenue and earnings from quarter to quarter.
48
Inflation
We do not believe that inflation had a material effect on our business during years ended December 31, 2016, 2015 and 2014. Although we believe that increases in the rate of inflation will generally result in comparable increases in hotel room rates, severe inflation could contribute to a slowing of the U.S. economy. Such a slowdown could result in a reduction in room rates and occupancy levels, negatively impacting our revenues and net income.
Key components and factors affecting our results of operations
Revenues
We primarily derive our revenues from the following sources:
|
|
• |
Room revenues. Represents revenues derived from hotel operations at owned hotels which are almost exclusively driven by room rentals. These revenues are primarily derived from three categories of guests: leisure, corporate and group. |
|
|
• |
Franchise fees. Represents revenues derived from franchise fees received in connection with the franchising of our brand, and other revenue generated by the incidental support of hotel operations for franchised hotels. Franchise fees consist of an initial fee upon the entry of a new hotel into the system and a monthly royalty fee, generally calculated as a percentage of gross room revenue. As new franchised hotels are established in our franchise system, we expect the franchise fees received from such hotels to increase over time as they establish their presence in the marketplace and stabilize their operations. If a franchise property changes owners, we generally charge a transfer fee. |
|
|
• |
Management fees. Represents revenues derived from management fees received in connection with the management of day-to-day hotel operations, and other revenue generated by the incidental support of hotel operations for managed properties. Management fees are generally calculated as a percentage of gross room revenue. After the consummation of the IPO Transactions, we no longer have any management fees from third parties. |
|
|
• |
Other hotel revenues. Other hotel revenues include revenues generated by the incidental support of hotel operations for owned hotels, including charges to guests for vending commissions, meeting and banquet room revenue, laundry services, and other rental income from operating leases associated with leasing space for restaurants, billboards and cell towers. |
|
|
• |
Brand marketing fund revenues from franchised and managed properties. These revenues represent the fees collected from our franchised and managed hotels related to our Brand Marketing Fund (“BMF”), which are calculated as a percentage of gross room revenues. The corresponding expenses are presented as other expenses from franchised and managed properties in our condensed consolidated statements of operations, resulting in no impact to continuing operating (loss) income or net (loss) income. After the consummation of the IPO Transactions, we no longer have BMF revenues from properties managed for third parties. |
Consumer demand for our services is closely linked to the performance of the general economy on both a national and regional basis and is sensitive to business and personal discretionary spending levels. Declines in consumer demand due to adverse general economic conditions, risks affecting or reducing travel patterns, lower consumer confidence and adverse political conditions can lower the revenues and profitability of our owned hotels and the amount of franchise fee revenues we are able to generate from our franchised hotels. As a result, changes in consumer demand and general business cycles can subject, and have subjected, our revenues to significant volatility. See “Risk Factors—Risks related to our business and industry.”
The downturn in the oil and gas industry has significantly affected demand in markets defined by Smith Travel Research (“STR”), a primary source for third-party market data and industry statistics and forecasts, as “oil tracts,” significantly affecting our business in those markets, and a further decline could further affect our business in those markets.
In addition to general economic conditions, our guest satisfaction scores, the location of our hotels, the expenditures that we and our franchisees incur to improve our hotels, our loyalty program and the quality of our service impact our ADR, occupancy rates, RevPAR and RevPAR Index performance (each of which is described below under “—Key indicators of financial condition and operating performance”). Changes in ADR, occupancy, RevPAR and RevPAR Index performance significantly impact our revenues.
Our review of our owned hotel portfolio has identified approximately 50 properties that, with the appropriate scope of capital investment and renovation, we believe have the opportunity to re-position within a market, capturing occupancy and additional rate while being measured against new, higher-quality competitive sets.
The first wave of these renovations commenced in the fourth quarter of 2016, with the start and completion dates for these projects being staggered over the next few quarters. The timing of the renovations has been sequenced with the goal of minimizing displacement, and maximizing readiness for peak demand seasons to come, such as the important spring break and summer travel seasons.
49
For the balance of our owned portfolio, our ongoing strategic review could result in several outcomes, such as:
|
|
• |
The property is appropriately positioned within its market; or |
|
|
• |
The property should be part of the next phase of incremental renovations; or |
|
|
• |
The property should be disposed of and/or removed from the La Quinta brand, opening the market to potential new franchise development. |
If a decision is made to dispose of a hotel or groups of hotels from the La Quinta brand, we expect that our revenue and Adjusted EBITDA from owned hotels will decrease and that decrease may be material. Additionally, a decision to dispose of a hotel or groups of hotels may result in an impairment charge related to the reduced holding period of the hotels.
Expenses
We primarily incur the following expenses:
|
|
• |
Direct lodging expenses and other lodging and operating expenses. Direct lodging and Other lodging and operating expenses reflect the operating expenses of our owned hotels, including both direct and indirect hotel operating expenses. Direct lodging expenses include items such as compensation costs for hotel level management, housekeeping, laundry and front desk staff, supply costs for guest room amenities and laundry, repairs and maintenance, utilities, sales and local marketing, bad debt expenses related to direct-bill corporate customers, and online and offline travel agency commissions. Other lodging and operating expenses include indirect property operating expenses, primarily property taxes and insurance. |
|
|
• |
Depreciation and amortization. These are non-cash expenses that primarily consist of depreciation of fixed assets such as buildings, furniture, fixtures and equipment at our owned hotels, as well as certain corporate assets. Amortization expense primarily consists of amortization of intangibles related to our franchise business, and other leasehold interests, all of which are amortized over their estimated useful lives. |
|
|
• |
General and administrative expenses. General and administrative expenses consist primarily of compensation expense for our corporate staff and personnel supporting our business segments, professional fees (including consulting, audit and legal fees), travel and entertainment expenses, contractual performance obligations and office administrative and related expenses. |
|
|
• |
Impairment losses. We hold amortizing and non-amortizing intangible assets and long-lived assets. We evaluate these assets for impairment as further discussed in “—Critical accounting policies and estimates.” These evaluations have, in the past, resulted in impairment losses for certain of these assets based on the specific facts and circumstances surrounding those assets and our estimates of the fair value of those assets. Based on economic conditions, estimated holding periods or other factors at a hotel-specific or system-wide level, we may be required to take additional impairment losses to reflect further declines in our asset and/or investment values. |
|
|
• |
Brand marketing fund expenses from franchised and managed properties. These expenses represent the expenditure of BMF fees collected from our franchised hotels for marketing and other support of the La Quinta brand. The corresponding revenues are presented as other revenues from franchised properties in our condensed consolidated statements of operations, resulting in no impact to operating income or net income. After the consummation of the IPO Transactions, we no longer have BMF expenses from properties managed for third parties. |
|
|
• |
Marketing, promotional and other advertising expenses. These expenses include advertising costs associated with general promotion of the La Quinta brand and specific advertising and marketing support for our operation and for the operations of our franchisees, which are in addition to the expenditure of BMF fees collected from franchised and managed properties for the same purpose. |
Fluctuations in operating expenses at our owned hotels can be related to various factors, including changes in occupancy rates, which directly impact certain variable expenses including labor, supplies, utilities and other operating expenses. However, certain of our expenses are relatively fixed, including rent, property taxes, liability insurance and, to a certain extent, payroll. As market conditions dictate, we take steps to adjust both our variable and fixed costs to levels we feel are appropriate to enhance guest experience, maximize profitability and respond to market conditions without jeopardizing the overall guest experience or the value of our hotels or brand. In addition, changes in depreciation expenses may be impacted by renovations of existing hotels or the disposition of existing hotels through sale or closure. General and administrative expenses may also fluctuate from period to period, primarily related to support of the Company’s overall strategic initiatives.
For other factors affecting our costs and expenses, see “Risk factors—Risks related to our business and industry.”
50
Key indicators of financial condition and operating performance
We use a variety of financial and other information in monitoring the financial condition and operating performance of our business. Some of this information is financial information that is prepared in accordance with generally accepted accounting principles (“GAAP”) in the United States of America, while other information may be financial in nature and may not be prepared in accordance with GAAP. Our management also uses other information that may not be financial in nature, including statistical information and comparative data that are commonly used within the lodging industry to evaluate hotel financial and operating performance. Our management uses this information to measure the performance of hotel properties and/or our business as a whole. Historical information is periodically compared to our internal budgets, as well as against industry-wide information. We use this information for planning and monitoring our business, as well as in determining management and employee compensation.
Average daily rate (“ADR”) represents hotel room revenues divided by total number of rooms sold in a given period. ADR measures the average room price attained by a hotel or group of hotels, and ADR trends provide useful information concerning pricing policies and the nature of the guest base of a hotel or group of hotels. Changes in room rates have an impact on overall revenues and profitability.
Occupancy represents the total number of rooms sold in a given period divided by the total number of rooms available at a hotel or group of hotels. Occupancy measures the utilization of our hotels’ available capacity. Management uses occupancy to gauge demand at a specific hotel or group of hotels in a given period. Occupancy levels also help us determine achievable ADR levels as demand for hotel rooms increases or decreases.
Revenue per available room (“RevPAR”) is defined as the product of the ADR charged and the average daily occupancy achieved. RevPAR does not include other ancillary, non-room revenues, such as food and beverage revenues or parking, telephone or other guest service revenues generated by a hotel, which are not significant for the Company.
As it pertains to owned hotels, RevPAR changes that are driven predominately by occupancy have different implications for overall revenue levels and incremental hotel operating profit than changes driven predominately by ADR. For example, increases in occupancy at a hotel would lead to increases in room revenues, as well as incremental operating costs (including, but not limited to, housekeeping services, utilities and room amenity costs). RevPAR increases due to higher ADR, however, would generally not result in additional operating costs, with the exception of those charged or incurred as a percentage of revenue, such as credit card fees and commissions. As a result, changes in RevPAR driven by increases or decreases in ADR generally have a greater effect on operating profitability at our owned hotels than changes in RevPAR driven by occupancy levels. Changes in RevPAR for our franchised hotels, whether driven by occupancy or ADR, directly impact our franchise revenues as these revenues are generally based on a percentage of the franchised hotels’ room revenues. Due to seasonality in our business, we review RevPAR by comparing current periods to budget and period-over-period.
RevPAR Index measures a hotel’s or group of hotels’ fair market share of a competitive set’s revenue per available room. RevPAR Index is stated as a percentage and is calculated for each hotel by comparing the hotel’s RevPAR to the aggregate RevPAR of a group of competing hotels generally in the same market. RevPAR Index is a weighted average of the individual property results. We subscribe to STR which collects and compiles the data used to calculate RevPAR Index, and STR may calculate ADR and RevPAR differently than we and our competitors do. The owner of each La Quinta hotel exercises its discretion in identifying the competitive set of properties for such hotel, considering, subject to STR’s guidelines, such factors as physical proximity, competition for similar customers, services and amenities, quality and average daily rate. We initially review the competitive set makeup of each new hotel that enters our system and review the continuing appropriateness of each hotel’s competitive set on an ongoing basis. Accordingly, while the hotel brands included in the competitive set for any individual La Quinta hotel depend heavily on market-specific conditions, the competitive sets for La Quinta hotels most often include one or more of Comfort, Holiday Inn Express and Hampton. Management uses RevPAR Index and changes in RevPAR Index, particularly year-over-year percentage changes, to evaluate the performance of individual or groups of hotels relative to other competing hotels.
Comparable hotels are defined as hotels that were active and operating in our system for at least one full calendar year as of the end of the applicable reporting period and were active and operating as of January 1st of the previous year; except for (i) hotels that sustained substantial property damage or other business interruption, (ii) owned hotels that become subject to a purchase and sale agreement, or (iii) hotels in which comparable results are otherwise not available. Management uses comparable hotels as the basis upon which to evaluate ADR, occupancy and RevPAR between periods for the set of comparable hotels existing at the reporting date versus the results of same set of hotels in the prior period.
|
|
• |
Of the 888, 886 and 867 hotels in our system as of December 31, 2016, 2015 and 2014, respectively, 788, 798 and 793 have been classified as comparable hotels for the years ended December 31, 2016, 2015 and 2014, respectively. |
EBITDA and Adjusted EBITDA. Earnings before interest, taxes, depreciation and amortization (“EBITDA”) is a commonly used measure in many industries. We adjust EBITDA when evaluating our performance because we believe that the adjustment for certain items, such as restructuring and acquisition transaction expenses, impairment charges related to long-lived assets, non-cash
51
equity-based compensation, discontinued operations, and other items not indicative of ongoing operating performance, provides useful supplemental information to management and investors regarding our ongoing operating performance. We believe that EBITDA and Adjusted EBITDA provide useful information to investors about us and our financial condition and results of operations for the following reasons: (i) EBITDA and Adjusted EBITDA are among the measures used by our management team to evaluate our operating performance and make day-to-day operating decisions; and (ii) EBITDA and Adjusted EBITDA are frequently used by securities analysts, investors, lenders and other interested parties as a common performance measure to compare results or estimate valuations across companies in our industry.
EBITDA and Adjusted EBITDA are not recognized terms under GAAP, have limitations as analytical tools and should not be considered either in isolation or as a substitute for net income (loss), cash flow or other methods of analyzing our results as reported under GAAP. Some of these limitations are:
|
|
• |
EBITDA and Adjusted EBITDA do not reflect changes in, or cash requirements for, our working capital needs; |
|
|
• |
EBITDA and Adjusted EBITDA do not reflect our interest expense, or the cash requirements necessary to service interest or principal payments, on our indebtedness; |
|
|
• |
EBITDA and Adjusted EBITDA do not reflect our tax expense or the cash requirements to pay our taxes; |
|
|
• |
EBITDA and Adjusted EBITDA do not reflect historical cash expenditures or future requirements for capital expenditures or contractual commitments; |
|
|
• |
EBITDA and Adjusted EBITDA do not reflect the impact on earnings or changes resulting from matters that we consider not to be indicative of our future operations; |
|
|
• |
although depreciation and amortization are non-cash charges, the assets being depreciated and amortized will often have to be replaced in the future, and EBITDA and Adjusted EBITDA do not reflect any cash requirements for such replacements; and |
|
|
• |
other companies in our industry may calculate EBITDA and Adjusted EBITDA differently, limiting their usefulness as comparative measures. |
Because of these limitations, EBITDA and Adjusted EBITDA should not be considered as discretionary cash available to us to reinvest in the growth of our business or as measures of cash that will be available to us to meet our obligations.
Results of operations
The following table presents hotel operating statistics for our system-wide (owned and franchised) comparable hotels for the applicable periods (1):
|
|
|
Year ended December 31, 2016 |
|
|
Variance 2016 vs. 2015 |
|
|
|
Year ended December 31, 2015 |
|
|
Variance 2015 vs. 2014 |
|
|
|
Year ended December 31, 2014 |
|
|||||
|
Occupancy |
|
|
66.5 |
% |
|
|
-100 |
|
bps |
|
|
67.5 |
% |
|
35 |
|
bps |
|
|
66.8 |
% |
|
|
ADR |
|
$ |
88.73 |
|
|
|
1.5 |
|
% |
|
$ |
86.21 |
|
|
|
2.9 |
|
% |
|
$ |
83.02 |
|
|
RevPAR |
|
$ |
59.03 |
|
|
|
0.0 |
|
% |
|
$ |
58.23 |
|
|
|
3.5 |
|
% |
|
$ |
55.48 |
|
|
(1) |
See definition of comparable hotels in “—Key indicators of financial condition and operating performance—Comparable hotels.” |
In addition, the following table presents RevPAR Index for our system-wide (owned and franchised) hotels for the applicable periods:
|
|
|
Year ended December 31, 2016 |
|
|
Net Change |
|
Year ended December 31, 2015 |
|
|
Net Change |
|
Year ended December 31, 2014 |
|
|||
|
RevPAR Index (1) |
|
|
95.2 |
% |
|
-43 bps |
|
|
95.7 |
% |
|
-84 bps |
|
|
96.5 |
% |
|
(1) |
Information based on the STR competitive set of hotels existing as of December 31, 2016 |
While we expect operating results at existing owned properties to improve and our business to grow based on our success in implementing initiatives designed to deliver a consistent guest experience and invest in points of differentiation, our ability to do so is
52
dependent in part on increases in discretionary spending and the economic environment overall as well as on a local basis in our markets. See “Risk factors—Risks related to our business and industry.”
We anticipate growth in our Franchise segment, driven both by improvements in performance at our existing franchised hotels and by increases in the number of franchised hotels in our system based on our pipeline and plans to grow our franchise business. In recent years, we have made significant progress in executing our strategic priorities, including the expansion of our footprint through our franchise business. From December 31, 2015 to December 31, 2016, our total number of owned and franchised La Quinta hotels has grown from 886 to 888, with franchised hotels increasing from 545 to 566. At December 31, 2015, our pipeline numbered 228 hotels, or approximately 20,400 rooms, and has grown to 248 hotels, or approximately 23,100 rooms, in our pipeline at December 31, 2016, while we have opened a net total of 21 hotels over that time period. Each of our pipeline hotels is represented by an executed franchise agreement, and approximately 29% of the conversions and new construction projects have commenced as of December 31, 2016. However, should our franchisees experience difficulty in securing financing for their franchise or a decline in demand for hotel rooms, our pipeline may be adversely affected, resulting in delays in the opening of new hotels or decreases in the number of future properties that we could potentially franchise. Although there is no significant cost to us associated with our pipeline, because revenues from franchised hotels are principally derived from franchise fees rather than room rentals, as we grow our system by increasing the number of franchised hotels, our revenues and expenses will increase at a significantly slower rate than if we were growing our system through an increase in number of owned hotels.
The completion of the IPO had material effects on our results of operations and financial condition. In connection with the IPO Transactions, we incurred, in the quarter ended June 30, 2014, a one-time net tax expense of $321.1 million, which reflects the impact of the La Quinta Predecessor Entities becoming owned by a “C” corporation and establishing the related net deferred tax liability on our books. Also in connection with the IPO Transactions, we recorded, in the year ended December 31, 2014, compensation expense of approximately $46.2 million related to the exchange of ownership units awards outstanding under our long-term cash incentive plan for vested shares of common stock and unvested shares of restricted stock of the Company, and recorded additional compensation expense in the periods since the IPO related to unvested shares of restricted stock of the Company received in this exchange. See Note 16 of our consolidated financial statements included elsewhere in this report for more information. Since the consummation of the IPO, our results of operations have been and will be affected by other one-time costs and recurring costs of being a public company, including increases in executive and board compensation (including equity based compensation), increased insurance, accounting, legal and investor relations costs, the costs of compliance with the Sarbanes-Oxley Act of 2002, and the costs of complying with the other rules and regulations of the SEC and the NYSE. Additionally, as a result of La Quinta Predecessor Entities becoming owned by a “C” corporation, the income produced by such entities is taxed at the federal and state level. These costs are not reflected in our historical results for the periods prior to April 14, 2014, but are included in our results for the periods following the consummation of the IPO.
Year ended December 31, 2016 compared with year ended December 31, 2015
In 2016, on a system-wide comparable hotels basis, we experienced an increase in ADR and a decline in occupancy, which resulted in flat RevPAR compared to the year ended December 31, 2015. The decline in occupancy is primarily a result of a slowing of demand affecting the hotel industry as a whole, including influences from both corporate transient and leisure travel, and challenges in specific markets, including significant challenges in markets defined by STR as “oil tracts”, resulting from the significant and prolonged pullback in oil and gas production. RevPAR in these oil tracts significantly worsened throughout the second half of 2015 and into 2016, causing significant negative comparisons to the prior year period, although such comparisons began to moderate throughout 2016.
Excluding these STR oil tracts, for the year ended December 31, 2016 system-wide comparable RevPAR would have increased by 1.5 percent, as compared to prior year, which is a 145 basis point lift from our system-wide comparable results for the year ended December 31, 2016. In addition, the year ended December 31, 2016 comparable hotel operating statistics are comparing against strong operating statistics on a comparable hotel basis for the year ended December 31, 2015, primarily related to the first six months of 2015.
53
The following tables present our overall operating performance, and system-wide and segment occupancy, ADR and RevPAR rates on a comparable hotel statistic basis, in each case, for the year ended December 31, 2016 and 2015, and system-wide and segment occupancy, ADR and RevPAR rates on a comparable hotel statistic basis, in each case, for the three months ended December 31, 2016 and 2015, including the amount and percentage change in these results between the periods (for additional information about quarterly periods, see Note 19: “Selected Quarterly Financial Information” in the consolidated financial statements of La Quinta Holdings Inc. as of December 31, 2016 and 2015 and for the years ended December 31, 2016, 2015 and 2014, included elsewhere in this report):
|
|
|
Year ended December 31, |
|
|
Increase/(Decrease) |
|
|
||||||||||
|
(in thousands) |
|
2016 |
|
|
2015 |
|
|
$ change |
|
|
% change |
|
|
||||
|
Revenues |
|
|
|
|
|
|
|
|
|
|
|
|
|
|
|
|
|
|
Room revenues |
|
$ |
855,302 |
|
|
$ |
887,358 |
|
|
$ |
(32,056 |
) |
|
|
(3.6 |
) |
|
|
Franchise and other fee-based revenues |
|
|
106,468 |
|
|
|
100,069 |
|
|
|
6,399 |
|
|
|
6.4 |
|
|
|
Other hotel revenues |
|
|
19,334 |
|
|
|
19,343 |
|
|
|
(9 |
) |
|
|
(0.0 |
) |
|
|
|
|
|
981,104 |
|
|
|
1,006,770 |
|
|
|
(25,666 |
) |
|
|
(2.5 |
) |
|
|
Brand marketing fund revenues from franchised and managed properties |
|
|
25,150 |
|
|
|
23,204 |
|
|
|
1,946 |
|
|
|
8.4 |
|
|
|
Total Revenues |
|
|
1,006,254 |
|
|
|
1,029,974 |
|
|
|
(23,720 |
) |
|
|
(2.3 |
) |
|
|
Operating Expenses |
|
|
|
|
|
|
|
|
|
|
|
|
|
|
|
|
|
|
Direct lodging expenses |
|
|
409,886 |
|
|
|
398,828 |
|
|
|
11,058 |
|
|
|
2.8 |
|
|
|
Depreciation and amortization(1) |
|
|
147,081 |
|
|
|
166,642 |
|
|
|
(19,561 |
) |
|
|
(11.7 |
) |
|
|
General and administrative expenses(1) |
|
|
115,715 |
|
|
|
125,697 |
|
|
|
(9,982 |
) |
|
|
(7.9 |
) |
|
|
Other lodging and operating expenses |
|
|
62,281 |
|
|
|
63,513 |
|
|
|
(1,232 |
) |
|
|
(1.9 |
) |
|
|
Marketing, promotional and other advertising expenses |
|
|
68,327 |
|
|
|
69,810 |
|
|
|
(1,483 |
) |
|
|
(2.1 |
) |
|
|
Impairment loss |
|
|
104,258 |
|
|
|
50,121 |
|
|
|
54,137 |
|
|
NM |
|
(2) |
|
|
(Gain) loss on sales |
|
|
(4,908 |
) |
|
|
4,088 |
|
|
|
(8,996 |
) |
|
NM |
|
(2) |
|
|
|
|
|
902,640 |
|
|
|
878,699 |
|
|
|
23,941 |
|
|
|
2.7 |
|
|
|
Brand marketing fund expenses from franchised and managed properties |
|
|
25,150 |
|
|
|
23,204 |
|
|
|
1,946 |
|
|
|
8.4 |
|
|
|
Total Operating Expenses |
|
|
927,790 |
|
|
|
901,903 |
|
|
|
25,887 |
|
|
|
2.9 |
|
|
|
Operating Income |
|
|
78,464 |
|
|
|
128,071 |
|
|
|
(49,607 |
) |
|
|
(38.7 |
) |
|
|
Other Income (Expenses) |
|
|
|
|
|
|
|
|
|
|
|
|
|
|
|
|
|
|
Interest expense, net |
|
|
(81,419 |
) |
|
|
(86,504 |
) |
|
|
5,085 |
|
|
|
(5.9 |
) |
|
|
Other income (loss) |
|
|
2,345 |
|
|
|
7,632 |
|
|
|
(5,287 |
) |
|
|
(69.3 |
) |
|
|
Total Other Income (Expenses) |
|
|
(79,074 |
) |
|
|
(78,872 |
) |
|
|
(202 |
) |
|
|
0.3 |
|
|
|
(Loss) income from Continuing Operations Before Income Taxes |
|
|
(610 |
) |
|
|
49,199 |
|
|
|
(49,809 |
) |
|
NM |
|
(2) |
|
|
Income tax expense |
|
|
(493 |
) |
|
|
(22,487 |
) |
|
|
21,994 |
|
|
|
(97.8 |
) |
|
|
Net (Loss )Income |
|
|
(1,103 |
) |
|
|
26,712 |
|
|
|
(27,815 |
) |
|
NM |
|
(2) |
|
|
Net Income Attributable to Noncontrolling Interests |
|
|
(185 |
) |
|
|
(347 |
) |
|
|
162 |
|
|
|
(46.7 |
) |
|
|
Net (Loss) Income Attributable to La Quinta Holdings’ stockholders |
|
$ |
(1,288 |
) |
|
$ |
26,365 |
|
|
$ |
(27,653 |
) |
|
NM |
|
(2) |
|
|
|
(1) |
We adopted ASU No. 2015-05 as of January 1, 2016. Accordingly, amortization of software service agreements in the amount of $8.3 million, which was classified as depreciation and amortization for the year ended December 31, 2015, has been reclassified as a general and administrative expense in our consolidated statement of operations. This reclassification was made for all sections contained in Management’s Discussion and Analysis of Financial Condition and Results of Operations that were impacted by this adoption. See Note 2 of the notes to our condensed consolidated financial statements included elsewhere in this report for additional information. |
|
|
(2) |
Fluctuation in terms of percentage change is not meaningful. |
54
|
Comparable hotel statistics |
|
For the three months ended December 31, 2016 |
|
|
Variance three months ended December 31, 2016 vs. 2015 |
|
|
|
Year ended December 31, 2016 |
|
|
Variance year ended Year ended December 31, 2016 vs. 2015 |
|
|
||||
|
Owned Hotels |
|
|
|
|
|
|
|
|
|
|
|
|
|
|
|
|
|
|
|
Occupancy |
|
|
60.7 |
% |
|
|
-127 |
|
bps |
|
|
65.5 |
% |
|
|
-185 |
|
bps |
|
ADR |
|
$ |
80.98 |
|
|
|
3.1 |
|
% |
|
$ |
84.68 |
|
|
|
2.1 |
|
% |
|
RevPAR |
|
$ |
49.17 |
|
|
|
1.0 |
|
% |
|
$ |
55.44 |
|
|
|
-0.7 |
|
% |
|
Franchised Hotels |
|
|
|
|
|
|
|
|
|
|
|
|
|
|
|
|
|
|
|
Occupancy |
|
|
63.7 |
% |
|
|
86 |
|
bps |
|
|
67.7 |
% |
|
|
-8 |
|
bps |
|
ADR |
|
$ |
88.61 |
|
|
|
1.2 |
|
% |
|
$ |
92.99 |
|
|
|
0.9 |
|
% |
|
RevPAR |
|
$ |
56.47 |
|
|
|
2.6 |
|
% |
|
$ |
62.92 |
|
|
|
0.7 |
|
% |
|
System-wide |
|
|
|
|
|
|
|
|
|
|
|
|
|
|
|
|
|
|
|
Occupancy |
|
|
62.2 |
% |
|
|
-25 |
|
bps |
|
|
66.5 |
% |
|
|
-100 |
|
bps |
|
ADR |
|
$ |
84.73 |
|
|
|
2.2 |
|
% |
|
$ |
88.73 |
|
|
|
1.5 |
|
% |
|
RevPAR |
|
$ |
52.67 |
|
|
|
1.8 |
|
% |
|
$ |
59.03 |
|
|
|
0.0 |
|
% |
Revenues
Owned hotels
As of December 31, 2016, we had 322 owned hotels, comprising approximately 41,200 rooms, located in the United States. Room revenues at our owned hotels for the years ended December 31, 2016 and 2015 totaled $855.3 million and $887.4 million, respectively. The decrease of $32.1 million, or 3.6 percent, was primarily driven by a decrease of 19 hotels in the owned hotel portfolio in comparison to the hotels owned at December 31, 2015 and a decrease in RevPAR at our comparable owned hotels of 0.7 percent, which was due to a decrease in occupancy of 185 basis points, partially offset by an increase in ADR of 2.1 percent. The declines in occupancy and RevPAR are primarily a result of a slowing of demand affecting the hotel industry as a whole, including influences from both corporate transient and leisure travel. In addition occupancy has declined due to challenges in specific markets, including significant challenges in markets defined by STR as “oil tracts”, resulting from the significant and prolonged pullback in oil and gas production. RevPAR in these oil tracts significantly worsened throughout the second half of 2015 and into 2016, causing significant negative comparisons to the prior year period, although such comparisons began to moderate throughout 2016.
Other hotel revenues at our owned hotels totaled $19.3 million for both years ended December 31, 2016 and 2015, respectively. These revenues are related to ancillary hotel services.
Franchise and other fee-based revenues
As of December 31, 2016, we had 566 franchised hotels, comprising approximately 46,000 rooms, located in the United States, Canada, Mexico, Honduras and Colombia. Franchise and other fee-based revenues for the years ended December 31, 2016 and 2015 totaled $106.5 million and $100.1 million, respectively. The increase of $6.4 million, or 6.4 percent, was primarily driven by a net increase of 21 hotels, providing approximately an additional 2,100 rooms, to our franchise system from December 31, 2015 to December 31, 2016 and an increase in RevPAR at our comparable franchised hotels of 0.7 percent, which was due to an increase in ADR of 0.9 percent, partially offset by a decrease in occupancy of 8 basis points. The decline in occupancy is primarily a result of a slowing of demand affecting the hotel industry as a whole, including influences from both corporate transient and leisure travel, and due to challenges in specific markets, including significant challenges in markets defined by STR as “oil tracts”, resulting from the significant and prolonged pullback in oil and gas production. RevPAR in these oil tracts significantly worsened throughout the second half of 2015 and into 2016, causing significant negative comparisons to the prior year period, although such comparisons began to moderate throughout 2016.
Operating expenses
|
|
|
Year Ended December 31, |
|
|
Percent change |
|
||||||
|
(in millions) |
|
2016 |
|
|
2015 |
|
|
2016 vs. 2015 |
|
|||
|
Direct lodging expenses |
|
$ |
409.9 |
|
|
$ |
398.8 |
|
|
|
2.8 |
|
|
Other lodging and operating expenses |
|
|
62.3 |
|
|
|
63.5 |
|
|
|
(1.9 |
) |
55
In total, direct lodging and other lodging and operating expenses for our owned hotels totaled $472.2 million and $462.3 million, for the years ended December 31, 2016 and 2015, respectively, resulting in an increase of $9.9 million, or 2.1 percent. These expenses increased primarily as a result of increases in direct lodging expenses for our owned hotels caused by increases in salaries (including hourly wages) and benefits and increased travel agency commission costs due to increased volume driven through third party online travel agencies, such as Expedia.com, Booking.com, and TripAdvisor. Additionally, uninsured losses and contract labor costs increased for the year ended December 31, 2016. These expense increases were partially offset by decreases in costs related to operating 19 fewer hotels in the owned hotel portfolio in comparison to the hotels owned at December 31, 2015 as a result of asset sales, and a decrease in utility costs, including electricity and natural gas resulting from mild weather in 2016. In addition, other lodging and operating expenses decreased, primarily due to operating 19 fewer hotels in the owned hotel portfolio in comparison to the hotels owned at December 31, 2015 as a result of asset sales and decreases in insurance expense and property taxes. These decreases are partially offset by an increase in losses from natural disasters.
|
|
|
Year Ended December 31, |
|
|
Percent change |
|
||||||
|
(in millions) |
|
2016 |
|
|
2015 |
|
|
2016 vs. 2015 |
|
|||
|
Depreciation and amortization |
|
$ |
147.1 |
|
|
$ |
166.6 |
|
|
|
(11.7 |
) |
Depreciation and amortization expense for our owned hotels totaled $147.1 million and $166.6 million, respectively, for the years ended December 31, 2016 and 2015. The decrease of $19.5 million, or 11.7 percent, was primarily the result of the suspension of depreciation for assets placed into held for sale status, as well as from the sale of 19 hotels in the owned hotel portfolio during 2016. This decrease was partially offset by a $51.8 million increase in capital expenditures between December 31, 2015 and December 31, 2016, which drove additional depreciation on certain owned assets in 2016.
|
|
|
Year Ended December 31, |
|
|
Percent change |
|
||||||
|
(in millions) |
|
2016 |
|
|
2015 |
|
|
2016 vs. 2015 |
|
|||
|
General and administrative expenses |
|
$ |
115.7 |
|
|
$ |
125.7 |
|
|
|
(7.9 |
) |
General and administrative expenses totaled $115.7 million and $125.7 million, respectively, for the years ended December 31, 2016 and 2015. For the year ended December 31, 2015 general and administrative expenses included equity based compensation expense of $5.6 million related to the shares of common stock and restricted stock received in exchange for long-term incentive ownership units held by certain members of the Company’s management in connection with our IPO. Additionally for the year ended December 31, 2015 general and administrative expenses included $8.0 million in cash and $3.0 million in non-cash charges related to the departure of our former CEO. Excluding these charges in the year ended December 31, 2015, general and administrative expenses increased for the year ended December 31, 2016 compared to the prior year, primarily as a result of increases in corporate bonus, stock based compensation for new grants, salaries and benefits, legal fees, severance costs and additional purchased services. The corporate bonus for the year ended December 31, 2015 excluded corporate bonus expense for the CEO. Also, in 2015, we incurred professional services fees related to a secondary offering of our common stock that did not recur in 2016.
|
|
|
Year Ended December 31, |
|
|
Percent change |
|
||||||
|
(in millions) |
|
2016 |
|
|
2015 |
|
|
2016 vs. 2015 |
|
|||
|
Marketing, promotional and other advertising expenses |
|
$ |
68.3 |
|
|
$ |
69.8 |
|
|
|
(2.1 |
) |
Marketing, promotional and other advertising expenses, not funded by the BMF collected from our hotels, totaled $68.3 million and $69.8 million, respectively, for the years ended December 31, 2016 and 2015. The decrease of $1.5 million, or 2.1 percent, was primarily driven by the timing of spending under certain brand programs and decreased spending in broadcast and direct media, partially offset by an increase in online media. In addition, we spent $25.2 million and $23.2 million of BMF fees collected from franchised hotels on similar brand management and other advertising expenses for the years ended December 31, 2016 and 2015, respectively which increased due to increased costs for online media.
|
|
|
Year Ended December 31, |
|
|
Percent change |
|
|||||
|
(in millions) |
|
2016 |
|
|
2015 |
|
|
2016 vs. 2015 |
|
||
|
Impairment loss |
|
$ |
104.3 |
|
|
$ |
50.1 |
|
|
NM |
(1) |
|
(1) |
Fluctuation in terms of percentage change is not meaningful |
56
During 2016, we entered into agreements to sell 11 of our Owned Hotels for approximately $62.2 million. In connection with the sale agreements, we recorded an impairment charge of $19.3 million to adjust the value of these assets to their fair value, less transaction costs. We recorded $1.1 million of additional impairment for hotels included in assets held for sale as of December 31, 2015. Furthermore, we identified two Owned Hotels for which it was determined that the carrying amount would not be recoverable due to changes in market and economic conditions. We recorded impairment charges of $3.5 million related to these properties.
Additionally during 2016, as part of the strategic review of our owned hotel portfolio, approximately 50 hotels were identified as candidates for sale in the near-term. After considering the reduced estimated holding period for these hotels, we determined that the estimated cash flows were less than the carrying value of these certain hotels and therefore we reduced the carrying values to their estimated fair value. This resulted in an impairment charge of approximately $80.4 million.
In 2015, the Company entered into discussions for the sale of 24 of its owned hotels. Due to the potential reduced holding period of these assets, the Company recorded an impairment charge of $43.4 million for the year ended December 31, 2015 to adjust the value of these assets to their estimated fair value. Additionally, during 2015, the Company entered into discussions to sell a restaurant parcel. Due to the potential reduced holding period of this restaurant asset, the Company recorded an impairment charge of $1.6 million to adjust the value of this asset to its estimated fair value. In the fourth quarter of 2015, we identified a hotel where it became more likely than not that the carrying amount would not be recoverable due to a change in market and economic conditions. As a result, we recorded an impairment charge of $5.1 million to adjust the carrying value of this hotel to its estimated fair value.
|
|
|
Year Ended December 31, |
|
|
Percent change |
|
|||||
|
(in millions) |
|
2016 |
|
|
2015 |
|
|
2016 vs. 2015 |
|
||
|
(Gain) loss on sales |
|
$ |
(4.9 |
) |
|
$ |
4.1 |
|
|
NM |
(1) |
|
(1) |
Fluctuation in terms of percentage change is not meaningful. |
During the year ended December 31, 2016, we sold 19 of our Owned Hotels for a gain of approximately $4.9 million. Of this group of hotels, 13 hotels were from the 24 hotels marked as held for sale in the third quarter of 2015.
During the year ended December 31, 2015, we sold one of our Owned Hotels for a loss of approximately $4.0 million. We sold 11 hotels from the 24 hotels marked as held for sale in the third quarter of 2015, with no gain or loss on the close of the transactions. Additionally, during 2015, we sold a restaurant parcel for a loss on sale of $0.1 million.
Other Income (Expenses)
|
|
|
Year Ended December 31, |
|
|
Percent change |
|
||||||
|
(in millions) |
|
2016 |
|
|
2015 |
|
|
2016 vs. 2015 |
|
|||
|
Interest expense, net |
|
$ |
81.4 |
|
|
$ |
86.5 |
|
|
|
(5.9 |
) |
Interest expense, net, totaled $81.4 million and $86.5 million for the years ended December 31, 2016 and 2015, respectively. The decrease of $5.1 million, or 5.9 percent, was driven by the reduction in the principal balance of our term loan facility with the application of the voluntary prepayments in 2015, and the realization of a 25 basis point reduction in the applicable interest rate when the Company achieved a net leverage ratio of less than or equal to 4.50 to 1.00 during the third quarter of 2015.
|
|
|
Year Ended December 31, |
|
|
Percent change |
|
|
||||||
|
(in millions) |
|
2016 |
|
|
2015 |
|
|
2016 vs. 2015 |
|
|
|||
|
Other income |
|
$ |
2.3 |
|
|
$ |
7.6 |
|
|
|
(69.3 |
) |
|
Other income totaled $2.3 million and $7.6 million, respectively, for the years ended December 31, 2016 and 2015. The decrease of $5.3 million is primarily related to a 2015 settlement for business interruption caused by the Deepwater Horizon oil spill in the Gulf of Mexico.
|
|
|
Year Ended December 31, |
|
|
Percent change |
|
|
||||||
|
(in millions) |
|
2016 |
|
|
2015 |
|
|
2016 vs. 2015 |
|
|
|||
|
Income tax expense |
|
$ |
(0.5 |
) |
|
$ |
(22.5 |
) |
|
|
(97.8 |
) |
|
57
The company recorded an income tax expense of approximately $0.5 million and an income tax expense of $22.5 million, respectively, for the years ended December 31, 2016 and 2015. The decrease of $22.0 million is primarily related to a decrease in income from operations.
Segment results
We evaluate our segments’ operating performance using segment Adjusted EBITDA, as described in Note 18: “Segments” in the consolidated financial statements of La Quinta Holdings Inc. as of December 31, 2016, 2015 and 2014 and for the years ended December 31, 2016, 2015 and 2014, included elsewhere in this report. Refer to those financial statements for a reconciliation of Adjusted EBITDA to net (loss) income. For a discussion of our definitions of EBITDA and Adjusted EBITDA, how management uses them to manage our business and material limitations on their usefulness, refer to “—Key indicators of financial condition and operating performance.” The following table sets forth revenues and Adjusted EBITDA by segment, reconciled to consolidated amounts, for the years ended December 31, 2016 and 2015.
|
|
|
Year Ended December 31, |
|
|||||
|
(in thousands) |
|
2016 |
|
|
2015 |
|
||
|
Revenues |
|
|
|
|
|
|
|
|
|
Owned Hotels |
|
$ |
879,653 |
|
|
$ |
911,491 |
|
|
Franchise and Management (1) |
|
|
116,806 |
|
|
|
114,610 |
|
|
Segment revenues |
|
|
996,459 |
|
|
|
1,026,101 |
|
|
Other revenues from franchised properties |
|
|
25,150 |
|
|
|
23,204 |
|
|
Corporate and other (2) |
|
|
124,757 |
|
|
|
126,469 |
|
|
Intersegment elimination (3) |
|
|
(140,112 |
) |
|
|
(145,800 |
) |
|
Total revenues |
|
$ |
1,006,254 |
|
|
$ |
1,029,974 |
|
|
Adjusted EBITDA |
|
|
|
|
|
|
|
|
|
Owned Hotels |
|
$ |
279,536 |
|
|
$ |
314,278 |
|
|
Franchise and Management |
|
|
116,806 |
|
|
|
114,610 |
|
|
Segment Adjusted EBITDA |
|
|
396,342 |
|
|
|
428,888 |
|
|
Corporate and other |
|
|
(35,964 |
) |
|
|
(34,846 |
) |
|
Adjusted EBITDA |
|
$ |
360,378 |
|
|
$ |
394,042 |
|
|
(1) |
This segment includes intercompany fees which are charged to our owned hotels to reflect that certain functions, such as licensing and management, are included in the franchise and management segment. We charge a franchise fee of 4.5% of gross room revenues and a management fee of 2.5% of gross operating revenue for our owned hotels. These fees are charged to owned hotels and are eliminated in the accompanying condensed consolidated financial statements. |
|
(2) |
Includes revenues related to our brand management programs and other cost reimbursements. The portion of these fees that were charged to our owned hotels totaled $71.5 million and $75.1 million for the years ended December 31, 2016 and 2015, respectively. This includes a reservation fee of 2.0% of gross room revenues, which is reflected in corporate and other. These fees are charged to owned hotels and are eliminated in the accompanying consolidated financial statements. |
|
(3) |
Includes management, license, franchise, BMF, Returns and other cost reimbursements totaling $140.1 million and $145.8 million for the years ended December 31, 2016 and 2015, respectively. These fees are charged to owned hotels and are eliminated in the accompanying consolidated financial statements. |
Owned hotels
Owned Hotels segment revenues decreased primarily driven by a decrease of 19 hotels in the owned hotel portfolio in comparison to the hotels owned at December 31, 2015 and a decline in RevPAR of 0.7 percent at our comparable owned hotels. Refer to “Revenues—Owned hotels” within this section for further discussion on the decrease in revenues from our comparable owned hotels. Our Owned Hotels segment’s Adjusted EBITDA decrease is a result of decreased Owned Hotels segment revenues of approximately $31.8 million and an increase in direct lodging expenses of $11.1 million, partially offset by decreases in other lodging and operating expenses of $1.2 million. Refer to “Operating expenses—Owned hotels” within this section for further discussion of the increase in operating expenses at our owned hotels.
58
Franchise and management
Franchise hotels segment revenues increased by $2.2 million primarily as a result of the net addition of 21 hotels to our franchise system and an increase in RevPAR of 0.7 percent at our comparable franchised hotels. Refer to “Revenues—Franchise and other fee-based revenues” within this section for further discussion of the increase in revenues from our comparable franchised hotels. Our Franchise segment’s Adjusted EBITDA increased as a result of the overall increase in Franchise segment revenues.
59
Year ended December 31, 2015 compared with year ended December 31, 2014
In 2015, we experienced system-wide improvement at our comparable hotels in occupancy, ADR, and RevPAR, compared to the year ended December 31, 2014. Despite the adverse impact on RevPAR from challenges in specific markets, including significant challenges in certain markets in Texas as a result of the declines in the oil and gas market and adverse weather conditions, the impact to RevPAR of a transition of our reservations call center, and the unexpected closure of one of our largest hotels for structural repairs during the third and fourth quarters, system-wide ADR improved 2.9 percent in the year ended December 31, 2015, compared to the year ended December 31, 2014, and system-wide RevPAR increased 3.5 percent in the year ended December 31, 2015, compared to the year ended December 31, 2014. System-wide occupancy increased 35 basis points in the year ended December 31, 2015, compared to the year ended December 31, 2014
The following tables present our overall operating performance, and system-wide and segment occupancy, ADR and RevPAR rates on a comparable hotel statistic basis, in each case, for the year ended December 31, 2015 and 2014, including the amount and percentage change in these results between the periods:
|
|
|
Year ended December 31, |
|
|
Increase/(Decrease) |
|
|
||||||||||
|
(in thousands) |
|
2015 |
|
|
2014 |
|
|
$ change |
|
|
% change |
|
|
||||
|
Revenues |
|
|
|
|
|
|
|
|
|
|
|
|
|
|
|
|
|
|
Room revenues |
|
$ |
887,358 |
|
|
$ |
846,203 |
|
|
$ |
41,155 |
|
|
|
4.9 |
|
|
|
Franchise and other fee-based revenues |
|
|
100,069 |
|
|
|
89,718 |
|
|
|
10,351 |
|
|
|
11.5 |
|
|
|
Other hotel revenues |
|
|
19,343 |
|
|
|
19,536 |
|
|
|
(193 |
) |
|
|
(1.0 |
) |
|
|
|
|
|
1,006,770 |
|
|
|
955,457 |
|
|
|
51,313 |
|
|
|
5.4 |
|
|
|
Brand marketing fund revenues from franchised and managed properties |
|
|
23,204 |
|
|
|
21,481 |
|
|
|
1,723 |
|
|
|
8.0 |
|
|
|
Total Revenues |
|
|
1,029,974 |
|
|
|
976,938 |
|
|
|
53,036 |
|
|
|
5.4 |
|
|
|
Operating Expenses |
|
|
|
|
|
|
|
|
|
|
|
|
|
|
|
|
|
|
Direct lodging expenses |
|
|
398,828 |
|
|
|
378,705 |
|
|
|
20,123 |
|
|
|
5.3 |
|
|
|
Depreciation and amortization(1) |
|
|
166,642 |
|
|
|
165,887 |
|
|
|
755 |
|
|
|
0.5 |
|
|
|
General and administrative expenses(1) |
|
|
125,697 |
|
|
|
149,894 |
|
|
|
(24,197 |
) |
|
|
(16.1 |
) |
|
|
Other lodging and operating expenses |
|
|
63,513 |
|
|
|
56,984 |
|
|
|
6,529 |
|
|
|
11.5 |
|
|
|
Marketing, promotional and other advertising expenses |
|
|
69,810 |
|
|
|
62,161 |
|
|
|
7,649 |
|
|
|
12.3 |
|
|
|
Impairment loss |
|
|
50,121 |
|
|
|
5,157 |
|
|
|
44,964 |
|
|
NM |
|
(2) |
|
|
Loss on sale |
|
|
4,088 |
|
|
|
— |
|
|
|
4,088 |
|
|
NM |
|
(2) |
|
|
|
|
|
878,699 |
|
|
|
818,788 |
|
|
|
59,911 |
|
|
|
7.3 |
|
|
|
Brand marketing fund expenses from franchised and managed properties |
|
|
23,204 |
|
|
|
21,481 |
|
|
|
1,723 |
|
|
|
8.0 |
|
|
|
Total Operating Expenses |
|
|
901,903 |
|
|
|
840,269 |
|
|
|
61,634 |
|
|
|
7.3 |
|
|
|
Operating Income |
|
|
128,071 |
|
|
|
136,669 |
|
|
|
(8,598 |
) |
|
|
(6.3 |
) |
|
|
Other Income (Expenses) |
|
|
|
|
|
|
|
|
|
|
|
|
|
|
|
|
|
|
Interest expense, net |
|
|
(86,504 |
) |
|
|
(120,945 |
) |
|
|
34,441 |
|
|
|
(28.5 |
) |
|
|
Other income |
|
|
7,632 |
|
|
|
3,261 |
|
|
|
4,371 |
|
|
NM |
|
(2) |
|
|
Loss on extinguishment of debt, net |
|
|
— |
|
|
|
(2,030 |
) |
|
|
2,030 |
|
|
NM |
|
(2) |
|
|
Total Other Income (Expenses) |
|
|
(78,872 |
) |
|
|
(119,714 |
) |
|
|
40,842 |
|
|
|
(34.1 |
) |
|
|
Income from Continuing Operations Before Income Taxes |
|
|
49,199 |
|
|
|
16,955 |
|
|
|
32,244 |
|
|
NM |
|
(2) |
|
|
Income tax expense |
|
|
(22,487 |
) |
|
|
(28,805 |
) |
|
|
6,318 |
|
|
|
(21.9 |
) |
|
|
Recognition of net deferred tax liabilities upon C-corporation conversion |
|
|
— |
|
|
|
(321,054 |
) |
|
|
321,054 |
|
|
NM |
|
(2) |
|
|
Income (Loss) from Continuing Operations, Net of Tax |
|
|
26,712 |
|
|
|
(332,904 |
) |
|
|
359,616 |
|
|
NM |
|
(2) |
|
|
Loss on Discontinued Operations, Net of Tax |
|
|
— |
|
|
|
(503 |
) |
|
|
503 |
|
|
NM |
|
(2) |
|
|
Net Income (Loss) |
|
|
26,712 |
|
|
|
(333,407 |
) |
|
|
360,119 |
|
|
NM |
|
(2) |
|
|
Net Income Attributable to Noncontrolling Interests |
|
|
(347 |
) |
|
|
(3,890 |
) |
|
|
3,543 |
|
|
|
(91.1 |
) |
|
|
Net Income (Loss) Attributable to La Quinta Holdings’ stockholders |
|
$ |
26,365 |
|
|
$ |
(337,297 |
) |
|
$ |
363,662 |
|
|
NM |
|
(2) |
|
|
|
(1) |
We adopted ASU No. 2015-05 as of January 1, 2016. Accordingly, amortization of software service agreements in the amount of $8.3 million and $7.3 million, which was classified as depreciation and amortization for the year ended |
60
|
|
December 31, 2015 and 2014, respectively, has been reclassified as a general and administrative expense in our consolidated statement of operations. This reclassification was made for all sections of Management’s Discussion and Analysis of Financial Condition and Results of Operations that were impacted by this adoption. See Note 2 of the notes to our condensed consolidated financial statements included elsewhere in this report for additional information. |
|
|
(2) |
Fluctuation in terms of percentage change is not meaningful. |
|
Comparable hotel statistics |
|
Year ended December 31, 2015 |
|
|
|
Variance 2015 vs. 2014 |
|
|
||
|
Owned Hotels |
|
|
|
|
|
|
|
|
|
|
|
Occupancy |
|
|
67.0 |
|
% |
|
|
1 |
|
bps |
|
ADR |
|
$ |
82.05 |
|
|
|
|
3.5 |
% |
|
|
RevPAR |
|
$ |
54.95 |
|
|
|
|
3.5 |
% |
|
|
Franchised Hotels |
|
|
|
|
|
|
|
|
|
|
|
Occupancy |
|
|
68.2 |
|
% |
|
|
76 |
|
bps |
|
ADR |
|
$ |
91.08 |
|
|
|
|
2.2 |
% |
|
|
RevPAR |
|
$ |
62.15 |
|
|
|
|
3.4 |
% |
|
|
System-wide |
|
|
|
|
|
|
|
|
|
|
|
Occupancy |
|
|
67.5 |
|
% |
|
|
35 |
|
bps |
|
ADR |
|
$ |
86.21 |
|
|
|
|
2.9 |
% |
|
|
RevPAR |
|
$ |
58.23 |
|
|
|
|
3.5 |
% |
|
Revenues
Owned hotels
As of December 31, 2015, we had 341 owned hotels, comprising approximately 43,600 rooms, located in the United States. Room revenues at our owned hotels for the years ended December 31, 2015 and 2014 totaled $887.4 million and $846.2 million, respectively. The increase of $41.2 million, or 4.9 percent, was primarily driven by an increase in RevPAR at our comparable owned hotels of 3.5 percent, which was due to increases in ADR and occupancy of 3.5 percent and 1 basis point, respectively.
The increase in RevPAR, which occurred through the third quarter, but as reflected in the table RevPAR declined in the fourth quarter, was driven by a combination of factors, including an increased demand for hotel rooms due in part to the historically low level of new hotels being built in our competitive markets, enhanced pricing power in certain of our markets, the introduction of new distribution and selling channels and continuous enhancements to our brand experience through capital expenditures and staff training. The growth in RevPAR was adversely impacted from challenges in specific markets, including significant challenges in certain markets in Texas as a result of the declines in the oil and gas market and adverse weather conditions, the impact of a transition of our reservations call center, and the unexpected closure of one of our largest hotels for structural repairs during the third and fourth quarters.
Other hotel revenues at our owned hotels for the years ended December 31, 2015 and 2014 totaled $19.3 million and $19.5 million, respectively. The decrease of $0.2 million, or 1.0 percent, was primarily a result of a decrease in demand for ancillary hotel services.
Franchise and other fee-based revenues
As of December 31, 2015, we had 545 franchised hotels, comprising approximately 43,900 rooms, located in the United States, Canada, Mexico and Honduras. Franchise and other fee-based revenues for the years ended December 31, 2015 and 2014 totaled $100.1 million and $89.7 million, respectively. The increase of $10.4 million, or 11.5 percent, was primarily driven by an increase in RevPAR at our comparable franchised hotels of 3.4 percent, which was due to increases in ADR and occupancy of 2.2 percent and 76 basis points, respectively. The increase in RevPAR, which occurred through the third quarter, but as reflected in the table above declined in the fourth quarter, was driven by a combination of factors, including increased demand for hotel rooms due in part to the historically low level of new hotels being built in our franchised hotels’ competitive markets, the continued expansion of our franchise footprint into higher-rated markets, and enhanced pricing power in certain of our franchisees’ markets. The growth in RevPAR was adversely impacted from challenges in specific markets, including significant challenges in certain markets in Texas as a result of the declines in the oil and gas market and adverse weather conditions.
The addition of new hotels to our franchise system also contributed to the growth in revenue. From December 31, 2014 to December 31, 2015, we added 31 franchised hotels on a net basis, providing an additional 2,400 rooms to our system.
61
Operating expenses
|
|
|
Year Ended December 31, |
|
|
Percent change |
|
||||||
|
(in millions) |
|
2015 |
|
|
2014 |
|
|
2015 vs. 2014 |
|
|||
|
Direct lodging expenses |
|
$ |
398.8 |
|
|
$ |
378.7 |
|
|
|
5.3 |
|
|
Other lodging and operating expenses |
|
|
63.5 |
|
|
|
57.0 |
|
|
|
11.5 |
|
In total, direct lodging and other lodging and operating expenses amounted to $462.3 million and $435.7 million, respectively, for the years ended December 31, 2015 and 2014 resulting in an increase of $26.6 million, or 6.1 percent. This overall increase was primarily the result of increases in direct lodging expenses for our owned hotels driven primarily by: (1) increases in salaries and benefits at our owned hotels including increased health care costs related to compliance with the Affordable Care Act, (2) increased travel agency commission costs due to an increase in the percentage of our customers selecting to reserve rooms through online travel agencies resulting in increased commission expense (3) an increase in credit card fees (4) increased utilities costs, specifically water and electricity, and (5) and increased expenses related to repair and maintenance costs. These expense increases were partially offset by the effects of continued cost mitigation strategies; the impact of operational efficiencies employed at our owned hotels and decreased cost due to fewer owned hotels in 2015. In addition, the overall increase was driven by increases in other lodging and operating expenses for certain of our owned hotels primarily in the cost for property taxes related to increased valuation assessments for certain of our owned hotels. In 2014, we received significant insurance proceeds related to a natural disaster that offset other lodging and operational expenses.
|
|
|
Year Ended December 31, |
|
|
Percent change |
|
||||||
|
(in millions) |
|
2015 |
|
|
2014 |
|
|
2015 vs. 2014 |
|
|||
|
Depreciation and amortization |
|
$ |
166.6 |
|
|
$ |
165.9 |
|
|
|
0.5 |
|
Depreciation and amortization expense for our owned hotels totaled $166.6 million and $165.9 million, respectively, for the years ended December 31, 2015 and 2014. The increase of $0.7 million, or 0.5 percent, was the result of $92.0 million in capital expenditures during 2015, which drove additional depreciation on certain owned assets, as well as $166.5 million in additions to property and equipment as a result of the acquisition of the Previously Managed Hotels on April 14, 2014. The increase was partially offset by of the suspension of depreciation for 24 Owned Hotels that are subject to a definitive purchase agreement, and which were designated as assets held for sale in September 2015. As of December 31, 2015, 11 of these 24 hotels have been sold, with the remaining 13 sold during 2016.
|
|
|
Year Ended December 31, |
|
|
Percent change |
|
||||||
|
(in millions) |
|
2015 |
|
|
2014 |
|
|
2015 vs. 2014 |
|
|||
|
General and administrative expenses |
|
$ |
125.7 |
|
|
$ |
149.9 |
|
|
|
(16.1 |
) |
General and administrative expenses totaled $125.7 million and $149.9 million, respectively, for the years ended December 31, 2015 and 2014. The decrease of $24.2 million, or 16.1 percent, was primarily the result of a decrease in equity based compensation expense of $36.3 million. For the years ended December 31, 2015 and 2014, equity based compensation expense included $5.6 million and $46.2 million, respectively, related to the shares of common stock and restricted stock received in exchange for long-term incentive ownership units held by certain members of the Company’s management in connection with our IPO. These shares became fully vested on April 14, 2015. The decrease also includes a significant reduction in corporate bonus expense as a result of the Company’s performance compared to the established bonus targets. This decrease in general and administrative expenses is partially offset by $8.0 million in cash and $3.0 million in non-cash charges related to the departure of our former CEO in 2015, in addition to other factors including increases in executive salary and director compensation, increases in insurance, and fees for professional services. Additionally, we had a significant favorable legal accrual reversal in 2014 and had increased costs related to the transition of our call center to a new provider in 2015.
|
|
|
Year Ended December 31, |
|
|
Percent change |
|
||||||
|
(in millions) |
|
2015 |
|
|
2014 |
|
|
2015 vs. 2014 |
|
|||
|
Marketing, promotional and other advertising expenses |
|
$ |
69.8 |
|
|
$ |
62.2 |
|
|
|
12.3 |
|
Marketing, promotional and other advertising expenses, not funded by the BMF collected from our franchised and managed hotels, totaled $69.8 million and $62.2 million, respectively, for the years ended December 31, 2015 and 2014. The increase of $7.6 million, or 12.3 percent, was primarily driven by increased spending to enhance brand awareness via broadcast, online, and print
62
media outlets. In addition, we spent $23.2 million of the BMF fees collected from franchised and managed hotels on similar brand management and other advertising expenses.
|
|
|
Year Ended December 31, |
|
|
Percent change |
|
|||||
|
(in millions) |
|
2015 |
|
|
2014 |
|
|
2015 vs. 2014 |
|
||
|
Impairment loss |
|
$ |
50.1 |
|
|
$ |
5.2 |
|
|
NM |
(1) |
|
(1) |
Fluctuation in terms of percentage change is not meaningful |
Due to the potential reduced holding period of 24 owned hotels, the Company recorded an impairment charge of $43.4 million during 2015 to adjust the value of these assets to their estimated fair value. The Company entered into a definitive purchase and sale agreement to sell these 24 owned hotels during 2015, and has completed the sale of 11 of these hotels as of December 31, 2015. Additionally, during 2015 the Company entered into discussions to sell a restaurant parcel. Due to the potential reduced holding period of the restaurant parcel, the Company recorded an impairment charge of $1.6 million to adjust the value to the estimated fair value. In the fourth quarter of 2015, we identified a hotel where it became more likely than not that the carrying amount would not be recoverable due to a change in market and economic conditions. As a result, we recorded an impairment charge of $5.1 million to adjust the carrying value of this hotel to its estimated fair value.
In June 2014, we determined that the long-lived assets associated with one of our Owned Hotels were partially impaired primarily due to unfavorable expected terms of the upcoming underlying ground lease renewal and the likelihood of the Company abandoning the hotel upon expiration of the ground lease. As a result, we recorded an impairment loss of approximately $5.2 million for the three months ended June 30, 2014. Subsequent to June 30, 2014, we reached an agreement with the landlord and renewed the ground lease.
|
|
|
Year Ended December 31, |
|
|
Percent change |
|
|||||
|
(in millions) |
|
2015 |
|
|
2014 |
|
|
2016 vs. 2015 |
|
||
|
Loss on sale |
|
$ |
4.1 |
|
|
$ |
— |
|
|
NM |
(1) |
|
(1) |
Fluctuation in terms of percentage change is not meaningful |
On April 13, 2015, we entered into an agreement to sell one of our Owned Hotels for approximately $3.0 million. We closed the sale in the second quarter of 2015 and recorded a loss on sale of approximately $4.0 million related to this transaction. We also sold a restaurant parcel for a loss on sale of $0.1 million.
Other Income (Expenses)
|
|
|
|
|
|
|
|
|
|
|
|
|
|
|
|
|
Year Ended December 31, |
|
|
Percent change |
|
||||||
|
(in millions) |
|
2015 |
|
|
2014 |
|
|
2015 vs. 2014 |
|
|||
|
Interest expense, net |
|
$ |
86.5 |
|
|
$ |
120.9 |
|
|
|
(28.5 |
) |
Net interest expense totaled $86.5 million and $120.9 million, respectively, for the years ended December 31, 2015 and 2014. The decrease of $34.4 million, or 28.5 percent, was primarily driven by a decrease in the overall interest rate on our new senior debt facility entered into at the time of the IPO as compared to our historical debt and the lower average outstanding balances of debt. The decrease was also driven by the Company’s realization of a 25 basis point reduction in interest rate when the Company achieved a net leverage ratio of less than or equal to 4.50 to 1.00 during the third quarter of 2015. Interest expense for the years ended December 31, 2015 and 2014 also included $8.9 million and $6.4 million, respectively, of interest expense related to an interest rate swap agreement covering a portion of our outstanding long-term debt entered into on April 14, 2014.
|
|
|
Year Ended December 31, |
|
|
Percent change |
|
|||||
|
(in millions) |
|
2015 |
|
|
2014 |
|
|
2015 vs. 2014 |
|
||
|
Loss on extinguishment of debt, net |
|
$ |
— |
|
|
$ |
2.0 |
|
|
NM |
(1) |
|
(1) |
Fluctuation in terms of percentage change is not meaningful |
63
In connection with the refinancing of our debt at the time of our IPO, we recorded a $2.0 million loss on extinguishment of debt, representing the write-off of unamortized debt issuance costs and associated fees.
|
|
|
Year Ended December 31, |
|
|
Percent change |
|
|||||
|
(in millions) |
|
2015 |
|
|
2014 |
|
|
2016 vs. 2015 |
|
||
|
Other income |
|
$ |
7.6 |
|
|
$ |
3.3 |
|
|
NM |
(1) |
|
(1) |
Fluctuation in terms of percentage change is not meaningful |
Other income totaled $7.6 million and $3.3 million, respectively, for the years ended December 31, 2015 and 2014. The increase of $4.3 million is primarily related to a settlement for business interruption caused by the Deepwater Horizon oil spill in the Gulf of Mexico in 2010.
|
|
|
Year Ended December 31, |
|
|
Percent change |
|
|
||||||
|
(in millions) |
|
2015 |
|
|
2014 |
|
|
2015 vs. 2014 |
|
|
|||
|
Income tax expense |
|
$ |
(22.5 |
) |
|
$ |
(28.8 |
) |
|
|
(21.9 |
) |
|
|
Recognition of net deferred tax liabilities upon C-corporation conversion |
|
|
— |
|
|
|
(321.1 |
) |
|
NM |
|
(1) |
|
|
(1) |
Fluctuation in terms of percentage change is not meaningful |
Income tax expense totaled $22.5 million and $28.8 million, respectively, for the years ended December 31, 2015 and 2014. The decrease of $6.3 million, or 21.9 percent, was primarily driven by a decrease in the impact of equity compensation charges that are not deductible for income tax purposes. This decrease is partially offset by an increase in income from operations.
Prior to our IPO on April 14, 2014, we operated within legal structures that are disregarded for federal and most state income tax purposes. Accordingly, in those jurisdictions that recognize disregarded status, items of income and expense have been allocated to the owners of our legal entities. Our partnership and REIT status terminated in connection with the IPO, as the La Quinta Predecessor Entities were contributed to Holdings, a “C” corporation, and our REITs were converted into limited liability companies. In connection with this reorganization, we recorded a one-time net deferred tax expense of $321.1 million, primarily driven by the accumulated differences between book and tax depreciation, as well as the recognition of additional deferred tax assets primarily related to the expected realization of federal net operating loss carryforwards.
64
Segment results
We evaluate our segments’ operating performance using segment Adjusted EBITDA, as described in Note 18: “Segments” in the consolidated financial statements of La Quinta Holdings Inc. as of December 31, 2016 and 2015 and for the years ended December 31, 2016, 2015 and 2014, included elsewhere in this report. Refer to those financial statements for a reconciliation of Adjusted EBITDA to net income. For a discussion of our definitions of EBITDA and Adjusted EBITDA, how management uses them to manage our business and material limitations on their usefulness, refer to “—Key indicators of financial condition and operating performance.” The following table sets forth revenues and Adjusted EBITDA by segment, reconciled to consolidated amounts, for the years ended December 31, 2015 and 2014. The comparison of the year ended December 31, 2015 to the year ended December 31, 2014 is impacted by the purchase of the Previously Managed Hotels at the time of the IPO and the change in certain intercompany agreements which went into effect on April 14, 2014—refer to the footnotes to the table below for a more detailed discussion:
|
|
|
Year Ended December 31, |
|
|||||
|
(in thousands) |
|
2015 |
|
|
2014 |
|
||
|
Revenues |
|
|
|
|
|
|
|
|
|
Owned Hotels |
|
$ |
911,491 |
|
|
$ |
870,061 |
|
|
Franchise and Management (1) |
|
|
114,610 |
|
|
|
94,002 |
|
|
Segment revenues |
|
|
1,026,101 |
|
|
|
964,063 |
|
|
Other revenues from franchised and managed properties |
|
|
23,204 |
|
|
|
21,481 |
|
|
Corporate and other (2) |
|
|
126,469 |
|
|
|
116,805 |
|
|
Intersegment elimination (3) |
|
|
(145,800 |
) |
|
|
(125,411 |
) |
|
Total revenues |
|
$ |
1,029,974 |
|
|
$ |
976,938 |
|
|
Adjusted EBITDA |
|
|
|
|
|
|
|
|
|
Owned Hotels |
|
$ |
314,278 |
|
|
$ |
312,067 |
|
|
Franchise and Management |
|
|
114,610 |
|
|
|
94,002 |
|
|
Segment Adjusted EBITDA |
|
|
428,888 |
|
|
|
406,069 |
|
|
Corporate and other |
|
|
(34,846 |
) |
|
|
(36,180 |
) |
|
Adjusted EBITDA |
|
$ |
394,042 |
|
|
$ |
369,889 |
|
|
(1) |
This segment includes intercompany fees which are charged to our owned hotels to reflect that certain functions, such as licensing and management, are included in the franchise and management segment. Prior to the IPO, we charged aggregate fees of 2.0% (0.33% license fees for trademark rights and 1.67% management fee for management services) to our owned hotels. In connection with the IPO, we entered into a new franchise agreement with our owned hotels, which covers certain services as well as trademark rights, and a new management agreement and terminated the existing agreements with our owned hotels. The new agreements, which commenced April 14, 2014, provide for a franchise fee of 4.5% of gross room revenues and a management fee of 2.5% of gross operating revenues for our owned hotels. Our consolidated financial information by segment for periods prior to April 14, 2014 presented herein reflects the historical aggregate fees of 2.0%. |
|
(2) |
Includes revenues related to our brand management programs and other cost reimbursements. The portions of these fees that are charged to our owned hotels, which totaled $75.1 million and $68.4 million for the years ended December 31, 2015 and 2014, respectively, are eliminated in the accompanying consolidated financial statements. The franchise agreement we entered into with our owned hotels upon effectiveness of the IPO also includes a reservation fee of 2.0% of gross room revenues, which is reflected in corporate and other. |
|
(3) |
Includes management, license, franchise, BMF, Returns and other cost reimbursements totaling $145.8 million and $125.4 million for the years ended December 31, 2015 and 2014, respectively. These fees are charged to owned hotels and are eliminated in the accompanying consolidated financial statements |
Owned hotels
Owned Hotels segment revenues increased primarily due to an improvement in RevPAR of 3.5 percent at our comparable owned hotels. Refer to “Revenues—Owned hotels” within this section for further discussion on the increase in revenues from our comparable owned hotels. Our Owned Hotels segment’s Adjusted EBITDA increased as a result of an increase in Owned Hotels segment revenues of approximately $41.4 million, partially offset by increased direct lodging expenses of $20.1 million, and other lodging and operating expenses of $6.5 million. Refer to “Operating expenses—Owned hotels” within this section for further discussion on the increase in operating expenses at our owned hotels.
65
Franchise and management
Franchise and Management segment revenues increased by $20.6 million primarily as a result of the increases in RevPAR of 3.4 percent at our comparable franchised and owned hotels and the net addition of 31 hotels added to our franchise system as well as the full year effect from the establishment of new franchise and management agreements for our owned hotels in April 2014. Refer to “Revenues—Franchise and other fee-based revenues” within this section for further discussion on the increase in revenues from our comparable franchised hotels. Our Franchise and Management segment’s Adjusted EBITDA increased as a result of the overall increase in Franchise and Management segment revenues.
Liquidity and capital resources
Overview
As of December 31, 2016, we had total cash and cash equivalents of $160.6 million. Our liquidity requirements primarily consist of funds necessary to pay for operating expenses and other expenditures, including corporate expenses, taxes, payroll and related benefits, legal costs, operating costs associated with the operation of hotels, interest and scheduled principal payments on our outstanding indebtedness, potential payments related to our interest rate swap, capital expenditures for renovations and maintenance at our owned hotels, and other purchase commitments.
Concurrently with the consummation of the IPO, we entered into a new credit agreement to refinance all of our then existing secured debt, which was to mature in July 2014. The new credit agreement provides for senior secured credit facilities consisting of a $2.1 billion senior secured term loan facility, which will mature in 2021, and a $250.0 million senior secured revolving credit facility, $50.0 million of which is available in the form of letters of credit, which will mature in 2019. See “—Debt” for a further discussion of our credit agreement. In addition, following consummation of the IPO, for federal income tax purposes, our partnership and REIT status terminated and we became subject to additional entity-level taxes at the federal and state level and, in our second quarter, we established the related net deferred tax liability on our books equal to $321.1 million. With the full utilization of our federal net operating losses (“NOLs”) in 2016, we currently expect our cash taxes for 2016 to be $11 million. In November 2014, Blackstone completed a secondary offering in which it registered and sold 23.0 million of the Company’s shares, reducing its ownership percentage to 45.2%, and creating an ownership change for federal income tax purposes. As a result of this secondary offering and the resulting ownership change the Company’s federal net operating losses will be limited under Internal Revenue Code Section 382 with annual limitations that became applicable in 2015 and will continue through 2019. State net operating loss carryforwards are also available for use subject to similar limitations in many cases.
We finance our business activities primarily with existing cash and cash generated from our operations. We believe that this cash will be adequate to meet anticipated requirements for operating expenses and other expenditures, including corporate expenses, payroll and related benefits, legal costs, and purchase commitments for the foreseeable future. The objectives of our cash management policy are to maintain the availability of liquidity and minimize operational costs.
We and our affiliates, and/or our major stockholders and their respective affiliates, may from time to time purchase our outstanding debt through open market purchases, privately negotiated transactions or otherwise. Purchases or retirement of debt, if any, will depend on prevailing market conditions, liquidity requirements, contractual restrictions and other factors. The amounts involved may be material.
The following table summarizes our net cash flows:
|
|
|
As of and for the year ended December 31, |
|
|
Percent Change |
|
|
||||||||||||||
|
(in millions) |
|
2016 |
|
|
2015 |
|
|
2014 |
|
|
2016 vs. 2015 |
|
|
2015 vs. 2014 |
|
|
|||||
|
Net cash provided by operating activities |
|
$ |
262.8 |
|
|
$ |
281.7 |
|
|
$ |
278.9 |
|
|
|
(6.7 |
) |
|
|
1.0 |
|
|
|
Net cash used in investing activities |
|
|
(69.3 |
) |
|
|
(46.3 |
) |
|
|
(37.0 |
) |
|
|
49.7 |
|
|
|
25.1 |
|
|
|
Net cash used in financing activities |
|
|
(119.7 |
) |
|
|
(258.6 |
) |
|
|
(165.5 |
) |
|
|
(53.7 |
) |
|
|
56.3 |
|
|
Our ratio of current assets to current liabilities was 1.36 and 1.07 as of December 31, 2016 and 2015, respectively.
Operating activities
Net cash provided by operating activities was $262.8 million for the year ended December 31, 2016, compared to $281.7 million for the year ended December 31, 2015. The $18.9 million decrease was primarily driven by decreased operating income prior to the reduction for equity based compensation and the impairment loss. The change period over period also includes the effects of timing in our various working capital components including other current assets, accrued payroll and employee benefits.
66
Net cash provided by operating activities was $281.7 million for the year ended December 31, 2015, compared to $278.9 million for the year ended December 31, 2014. The $2.8 million increase was primarily driven by increased operating income prior to the reduction for increased impairment loss and a reduction in interest expense. The change period over period also includes the effects of timing in our various working capital components including accounts receivable and accrued expenses and other liabilities.
Investing activities
Net cash used in investing activities during the year ended December 31, 2016 was $69.3 million, compared to net cash used in investing activities of $46.3 million during the year ended December 31, 2015. The $23.0 million increase in cash used in investing activities was primarily an increase of $51.8 million of capital expenditures driven by increased renovations of our owned properties, which was partially offset by an increase in proceeds from the sale of owned assets during 2016.
Net cash used in investing activities during the year ended December 31, 2015 was $46.3 million, compared to net cash used in investing activities of $37.0 million during the year ended December 31, 2014. The $9.3 million increase in cash used in investing activities was primarily attributable to an increase in capital expenditures of $20.5 million and the $103.0 million decrease in restricted cash in 2014, partially offset by an increase in proceeds from the sale of assets of $30.5 million, an increase in insurance proceeds from casualty disasters of $4.9 million and a decrease in the cash acquisition costs for the 14 Previously Managed Hotels of $77.7 million in 2014.
Financing activities
Net cash used in financing activities during the year ended December 31, 2016 was $119.7 million, compared to $258.6 million during the year ended December 31, 2015. The $138.9 million decrease in cash used in financing activities was primarily attributable to prior period voluntary principal payments of long-term debt totaling $135.0 million.
Net cash used in financing activities during the year ended December 31, 2015 was $258.6 million, compared to $165.5 million during the year ended December 31, 2014. The $93.1 million increase in cash used in financing activities was primarily attributable to the increase in treasury stock due to our use of $100 million for our stock repurchase program offset by the decrease in our repayment of long-term debt, which in 2015 included $152.7 million of repayments. Additionally in 2014, financing activities were impacted by the proceeds from our senior debt facility of $2.1 billion, the net proceeds from issuance of common stock of $698.0 million, and capital contributions of $21.5 million, partially offset by repayment of long-term debt of $2.9 billion, including $204.8 million of our senior debt facility, payment of deferred costs of $27.3 million, payment of original issue discount of $10.5 million, distributions to noncontrolling interest holders of $4.5 million, including $3.9 million for redemption of the capital stock held by third-party shareholders of our REIT entities.
Capital expenditures
We divide our capital expenditures primarily between “renovation and maintenance” and “investment” capital. Renovation and maintenance capital expenditures are comprised of repair and maintenance in the ordinary course of operations, as well as cycle renovations and ongoing maintenance of our technology infrastructure to keep it current and operational. Investment capital expenditures include projects designed to provide additional return on investment in a short period of time, and may include acceleration of renovation cycles for our owned hotels in order to improve their market positioning in the short term.
Our capital expenditures are generally paid using cash on hand and cash flows from operations.
During the years ended December 31, 2016 and 2015, we incurred capital expenditures of approximately $143.8 million and $92.0 million, respectively. The increase in capital expenditures is primarily related to increased spending of investment capital and funds to recover from natural and other disasters related to our owned hotels.
During the years ended December 31, 2015 and 2014, we incurred capital expenditures of approximately $92.0 million and $71.5 million, respectively. The increase in capital expenditures is primarily related to increased spending of investment capital and funds to recover from natural and other disasters related to our owned hotels.
We currently consider a spending level of approximately 8.5-9.0% of the year’s total annual revenues for capital expenditures to be required for maintenance and repair in the ordinary course of operations, as well as cycle renovations and ongoing maintenance of our technology infrastructure to keep it current and operational. These levels do not reflect additional capital expenditures we may elect to make to, among other reasons, maintain or improve our competitive position or construct or acquire new hotels. We currently intend to make significant additional capital investments in 2017 focused on accelerating renovations of our owned hotels and investing in technology innovation to enhance our guest experience.
67
As of December 31, 2016, we had outstanding commitments under capital expenditure contracts of approximately $58.3 million for capital expenditures at certain owned hotels and for information technology enhancements. If cancellation of a contract occurred, our commitment would be any costs incurred up to the cancellation date, in addition to any costs associated with the discharge of the contract.
Debt
Concurrently with the consummation of the IPO, we refinanced all of our existing debt and accrued interest and related fees. As part of the refinancing, we entered into a credit agreement which provides for senior secured credit facilities consisting of:
|
|
• |
a $2.1 billion senior secured term loan facility, which will mature in 2021; and |
|
|
• |
a $250.0 million senior secured revolving credit facility, which will mature in 2019. The revolving credit facility includes $50 million of borrowing capacity available for letters of credit and borrowing capacity for short-term borrowings referred to as the swing line borrowings. |
In addition, the senior secured credit facilities also provide us with the option to (1) raise incremental credit facilities including an uncommitted incremental facility that provides us the option to increase the amounts available under the term loans and/or the revolving credit facility by an aggregate of up to $350.0 million, subject to additional increases upon achievement of a consolidated first lien net leverage ratio of less than or equal to 6.00 to 1.00 (or, after April 14, 2015, 5.75 to 1.00), (2), refinance the loans with debt incurred outside the credit agreement and (3) extend the maturity date of the revolving credit facility and term loans, subject to certain limitations.
We used the net proceeds of the senior secured term loan facility, together with the net proceeds from the IPO and available cash, to repay all of our previous indebtedness. In 2015, we made voluntary prepayments of $135.0 million on the term loan facility. We also made quarterly scheduled principal payments of $17.7 million in the aggregate in 2015. In 2014, we made voluntary prepayments of $195.0 million on the term loan facility. We also made quarterly scheduled principal payments of $9.8 million in the aggregate in September and December 2014.
Borrowings under the term loans bear interest, at the option of the Borrower (as defined below), at a rate equal to a margin over either (a) a base rate determined by reference to the highest of (1) the administrative agent’s prime lending rate, (2) the federal funds effective rate plus 1/2 of 1.00% and (3) the LIBOR rate for a one-month interest period plus 1.00% or (b) a LIBOR rate determined by reference to the Reuters LIBOR rate for the interest period relevant to such borrowing. The margin for the term loans is 2.00%, in the case of base rate loans, and 3.00% in the case of LIBOR rate loans, subject to one step-down of 0.25% upon the achievement of a consolidated first lien net leverage ratio (as defined in the credit agreement) of less than or equal to 4.50 to 1.00, subject to a base rate floor of 2.00%, and a LIBOR floor of 1.00%. As of July 31, 2015, we achieved a consolidated first lien net leverage ratio of less than 4.50 to 1.00, and, as a result we realized the step-down of 0.25% after that date.
Borrowings under the revolving credit facility bear interest, at the Borrower’s option, at a rate equal to a margin over either (a) a base rate determined by reference to the highest of (1) the administrative agent’s prime lending rate, (2) the federal funds effective rate plus 1/2 of 1.00% and (3) the LIBOR rate for a one-month interest period plus 1.00% or (b) a LIBOR rate determined by reference to the Reuters LIBOR rate for the interest period relevant to such borrowing. The margin for the revolving credit facility is 1.50%, in the case of base rate loans, and 2.50%, in the case of LIBOR rate loans, subject to three step-downs of 0.25% each upon the achievement of a consolidated first lien net leverage ratio of less than or equal to 5.00 to 1.00, 4.50 to 1.00 and 4.00 to 1.00, respectively. As of March 2, 2015, we achieved a consolidated first lien net leverage ratio of less than 5.00 to 1.00, and after March 2, 2015 we realized the first step-down in margin of 0.25%. As of July 31, 2015, we achieved a consolidated first lien net leverage ratio of less than 4.50 to 1.00, and, as a result we realized the second step-down in margin of 0.25% after that date.
In addition, the Borrower is required to pay a commitment fee to the lenders under the revolving credit facility in respect of the unutilized commitments thereunder. The commitment fee rate is 0.50% per annum subject to a step-down to 0.375%, upon achievement of a consolidated first lien net leverage ratio of less than or equal to 5.00 to 1.00. The Borrower is also required to pay customary letter of credit fees. As of March 2, 2015, we achieved a consolidated first lien net leverage ratio of less than 5.00 to 1.00, and after March 2, 2015 we realized the step-down in margin of 0.375%.
Beginning September 2014, the Borrower is required to repay installments on the term loans in quarterly installments equal to 0.25% of the original principal amount less any prepayments on the term loans, with the remaining amount payable on the applicable maturity date with respect to the term loans.
The senior secured credit facilities are unconditionally and irrevocably guaranteed by Holdings, and any subsidiary of Holdings that directly or indirectly owns any issued and outstanding equity interests of Holdings’ wholly-owned subsidiary, La Quinta Intermediate Holdings L.L.C., which is the borrower under the senior secured credit facilities (the “Borrower”), and, subject to certain
68
exceptions, each of the Borrower’s existing and future material domestic wholly owned subsidiaries (collectively, the “Guarantors”). In addition, the senior secured credit facilities are collateralized by first priority or equivalent security interests in (i) all the capital stock of, or other equity interests in, the Borrower and each of the Borrower’s and Guarantors’ material direct or indirect wholly owned restricted domestic subsidiaries and 65% of the voting stock (and 100% of the non-voting stock) of, or other equity interests in, each of the Borrower’s or any subsidiary Guarantor’s material direct wholly owned first-tier restricted foreign subsidiaries and (ii) certain tangible and intangible assets of the Borrower (other than real property except for certain real property described in the credit agreement) and those of the Guarantors (subject to certain exceptions and qualifications).
As of the closing date for the senior secured credit facilities, we did not have any foreign subsidiaries, non-wholly owned domestic subsidiaries that are restricted subsidiaries or immaterial subsidiaries guarantee the senior secured credit facilities. The Borrower will also have the ability to designate certain subsidiaries as unrestricted subsidiaries utilizing its investment capacity under the senior secured credit facilities.
The senior secured credit facilities require us to prepay outstanding term loans, subject to certain exceptions, with (i) 50% of annual “excess cash flow” (with step-downs to 25% and 0%, as applicable, based upon the consolidated first lien net leverage ratio (as defined in the credit agreement)); (ii) 100% of the net cash proceeds of all non-ordinary course asset sales or other dispositions, subject to reinvestment rights; and (iii) 100% of the net proceeds of any incurrence of debt by the Borrower or any of its restricted subsidiaries, other than debt permitted to be incurred or issued under the senior secured credit facilities.
Each lender of the term loans has the right to reject its pro rata share of mandatory prepayments described above, in which case the Borrower may retain the amounts so rejected. The foregoing mandatory prepayments will be applied to installments of the term loans in direct order of maturity.
The Borrower has the ability to voluntarily repay outstanding loans at any time without premium or penalty, other than customary “breakage” costs with respect to LIBOR loans.
The senior secured credit facilities contain a number of significant affirmative and negative covenants. Such covenants, among other things, limit or restrict, subject to certain exceptions, the ability of (i) the Company to engage in any material operating or business activities other than the ownership of the equity interests of the Borrower and (ii) the Borrower and its restricted subsidiaries to:
|
|
• |
incur additional indebtedness and make guarantees; |
|
|
• |
create liens on assets; |
|
|
• |
enter into sale and leaseback transactions; |
|
|
• |
engage in mergers or consolidations; |
|
|
• |
sell certain assets; |
|
|
• |
make fundamental changes; |
|
|
• |
pay dividends and distributions or repurchase capital stock; |
|
|
• |
make investments, loans and advances; |
|
|
• |
engage in certain transactions with affiliates; |
|
|
• |
make changes in the nature of their business; and |
|
|
• |
make prepayments of junior debt. |
In addition, if, on the last day of any period of four consecutive quarters on or after June 30, 2014, the aggregate principal amount of revolving credit loans, swing line loans and/or letters of credit (excluding up to $20 million of letters of credit and certain other letters of credit that have been cash collateralized or back-stopped) that are issued and/or outstanding is greater than 25% of the revolving credit facility, the credit agreement requires the Borrower to maintain a maximum consolidated first lien net leverage ratio not to exceed 8.0 to 1.0. During any period in which our corporate issuer rating is equal to or higher than Baa3 (or the equivalent) according to Moody’s Investors Service, Inc. or BBB- (or the equivalent) according to Standard & Poor’s Ratings Services and no default has occurred and is continuing, the restrictions in the senior secured credit facilities regarding incurring additional indebtedness, dividends and distributions or repurchases of capital stock and transactions with affiliates will not apply to the Borrower and its restricted subsidiaries.
69
The senior secured credit facilities also contain certain customary representations and warranties, affirmative covenants and events of default. If an event of default occurs, the lenders under the senior secured credit facilities will be entitled to take various actions, including the acceleration of amounts due under the senior secured credit facilities and actions permitted to be taken by a secured creditor. As of December 31, 2016, we were in compliance with all covenants under the senior secured credit facilities.
On April 14, 2014, we entered into an interest rate swap agreement with an aggregate notional amount of $850.0 million that expires on April 14, 2019. This agreement swaps the LIBOR rate in effect under the new credit agreement for this portion of the loan to a fixed-rate of 2.0311%, which includes the 1% LIBOR floor. We have elected to designate this interest rate swap as a cash flow hedge for accounting purposes.
If we are unable to generate sufficient cash flow from operations in the future to service our debt, we may be required to reduce capital expenditures or refinance all or a portion of our existing debt. Our ability to make scheduled principal payments and to pay interest on our debt depends on the future performance of our operations, which is subject to general conditions in or affecting the hotel industry that are beyond our control. See “Risk Factors—Risks related to our business and industry” and “Risk Factors—Risks relating to our indebtedness” in this report.
Contractual obligations
The following table summarizes our significant contractual obligations as of December 31, 2016:
|
(in millions) |
|
Total |
|
|
Less than 1 year |
|
|
1-3 years |
|
|
3-5 years |
|
|
More than 5 years |
|
|||||
|
Long-term debt obligations(1) |
|
$ |
1,725 |
|
|
$ |
18 |
|
|
$ |
35 |
|
|
$ |
1,672 |
|
|
|
— |
|
|
Interest on long-term debt (2) |
|
|
319 |
|
|
|
73 |
|
|
|
137 |
|
|
|
109 |
|
|
|
— |
|
|
Operating and ground leases |
|
|
127 |
|
|
|
5 |
|
|
|
9 |
|
|
|
9 |
|
|
|
104 |
|
|
Purchase commitments (3) |
|
|
58 |
|
|
|
58 |
|
|
|
— |
|
|
|
— |
|
|
|
— |
|
|
Total contractual obligations |
|
$ |
2,229 |
|
|
$ |
154 |
|
|
$ |
181 |
|
|
$ |
1,790 |
|
|
$ |
104 |
|
|
(1) |
Long-term debt obligation excludes the deduction of debt issuance costs of $18.5 million and includes the unamortized portion of the original issue discount of $6.7 million. |
|
(2) |
For our unhedged variable-rate debt we have assumed a LIBOR floor of 1.0 percent plus a spread of 2.75 percent. For our interest rate swap, we have used the fixed-rate of 2.0311 percent, which includes a 1 percent LIBOR floor. |
|
(3) |
Purchase commitments include outstanding commitments under contracts for capital expenditures at certain owned hotels and for information technology enhancements. |
In addition to the purchase commitments in the table above, in the normal course of business, we enter into purchase commitments for which we are reimbursed by our franchisees. These obligations have minimal or no impact on our net income and cash flow.
Off-balance sheet arrangements
We do not have off-balance sheet arrangements that have or are reasonably likely to have a current or future effect on our financial condition, revenues or expenses, results of operations, liquidity, capital expenditures or capital resources. Under certain franchise agreements, we have committed to provide certain incentive payments, reimbursements, rebates and other payments, to help defray the costs of construction, marketing and other costs associated with opening and operating a La Quinta hotel.
Critical accounting policies and estimates
The preparation of our financial statements in accordance with GAAP requires us to make estimates and assumptions that affect the reported amounts of assets and liabilities as of the date of the financial statements, the reported amounts of revenues and expenses during the reporting periods and the related disclosures in the consolidated financial statements and accompanying footnotes. We believe that of our significant accounting policies, which are described in Note 2: “Significant Accounting Policies and Recently Issued Accounting Standards” in the audited financial statements included elsewhere in this report, the following accounting policies are critical because they involve a higher degree of judgment, and the estimates required to be made were based on assumptions that are inherently uncertain. As a result, these accounting policies could materially affect our financial position, results of operations and related disclosures. On an ongoing basis, we evaluate these estimates and judgments based on historical experiences and various other factors that are believed to reflect the current circumstances. While we believe our estimates, assumptions and judgments are reasonable, they are based on information presently available. Actual results may differ significantly from these estimates due to changes in judgments, assumptions and conditions as a result of unforeseen events or otherwise, which could have a material impact on financial position or results of operations.
70
Investments in long-lived assets
We review the performance of our long-lived assets, such as property and equipment and intangible assets, for impairment, whenever events or changes in circumstances indicate that the carrying amount of an asset may not be recoverable. We also identify properties we intend to sell and properties we intend to hold for use. For each lodging asset or group of assets held for use, we compare the sum of the expected future cash flows (undiscounted and without interest charges) generated by the asset or group of assets with its associated net carrying value. If the net carrying value of the asset or group of assets exceeds expected future cash flows, the excess of the net book value over estimated fair value is charged to impairment loss in the accompanying consolidated statements of operations. Properties held for sale are reported at the lower of their carrying amount of their estimated sales price, less estimated costs to sell.
We estimate fair value primarily using unobservable inputs by (1) calculating the discounted expected future cash flows and (2) calculating expected liquidated sales proceeds, relying on common hotel valuation methods such as multiples of room revenues or per room valuations. Our estimate of fair value of the asset using these unobservable inputs then becomes the new basis of the asset or group of assets and this new basis is then depreciated over the asset’s remaining useful life. We may be subject to impairment charges in the future, in the event that operating results of individual hotel operations are materially different from its forecasts, the economy or the lodging industry weakens or the estimated holding period of a hotel is shortened.
Guest loyalty program
Our guest loyalty program, La Quinta Returns, allows members to earn points primarily based on certain dollars spent at our owned and franchised hotels or via our co-branded credit card. Members may redeem points earned for free night certificates, gift cards, airline miles and a variety of other awards. We account for the economic impact of points earned by accruing an estimate of liability for unredeemed points. The expense related to this estimate includes the cost of administering the program, as well as the incremental cost of the stay at one of its hotels or the value of awards purchased from program partners. We estimate the future redemption obligation based upon historical experience, including an estimate of “breakage” for points that will never be redeemed. The estimate is based on a calculation that includes assumptions for the redemption rate, redemption type (whether for a free night certificate or other award), rate of redemption at our owned hotels versus franchised hotels, and the number of points required per stay. Actual results of the Returns program, and the related expense and liability, may vary significantly from our estimates due primarily to variances from assumptions used in the calculation of its obligation for future redemptions and changes in member behavior. These variances are accounted for as changes in estimates and are charged to operations as they become known.
We had approximately $17.1 million of guest loyalty liability as of December 31, 2016. Changes in the estimates used in developing our breakage rate could result in a material change to our loyalty liability. Currently, a 10% decrease to the breakage estimate used in determining future award redemption obligations would increase our loyalty liability by approximately $3.9 million.
Insurance programs
Workers’ compensation, automobile and general liability
We maintain a retrospective loss deductible insurance program for workers’ compensation and automobile liability loss exposures, and a self-insured retention program for our commercial general liability loss exposures related to our lodging operations. A transfer of risk to an insurance underwriter is purchased for loss exposures in excess of the deductible and retention limits on both a primary and excess limits basis.
Case loss reserves are established for losses within the insurance and self-insured programs. These individual case reserves are estimates of amounts necessary to settle the claims as of the reporting date. These individual case estimates are based on known facts and interpretations of circumstances and legal standards and include the claims representatives’ expertise and experience with similar cases. These individual estimates change over time as additional facts and information become known.
On at least a semi-annual basis, we perform a formal review of estimates of the ultimate liability for losses and associated expenses for each coverage component of the casualty insurance program within the deductible and self-insured retention. We engage outside actuaries who perform an analysis of historical development trends of loss frequency and severity in order to project the ultimate liability for losses, including incurred but not reported claims. The outside actuaries utilize various actuarial methods such as the loss triangle technique to derive loss development factors from the actual loss experience, which translate current case reserve value to an ultimate basis by measuring the historical change in valuations over time, which is characteristic of liability losses. Other methods such as “increased limits factors” are utilized for projecting losses and are calculated based on historical experience and represent an average over several years and used to estimate the ultimate loss. We revise our reserve amounts periodically based upon recognized changes in the development factors and trends that affect loss costs and their impact on the actuarial calculation. These estimates are influenced by external factors, including inflation, changes in law, court decisions and changes to regulatory requirements, economic conditions and public attitudes.
71
Employee healthcare
We maintain a self-insurance program for major medical and hospitalization coverage for our employees and their dependents, which is partially funded by payroll deductions. Payments for major medical and hospitalization to individual participants below specified amounts are self-insured by us. We base our estimate of ultimate liability on trends in claim payment history, historical trends in incurred but not reported incidents and developments in other cost components (such as rising medical costs, projected premium costs and the number of participants). Our liability with respect to employee healthcare reserves is monitored on a periodic basis and adjusted accordingly.
Income taxes
We are subject to income taxes and account for the income taxes using the asset and liability approach for financial accounting and reporting purposes.
For financial reporting purposes, income tax expense or benefit is based on reported financial accounting income or loss before income taxes.
Deferred tax assets and liabilities reflect the temporary differences between assets and liabilities recognized for financial reporting and the analogous amounts recognized for tax purposes using the statutory tax rates expected to be in effect for the year in which the differences are expected to reverse. We evaluate the probability of realizing the future benefits of deferred tax assets and provide a valuation allowance for the portion of any deferred tax assets where the likelihood of realizing an income tax benefit in the future does not meet the more-likely-than-not criteria for recognition.
We recognize the financial statement benefit of a tax position only after determining that the relevant tax authority would more likely than not sustain the position following an audit. For tax positions meeting the more-likely-than-not threshold, the amount recognized in the financial statements is the largest benefit that has a greater than 50 percent likelihood of being realized upon ultimate settlement with the relevant tax authority.
See Note 13: “Income Taxes” in the audited consolidated financial statements included elsewhere in this report.
Legal contingencies
We are subject to various legal proceedings and claims, the outcomes of which are subject to significant uncertainty. We accrue an estimated amount for a loss contingency if it is probable and the amount of the loss can be reasonably estimated. Significant judgment is required when we evaluate, among other factors, the degree of probability of an unfavorable outcome and the ability to make a reasonable estimate of the amount of loss. Changes in these factors could materially impact our consolidated financial statements.
New Accounting Pronouncements
See Note 2 of the notes to our consolidated financial statements in this Annual Report on Form 10-K for a comprehensive list of new accounting pronouncements.
Quantitative and qualitative disclosures about market risk
We are exposed to market risk primarily from changes in interest rates, which may impact future income, cash flows, and fair value of the Company, depending on changes to interest rates. In certain situations, we may seek to reduce cash flow volatility associated with changes in interest rates by entering into financial arrangements intended to provide a hedge against a portion of the risks associated with such volatility. We continue to have exposure to such risks to the extent they are not hedged. We enter into derivative financial arrangements to the extent they meet the objective described above, or are required by the terms of our debt facilities, and we do not use derivatives for trading or speculative purposes.
Interest rate risk
We are exposed to interest rate risk under our new credit agreement, as the interest is floating rate based on LIBOR, subject to a 1% LIBOR floor. On April 14, 2014, we entered into an interest rate swap agreement with an aggregate notional amount of $850.0 million that expires on April 14, 2019. This agreement swaps the LIBOR rate in effect under the new credit agreement for this portion of the loan to a fixed-rate of 2.0311%, which includes the 1% LIBOR floor. We have elected to designate this interest rate swap as a
72
cash flow hedge for accounting purposes. The 30-day LIBOR rate increased from 0.36 percent per annum at December 31, 2015 to 0.72% percent at December 31, 2016. Changes in interest rates also affect the fair value of our debt.
The following table sets forth the scheduled maturities and the total estimated fair value as of December 31, 2016 for our financial instruments that were materially affected by interest rate risks (in millions, excluding average interest rate):
|
|
|
Maturities by period |
|
|
|
|
|
|
Fair |
|
||||||||||||||||||||||
|
|
|
2017 |
|
|
2018 |
|
|
2019 |
|
|
2020 |
|
|
2021 |
|
|
Thereafter |
|
|
Total |
|
|
value |
|
||||||||
|
Term Facility |
|
$ |
17.5 |
|
|
$ |
17.5 |
|
|
$ |
17.5 |
|
|
$ |
17.5 |
|
|
$ |
1,630.0 |
|
|
$ |
- |
|
|
$ |
1,700.0 |
|
|
$ |
1,716.8 |
|
|
Weighted average interest rate (1) |
|
|
|
|
|
|
|
|
|
|
|
|
|
|
|
|
|
|
|
|
|
|
|
|
|
|
4.258 |
% |
|
|
|
|
|
(1) |
Weighted average interest rate as of December 31, 2016, which includes the effect of the interest rate swap. |
Refer to our Note 10: “Fair Value Measurements” in the audited consolidated financial statements included elsewhere in this report for further discussion of the fair value measurements of our financial assets and liabilities.
73
INDEX TO CONSOLIDATED FINANCIAL STATEMENTS
74
REPORT OF INDEPENDENT REGISTERED PUBLIC ACCOUNTING FIRM
To the Board of Directors and Stockholders of
La Quinta Holdings Inc.
Irving, Texas
We have audited the accompanying consolidated balance sheets of La Quinta Holdings Inc. and subsidiaries (the “Company”), as of December 31, 2016 and 2015, and the related consolidated statements of operations, comprehensive income (loss), stockholders’ equity and cash flows for each of the three years in the period ended December 31, 2016. These financial statements are the responsibility of the Company’s management. Our responsibility is to express an opinion on the financial statements based on our audits.
We conducted our audits in accordance with the standards of the Public Company Accounting Oversight Board (United States). Those standards require that we plan and perform the audit to obtain reasonable assurance about whether the financial statements are free of material misstatement. An audit includes examining, on a test basis, evidence supporting the amounts and disclosures in the financial statements. An audit also includes assessing the accounting principles used and significant estimates made by management, as well as evaluating the overall financial statement presentation. We believe that our audits provide a reasonable basis for our opinion.
In our opinion, such consolidated financial statements present fairly, in all material respects, the financial position of La Quinta Holdings Inc. and subsidiaries at December 31, 2016 and 2015, and the results of their operations and their cash flows for each of the three years in the period ended December 31, 2016, in conformity with accounting principles generally accepted in the United States of America.
We have also audited, in accordance with the standards of the Public Company Accounting Oversight Board (United States), the Company's internal control over financial reporting as of December 31, 2016, based on the criteria established in Internal Control — Integrated Framework (2013) issued by the Committee of Sponsoring Organizations of the Treadway Commission and our report dated February 28, 2017 expressed an unqualified opinion on the Company's internal control over financial reporting.
/s/ Deloitte & Touche LLP
Dallas, Texas
February 28, 2017
75
La Quinta Holdings Inc.
As of December 31, 2016 and 2015
|
|
|
2016 |
|
|
2015 |
|
||
|
|
|
(in thousands, except share data) |
|
|||||
|
ASSETS |
|
|
|
|
|
|
|
|
|
Current Assets: |
|
|
|
|
|
|
|
|
|
Cash and cash equivalents |
|
$ |
160,596 |
|
|
$ |
86,709 |
|
|
Accounts receivable, net of allowance for doubtful accounts of $4,022 and $4,773 |
|
|
45,337 |
|
|
|
37,625 |
|
|
Assets held for sale |
|
|
29,544 |
|
|
|
35,523 |
|
|
Other current assets |
|
|
9,943 |
|
|
|
12,066 |
|
|
Total Current Assets |
|
|
245,420 |
|
|
|
171,923 |
|
|
Property and equipment, net of accumulated depreciation |
|
|
2,456,780 |
|
|
|
2,623,472 |
|
|
Intangible assets, net of accumulated amortization |
|
|
177,002 |
|
|
|
178,095 |
|
|
Other non-current assets |
|
|
13,321 |
|
|
|
12,354 |
|
|
Total Non-Current Assets |
|
|
2,647,103 |
|
|
|
2,813,921 |
|
|
Total Assets |
|
$ |
2,892,523 |
|
|
$ |
2,985,844 |
|
|
LIABILITIES AND EQUITY |
|
|
|
|
|
|
|
|
|
Current Liabilities: |
|
|
|
|
|
|
|
|
|
Current portion of long-term debt |
|
$ |
17,514 |
|
|
$ |
17,514 |
|
|
Accounts payable |
|
|
38,130 |
|
|
|
27,572 |
|
|
Accrued expenses and other liabilities |
|
|
64,581 |
|
|
|
63,120 |
|
|
Accrued payroll and employee benefits |
|
|
38,467 |
|
|
|
30,918 |
|
|
Accrued real estate taxes |
|
|
21,400 |
|
|
|
21,705 |
|
|
Total Current Liabilities |
|
|
180,092 |
|
|
|
160,829 |
|
|
Long-term debt |
|
|
1,682,436 |
|
|
|
1,694,585 |
|
|
Other long-term liabilities |
|
|
29,130 |
|
|
|
30,330 |
|
|
Deferred tax liabilities |
|
|
343,028 |
|
|
|
353,588 |
|
|
Total Liabilities |
|
|
2,234,686 |
|
|
|
2,239,332 |
|
|
Commitments and Contingencies |
|
|
|
|
|
|
|
|
|
Equity: |
|
|
|
|
|
|
|
|
|
Preferred Stock, $0.01 par value; 100,000,000 shares authorized and none outstanding as of December 31, 2016 and 2015 |
|
|
— |
|
|
|
— |
|
|
Common Stock, $0.01 par value; 2,000,000,000 shares authorized at December 31, 2016 and 2015, 131,750,715 shares issued and 116,790,470 shares outstanding as of December 31, 2016 and 130,974,073 shares issued and 124,302,318 shares outstanding as of December 31, 2015 |
|
|
1,318 |
|
|
|
1,310 |
|
|
Additional paid-in-capital |
|
|
1,165,651 |
|
|
|
1,152,155 |
|
|
Accumulated deficit |
|
|
(296,006 |
) |
|
|
(294,718 |
) |
|
Treasury stock at cost, 14,960,245 shares at December 31, 2016 and 6,671,755 shares at December 31, 2015 |
|
|
(209,523 |
) |
|
|
(107,699 |
) |
|
Accumulated other comprehensive loss |
|
|
(6,372 |
) |
|
|
(7,436 |
) |
|
Noncontrolling interests |
|
|
2,769 |
|
|
|
2,900 |
|
|
Total Equity |
|
|
657,837 |
|
|
|
746,512 |
|
|
Total Liabilities and Equity |
|
$ |
2,892,523 |
|
|
$ |
2,985,844 |
|
The accompanying notes are an integral part of these consolidated financial statements.
76
La Quinta Holdings Inc.
Consolidated Statements of Operations
For the years ended December 31, 2016, 2015 and 2014
|
|
|
2016 |
|
|
2015 |
|
|
2014 |
|
|||
|
|
|
(in thousands, except per share data) |
|
|||||||||
|
REVENUES: |
|
|
|
|
|
|
|
|
|
|
|
|
|
Room revenues |
|
$ |
855,302 |
|
|
$ |
887,358 |
|
|
$ |
846,203 |
|
|
Franchise and other fee-based revenues |
|
|
106,468 |
|
|
|
100,069 |
|
|
|
89,718 |
|
|
Other hotel revenues |
|
|
19,334 |
|
|
|
19,343 |
|
|
|
19,536 |
|
|
|
|
|
981,104 |
|
|
|
1,006,770 |
|
|
|
955,457 |
|
|
Brand marketing fund revenues from franchise and managed properties |
|
|
25,150 |
|
|
|
23,204 |
|
|
|
21,481 |
|
|
Total Revenues |
|
|
1,006,254 |
|
|
|
1,029,974 |
|
|
|
976,938 |
|
|
OPERATING EXPENSES: |
|
|
|
|
|
|
|
|
|
|
|
|
|
Direct lodging expenses |
|
|
409,886 |
|
|
|
398,828 |
|
|
|
378,705 |
|
|
Depreciation and amortization |
|
|
147,081 |
|
|
|
166,642 |
|
|
|
165,887 |
|
|
General and administrative expenses |
|
|
115,715 |
|
|
|
125,697 |
|
|
|
149,894 |
|
|
Other lodging and operating expenses |
|
|
62,281 |
|
|
|
63,513 |
|
|
|
56,984 |
|
|
Marketing, promotional and other advertising expenses |
|
|
68,327 |
|
|
|
69,810 |
|
|
|
62,161 |
|
|
Impairment loss |
|
|
104,258 |
|
|
|
50,121 |
|
|
|
5,157 |
|
|
(Gain) loss on sales |
|
|
(4,908 |
) |
|
|
4,088 |
|
|
|
— |
|
|
|
|
|
902,640 |
|
|
|
878,699 |
|
|
|
818,788 |
|
|
Brand marketing fund expenses from franchise and managed properties |
|
|
25,150 |
|
|
|
23,204 |
|
|
|
21,481 |
|
|
Total Operating Expenses |
|
|
927,790 |
|
|
|
901,903 |
|
|
|
840,269 |
|
|
Operating Income |
|
|
78,464 |
|
|
|
128,071 |
|
|
|
136,669 |
|
|
OTHER INCOME (EXPENSES): |
|
|
|
|
|
|
|
|
|
|
|
|
|
Interest expense, net |
|
|
(81,419 |
) |
|
|
(86,504 |
) |
|
|
(120,945 |
) |
|
Other income |
|
|
2,345 |
|
|
|
7,632 |
|
|
|
3,261 |
|
|
Loss on extinguishment of debt, net |
|
|
— |
|
|
|
— |
|
|
|
(2,030 |
) |
|
Total Other Income (Expenses) |
|
|
(79,074 |
) |
|
|
(78,872 |
) |
|
|
(119,714 |
) |
|
(Loss) Income From Continuing Operations Before Income Taxes |
|
|
(610 |
) |
|
|
49,199 |
|
|
|
16,955 |
|
|
Income tax expense |
|
|
(493 |
) |
|
|
(22,487 |
) |
|
|
(28,805 |
) |
|
Recognition of net deferred tax liabilities upon C-corporation conversion |
|
|
— |
|
|
|
— |
|
|
|
(321,054 |
) |
|
(Loss) Income from Continuing Operations, net of tax |
|
|
(1,103 |
) |
|
|
26,712 |
|
|
|
(332,904 |
) |
|
Loss on Discontinued Operations, net of tax |
|
|
— |
|
|
|
— |
|
|
|
(503 |
) |
|
NET (LOSS) INCOME |
|
|
(1,103 |
) |
|
|
26,712 |
|
|
|
(333,407 |
) |
|
Less: Income attributable to noncontrolling interests in continuing operations, net of tax |
|
|
(185 |
) |
|
|
(347 |
) |
|
|
(3,890 |
) |
|
Amounts attributable to La Quinta Holdings’ stockholders |
|
|
|
|
|
|
|
|
|
|
|
|
|
(Loss) income from continuing operations, net of tax |
|
|
(1,288 |
) |
|
|
26,365 |
|
|
|
(336,794 |
) |
|
Loss from discontinued operations, net of tax |
|
|
— |
|
|
|
— |
|
|
|
(503 |
) |
|
Net (Loss) Income attributable to La Quinta Holdings’ stockholders |
|
$ |
(1,288 |
) |
|
$ |
26,365 |
|
|
$ |
(337,297 |
) |
|
Earnings (loss) per share: |
|
|
|
|
|
|
|
|
|
|
|
|
|
Basic (loss) earnings per share |
|
$ |
(0.01 |
) |
|
$ |
0.21 |
|
|
$ |
(2.67 |
) |
|
Diluted (loss) earnings per share |
|
$ |
(0.01 |
) |
|
$ |
0.20 |
|
|
$ |
(2.67 |
) |
The accompanying notes are an integral part of these consolidated financial statements.
77
La Quinta Holdings Inc.
Consolidated Statements of Comprehensive Income (Loss)
For the years ended December 31, 2016, 2015, and 2014
|
|
|
2016 |
|
|
2015 |
|
|
2014 |
|
|||
|
|
|
(in thousands) |
|
|||||||||
|
NET (LOSS) INCOME |
|
$ |
(1,103 |
) |
|
$ |
26,712 |
|
|
$ |
(333,407 |
) |
|
Cash flow hedge adjustment, net of tax |
|
|
1,064 |
|
|
|
(4,309 |
) |
|
|
(3,127 |
) |
|
COMPREHENSIVE NET (LOSS) INCOME |
|
|
(39 |
) |
|
|
22,403 |
|
|
|
(336,534 |
) |
|
Comprehensive net income attributable to noncontrolling interests |
|
|
(185 |
) |
|
|
(347 |
) |
|
|
(3,890 |
) |
|
Comprehensive net (loss) income attributable to La Quinta Holdings’ Stockholders |
|
$ |
(224 |
) |
|
$ |
22,056 |
|
|
$ |
(340,424 |
) |
The accompanying notes are an integral part of these consolidated financial statements.
78
La Quinta Holdings Inc.
Consolidated Statements of Stockholders’ Equity
For the years ended December 31, 2016, 2015 and 2014
|
|
|
|
|
|
|
Equity Attributable to La Quinta Holdings Inc. Stockholders |
|
|
|
|
|
|
|
|
|
|||||||||||||||||||||
|
|
|
Members’ Equity |
|
|
Common Stock |
|
|
Treasury Stock |
|
|
Additional Paid in Capital |
|
|
Accumulated Deficit |
|
|
Accumulated Other Comprehensive Loss |
|
|
Noncontrolling Interests |
|
|
Total Equity |
|
||||||||||||
|
|
|
|
|
|
|
Shares |
|
|
Amount |
|
|
|
|
|
|
|
|
|
|
|
|
|
|
|
|
|
|
|
|
|
|
|
|
|
||
|
|
|
(in thousands, except share data) |
|
|||||||||||||||||||||||||||||||||
|
Balance as of January 1, 2014 |
|
$ |
319,096 |
|
|
|
— |
|
|
$ |
— |
|
|
$ |
— |
|
|
$ |
— |
|
|
$ |
— |
|
|
$ |
— |
|
|
$ |
(13,843 |
) |
|
$ |
305,253 |
|
|
Net (loss) income |
|
|
(16,214 |
) |
|
|
— |
|
|
|
— |
|
|
|
— |
|
|
|
— |
|
|
|
(321,083 |
) |
|
|
— |
|
|
|
3,890 |
|
|
|
(333,407 |
) |
|
Capital contributions |
|
|
21,516 |
|
|
|
— |
|
|
|
— |
|
|
|
— |
|
|
|
— |
|
|
|
— |
|
|
|
— |
|
|
|
— |
|
|
|
21,516 |
|
|
Distributions |
|
|
(106 |
) |
|
|
— |
|
|
|
— |
|
|
|
— |
|
|
|
— |
|
|
|
— |
|
|
|
— |
|
|
|
(4,451 |
) |
|
|
(4,557 |
) |
|
Issuance of common stock |
|
|
— |
|
|
|
43,987,500 |
|
|
|
440 |
|
|
|
— |
|
|
|
692,781 |
|
|
|
— |
|
|
|
— |
|
|
|
— |
|
|
|
693,221 |
|
|
Equity based compensation |
|
|
— |
|
|
|
4,434,567 |
|
|
|
44 |
|
|
|
— |
|
|
|
57,939 |
|
|
|
— |
|
|
|
— |
|
|
|
— |
|
|
|
57,983 |
|
|
Repurchase of common stock |
|
|
— |
|
|
|
(83,091 |
) |
|
|
(1 |
) |
|
|
(1,532 |
) |
|
|
— |
|
|
|
— |
|
|
|
— |
|
|
|
— |
|
|
|
(1,533 |
) |
|
Acquisitions |
|
|
— |
|
|
|
4,348,284 |
|
|
|
44 |
|
|
|
— |
|
|
|
73,062 |
|
|
|
— |
|
|
|
— |
|
|
|
— |
|
|
|
73,106 |
|
|
Cash flow hedge adjustment |
|
|
— |
|
|
|
— |
|
|
|
— |
|
|
|
— |
|
|
|
— |
|
|
|
— |
|
|
|
(3,127 |
) |
|
|
— |
|
|
|
(3,127 |
) |
|
La Quinta Predecessor Entities reorganization |
|
|
(324,292 |
) |
|
|
78,008,014 |
|
|
|
780 |
|
|
|
— |
|
|
|
306,033 |
|
|
|
— |
|
|
|
— |
|
|
|
17,479 |
|
|
|
— |
|
|
Balance as of December 31, 2014 |
|
$ |
— |
|
|
|
130,695,274 |
|
|
$ |
1,307 |
|
|
$ |
(1,532 |
) |
|
$ |
1,129,815 |
|
|
$ |
(321,083 |
) |
|
$ |
(3,127 |
) |
|
$ |
3,075 |
|
|
$ |
808,455 |
|
|
Net income |
|
|
— |
|
|
|
— |
|
|
|
— |
|
|
|
— |
|
|
|
— |
|
|
|
26,365 |
|
|
|
— |
|
|
|
347 |
|
|
|
26,712 |
|
|
Distributions |
|
|
— |
|
|
|
— |
|
|
|
— |
|
|
|
— |
|
|
|
— |
|
|
|
— |
|
|
|
— |
|
|
|
(522 |
) |
|
|
(522 |
) |
|
Equity based compensation |
|
|
— |
|
|
|
194,818 |
|
|
|
3 |
|
|
|
— |
|
|
|
22,340 |
|
|
|
— |
|
|
|
— |
|
|
|
— |
|
|
|
22,343 |
|
|
Repurchase of common stock |
|
|
— |
|
|
|
(6,587,774 |
) |
|
|
— |
|
|
|
(106,167 |
) |
|
|
— |
|
|
|
— |
|
|
|
— |
|
|
|
— |
|
|
|
(106,167 |
) |
|
Cash flow hedge adjustment |
|
|
— |
|
|
|
— |
|
|
|
— |
|
|
|
— |
|
|
|
— |
|
|
|
— |
|
|
|
(4,309 |
) |
|
|
— |
|
|
|
(4,309 |
) |
|
Balance as of December 31, 2015 |
|
$ |
— |
|
|
|
124,302,318 |
|
|
$ |
1,310 |
|
|
$ |
(107,699 |
) |
|
$ |
1,152,155 |
|
|
$ |
(294,718 |
) |
|
$ |
(7,436 |
) |
|
$ |
2,900 |
|
|
$ |
746,512 |
|
|
Net (loss) income |
|
|
— |
|
|
|
— |
|
|
|
— |
|
|
|
— |
|
|
|
— |
|
|
|
(1,288 |
) |
|
|
— |
|
|
|
185 |
|
|
|
(1,103 |
) |
|
Distributions |
|
|
— |
|
|
|
— |
|
|
|
— |
|
|
|
— |
|
|
|
— |
|
|
|
— |
|
|
|
— |
|
|
|
(316 |
) |
|
|
(316 |
) |
|
Equity based compensation |
|
|
— |
|
|
|
828,869 |
|
|
|
8 |
|
|
|
— |
|
|
|
14,163 |
|
|
|
— |
|
|
|
— |
|
|
|
— |
|
|
|
14,171 |
|
|
Tax deficit related to equity comp (APIC Pool) |
|
|
— |
|
|
|
— |
|
|
|
— |
|
|
|
— |
|
|
|
(667 |
) |
|
|
— |
|
|
|
— |
|
|
|
— |
|
|
|
(667 |
) |
|
Repurchase of common stock |
|
|
— |
|
|
|
(8,340,717 |
) |
|
|
— |
|
|
|
(101,824 |
) |
|
|
— |
|
|
|
— |
|
|
|
— |
|
|
|
— |
|
|
|
(101,824 |
) |
|
Cash flow hedge adjustment |
|
|
— |
|
|
|
— |
|
|
|
— |
|
|
|
— |
|
|
|
— |
|
|
|
— |
|
|
|
1,064 |
|
|
|
— |
|
|
|
1,064 |
|
|
Balance as of December 31, 2016 |
|
$ |
— |
|
|
|
116,790,470 |
|
|
$ |
1,318 |
|
|
$ |
(209,523 |
) |
|
$ |
1,165,651 |
|
|
$ |
(296,006 |
) |
|
$ |
(6,372 |
) |
|
$ |
2,769 |
|
|
$ |
657,837 |
|
The accompanying notes are an integral part of these consolidated financial statements.
79
La Quinta Holdings Inc.
Consolidated Statements of Cash Flows
For the years ended December 31, 2016, 2015 and 2014
|
|
|
2016 |
|
|
2015 |
|
|
2014 |
|
|||
|
|
|
(in thousands) |
|
|||||||||
|
Cash flows from operating activities: |
|
|
|
|
|
|
|
|
|
|
|
|
|
Net (loss) income |
|
$ |
(1,103 |
) |
|
$ |
26,712 |
|
|
$ |
(333,407 |
) |
|
Adjustment to reconcile net (loss) income to net cash provided by operating activities: |
|
|
|
|
|
|
|
|
|
|
|
|
|
Depreciation and amortization |
|
|
146,996 |
|
|
|
166,396 |
|
|
|
165,408 |
|
|
Amortization of other non-current assets |
|
|
91 |
|
|
|
337 |
|
|
|
957 |
|
|
Amortization of intangible assets |
|
|
732 |
|
|
|
937 |
|
|
|
1,075 |
|
|
Loss on extinguishment of debt, net |
|
|
— |
|
|
|
— |
|
|
|
2,030 |
|
|
Interest expense added to long-term debt |
|
|
— |
|
|
|
— |
|
|
|
18,601 |
|
|
Amortization of long-term debt reduction |
|
|
— |
|
|
|
— |
|
|
|
(1,532 |
) |
|
(Gain) loss related to casualty disasters |
|
|
3,051 |
|
|
|
1,824 |
|
|
|
(5,591 |
) |
|
Write off of deferred costs |
|
|
— |
|
|
|
18 |
|
|
|
— |
|
|
Amortization of leasehold interests |
|
|
(647 |
) |
|
|
(691 |
) |
|
|
(596 |
) |
|
Amortization of deferred costs |
|
|
5,708 |
|
|
|
5,559 |
|
|
|
8,173 |
|
|
Impairment loss |
|
|
104,258 |
|
|
|
50,121 |
|
|
|
5,308 |
|
|
(Gain) loss on sale or retirement of assets |
|
|
(4,908 |
) |
|
|
4,533 |
|
|
|
177 |
|
|
Equity based compensation |
|
|
14,171 |
|
|
|
21,603 |
|
|
|
57,983 |
|
|
Excess tax benefits from equity based compensation |
|
|
— |
|
|
|
(740 |
) |
|
|
(132 |
) |
|
Deferred taxes |
|
|
(11,800 |
) |
|
|
16,898 |
|
|
|
22,980 |
|
|
Recognition of net deferred tax liabilities upon C-corporation conversion |
|
|
— |
|
|
|
— |
|
|
|
321,054 |
|
|
Provision for doubtful accounts |
|
|
1,470 |
|
|
|
2,198 |
|
|
|
1,904 |
|
|
Changes in assets and liabilities: |
|
|
|
|
|
|
|
|
|
|
|
|
|
Accounts receivable |
|
|
(10,341 |
) |
|
|
(2,255 |
) |
|
|
(2,853 |
) |
|
Other current assets |
|
|
2,123 |
|
|
|
(484 |
) |
|
|
914 |
|
|
Receivables from affiliates |
|
|
— |
|
|
|
— |
|
|
|
276 |
|
|
Other non-current assets |
|
|
537 |
|
|
|
(1,410 |
) |
|
|
(510 |
) |
|
Accounts payable |
|
|
2,321 |
|
|
|
272 |
|
|
|
(9,494 |
) |
|
Accrued payroll and employee benefits |
|
|
7,549 |
|
|
|
(4,278 |
) |
|
|
8,894 |
|
|
Accrued real estate taxes |
|
|
(305 |
) |
|
|
1,135 |
|
|
|
993 |
|
|
Accrued expenses and other liabilities |
|
|
1,446 |
|
|
|
(8,035 |
) |
|
|
15,693 |
|
|
Other long-term liabilities |
|
|
1,445 |
|
|
|
1,039 |
|
|
|
622 |
|
|
Net cash provided by operating activities |
|
|
262,794 |
|
|
|
281,689 |
|
|
|
278,927 |
|
|
Cash flows from investing activities: |
|
|
|
|
|
|
|
|
|
|
|
|
|
Acquisitions, net of cash acquired |
|
|
— |
|
|
|
— |
|
|
|
(77,667 |
) |
|
Capital expenditures |
|
|
(143,752 |
) |
|
|
(91,970 |
) |
|
|
(71,475 |
) |
|
Decrease in restricted cash |
|
|
— |
|
|
|
— |
|
|
|
103,026 |
|
|
Decrease in investments |
|
|
— |
|
|
|
— |
|
|
|
67 |
|
|
Insurance proceeds on casualty disasters |
|
|
5,301 |
|
|
|
7,033 |
|
|
|
2,120 |
|
|
Proceeds from sale of assets |
|
|
71,136 |
|
|
|
37,576 |
|
|
|
7,053 |
|
|
Payment of franchise incentives |
|
|
(1,938 |
) |
|
|
(30 |
) |
|
|
(400 |
) |
|
Decrease in other non-current assets |
|
|
— |
|
|
|
1,125 |
|
|
|
315 |
|
|
Net cash used in investing activities |
|
|
(69,253 |
) |
|
|
(46,266 |
) |
|
|
(36,961 |
) |
The accompanying notes are an integral part of these consolidated financial statements.
80
La Quinta Holdings Inc.
Consolidated Statements of Cash Flows
For the years ended December 31, 2016, 2015 and 2014
|
|
|
2016 |
|
|
2015 |
|
|
2014 |
|
|||
|
|
|
(in thousands) |
|
|||||||||
|
Cash flows from financing activities: |
|
|
|
|
|
|
|
|
|
|
|
|
|
Proceeds from long-term debt |
|
|
— |
|
|
|
— |
|
|
|
2,100,000 |
|
|
Repayment of long-term debt |
|
|
(17,514 |
) |
|
|
(152,622 |
) |
|
|
(2,941,302 |
) |
|
Payment of deferred costs |
|
|
— |
|
|
|
— |
|
|
|
(27,255 |
) |
|
Payment of original issue discount |
|
|
— |
|
|
|
— |
|
|
|
(10,500 |
) |
|
Proceeds from issuance of common stock, net |
|
|
— |
|
|
|
— |
|
|
|
697,978 |
|
|
Purchase of treasury stock |
|
|
(101,824 |
) |
|
|
(106,167 |
) |
|
|
(1,533 |
) |
|
Excess tax benefits from equity based compensation |
|
|
— |
|
|
|
740 |
|
|
|
132 |
|
|
Distributions to members |
|
|
— |
|
|
|
— |
|
|
|
(106 |
) |
|
Distributions to noncontrolling interests |
|
|
(316 |
) |
|
|
(522 |
) |
|
|
(4,451 |
) |
|
Capital contributions |
|
|
— |
|
|
|
— |
|
|
|
21,516 |
|
|
Net cash used in financing activities |
|
|
(119,654 |
) |
|
|
(258,571 |
) |
|
|
(165,521 |
) |
|
Increase (decrease) in cash and cash equivalents |
|
|
73,887 |
|
|
|
(23,148 |
) |
|
|
76,445 |
|
|
Cash and cash equivalents at the beginning of the year |
|
|
86,709 |
|
|
|
109,857 |
|
|
|
33,412 |
|
|
Cash and cash equivalents at the end of the year |
|
$ |
160,596 |
|
|
$ |
86,709 |
|
|
$ |
109,857 |
|
|
SUPPLEMENTAL CASH FLOW INFORMATION: |
|
|
|
|
|
|
|
|
|
|
|
|
|
Interest paid during the year |
|
$ |
76,634 |
|
|
$ |
83,468 |
|
|
$ |
101,708 |
|
|
Income taxes paid during the year, net of refunds |
|
$ |
9,856 |
|
|
$ |
12,357 |
|
|
$ |
4,156 |
|
|
SUPPLEMENTAL NON-CASH DISCLOSURE: |
|
|
|
|
|
|
|
|
|
|
|
|
|
Capital expenditures included in accounts payable |
|
$ |
5,646 |
|
|
$ |
2,836 |
|
|
$ |
760 |
|
|
Deferred cost included in proceeds from issuance of common stock |
|
$ |
— |
|
|
$ |
— |
|
|
$ |
4,757 |
|
|
Cash flow hedge adjustment, net of tax |
|
$ |
1,064 |
|
|
$ |
(4,309 |
) |
|
$ |
(3,127 |
) |
|
Receivable for capital assets damaged by casualty disasters |
|
$ |
4,127 |
|
|
$ |
4,625 |
|
|
$ |
7,554 |
|
The accompanying notes are an integral part of these consolidated financial statements.
81
La Quinta Holdings Inc.
Notes to Consolidated Financial Statements
For the years ended December 31, 2016, 2015 and 2014
NOTE 1. ORGANIZATION AND BASIS OF PRESENTATION
Organization
Effective April 14, 2014 (the “IPO Effective Date”), La Quinta Holdings Inc. (“Holdings”) completed its initial public offering (“IPO”) in which Holdings issued and sold 44.0 million shares of common stock. Holdings was incorporated in the state of Delaware on December 9, 2013 and, prior to the IPO Effective Date, had no operations. In connection with the IPO, we completed certain transactions including, among others, refinancing our existing debt, acquiring 14 previously managed hotels (the “Previously Managed Hotels”), and contributing the La Quinta Predecessor Entities (as defined below) into Holdings, which resulted in the La Quinta Predecessor Entities becoming owned by a “C” corporation for federal income tax purposes.
Lodge Holdco I L.L.C. (“Holdco I”) and Lodge Holdco II L.L.C. (“Holdco II”), each a Delaware limited liability company, were formed on January 4, 2006. Lodge Holdco III L.L.C. (“Holdco III”), a Delaware limited liability company, was formed March 17, 2006. We refer collectively to Holdco I, Holdco II, and Holdco III as the “La Quinta Predecessor Entities”. Since those dates and prior to the completion of our IPO, the La Quinta Predecessor Entities were owned and controlled by Blackstone Real Estate Partners IV L.P. and affiliates (“BREP IV”) and Blackstone Real Estate Partners V L.P. and affiliates (“BREP V”). BREP IV and BREP V are affiliates of The Blackstone Group L.P. (collectivity, the “Funds” or “Blackstone”).
As it pertains to the period prior to completion of our IPO, the accompanying consolidated financial statements include the accounts of each of the La Quinta Predecessor Entities, and all related wholly and majority owned subsidiaries and a consolidated Variable Interest Entity (“VIE”). For these periods, the La Quinta Predecessor Entities have been presented on a combined historical basis due to their prior common ownership and control. In connection with the IPO, the Funds and other pre-IPO owners contributed their equity interests in the La Quinta Predecessor Entities to Holdings in exchange for an aggregate of 81.06 million shares of common stock of Holdings. Holdings then transferred such equity interests to its wholly-owned subsidiary which pledged these interests as security for borrowings under a new credit agreement. As a result, as it pertains to the period subsequent to completion of our IPO, the accompanying consolidated financial statements also include the accounts of Holdings, the Previously Managed Hotels, and all other wholly and majority owned subsidiaries created in connection with the IPO. The combined or consolidated entity presented may also be referred to herein as “La Quinta”, “we”, “us”, “our”, or the “Company”, as the context requires, when we refer to our historical operations and financial performance.
In November 2014 and April 2015, Blackstone completed two secondary offerings in which it registered and sold 23.0 and 23.9 million shares of Holdings common stock, respectively. As of December 31, 2016 Blackstone owned 30.1% of Holdings’ outstanding common stock.
We own and operate hotels, some of which are subject to a ground lease, located in the United States under the La Quinta brand. We also franchise and, until the acquisition of the Previously Managed Hotels upon completion of our IPO, managed hotels under the La Quinta brand, with franchised hotels currently operating in the United States (“U.S.”), Canada, Mexico, Honduras and Colombia. All new franchised hotels are La Quinta Inn & Suites in the U.S. and Canada and LQ Hotel in Mexico and in Central and South America. As of December 31, 2016, 2015 and 2014, total owned and franchised hotels, and the approximate number of associated rooms were as follows:
|
|
|
2016 |
|
|
2015 |
|
|
2014 |
|
|||||||||||||||
|
|
|
# of hotels |
|
|
# of rooms |
|
|
# of hotels |
|
|
# of rooms |
|
|
# of hotels |
|
|
# of rooms |
|
||||||
|
Owned (1) |
|
|
321 |
|
|
|
41,000 |
|
|
|
340 |
|
|
|
43,400 |
|
|
|
352 |
|
|
|
44,800 |
|
|
Joint Venture |
|
|
1 |
|
|
|
200 |
|
|
|
1 |
|
|
|
200 |
|
|
|
1 |
|
|
|
200 |
|
|
Franchised |
|
|
566 |
|
|
|
46,000 |
|
|
|
545 |
|
|
|
43,900 |
|
|
|
514 |
|
|
|
41,500 |
|
|
Totals |
|
|
888 |
|
|
|
87,200 |
|
|
|
886 |
|
|
|
87,500 |
|
|
|
867 |
|
|
|
86,500 |
|
|
(1) |
As of December 31, 2016 and 2015, owned hotels includes five and 13 hotels, respectively, designated as assets held for sale, which are subject to a definitive purchase agreement. |
Basis of Presentation and Use of Estimates
The accompanying consolidated financial statements have been prepared in accordance with accounting principles generally accepted in the United States of America (“GAAP”). All intercompany transactions have been eliminated. The preparation of financial
82
statements in conformity with GAAP requires management to make estimates and assumptions that affect the amounts reported and, accordingly, ultimate results could differ from those estimates.
Effective April 14, 2014, we acquired 100% of the ownership interests of LQ Management L.L.C. (“LQM”) for $0.8 million in cash. Prior to April 14, 2014, LQM was a VIE, in which the La Quinta Predecessor Entities had a significant variable financial interest, and were the primary beneficiary. LQM received no member or other capital contribution, or equity investment upon formation or thereafter. LQM’s sole purpose is to manage all of our day-to-day operations, as well as to provide, prior to the IPO, day to day management of the Previously Managed Hotels. In return for providing these management services, we and, prior to the IPO, the Previously Managed Hotels pay LQM a management fee and reimburse LQM for costs incurred on our behalf, and, prior to the IPO, on behalf of the Previously Managed Hotels, in accordance with management and service agreements in place prior to the IPO. The La Quinta Predecessor Entities were the primary beneficiary of LQM as the management and service agreements in place provided for the La Quinta Predecessor Entities to reimburse LQM for its expenses in a manner that allowed LQM to realize a reasonable profit. We have not provided financial or other support to LQM during the periods presented that we were not contractually required to provide, and LQM’s agreements with its vendors are structured as non-recourse to our general credit. On April 14, 2014, LQM became a wholly owned subsidiary of Holdings and, as a result, is no longer a VIE.
NOTE 2. SIGNIFICANT ACCOUNTING POLICIES AND RECENTLY ISSUED ACCOUNTING STANDARDS
Revenue Recognition —Revenues primarily consist of room rentals, franchise fees and other hotel revenues. We defer a portion of our revenue from franchisees at the time the franchise agreement is signed and recognize the remainder upon hotel opening.
Room revenues are derived from room rentals at our owned hotels. We recognize room revenue on a daily basis based on an agreed-upon daily rate after the guest has stayed at one of our hotels. Customer incentive discounts, cash rebates, and refunds are recognized as a reduction of room revenues. Occupancy, hotel, and sales taxes collected from customers and remitted to the taxing authorities are excluded from revenues in the accompanying consolidated statements of operations.
Included in franchise and other fee-based revenues are franchise fee revenues, which primarily consist of revenues from franchisees for application and initial fees, royalty, reservations, and training, as well as fees related to our guest loyalty program (“Returns”). We recognize franchise fee revenue on a gross basis because we (1) are the primary obligor in these arrangements, (2) have latitude in establishing rates, (3) perform the services delivered, (4) have some discretion over supplier selection, and (5) determine the specification of services delivered. The different types of franchise fee revenues are described as follows:
|
|
• |
Upon execution of a franchise agreement, a franchisee is required to pay us an initial fee. We recognize the initial fee as revenue when substantial performance of our obligations to the franchisee with respect to the initial fee has been achieved. In most cases, the vast majority of the initial fee is recognized as revenue when each franchise agreement is signed as, after that date, our remaining obligations to the franchisee are limited to (1) pre-opening inspections, for which we defer $2,500, and (2) if mandated by us or agreed to with the franchisee, preopening training and marketing support related to entry into the La Quinta brand, for which we defer $5,000. These amounts represent an estimate of the value provided to the franchisee related to the services provided, and are based on our experience with time, materials, and third-party costs necessary to provide these services. We recognize the remaining deferred initial fee as revenue when the franchised property opens as the remaining service obligations have been fulfilled. |
|
|
• |
For franchise agreements entered into prior to April 1, 2013, we collect a monthly royalty fee from franchisees generally equal to 4.0% of their room revenues until the franchisee has operated as a La Quinta hotel for twenty-four consecutive months. Beginning in the twenty-fifth month of operation, the franchisee monthly royalty fee increases to 4.5%. Pursuant to franchise agreements entered into with new U.S. franchisees on or after April 1, 2013, we collect a royalty fee from franchisees equal to 4.5% of their room revenues until the franchisee has operated as a La Quinta hotel for twenty-four consecutive months. Beginning in the twenty-fifth month of operation, the franchisee monthly royalty fee increases to 5.0%. In each of these cases, the franchisee has the opportunity to earn the additional 0.5% back via rebate by achieving certain defined customer satisfaction results. Pursuant to franchise agreements entered into with franchisees outside of the U.S. on or after April 1, 2013, we generally collect a royalty fee from franchisees equal to 4.5% of their room revenues throughout the term and do not offer a rebate. |
|
|
• |
We receive reservation and technology fees, as well as fees related to Returns, in connection with franchising our La Quinta brand. Such fees are recognized based on a percentage of the franchisee’s eligible hotel room revenues or room count. We also perform certain other services for franchisees such as training and revenue management. Revenue for these services is recognized at the time the services are performed. |
Included in franchise and other fee-based revenues are management fees of approximately $0.7 million for the year ended December 31, 2014, which represent fees earned from the Previously Managed Hotels, prior to their acquisition on April 14, 2014. Management fees from hotels include a base fee, which is generally a percentage of hotel revenues. (See Note 11)
83
Other hotel revenues include revenues generated by the incidental support of hotel operations for owned hotels and other rental income. We record rental income from operating leases associated with leasing space for restaurants, billboards, and cell towers. Rental income is recognized on a straight-line basis over the life of the respective lease agreement.
Brand marketing fund revenues from franchise and managed properties represent fees collected from franchised and managed hotels related to maintaining our Brand Marketing Fund (“BMF”). We maintain the BMF on behalf of all La Quinta branded hotel properties, including our owned hotels, from which national marketing and advertising campaign expenses are paid. Each La Quinta branded hotel is charged a percentage of its room revenue from which the expenses of the fund are covered. The corresponding expenditures of the BMF fees collected from franchised and managed hotels are presented as brand marketing fund expenses from franchised and managed hotels in our consolidated statements of operations, resulting in no net impact to operating income or net loss.
Cash and cash equivalents— We consider all cash on hand, demand deposits with financial institutions, and short-term highly liquid investments with original maturities of three months or less to be cash equivalents. Cash and cash equivalents consist of highly liquid investments that are stated at cost, which approximates fair market value. Certain balances in cash and cash equivalents exceed the Federal Deposit Insurance Corporation limit of $250,000; however, we believe credit risk related to these deposits is minimal.
Restricted cash— On April 14, 2014, our previously restricted cash was released from restriction due to the refinancing of our debt. Prior to April 14, 2014, restricted cash classified as current assets consists of cash restricted under the terms of our previous debt agreements and held in collateral property hotel depositories, escrow accounts primarily for the payment of capital expenditures, taxes, debt service, insurance losses, and ground leases, and a cash deposit for a letter of credit (See Note 7). Restricted cash consists of cash and cash equivalents that are stated at cost, which approximates fair market value. Classification of restricted cash is based on the nature of the restrictions associated with the underlying assets.
Accounts receivable— Accounts receivable primarily consists of receivables due from franchisees, hotel guests, credit card companies and insurance settlements. Accounts receivable are carried at estimated collectable amounts. We periodically evaluate our receivables for collectability based on historical experience, the length of time receivables are past due, and the general economy. We provide an allowance for doubtful accounts, after considering factors that might affect the collection of accounts receivable, including historical losses and the ability of the party to meet its obligations to us. Accounts receivable are written off when determined to be uncollectable.
Property and equipment— Property and equipment are stated at cost less accumulated depreciation computed using a straight-line method over the estimated useful life of each asset. Property and equipment consists of the following, along with associated estimated useful lives:
|
|
|
|
|
Buildings and improvements |
|
5 to 40 years |
|
Hotel equipment, automobiles, furniture, and fixtures |
|
2 to 10 years |
|
Leasehold improvements |
|
shorter of the lease term or the estimated useful life |
We periodically review the useful lives of our long-lived assets based on current assessments of the remaining utility of our assets. Such changes are accounted for prospectively and would either increase or decrease depreciation expense in the accompanying consolidated statements of operations.
We capitalize expenditures that increase the overall value of an asset or extend an asset’s life, typically associated with hotel refurbishment, renovation, and major repairs. Such costs primarily include third party contract labor, professional design and construction costs, including associated materials, and other direct and indirect costs, such as sales and use tax, incurred during the redevelopment and renovation period. The capitalization period begins when the activities related to development have begun and ceases when the project is substantially complete and the assets are held available for use or occupancy. Once a redevelopment project is substantially complete and the associated assets are ready for intended use, costs related to the redevelopment project are no longer capitalized. Additionally, we capitalize costs such as construction administration, cost accounting, design and other various office costs that clearly relate to projects under development or construction (“Indirect Costs”). Total capitalized Indirect Costs for the year ended December 31, 2016, 2015 and 2014 was $4.5 million, $2.7 million and $3.0 million, respectively.
Normal maintenance and repair costs are expensed as incurred. When depreciable property is retired or disposed, the related cost and accumulated depreciation or amortization is removed from the applicable accounts and any gain or loss is reflected in the accompanying combined statements of operations.
Assets held for sale— Long-lived assets are classified as held for sale when all of the following criteria are met:
|
|
• |
Management, having the authority to approve the action, commits to a plan to sell the asset and does not expect significant changes to the plan or that the plan will be withdrawn; |
84
|
|
• |
The asset is available for immediate sale in its present condition; |
|
|
• |
The asset is being actively marketed; |
|
|
• |
The sale of the asset is probable within one year. |
When we identify a long-lived asset as held for sale, depreciation of the asset is discontinued and the carrying value is reduced, if necessary, to the estimated sales price less costs to sell by recording a charge to current earnings. All assets held for sale are monitored through the date of sale for potential adjustments based on offers we are willing to take under serious consideration and continued review of facts and circumstances. Losses on sales are recorded to the extent that the amounts ultimately received for the sale of assets differ from the adjusted book values of the assets. Gains on sales are recognized at the time the assets are sold, provided there is reasonable assurance the sales price will be collected and any future activities to be performed by the Company relating to the assets sold are expected to be insignificant.
Fair value measurements— Fair value is defined as the price that would be received to sell an asset or pay to transfer a liability in the principal or most advantageous market for the asset or liability in an orderly transaction between market participants at the measurement date. In evaluating the fair value of both financial and non-financial assets and liabilities, we use the accounting guidance that establishes a fair value hierarchy, which prioritizes the inputs used in measuring fair value into three broad levels, which are as follows:
|
|
• |
Level 1—Quoted prices in active markets for identical assets or liabilities. |
|
|
• |
Level 2—Observable inputs other than Level 1 prices, such as quoted prices for similar assets or liabilities; quoted prices in markets that are not active; or other inputs that are observable or can be corroborated by observable market data for substantially the full term of the assets or liabilities. Valuations in this category are inherently less reliable than quoted market prices due to the degree of subjectivity involved in determining appropriate methodologies and the applicable underlying observable market assumptions. |
|
|
• |
Level 3—Unobservable inputs that are supported by little or no market activity and that are significant to the fair value of the assets and liabilities. These inputs cannot be validated by readily determinable market data and generally involve considerable judgment by management. |
We use the highest level of observable market data if such data is available without undue cost and effort.
Valuation and impairment of long-lived assets— We review the performance of long-lived assets for impairment when events or changes in circumstances indicate that the carrying amount of an asset may not be recoverable. We also identify properties we intend to sell and properties we intend to hold for use. For each asset or group of assets held for use with indicators of impairment, we compare the sum of the expected future cash flows (undiscounted and without interest charges) generated by the asset or group of assets with its associated net carrying value.
If the net carrying value of the asset or group of assets exceeds expected undiscounted future cash flows, the excess of the net book value over estimated fair value is charged to impairment loss in the accompanying combined statements of operations. Properties held for sale are reported at the lower of their carrying amount or their estimated sales price, less estimated costs to sell.
We estimate fair value primarily using Level 3 inputs by (1) calculating the discounted expected future cash flows, and (2) calculating expected liquidated sales proceeds, relying on common hotel valuation methods such as multiples of room revenues or per room valuations. Our estimate of fair value of the asset using these Level 3 inputs then becomes the new basis of the asset or group of assets and this new basis is then depreciated over the asset’s remaining useful life. We may be subject to impairment charges in the future, in the event that operating results of individual hotel operations are materially different from its forecasts, the economy or the lodging industry weakens, or if the assumed holding period of a hotel is shortened.
Intangible assets— Intangible assets consist of trademarks, franchise agreements and management contracts, Returns membership list, and leasehold interests. Owned trademarks are not amortized but are tested for impairment annually or more frequently if events or changes in circumstances indicate that the asset might be impaired.
Intangible assets with a definite life are amortized on a straight-line basis over their estimated useful lives, which consist of the following:
|
Franchise agreements, management contracts and other |
|
3 to 20 years |
|
Returns membership list |
|
3 years |
|
Leasehold interests—hotels, restaurants, office |
|
2 to 49 years |
85
Derivative instruments —We use derivative instruments as part of our overall strategy to manage our exposure to market risks associated with fluctuations in interest rates. We regularly monitor the financial stability and credit standing of the counterparties to our derivative instruments. We do not enter into derivative financial instruments for trading or speculative purposes.
We record all derivatives at fair value. On the date the derivative contract is entered, we designate the derivative as one of the following: a hedge of a forecasted transaction or the variability of cash flows to be paid (“cash flow hedge”), a hedge of the fair value of a recognized asset or liability (“fair value hedge”), or an undesignated hedge instrument. Changes in the fair value of a derivative that is qualified, designated and highly effective as a cash flow hedge or net investment hedge are recorded in the consolidated statements of comprehensive income (loss) until they are reclassified into earnings in the same period or periods during which the hedged transaction affects earnings. Changes in the fair value of a derivative that is qualified, designated and highly effective as a fair value hedge, along with the gain or loss on the hedged asset or liability that is attributable to the hedged risk, are recorded in current period earnings. Changes in the fair value of undesignated derivative instruments and the ineffective portion of designated derivative instruments are reported in current period earnings. Cash flows from designated derivative financial instruments are classified within the same category as the item being hedged in the consolidated statements of cash flows.
If we determine that we qualify for and will designate a derivative as a hedging instrument at the designation date, we formally document all relationships between hedging activities, including the risk management objective and strategy for undertaking various hedge transactions. This process includes matching all derivatives that are designated as cash flow hedges to specific forecasted transactions, linking all derivatives designated as fair value hedges to specific assets and liabilities in our consolidated balance sheets, and determining the foreign currency exposure of net investment of the foreign operation for a net investment hedge.
On a quarterly basis, we assess the effectiveness of our designated hedges in offsetting the variability in the cash flows or fair values of the hedged assets or obligations via use of a statistical regression approach. Additionally, we measure ineffectiveness using the hypothetical derivative method. This method compares the cumulative change in fair value of each hedging instrument to the cumulative change in fair value of a hypothetical hedging instrument, which has terms that identically match the critical terms of the respective hedged transactions. Thus, the hypothetical hedging instrument is presumed to perfectly offset the hedged cash flows. Ineffectiveness results when the cumulative change in the fair value of the hedging instrument exceeds the cumulative change in the fair value of the hypothetical hedging instrument. We discontinue hedge accounting prospectively when the derivative is not highly effective as a hedge, the underlying hedged transaction is no longer probable, or the hedging instrument expires, is sold, terminated or exercised.
Insurance and self-insurance programs— We purchase insurance to limit the risk of loss associated with our lodging operations and use paid loss retrospective insurance for exposures covered under commercial general liability, automobile liability, and workers’ compensation insurance policies. Predetermined loss deductibles and self-insured retentions and liability limits have been selected to limit the per occurrence cash outlay.
We have a self-insurance program for major medical and hospitalization coverage offered to employees and their dependents that is partially funded by payroll deductions from our employees. Under the self-insurance program, payments for major medical and hospitalization to individual participants which are below specified deductible amounts are paid by us through a third party administrator.
As of December 31, 2016 and 2015, we accrued the following liabilities related to these insurance programs:
|
|
|
2016 |
|
|
2015 |
|
||
|
|
|
(in thousands) |
|
|||||
|
Automobile and general liability insurance |
|
$ |
21,219 |
|
|
$ |
21,769 |
|
|
Workers’ compensation |
|
|
10,575 |
|
|
|
8,360 |
|
|
Health insurance |
|
|
1,350 |
|
|
|
1,242 |
|
|
|
|
$ |
33,144 |
|
|
$ |
31,371 |
|
The liability for automobile and general liability insurance is included in accrued expenses and other liabilities and the liability for workers’ compensation and health insurance is included in accrued payroll and employee benefits in the accompanying combined balance sheets.
Customer loyalty program— We administer Returns, which allows members to earn points based on certain dollars spent. Members may redeem points earned for free night certificates, gift cards, airline miles, and a variety of other awards. We account for the economic impact of points earned by accruing an estimate of its liability for unredeemed points. The expense related to this estimate includes the incremental cost of the stay at one of our hotels or the value of awards purchased from program partners. We estimate the future redemption obligation based upon historical experience, including an estimate of “breakage” for points that will never be redeemed. The estimate is based on a calculation that includes assumptions for the redemption rate, redemption type (whether for a
86
free night certificate or other award), rate of redemption at Company-owned hotels versus franchised hotels and the number of points required per stay. The net expenses of the Returns program are charged to marketing, promotional and other advertising expenses in the accompanying combined statements of operations.
As of December 31, 2016 and 2015, the total liability for Returns points was approximately $17.1 million and $15.6 million, respectively, of which $5.9 million and $5.7 million are included in accrued expenses and other liabilities, representing the estimated points expected to be redeemed in the next year. The remainder is included within other long-term liabilities in the accompanying combined balance sheets.
Actual financial results of the Returns program may vary from our estimate due primarily to variances from assumptions used in the calculation of the obligation for future redemptions and changes in member behavior. These variances are accounted for as changes in estimates and are charged to operations as they become known.
Noncontrolling interests— Noncontrolling interests are recognized within total equity in our consolidated balance sheets, reflected in net loss attributable to noncontrolling interests in our consolidated statements of operations, and included in our consolidated statements of equity.
We hold a 60% controlling equity interest in a joint venture. The joint venture owns and operates one hotel in New Orleans, Louisiana. The noncontrolling interest, totaling 40%, represents the external partner’s interest in the joint venture of approximately $2.8 million and $2.9 million as of December 31, 2016 and 2015, respectively. Total distributions to the noncontrolling interest holder were approximately $0.3 million, $0.5 million and $0.6 million for the years ended December 31, 2016, 2015 and 2014, respectively.
As described in Note 1, effective April 14, 2014 we acquired LQM. Prior to the acquisition date, we consolidated LQM, and LQM’s results of operations and net equity or deficit were presented as a noncontrolling interest.
Direct lodging expenses— Direct lodging expenses primarily consist of direct labor costs, repairs and maintenance, utilities, and other advertising costs to operate our owned hotels.
Other lodging and operating expenses— Other lodging and operating expenses consist of indirect costs to operate our owned hotels such as property taxes and insurance.
General and administrative expenses— General and administrative expenses consist of items such as corporate operating expenses including operations, information technology, accounting, legal, human resources, and equity based compensation.
Marketing, promotional and other advertising expenses— Marketing, promotional, and other advertising expenses consist of BMF expenses not paid for with funds received from franchised or managed hotels, expenses related to other customer loyalty programs such as Returns, and other advertising expenses.
Advertising costs— We incur advertising costs associated with general promotion of the La Quinta brand and specific advertising and marketing support for our operation and for the operations of our franchisees. We expense the production cost of advertising the first time the advertising is publicly displayed.
For the years ended December 31, 2016, 2015 and 2014, we incurred advertising and promotional expenses included within the following in the accompanying combined statements of operations:
|
|
|
2016 |
|
|
2015 |
|
|
2014 |
|
|||
|
|
|
(in thousands) |
|
|||||||||
|
Direct lodging expenses |
|
|
5,427 |
|
|
|
5,615 |
|
|
|
5,802 |
|
|
General and administrative expenses |
|
|
1,649 |
|
|
|
1,249 |
|
|
|
1,572 |
|
|
Marketing, promotional and other advertising expenses |
|
|
58,397 |
|
|
|
61,209 |
|
|
|
52,195 |
|
|
Total |
|
$ |
65,473 |
|
|
$ |
68,073 |
|
|
$ |
59,569 |
|
Long-term debt amendments— We may elect to amend, extend, repay, or otherwise modify the terms of our long-term debt arrangements. When such a transaction occurs, we determine the appropriate accounting treatment primarily by first determining whether we have been fully relieved of our obligation by the creditor. If so, we recognize an extinguishment of debt and calculate a gain or loss which is reflected as gain or loss on extinguishment of debt in the accompanying combined statements of operations. If we are not fully relieved of our obligation by the creditor, we consider whether the amended debt agreement has substantially different terms, generally defined as a change in cash flows, on a present value basis, of 10 percent or greater. If the terms are not substantially different, we account for the change as a modification. If the terms are substantially different, we account for the change as an
87
extinguishment of the old debt and the issuance of a new debt instrument. The determination of modification or extinguishment status then governs the expense versus deferral treatment of third party costs paid related to the modification.
Equity Based Compensation —We recognize the cost of services received in an equity based payment transaction with an employee as services are received and record either a corresponding increase in equity or a liability, depending on whether the instruments granted satisfy the equity or liability classification criteria.
The measurement objective for equity awards is the estimated fair value at the grant date of the equity instruments that we are obligated to issue when employees have rendered the requisite service and satisfied any other conditions necessary to earn the right to benefit from the instruments. The compensation cost for an award classified as an equity instrument is recognized ratably over the requisite service period, including an estimate of forfeitures. The requisite service period is the period during which an employee is required to provide service in exchange for an award.
Compensation cost for awards with performance conditions is recognized over the requisite service period if it is probable that the performance condition will be satisfied. If such performance conditions are not considered probable until they occur, no compensation expense for these awards is recognized.
Income Taxes —The accompanying consolidated financial statements include taxable entities, limited liability companies, and, through April 14, 2014, REIT entities. Limited liability companies and REITs generally are not subject to federal income taxes at the entity level. For our taxable subsidiaries, we account for income taxes using the asset and liability approach for financial accounting and reporting purposes.
For financial reporting purposes, income tax expense or benefit is based on reported financial accounting income or loss before income taxes.
Deferred tax assets and liabilities reflect the temporary differences between assets and liabilities recognized for financial reporting and the analogous amounts recognized for tax purposes using the statutory tax rates expected to be in effect for the year in which the differences are expected to reverse, within the taxable subsidiaries.
Prior to the IPO, certain of our subsidiaries had elected to be treated as REITs for federal income tax purposes under the Internal Revenue Code of 1986, as amended (the “Internal Revenue Code”). To qualify as REITs, these subsidiaries had to meet all of the required organizational and operational requirements, including a requirement that the REIT distribute at least 90% of its regular taxable income to its shareholders as dividends eligible for the dividends paid deduction. Prior to the IPO, the REIT subsidiaries adhered to these requirements. If the REIT subsidiaries failed to qualify as REITs in any taxable year, they would be subject to federal income taxes at regular corporate rates (including any applicable alternative minimum tax) and might not qualify as REITs for the four subsequent taxable years. For this reason, one of our REITs formed taxable subsidiaries to hold certain assets that could have otherwise adversely affected its REIT status. These taxable subsidiaries are or were subject to federal and state income taxes.
On April 14, 2014, the La Quinta Predecessor Entities were contributed to Holdings, a “C” corporation, the shares of capital stock held by third-party shareholders of our REIT entities were redeemed for cash totaling approximately $3.9 million, and our REITs were converted into limited liability companies. As a result of these transactions, we have become subject to additional entity-level taxes and, as of April 14, 2014, we recorded a one-time net deferred tax expense of $321.1 million, which reflects the establishment of the associated net deferred tax liability.
We evaluate the probability of realizing the future benefits of deferred tax assets and provide a valuation allowance for the portion of any deferred tax assets where the likelihood of realizing an income tax benefit in the future does not meet the more-likely-than-not criteria for recognition.
We recognize the financial statement benefit of a tax position only after determining that the relevant tax authority would more likely than not sustain the position following an audit. For tax positions meeting the more-likely-than-not threshold, the amount recognized in the financial statements is the largest benefit that has a greater than 50 percent likelihood of being realized upon ultimate settlement with the relevant tax authority. We accrue interest and, if applicable, penalties for any uncertain tax positions. Our policy is to classify interest and penalties as a component of income tax expense. The Company has open tax years dating back to 2010.
The State of Texas imposes a margin tax of 0.75%, based on the prior year’s Texas-sourced gross receipts. This tax is treated as an income tax and accrued in the accounting period in which the taxable gross receipts are recognized.
We are required by certain foreign jurisdictions to have franchisees withhold, for income tax purposes, a percentage of revenues related to royalties and certain other revenues. For the years ended December 31, 2013 and 2012, the withholding rate was up to 30%. For the period from January 1, 2014 to April 13, 2014, the withholding rates were up to 35%. For the period from April 14, 2014 to
88
December 31, 2016, the withholding rate was between 10% and 33% depending upon the country, after the application of certain tax treaties between the U.S. and certain countries. These taxes are treated as an income tax and expensed in the period in which the taxable gross receipts are recognized.
Comprehensive income— Comprehensive income is defined as the change in equity of a business enterprise during a period from transactions and other events and circumstances from non-owner sources and includes all changes in equity during a period, except those resulting from investments by owners and distributions to owners.
Concentrations of credit risk and business risk — Financial instruments, which potentially subject us to concentrations of credit risk, consist principally of cash and cash equivalents, and restricted cash. We utilize financial institutions that we consider to be of high credit quality and consider the risk of default to be minimal. We also monitor the credit-worthiness of our customers and financial institutions before extending credit or making investments.
Lodging operations are particularly sensitive to adverse economic and competitive conditions and trends, which could adversely affect the Company’s business, financial condition, and results of operations.
Geographic concentrations, which potentially subject us to concentrations of business risk, relate primarily to locations of hotels and the revenue recognized in various states within the United States. We have a concentration of hotels operating in Texas, Florida and California.
The percentages of our total revenues, including revenue from discontinued operations, from these states for the years ended December 31, 2016, 2015 and 2014 are as follows:
|
|
|
2016 |
|
|
2015 |
|
|
2014 |
|
|||
|
Texas |
|
|
21 |
% |
|
|
22 |
% |
|
|
23 |
% |
|
Florida |
|
|
16 |
% |
|
|
17 |
% |
|
|
16 |
% |
|
California |
|
|
10 |
% |
|
|
9 |
% |
|
|
9 |
% |
|
Total |
|
|
47 |
% |
|
|
48 |
% |
|
|
48 |
% |
Newly Issued Accounting Standards
In November 2016, the Financial Accounting Standards Board (“FASB”) issued Accounting Standards Update (“ASU”) No. 2016‑18, “Statement of Cash Flows (Topic 230): Restricted Cash” (“ASU 2016-18”). ASU 2016-18 is intended to address diversity in practice that exists in the classification and presentation of changes in restricted cash on the statement of cash flows. The amendments require that a statement of cash flows explain the change during the period in the total of cash, cash equivalents, and amounts generally described as restricted cash or restricted cash equivalents. The amendments are effective for public business entities for fiscal years beginning after December 15, 2017, and interim periods within those fiscal years. Early adoption is permitted. We are currently evaluating the impact of this guidance on our consolidated financial position, results of operations and related disclosures.
In October 2016, the FASB issued ASU 2016-17, Consolidation (Topic 810): Interests held through Related Parties that are under Common Control, which alters how a decision maker needs to consider indirect interests in a variable interest entity held through an entity under common control and simplifies that analysis to require consideration of only an entity’s proportionate indirect interest in a VIE held through a common control party. ASU 2016-17 amends ASU 2015-02, Consolidations (Topic 810): Amendments to the Consolidation Analysis, which was not effective for the Company in the current fiscal year. ASU 2016-17 will be effective for fiscal years, and interim periods within those fiscal years, beginning after December 15, 2016, with early adoption permitted. We are currently evaluating the impact of this guidance on our consolidated financial position, results of operations and related disclosures.
In October 2016, the FASB issued ASU 2016-16, Income Taxes (Topic 740): Intra-Entity Transfers of Assets Other Than Inventory. The new guidance requires that entities recognize the income tax consequences of an intra-entity transfer of an asset other than inventory when the transfer occurs. The guidance is effective for annual reporting periods beginning after December 15, 2017, including interim reporting periods within those annual reporting periods. Early adoption is permitted but should be in the first interim period. The new guidance should also be applied on a modified retrospective basis through a cumulative-effect adjustment to retained earnings as of the beginning of the period of adoption. We are currently evaluating the impact of this guidance on our consolidated financial position, results of operations and related disclosures.
In August 2016, the FASB issued ASU No. 2016-15, Statement of Cash Flows (Topic 230): Classification of Certain Cash Receipts and Cash Payments: A Consensus of the FASB Emerging Issues Task Force. The amendments provide guidance on eight specific cash flow classification issues: debt prepayment or debt extinguishment costs, settlement of zero-coupon debt instruments or other debt instruments with coupon interest rates that are insignificant in relation to the effective interest rate of the borrowing, contingent
89
consideration payments made after a business combination, proceeds from the settlement of insurance claims, proceeds from the settlement of corporate and bank-owned life insurance policies, distributions received from equity method investees, beneficial interests in securitization transactions and separately identifiable cash flows and application of the predominance principle. The amendments in this update are effective for public business entities for fiscal years beginning after December 15, 2017 and interim periods within those fiscal years. Early adoption is permitted. If an entity early adopts the amendments in an interim period, any adjustments should be reflected as of the beginning of the fiscal year that includes that interim period. An entity that elects early adoption must adopt all of the amendments in the same period. We are currently evaluating the impact of this guidance on our condensed consolidated financial statements.
In June 2016, the FASB issued ASU No. 2016-13, Financial Instruments - Credit Losses (Topic 326): Measurement of Credit Losses on Financial Instruments, which changes the methodology for measuring credit losses on financial instruments and the timing of when such losses are recorded. The guidance is effective for fiscal years, and interim periods within those years, beginning after December 15, 2019. Early adoption is permitted for fiscal years, and interim periods within those years, beginning after December 15, 2018. We are currently evaluating the impact of this guidance on our consolidated financial position, results of operations and related disclosures.
In March 2016, the FASB issued ASU No. 2016-09, Compensation - Stock Compensation (Topic 718): Improvements to Employee Share-Based Payment Accounting, which is intended to simplify several aspects of the accounting for share-based payment transactions, including the income tax consequences, classification of awards as either equity or liabilities, and classification on the statement of cash flows. The guidance is effective for the interim and annual periods beginning after December 15, 2016. Early application is permitted. We are currently evaluating the impact of this guidance on our consolidated financial position, results of operations and related disclosures.
In February 2016, the FASB issued ASU 2016-02, Leases (Topic 842), which requires lessees to recognize on the balance sheet a right-of-use asset, representing its right to use the underlying asset for the lease term, and a lease liability for all leases with terms greater than 12 months. The guidance also requires qualitative and quantitative disclosures designed to assess the amount, timing, and uncertainty of cash flows arising from leases. The standard requires the use of a modified retrospective transition approach, which includes a number of optional practical expedients that entities may elect to apply. The guidance is effective for the interim and annual periods beginning after December 15, 2018. Early application is permitted. We are currently evaluating the impact of this guidance on our consolidated financial position, results of operations and related disclosures.
In May 2014, the FASB issued ASU No. 2014-09. The new guidance on revenue from contracts with customers will supersede most current revenue recognition guidance, including industry-specific guidance. The guidance is effective for the interim and annual periods beginning on or after December 15, 2017; early adoption is permitted for annual reporting periods beginning after December 15, 2016. The underlying principle is that an entity will recognize revenue to depict the transfer of goods or services to customers at an amount that the entity expects to be entitled to in exchange for those goods or services. The Company has formed a project team to evaluate and implement the standard and currently believes the most significant areas of impact of this ASU will be i) the deferral of initial fees paid by franchisees over their estimated average contract life; and ii) the deferral of costs to acquire a customer. We are continuing our assessment, which may identify other impacts of the adoption of ASU 2014-09.
The guidance also requires enhanced disclosures regarding the nature, amount, timing and uncertainty of revenue and cash flows arising from an entity’s contracts with customers. The guidance permits the use of either a retrospective or cumulative effect transition method. The Company currently anticipates utilizing the full retrospective method of adoption allowed by the standard, in order to provide for comparative results in all periods presented, and plans to adopt the standard as of January 1, 2018.
Newly Adopted Accounting Standards
In August 2014, the FASB issued ASU No. 2014-15, Presentation of Financial Statements - Going Concern (Subtopic 205-40) - Disclosure of Uncertainties about an Entity’s Ability to Continue as a Going Concern, which requires management to evaluate, at each annual and interim reporting period, whether there are conditions or events that raise substantial doubt about the entity's ability to continue as a going concern within one year after the date the financial statements are issued and provide related disclosures. ASU 2014-15 is effective for annual periods ending after December 15, 2016 and interim periods thereafter. We adopted this standard on January 1, 2016. This adoption did not have a material effect on the Company’s results of operations, cash flows or financial position.
In April 2015, the FASB issued ASU No. 2015-05, Intangibles - Goodwill and Other - Internal-Use Software (Subtopic 350-40): Customer's Accounting for Fees Paid in a Cloud Computing Arrangement. The amendments in this update provide guidance to customers about whether a cloud computing arrangement includes a software license. If a cloud computing arrangement includes a software license, the update specifies that the customer should account for the software license element of the arrangement consistent with the acquisition of other software licenses. The update further specifies that the customer should account for a cloud computing arrangement as a service contract if the arrangement does not include a software license. ASU No. 2015-05 is effective for the Company for interim and annual periods beginning after December 15, 2015. We adopted this update as of January 1, 2016 on a
90
retrospective basis. For the years ended December 31, 2015 and 2014, we reclassified $8.3 million and $7.3 million, respectively, of expense from depreciation and amortization to general and administrative expenses in the consolidated statement of operations. A corresponding reclassification was made in our consolidated statement of cash flows between depreciation and amortization and change in other current assets. Additionally, cash payments in the amount of $8.8 million and $7.2 million for software service agreements associated with cloud computing arrangements, which were classified as capital expenditures for the years ended December 31, 2015 and 2014, respectively, have been reclassified as a change in other current assets in our consolidated statement of cash flows.
From time to time, new accounting standards are issued by FASB or other standards setting bodies, which we adopt as of the specified effective date. Unless otherwise discussed, we believe the impact of recently issued standards that are not yet effective will not have a material impact on our consolidated financial statements upon adoption.
NOTE 3. ASSETS HELD FOR SALE AND DISCONTINUED OPERATIONS
Assets Held for Sale
During the third quarter of 2015, 24 of our hotels and one additional restaurant parcel were classified as assets held for sale. The sale of these assets does not represent a major strategic shift and does not qualify for discontinued operations reporting. During the fourth quarter of 2015, 11 of the hotels were sold for $34.1 million, net of transaction costs. During 2016, the remaining 13 of these hotels were sold for $34.4 million, net of transaction costs.
During 2016, six additional hotels were sold for $33.9 million, net of transaction costs, resulting in a net gain on sale of $4.9 million. Additionally, five hotels were classified as assets held for sale during 2016. During the first quarter of 2017, three hotels were sold for $22.0 million, net of transaction costs. The remaining two hotels are expected to close during the second quarter of 2017.
As of December 31, 2016 and 2015, the carrying amounts of the major classes of assets for the assets held for sale were as follows:
|
|
|
December 31, 2016 |
|
|
December 31, 2015 |
|
||
|
|
|
(in thousands) |
|
|||||
|
Current assets |
|
$ |
64 |
|
|
$ |
221 |
|
|
Property and equipment, net |
|
|
29,383 |
|
|
|
34,982 |
|
|
Other non-current assets |
|
|
97 |
|
|
|
320 |
|
|
Total assets held for sale |
|
$ |
29,544 |
|
|
$ |
35,523 |
|
Discontinued Operations
During the second quarter of 2013, 44 of our hotels were classified as assets held for sale, and the results of their operations, in accordance with accounting rules in place at that time, have been presented within discontinued operations for all affected periods presented in the accompanying condensed consolidated statements of operations.
During the third and fourth quarters of 2013, 40 of these hotels were sold. On February 6, 2014, the four remaining hotels were sold. In accordance with the terms of our loan agreements existing at the time of such sales, all proceeds associated with the sale of these hotels were used to make principal payments on our long-term debt.
The following table summarizes the results of the discontinued operations:
|
|
|
For the year ended December 31, |
|
|
|
|
|
2014 |
|
|
|
|
|
(in thousands) |
|
|
|
Hotel revenues |
|
$ |
361 |
|
|
Direct lodging expenses |
|
|
651 |
|
|
Other lodging and operating expenses |
|
|
62 |
|
|
Operating loss |
|
|
(352 |
) |
|
Impairment charge |
|
|
(151 |
) |
|
Loss on discontinued operations |
|
$ |
(503 |
) |
91
NOTE 4. ACQUISITIONS
In connection with the acquisitions described below, we recorded the assets acquired and liabilities assumed at fair value as of the acquisition date. Furthermore, acquisition-related costs, such as due diligence, legal and accounting fees, were expensed in the period incurred and were not capitalized or applied in determining the fair value of the acquired assets.
Acquisition of the Previously Managed Hotels and LQ Management L.L.C.
On April 14, 2014, we acquired BRE/Prime Mezz L.L.C. and BRE/Wellesley Properties L.L.C., which owned the Previously Managed Hotels, for a total purchase price of $161.7 million. Total net consideration paid was $150.8 million, which equals the total purchase price of $161.7 million less $10.9 million owed by the parent of BRE/Prime Mezz L.L.C. and BRE/Wellesley Properties L.L.C. to the La Quinta Predecessor Entities. The total net consideration was paid in the form of $76.9 million of cash and $73.9 million of equity in the form of common stock of Holdings. Of the total $161.7 million purchase price, significant assets acquired consist of $166.5 million of property and equipment and $1.4 million in intangible assets for favorable leasehold interests. Other significant long term liabilities acquired include unfavorable leasehold interests of $5.3 million. Additionally on April 14, 2014, we acquired 100% of the ownership interests of LQM for $0.8 million in cash.
The following unaudited pro forma results of operations reflect our results as if the acquisition of the Previously Managed Hotels had occurred on January 1, 2013. In our opinion, all significant adjustments necessary to reflect the effects of the acquisitions have been made (in thousands, except per share data):
|
|
For the year ended December 31, 2014 |
||||
|
Total revenues |
|
$ |
988,858 |
|
|
|
Net loss attributable to La Quinta Holdings’ stockholders |
|
|
(333,698 |
) |
|
|
Basic and diluted loss per share |
|
|
(2.65 |
) |
|
NOTE 5. INTANGIBLE ASSETS
Intangible assets consist of both finite-lived and indefinite-lived assets. The following is a summary of our intangible assets as of December 31, 2016 and 2015:
|
|
|
2016 |
|
|
2015 |
|
||||||||||
|
|
|
Weighted average remaining life |
|
|
Amount |
|
|
Weighted average remaining life |
|
|
Amount |
|
||||
|
|
|
|
|
|
|
(in thousands) |
|
|
|
|
|
|
(in thousands) |
|
||
|
Finite-lived assets: |
|
|
|
|
|
|
|
|
|
|
|
|
|
|
|
|
|
Favorable leasehold interests—hotels, restaurants, offices |
|
26 years |
|
|
$ |
9,680 |
|
|
27 years |
|
|
$ |
9,680 |
|
||
|
Franchise agreements, management contracts and other |
|
4 years |
|
|
|
18,015 |
|
|
5 years |
|
|
|
18,015 |
|
||
|
Returns membership list |
|
|
— |
|
(1) |
|
3,200 |
|
|
|
— |
|
(1) |
|
3,200 |
|
|
Accumulated amortization |
|
|
|
|
|
|
(23,327 |
) |
|
|
|
|
|
|
(22,234 |
) |
|
Total finite–lived assets |
|
|
|
|
|
|
7,568 |
|
|
|
|
|
|
|
8,661 |
|
|
Indefinite-lived assets: |
|
|
|
|
|
|
|
|
|
|
|
|
|
|
|
|
|
Trademarks—La Quinta |
|
|
|
|
|
|
169,434 |
|
|
|
|
|
|
|
169,434 |
|
|
Total |
|
|
|
|
|
$ |
177,002 |
|
|
|
|
|
|
$ |
178,095 |
|
|
|
(1) |
As of December 31, 2016 and 2015, the Returns membership list has been fully amortized. |
|
|
|
For the years ended December 31, |
|
|||||||||
|
|
|
2016 |
|
|
2015 |
|
|
2014 |
|
|||
|
|
|
(in thousands) |
|
|||||||||
|
Amortization expense related to intangible assets: |
|
|
|
|
|
|
|
|
|
|
|
|
|
Depreciation and amortization expense |
|
$ |
732 |
|
|
$ |
937 |
|
|
$ |
1,075 |
|
|
Direct lodging operations |
|
|
361 |
|
|
|
374 |
|
|
|
365 |
|
|
Total amortization expense |
|
$ |
1,093 |
|
|
$ |
1,311 |
|
|
$ |
1,440 |
|
92
As of December 31, 2016, estimated amortization expense related to intangible assets for the years ending December 31 is as follows (in thousands):
|
2017 |
|
$ |
1,019 |
|
|
2018 |
|
|
908 |
|
|
2019 |
|
|
897 |
|
|
2020 |
|
|
797 |
|
|
2021 |
|
|
353 |
|
|
Thereafter |
|
|
3,594 |
|
|
|
|
$ |
7,568 |
|
The accumulated amortization and related amortization expense described above do not include the impact of unfavorable leasehold interests which are reflected within other non-current liabilities in the accompanying combined balance sheets. For the years ended December 31, 2016, 2015 and 2014, approximately $1.0 million, $1.1 million and $1.0 million of amortization expense, related to unfavorable leasehold interests, was reported as a reduction of depreciation and amortization expenses in the accompanying combined statements of operations.
NOTE 6. PROPERTY AND EQUIPMENT
The following is a summary of property and equipment as of December 31, 2016 and 2015:
|
|
|
2016 |
|
|
2015 |
|
||
|
|
|
(in thousands) |
|
|||||
|
Land |
|
$ |
740,996 |
|
|
$ |
796,790 |
|
|
Buildings and improvements |
|
|
2,621,924 |
|
|
|
2,703,293 |
|
|
Furniture, fixtures, equipment and other |
|
|
429,307 |
|
|
|
408,190 |
|
|
Total property and equipment |
|
|
3,792,227 |
|
|
|
3,908,273 |
|
|
Less accumulated depreciation |
|
|
(1,397,514 |
) |
|
|
(1,288,281 |
) |
|
Property and equipment, net |
|
|
2,394,713 |
|
|
|
2,619,992 |
|
|
Construction in progress |
|
|
62,067 |
|
|
|
3,480 |
|
|
Total property and equipment, net of accumulated depreciation |
|
$ |
2,456,780 |
|
|
$ |
2,623,472 |
|
Depreciation and amortization expense related to property and equipment was $147.0 million, $166.4 million and $165.4 million for the years ended December 31, 2016, 2015 and 2014 respectively. Construction in progress includes capitalized costs for ongoing projects that have not yet been put into service.
NOTE 7. LONG-TERM DEBT
Long-term debt as of December 31, 2016 and 2015 was as follows:
|
|
|
2016 |
|
|
2015 |
|
||
|
|
|
(in thousands) |
|
|||||
|
Current portion of term facility |
|
$ |
17,514 |
|
|
$ |
17,514 |
|
|
Long-term portion of term facility |
|
|
1,682,436 |
|
|
|
1,694,585 |
|
|
Total long term debt (1) |
|
$ |
1,699,950 |
|
|
$ |
1,712,099 |
|
|
(1) |
As of December 31, 2016 and 2015, the 30 day United States dollar London Interbank Offering Rate (“LIBOR”) was 0.72% and 0.36%, respectively. As of December 31, 2016, the interest rate, maturity date and principal payments on the Term Facility were as follows: |
|
|
• |
During year ended December 31, 2016, we made quarterly scheduled principal payments totaling $17.5 million. During the year ended December 31, 2015, we made voluntary principal prepayments totaling $135.0 million and quarterly scheduled principal payments totaling $17.7 million. |
|
|
• |
The interest rate for the Term Facility through July 31, 2015 was LIBOR with a floor of 1.0% plus a spread of 3.0%. As of July 31, 2015, we achieved a consolidated first lien net leverage ratio of less than 4.50 to 1.00, and as a result the rate decreased to LIBOR with a floor of 1.0% plus a spread of 2.75% for the period from August 1, 2015 to December 31, 2016. Included in the Term Facility as of December 31, 2016 and 2015 is an unamortized original issue discount of $6.7 |
93
|
|
million and $8.2 million, respectively. As of December 31, 2016 and 2015, we had $16.2 million and $16.5 million, respectively, in accrued interest included within accrued expenses and other liabilities in the accompanying consolidated balance sheets. |
Term Facility
On April 14, 2014, Holdings’ wholly owned subsidiary, La Quinta Intermediate Holdings L.L.C. (the “Borrower”), entered into a new credit agreement (the “Agreement”) with JPMorgan Chase Bank, N.A. (“JPM”), as administrative agent, collateral agent, swingline lender and L/C issuer, J.P. Morgan Securities LLC, Morgan Stanley Senior Funding, Inc., Merrill Lynch, Pierce, Fenner & Smith Incorporated, Citigroup Global Markets Inc., Credit Suisse Securities (USA) LLC, Deutsche Bank Securities Inc., Goldman Sachs Bank USA, and Wells Fargo Securities, LLC, as joint lead arrangers and joint book runners, and the other agents and lenders from time to time party thereto.
The credit agreement provides for senior secured credit facilities (collectively the “Senior Facilities”) consisting of:
|
|
• |
$2.1 billion senior secured term loan facility (the “Term Facility”), which will mature in 2021; and |
|
|
• |
$250 million senior secured revolving credit facility (the “Revolving Facility”), $50 million of which is available in the form of letters of credit, which will mature in 2019. |
The Revolving Facility includes borrowing capacity available for letters of credit and for short-term borrowings referred to as the swing line borrowings. In addition, the Senior Facilities also provide the Borrower with the option to (1) raise incremental credit facilities including an uncommitted incremental facility that provides the Borrower the option to increase the amounts available under the Term Facility and/or the Revolving Facility by an aggregate of up to $350 million, subject to additional increases upon achievement of a consolidated first lien net leverage ratio of less than or equal to 6.00 to 1.00 (or, after the first anniversary of the closing date, 5.75 to 1.00), (2) refinance the loans with debt incurred outside the Senior Facilities, and (3) extend the maturity date of the Revolving Credit Facility and Term Facility, subject to certain limitations.
The proceeds of the Term Facility, together with the net cash proceeds of the IPO and other cash on hand, were used to repay the Holdco I Mortgage Loan and Mezzanine Loans (collectively the “ Holdco I Loans”) and the Holdco III Mortgage Loan, and to acquire the Previously Managed Hotels. Upon completion of the refinancing, we recognized a $2.0 million loss on extinguishment of debt in our consolidated statements of operations. We also incurred $28.7 million of debt issuance costs for the Senior Facilities, which is being amortized over the terms of the underlying debt agreement. As of December 31, 2016 and 2015, the net balance of these debt issuance costs included in our consolidated balance sheet was $18.5 million and $22.4 million, respectively.
Interest Rate and Fees —Borrowings under the Term Facility bear interest, at the Borrower’s option, at a rate equal to a margin over either (a) a base rate determined by reference to the highest of (1) the JPM prime lending rate, (2) the Federal Funds Effective Rate plus 1/2 of 1.00% and (3) the adjusted LIBOR rate for a one-month interest period plus 1.00% or (b) a LIBOR rate determined by reference to the Reuters LIBOR rate for the interest period relevant to such borrowing. The margin for the Term Facility is 2.00%, in the case of base rate loans, and 3.00%, in the case of LIBOR rate loans, subject to one step-down of 0.25% upon the achievement of a consolidated first lien net leverage ratio (as defined in the Agreement) of less than or equal to 4.50 to 1.00, subject to a base rate floor of 2.00% and a LIBOR floor of 1.00%. As of July 31, 2015, we achieved a consolidated first lien net leverage ratio of less than 4.50 to 1.00, and, as a result we realized the step-down of 0.25% after that date.
Borrowings under the Revolving Facility bear interest, at the Borrower’s option, at a rate equal to a margin over either (a) a base rate determined by reference to the highest of (1) the JPM prime lending rate, (2) the Federal Funds Effective Rate plus 1/2 of 1.00% and (3) the adjusted LIBOR rate for a one-month interest period plus 1.00% or (b) a LIBOR rate determined by reference to the Reuters LIBOR rate for the interest period relevant to such borrowing. The margin for the Revolving Facility is 1.50%, in the case of base rate loans, and 2.50%, in the case of LIBOR rate loans, subject to three step-downs of 0.25% each upon the achievement of a consolidated first lien net leverage ratio of less than or equal to 5.00 to 1.00, 4.50 to 1.00 and 4.00 to 1.00, respectively. As of March 2, 2015, we achieved a consolidated first lien net leverage ratio of less than 5.00 to 1.00, and after March 2, 2015 we realized the first step-down in margin of 0.25%. As of July 31, 2015, we achieved a consolidated first lien net leverage ratio of less than 4.50 to 1.00, and, as a result we realized the second step-down of 0.25% after that date.
In addition, the Borrower is required to pay a commitment fee to the lenders under the Revolving Facility in respect of the unutilized commitments thereunder. The commitment fee rate is 0.50% per annum subject to a step-down to 0.375%, upon achievement of a consolidated first lien net leverage ratio less than or equal to 5.00 to 1.00. As of March 2, 2015, we achieved a consolidated first lien net leverage ratio of less than 5.00 to 1.00, and after March 2, 2015, the commitment fee rate is 0.375%. The Borrower is also required to pay customary letter of credit fees.
94
The Borrower incurred a ticking fee of approximately $1.8 million for the period between the date the allocations were notified to the lenders, February 21, 2014, and the closing date of the Senior Facilities of April 14, 2014.
Prepayments —The Term Facility requires mandatory prepayments, subject to certain exceptions, with:
|
|
• |
50% (which percentage will be reduced to 25% and 0%, as applicable, subject to achievement of a consolidated first lien net leverage ratio of less than or equal to 5.25 to 1.00 and 4.00 to 1.00, respectively) of annual excess cash flow, calculated in accordance with the Agreement; |
|
|
• |
100% of the net cash proceeds (including insurance and condemnation proceeds) of all non-ordinary course asset sales or other dispositions of property by the Borrower and its restricted subsidiaries subject to de minimus thresholds, if those net cash proceeds are not reinvested in assets to be used in the Borrower’s business or to make certain other permitted investments (a) within 12 months of the receipt of such net cash proceeds or (b) if the borrower commits to reinvest such net cash proceeds within 12 months of the receipt thereof, within 180 days of the date of such commitment; and |
|
|
• |
100% of the net proceeds of any incurrence of debt by the Borrower or any of its restricted subsidiaries, other than debt permitted to be incurred or issued under the Senior Facilities. |
Each lender of the Term Facility will have the right to reject its pro rata share of mandatory prepayments described above, in which case the Borrower may retain the amounts so rejected. The foregoing mandatory prepayments will be applied to installments of the Term Facility in direct order of maturity.
The Borrower has the ability to voluntarily repay outstanding loans at any time without premium or penalty, other than customary “breakage” costs with respect to LIBOR loans.
Amortization —Beginning September 2014, the Borrower is required to repay installments on the Term Facility in quarterly installments equal to 0.25% of the original principal amount less any prepayments on the Term Facility, with the remaining amount payable on the applicable maturity date with respect to the Term Facility.
Guarantees and security —The obligations under the Senior Facilities will be unconditionally and irrevocably guaranteed by Holdings, any subsidiary of Holdings that directly or indirectly owns any issued and outstanding equity interests of the Borrower, and, subject to certain exceptions, each of the Borrower’s existing and future material domestic wholly owned subsidiaries (collectively, the “Guarantors”). In addition, the Senior Facilities will be collateralized by first priority or equivalent security interests in (i) all the capital stock, or other equity interests in, the Borrower and each of the Borrower’s and the Guarantors’ material direct or indirect wholly owned restricted domestic subsidiaries, and 65% of the voting stock (and 100% of the nonvoting stock) of, or other equity interests in, each of the Borrower’s or any subsidiary guarantors’ material direct wholly owned first-tier restricted foreign subsidiaries, and (ii) certain tangible and intangible assets of the Borrower (other than real property except for certain real property described in the credit agreement) and Guarantors (subject to certain exceptions and qualifications).
As of the closing date for the Senior Facilities, Holdings did not have any of its foreign subsidiaries, non-wholly owned domestic subsidiaries that are restricted subsidiaries or immaterial subsidiaries guarantee the Senior Facilities. The Borrower will also have the ability to designate certain subsidiaries as unrestricted subsidiaries utilizing its investment capacity under the Agreement.
Certain covenants and events of default —The Agreement contains a number of significant affirmative and negative covenants and customary events of default. Such covenants, among other things, will limit or restrict, subject to certain exceptions, the ability of (i) Holdings, the direct parent of the Borrower, to engage in any material operating or business activities other than the ownership of the equity interests of the Borrower and (ii) the Borrower and its restricted subsidiaries to:
|
|
• |
incur additional indebtedness and make guarantees; |
|
|
• |
create liens on assets; |
|
|
• |
enter into sale and leaseback transactions; |
|
|
• |
engage in mergers or consolidations; |
|
|
• |
sell certain assets; |
|
|
• |
make fundamental changes; |
|
|
• |
pay dividends and distributions or repurchase capital stock; |
|
|
• |
make investments, loans and advances; |
|
|
• |
engage in certain transactions with affiliates; |
95
|
|
• |
make changes in the nature of their business; and |
|
|
• |
make prepayments of junior debt. |
In addition, if, on the last day of any period of four consecutive quarters on or after the first full fiscal quarter following the closing of the Senior Facilities, the aggregate principal amount of the Revolving Facility, swing line loans and/or letters of credit (excluding up to $20 million of letters of credit and certain other letters of credit that have been cash collateralized or back-stopped) that are issued and/or outstanding is greater than 25% of the Revolving Facility, the Agreement will require the Borrower to maintain a consolidated first lien net leverage ratio not to exceed 8.0 to 1.0. During any period in which Holdings’ corporate issuer rating is equal to or higher than Baa3 (or the equivalent) according to Moody’s Investors Service, Inc. or BBB- (or the equivalent) according to Standard & Poor’s Ratings Services and no default has occurred and is continuing, the restrictions in the Senior Facility regarding incurring additional indebtedness, dividends and distributions or repurchases of capital stock and transactions with affiliates will not apply to the Borrower and its restricted subsidiaries.
The Senior Facilities also contain certain customary representations and warranties, affirmative covenants and events of default. If an event of default occurs, the lenders under the Senior Facilities will be entitled to take various actions, including the acceleration of amounts due under the Senior Facilities and actions permitted to be taken by a secured creditor. As of December 31, 2016, we were in compliance with all covenants under the Senior Facilities.
Prior Debt Facilities
Prior to entering into the Agreement, Holdco I and subsidiaries borrowed amounts under a mortgage loan agreement (“Mortgage Loan”), five unsecured mezzanine loans and one senior mezzanine loan (collectively, the “Mezzanine Loans”). Additionally, Holdco III and subsidiaries borrowed amounts under a mortgage loan agreement ( the “Holdco III Mortgage Loan”). These amounts were repaid with the proceeds from the Term Facility.
Interest for portions of the Mortgage Loan were subject to a LIBOR floor of 1.0%, plus interest rate spreads ranging from 0.55% to 6.803%, resulting in a weighted average spread of 2.892% as of December 31, 2013, with all interest to be paid currently. In addition, interest for the Mezzanine Loans was subject to a LIBOR floor of 1.0%, plus interest rate spreads ranging from 9.0% to 13.9%, resulting in a weighted average spread of 11.59% as of December 31, 2013. For the Mezzanine Loans, any difference between current LIBOR and the LIBOR floor were deferred until the maturity date of the Mezzanine Loans. Such deferred interest was not to be treated as part of the principal amount of the Mezzanine Loans for any calculation of interest or any other purpose, although it was considered debt under the Mezzanine Loans and secured accordingly.
Under the terms of the Holdco III Mortgage Loan, we were required to make monthly interest payments at LIBOR with a floor of 1.0% plus a spread of 4.0% through July 2012, and thereafter at LIBOR with a floor of 1.0% plus a spread of 4.5%.
Debt Maturity
The contractual maturity of our Term Facility as of December 31, 2016 was as follows (1):
|
(in thousands) |
|
|
|
|
|
Year |
|
|
|
|
|
2017 |
|
$ |
17,514 |
|
|
2018 |
|
|
17,514 |
|
|
2019 |
|
|
17,514 |
|
|
2020 |
|
|
17,514 |
|
|
2021 |
|
|
1,655,094 |
|
|
|
|
$ |
1,725,150 |
|
|
(1) |
Excludes the deduction of debt issuance costs of $18.5 million and includes the unamortized portion of the original issue discount of $6.7 million. |
Letters of Credit
As of both December 31, 2016 and December 31, 2015, we have $14.6 million in letters of credit obtained through our Revolving Facility. In 2014, we were required to pay a fee of 2.63% per annum related to these letters of credit. As of March 2, 2015, we achieved a consolidated first lien net leverage ratio of less than 5.00 to 1.00, and after March 2, 2015 we realized the first step-down in
96
rate of 0.25%, for a margin of 2.38%. As of July 31, 2015, we achieved a consolidated first lien net leverage ratio of less than 4.50 to 1.00, and, as a result we realized the step-down of 0.25% after that date, for a margin of 2.13%.
Prior to our debt refinancing in April 2014, we had two letters of credit through Wells Fargo Bank, N.A. aggregating approximately $5.7 million as of December 31, 2013. We were required to pay a fee of 2.0% per annum related to these letters of credit.
Interest Expense, Net
Net interest expense, including the impact of our interest rate swap (see Note 8), consisted of the following for the years ended December 31, 2016, 2015 and 2014:
|
Description |
|
2016 |
|
|
2015 |
|
|
2014 |
|
|||
|
|
|
(in thousands) |
|
|||||||||
|
Term Facility |
|
$ |
76,289 |
|
|
$ |
81,394 |
|
|
$ |
65,994 |
|
|
Mortgage Loan |
|
|
— |
|
|
|
— |
|
|
|
23,754 |
|
|
Holdco III Mortgage Loan |
|
|
— |
|
|
|
— |
|
|
|
3,206 |
|
|
Mezzanine Loans: |
|
|
|
|
|
|
|
|
|
|
|
|
|
Current |
|
|
— |
|
|
|
— |
|
|
|
3,107 |
|
|
Deferred |
|
|
— |
|
|
|
— |
|
|
|
18,601 |
|
|
Amortization of long-term debt reduction |
|
|
— |
|
|
|
— |
|
|
|
(1,532 |
) |
|
Amortization of deferred financing costs |
|
|
3,925 |
|
|
|
3,810 |
|
|
|
6,938 |
|
|
Amortization of original issue discount |
|
|
1,440 |
|
|
|
1,400 |
|
|
|
912 |
|
|
Other interest |
|
|
12 |
|
|
|
10 |
|
|
|
14 |
|
|
Interest income |
|
|
(247 |
) |
|
|
(110 |
) |
|
|
(49 |
) |
|
Total interest expense, net |
|
$ |
81,419 |
|
|
$ |
86,504 |
|
|
$ |
120,945 |
|
NOTE 8. DERIVATIVE INSTRUMENTS AND HEDGING ACTIVITIES
During the years ended December 31, 2016, 2015 and 2014, derivatives were used to hedge the interest rate risk associated with our variable-rate debt.
Term Facility Interest Rate Swap
On April 14, 2014, the Borrower entered into an interest rate swap agreement with an aggregate notional amount of $850.0 million that expires on April 14, 2019. This agreement swaps the LIBOR rate in effect under the new credit agreement for this portion of the loan to a fixed-rate of 2.0311%, which includes a 1.0% LIBOR floor. Management has elected to designate this interest rate swap as a cash flow hedge for accounting purposes.
Fair Value of Derivative Instruments
The effects of our derivative instruments on our consolidated balance sheets were as follows:
|
|
|
December 31, 2016 |
|
|
December 31, 2015 |
|
||||||
|
|
|
Balance Sheet Classification |
|
Fair Value |
|
|
Balance Sheet Classification |
|
Fair Value |
|
||
|
|
|
(in thousands) |
|
|||||||||
|
Cash Flow Hedges: |
|
|
|
|
|
|
|
|
|
|
|
|
|
Interest rate swap |
|
Other non- current long-term liabilities |
|
$ |
(9,803 |
) |
|
Other non- current long-term liabilities |
|
$ |
(11,440 |
) |
97
Earnings Effect of Derivative Instruments
The effects of our derivative instruments on our consolidated statements of operations and consolidated statements of comprehensive income (loss), net of the effect for income taxes, were as follows:
|
|
|
|
|
|
|
|
|
|
|
|
|
|
|
|
|
|
|
Classification of Gain (Loss) Recognized |
|
2016 |
|
|
2015 |
|
|
2014 |
|
|||
|
|
|
|
|
(in thousands) |
|
|||||||||
|
Cash Flow Hedges: |
|
|
|
|
|
|
|
|
|
|
|
|
|
|
|
Interest rate swap (1) |
|
Other comprehensive income (loss) |
|
$ |
1,064 |
|
|
$ |
(4,309 |
) |
|
$ |
(3,127 |
) |
|
(1) |
There were no amounts recognized in earnings related to hedge ineffectiveness or amounts excluded from hedge effectiveness testing during the years ended December 31, 2016, 2015 and 2014. |
NOTE 9. ACCRUED EXPENSES AND OTHER LIABILITIES
Accrued expenses and other liabilities include the following as of December 31, 2016 and 2015:
|
|
|
2016 |
|
|
2015 |
|
||
|
|
|
(in thousands) |
|
|||||
|
Accrued automobile and general liability insurance |
|
$ |
21,219 |
|
|
$ |
21,769 |
|
|
Accrued sales and occupancy taxes |
|
|
9,829 |
|
|
|
9,431 |
|
|
Accrued liability for guest loyalty program points |
|
|
5,923 |
|
|
|
5,732 |
|
|
Accrued interest |
|
|
16,154 |
|
|
|
16,487 |
|
|
Other accrued expenses |
|
|
11,456 |
|
|
|
9,701 |
|
|
Total accrued expenses and other liabilities |
|
$ |
64,581 |
|
|
$ |
63,120 |
|
NOTE 10. FAIR VALUE MEASUREMENTS
The carrying amount and estimated fair values of our financial assets and liabilities, which include related current portions, were as follows:
|
|
|
December 31, 2016 |
|
|
December 31, 2015 |
|
||||||||||
|
|
|
Carrying Amount |
|
|
Fair Value |
|
|
Carrying Amount |
|
|
Fair Value |
|
||||
|
|
|
(in thousands) |
|
|||||||||||||
|
Cash and cash equivalents (1) |
|
$ |
160,596 |
|
|
$ |
160,596 |
|
|
$ |
86,709 |
|
|
$ |
86,709 |
|
|
Interest rate swaps (2) |
|
|
(9,803 |
) |
|
|
(9,803 |
) |
|
|
(11,440 |
) |
|
|
(11,440 |
) |
|
Long-term debt (3) (4) |
|
|
1,699,950 |
|
|
|
1,716,815 |
|
|
|
1,712,099 |
|
|
|
1,675,760 |
|
|
(1) |
Classified as Level 1 under the fair value hierarchy. |
|
(2) |
Classified as Level 2 under the fair value hierarchy. |
|
(3) |
Classified as Level 3 under the fair value hierarchy. |
|
(4) |
Carrying amount includes deferred debt issuance costs of $18.5 million and $22.4 million as of December 31, 2016 and 2015, respectively. |
We believe the carrying amounts of our cash and cash equivalents approximated fair value as of December 31, 2016 and December 31, 2015, as applicable. Our estimates of the fair values were determined using available market information and valuation methods appropriate in the circumstances. Considerable judgment is necessary to interpret market data and develop estimated fair values. Proper placement of fair value measurements within the valuation hierarchy is considered each reporting period. The use of different market assumptions or estimation methods may have a material effect on the estimated fair value amounts.
The fair values of interest rate swaps are determined using widely accepted valuation techniques including discounted cash flow analysis on the expected cash flows of each instrument. This analysis reflects the contractual terms of the agreements, including the period to maturity, and uses observable market-based inputs, including forward interest rate curves. We incorporate credit valuation adjustments to appropriately reflect both our own nonperformance risk and the respective counterparty’s nonperformance risk in the fair value measurements.
98
We estimate the fair value of our long-term debt using discounted cash flow analysis based on current market inputs for similar types of arrangements. The primary sensitivity in these calculations is based on the selection of appropriate discount rates. We estimated the discount rate to be approximately 3.7% and 4.4%, as of December 31, 2016 and December 31, 2015, respectively. Fluctuations in these assumptions will result in different estimates of fair value.
We test long-lived assets for impairment if events or changes in circumstances indicate that the asset might be impaired. The following fair value hierarchy table presents information about assets measured at fair value on a nonrecurring basis and related impairment charges during the years ended December 31, 2016 and 2015:
|
December 31, 2016 |
|
Level 1 |
|
|
Level 2 |
|
|
Level 3 |
|
|
Total Fair Value |
|
|
Impairment Charge |
|
|||||
|
|
|
(in thousands) |
|
|||||||||||||||||
|
Owned Hotels identified for possible sale |
|
$ |
— |
|
|
$ |
— |
|
|
$ |
227,816 |
|
|
$ |
227,816 |
|
|
$ |
94,087 |
|
|
Assets Held for Sale (1) |
|
|
— |
|
|
|
— |
|
|
|
29,544 |
|
|
|
29,544 |
|
|
|
6,661 |
|
|
2 Owned Hotels |
|
|
— |
|
|
|
— |
|
|
|
6,725 |
|
|
|
6,725 |
|
|
|
3,510 |
|
|
|
|
$ |
— |
|
|
$ |
— |
|
|
$ |
264,085 |
|
|
$ |
264,085 |
|
|
$ |
104,258 |
|
|
(1) |
Assets Held for Sale include a restaurant parcel that was designated as held for sale in the third quarter of 2015, in addition to the five Owned Hotels that the Company entered into an agreement to sell during 2016. The impairment charge for Assets Held for Sale is related to updating the fair value to be net of estimated transaction cost. |
|
December 31, 2015 |
|
Level 1 |
|
|
Level 2 |
|
|
Level 3 |
|
|
Total Fair Value |
|
|
Impairment Charge |
|
|||||
|
|
|
(in thousands) |
|
|||||||||||||||||
|
24 Owned Hotels Held for Sale (1) |
|
$ |
— |
|
|
$ |
— |
|
|
$ |
34,498 |
|
|
$ |
34,498 |
|
|
$ |
43,382 |
|
|
1 Owned Hotel |
|
|
— |
|
|
|
— |
|
|
|
2,422 |
|
|
|
2,422 |
|
|
|
5,103 |
|
|
1 Owned Restaurant Parcel |
|
|
— |
|
|
|
— |
|
|
|
1,025 |
|
|
|
1,025 |
|
|
|
1,636 |
|
|
|
|
$ |
— |
|
|
$ |
— |
|
|
$ |
37,945 |
|
|
$ |
37,945 |
|
|
$ |
50,121 |
|
|
(1) |
During 2015, we sold 11 of the 24 hotels that were designated as assets held for sale in the third quarter of 2015. The remaining 13 hotels are included in assets held for sale as of December 31, 2015, and were sold during 2016. |
99
24 Owned Hotels identified for sale in 2015
During 2015, we identified a portfolio of 24 hotels where it became more likely than not the hotels would be sold significantly before the end of the previously estimated useful life. We recorded an impairment charge of $42.5 million to adjust the carrying value of these assets to their estimated fair value. The inputs used in determining the fair value for these 24 hotels were based on estimated selling prices ranging from $70.0 million to $75.0 million. During the third quarter of 2015, these assets met the criteria for classification as assets held for sale. In 2015, 11 of these hotels were sold for $34.1 million, net of transaction costs. In 2016, we recorded additional impairment on the remaining 13 hotels of $1.1 million. During 2016, the remaining 13 of these hotels were sold for $34.4 million, net of transaction costs.
Restaurant Parcel identified for sale in 2015
In 2015, we identified a restaurant parcel for which it became more likely than not the restaurant parcel would be sold significantly before the end of the previously estimated useful life. We recorded an impairment charge of $1.6 million to adjust the carrying value of this restaurant parcel to its estimated fair value. During the third quarter of 2015, this restaurant parcel met the criteria for classification as assets held for sale. The fair value estimate is considered to be Level 3 within the fair value measurement hierarchy. The inputs used in determining the fair value of these assets are based on estimated selling price, less transaction costs.
Approximately 50 Owned Hotels identified as candidates for sale in 2016
In the first quarter of 2016, we identified approximately 50 hotels where it became more likely than not that the holding period will be significantly shorter than the previously estimated useful lives. We recorded an impairment charge of $80.3 million in the first quarter of 2016, to adjust the carrying value of these assets to the lesser of their estimated fair value or carrying value. These assets did not meet the criteria for classification as assets held for sale as of the date of impairment. The fair value estimate is considered to be Level 3 within the fair value measurement hierarchy. The inputs used in determining the fair value of these approximately 50 hotels are based on multiples of room revenues ranging from 3.70 to 1.50 for the identified assets.
During 2016, we entered into agreements to sell six of the approximately 50 hotels identified in the first quarter of 2016. Three of those hotel sales closed and the remaining three hotels met the criteria for assets held for sale as of December 31, 2016. We recorded an additional impairment charge of $1.6 million to adjust the carrying value of these owned hotels to their estimated fair value including a reduction for transaction costs, with a resulting fair value of approximately $22.3 million. The fair value estimate is considered to be Level 3 within the fair value measurement hierarchy. The inputs used in determining the fair value of these assets are based on estimated selling price, less transaction costs. During 2016, we sold three of the hotels for approximately $11.9 million, resulting in a net gain on sale of $0.3 million. One of the remaining three hotels in assets held for sale was sold subsequent to December 31, 2016 for $4.1 million, net of transaction costs.
Additional Hotel Sales
During 2016, we entered into agreements to sell five of our Owned Hotels for approximately $39.4 million, net of estimated transaction costs. We recorded an impairment charge of $17.7 million to adjust the carrying value of these hotels to their estimated fair value. These hotels met the criteria for classification within assets held for sale and three were sold during 2016 for approximately $22.0 million, resulting in a gain on sale of $4.6 million. The remaining two hotels were sold subsequent to December 31, 2016 for $17.9 million, net of transaction costs.
Additional Impairment
Additionally, during 2016, we identified two hotels where it became more likely than not that the carrying amount would not be recoverable due to a change in market and economic conditions. We recorded an impairment charge of $3.5 million to adjust the carrying value of these hotels to their estimated fair value. The fair value estimate is considered to be Level 3 within the fair value measurement hierarchy. The inputs used in determining the fair value are based on a combination of historical and projected cash flows and other available market information, such as recent sales prices for similar assets.
In the fourth quarter of 2015, we identified a hotel where it became more likely than not that the carrying amount would not be recoverable due to a change in market and economic conditions. We recorded an impairment charge of $5.1 million to adjust the carrying value of this hotel to its estimated fair value. The fair value estimate is considered to be a Level 3 within the fair value measurement hierarchy. The inputs used in determining the fair value are based on a combination of historical and projected cash flows and other available market information, such as recent sales prices for similar assets.
100
NOTE 11. RELATED PARTY TRANSACTIONS
We maintain various agreements and enter into certain transactions with affiliates. Prior to April 14, 2014 these affiliates owned the Previously Managed Hotels ( see Note 4 ), which were managed by LQM. The following is a discussion of these arrangements and resulting transactions from January 1, 2014 to April 14, 2014:
Management and Service Agreements
Hotel Management Agreements —Pursuant to hotel management agreements with affiliates of the Funds in existence prior to the IPO (“LQM Management Agreements”), LQM provided management services to the Previously Managed Hotels until the IPO, including supervision, direction, operation, management and promotion. The LQM Management Agreements would have expired in July 2027, but could have been terminated by either party at any time and for any reason and were terminated in connection with the IPO. Under the terms of the LQM Management Agreements, LQM was entitled to recover a management fee of 1.67% of gross operating revenue from the Previously Managed Hotels, as well as reimbursement for certain shared group costs.
Management fees earned by LQM from the Previously Managed Hotels, for the period from January 1, 2014 to April 14, 2014 were $0.2 million. These management fees are included within franchise and other fee-based revenues in the accompanying consolidated statements of operations.
In addition, in accordance with the LQM Management Agreements, LQM also provided certain group services for hotels it managed, including group and administrative services, information systems support, training, and other field services, and was reimbursed for the cost of providing these services. For the period from January 1, 2014 to April 14, 2014, LQM earned group services reimbursements from the Previously Managed Hotels of approximately $0.2 million. These fees are included within franchise and other fee-based revenues in the accompanying consolidated statements of operations.
Other Fees and Funding
Brand Marketing Fund (BMF) —We maintain the BMF on behalf of our franchisees and the hotel properties we own and manage, and we charge these hotels a fee of 2.5% of gross room revenue, which is then used by the BMF to fund national advertising promotions and campaigns. BMF fees collected from franchised and managed hotels, and the related expenses, are reflected as brand marketing fund revenues and expenses from franchise and managed hotels in the accompanying consolidated statements of operations.
Customer Loyalty Program —We administer a customer loyalty program, La Quinta Returns (“Returns”), and charge participating hotels a fee to administer the program equal to 5% of the Returns members’ eligible room rate per night. Returns fees collected from franchised and managed hotels are reflected within franchise and other fees-based revenues in the accompanying consolidated statements of operations. We recorded revenues related to Returns from the Previously Managed Hotels of approximately $0.3 million for the period from January 1, 2014 to April 14, 2014.
Trademark Licenses —In accordance with the LQM Management Agreements, we charged a royalty fee of 0.33% of the Previously Managed Hotels’ gross room revenues. For the period January 1, 2014 to April 14, 2014, royalty fees charged to the Previously Managed Hotels under these agreements were approximately $0.1 million. These royalty fees are reflected within franchise and other fee-based revenues in the accompanying consolidated statements of operations.
Other Arrangements
As of December 31, 2016 and December 31, 2015, approximately $81.6 million and $41.6 million, respectively, of the aggregate principal amount of our Term Facility was owned by affiliates of Blackstone. We make periodic interest and principal payments on such debt in accordance with its terms.
Blackstone Advisory Partners L.P., an affiliate of Blackstone, received aggregate compensation of approximately $3.0 million for acting as underwriter or co-manager in connection with financing transactions by us, including our IPO, during 2014. In addition, we engaged Blackstone Advisory Partners L.P. to provide certain financial consulting services in connection with the public offering of our common stock by certain stockholders in April 2015 and November 2014 for a fee of approximately $0.4 million and $0.5 million, respectively.
We also purchase products and services from entities affiliated with or owned by Blackstone. The fees paid for these products and services were approximately $4.9 million, $2.6 million and $2.8 million during years ended December 31, 2016, 2015, and 2014, respectively.
101
NOTE 12. COMMITMENTS AND CONTINGENCIES
Environmental —We are subject to certain requirements and potential liabilities under various federal, state and local environmental laws, ordinances, and regulations. Such requirements often impose liability without regard to whether the current or previous owner or operator knew of, or was responsible for, the presence of such hazardous or toxic substances. Although we have incurred and expect to incur remediation and other environmental costs during the ordinary course of operations, we anticipate that such costs will not have a material effect on our financial condition, results of operations, or cash flows.
Litigation — On April 25, 2016, a purported stockholder class action lawsuit, captioned Beisel v. La Quinta Holdings Inc. et al., was filed in the U.S. District Court for the Southern District of New York on behalf of purchasers of the Company’s common stock pursuant to the Company’s March 24, 2015 secondary public offering (the “March Secondary Offering”) and on behalf of purchasers of the Company’s common stock from November 19, 2014 through October 29, 2015 (the “Class Period”). On July 22, 2016, the court appointed lead plaintiff, and on September 30, 2016, lead plaintiff filed an amended complaint. The amended complaint names as defendants the Company, certain current and former Company officers, and certain current and former members of the Board of Directors, among others. The complaint alleges, among other things, that, in violation of the federal securities laws, the registration statement and prospectus filed in connection with the March Secondary Offering contained materially false and misleading information or omissions and that the Company as well as certain current and former officers made false and misleading statements in earnings releases and to analysts during the Class Period. Plaintiff seeks unspecified compensatory damages and other relief. The Company believes that the putative class action lawsuit is without merit and intends to defend the lawsuit vigorously; however, there can be no assurance regarding the ultimate outcome of this lawsuit.
In addition, we are a party to a number of pending claims and lawsuits arising in the normal course of business, including proceedings involving tort and other general liability claims, workers’ compensation and other employee claims and intellectual property claims. We do not consider our ultimate liability with respect to any such claims or lawsuits, or the aggregate of such claims and lawsuits, to be material in relation to our consolidated financial condition, results of operations or our cash flows taken as a whole.
We maintain general and other liability insurance; however, certain costs of defending lawsuits, such as those below the retention or insurance deductible amount, are not covered by or are only partially covered by insurance policies, and our insurance carriers could refuse to cover certain claims in whole or in part. We regularly evaluate our ultimate liability costs with respect to such claims and lawsuits. We accrue costs from litigation as they become probable and estimable.
Casualty Losses —We maintain insurance for property and casualty damage, subject to deductibles and policy terms and conditions, attributable to wind, flood, and earthquakes. We also maintain business interruption insurance.
Tax Contingencies — We are subject to regular audits by federal and state tax authorities. These audits may result in additional tax liabilities. The Internal Revenue Service (the “IRS”) is currently auditing the tax returns of La Quinta Corporation, one of our former REITs prior to the Pre-IPO Transactions, and BRE/LQ Operating Lessee Inc., one of our former taxable REIT subsidiaries prior to the Pre-IPO Transactions, in each case for the tax years ended December 31, 2010 and 2011. We received a draft notice of proposed adjustment from the IRS on January 9, 2014, and the notice of proposed adjustment was issued to us on June 2, 2014. We submitted a timely response to the notice of proposed adjustment and, on July 7, 2014, we received an IRS 30-Day Letter proposing to impose a 100% tax on the REIT totaling $158 million for the periods under audit in which the IRS has asserted that the rent charged for these periods under the lease of hotel properties from the REIT to the taxable REIT subsidiary exceeded an arm’s length rent. In addition, the IRS proposed to eliminate $89 million of net operating loss carryforwards for the taxable REIT subsidiary for the tax years 2006 through 2009; however, in an IRS rebuttal received on September 26, 2014, the IRS conceded its proposed adjustment on this point was incorrect. We disagree with the IRS’ position with respect to rents charged by the REIT to its taxable REIT subsidiary and have appealed the proposed tax and adjustments to the IRS Appeals Office. In determining amounts payable by our taxable REIT subsidiary under the lease, we engaged a third party to prepare a transfer pricing study contemporaneous with the lease which concluded that the lease terms were consistent with an arm’s length rent as required by relevant provisions of the Internal Revenue Code of 1986 (the “Internal Revenue Code”) and applicable Treasury Regulations. Attorneys and others representing the Company conducted preliminary discussions regarding the appeal with the IRS Appeals Office team on March 31, 2015 and April 1, 2015. In response to a supplemental analysis submitted by the IRS economist to IRS Appeals and provided to us on August 18, 2015, we submitted responses dated September 3, 2015 and October 1, 2015. Our most recent meeting with the IRS Appeals Office team occurred on January 25, 2017. Our discussions with IRS Appeals are ongoing. We believe the IRS transfer pricing methodologies applied in the audits contain flaws and that the IRS proposed tax and adjustments are inconsistent with U.S. transfer pricing principles and the U.S. federal tax laws related to REITs. We have concluded that the positions reported on our tax returns under audit by the IRS are, based on their technical merits, more-likely-than-not to be sustained upon examination. Accordingly, as of December 31, 2016, we have not established any reserves related to this proposed adjustment or any other issues reflected on the returns under examination.
On November 25, 2014, we were notified that the IRS intended to examine the tax returns of the same entities subject to the 2010 and 2011 audit in each case for the tax years ended December 31, 2012 and 2013. We have received several draft notices of proposed
102
adjustment proposing a transfer-pricing related assessment of approximately $18 million for 2013 and adjustments to our net operating losses for the years 2006 through 2009. Based on our analysis of these draft notices, we believe the IRS transfer pricing methodologies and NOL disallowances applied in the 2012-2013 audit contains the same flaws present in the 2010-2011 audit and that the IRS proposed tax and adjustments are inconsistent with U.S. transfer pricing principles and the U.S. federal tax laws related to REITs. We have concluded that the positions reported on our tax returns under audit by the IRS are, based on their technical merits, more-likely-than-not to be sustained upon examination. Accordingly, as of December 31, 2016, we have not established any reserves related to this proposed adjustment or any other issues reflected on the returns under examination.
On November 1, 2016, the Internal Revenue Service notified the Company that it intends to audit the return of one of its subsidiaries, Lodge Holdco II L.L.C., for the short taxable year ended April 13, 2014. The audit is in its early stages and no issues have been communicated to the Company at this point. As Lodge Holdco II L.L.C. was treated as a partnership for the taxable year ended April 13, 2014, any tax resulting from this examination would be assessed at the partner level rather than against the Company. Accordingly, no provision has been recorded for this examination.
Purchase Commitments —As of December 31, 2016, we had approximately $58.3 million of purchase commitments related to certain continuing redevelopment and renovation projects.
Franchise Commitments —Under certain franchise agreements, we are committed to provide certain incentive payments, reimbursements, rebates, and other payments to help defray certain costs. Our obligation to fund these commitments is contingent upon certain conditions set forth in the respective franchise agreement. The franchise agreements generally require that, in the event that the franchise relationship is terminated, the franchisee is required to repay any outstanding balance plus any unamortized portion of any incentive payment. As of December 31, 2016, we had $20.8 million in outstanding commitments to various franchisees for such financial assistance.
NOTE 13. INCOME TAXES
Prior to our IPO on April 14, 2014, we operated primarily as limited liability companies treated as partnerships for U.S. federal income tax purposes, REIT entities, and taxable entities. As a result, we were not subject to U.S. federal and most state income taxes for our limited liability companies and our REIT entities. Our partnership and REIT status terminated in connection with the IPO, as the La Quinta Predecessor Entities were contributed to Holdings, a “C” corporation, the shares of capital stock held by third-party shareholders of our REIT entities were redeemed for cash totaling approximately $3.9 million, and our REITs were converted into limited liability companies. As a result of these transactions, we have become subject to additional entity-level taxes and, during the second quarter of 2014, we recorded a one-time net deferred tax expense of $321.1 million, which established the associated net deferred tax liability on our balance sheet, and reflects the future tax consequences attributable to differences between the financial statement carrying amounts of existing assets and liabilities and their respective tax bases at the estimated blended statutory U.S. federal and state income tax rate of 38.1%. More specifically, this initial deferred tax expense is driven by (1) the recognition of deferred tax liabilities of approximately $462.3 million, primarily related to differences between the book and tax basis for our fixed and intangible assets and related depreciation, (2) the recognition of deferred tax assets of approximately $14 million primarily related to tax-only intangibles, and (3) as a result of the change in the Company’s tax status, a tax benefit of $127.2 million related to the reduction in valuation allowance, primarily associated with La Quinta Predecessor Entities’ net operating losses and tax credits.
For financial reporting purposes, the consolidated income tax expense is based on consolidated reported financial accounting income or loss before income taxes.
103
The components of our income tax provision are as follows:
|
|
|
For the years ended December 31, |
|
|||||||||
|
|
|
2016 |
|
|
2015 |
|
|
2014 |
|
|||
|
|
|
(in thousands) |
|
|||||||||
|
Current provision: |
|
|
|
|
|
|
|
|
|
|
|
|
|
Federal |
|
$ |
4,467 |
|
|
$ |
1,933 |
|
|
$ |
2,615 |
|
|
State |
|
|
7,070 |
|
|
|
3,442 |
|
|
|
3,121 |
|
|
Foreign |
|
|
88 |
|
|
|
78 |
|
|
|
103 |
|
|
Total current |
|
|
11,625 |
|
|
|
5,453 |
|
|
|
5,839 |
|
|
Deferred provision: |
|
|
|
|
|
|
|
|
|
|
|
|
|
Federal |
|
|
(5,148 |
) |
|
|
17,765 |
|
|
|
22,279 |
|
|
State |
|
|
(5,984 |
) |
|
|
(731 |
) |
|
|
687 |
|
|
Total deferred |
|
|
(11,132 |
) |
|
|
17,034 |
|
|
|
22,966 |
|
|
Provision for income taxes |
|
|
493 |
|
|
|
22,487 |
|
|
|
28,805 |
|
|
Recognition of net deferred tax liabilities upon C-corporation conversion |
|
|
— |
|
|
|
— |
|
|
|
321,054 |
|
|
Total income tax expense |
|
$ |
493 |
|
|
$ |
22,487 |
|
|
$ |
349,859 |
|
The significant components of the deferred tax assets and liabilities as of December 31, 2016 and 2015 are as follows:
|
|
|
December 31, |
|
|||||
|
|
|
2016 |
|
|
2015 |
|
||
|
|
|
(in thousands) |
|
|||||
|
Deferred Tax Assets |
|
|
|
|
|
|
|
|
|
Net Operating Losses |
|
$ |
9,145 |
|
|
$ |
43,583 |
|
|
Insurance Accruals |
|
|
12,084 |
|
|
|
10,641 |
|
|
Tax Credits |
|
|
8,623 |
|
|
|
11,550 |
|
|
Cash Flow Hedge-OCI |
|
|
3,431 |
|
|
|
4,004 |
|
|
Intangibles |
|
|
10,794 |
|
|
|
12,602 |
|
|
Doubtful Accounts |
|
|
1,528 |
|
|
|
1,932 |
|
|
Returns Club |
|
|
— |
|
|
|
343 |
|
|
Compensation Accruals |
|
|
9,481 |
|
|
|
8,054 |
|
|
Other |
|
|
2,310 |
|
|
|
1,960 |
|
|
Total gross deferred tax assets |
|
|
57,396 |
|
|
|
94,669 |
|
|
Less: Valuation Allowance |
|
|
(9,116 |
) |
|
|
(9,300 |
) |
|
Deferred Tax Assets |
|
$ |
48,280 |
|
|
$ |
85,369 |
|
|
Deferred Tax Liabilities |
|
|
|
|
|
|
|
|
|
Fixed Assets |
|
$ |
318,986 |
|
|
$ |
361,856 |
|
|
Trademark |
|
|
61,823 |
|
|
|
61,603 |
|
|
Cancellation of Debt Income |
|
|
6,192 |
|
|
|
9,300 |
|
|
Linens, uniforms and supplies |
|
|
3,959 |
|
|
|
4,225 |
|
|
Other |
|
|
348 |
|
|
|
1,973 |
|
|
Deferred Tax Liabilities |
|
|
391,308 |
|
|
|
438,957 |
|
|
Net Deferred Taxes |
|
$ |
(343,028 |
) |
|
$ |
(353,588 |
) |
As of December 31, 2016 and 2015, certain subsidiaries of ours had available federal net operating loss carryforwards (“NOLs”) totaling approximately $26.1 million and $123.8 million, respectively. Generally, NOL carryforwards expire 20 years after the year in which they arise. Our NOLs will expire between 2016 and 2033. In November 2014, Blackstone completed a secondary offering in which it registered and sold 23.0 million of the Company’s shares, bringing its ownership percentage to 45.2%, and creating an ownership change for federal income tax purposes. As a result of this secondary offering, and the resulting ownership change the Company’s federal net operating losses will be limited under Internal Revenue Code Section 382 with annual limitations that became applicable in 2015 through 2019. State net operating loss carryforwards are also available for use subject to similar limitations in many cases. As of December 31, 2016, we have fully utilized all available federal NOLs, except those belonging to certain inactive
104
subsidiaries. We also have alternative minimum tax (“AMT”) credit carry forwards, as of December 31, 2016 and 2015, in the gross amount of $8.6 million and $11.5 million, respectively, which do not expire.
For periods prior to the IPO, we maintained valuation allowances for our NOLs and AMT credit carry forwards as we believed the more-likely-than-not realization criteria were not met and therefore realization was not reasonably assured. When assessing the adequacy of the valuation allowance, the Company considers both anticipated reversals of deferred tax liabilities within applicable carryforward periods and other potential sources of taxable income within those periods. In connection with our conversion to a C-corporation on April 14, 2014, we reassessed the realizability of our NOLs and AMT credit carryforwards. As a result, we concluded that a valuation allowance was required on only a portion of our NOLs and that the remainder of our NOLs and all of our AMT credit carryforwards meet the more likely than not realization criteria. The impact of our reassessment of the realizability of our deferred tax assets is incorporated in the charge to record the impact of our conversion to a C-corporation. The Company has open tax years dating back to 2010.
The following is a reconciliation of the statutory federal income tax rate to the effective tax rate reported in the combined financial statements:
|
|
|
For the years ended December 31, |
|||||||||||
|
|
|
2016 |
|
|
2015 |
|
|
2014 |
|||||
|
|
|
(in thousands) |
|
|
|||||||||
|
Statutory U.S. federal income tax provision |
|
$ |
(214 |
) |
|
$ |
17,219 |
|
|
$ |
5,934 |
|
|
|
State tax, net of federal benefit |
|
|
1,052 |
|
|
|
2,221 |
|
|
|
4,957 |
|
|
|
Foreign tax, net of federal benefit |
|
|
88 |
|
|
|
50 |
|
|
|
67 |
|
|
|
Nondeductible stock compensation |
|
|
— |
|
|
|
1,948 |
|
|
|
16,155 |
|
|
|
Nondeductible book loss from January 1, 2014 through April 13, 2014 |
|
|
— |
|
|
|
— |
|
|
|
4,480 |
|
|
|
Permanent items |
|
|
389 |
|
|
|
800 |
|
|
|
97 |
|
|
|
Tax credits |
|
|
(548 |
) |
|
|
(84 |
) |
|
|
— |
|
|
|
Unrecognized tax benefit |
|
|
174 |
|
|
|
— |
|
|
|
— |
|
|
|
Change in valuation allowance |
|
|
95 |
|
|
|
353 |
|
|
|
(767 |
) |
|
|
Return to provision |
|
|
(351 |
) |
|
|
(688 |
) |
|
|
(329 |
) |
|
|
Changes in deferred taxes |
|
|
(169 |
) |
|
|
541 |
|
|
|
(1,904 |
) |
|
|
Other |
|
|
(23 |
) |
|
|
127 |
|
|
|
115 |
|
|
|
Provision for income taxes |
|
|
493 |
|
|
|
22,487 |
|
|
|
28,805 |
|
|
|
Recognition of net deferred tax liabilities upon C-corporation conversion |
|
|
— |
|
|
|
— |
|
|
|
321,054 |
|
(1) |
|
Income tax expense |
|
$ |
493 |
|
|
$ |
22,487 |
|
|
$ |
349,859 |
|
|
|
(1) |
The one-time net deferred tax expense of $321.1 million consists of (a) the recognition of deferred tax liabilities of approximately $462.3 million, primarily related to differences between the book and tax basis for fixed and intangible assets, (b) the recognition of deferred tax assets of approximately $14.0 million, primarily related to tax basis only intangibles, and (c) as a result of the change in the Company’s tax status, a tax benefit of $127.2 million related to the reduction in valuation allowance, primarily associated with La Quinta Predecessor Entities’ net operating losses and tax credits. |
The Company files income tax returns in the U.S. Federal jurisdiction and several state jurisdictions. The Company has open tax years back to 2010. We utilize our available tax attributes at the federal and state levels to the extent allowed by applicable law. The Company anticipates that it is reasonably possible a state may challenge our use of certain state tax benefits, although we believe any proposed adjustment pertaining to the use of those state tax benefits would not result in a material change to our financial position. A reconciliation of the beginning and ending amount of unrecognized tax benefits is as follows:
|
|
|
For the years ended December 31, |
|
|||||||||
|
|
|
2016 |
|
|
2015 |
|
|
2014 |
|
|||
|
|
|
(in thousands) |
|
|||||||||
|
Unrecognized tax benefits, beginning of the year |
|
$ |
2,990 |
|
|
$ |
— |
|
|
$ |
— |
|
|
Gross increase in unrecognized tax positions in the current year |
|
|
— |
|
|
|
2,990 |
|
|
|
— |
|
|
Unrecognized tax benefits, end of the year |
|
$ |
2,990 |
|
|
$ |
2,990 |
|
|
$ |
— |
|
105
At December 31, 2016 and 2015, there are $3.0 million of unrecognized tax benefits that, if recognized, would affect the annual effective tax rate. We do not expect any significant changes in our unrecognized tax benefits over the next twelve months.
Our policy is to classify interest and penalties as a component of income tax expense.
NOTE 14. THIRD PARTY LEASE COMMITMENTS
Rental Income— We act as a lessor and lease properties we own to third parties, which are primarily operated as restaurants. These leases are accounted for as operating leases and mature on various dates through 2096. The leases provide for minimum and contingent rental income based on a percentage of the lessee’s annual sales in excess of stipulated amounts.
As of December 31, 2016, approximate future minimum rental income to be received under non-cancelable operating leases, in excess of one-year, is as follows:
|
Year ending December 31, |
|
Operating lease income |
|
|
|
|
|
(in thousands) |
|
|
|
2017 |
|
$ |
4,450 |
|
|
2018 |
|
|
4,066 |
|
|
2019 |
|
|
3,859 |
|
|
2020 |
|
|
3,522 |
|
|
2021 |
|
|
3,102 |
|
|
Thereafter |
|
|
3,664 |
|
|
|
|
$ |
22,663 |
|
For the year ended December 31, 2016, total rental revenue was approximately $4.0 million, of which $0.5 million related to contingent rents. For the year ended December 31, 2015, total rental revenue was approximately $3.8 million, of which $0.4 million related to contingent rents. For the year ended December 31, 2014, total rental revenue was approximately $4.2 million, of which $0.4 million related to contingent rents. Rental revenue is included within other hotel revenues in the accompanying consolidated statement of operations.
Rental Expense— We maintain ground lease arrangements with third parties for certain hotel properties that contain contingent rent provisions based upon the respective hotel’s revenues. Many of these lease agreements contain renewal options at fair market value at the conclusion of the initial lease terms. The leases extend for varying periods through 2096.
|
Year ending December 31, |
|
Operating ground lease commitments |
|
|
|
|
|
(in thousands) |
|
|
|
2017 |
|
$ |
4,637 |
|
|
2018 |
|
|
4,448 |
|
|
2019 |
|
|
4,448 |
|
|
2020 |
|
|
4,413 |
|
|
2021 |
|
|
4,453 |
|
|
Thereafter |
|
|
104,210 |
|
|
|
|
$ |
126,609 |
|
For the year ended December 31, 2016, total rent expense for ground leases included in other lodging and operating expenses was approximately $6.4 million, of which $0.7 million related to contingent rents. For the year ended December 31, 2015, total rent expense was approximately $6.1 million, of which $0.7 million related to contingent rents. For the year ended December 31, 2014, total rent expense was approximately $5.2 million, of which $0.5 million related to contingent rents.
NOTE 15. EMPLOYEE BENEFIT PLANS
We maintain a deferred savings plan covering substantially all of our employees that qualified under Section 401(k) of the Internal Revenue Code. Our deferred savings plan has an employer matching contribution of 100% of the first 3% and 50% of the next 2% of an employee’s eligible earnings, which vests immediately. We paid employer contributions of approximately $2.2 million, $2.3 million and $2.0 million, respectively, during the years ended December 31, 2016, 2015 and 2014, respectively.
106
In 2015, our board and stockholders’ approved and adopted the La Quinta Holdings Inc. 2015 Employee Stock Purchase Plan (the “ESPP”) which allows eligible employees to purchase Holdings’ stock at a discount of 5%. The ESPP is intended to be in compliance with safe harbor rules so that the ESPP is not compensatory, and no expense is recognized related to the ESPP. There were 2.6 million shares reserved for purchase under the ESPP, of which 11,589 shares and 5,233 shares were issued and included in shares outstanding as of December 31, 2016 and 2015, respectively.
NOTE 16. EQUITY-BASED COMPENSATION
Promote Plan
Prior to the IPO Effective Date, certain members of our management and others associated with Blackstone (collectively the “Promote Participants”) were eligible to receive long-term incentives evidenced by units (the “Units”) in LQ Services L.L.C. (“LQ Services”), which indirectly held interests in the Company, which Units were intended to be treated as “profits interests” for U.S. tax purposes (the “Promote Plan”). Units were typically granted by our Chief Executive Officer, in consultation with Blackstone, to key employees upon hire. Unit levels could also be adjusted to recognize changing job responsibilities. All of the Units were subject to exit-based vesting on the date when there was a sale, transfer or disposition of all or substantially all of the assets of the La Quinta Predecessor Entities to an unaffiliated entity which resulted in distributions being payable to the holders of the Units (a “Liquidity Event”), subject to a Promote Participant’s continued employment on such date. The value in respect of Units would have been determined based upon the amounts received by Blackstone pursuant to a Liquidity Event, net of certain debt repayments and return of equity to Blackstone. As payments in respect of the Units were contingent on occurrence of a Liquidity Event, which was not assessed to be probable prior to the date of our IPO, no expense was accrued or recognized for the Units prior to April 14, 2014.
On the IPO Effective Date, Units that were outstanding under the Promote Plan at the time of the offering were exchanged for 3.1 million vested and unvested shares of common stock of Holdings of equivalent economic value, using a grant date fair value equal to the initial public offering price of Holdings shares of $17.00 per share and issued as follows: (1) 40% of the shares received were vested shares of common stock; (2) 40% of the shares received were unvested shares of restricted stock that were vested on April 14, 2015, contingent upon continued employment through that date; and (3) 20% of the shares received were unvested shares of restricted stock that were slated to vest on the earlier of the date that Blackstone and its affiliates cease to own 50% or more of Holdings or the seventh anniversary of the IPO Effective Date, contingent upon continued employment at that date. Blackstone and its affiliates ceased to own 50% of Holdings, effective November 25, 2014. The Promote Plan became fully vested on April 14, 2015.
Total compensation expense under the Promote Plan was $5.6 million and $46.2 million for the years ended December 31, 2015 and 2014, respectively. A total of 9,658 shares were forfeited from the Promote Plan.
2014 Omnibus Incentive Plan
In connection with, and prior to completion of, the IPO, our board of directors adopted, and our stockholders approved, the La Quinta Holdings Inc. 2014 Omnibus Incentive Plan which was amended and restated effective as of May 18, 2016 (the “A&R 2014 Omnibus Incentive Plan”). The A&R 2014 Omnibus Incentive Plan provides for the granting of stock options, restricted stock and other equity-based or performance-based awards denominated in cash or in stock to directors, officers, employees, consultants and advisors of Holdings and its affiliates.
2014 Grant I —Effective on the IPO Effective Date, Holdings issued 0.35 million shares of Holdings common stock under our 2014 A&R 2014 Omnibus Incentive Plan with a grant date fair value of $16.65 per share to certain of our employees as follows: (1) 50% of the shares granted were vested shares of common stock; (2) 40% of the shares granted were unvested shares of restricted stock that were vested on April 14, 2015, contingent upon continued employment through that date; and (3) 10% of the shares granted were unvested shares of restricted stock that were slated to vest on the earlier of the date that Blackstone and its affiliates cease to own 50% or more of Holdings or the seventh anniversary of the IPO Effective Date, contingent upon continued employment through that date. Blackstone and its affiliates ceased to own 50% of Holdings, effective November 25, 2014. The 2014 Grant I became fully vested on April 14, 2015.
2014 Grant II—On June 11, 2014, Holdings issued 1.01 million shares of Holdings common stock under our A&R 2014 Omnibus Incentive Plan with a grant date fair value of $18.70 per share to certain of our employees. Grant II is a time-based vesting award with multiple tranches that vest on various dates with a remaining weighted average life of 0.4 years as of December 31, 2016. The fair value of Grant II will be recognized on a straight-line basis over the requisite service period of each tranche included in the award.
2014 Performance Unit Grant — On June 11, 2014, we issued 109 performance-based RSUs (the “PSUs”), which represent 0.5 million shares at target value of common stock to certain of our employees. The performance period for the 2014 Performance Unit Grant ended on December 31, 2016. The calculation of the value of the units granted under the 2014 Performance Unit Grant is weighted as follows: 70% based on our total shareholder return (“TSR”) relative to the total shareholder returns of a defined set of
107
peer companies (“Relative Shareholder Return”); and 30% based on our absolute TSR compound annual growth rate (“TSR CAGR”). The number of shares of common stock issued in exchange for each PSU at the end of the performance period is determined based on a calculated multiple of defined target amounts for TSR CAGR and Relative Shareholder Return. Possible payout multiples range from 33% of target, which represents the threshold and below which no payout is given, and 167% of target, which represents the maximum payout. At the end of the performance period the TSR CAGR and Relative Shareholder Return were below the threshold.
The grant date fair value of the 2014 Performance Unit Grant was $19.80 per share, which was determined using a Monte Carlo simulation valuation model with the following assumptions:
|
Expected volatility (1) |
|
|
24.05 |
% |
|
Dividend yield (2) |
|
— % |
|
|
|
Risk-free rate (3) |
|
|
0.70 |
% |
|
Expected term (in years) (4) |
|
|
2.60 |
|
|
(1) |
Due to limited trading history for our common stock, we did not have sufficient information available on which to base a reasonable and supportable estimate of the expected volatility of our share price. As a result, we used an average historical volatility of our peer group over a time period consistent with our expected term assumption. Our peer group was determined based upon companies in our industry with similar business models and is included with those used to benchmark our executive compensation. |
|
(2) |
At the time of the 2014 Performance Unit Grant, we had no plans to pay dividends during the expected term of these performance shares. |
|
(3) |
Based on the yields of U.S. Department of Treasury instruments with similar expected lives. |
|
(4) |
Midpoint of the 30-calendar day period preceding the end of the performance period. |
Director Unit Grants — In 2014, 2015 and 2016, we granted a total of 100,819 restricted stock units (“RSUs”) to our independent directors under our A&R 2014 Omnibus Incentive Plan, as part of our regular annual compensation of our independent directors. The Director Unit Grants vests in three equal installments on the first, second and third anniversaries of the grant dates with a remaining weighted average life of 1.3 years as of December 31, 2016. The grant date weighted average price is $14.87 per share. The fair value of the RSUs will be recognized on a straight-line basis over the requisite service period for the entire award. Vested RSUs will be settled with shares of our common stock.
2015 Grant I — In 2015, we issued a total of 0.2 million shares of Holdings common stock under our A&R 2014 Omnibus Incentive Plan with a grant date weighted average price of $21.81 per share to certain of our employees. 2015 Grant I is a time-based vesting award with multiple tranches that vest on various dates with a remaining weighted average life of 0.9 years as of December 31, 2016. The fair value of 2015 Grant I will be recognized on a straight-line basis over the requisite service period of each tranche included in the award.
2015 Performance Unit Grant — On February 19, 2015, we issued PSUs, which represents 0.3 million shares of common stock at target value to certain of our employees. The performance period for the 2015 Performance Unit Grant ends December 31, 2017, with a remaining life of 1.0 years as of December 31, 2016. The calculation of the value of the units granted under the 2015 Performance Unit Grant is based solely on our TSR relative to the Relative Shareholder Return. The number of shares of common stock issued in exchange for each PSU at the end of the performance period is determined based on defined target amounts for Relative Shareholder Return. Possible payout multiples range from 33% of target, which represents the threshold and below which no payout is given, and 200% of target, which represents the maximum payout. The 2015 Performance Unit Grant PSUs will be settled with shares of our common stock.
The grant date fair value of the 2015 Performance Unit Grant was $25.35 per share, which was determined using a Monte Carlo simulation valuation model with the following assumptions:
|
Expected volatility(1) |
|
|
31.66 |
% |
|
Dividend yield(2) |
|
— % |
|
|
|
Risk-free rate(3) |
|
|
1.00 |
% |
|
Expected term (in years)(4) |
|
|
2.87 |
|
|
(1) |
Expected volatility is calculated as the average of the long-term historical volatility based on the peer companies and our implied volatility. |
108
|
(2) |
At the time of the 2015 Performance Unit Grant, we had no foreseeable plans to pay dividends during the expected term of these performance shares. |
|
(3) |
Based on the yields of U.S. Department of Treasury instruments with similar expected lives. |
|
(4) |
As of the grant date. |
2016 Grant I — In 2016, we issued a total of 0.4 million shares of Holdings common stock under our A&R 2014 Omnibus Incentive Plan with a grant date weighted average price of $11.87 per share to certain of our employees. 2016 Grant I is a time-based vesting award with multiple tranches that vest on various dates with a remaining weighted average life of 1.0 years as of December 31, 2016. The fair value of 2016 Grant I will be recognized on a straight-line basis over the requisite service period of each tranche included in the award.
2016 Grant II — In 2016, we issued a total of 0.3 million shares of Holdings common stock under our A&R 2014 Omnibus Incentive Plan with a grant date weighted average price of $11.35 per share to certain of our employees. 2016 Grant II is a time-based vesting award with single tranches that vest at the end of a three year performance period. The remaining weighted average life is 2.2 years as of December 31, 2016. The fair value of 2016 Grant II will be recognized on a straight-line basis over the requisite service period of the award.
2016 Performance Unit Grant — During the year ended December 31, 2016, we issued PSUs that would result in 0.4 million shares being issued at target value to certain of our employees. The performance period for PSUs is generally three years. The calculation of the value of the units granted during the year ended December 31, 2016 is based solely on our total shareholder return (“TSR”) relative to the Relative Shareholder Return. The number of shares of common stock issued in exchange for each PSU at the end of the performance period is determined based on defined target amounts for Relative Shareholder Return. Possible payout multiples range from 33% of target, which represents the threshold and below which no payout is given, and 200% of target, which represents the maximum payout. Vested PSUs are settled with shares of our common stock.
The weighted average grant date fair value of the PSUs granted during the year ended December 31, 2016 was $12.18 per unit, which was determined using a Monte Carlo simulation valuation model with the following assumptions:
|
Expected volatility(1) |
|
|
29.03 |
% |
|
Dividend yield(2) |
|
— % |
|
|
|
Risk-free rate(3) |
|
|
0.99 |
% |
|
Expected term (in years)(4) |
|
|
2.62 |
|
|
(1) |
Expected volatility is calculated as the average of the long-term historical volatility based on the peer companies and our implied volatility. |
|
(2) |
At the time of the PSU grant, we had no foreseeable plans to pay dividends during the expected term of these performance shares. |
|
(3) |
Based on the yields of U.S. Department of Treasury instruments with similar expected lives. |
|
(4) |
As of the grant date. |
For the years ended December 31, 2016, 2015 and 2014, total compensation expense for awards under the A&R 2014 Omnibus Incentive Plan was $14.1 million, $16.0 million and $11.7 million, respectively, excluding related taxes. As of December 31, 2016 unrecognized compensation expense was $14.6 million, which is expected to be recognized over a weighted-average period of 1.4 years. As of December 31, 2015, the Company had 0.6 million shares unvested under the A&R 2014 Omnibus Incentive Plan, excluding the PSUs. In 2016, the Company granted 0.9 million shares, had 0.4 million shares vest, and had forfeitures of 0.1 million shares, for a total unvested shares of 1.0 million shares as of December 31, 2016, excluding PSUs.
As of December 31, 2016, there were 11.2 million shares of common stock available for future issuance under the A&R 2014 Omnibus Incentive Plan.
During September 2015, pursuant to a Separation and Release Agreement (the “Separation and Release Agreement”), dated effective as of September 15, 2015, that the Company entered into with its former President and Chief Executive Officer in connection with his departure, the Company vested 0.3 million shares to him in accordance with the terms of the respective grants under the 2014 Omnibus Incentive Plan, and the Company incurred an associated non-cash severance charge of $3.0 million. In addition, pursuant to the benefits to which the Company’s former President and Chief Executive Officer was entitled under the Separation and Release Agreement, the Company made a cash severance payment of $7.6 million.
109
NOTE 17. EARNINGS PER SHARE
Basic earnings (loss) per share is computed by dividing net income (loss) available to common stockholders by the weighted average number of shares of common stock outstanding. Diluted earnings per share is computed by dividing net (loss) income available to common stockholders by the weighted average number of shares of the Company’s common stock outstanding plus other potentially dilutive securities. Dilutive securities include equity based awards issued under long-term incentive plans.
As discussed in Note 1, on April 14, 2014, the Company completed its IPO. For purposes of computing earnings per share, it is assumed that our IPO and ownership reorganization had occurred for all periods presented and therefore the outstanding shares have been adjusted to reflect the conversion of shares that took place in connection with the IPO. Accordingly, the denominators in the computations of basic and diluted net income per share reflect our IPO and ownership reorganization for all periods presented.
The calculations of basic and diluted (loss) earnings per share are as follows:
|
|
|
For the years ended December 31, |
|
|||||||||
|
|
|
2016 |
|
|
2015 |
|
|
2014 |
|
|||
|
|
|
(in thousands, except per share data) |
|
|||||||||
|
Numerator: |
|
|
|
|
|
|
|
|
|
|
|
|
|
(Loss) income from continuing operations attributable to La Quinta Holdings’ stockholders |
|
$ |
(1,288 |
) |
|
$ |
26,365 |
|
|
$ |
(336,794 |
) |
|
Loss from discontinued operations attributable to La Quinta Holdings’ stockholders |
|
|
— |
|
|
|
— |
|
|
|
(503 |
) |
|
Net (loss) income attributable to La Quinta Holdings’ stockholders |
|
$ |
(1,288 |
) |
|
$ |
26,365 |
|
|
$ |
(337,297 |
) |
|
Denominator: |
|
|
|
|
|
|
|
|
|
|
|
|
|
Weighted average number of shares outstanding, basic |
|
|
118,114 |
|
|
|
128,272 |
|
|
|
126,156 |
|
|
Weighted average number of shares outstanding, diluted |
|
|
118,114 |
|
|
|
129,172 |
|
|
|
126,156 |
|
|
(Loss) income from continuing operations attributable to La Quinta Holdings’ stockholders per common share, basic |
|
$ |
(0.01 |
) |
|
$ |
0.21 |
|
|
$ |
(2.67 |
) |
|
(Loss) Income from continuing operations attributable to La Quinta Holdings’ stockholders per common share, diluted |
|
$ |
(0.01 |
) |
|
$ |
0.20 |
|
|
$ |
(2.67 |
) |
|
Basic (loss) earnings per share |
|
$ |
(0.01 |
) |
|
$ |
0.21 |
|
|
$ |
(2.67 |
) |
|
Diluted (loss) earnings per share |
|
$ |
(0.01 |
) |
|
$ |
0.20 |
|
|
$ |
(2.67 |
) |
As of December 31, 2016, approximately 0.7 million shares were excluded from the computation of diluted shares, as their impact would have been anti-dilutive. As of December 31, 2015, an immaterial amount of shares were anti-dilutive. Approximately 0.8 million shares for the year ended December 31, 2014, were excluded from the computation of diluted shares, as their impact would have been anti-dilutive.
During March 2016, the Company's board of directors authorized a program to repurchase an aggregate of up to $100 million of the Company’s common stock (the “2016 Repurchase Program”). Under the Repurchase Program, these repurchases could be made from time to time in the open market, in privately negotiated transactions, or otherwise, including pursuant to a Rule 10b5-1 plan, at prices that the Company deemed appropriate and subject to market conditions, applicable law and other factors deemed relevant in the Company's sole discretion. The 2016 Repurchase Program did not obligate the Company to repurchase any dollar amount or number of shares of common stock and the program could be suspended or discontinued at any time.
The 2016 Repurchase Program was completed in May 2016. The Company repurchased 8.1 million shares of common stock at a weighted-average price of $12.27 per share, for an aggregate purchase price, including commissions, of $100.0 million. The shares repurchased through the 2016 Repurchase Program represented approximately 7.0% of the Company's total shares of common stock outstanding as of December 31, 2016. The shares of common stock that were repurchased were placed in treasury stock.
During September 2015, Company's board of directors authorized a program to repurchase an aggregate of up to $100 million of the Company’s common stock (the “2015 Repurchase Program”). These repurchases were to be made from time to time in the open market, in privately negotiated transactions, or otherwise, including pursuant to a Rule 10b5-1 plan, at prices that the Company deemed appropriate and subject to market conditions, applicable law and other factors deemed relevant in the Company's sole discretion. The 2015 Repurchase Program did not obligate the Company to repurchase any dollar amount or number of shares of common stock and the program could be suspended or discontinued at any time.
110
Under the 2015 Repurchase Program, through December 31, 2015, the Company repurchased 6.3 million shares of common stock. These shares were repurchased at a weighted-average price of $15.89 per share, for an aggregate purchase price including commissions, of $100.1 million. The shares repurchased through December 31, 2015 represented approximately 5% of the Company's total shares of common stock outstanding as of December 31, 2015. The shares of common stock that were repurchased were placed in treasury stock.
NOTE 18. SEGMENTS
Our operating segments are components of the business which are managed discretely and for which discrete financial information is reviewed regularly by our Chief Executive Officer, who is our chief operating decision maker, to assess performance and make decisions regarding the allocation of resources. Our operating and reportable segments are defined as follows:
|
|
• |
Owned hotels —This segment derives its earnings from the operation of owned hotel properties located in the United States. |
|
|
• |
Franchise and management —This segment derives its earnings primarily from revenues earned under various franchise and management agreements relating to our owned, franchised, and managed hotels, which provide for us to earn compensation for the licensing of our brand to franchisees, as well as for services rendered, such as hotel management and providing access to certain shared services and marketing programs such as reservations, Returns, and property management systems. |
Corporate and other includes revenues generated and operating expenses incurred in connection with the overall support and brand management of our owned, managed, and franchised hotels and operations.
The performance of our operating segments is evaluated primarily based upon Adjusted EBITDA, which should not be considered an alternative to net income (loss) or other measures of financial performance or liquidity derived in accordance with GAAP. We define Adjusted EBITDA as our net (loss) income (exclusive of noncontrolling interests) before interest expense, income tax expense (benefit), and depreciation and amortization, further adjusted to exclude certain items, including, but not limited to: gains, losses, and expenses in connection with: (i) asset dispositions; (ii) debt modifications/retirements; (iii) non-cash impairment charges; (iv) discontinued operations; (v) equity based compensation and (vi) other items.
The table below shows summarized consolidated financial information by segment:
|
|
|
For the years ended December 31, |
|
|||||||||
|
|
|
2016 |
|
|
2015 |
|
|
2014 |
|
|||
|
|
|
(in thousands) |
|
|||||||||
|
Revenues |
|
|
|
|
|
|
|
|
|
|
|
|
|
Owned hotels |
|
$ |
879,653 |
|
|
$ |
911,491 |
|
|
$ |
870,061 |
|
|
Franchise and management (1) |
|
|
116,806 |
|
|
|
114,610 |
|
|
|
94,002 |
|
|
Segment revenues |
|
|
996,459 |
|
|
|
1,026,101 |
|
|
|
964,063 |
|
|
Other fee-based revenues from franchise and managed properties |
|
|
25,150 |
|
|
|
23,204 |
|
|
|
21,481 |
|
|
Corporate and other (2) |
|
|
124,757 |
|
|
|
126,469 |
|
|
|
116,805 |
|
|
Intersegment elimination (3) |
|
|
(140,112 |
) |
|
|
(145,800 |
) |
|
|
(125,411 |
) |
|
Total revenues |
|
$ |
1,006,254 |
|
|
$ |
1,029,974 |
|
|
$ |
976,938 |
|
|
Adjusted EBITDA |
|
|
|
|
|
|
|
|
|
|
|
|
|
Owned hotels |
|
|
279,536 |
|
|
|
314,278 |
|
|
|
312,067 |
|
|
Franchise and management |
|
|
116,806 |
|
|
|
114,610 |
|
|
|
94,002 |
|
|
Segment Adjusted EBITDA |
|
|
396,342 |
|
|
|
428,888 |
|
|
|
406,069 |
|
|
Corporate and other |
|
|
(35,964 |
) |
|
|
(34,846 |
) |
|
|
(36,180 |
) |
|
Adjusted EBITDA |
|
$ |
360,378 |
|
|
$ |
394,042 |
|
|
$ |
369,889 |
|
|
(1) |
This segment includes intercompany fees which are charged to our owned hotels to reflect that certain functions, such as licensing and management, are included in the franchise and management segment. Prior to the IPO, we charged aggregate fees of 2.0% (0.33% license fees for trademark rights and 1.67% management fee for management services) to our owned hotels. In connection with the IPO, we entered into a new franchise agreement with our owned hotels, which covers certain services as well as trademark rights, and a new management agreement and terminated the existing agreements with our owned hotels. The new agreements, which commenced April 14, 2014, provide for a franchise fee of 4.5% of gross room revenues and a |
111
|
management fee of 2.5% of gross operating revenues for our owned hotels. Our consolidated financial information by segment for periods prior to April 14, 2014 presented herein reflects the historical aggregate fees of 2.0%. |
|
(2) |
Includes revenues related to our brand management programs and other cost reimbursements. The portions of these fees that are charged to our owned hotels, which totaled $71.5 million, $75.1 million and $68.4 million for the years ended December 31, 2016, 2015 and 2014, respectively, are eliminated in the accompanying consolidated financial statements. The franchise agreement we entered into with our owned hotels upon effectiveness of the IPO also includes a reservation fee of 2.0% of gross room revenues, which is reflected in corporate and other. |
|
(3) |
Includes management, license, franchise, BMF, Returns and other cost reimbursements totaling $140.1 million, $145.8 million and $125.4 million for the years ended December 31, 2016, 2015 and 2014, respectively. These fees are charged to owned hotels and are eliminated in the accompanying consolidated financial statements. |
The table below provides a reconciliation of Adjusted EBITDA to EBITDA and EBITDA to net income (loss) attributable to La Quinta Holdings’ stockholders for the years ended December 31, 2016, 2015 and 2014:
|
|
|
For the years ended December 31, |
|
|||||||||
|
|
|
2016 |
|
|
2015 |
|
|
2014 |
|
|||
|
|
|
(in thousands) |
|
|||||||||
|
Adjusted EBITDA |
|
$ |
360,378 |
|
|
$ |
394,042 |
|
|
$ |
369,889 |
|
|
Fixed asset impairment loss |
|
|
(104,258 |
) |
|
|
(50,121 |
) |
|
|
(5,308 |
) |
|
Loss from discontinued operations |
|
|
— |
|
|
|
— |
|
|
|
(377 |
) |
|
(Gain ) loss on sales |
|
|
4,908 |
|
|
|
(4,088 |
) |
|
|
— |
|
|
Loss on retirement of assets |
|
|
— |
|
|
|
(445 |
) |
|
|
(177 |
) |
|
Gain (loss) related to casualty disasters |
|
|
(3,051 |
) |
|
|
(1,824 |
) |
|
|
6,772 |
|
|
Loss on extinguishment of debt, net |
|
|
— |
|
|
|
— |
|
|
|
(2,030 |
) |
|
Equity based compensation |
|
|
(14,153 |
) |
|
|
(18,814 |
) |
|
|
(58,007 |
) |
|
Amortization of software service agreements (1) |
|
|
(9,050 |
) |
|
|
(8,343 |
) |
|
|
(7,258 |
) |
|
Severance charges (2) |
|
|
— |
|
|
|
(11,021 |
) |
|
|
— |
|
|
Other gains (losses), net (3) |
|
|
(5,722 |
) |
|
|
4,347 |
|
|
|
821 |
|
|
EBITDA |
|
|
229,052 |
|
|
|
303,733 |
|
|
|
304,325 |
|
|
Interest expense |
|
|
(81,666 |
) |
|
|
(86,614 |
) |
|
|
(120,994 |
) |
|
Income tax expense |
|
|
(493 |
) |
|
|
(22,487 |
) |
|
|
(28,805 |
) |
|
Recognition of net deferred tax liabilities upon C-corp conversion |
|
|
— |
|
|
|
— |
|
|
|
(321,054 |
) |
|
Depreciation and amortization |
|
|
(147,996 |
) |
|
|
(167,920 |
) |
|
|
(166,879 |
) |
|
Noncontrolling interests |
|
|
(185 |
) |
|
|
(347 |
) |
|
|
(3,890 |
) |
|
Net income (loss) attributable to the Company |
|
$ |
(1,288 |
) |
|
$ |
26,365 |
|
|
$ |
(337,297 |
) |
|
(1) |
We adopted ASU No. 2015-05 as of January 1, 2016. Accordingly, amortization of software service agreements in the amount of $8.3 million and $7.3 million, which was classified as depreciation and amortization for the years ended December 31, 2015 and 2014, respectively, has been reclassified to general and administrative in our consolidated statement of operations. See Note 2 for additional information. |
|
(2) |
Includes cash and non-cash charges relating to the departure of the Company’s former President and Chief Executive Officer. |
|
(3) |
Other gains (losses), net primarily consists of net income (loss) attributable to the BMF (which, over time, runs at a break-even level, but may reflect a profit or loss from period to period), insurance proceeds from business interruption and litigation reserve adjustments. |
The following table presents assets for our reportable segments, reconciled to consolidated amounts as of December 31, 2016, 2015 and 2014:
|
|
|
2016 |
|
|
2015 |
|
|
2014 |
|
|||
|
|
|
(in thousands) |
|
|||||||||
|
Total Assets |
|
|
|
|
|
|
|
|
|
|
|
|
|
Owned hotels |
|
$ |
2,499,770 |
|
|
$ |
2,682,394 |
|
|
$ |
2,874,098 |
|
|
Franchise and management |
|
|
198,832 |
|
|
|
192,284 |
|
|
|
191,410 |
|
|
Total segments assets |
|
|
2,698,602 |
|
|
|
2,874,678 |
|
|
|
3,065,508 |
|
|
Corporate and other |
|
|
193,921 |
|
|
|
111,166 |
|
|
|
114,265 |
|
|
Total |
|
$ |
2,892,523 |
|
|
$ |
2,985,844 |
|
|
$ |
3,179,773 |
|
112
The following table presents capital expenditures for our reportable segments, reconciled to our consolidated amounts:
|
|
|
For the years ended December 31, |
|
|||||||||
|
|
|
2016 |
|
|
2015 |
|
|
2014 |
|
|||
|
|
|
(in thousands) |
|
|||||||||
|
Owned hotels |
|
$ |
123,996 |
|
|
$ |
82,139 |
|
|
$ |
65,150 |
|
|
Franchise and management |
|
|
— |
|
|
|
— |
|
|
|
— |
|
|
Total segment capital expenditures |
|
|
123,996 |
|
|
|
82,139 |
|
|
|
65,150 |
|
|
Corporate and other (1) |
|
|
19,756 |
|
|
|
9,831 |
|
|
|
6,325 |
|
|
Total |
|
$ |
143,752 |
|
|
$ |
91,970 |
|
|
$ |
71,475 |
|
|
(1) |
We adopted ASU No. 2015-05 as of January 1, 2016. Accordingly, cash payments of software service agreements in the amounts of $8.8 million and $7.2 million, which were classified as capital expenditures in corporate and other for the years ended December 31, 2015 and 2014, respectively, are reclassified as a change in other current assets in our consolidated statement of cash flows. See Note 2 for additional information. |
NOTE 19. SELECTED QUARTERLY FINANCIAL INFORMATION (unaudited)
The following table sets forth the historical unaudited quarterly financial data for the periods indicated. The information for each of these periods has been prepared on the same basis as the audited consolidated financial statements and, in our opinion, reflects all adjustments necessary to present fairly our financial results. Operating results for previous periods do not necessarily indicate results that may be achieved in any future period.
|
|
|
2016 |
|
|||||||||||||||||
|
|
|
First Quarter |
|
|
Second Quarter |
|
|
Third Quarter |
|
|
Fourth Quarter |
|
|
Year |
|
|||||
|
|
|
(in thousands, except per share data) |
|
|||||||||||||||||
|
Total Revenues |
|
$ |
241,771 |
|
|
$ |
269,555 |
|
|
$ |
272,312 |
|
|
$ |
222,616 |
|
|
$ |
1,006,254 |
|
|
Operating (loss) income |
|
|
(45,520 |
) |
|
|
40,485 |
|
|
|
61,285 |
|
|
|
22,214 |
|
|
|
78,464 |
|
|
Net (loss) income |
|
|
(38,724 |
) |
|
|
14,918 |
|
|
|
22,684 |
|
|
|
19 |
|
|
|
(1,103 |
) |
|
Net (loss) income attributable to La Quinta Holdings’ stockholders |
|
|
(38,775 |
) |
|
|
14,849 |
|
|
|
22,666 |
|
|
|
(28 |
) |
|
|
(1,288 |
) |
|
Basic (loss) earnings per share |
|
$ |
(0.31 |
) |
|
$ |
0.13 |
|
|
$ |
0.20 |
|
|
$ |
— |
|
|
$ |
(0.01 |
) |
|
Diluted (loss) earnings per share |
|
$ |
(0.31 |
) |
|
$ |
0.13 |
|
|
$ |
0.20 |
|
|
$ |
— |
|
|
$ |
(0.01 |
) |
|
|
|
2015 |
|
|||||||||||||||||
|
|
|
First Quarter |
|
|
Second Quarter |
|
|
Third Quarter |
|
|
Fourth Quarter |
|
|
Year |
|
|||||
|
|
|
(in thousands, except per share data) |
|
|||||||||||||||||
|
Total Revenues |
|
$ |
248,106 |
|
|
$ |
273,888 |
|
|
$ |
279,103 |
|
|
$ |
228,877 |
|
|
$ |
1,029,974 |
|
|
Operating income |
|
|
32,913 |
|
|
|
15,177 |
|
|
|
52,740 |
|
|
|
27,241 |
|
|
|
128,071 |
|
|
Net income (loss) |
|
|
6,314 |
|
|
|
(4,567 |
) |
|
|
17,083 |
|
|
|
7,882 |
|
|
|
26,712 |
|
|
Net income (loss) attributable to La Quinta Holdings’ stockholders |
|
|
6,142 |
|
|
|
(4,663 |
) |
|
|
17,058 |
|
|
|
7,828 |
|
|
|
26,365 |
|
|
Basic earnings (loss) per share |
|
$ |
0.05 |
|
|
$ |
(0.04 |
) |
|
$ |
0.13 |
|
|
$ |
0.06 |
|
|
$ |
0.21 |
|
|
Diluted earnings (loss) per share |
|
$ |
0.05 |
|
|
$ |
(0.04 |
) |
|
$ |
0.13 |
|
|
$ |
0.06 |
|
|
$ |
0.20 |
|
113
None.
Disclosure Controls and Procedures
The Company maintains a set of disclosure controls and procedures as that term is defined in Rules 13a-15(e) and 15d-15(e) under the Exchange Act that are designed to ensure that information required to be disclosed by the Company in reports that it files or submits under the Exchange Act is recorded, processed, summarized and reported within the time periods specified in SEC rules and forms. The design of any disclosure controls and procedures is based in part upon certain assumptions about the likelihood of future events, and there can be no assurance that any design will succeed in achieving its stated goals under all potential future conditions. Any controls and procedures, no matter how well designed and operated, can provide only reasonable, not absolute, assurance of achieving the desired control objectives. In accordance with Rule 13a-15(b) of the Exchange Act, as of the end of the period covered by this Annual Report on Form 10-K, an evaluation was carried out under the supervision and with the participation of the Company’s management, including its Chief Executive Officer and Chief Financial Officer, of the effectiveness of its disclosure controls and procedures. Based on that evaluation, the Company’s Chief Executive Officer and Chief Financial Officer concluded that the Company’s disclosure controls and procedures, as of the end of the period covered by this annual report, were effective to provide reasonable assurance that information required to be disclosed by the Company in reports that it files or submits under the Exchange Act is recorded, processed, summarized and reported within the time periods specified in SEC rules and forms and is accumulated and communicated to the Company’s management, including the Chief Executive Officer and Chief Financial Officer, as appropriate to allow timely decisions regarding required disclosure.
Changes in Internal Control
There were no changes in the Company’s internal control over financial reporting (as defined in Rule 13a-15(f) of the Exchange Act) during the quarter ended December 31, 2016, that have materially affected, or are reasonably likely to materially affect, the Company’s internal control over financial reporting.
Management’s Annual Report on Internal Control over Financial Reporting
Management of the Company is responsible for establishing and maintaining adequate internal control over financial reporting (as defined in Rule 13a-15(f) of the Exchange Act). The Company’s internal control over financial reporting is a process designed to provide reasonable assurance regarding the reliability of financial reporting and the preparation of financial statements for external purposes in accordance with accounting principles generally accepted in the United States. Internal control over financial reporting includes those policies and procedures that:
|
|
i. |
pertain to the maintenance of records that in reasonable detail accurately and fairly reflect the transactions and dispositions of our assets; |
|
|
ii. |
provide reasonable assurance that the transactions are recorded as necessary to permit preparation of financial statements in accordance with generally accepted accounting principles, and that our receipts and expenditures are being made only in accordance with authorizations of management and our board of directors; and |
|
|
iii. |
provide reasonable assurance regarding prevention or timely detection of unauthorized acquisition, use or disposition of our assets that could have a material effect on our financial statements. |
Because of its inherent limitations, internal control over financial reporting may not prevent or detect misstatements. Therefore, even those systems determined to be effective can provide only reasonable assurance of achieving their control objectives. Also, projections of any evaluation of effectiveness to future periods are subject to the risk that controls may become inadequate due to changes in conditions, or that the degree of compliance with the policies or procedures may deteriorate.
Management, with the participation of the Company’s Chief Executive Officer and Chief Financial Officer, evaluated the effectiveness of the Company’s internal control over financial reporting as of December 31, 2016. In making this assessment, management used the criteria set forth by the Committee of Sponsoring Organizations of the Treadway Commission (COSO) in Internal Control - Integrated Framework (2013). Based on this evaluation, management concluded that, as of December 31, 2016, the Company’s internal control over financial reporting was effective.
Deloitte & Touche LLP, the independent registered public accounting firm who audited the Company’s Consolidated Financial Statements included in this Annual Report on Form 10-K, has issued an attestation report on the Company’s internal control over financial reporting as of December 31, 2016, which is included herein.
114
REPORT OF INDEPENDENT REGISTERED PUBLIC ACCOUNTING FIRM
To the Board of Directors and Stockholders of
La Quinta Holdings Inc.
Irving, Texas
We have audited the internal control over financial reporting of La Quinta Holdings Inc. and subsidiaries (the "Company") as of December 31, 2016, based on criteria established in Internal Control — Integrated Framework (2013) issued by the Committee of Sponsoring Organizations of the Treadway Commission. The Company's management is responsible for maintaining effective internal control over financial reporting and for its assessment of the effectiveness of internal control over financial reporting, included in the accompanying Management’s Annual Report on Internal Control Over Financial Reporting. Our responsibility is to express an opinion on the Company's internal control over financial reporting based on our audit.
We conducted our audit in accordance with the standards of the Public Company Accounting Oversight Board (United States). Those standards require that we plan and perform the audit to obtain reasonable assurance about whether effective internal control over financial reporting was maintained in all material respects. Our audit included obtaining an understanding of internal control over financial reporting, assessing the risk that a material weakness exists, testing and evaluating the design and operating effectiveness of internal control based on the assessed risk, and performing such other procedures as we considered necessary in the circumstances. We believe that our audit provides a reasonable basis for our opinion.
A company's internal control over financial reporting is a process designed by, or under the supervision of, the company's principal executive and principal financial officers, or persons performing similar functions, and effected by the company's board of directors, management, and other personnel to provide reasonable assurance regarding the reliability of financial reporting and the preparation of financial statements for external purposes in accordance with generally accepted accounting principles. A company's internal control over financial reporting includes those policies and procedures that (1) pertain to the maintenance of records that, in reasonable detail, accurately and fairly reflect the transactions and dispositions of the assets of the company; (2) provide reasonable assurance that transactions are recorded as necessary to permit preparation of financial statements in accordance with generally accepted accounting principles, and that receipts and expenditures of the company are being made only in accordance with authorizations of management and directors of the company; and (3) provide reasonable assurance regarding prevention or timely detection of unauthorized acquisition, use, or disposition of the company's assets that could have a material effect on the financial statements.
Because of the inherent limitations of internal control over financial reporting, including the possibility of collusion or improper management override of controls, material misstatements due to error or fraud may not be prevented or detected on a timely basis. Also, projections of any evaluation of the effectiveness of the internal control over financial reporting to future periods are subject to the risk that the controls may become inadequate because of changes in conditions, or that the degree of compliance with the policies or procedures may deteriorate.
In our opinion, the Company maintained, in all material respects, effective internal control over financial reporting as of December 31, 2016, based on the criteria established in Internal Control — Integrated Framework (2013) issued by the Committee of Sponsoring Organizations of the Treadway Commission.
We have also audited, in accordance with the standards of the Public Company Accounting Oversight Board (United States), the consolidated financial statements as of and for the year ended December 31, 2016 of the Company and our report dated February 28, 2017 expressed an unqualified opinion on those financial statements.
/s/ Deloitte & Touche LLP
Dallas, Texas
February 28, 2017
115
Pursuant to Section 219 of the Iran Threat Reduction and Syria Human Rights Act of 2012 (“ITRSHRA”), which added Section 13(r) of the Exchange Act, we hereby incorporate by reference herein Exhibit 99.1 of this report, which includes disclosures publicly filed and/or provided to Blackstone by Travelport Worldwide Limited and NCR Corporation, which may be considered our affiliates.
116
The information required by this item will be included in our definitive proxy statement for the 2017 Annual Meeting of Stockholders and is incorporated herein by reference. La Quinta Holdings Inc. will file such definitive proxy statement with the SEC pursuant to Regulation 14A within 120 days of the fiscal year ended December 31, 2016.
The information required by this item will be included in our definitive proxy statement for the 2017 Annual Meeting of Stockholders and is incorporated herein by reference. La Quinta Holdings Inc. will file such definitive proxy statement with the SEC pursuant to Regulation 14A within 120 days of the fiscal year ended December 31, 2016.
|
Item 12. |
Security Ownership of Certain Beneficial Owners and Management and Related Stockholder Matters |
EQUITY COMPENSATION PLAN INFORMATION
The following table sets forth, as of December 31, 2016, certain information related to our compensation plans under which shares of our common stock may be issued.
|
|
|
Number of securities to be issued upon exercise of outstanding options, warrants and rights (1) |
|
Weighted-average exercise price of outstanding options, warrants and rights |
|
Number of securities remaining available for future issuance under equity compensation plans(2) |
|
Equity compensation plans approved by shareholders: |
|
|
|
|
|
|
|
Amended and Restated 2014 Omnibus Incentive Plan |
|
1,239,164 |
|
N/A |
|
9,945,356 |
|
2015 Employee Stock Purchase Plan |
|
― |
|
N/A |
|
2,583,178 |
(1) Relates to 1,158,724 performance-vesting restricted stock units (assuming maximum performance for each of the performance measures) granted to our management in 2015 and 2016 and 80,440 time-vesting restricted stock units granted to our non-employee directors in 2014, 2015 and 2016 outstanding under our Amended and Restated 2014 Omnibus Incentive Plan.
(2) Relates to additional shares reserved for future awards under our Amended and Restated 2014 Omnibus Incentive Plan and our 2015 Employee Stock Purchase Plan, as applicable.
The remaining information required by this item will be included in our definitive proxy statement for the 2017 Annual Meeting of Stockholders and is incorporated herein by reference. La Quinta Holdings Inc. will file such definitive proxy statement with the SEC pursuant to Regulation 14A within 120 days of the fiscal year ended December 31, 2016.
The information required by this item will be included in our definitive proxy statement for the 2017 Annual Meeting of Stockholders and is incorporated herein by reference. La Quinta Holdings Inc. will file such definitive proxy statement with the SEC pursuant to Regulation 14A within 120 days of the fiscal year ended December 31, 2016.
The information required by this item will be included in our definitive proxy statement for the 2017 Annual Meeting of Stockholders and is incorporated herein by reference. La Quinta Holdings Inc. will file such definitive proxy statement with the SEC pursuant to Regulation 14A within 120 days of the fiscal year ended December 31, 2016.
117
The following documents are filed as part of this report.
|
|
(a) |
Financial Statements |
We include this portion of Item 15 under Item 8 of this Annual Report on Form 10-K.
|
|
(b) |
Financial Statement Schedules |
All schedules are omitted as the required information is either not present, not present in material amounts or presented within the audited financial statements or related notes.
|
|
(c) |
Exhibits: |
|
Exhibit Number |
|
Exhibit Description |
|
|
|
|
|
3.1 |
|
Amended and Restated Certificate of Incorporation of La Quinta Holdings Inc. (incorporated by reference to Exhibit 3.1 to the Registrant’s Current Report on Form 8-K filed on April 14, 2014 (File no. 001-36412)) |
|
|
|
|
|
3.2 |
|
Amended and Restated By-Laws of La Quinta Holdings Inc. (incorporated by reference to Exhibit 3.2 to the Registrant’s Current Report on Form 8-K filed on April 14, 2014 (File no. 001-36412)) |
|
|
|
|
|
10.1 |
|
Stockholders’ Agreement, dated as of April 14, 2014, by and among La Quinta Holdings Inc. and certain of its stockholders (incorporated by reference to Exhibit 10.1 to the Registrant’s Current Report on Form 8-K filed on April 14, 2014 (File no. 001-36412)) |
|
|
|
|
|
10.2 |
|
Registration Rights Agreement, dated as of April 14, 2014, by and among La Quinta Holdings Inc. and certain of its stockholders (incorporated by reference to Exhibit 10.2 to the Registrant’s Current Report on Form 8-K filed on April 14, 2014 (File no. 001-36412)) |
|
|
|
|
|
10.3* |
|
Amended and Restated Omnibus Incentive Plan (incorporated by reference to Exhibit 10.5 to the Registrant’s Quarterly Report on Form 10-Q for the quarter ended June 30, 2016 (File no. 001-36412)) |
|
|
|
|
|
10.4* |
|
Offer Letter, dated February 18, 2016, between La Quinta Holdings Inc. and Keith A. Cline (incorporated by reference to Exhibit 10.1 to the Registrant’s Current Report on Form 8-K filed on February 19, 2016 (File no. 001-36412)) |
|
|
|
|
|
10.5* |
|
Offer Letter, dated April 13, 2016, between La Quinta Holdings Inc. and John Cantele (incorporated by reference to Exhibit 10.1 to the Registrant’s Current Report on Form 8-K filed on April 14, 2016 (File no. 001-36412)) |
|
|
|
|
|
10.6* |
|
Amended and Restated Executive Employment Agreement, dated as of August 20, 2003, between Wyndham International, Inc. and Mark Chloupek (incorporated by reference to Exhibit 10.14 to the Registrant’s Registration Statement on Form S-1 (File no. 333-193860)) |
|
|
|
|
|
10.7* |
|
Assumption of Employment Agreement, dated as of October 31, 2013, by LQ Management L.L.C. (incorporated by reference to Exhibit 10.15 to the Registrant’s Registration Statement on Form S-1 (File no. 333-193860)) |
|
|
|
|
|
10.8* |
|
Separation and Consulting Agreement, dated April 14, 2016, between La Quinta Holdings Inc. and Angelo Lombardi (incorporated by reference to Exhibit 10.2 to the Registrant’s Current Report on Form 8-K filed on April 14, 2016 (File no. 001-36412) |
|
|
|
|
|
10.9 |
|
Credit Agreement, dated April 14, 2014, among La Quinta Holdings Inc., La Quinta Intermediate Holdings L.L.C., as borrower, the other guarantors party thereto from time to time, JPMorgan Chase Bank, N.A., as administrative agent, collateral agent, swing line lender and L/C lender, and the other lenders party thereto from time to time (incorporated by reference to Exhibit 10.9 to the Registrant’s Registration Statement on Form S-1 (File no. 333-193860)) |
|
|
|
|
|
10.10 |
|
Security Agreement, dated April 14, 2014, among the grantors identified therein and JPMorgan Chase Bank, N.A., as collateral agent (incorporated by reference to Exhibit 10.10 to the Registrant’s Registration Statement on Form S-1 (File no. 333-193860)) |
|
|
|
|
|
10.11* |
|
Form of Restricted Stock Grant Notice under the Omnibus Incentive Plan (incorporated by reference to Exhibit 10.12 to the Registrant’s Registration Statement on Form S-1 (File no. 333-193860)) |
|
|
|
|
|
10.12* |
|
Form of Performance Share Unit Agreement (incorporated by reference to Exhibit 10.1 to the Registrant’s Quarterly Report on Form 10-Q for the quarter ended September 30, 2014 (File no. 001-36412) |
|
|
|
|
118
|
Exhibit Number |
|
Exhibit Description |
|
10.13* |
|
Form of Restricted Stock Grant Notice (Retention Award) (incorporated by reference to Exhibit 10.2 to the Registrant’s Quarterly Report on Form 10-Q for the quarter ended September 30, 2014 (File no. 001-36412) |
|
|
|
|
|
10.14* |
|
Form of Restricted Stock Grant Notice (Time-Based Vesting Award) (incorporated by reference to Exhibit 10.3 to the Registrant’s Quarterly Report on Form 10-Q for the quarter ended September 30, 2014 (File no. 001-36412) |
|
|
|
|
|
10.15* |
|
Form of Restricted Stock Unit Grant Notice (incorporated by reference to Exhibit 10.4 to the Registrant’s Quarterly Report on Form 10-Q for the quarter ended September 30, 2014 (File no. 001-36412) |
|
|
|
|
|
10.16* |
|
Form of Restricted Stock Grant Notice (Time-Based Vesting Award) (incorporated by reference to Exhibit 10.4 to the Registrant’s Current Report on Form 10-Q for the quarter ended March 30, 2016 (File no. 001-36412)) |
|
|
|
|
|
10.17* |
|
Form of Performance Share Unit Agreement (incorporated by reference to Exhibit 10.5 to the Registrant’s Current Report on Form 10-Q for the quarter ended March 30, 2016 (File no. 001-36412)) |
|
|
|
|
|
10.18* |
|
Employee Stock Purchase Plan (incorporated by reference to Exhibit 4.3 to the Registrant’s Registration Statement on Form S-8 (File no. 333-204222) |
|
|
|
|
|
10.19* |
|
Form of Restricted Stock Grant Notice (Time-Based Vesting Award) |
|
|
|
|
|
10.20* |
|
Form of Director and Officer Indemnification Agreement (incorporated by reference to Exhibit 10.8 to the Registrant’s Registration Statement on Form S-1 (File no. 333-193860)) |
|
|
|
|
|
21.1 |
|
List of Subsidiaries |
|
|
|
|
|
23.1 |
|
Consent of Deloitte & Touche LLP as to La Quinta Holdings Inc. |
|
|
|
|
|
31.1 |
|
Certificate of Keith A. Cline, President and Chief Executive Officer, pursuant to Section 302 of the Sarbanes-Oxley Act of 2002 |
|
|
|
|
|
31.2 |
|
Certificate of James H. Forson, Executive Vice President and Chief Financial Officer pursuant to Section 302 of the Sarbanes-Oxley Act of 2002 |
|
|
|
|
|
32.1 |
|
Certificate of Keith A. Cline, President and Chief Executive Officer, pursuant to Section 18 U.S.C. Section 1350, as adopted pursuant to Section 906 of the Sarbanes-Oxley Act of 2002 (furnished herewith) |
|
|
|
|
|
32.2 |
|
Certificate of James H. Forson, Executive Vice President and Chief Financial Officer pursuant to Section 18 U.S.C. Section 1350, as adopted pursuant to Section 906 of the Sarbanes-Oxley Act of 2002 (furnished herewith) |
|
|
|
|
|
99.1 |
|
Section 13(r) Disclosure |
|
|
|
|
|
101.INS |
|
XBRL Instance Document |
|
|
|
|
|
101.SCH |
|
XBRL Taxonomy Extension Schema Document |
|
|
|
|
|
101.CAL |
|
XBRL Taxonomy Extension Calculation Linkbase Document |
|
|
|
|
|
101.DEF |
|
XBRL Taxonomy Extension Definition Linkbase Document |
|
|
|
|
|
101.LAB |
|
XBRL Taxonomy Extension Label Linkbase Document |
|
|
|
|
|
101.PRE |
|
XBRL Taxonomy Extension Presentation Linkbase Document |
|
* |
This document has been identified as a management contract or compensatory plan or arrangement. |
The agreements and other documents filed as exhibits to this report are not intended to provide factual information or other disclosure other than with respect to the terms of the agreements or other documents themselves, and you should not rely on them for that purpose. In particular, any representations and warranties made by us in these agreements or other documents were made solely within the specific context of the relevant agreement or document and may not describe the actual state of affairs as of the date they were made or at any other time.
None
119
Pursuant to the requirements of Section 13 or 15(d) of the Securities Exchange Act of 1934, the registrant has duly caused this report to be signed on its behalf by the undersigned, thereunto duly authorized, on the 28th day of February 2017.
|
|
|
|
|
LA QUINTA HOLDINGS INC. |
||
|
|
|
|
|
By: |
|
/s/ Keith A. Cline |
|
Name: |
|
Keith A. Cline |
|
Title: |
|
President and Chief Executive Officer |
Pursuant to the requirements of the Securities Act of 1934, this report has been signed below by the following persons on behalf of the registrant and in the capacities indicated on the 28th day of February 2017.
|
|
|
|
|
Signature |
|
Title |
|
|
|
|
|
/s/ Keith A. Cline |
|
President, Chief Executive Officer and Director |
|
Keith A. Cline |
|
(principal executive officer) |
|
|
|
|
|
/s/ James H. Forson |
|
Executive Vice President and Chief Financial Officer |
|
James H. Forson |
|
(principal financial and accounting officer) |
|
|
|
|
|
/s/ James R. Abrahamson |
|
Director |
|
James R. Abrahamson |
|
|
|
|
|
|
|
/s/ Glenn Alba |
|
Director |
|
Glenn Alba |
|
|
|
|
|
|
|
/s/ Scott O. Bergren |
|
Director |
|
Scott O. Bergren |
|
|
|
|
|
|
|
/s/ Alan J. Bowers |
|
Director |
|
Alan J. Bowers |
|
|
|
|
|
|
|
/s/ Henry G. Cisneros |
|
Director |
|
Henry G. Cisneros |
|
|
|
|
|
|
|
/s/ Giovanni Cutaia |
|
Director |
|
Giovanni Cutaia |
|
|
|
|
|
|
|
/s/ Brian Kim |
|
Director |
|
Brian Kim |
|
|
|
|
|
|
|
/s/ Mitesh B. Shah |
|
Director |
|
Mitesh B. Shah |
|
|
|
|
|
|
|
/s/ Gary M. Sumers |
|
Director |
|
Gary M. Sumers |
|
|
120