Attached files
| file | filename |
|---|---|
| 8-K - 8-K - CHC Group Ltd. | a8-k1.htm |
GO FURTHER. DO MORE. COME HOME SAFELY. Page 1 GO FURTHER. DO . E HOME SAFELY. CHC Helicopter is the operating company of CHC Group Ltd. (NYSE: HELI) Global Hunter Securities 1x1 Series CHC Helicopter Joan Hooper, CFO November 17, 2014 Lynn Antipas Tyson Vice President, Investor Relations lynn.tyson@chc.ca +1-914-485-1150
Page 2 GO FURTHER. DO MORE. COME HOME SAFELY. Forward-Looking Statements and non-GAAP Financial Measures This presentation contains forward-looking statements and information within the meaning of certain securities laws, including the “safe harbor” provision of the United States Private Securities Litigation Reform Act of 1995, the United States Securities Act of 1933, as amended, the United States Securities Exchange Act of 1934, as amended, and other applicable securities legislation. All statements, other than statements of historical fact included in this presentation regarding our strategy, future operations, projections, conclusions, forecasts, fiscal year 2015 guidance and other statements are “forward-looking statements“. While these forward-looking statements represent our best current judgment, actual results could differ materially from the conclusions, forecasts or projections contained in the forward-looking information. Certain material factors or assumptions were applied in drawing a conclusion or making a forecast or projection in the forward-looking information contained herein. Such factors include our ability to satisfy conditions to the final tranche of our ongoing preferred share financing transaction on the proposed terms and timeframe; the possibility that the transaction does not close when expected, or at all; the ability to realize the expected reduction of debt and interest expense from the transaction in the amounts or in the timeframe expected; competition in the markets we serve, our ability to secure and retain long-term support contracts, our ability to maintain standards of acceptable safety performance, political, economical, and regulatory uncertainty, problems with our non-wholly owned entities, including potential conflicts with the other owners of such entities, exposure to credit risks, ability to continue funding our working capital requirements, risks inherent in the operation of helicopters, unanticipated costs or cost increases associated with our business operations, exchange rate fluctuations, trade industry exposure, inflation, inability to obtain or maintain government issued licenses or related approvals, inability to obtain or maintain necessary aircraft or insurance, loss of key personnel, work stoppages due to labor disputes, and future material acquisitions or dispositions. Should one or more of these risks or uncertainties materialize, or should underlying assumptions prove incorrect, actual outcomes may vary materially from those indicated. The Company disclaims any intentions or obligations to update or revise any forward-looking information, whether as a result of new information, future events or otherwise. We make certain statements in this presentation that include references to “non-GAAP financial measures,” as defined by SEC regulations. We have provided reconciliations of these measures to what we believe are the most directly comparable GAAP measures, which are attached hereto within the appendix or footnoted. Adjusted EBITDAR excluding special items is referred to in this document as EBITDAR.
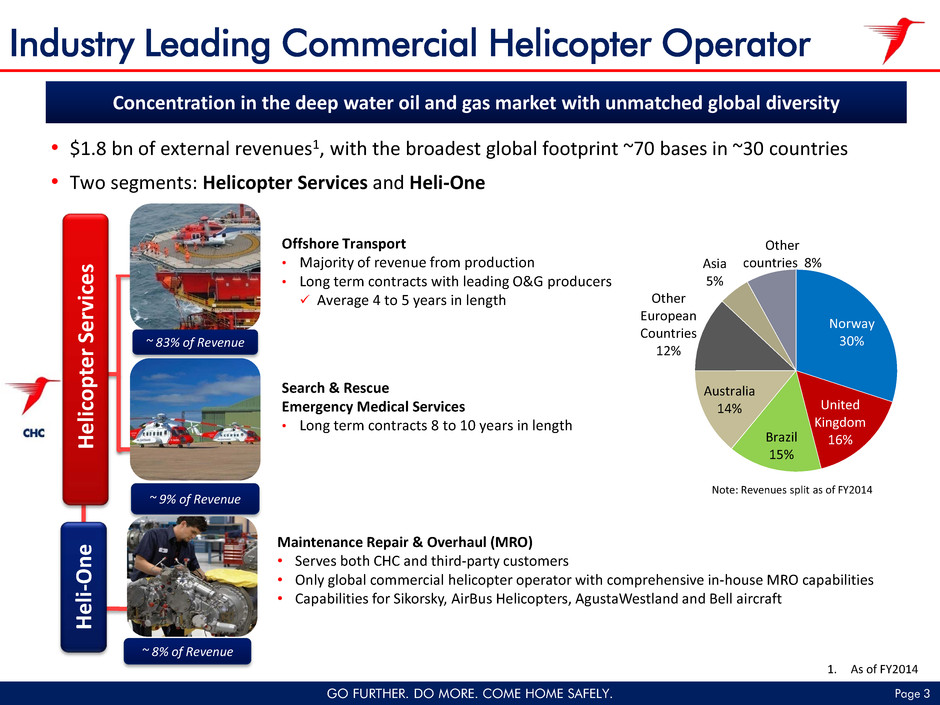
Page 3 GO FURTHER. DO MORE. COME HOME SAFELY. Industry Leading Commercial Helicopter Operator Search & Rescue Emergency Medical Services • Long term contracts 8 to 10 years in length H el ic op te r Se rv ic es H el i- O ne ~ 9% of Revenue ~ 8% of Revenue • $1.8 bn of external revenues1, with the broadest global footprint ~70 bases in ~30 countries • Two segments: Helicopter Services and Heli-One Note: Revenues split as of FY2014 Concentration in the deep water oil and gas market with unmatched global diversity 1. As of FY2014 ~ 83% of Revenue Offshore Transport • Majority of revenue from production • Long term contracts with leading O&G producers Average 4 to 5 years in length Maintenance Repair & Overhaul (MRO) • Serves both CHC and third-party customers • Only global commercial helicopter operator with comprehensive in-house MRO capabilities • Capabilities for Sikorsky, AirBus Helicopters, AgustaWestland and Bell aircraft Norway 30% United Kingdom 16% Brazil 15% Australia 14% Other European Countries 12% Asia 5% Other countries 8%
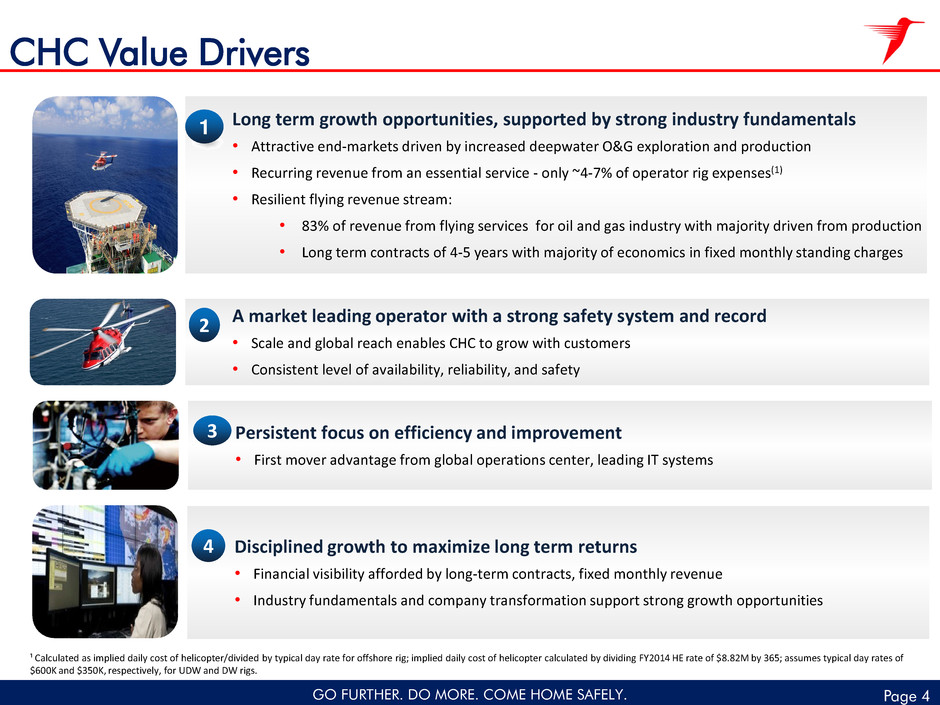
GO FURTHER. DO MORE. COME HOME SAFELY. Page 4 CHC Value Drivers A market leading operator with a strong safety system and record • Scale and global reach enables CHC to grow with customers • Consistent level of availability, reliability, and safety 2 Persistent focus on efficiency and improvement • First mover advantage from global operations center, leading IT systems 3 Long term growth opportunities, supported by strong industry fundamentals • Attractive end-markets driven by increased deepwater O&G exploration and production • Recurring revenue from an essential service - only ~4-7% of operator rig expenses(1) • Resilient flying revenue stream: • 83% of revenue from flying services for oil and gas industry with majority driven from production • Long term contracts of 4-5 years with majority of economics in fixed monthly standing charges 1 Disciplined growth to maximize long term returns • Financial visibility afforded by long-term contracts, fixed monthly revenue • Industry fundamentals and company transformation support strong growth opportunities 4 ¹ Calculated as implied daily cost of helicopter/divided by typical day rate for offshore rig; implied daily cost of helicopter calculated by dividing FY2014 HE rate of $8.82M by 365; assumes typical day rates of $600K and $350K, respectively, for UDW and DW rigs.
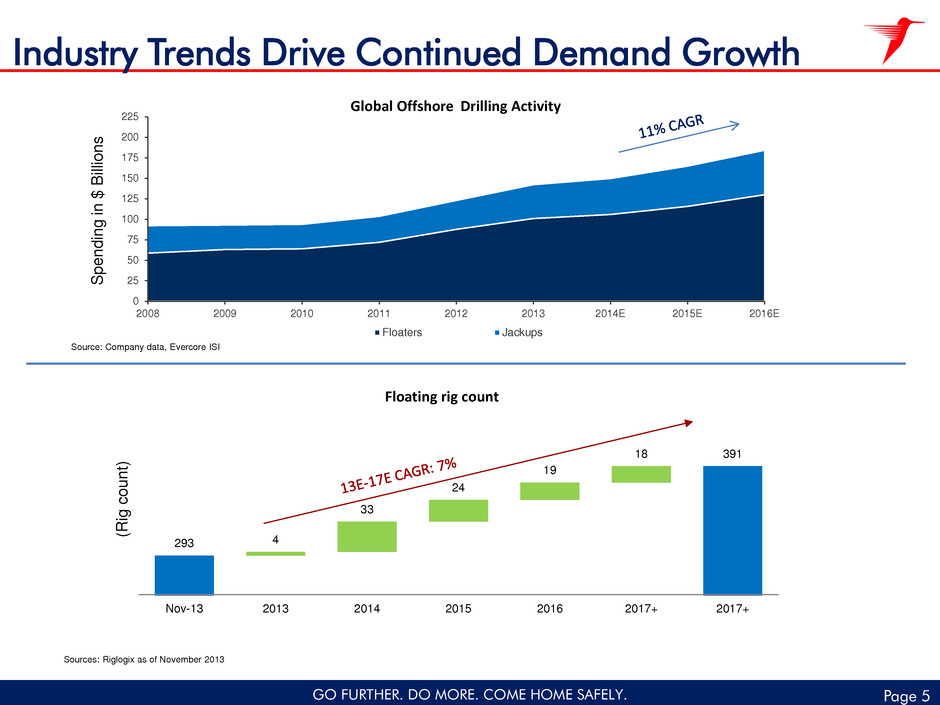
GO FURTHER. DO MORE. COME HOME SAFELY. Page 5 0 25 50 75 100 125 150 175 200 225 2008 2009 2010 2011 2012 2013 2014E 2015E 2016E Floaters Jackups Industry Trends Drive Continued Demand Growth Global Offshore Drilling Activity Source: Company data, Evercore ISI 293 4 33 24 19 18 391 Nov-13 2013 2014 2015 2016 2017+ 2017+ (R ig c ou nt ) Sources: Riglogix as of November 2013 Floating rig count S pe nd in g in $ B ill io ns
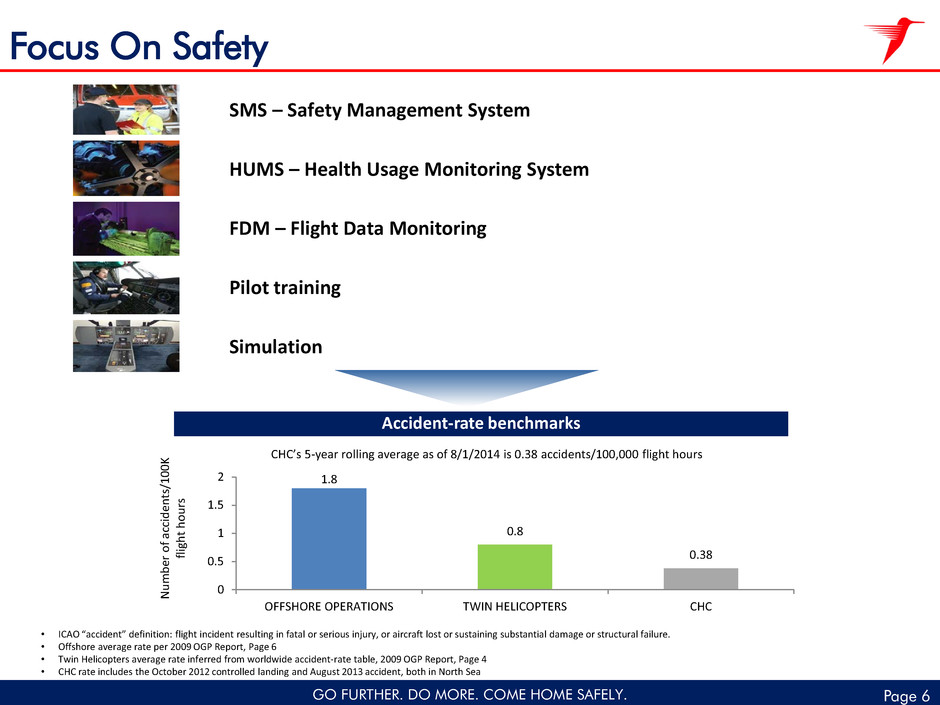
GO FURTHER. DO MORE. COME HOME SAFELY. Page 6 Focus On Safety • ICAO “accident” definition: flight incident resulting in fatal or serious injury, or aircraft lost or sustaining substantial damage or structural failure. • Offshore average rate per 2009 OGP Report, Page 6 • Twin Helicopters average rate inferred from worldwide accident-rate table, 2009 OGP Report, Page 4 • CHC rate includes the October 2012 controlled landing and August 2013 accident, both in North Sea CHC’s 5-year rolling average as of 8/1/2014 is 0.38 accidents/100,000 flight hours N um be r of a cc id en ts /1 00 K fli gh t ho ur s 1.8 0.8 0.38 0 0.5 1 1.5 2 OFFSHORE OPERATIONS TWIN HELICOPTERS CHC Accident-rate benchmarks SMS – Safety Management System HUMS – Health Usage Monitoring System FDM – Flight Data Monitoring Pilot training Simulation
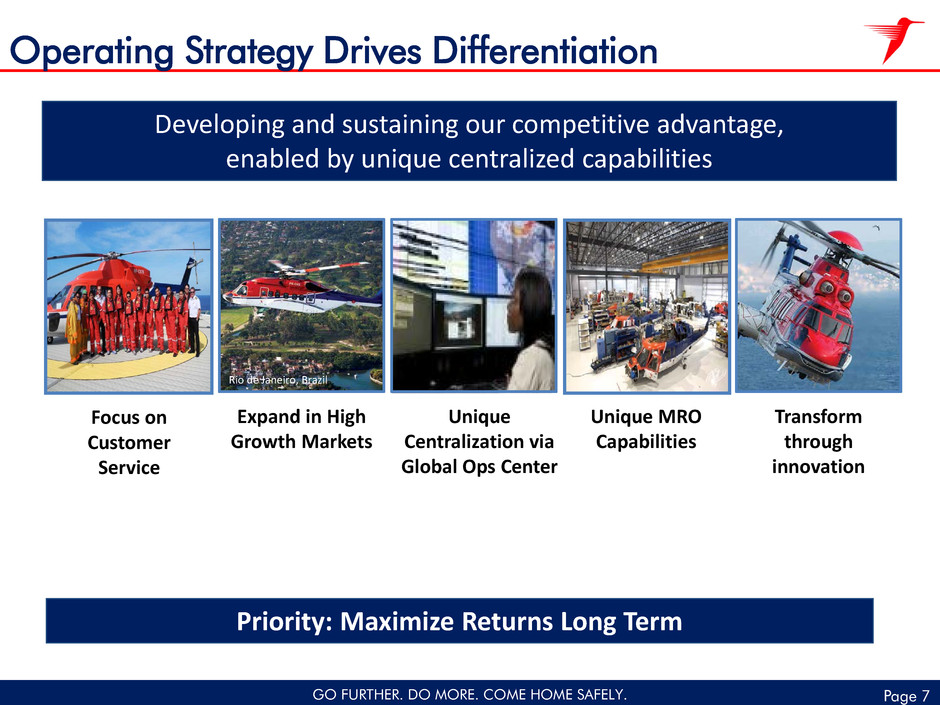
GO FURTHER. DO MORE. COME HOME SAFELY. Page 7 Operating Strategy Drives Differentiation Focus on Customer Service Expand in High Growth Markets Unique Centralization via Global Ops Center Unique MRO Capabilities Transform through innovation Developing and sustaining our competitive advantage, enabled by unique centralized capabilities Priority: Maximize Returns Long Term Rio de Janeiro, Brazil
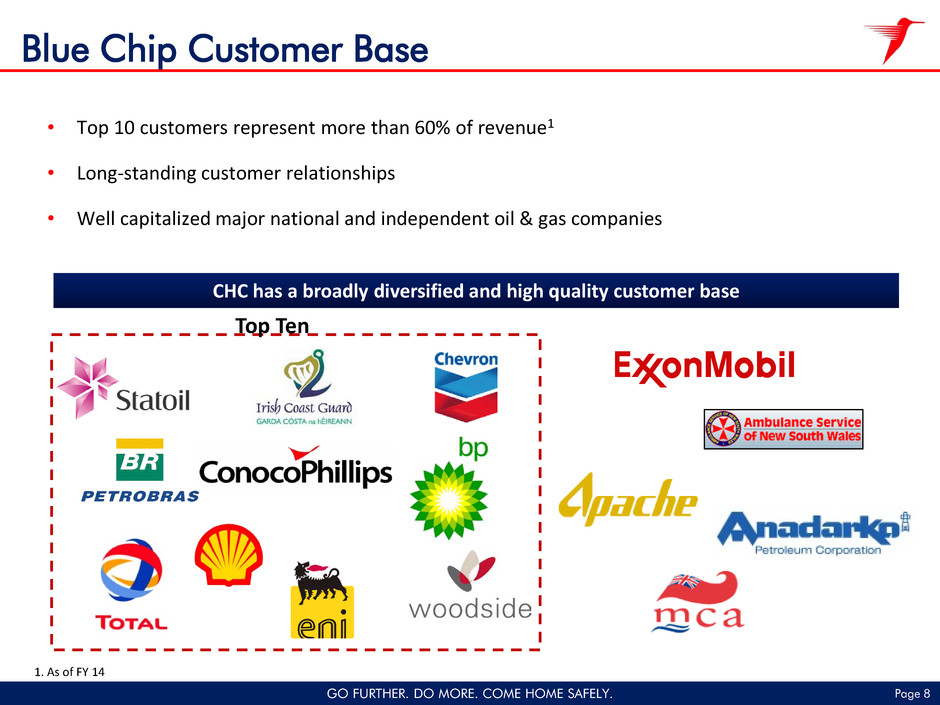
Page 8 GO FURTHER. DO MORE. COME HOME SAFELY. CHC has a broadly diversified and high quality customer base Blue Chip Customer Base • Top 10 customers represent more than 60% of revenue1 • Long-standing customer relationships • Well capitalized major national and independent oil & gas companies 1. As of FY 14 Top Ten
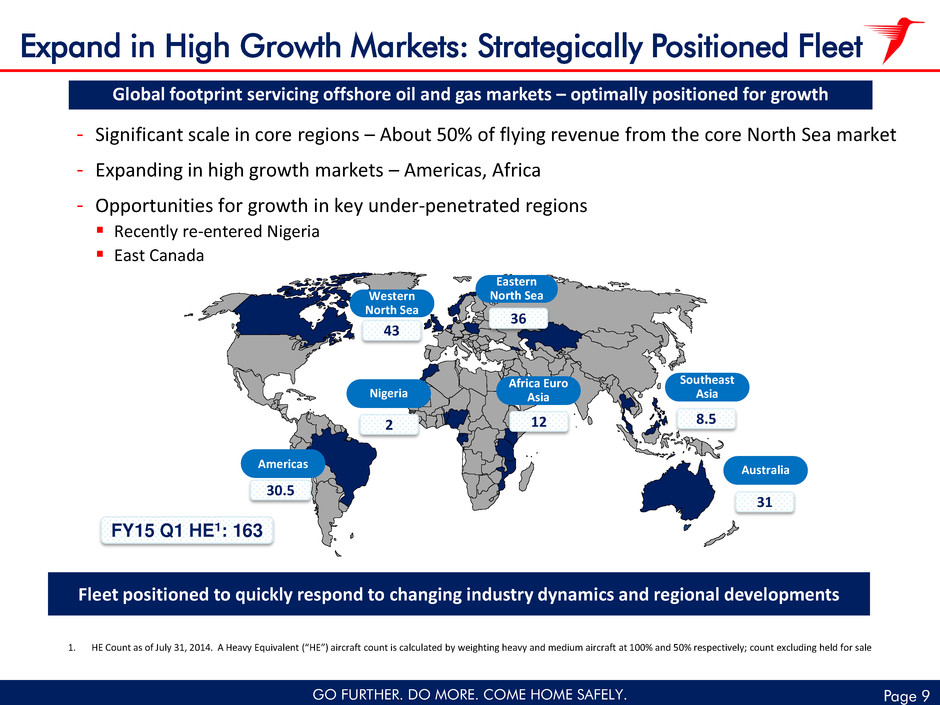
GO FURTHER. DO MORE. COME HOME SAFELY. Page 9 Expand in High Growth Markets: Strategically Positioned Fleet Eastern North Sea Western North Sea 12 8.5 43 36 Africa Euro Asia Southeast Asia Fleet positioned to quickly respond to changing industry dynamics and regional developments - Significant scale in core regions – About 50% of flying revenue from the core North Sea market - Expanding in high growth markets – Americas, Africa - Opportunities for growth in key under-penetrated regions Recently re-entered Nigeria East Canada Global footprint servicing offshore oil and gas markets – optimally positioned for growth 1. HE Count as of July 31, 2014. A Heavy Equivalent (“HE”) aircraft count is calculated by weighting heavy and medium aircraft at 100% and 50% respectively; count excluding held for sale FY15 Q1 HE1: 163 Americas 30.5 31 Australia 2 Nigeria
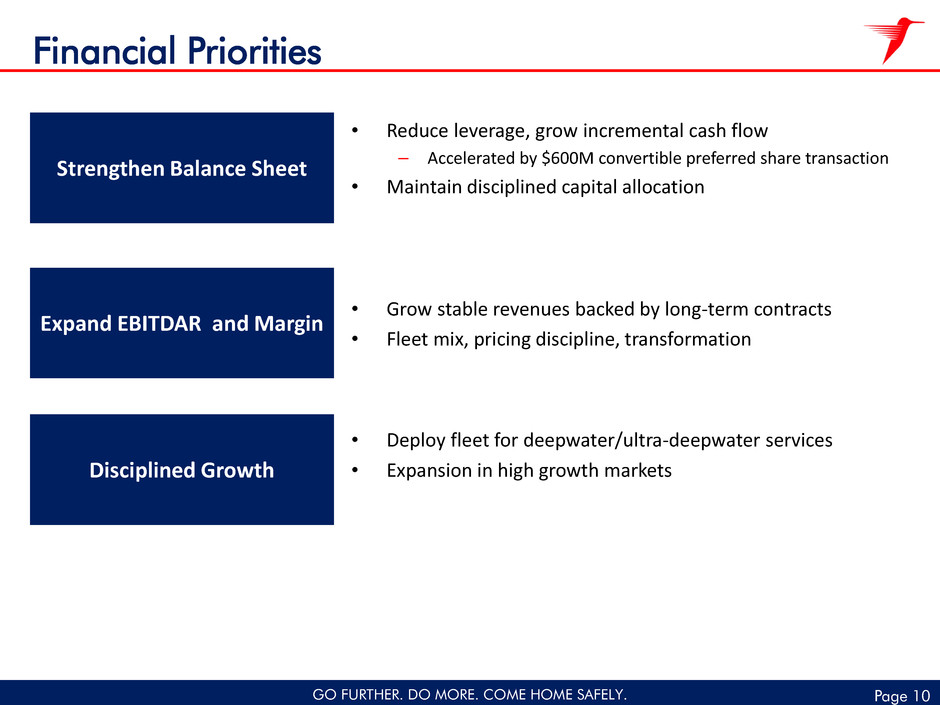
GO FURTHER. DO MORE. COME HOME SAFELY. Page 10 • Reduce leverage, grow incremental cash flow – Accelerated by $600M convertible preferred share transaction • Maintain disciplined capital allocation Disciplined Growth Strengthen Balance Sheet Disciplined Growth Expand EBITDAR and Margin • Deploy fleet for deepwater/ultra-deepwater services • Expansion in high growth markets • Grow stable revenues backed by long-term contracts • Fleet mix, pricing discipline, transformation Financial Priorities
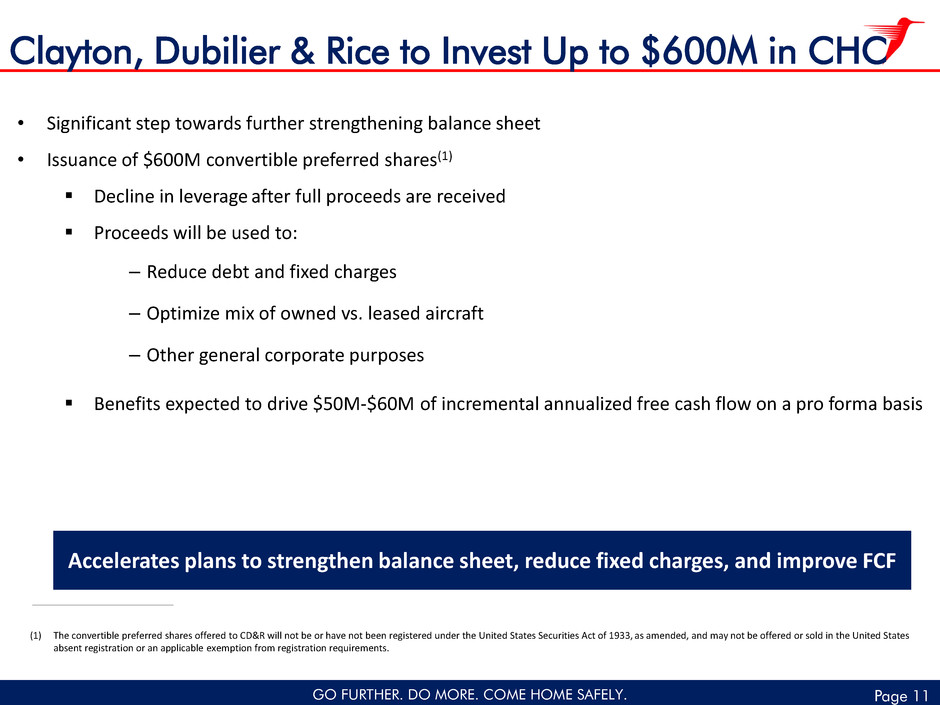
GO FURTHER. DO MORE. COME HOME SAFELY. Page 11 Clayton, Dubilier & Rice to Invest Up to $600M in CHC • Significant step towards further strengthening balance sheet • Issuance of $600M convertible preferred shares(1) Decline in leverage after full proceeds are received Proceeds will be used to: – Reduce debt and fixed charges – Optimize mix of owned vs. leased aircraft – Other general corporate purposes Benefits expected to drive $50M-$60M of incremental annualized free cash flow on a pro forma basis (1) The convertible preferred shares offered to CD&R will not be or have not been registered under the United States Securities Act of 1933, as amended, and may not be offered or sold in the United States absent registration or an applicable exemption from registration requirements. Accelerates plans to strengthen balance sheet, reduce fixed charges, and improve FCF
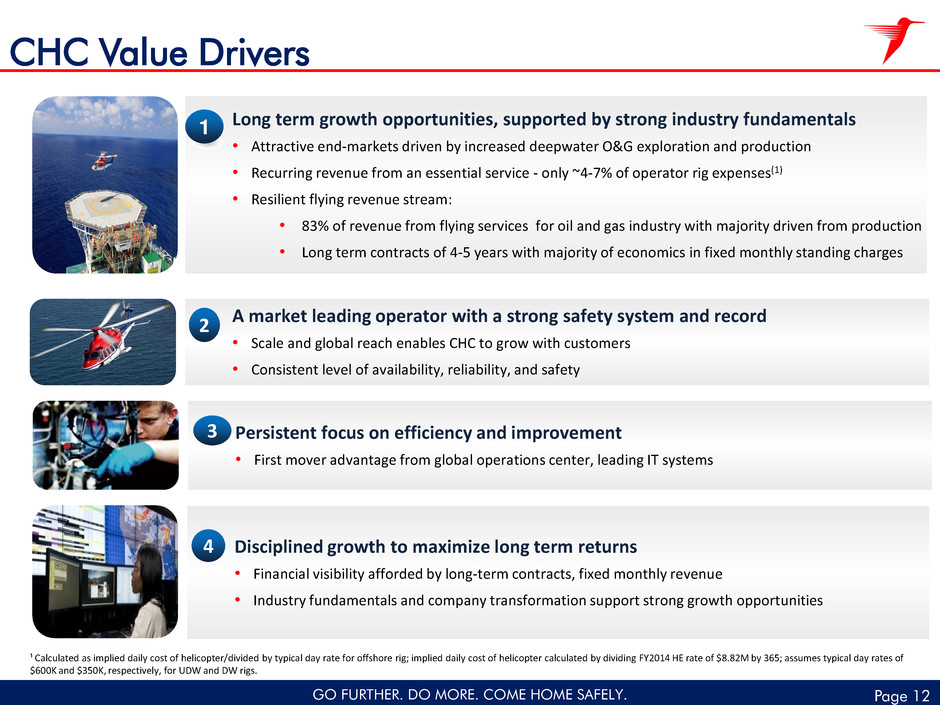
GO FURTHER. DO MORE. COME HOME SAFELY. Page 12 CHC Value Drivers A market leading operator with a strong safety system and record • Scale and global reach enables CHC to grow with customers • Consistent level of availability, reliability, and safety 2 Persistent focus on efficiency and improvement • First mover advantage from global operations center, leading IT systems 3 Long term growth opportunities, supported by strong industry fundamentals • Attractive end-markets driven by increased deepwater O&G exploration and production • Recurring revenue from an essential service - only ~4-7% of operator rig expenses(1) • Resilient flying revenue stream: • 83% of revenue from flying services for oil and gas industry with majority driven from production • Long term contracts of 4-5 years with majority of economics in fixed monthly standing charges 1 Disciplined growth to maximize long term returns • Financial visibility afforded by long-term contracts, fixed monthly revenue • Industry fundamentals and company transformation support strong growth opportunities 4 ¹ Calculated as implied daily cost of helicopter/divided by typical day rate for offshore rig; implied daily cost of helicopter calculated by dividing FY2014 HE rate of $8.82M by 365; assumes typical day rates of $600K and $350K, respectively, for UDW and DW rigs.
Page 13 GO FURTHER. DO MORE. COME HOME SAFELY. APPENDIX
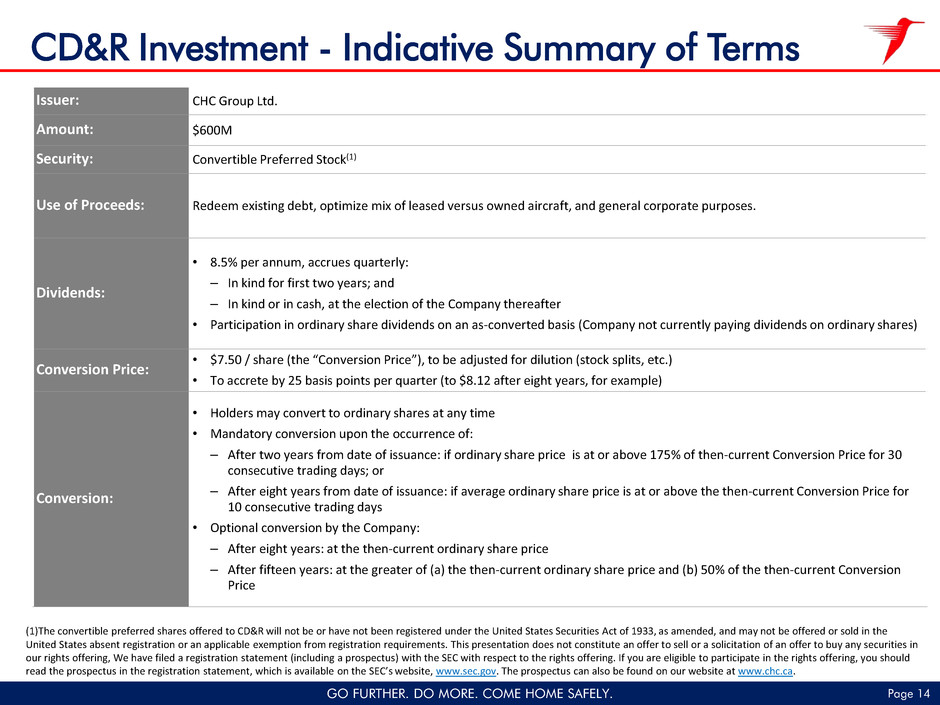
Page 14 GO FURTHER. DO MORE. COME HOME SAFELY. CD&R Investment - Indicative Summary of Terms Issuer: CHC Group Ltd. Amount: $600M Security: Convertible Preferred Stock(1) Use of Proceeds: Redeem existing debt, optimize mix of leased versus owned aircraft, and general corporate purposes. Dividends: • 8.5% per annum, accrues quarterly: – In kind for first two years; and – In kind or in cash, at the election of the Company thereafter • Participation in ordinary share dividends on an as-converted basis (Company not currently paying dividends on ordinary shares) Conversion Price: • $7.50 / share (the “Conversion Price”), to be adjusted for dilution (stock splits, etc.) • To accrete by 25 basis points per quarter (to $8.12 after eight years, for example) Conversion: • Holders may convert to ordinary shares at any time • Mandatory conversion upon the occurrence of: – After two years from date of issuance: if ordinary share price is at or above 175% of then-current Conversion Price for 30 consecutive trading days; or – After eight years from date of issuance: if average ordinary share price is at or above the then-current Conversion Price for 10 consecutive trading days • Optional conversion by the Company: – After eight years: at the then-current ordinary share price – After fifteen years: at the greater of (a) the then-current ordinary share price and (b) 50% of the then-current Conversion Price (1)The convertible preferred shares offered to CD&R will not be or have not been registered under the United States Securities Act of 1933, as amended, and may not be offered or sold in the United States absent registration or an applicable exemption from registration requirements. This presentation does not constitute an offer to sell or a solicitation of an offer to buy any securities in our rights offering, We have filed a registration statement (including a prospectus) with the SEC with respect to the rights offering. If you are eligible to participate in the rights offering, you should read the prospectus in the registration statement, which is available on the SEC’s website, www.sec.gov. The prospectus can also be found on our website at www.chc.ca.
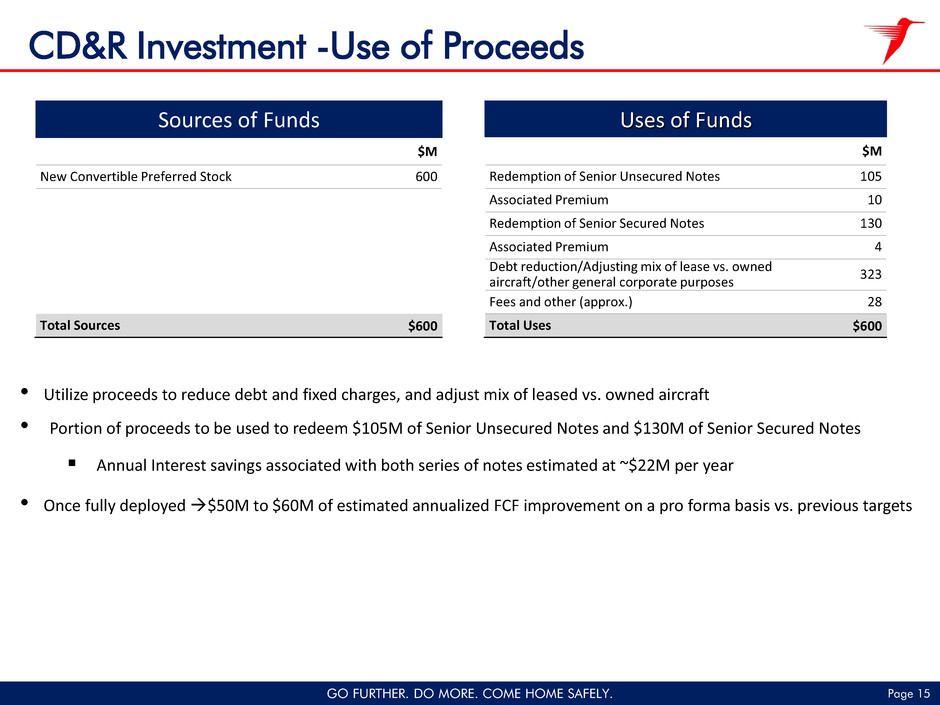
Page 15 GO FURTHER. DO MORE. COME HOME SAFELY. CD&R Investment -Use of Proceeds • Utilize proceeds to reduce debt and fixed charges, and adjust mix of leased vs. owned aircraft • Portion of proceeds to be used to redeem $105M of Senior Unsecured Notes and $130M of Senior Secured Notes Annual Interest savings associated with both series of notes estimated at ~$22M per year • Once fully deployed $50M to $60M of estimated annualized FCF improvement on a pro forma basis vs. previous targets Uses of Funds Sources of Funds $M New Convertible Preferred Stock 600 Total Sources $600 $M Redemption of Senior Unsecured Notes 105 Associated Premium 10 Redemption of Senior Secured Notes 130 Associated Premium 4 Debt reduction/Adjusting mix of lease vs. owned aircraft/other general corporate purposes 323 Fees and other (approx.) 28 Total Uses $600
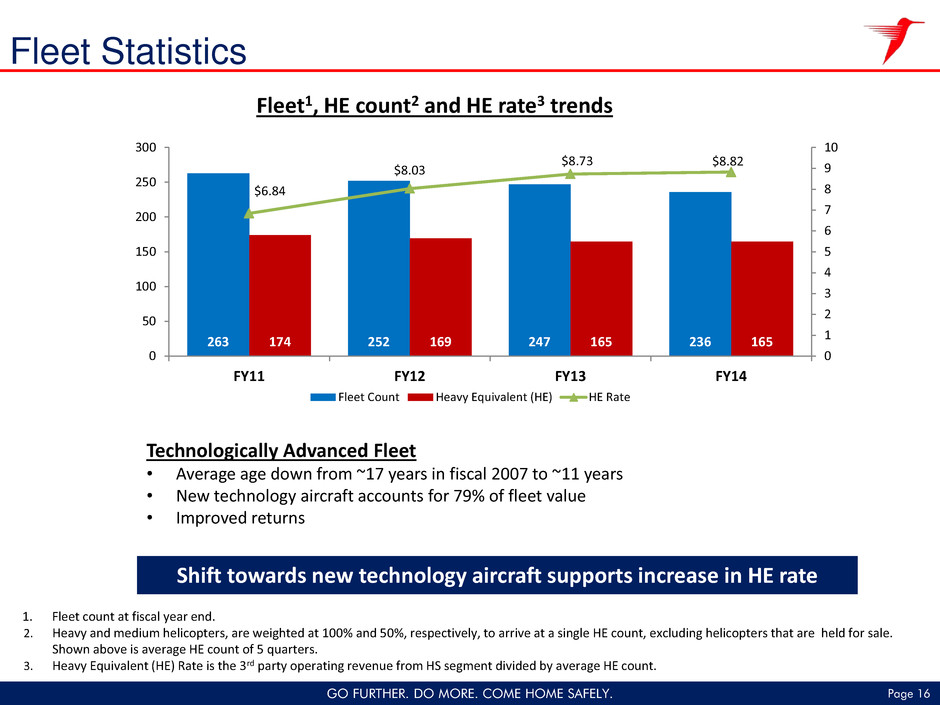
Page 16 GO FURTHER. DO MORE. COME HOME SAFELY. Fleet1, HE count2 and HE rate3 trends Fleet Statistics Technologically Advanced Fleet • Average age down from ~17 years in fiscal 2007 to ~11 years • New technology aircraft accounts for 79% of fleet value • Improved returns 263 252 247 236 174 169 165 165 $6.84 $8.03 $8.73 $8.82 0 1 2 3 4 5 6 7 8 9 10 0 50 100 150 200 250 300 FY11 FY12 FY13 FY14 Fleet Count Heavy Equivalent (HE) HE Rate 1. Fleet count at fiscal year end. 2. Heavy and medium helicopters, are weighted at 100% and 50%, respectively, to arrive at a single HE count, excluding helicopters that are held for sale. Shown above is average HE count of 5 quarters. 3. Heavy Equivalent (HE) Rate is the 3rd party operating revenue from HS segment divided by average HE count. Shift towards new technology aircraft supports increase in HE rate
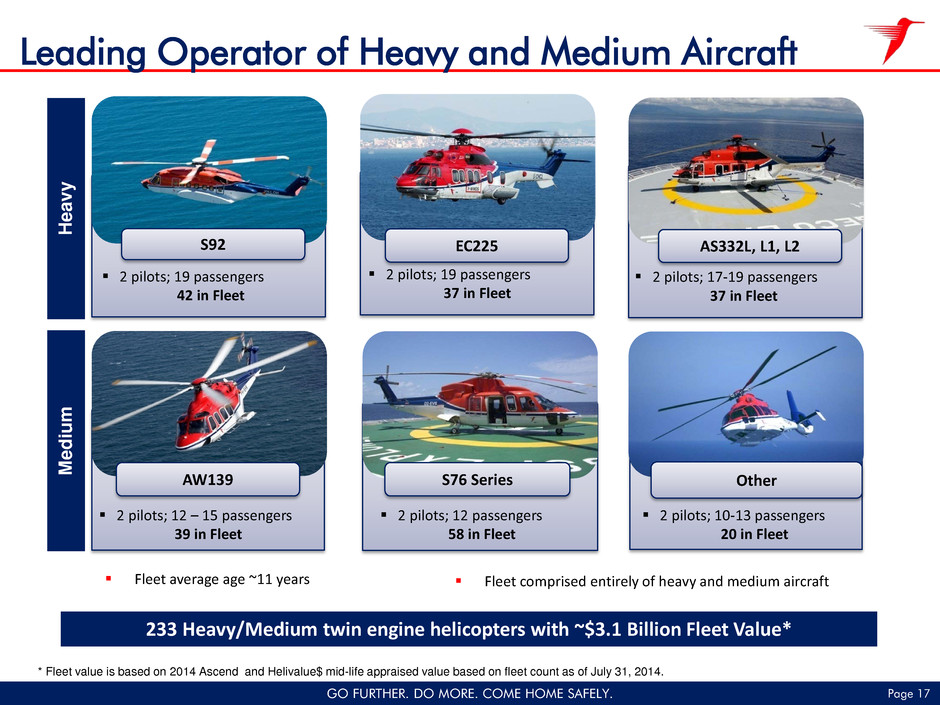
Page 17 GO FURTHER. DO MORE. COME HOME SAFELY. 2 pilots; 12 – 15 passengers 39 in Fleet 2 pilots; 10-13 passengers 20 in Fleet Other S92 2 pilots; 19 passengers 42 in Fleet EC225 2 pilots; 19 passengers 37 in Fleet S76 Series 2 pilots; 12 passengers 58 in Fleet AS332L, L1, L2 2 pilots; 17-19 passengers 37 in Fleet 233 Heavy/Medium twin engine helicopters with ~$3.1 Billion Fleet Value* Fleet average age ~11 years * Fleet value is based on 2014 Ascend and Helivalue$ mid-life appraised value based on fleet count as of July 31, 2014. AW139 H ea vy M ed iu m Fleet comprised entirely of heavy and medium aircraft Leading Operator of Heavy and Medium Aircraft
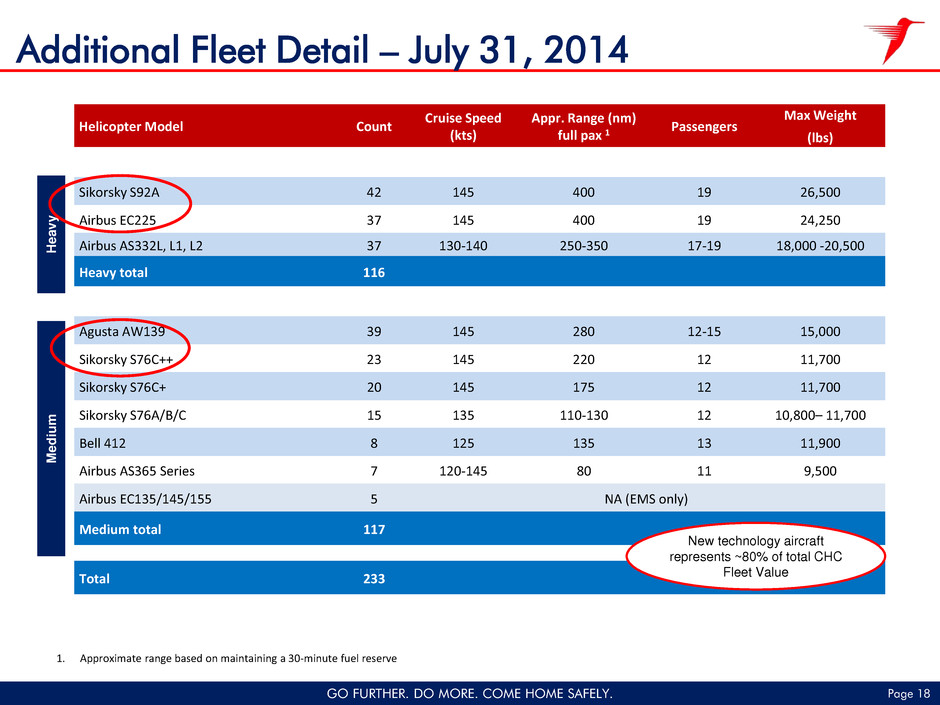
Page 18 GO FURTHER. DO MORE. COME HOME SAFELY. Additional Fleet Detail – July 31, 2014 1. Approximate range based on maintaining a 30-minute fuel reserve Helicopter Model Count Cruise Speed (kts) Appr. Range (nm) full pax 1 Passengers Max Weight (lbs) Sikorsky S92A 42 145 400 19 26,500 Airbus EC225 37 145 400 19 24,250 Airbus AS332L, L1, L2 37 130-140 250-350 17-19 18,000 -20,500 Heavy total 116 Agusta AW139 39 145 280 12-15 15,000 Sikorsky S76C++ 23 145 220 12 11,700 Sikorsky S76C+ 20 145 175 12 11,700 Sikorsky S76A/B/C 15 135 110-130 12 10,800– 11,700 Bell 412 8 125 135 13 11,900 Airbus AS365 Series 7 120-145 80 11 9,500 Airbus EC135/145/155 5 NA (EMS only) Medium total 117 Total 233 H ea vy M ed iu m New technology aircraft represents ~80% of total CHC Fleet Value
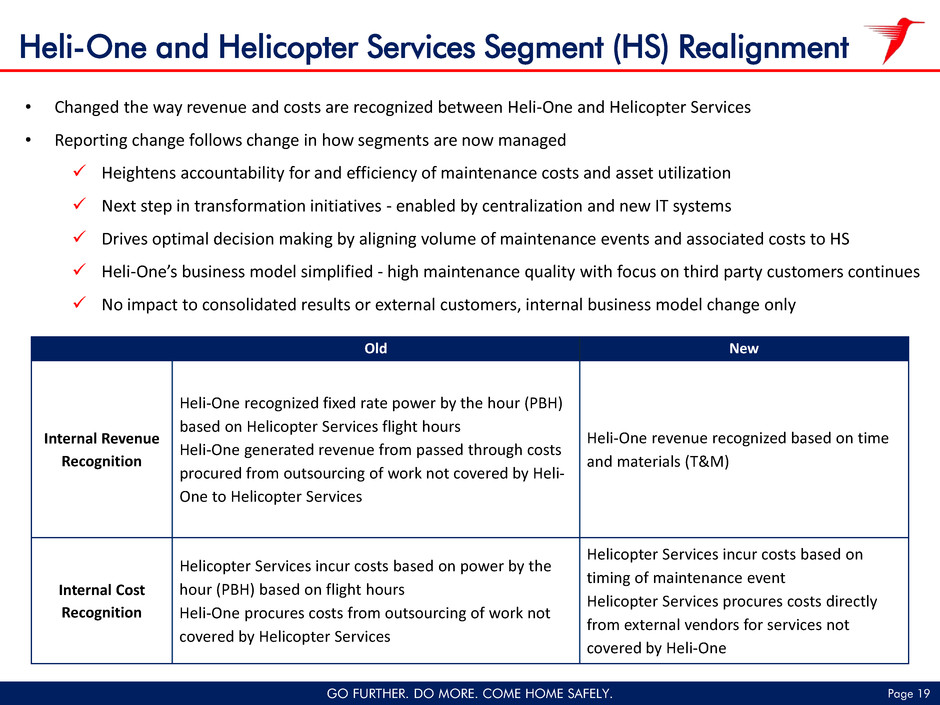
Page 19 GO FURTHER. DO MORE. COME HOME SAFELY. Heli-One and Helicopter Services Segment (HS) Realignment Old New Internal Revenue Recognition Heli-One recognized fixed rate power by the hour (PBH) based on Helicopter Services flight hours Heli-One generated revenue from passed through costs procured from outsourcing of work not covered by Heli- One to Helicopter Services Heli-One revenue recognized based on time and materials (T&M) Internal Cost Recognition Helicopter Services incur costs based on power by the hour (PBH) based on flight hours Heli-One procures costs from outsourcing of work not covered by Helicopter Services Helicopter Services incur costs based on timing of maintenance event Helicopter Services procures costs directly from external vendors for services not covered by Heli-One • Changed the way revenue and costs are recognized between Heli-One and Helicopter Services • Reporting change follows change in how segments are now managed Heightens accountability for and efficiency of maintenance costs and asset utilization Next step in transformation initiatives - enabled by centralization and new IT systems Drives optimal decision making by aligning volume of maintenance events and associated costs to HS Heli-One’s business model simplified - high maintenance quality with focus on third party customers continues No impact to consolidated results or external customers, internal business model change only
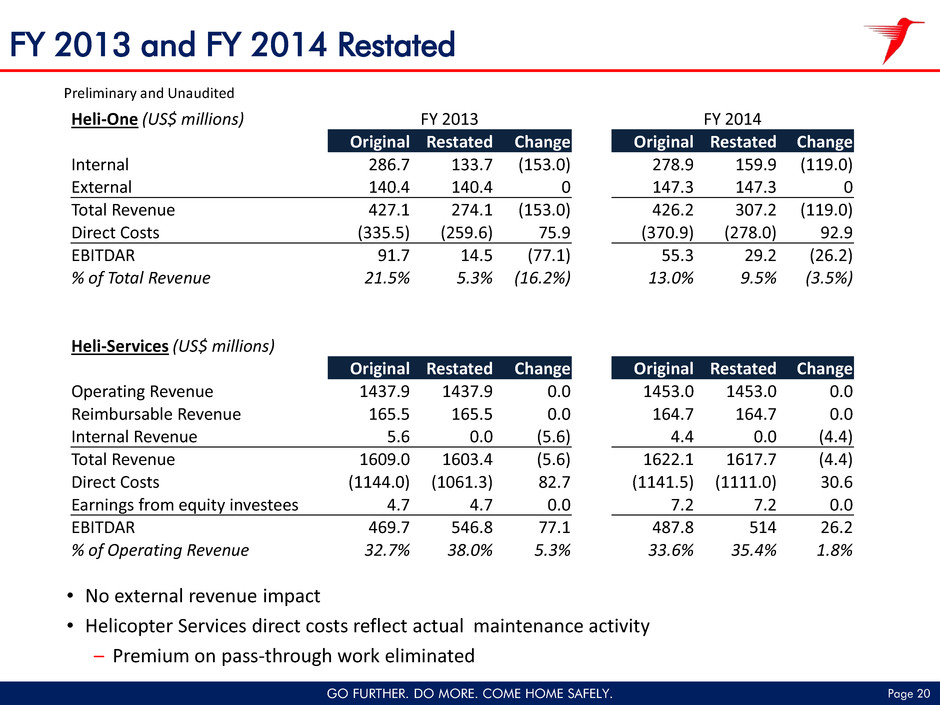
Page 20 GO FURTHER. DO MORE. COME HOME SAFELY. FY 2013 and FY 2014 Restated • No external revenue impact • Helicopter Services direct costs reflect actual maintenance activity – Premium on pass-through work eliminated Preliminary and Unaudited Heli-One (US$ millions) FY 2013 FY 2014 Original Restated Change Original Restated Change Internal 286.7 133.7 (153.0) 278.9 159.9 (119.0) External 140.4 140.4 0 147.3 147.3 0 Total Revenue 427.1 274.1 (153.0) 426.2 307.2 (119.0) Direct Costs (335.5) (259.6) 75.9 (370.9) (278.0) 92.9 EBITDAR 91.7 14.5 (77.1) 55.3 29.2 (26.2) % of Total Revenue 21.5% 5.3% (16.2%) 13.0% 9.5% (3.5%) Heli-Services (US$ millions) Original Restated Change Original Restated Change Operating Revenue 1437.9 1437.9 0.0 1453.0 1453.0 0.0 Reimbursable Revenue 165.5 165.5 0.0 164.7 164.7 0.0 Internal Revenue 5.6 0.0 (5.6) 4.4 0.0 (4.4) Total Revenue 1609.0 1603.4 (5.6) 1622.1 1617.7 (4.4) Direct Costs (1144.0) (1061.3) 82.7 (1141.5) (1111.0) 30.6 Earnings from equity investees 4.7 4.7 0.0 7.2 7.2 0.0 EBITDAR 469.7 546.8 77.1 487.8 514 26.2 % of Operating Revenue 32.7% 38.0% 5.3% 33.6% 35.4% 1.8%
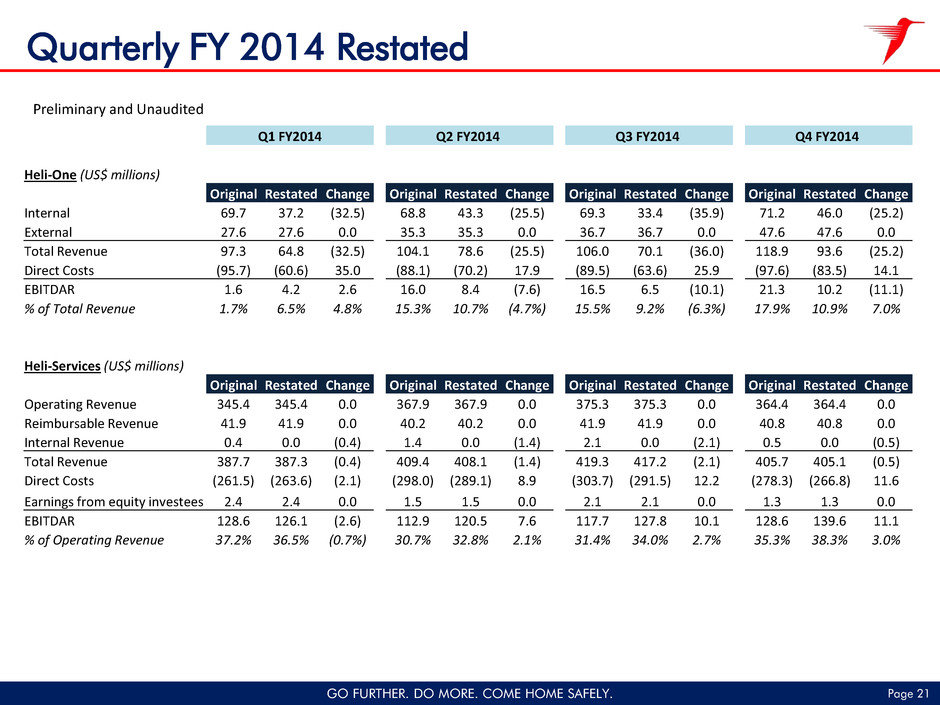
Page 21 GO FURTHER. DO MORE. COME HOME SAFELY. Quarterly FY 2014 Restated Preliminary and Unaudited Q1 FY2014 Q2 FY2014 Q3 FY2014 Q4 FY2014 Heli-One (US$ millions) Original Restated Change Original Restated Change Original Restated Change Original Restated Change Internal 69.7 37.2 (32.5) 68.8 43.3 (25.5) 69.3 33.4 (35.9) 71.2 46.0 (25.2) External 27.6 27.6 0.0 35.3 35.3 0.0 36.7 36.7 0.0 47.6 47.6 0.0 Total Revenue 97.3 64.8 (32.5) 104.1 78.6 (25.5) 106.0 70.1 (36.0) 118.9 93.6 (25.2) Direct Costs (95.7) (60.6) 35.0 (88.1) (70.2) 17.9 (89.5) (63.6) 25.9 (97.6) (83.5) 14.1 EBITDAR 1.6 4.2 2.6 16.0 8.4 (7.6) 16.5 6.5 (10.1) 21.3 10.2 (11.1) % of Total Revenue 1.7% 6.5% 4.8% 15.3% 10.7% (4.7%) 15.5% 9.2% (6.3%) 17.9% 10.9% 7.0% Heli-Services (US$ millions) Original Restated Change Original Restated Change Original Restated Change Original Restated Change Operating Revenue 345.4 345.4 0.0 367.9 367.9 0.0 375.3 375.3 0.0 364.4 364.4 0.0 Reimbursable Revenue 41.9 41.9 0.0 40.2 40.2 0.0 41.9 41.9 0.0 40.8 40.8 0.0 Internal Revenue 0.4 0.0 (0.4) 1.4 0.0 (1.4) 2.1 0.0 (2.1) 0.5 0.0 (0.5) Total Revenue 387.7 387.3 (0.4) 409.4 408.1 (1.4) 419.3 417.2 (2.1) 405.7 405.1 (0.5) Direct Costs (261.5) (263.6) (2.1) (298.0) (289.1) 8.9 (303.7) (291.5) 12.2 (278.3) (266.8) 11.6 Earnings from equity investees 2.4 2.4 0.0 1.5 1.5 0.0 2.1 2.1 0.0 1.3 1.3 0.0 EBITDAR 128.6 126.1 (2.6) 112.9 120.5 7.6 117.7 127.8 10.1 128.6 139.6 11.1 % of Operating Revenue 37.2% 36.5% (0.7%) 30.7% 32.8% 2.1% 31.4% 34.0% 2.7% 35.3% 38.3% 3.0%
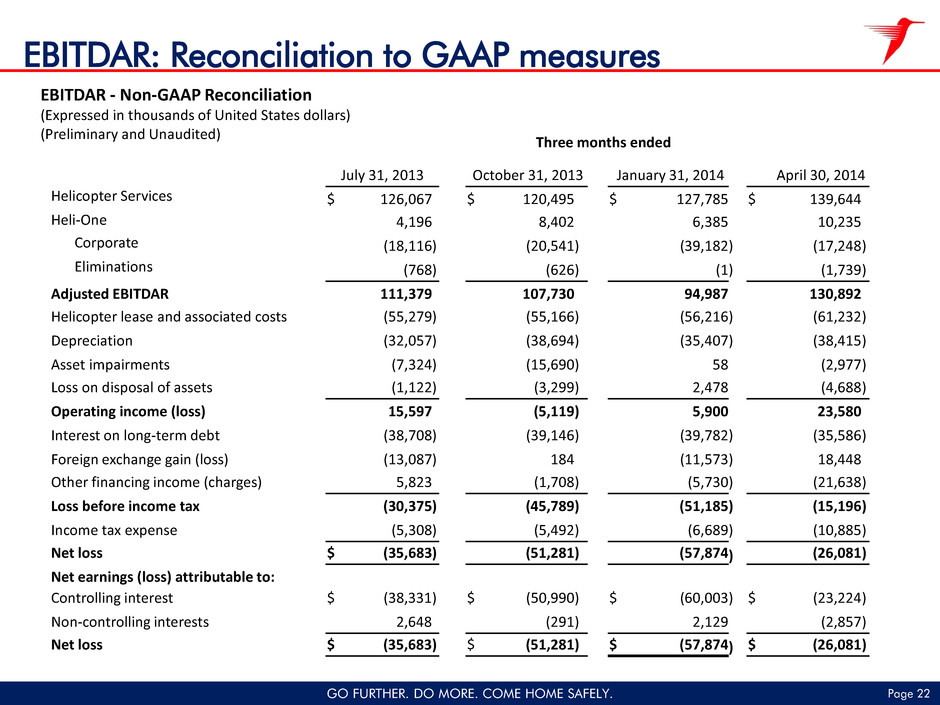
Page 22 GO FURTHER. DO MORE. COME HOME SAFELY. Three months ended July 31, 2013 October 31, 2013 January 31, 2014 April 30, 2014 Helicopter Services $ 126,067 $ 120,495 $ 127,785 $ 139,644 Heli-One 4,196 8,402 6,385 10,235 Corporate (18,116 ) (20,541 ) (39,182 ) (17,248 ) Eliminations (768 ) (626 ) (1 ) (1,739 ) Adjusted EBITDAR 111,379 107,730 94,987 130,892 Helicopter lease and associated costs (55,279 ) (55,166 ) (56,216 ) (61,232 ) Depreciation (32,057 ) (38,694 ) (35,407 ) (38,415 ) Asset impairments (7,324 ) (15,690 ) 58 (2,977 ) Loss on disposal of assets (1,122 ) (3,299 ) 2,478 (4,688 ) Operating income (loss) 15,597 (5,119 ) 5,900 23,580 Interest on long-term debt (38,708 ) (39,146 ) (39,782 ) (35,586 ) Foreign exchange gain (loss) (13,087 ) 184 (11,573 ) 18,448 Other financing income (charges) 5,823 (1,708 ) (5,730 ) (21,638 ) Loss before income tax (30,375 ) (45,789 ) (51,185 ) (15,196 ) Income tax expense (5,308 ) (5,492 ) (6,689 ) (10,885 ) Net loss $ (35,683 ) (51,281 ) (57,874 ) (26,081 ) Net earnings (loss) attributable to: Controlling interest $ (38,331 ) $ (50,990 ) $ (60,003 ) $ (23,224 ) Non-controlling interests 2,648 (291 ) 2,129 (2,857 ) Net loss $ (35,683 ) $ (51,281 ) $ (57,874 ) $ (26,081 ) EBITDAR: Reconciliation to GAAP measures EBITDAR - Non-GAAP Reconciliation (Expressed in thousands of United States dollars) (Preliminary and Unaudited)
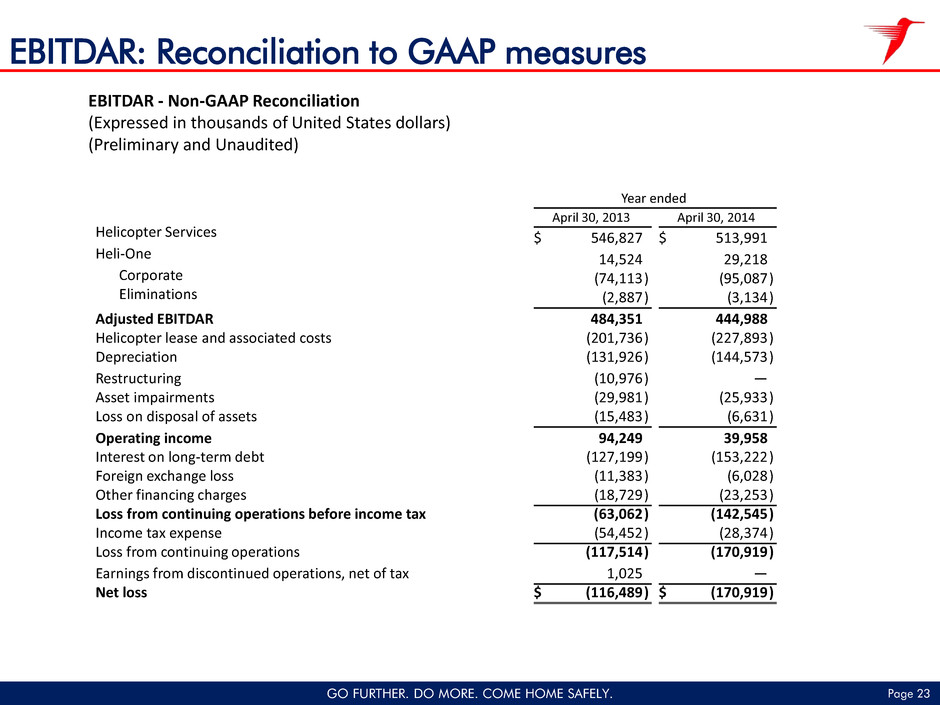
Page 23 GO FURTHER. DO MORE. COME HOME SAFELY. EBITDAR: Reconciliation to GAAP measures EBITDAR - Non-GAAP Reconciliation (Expressed in thousands of United States dollars) (Preliminary and Unaudited) Year ended April 30, 2013 April 30, 2014 Helicopter Services $ 546,827 $ 513,991 Heli-One 14,524 29,218 Corporate (74,113 ) (95,087 ) Eliminations (2,887 ) (3,134 ) Adjusted EBITDAR 484,351 444,988 Helicopter lease and associated costs (201,736 ) (227,893 ) Depreciation (131,926 ) (144,573 ) Restructuring (10,976 ) — Asset impairments (29,981 ) (25,933 ) Loss on disposal of assets (15,483 ) (6,631 ) Operating income 94,249 39,958 Interest on long-term debt (127,199 ) (153,222 ) Foreign exchange loss (11,383 ) (6,028 ) Other financing charges (18,729 ) (23,253 ) Loss from continuing operations before income tax (63,062 ) (142,545 ) Income tax expense (54,452 ) (28,374 ) Loss from continuing operations (117,514 ) (170,919 ) Earnings from discontinued operations, net of tax 1,025 — Net loss $ (116,489 ) $ (170,919 )
