Attached files
| file | filename |
|---|---|
| 8-K - 8-K - APX Group Holdings, Inc. | d820321d8k.htm |
| EX-99.1 - EX-99.1 - APX Group Holdings, Inc. | d820321dex991.htm |
Exhibit 99.2
Vivint, Inc.
Third Quarter 2014 Earnings Call
November 11, 2014
Operator: Good afternoon. My name is John and I’ll be your conference Operator today. At this time, I would like to welcome everyone to the Third Quarter 2014 Earnings Conference Call. All lines have been placed on mute to prevent any background noise. After the speakers’ remarks, there will be a question-and-answer session. If you would like to ask a question during this time, simply press star, then the number one on your telephone keypad. If you would like to withdraw that question, press the pound key.
Thank you. Dale Gerard, Vice President of Investor Relations, you may begin your conference.
Dale R. Gerard: Thanks Sean. I’d like to—we’d like to first start out and honor our veterans and thank them for their service to our country today and today’s holiday.
With that, good afternoon, everyone. Thank you for joining us this afternoon to discuss our results for the three and nine month periods ended September 30, 2014. Joining me on the conference call this afternoon are APX Group’s Chief Executive Officer, Todd Pedersen; APX Group’s President, Alex Dunn; and APX Group’s Chief Financial Officer, Mark Davies.
I would like to begin by reminding everyone that the discussion today may contain certain forward-looking statements, including with regards to the Company’s future performance and prospects. Forward-looking statements are inherently subject to risks, uncertainty and assumptions and are not guarantees of performance. You should not put undue reliance on these statements. You should understand that a number of important factors, including the items discussed under the “Risk Factors” section and our annual report on Form 10-K for the year ended December 31st, 2013, as such factors may be updated from time to time in our fillings with the SEC, which are available on our website, could cause actual results to differ materially from those expressed or implied in our forward-looking statements. The Company undertakes no obligation to review, update or revise publicly any forward-looking statements whether as a result of new information, future events or otherwise.
In today’s remarks, we will refer to certain non-GAAP financial measures. A reconciliation of these non-GAAP financial measures to the most comparable measures calculated and presented in accordance with GAAP are available in the earnings release and the accompanying presentation or in the Financial Information page on the Investor Relations portion of our website.
1
Now, I’ll turn the call over to Todd to discuss our third quarter results for the fiscal year 2014.
Todd Pedersen: All right. I’d like to also just say thanks to everyone on the phone. I know some of the people on the phone are familiar with the Company, others may be a bit new, so I just wanted to talk a little bit about the vision and strategy of the Company.
We obviously started as a security company and have built off of that platform, and really had the vision to become a smart home capable company with integrated services into the home. Really over the past 24 months, we’ve spent a lot of time and energy and resources on building out innovation capabilities, bringing on engineering resources to design and build both the hardware side and the software side of our business and our services. What we’ve created is the Vivint Sky platform. Again, that involves the Panel and the hardware solutions integrated with the Cloud services solution. By the way, those are proprietary to the Company which we think is very important and differentiated from other people inside of our smart home market.
The importance of this is really to take services that we feel are important and critical to consumers. We’re Talking Security Home Automation, Lighting Control, Solar, Internet High-Speed Wireless, Cloud Storage services and others that in the future will be able to be added to this platform in order to drive value to consumers, but also to deliver the services in a very simple, easy manner that’s easy to use and therefore adds value to consumers’ lives.
Again, over the past 24 months, we’ve spent the time and energy and resources to do that and we’re very, very pleased with the outcome and I think that our year this year speaks volumes to our ability to execute on that. We did launch the Sky platform, the Panel and the Cloud service. We had very high adoption of additional services. In fact, we exceeded our own expectations on RMR per subscriber. As you will see in a minute here, even attrition in the Company was better than expected this past quarter, and that’s a direct result of people using the system, believing in the system and seeing value in the system. I think we’re going to continue to see that going forward.
So, again, this is—you know, it’s been a very important year to us. We’re very pleased with the outcome We’ve taken on a lot as a Company, and again some of you have been around, and bondholders of the Company since we first released the bonds and have been great supporters, and we’ve explained in quite a bit of detail as to what we intended to do and intended to accomplish and we feel like we’ve done that. We have gone through an investment cycle over the last couple of years building up these capabilities
2
and making these investments, which I think we’ll talk some more about, but that’s kind of coming to an end in the near future and we feel like we’ve got the platform stabilized and the infrastructure stabilized and we’re now going to see the growth of the Company into that capability.
So, that’s important. A few bits of information on Page 6 that are important. With this new Cloud platform, again, that is owned and proprietary to Vivint, we’re now collecting 86-plus million daily data points. This is important because we’re really trying to recognize and analyze what is exactly happening inside of the consumers’ home with individuals in the home and make sure that we can deliver services that really matter to them. You can only do that if you really know in a comprehensive way and have the ability to analyze that data, and we now have that capability in-house and we’re very happy about that. Note on this, we capture and store 2.3 million video clips per day. These are—these can be accessed any time, anywhere by our consumers. It’s a very important piece of our business.
We now have 160,000 subscribers using this platform. Again, we think we’re—we know that we’re leading in the smart home industry without question. This is not just from having built technologies but this is having an integrated platform, even from the sales and installation side and now proving that out with the customer base that exceeds anyone else in the market from an integrated perspective.
A thing that we will be talking a little bit more in depth next quarter about is going to be the Wireless Internet offering. I know we mentioned it this last quarter that it was in kind of a beta mode. We did just open up our first outside of Utah market. We ended Q3 with 5,200 subscribers. We’re very pleased with that business. We think that there’s a lot of scalability, a lot of interest, and again, it’s an important part of our integrated—future integrated services offering that we’ll be putting out into the market. Again, this first network wasn’t—is in Texas that we’re building out right now.
IT systems. We mentioned a Jarvis (ph) roll-out, a new IT system. This was incredibly important to the Company. In order to offer integrated and additional services, our old IT systems were really built just to offer and manage security related services, and so we did make that investment in upgrading the systems. It obviously was a challenging roll-out. It’s caused some headache and some heartache inside of the Company but we have it stabilized and we are working through the last parts of that effect on the business and I think we’ll talk about some of that in the financials with Mark Davies. But, we are confident that it’s going to enhance the functionality inside of the Company to provide the right data to the right people and provide great service to consumers.
With that, I’ll pass this off to Mark.
3
Mark Davies: Great. Thanks Todd, and welcome everyone. We’ll go through a number of things on the (audio interference). We’ll have Alex Dunn speak a bit about some of these initiatives, but let me go through first a few highlights from Q3 and where we ended the nine months.
Revenues for the quarter were up 13.4% versus prior year. It brought us an Adjusted EBITDA of 78.8 million, which is up 10 million sequentially quarter-over-quarter from 68.6 million. Subscribers grew by 73,000 during Q3. I’ll show you in a moment that the RMR on those subscribers was up significantly year-over-year. That really is our take rate and adoption of Smart Home services that Todd mentioned and through this new platform. All of those subscribers are put on the new platform, and like Todd said we’re up to 160,000 on that.
During the quarter, July 1st, to be exact, we raised $100 million of senior notes. We actually paid out a $50 million dividend in September but we correspondingly brought back $55 million into the Company, $22 million which was a repayment of a loan to Solar, and $33 million of capital return on that $50 million dividend. So, net-net we actually put $5 million back into the Company in terms of cash during the quarter. Then we also bought a data cloud storage company. Alex will talk a bit about this and Todd mentioned that that was part of the strategy all along. We believe that data storage and secure cloud access to that storage is essential to our platform. We now have that capability and we’ll be taking that to market during this year. For next year, it’ll be a core component of our service offering and the entire bundle.
In terms of the nine months, revenue was up 17.3%. That excludes 2GIG, which we had Q1 of last year. We had roughly $17 million last quarter so that’s been excluded in this metric. Our EBITDA is $225 million, which is up 6% year-over-year. There are three one-time expenses or kind of incremental unique expenses. I’ll go through those in a moment. If you exclude those, you’d be roughly a 16% increase, but we’ll go through that. A hundred and eighty two thousand new subscribers. When you look at the new subscribers coupled with the last 12 month attrition, we have a total subscriber base of just under 900,000 customers at the end of Q3, which is up 12% from last year.
It’s probably worth noting that the last 12 month attrition numbers, the improvement is worth about 10,000 accounts. That really is due to two—something we focus a lot about, we’ve talked a lot about that in the past. Two driving factors for that improvement. One is, we have an operational initiative to drive through root cause any sort of reason that a customer may want to choose to leave the system, but we think most importantly is that these smart home type of services, of energy and monitoring and cameras and those types of added services, are actually more sticky and provide more value to the customers on an ongoing basis so that we’re actually seeing our attrition go down because the use of our system is going up.
4
If you look at the next slide, this is just several key metrics which we report every quarter. Revenue, as you see here, is up 13.4%. This is the three month number which I just mentioned. Adjusted EBITDA of $78.8 million, although it was up $10 million quarter-over-quarter, it’s up only 1.1 million year-over-year. There’s three things that are in this quarter which we talked a bit about last quarter as well but they were not in last year’s numbers. The first is a brand campaign. We talked in Q2 about a two quarter brand test that we ran in five to six markets across the United States. That roughly ran about $4 million per quarter. Alex is going to talk a bit about that in the closing statements, but that expense we did put through G&A and that $4 million is in this number.
The second piece is credits associated with the IT improvements that we implemented for both our CRM, our Customer Management System and our billing system. Last quarter we announced that we spent roughly $4 million on a system implementation that was a bit challenging, and even though we now have kind of a handle on that and kind of—and the integrity of the system is working, we still have residual impact of customer credits that we’ve issued because of a less than perfect experience with our billing and Customer Management System. So, this quarter we spent about $4 million on that same impact. We think that is relatively under control now and as we roll through October, November and December for Q4, that we’ll see significantly less net impact, but that is another $4 million.
Then the third piece is our Wireless initiative. I would probably characterize it moving from an initiative to moving into beta and then as Todd mentioned we’re actually starting to roll that out. We’re seeing good improvement in the productivity of establishing customers and supporting the network on a per customer basis, but it still is in a position where we have fixed costs, you know, greater than revenue and we spent about a $4 million expense in negative EBITDA for that business.
So, when you look at those three impacts of $12 million, those are just things that we didn’t have last year. That rolls that 12—and by the way, in Q3 the numbers that we gave you for those three items were $11 million, which were roughly the same quarter-over-quarter. So, a couple—one good thing, we are increasing the profitability of the overall core business. It’s moved up $10 million quarter-over-quarter. It’s something we definitely have to get under control in terms of the credits, which we think we have stabilized that system. The brand is done for the year and we’ll talk a little bit about whether we’re going to do that anymore. Then Wireless, as we scale out we’ll continue to have two impacts. One we’ll see scale as we move up volume, and until we can actually get to true EBITDA neutral and then profit, we’ll have kind of a competing offset to that scale and we’ll continue to burn a little bit of income on that over the next few quarters.
5
Those four impacts roll right into steady state free cash flow. The free cash flow went down by $7 million year-over-year. If you do the silver lining in that, obviously we’d like to have this number better than it is right now. If you normalize for those four—those three items, that $12 million, it takes that to roughly 245 million or 12 times four. Forty eight million plus the 197, and that’s a 20% improvement. So, the actual—the model’s working, we’re generating more cash every year. This free cash flow is actually growing faster than the revenue growth and faster than EBITDA growth, but the—you know, we need to normalize and stabilize then these EBITDA impacts. That rolls right into the nine months as well.
Let’s go to the next page. I’ll share a few stats with you on the subscriber portfolio data. RMR moved up to $49 million. At the exit of Q3, that’s a 15% growth, 96,000 new customers was a piece of that and then our RMR increase on an install base went from 53 to 54.48. So, that’s kind of the content of the RMR increase. Subscribers again at just under 900,000 and we exited the quarter at $54.48 on the average subscriber revenue.
Probably a little bit more interesting is what are the trends and what is the most recent set of additions to the subscriber base? In total new subscribers, as I mentioned, at 73,000 new adds, 61,000 from our Direct-to-Home and 12,000 from our inside sales. That brings the year-to-date to 182,000. One important note I think here is, I think we’ve kind of documented that our subscriber growth is down year-over-year. It’s almost exclusively—well, it’s two reasons. One is the Google NIS penalty that we had in Q1 and Q2. So, NIS is down year-over-year because of that, and our Direct-to-Home is down slightly year-over-year because of the transfer of several hundred experienced reps to the Vivint Solar business. Even though we replaced those, and actually more than them, with new reps, kind of the productivity of new versus experienced reps caused this miss of about 16,000 units. However, when you look at the increase in the RMR year-over-year, we’re now at $62.81 per subscriber versus 58.61. We’ve generated just—virtually the same amount of incremental RMR when you look at the slightly less subscribers and the increase in the RMR. About $11 million of increased RMR for the nine months, September 30th ending.
So—and then finally in terms of accounts, our attrition, we mentioned last quarter that we exited Q2 at 13.7, which we stated would be kind of the peak of our attrition ramp, and that attrition ramp, as you can see from Q4 ’13 through Q2 ’14, went up due to the confluence of the cohorts of contract…
Male Speaker: Pools.
6
Mark Davies: Yes, pools coming to the end of their term. We’ve dropped about 90 basis points from 13.7 down to 12.8. That’s ahead of our expectations. We think that’s very, very good for the platform and for our net promoter scores and we like to see that continue on into the future. So that represents about the 10,000 accounts that I mentioned in terms of attrition year-over-year.
So with that, I’ll turn this—we’ll turn this over to Alex Dunn and he can talk a bit about each of the six points that are on the last slide.
Alex Dunn: Yes. So, we’re going to start out just summarizing kind of what I know Todd talked a little bit about with the Vivint Sky operating platform. That includes the proprietary panel and then also the Cloud service. So, one of the points that’s really important here is that previous to this we were buying equipment, you know, from an outside vendor and we were also partnered with Alarm.com on the Cloud side, and so this has given us a lot of flexibility internally to be able to add the new services and really have a model integrated into the cloud. So, every service we have connects somehow back to the cloud so that we can monitor the performance of the service and be able to glean insights into how consumers are using it so that we can make it more valuable to the consumer.
On the IT system implementation, we also talked about the challenges that we had this year and some of the costs associated with those. I think what we would say and hopefully the message that comes across is, yes, we did have some bumps in dealing with the implementation of the IT systems. We’ve really stabilized that, and for the most part the system is stable and doing now kind of what we anticipated that it would be doing when we first rolled it out. There is still a few residual effects that we’re feeling from a financial standpoint in credits in that sometimes we had to actually give credits beyond one month or two months, maybe three months of credit, and so the billing issues were happening as late as August, and so we’re still kind of feeling some of the cost of those coming through our financials.
On the brand, we had talked about kind of testing—doing a brand study and seeing kind of what we could do in creating a dynamic where consumers were coming to us to get the services. We had some positive results on the brand test, but the results really didn’t justify the dollars that were invested in terms of doing that on a more broad-scale basis. What we did find is actually the Direct-to-Home, we did this in about six markets, the Direct-to-Home sales productivity actually went up quite a bit. The problem with that is is that we paid the same sales commission in those markets. So, what we have decided is that we’re not going to be spending kind of these brand dollars out of G&A, and if moving forward we do spend any dollars and doing initiatives like this, it would be—it would come essentially from the sales organization and we would adjust the sales commissions accordingly so that creation cost essentially would stay neutral and we would increase productivity.
7
So once again, you’re not going to see in 2015 really any dollars being spent out of G&A for branding purposes. The data cloud storage technology, we acquired a company this year called Space Monkey. It’s a really interesting device because it’s really a cross between—it’s a device that you actually put in your home. It has, you know, at a minimum a terabyte of storage and potentially for very little cost a lot more than that. But it’s very cool because it’s a device that if a device fails or it’s, you know, your house burns down or something happens to that device, all you have to do is get a new device, plug it in and all the data that was on that device is restored back to the device. So, it’s the benefits of cloud storage and of having a local storage device. We think this is a very important part of our strategy moving forward. We’ve done a lot of research with our customer base and found that actually protecting their data, their pictures, especially the pictures generated through smartphones, which is pictures and video, which is proliferating, is a really important component of what consumers want to have as part of a smart home offering. So, we’ve made this acquisition, we believe, for very small dollars and you’re going to see Space Monkey devices being included in a lot of our packages this next year.
The Internet service. We’ve talked a lot about this in the past. We’ve made strides this quarter with starting to scale that business and do it in a way that is cost-efficient. We’re still working through kind of a lot of those issues now that we’re in kind of the scaling phase of the business. We put a little diagram on here just to maybe simply explain how it works, what the network topology looks like. So, we have essentially a fiber terminus to a cellular tower who work with the two companies that own most of the cell towers in North America. So, we have a fiber connection that runs to that tower. We have a radio on that tower that then really speaks to a point-to-point radio into a customer’s home and the neighborhood. What we call that in the diagram here, it’s the dark blue picture in the middle, is a micro hub. So, the micro hub has a connection of hundreds of megabits from the tower to that home, and then from the home, from the micro hub, we can support about 10 homes in the vicinity that are hundreds of yards within the vicinity of that micro hub. Each of those homes are getting an average 50 megabits per second up and down.
So, that’s a little bit of the network topology. What you’ll see is is that one of the—a couple of things. First, the radios and the antennas on the homes from the micro hub down to the customers’ homes, that’s all technology that has actually been developed in-house. We’ve made some acquisitions a few years ago of some wireless technology company in Silicon Valley. We’ve really developed that out now to where it’s commercially viable and that’s the technology that we’re using. So, we have really a proprietary technology here that’s allowing us to do this, which we think differentiates us from a lot of other companies that are trying to accomplish this.
8
The second thing is is that rolling out a network in a really dense way is very important. So, we need—in order to make the economics work, in order to make it work you need a micro hub and you need about 10 consumers out of 50 homes in order to make kind of the investments work all the way back in the network. So, we’re very uniquely positioned to be able to go into a neighborhood and tell our sales reps—and this is what we literally do. we do surveys, aerial surveys, we find the homes that are best suited to be the micro hub home, we go get the micro hub home and get that set up, and then we give literally a list of addresses to a sales rep and say “Here are the 50 homes that can be serviced by this micro hub and we need 10—you know, you have 10 homes.” So, we’re uniquely positioned because it would be very difficult on kind of pull marketing, so if we just said, hey, send out TV advertising or Internet ads and said “Hey, do you want Internet,” it would be very difficult to build the network this way. So, because of our Direct-to-Home sales force, it actually takes advantage of the technology in a way that is really unique to us.
So, the Internet roll-out is going very well. We’re working on figuring out and making sure that we roll it out in a way that is cost-efficient and that the servicing is efficient and then working through all those issues. But we’re very excited about it. We will be giving more detail, a lot of more financial detail on the Internet business after kind of the next quarter so that really we can help each of you kind of build a model and help you understand the business the way that it’s kind of playing out for us.
So, I think the final point here to note that we would make is is that we’ve really gone through the last 24 months - a pretty exciting time in our business. One, we’ve significantly—over the last 24 months we’ve significantly grown the recurring monthly revenue base, seeing really great growth there, but as we’ve—in parallel to growing the base of the Company, we’ve really expanded the offering that we can bring to market and it’s really all around smart home.
So the—and maybe I would add to that, Solar’s a part of that. So, in all the markets where we—even though that—we spun that business out and now it’s a standalone entity, we have a marketing agreement where we’re able to include Solar as part of the smart home offering in all the states that Vivint Solar is able to provide that service and have Solar integrated back into the Cloud service, the Security, the Energy Management. So, you begin to see that all these systems in your home if they’re integrated and they work together they’re offered in a cost-effective manner with one bill. We have a real competitive differentiation to the market.
9
So, we are really at the end of kind of that transformation that we wanted to make with the business. We have the offerings on top of our platform and now the technology is to be able to sell into the business. So, what we would anticipate really over the next three to five years is we have the core of the offering that we’re going to go-to-market with and you’re going to start to see what we would hope is some pretty nice scaling of the business and not really any more incremental investments into kind of the building out the platform, the technology platform.
So, that is the end of my slide, so I think we’re going to turn it over to questions-and-answers.
Dale R. Gerard: Yes, John, we’re ready to take questions.
Operator: At this time, I would like to remind everyone that in order to ask a question, please press star, then the number one on your telephone keypad. We’ll pause for just a moment to compile the Q&A roster.
Our first question comes from the line of Saliq Khan of Imperial Capital. Please proceed with your question.
Saliq Khan: Great, thank you. Todd, your team made a lot of great progress, especially as you look at the turns side as well as the RMR and the ARPU. Could you guys talk a little bit about the impact that you’re seeing either from the movers versus—moving accounts with competition versus the cables and telcos? On the exact same point, AT&T in particular was pretty aggressive over the last couple of quarters with their promotional activities. Can you also talk about what you’re seeing in terms of their promotional activities and their impact on your business?
Todd Pedersen: Yes, you know, I think this is—I think that’s a good question and it’s one we get often and have for a couple of years now. There’s no question that AT&T and Comcast are spending a lot of money promoting their new services. I’m not totally sure what the dollar amount is, but even down to our sales people that are starting to recognize those promotional offers. The interesting thing is we still are not feeling much effect at all from the competitive market, and I’m saying out on the streets. We’re inside of people’s homes selling directly to them and it’s onesie-twosie customers from a customer acquisition perspective that we’re being affected by. So, it’s not like a wholesale, you know, war out there trying to gain a customer base. I think that is largely in part to two things. One, the security industry, which this all kind of started with with us and is kind of the base service, is still very under penetrated in the US. Then the other is, smart home and Internet of Things technologies are just in their infancy. So, the smart home capability or home automation capability is still in the low single-digits penetrated in the US and so we’re just not fighting customer for customer at this point.
10
I think part of the question was also, well there was moves, and I think maybe you might have asked, and if you didn’t I’ll say it anyway. From an attrition perspective, are we seeing much by way of the bigger competitors, AT&T and Comcast, as far as the attrition goes, is that much effect on the attrition, we—they’re one of the causes for attrition but internationally enough the highest cause of attrition. There is no one silver bullet in attrition. It’s a multitude of things. Moves is one of them. Moves have been higher as a percentage of our total customer base moving with the real estate market improving. But we are not losing a high percentage of our customers to any of the specific larger, newer entrants into the security market. In fact, we have more competition from local security only companies than we do the larger, large scale national players at this point.
Saliq Khan: Got it. What’s interesting is that you talked about attrition as well. Interestingly enough, your attrition number sequentially went down. One of your competitors actually reported yesterday and their attrition went up. In fact, as you look out to the out quarters for the next two quarters or so they ended up guiding higher and I don’t think it’s an issue of the overall industry with the industry seeing the attrition go higher. It may just have been an agnostic example particularly with the issues that they’re seeing. As we’re thinking about it as analysts, right, predicting the attrition level going forward, how should we think about that particularly as we’re looking at the subscriber cohorts as well?
Todd Pedersen: So, you know, interestingly, and I think I actually—I saw that—we saw the guidance on the attrition. Look, we had thought that our attrition was going to come in higher than it did and we are very happy with the improvement from last quarter to this quarter. I’m sure they’re very focused on I talk also but we think that’s a direct reflection in the services that we’re selling. We really—and now Alex mentioned our past Alarm.com relationship. We did not have true access to the data of the customers on the day-to-day—I mean minute-by-minute, second-by-second basis. We now do. We know how consumers are using or not using our systems and can deal with that accordingly, so we feel like it’s a product and customer base mix. Then also our focus, we’ve got a very good team and a very intelligent team that is recognizing trends in our customer base and knowing how to address those trends. Honestly, it’s more usage trends or lack of usage trends that are causing that, so we’re dealing with that.
One thing of note, and you mentioned AT&T and some of their promotional thing, if you look out over the last two quarters we actually outperformed AT&T from a customer base—a customer acquisition basis, which we were actually—we didn’t know but they reported and we were pleasantly surprised that with—although we did spend 8 million over the past two quarters with branding, I’m assuming that’s a small fraction of what they spent.
11
So, with our tried and true direct sales force and now, you know, very important inside sales group, we’re going head-to-head with some pretty big companies and we think we’re having a lot of success.
The other thing is we feel that our offering, our core offering, the Sky platform, the Panel, the backend, the integrated services with cloud storage, Wireless, Internet and others that we mentioned, is going to be very, very interesting when it comes to the competitive market. We think we’ve got a very good solid ground to stand on and we think we’re going to compete quite well.
Mark Davies: Specifically on the attrition, we don’t think Q3 was an anomaly. We think it’s something that is kind of a foundational shift for us to just better attrition. What will it be in the future? You’ll have to model that, but we don’t think that it was an anomaly.
Saliq Khan: Okay. Then, last question for you guys before I hop back in the queue. As much as you guys are talking about the competition that you’re seeing out there, the Vivint Sky Panel is pretty unique and the amounts of bells and whistles on sensors and things of that nature that you can actually put in and also you guys are really in-housing a lot of technology as well. As your subscriber account is increasing—excuse me, subscriber account is increasing, are you able to displace the competitor or is it more often the case that it’s the competitor’s first time purchasing some sort of an interactive wireless home service?
Alex Dunn: Yes, we—something that we’ve prided ourselves on for really our inception is making sure that a majority of our customers are coming—are new to the services that we’re selling, and so we believe still that a majority of our customers are actually new entrants either into security or smart home or any of the services that we’re selling. Obviously that’s not the case with Internet. You know, Internet has pretty high penetration, but all the other services or a majority of our customers are actually new. So, we certainly do take our share of customers from other companies, but again because we’re not really selling—we’re selling a lot more than what a customer, you know, maybe customarily or traditionally had. We’re adding a lot of value to the consumer around additional services that can be integrated into what we sell.
I mean, and more pointedly, we’re signing—of those that we are acquiring from other companies, they may be paying $30 a month for basic security and we’re taking them as you saw an average of $62 a month, 62.81, I think it was a month. So, they are interested in these additional services and the functionality that it provides to their homes and managing their life. So, this isn’t—we’re not just trading customer for customer, we’re—they believe in the concept of what we’re doing which is providing smart home capabilities to them. Security for a lot of them is just—it’s just an additional functionality, it’s not the driver of the choice to change from whoever their provider was.
12
Saliq Khan: Great. Thank you.
Operator: Your next question comes from the line of Karru Martinson of Deutsche Bank. Please proceed with your question.
Karru Martinson: Good evening. When you guys look at the platform investment cycle time coming to its end, I mean if I just do the math simply here, you spent, you know, call it, 24 million here in the second and third quarter. It sounds like there’ll be a little bit more in the fourth quarter. I mean, is that essentially money that will drop to the bottom line next year?
Mark Davies: Say that—the 24 million was—can you reference that one more time?
Karru Martinson: So, I mean you spent about 11, 12 million in the second quarter, 12 million this quarter.
Mark Davies: Oh yes.
Karru Martinson: You said there’ll be a little bit more. So, I mean as—you know, I understand that Wireless will go on and there will be additional investments, but it sounds to me like the rest of this is money that should be able to drop to the bottom line next year.
Mark Davies: Yes, we agree with that. I think the brand investment of 8 million over the last two quarters will not repeat and we wanted to let you know that, Alex talked about it, it’s not something that will run through any sort of an expense. If we do any sort of marketing in that manner would be part of creation costs. We have our own—we have goals for creation cost, creation multiples and it would have to fit into those parameters. So, that will drop to the bottom line.
The credit due to IT systems, we’re pretty focused on that. Again, we think that the system has been stabilized, the functionality is where we want it. The customer impact has been essentially eliminated, but when you have billing issues or a customer looks at their account 60 days after it actually happened and they realize they had a issue so we have a residual that carries over into that. We expect Q4 will be lower than Q3 for sure and by the time we hit next year it’ll be completely mitigated. So, that should drop.
Our goal on the third piece, which was Wireless, is that we will—our goal is to add enough accounts over the next three or four quarters that we will quickly get this back to a zero impact to our EBITDA on its
13
way to accretive EBITDA and accretive creation cost. So, that is—you know, we expect that’ll take several quarters to do that. Alex is actually focused on that as kind of the lead in that space and we’ve done the same thing with Security, with Solar, with Smart Home and we believe everything that we do with Wireless Internet is really an extension of our platform. It really is nothing new, except we own the intellectual property around it and we’re working on that element.
But it’s something—it’s a bit of a long answer to your short question, but yes it should all drop.
Karru Martinson: Then, you know, when we look at the sales force productivity, certainly we had a younger sales force this year. I mean, is the expectation—or what’s normally the retention rate of the sales people as we go into next year?
Todd Pedersen: Yes. So, productivity was a bit down but it was in line with—if you take the percentage of experienced sales reps and first year sales reps, it was in line with historical numbers. We—I guess what I would say is we expect the percentage of first year sales reps coming back to be kind of normalized. It’s kind of—I guess what—your intuition would probably say experienced sales reps come back at a higher rate, first year sales reps don’t, but we do—you know, we’re in the middle of the recruiting season right now. It’s going very, very well. We have—we’ve already—you know, we reassembled the Management teams and start to make projections around recruiting and hiring and training and that’s happening right now. I was in Idaho last night at one of our recruiting centers and we had a great showing.
So, I would expect that we’ll have a higher percentage of experienced reps—well, I actually don’t want to say that. But based on how I think we’re going to end up doing it we’re going to try to recruit even more people but we’re going to have a good returning sales force next year. We’ve got a great training curriculum coming through this year. A lot of excitement by the way from our sales force. On everything that we’ve talked about they know and understand. I mean, the Sky platform, the Panel and the backend and all the services are what they’re excited about. They want differentiation in the market. They don’t want to be another security company selling someone—all selling the same panel, all selling the same exact service the exact same way. They love the differentiation. So, we’re actually quite excited about the 2015 season.
Karru Martinson: Okay. Just lastly, when we look at 2015 it sounds like some of your cash cost might be coming down but if you are putting out a larger sales force out there, you know, how do you look at the financing and the funding in terms of a capital structure? Do you need to come back to the market?
Mark Davies: Yes. This is Mark. We will be back to the market in 2015. We—the way our process works is we’ll go through the forecasting that
14
Todd just mentioned, determine what the growth rate is of new subscribers and what the creation multiple is. We’ll then look at our RMR and the cash flow from that source and we’ll get a delta and we’ll come back to market. Right now our growth is such that we’re adding more subscribers and using a bit more cash than we would on a steady-state basis. So yes, we’ll be back with that sometime in 2015.
Karru Martinson: Thank you very much guys, appreciate it.
Mark Davies: Yes.
Operator: Our next question comes from the line of Brett Kaufman of Columbia Management. Please proceed with your question.
Todd Pedersen: Brett? It sounds like Brett’s dropped.
Operator: Our next question comes from the line of Brian Chan of Bank of America Merrill Lynch. Please proceed with your question.
Brian Chan: Hi guys, thanks for taking the time today. Just had a few questions for you. The first one is, with the Google penalty behind you, can you give a little bit more detail on how many new subscribers (inaudible) organic (audio interference)?
Alex Dunn: Yes. So as we talked about the Google penalty that really happened first and second quarter, it is completely behind us. We actually had a really fantastic month last month through our inside sales group. So, I think one of the things that happened because of the Google penalty is it forced us to become better at the other kind of other things that—other channels that we were using to generate leads, specifically the paid search.
Todd Pedersen: Mm-hmm.
Alex Dunn: So, that has led now to some I think, you know, some really nice increases in our inside sales group.
Brian Chan: Okay, great. Thanks. Also on the cash flow from investing, does this include the maturity of the CDs or I assume any short term investments that you had from last quarter? If you could talk a little bit more about the acquisition cost and other items that might be in the number that you have in the presentation, that would be great.
Mark Davies: Yes, we haven’t announced or disclosed what we paid for the Space Monkey acquisition. On a relative basis to that technology and even to a relative basis of Vivint’s size and—it’s fairly small. We bought a technology that was essentially ready to go to market that had a few more points
15
of functionality, some quality checks and some performance upgrades that we’re working on right now and just getting ready to release, but essentially it’s ready to go and we paid a very, very small multiple for that.
On the question regarding the invest…
Alex Dunn: Yes, yes, yes. The 60 million, the money we had invested in the CD was repaid or returned investment come back here, so you’d find that in that number also for the third quarter.
Brian Chan: Okay, thank you. Can you give us an actual number on the subscriber acquisition cost?
Alex Dunn: For…
Mark Davies: Well we don’t disclose our actual acquisition costs. I’m not—were you asking for something specific?
Brian Chan: Well just on the—you know, historically I think on the last 10-Q the subscriber acquisition cost on the cash flow from investing?
Todd Pedersen: Yes. Hey Brian, I think this might be good if we could take this offline. Maybe you could follow-on and…
Alex Dunn: Okay.
Todd Pedersen: You can kind of walk through that calculation because…
Mark Davies: Is this the—you’re talking about the cash flow on the statement of cash flows. Yes, let’s take this offline and we can walk through that with you if you’d like. I see the number you’re talking about.
Brian Chan: Right, thank you. Appreciate it.
Mark Davies: Sure.
Operator: Our next question comes from the line of Jeff Kessler of Imperial Capital. Please proceed with your question.
Jeff Kessler: Thank you. What happens if we get through (inaudible). You have—you use RMR as a basis of attrition. When the—when you saw the cohorts coming together and when you saw the attrition going down, was there any effect of customers trying to take a lower rate as they resign and was that offset by newer customers coming on who were taking a higher rate?
16
Alex Dunn: Yes, Jeff, we actually don’t calculate attrition. We don’t do RMR attrition. I think we may put the number in there but we…
Male Speaker: (Cross talking)
Alex Dunn: The way that we—yes, we really look at subscriber.
Jeff Kessler: Okay.
Alex Dunn: Attrition.
Todd Pedersen: But, if we did our number—if we did what you said, and I think—or ADT does do that, our attrition would show lower obviously because we’re replacing…
Alex Dunn: I think it would be better by about a percent. In the past we had looked at it. So, yes, we look more at subscriber attrition than we do it RMR.
Jeff Kessler: Okay, but—and the follow-up that you saw no fall off on those accounts that attrited. They were accounts that attrited as opposed to RMR that was let’s say lessened because they wanted to drop off, lop off a couple of services.
Alex Dunn: Yes, yes, we do subscriber attrition, so when a customer cancels…
Jeff Kessler: Yes.
Alex Dunn: They cancel and they’re done. That’s how we count the attrition.
Mark Davies: Right.
Jeff Kessler: Okay, great, great. I’m having—I’ve got some problems here on this train so I—basically that’ll be my only question. Thank you.
Alex Dunn: Okay.
Mark Davies: Good to talk to you.
Alex Dunn: Thanks.
Jeff Kessler: You too.
17
Todd Pedersen: Thanks Jeff.
Jeff Kessler: Yes.
Operator: Our next question comes from the line of Brett Kaufman of Columbia Management. Please proceed with your question.
Brett Kaufman: Hey guys. Sorry I dropped earlier.
Alex Dunn: No problem.
Brett Kaufman: So a couple of questions. First, on the attrition, are there any pools coming up in the next few quarters which are going to cause just, you know, as far as the attrition curve going to cause any sort of impact on your reported attrition or do we have a pretty I guess clean window for a few quarters on that?
Alex Dunn: Yes, so we’ve talked about our attrition a lot and the fact that we had—we were a young customer base, we have lots of pools kind of coming up for renewal in a 12, 18-month period, that’s why our attrition went up. We kind of said to everybody “Hey, second quarter—in the first quarter, second quarter, our attrition was going to peak and we were going to start to see that come down.” That’s exactly what has happened. We’ve actually—it’s come down a little faster than what we anticipated which is probably the biggest thing driving that is just better than expected renewal rates on those older cohorts.
So, we obviously moving forward are going to have pools coming up for renewal but as we get bigger each pool represents a smaller percentage of the overall base. So, we don’t anticipate that you’re going to see again something as an anomaly where it’s going to really spike up attrition. We would anticipate that if you look at it over on an annualized basis that we’re going to see that continue to come down. In fact there’s a period of time in I think three years where we switch back to 60-month agreements, and so there’s going to be—it will actually be artificially low during a 12-month period because we will have very few customers coming up for renewal. But that—I think we feel like we’ve hit the peak which is what we had talked about and that’s starting to trend down now.
Brett Kaufman: Okay, that’s fair. The Wireless conversation that you had, you talked about how the economics you really kind of need to get 10 homes out of 50 for the economics to really make sense. I guess, I want to appreciate at what point does a neighborhood turn EBITDA positive? I mean, do you need 10 homes to get to EBITDA positive or is that just to get the IRR that you expect and you’re really kind of EBITDA positive on a neighborhood basis at four homes, five homes?
18
Alex Dunn: Yes. We’re going to go over the economics but what I will tell you it’s more—to get 10 is more an IRR than it is to get to EBITDA positive. I mean I think on a unit basis—and look, when you’re building a business where we’re building the technology and we’re building out a network, there’s certainly some overhead cost that are there whether we have one customer or we have 10,000 customers. So there’s some overhead there that we’re going to have to grow into that we think, as Mark said, we can over the next four quarters—you know, three to four quarters, but the unit economics don’t require—you know, or it’s not about EBITDA positive at 10, it’s about just making it a really fantastic business with a fantastic IRR. But we’re…
Brett Kaufman: Got it.
Alex Dunn: EBITDA positive well before that.
Mark Davies: Right.
Brett Kaufman: I know there are some geographic limits, at least that’s what’s being communicated to me in the past as to where this type of service really will work best. I mean, do you have a feel for kind of what percent of your markets or the country, you know, this product really makes sense and you think is I guess somewhat of a target market?
Alex Dunn: Yes, so we think that—a couple of things. First, we’re actually involved with I think on some real cutting edge stuff here, and so we have people kind of the world leaders in this stuff that we are working with to continue to develop the technology. So, I don’t think where we’re at is static, but with the solution we have today we think easily there’s a 30 million kind of population homeowners, homes that we could—that are in a geography that is really perfectly suited for our solution. Beyond that, we could use our solution in markets that maybe aren’t part of that 30 million that’s not perfect, but we’re going to tackle those kind of those areas first. It’s the West Coast, the Southwest…
Todd Pedersen: Mountain West.
Alex Dunn: Mountain West, kind of Mississippi kind of over our—most places in those areas are perfect for the technology.
Brett Kaufman: Okay, I appreciate it guys. Thanks.
Alex Dunn: Thank you.
Todd Pedersen: Next question.
19
Operator: Your next question comes from the line of a Dan Max at FBR. Your line is open; please proceed.
Dan Max: Hi, good afternoon. Thanks for taking my question. Can you give us—I guess we’ll see it on the Q when it posts, but can you give us—describe what the capitalized subscriber acquisition costs were for the quarter? Or if not an exact number, were they similar to last quarter or? The last quarter it looked like you capitalized that. I think it was about 140 million.
Mark Davies: Year-to-date 284 million for capitalized subscriber acquisition. So, you have the—I don’t have the quarter in front of me right this second.
Dan Max: Okay, so then (inaudible). All right. On that it looks like about 110 million was capitalized, okay. So given that, the way that I look at it in terms of subscriber acquisition costs, because if you think about—I think about it in terms of combined expense was capitalized cost that’s actual cash effectively that goes out the door to acquire customers. When you look back historically at that, it looks as though your cost per sub has gone up dramatically and your spend has actually gone up, and yet your subscriber adds have gone down. On my math it looks like your cost per subscriber add year-over-year for the quarter is actually up about 15%, and yet your subscriber addition has gone down 6.5%. This is at least the second consecutive quarter that your spend both in the per sub add as well as an aggregate add has gone up, and yet your adds have gone down. Can you explain to us like what the trend is? What’s going on and what’s sort of driving that and where kind of (cross talking)…?
Alex Dunn: Yes. So, a couple of things I would say. The one thing that you didn’t include in the equation that’s actually really important is the average recurring monthly revenue of a sub which has also dramatically gone up. The way that goes up is someone has additional services, and so with additional services comes additional cost of acquisition, specifically equipment. If someone is in the full Home Automation package that includes a door lock, a thermostat, a lighting control, a camera, and so as you increase the adoption of those services, you’re going to see higher per sub creation cost but you’re also going to see higher per sub RMR. So, if you look at the creation cost as a multiple of your recurring monthly revenue, we think we’re fairly in line.
The one area this year that we have gone a little higher than what we have been in the past, is the equipment. That’s specific to the Sky Panel. It’s more expensive than what we were putting in with the Go!Control. We think that that’s going to come back down. This is actually when we installed—first installed the Go!Control. This was the same trend. We—you know, components come down, they actually come down fairly quickly. So, we’re already seeing now and into next year kind of reduced equipment cost. So, we’re not that far out of line for sure as a multiple of recurring monthly revenue on the
20
creation multiple and where we are it’s around the cost of a new panel which we think the benefit of having that panel is worth having a blip in that kind of creation multiple go up. If we could have avoided it we would have but it just—the newer technology was a little bit more expensive.
So, if you take all of that together and that’s kind of what you’re seeing in there which it’s not—where certainly as a multiple of recurring monthly revenue is not as dramatic as I think it may look on the surface.
Mark Davies: You would have seen that in the last two months—the last two quarters because that’s when we reintroduced the new panel.
Alex Dunn: Yes.
Mark Davies: That’s when we saw the big increase in the RMR up to—on the Direct-to-Home it’s $64 plus on RMR because they’re adding so much more equipment and that’s when we have the density of the Direct-to-Home sales come in Q2 and 3.
Dan Max: I guess, I’m still a little confused because it seems though on an average basis you’ve added about $4, a little over four bucks a month—oh actually it’s where you were for this quarter, so through the year you’ve on average—your RMRs for new subscribers has been a little bit less than that, but yet your cost per sub has gone up over the $300, which would be—just even if you had 100% margins on that $4 at sort of a six year pay-back period for customers. So, is there a point at which you feel you actually will start to get more bang for your buck? I mean growth is great but..
Alex Dunn: Yes, I know…
Dan Max: At what cost are you sort of (cross talking)…
Alex Dunn: We would not do that and we’re not doing that. So, we’d have to take a look at the map that you’re using. I mean, when we take a look at RMR when you say we’re down 6%, our RMR created for last quarter was flat.
Dan Max: No, I didn’t say that. I said was down 6% year-over-year of your subscriber acquisitions.
Alex Dunn: Yes, and I’m saying…
Dan Max: Your—when you add—if you add your cost, your total cost per add, the cost being like both capitalized and expand subscriber acquisition costs, and you divide that by your subscriber adds, your spend has gone up and your adds have gone down, but even away from that, the total add
21
per sub is up like $300. But just as a breakeven in terms of how—I’m just not—I just don’t really understand the bang for the buck in terms of growth—sort of at what point do you think you’ll start getting incremental returns on the dollars that you’re spending at your breaking points (ph)?
Dale Gerard: Yes. So, hey, this is Dale. So, I think there’s a couple of other components you’re missing in your calculation. You’re missing the activation fees, you’re missing any of the revenue associated with upgrades at the time of install. I mean, I’d be glad to take this kind of offline and walk through the calculation with you just so that we can, you know…
Dan Max: Okay, because I was not including any revenue—I’m not talking about revenues. I’m just using the number that you gave for RMR but (cross talking)…
Alex Dunn: Yes, so we’re—I guess what we’re saying is is that on the equipment, our equipment cost was up at about over—just over a turn from traditionally which we think is going to come down to where it has been traditionally but that’s it. So, there’s a little bit of a disconnect between obviously what we know and how we run the business and what you’re saying. So, we’re happy to sit down and try and bridge the gap, but the only cost that have gone up is our equipment cost by just north of a turn and that is going to be coming down as a multiple, which includes the fact that we increased the average recurring monthly revenue.
Dan Max: I guess we’ll chat offline. Thank you very much.
Alex Dunn: Okay.
Todd Pedersen: Thanks Dan.
Operator: Your next question comes from the line of Scott Simon at UBS. Your line is now open.
Scott Simon: Hey guys. As you roll out your Wireless product to different markets, what’s the cap ex associated with that buildout per market I guess is probably the best way to do it.
Mark Davies: Well, it’s—thankfully and it’s kind of the reason why we’re interested in doing this model is we really don’t have an extremely large cost of capital to open up a market. It’s just adding more subscribers through the way that Alex mentioned. We will go into a market, whether it’s a new state or a new city or an existing city. You basically—you grab fiber to the tower, you put up your radios, you set up your hub home and then you add the subscriber homes around the hub home. So, it’s a variable cost kind of intensive model, so it’s not like you go in like a Google Fiber or people who are laying cable. We just
22
do it in units of a tower and the homes that come off the tower. So, the unit of one is really still our cost of putting up the network in a new city as we expand through markets. I don’t know if that answered your question, but there’s very little startup cost to—we don’t—we have call centers, we have a network operating center. Install and service are variable on a per unit cost. So, that’s why we think this is a variable-based kind of model where we can target a neighborhood or target a suburb or a particular city and then send installers and sales people to go put them on almost at the same time.
Scott Simon: Okay. As I think about your attrition coming down, obviously Vivint’s (ph) going to be happy with that, but if I remember correctly last quarter you talked about the young sales force and you guys weren’t—the business model was kind of changing a little bit where—whereas you guys were focusing on the markets where you already have penetration and keeping and retaining the customers. So obviously, that led to lower attrition. But as I think about that, how many—or what percentage of the customers have you guys resigned upgraded to the new higher RMR? I’m just trying to model cost here so if obviously as you go from just a regular security system like you said that home automation it comes with incremental cost, so I’m just trying to figure out what that cost is.
Mark Davies: Yes. I don’t have the exact—we have approximately 90% of our subscribers on Home Automation capable equipment. Most of the subscribers that have that 90% have some sort of an added service, Energy Management, locks, cameras, whatever. So, when a subscriber like that renews, it typically—that subscriber typically already had a smart home capable, smart home revenue base subscription. So, we’re not—I don’t have the exact number that you’re talking about but the dynamics of the attrition and the reups are relatively flat from their old to their new contract.
Scott Simon: Okay. Obviously…
Mark Davies: If that’s what you’re trying to model.
Scott Simon: Gotcha. Obviously, just kind of a lot of focus on creation cost and you guys continue to put 28 times as your creation multiple. As costs have gone up, is that multiple going to change? I think your competitors are just a bit above 30. So, are you seeing that creation multiple go up as you add more sales heads, et cetera?
Mark Davies: Yes. We moved up on creation cost this year because of that turn that Alex just mentioned because of the panel. It’s something that we’re focused on bringing that back in line. A hundred percent of our sales are self—you know, we generate 100% of our sales and we do it in that sub-30 range. I think a lot of customers are generated by other companies through dealers and I think the dealer network is actually selling that at above 30,
23
but maybe an ADT, whoever, is generating accounts around the 30 points. We actually think our creation cost multiple is pretty low compared to the industry average. But you have the numbers generally right on.
Scott Simon: Okay. Just last question. You guys obviously got the dividend back to the $55 million and back into cash (inaudible) balance sheet. What’s your cash balance today?
Mark Davies: We ended the quarter at…
Male Speaker: Sixty seven.
Mark Davies: Sixty seven million.
Scott Simon: Okay. So plus 55, so you’re right a hundred?
Mark Davies: Yes, if you took that 55 in and assumed it was—I think we brought it back in on October 10th, roughly.
Scott Simon: Mm-hmm.
Mark Davies: That would have been 112.
Scott Simon: Right. Okay. Okay, thank you.
Todd Pedersen: Thank you.
Mark Davies: Thank you.
Operator: Your next question comes from the line of Rishad Purs (ph) at Lyndon (ph). Your line is now open.
Rishad Purs: Hey guys. Thanks for taking the question. I guess could you just walk me through the use of cash in the quarter? Like how much cash was actually used?
Mark Davies: Do we have the statement of changes here?
Rishad Purs: On an operating way (ph) because I’m seeing net debt change of like around 18 million and that ended up kind of operating cash used for the quarter.
Mark Davies: Go ahead.
24
Mark Davies: So, in the back of our presentation we kind of walked through the consolidated statement of cash flows. I mean, I can walk through that, but basically we generated about $92 million cash flow from operations. We have reinvesting activities of 3.32. That does include as we mentioned earlier the $60 million redemption of the CD that we had invested in. Then you’ve got cash provided from financing activities of 47 million. So, it gets you to a cash usage of about 195 million.
Rishad Purs: Mm-hmm.
Mark Davies: For the nine months—that’s for the nine month period.
Rishad Purs: Okay. Then where—like did you ever think that you’re going to come back to the market, you know, for additional debt? So, I mean, where do you think the right level, you know, like leverage multiple is for the business and where do you think it’s going to peak?
Alex Dunn: Yes, I mean, I think the way we look at it is as we talked about the last 24 months we’ve definitely invested some money in building out the platform and so there’s been some cash used there that traditionally hasn’t been. We think that’s going to drive increased RMR, increased subscriber growth. So now what we would say is is that on a unit basis, we think that what we’re trying to do as we continue to grow our business is that we’ll continue to increase the debt, but the leverage ratios and all of that we will kind of delever as more and more cash comes from the operating business to fund account creation. Really people say “Well, how long does it take to—you know, before you need no money?” That’s really there’s an artificial—it’s an artificial kind of answer because I can—we can make that happen today. We would just cut the growth of the business and we could make the business today not need any more cash than is generated based on the number of new customers we add. So.
Mark Davies: If you look at the steady state free cash flow of 200 million, we’re generating that. We don’t need to invest it but we choose to invest it. There’s a couple of metrics that you can build your model out with. I mean, we have a 30—let’s say 28, 29, 30 multiple for the creation cost. You have an internal rate of return of somewhere in the mid-20s. You know that you can model out a growth forecast of added subscribers at that multiple and you can kind of draw lines to see where the breakeven is and the (cross talking)…
Rishad Purs: But is the creation multiple at 30 today? The actual number is 30 today?
Mark Davies: It depends on the quarter, right. If you look at our year-to-date it’s slightly below 30. Our average has been over the years 28. We came up a turn this year because of that panel. The panel, we sold a lot of panels during Q2 and Q3. So there’s—it’s close to 30 right now.
25
Rishad Purs: Okay. The way you guys…
Mark Davies: Coming back down.
Rishad Purs: The way you guys calculate creation multiple is obviously just the asset (ph) fee divided by the RMR, right? That’s what you’re calling the creation multiple?
Alex Dunn: That’s right.
Rishad Purs: Right, okay
Mark Davies: Yes.
Rishad Purs: Okay. Then…
Mark Davies: Then you look at our—yes. You can kind of draw that out. We believe that as long as our attrition is what it is, our operating service margins are what they are. We generate a return on every dollar that we put in to a new customer creation of roughly 23 or 24%. So, if we can borrow at eight, return it at 23 or 24 with a risk profile of, you know, industry leading attrition, it’s a good investment. So, we’re actually trying to grow as fast as we can. At some point even growing very fast we’ll eventually catch up but we haven’t slowed down growth enough to actually hit the breakeven point on cash. But it’s simply you want a modeling exercise to see where it happens, and two, a management decision. If cash becomes too hard to get or if it becomes too expensive or if something changes in the fundamentals of the operating model then you just stop growing and you become cash accretive immediately, basically.
Rishad Purs: Okay. Right now when you’re going to come back to the market, do you think it’s going to be at the secured level or the unsecured level?
Mark Davies: Now we will probably—I mean we look at that every time we go to market. The bond covenants actually have some leverage ratios dictated to us between secured and unsecured. We put secured on when we first went public debt. We haven’t since then. We will likely have some combination of secured and unsecured next year.
Rishad Purs: Okay. In terms of like, you know, equity contribution, so basically the sponsor took a dividend of 50 and returned 32 of it, like within a quarter? Is that what happened or am I mistaking that?
Mark Davies: Yes, we returned—we took a dividend of 50, returned 55 million, 33 of which was a return of that same 50 million that we borrowed for less than 60 days.
26
Rishad Purs: Okay. From VSLR is there any more cash that needs to come in or is it 20 (ph) to the end of this?
Alex Dunn: Yes, I’d say actually that business went public and now it’s capitalized kind of completely on its own. Really the—when you talk about dividends, you know, we were trying to help launch the Solar offering because we think it’s an important component of the Smart Home. So, the money that went out, you know, the way that we look at it came kind of right back in and so it was a way to kind of help Solar get to a place to then it could be capitalized on its own without having to kind of take any more money from…
Mark Davies: From us.
Alex Dunn: From Vivint.
Mark Davies: Yes.
Rishad Purs: Got it. Then in terms of your relationship with VSLR you said you have a marketing agreement. Did you get any cash for that? Do you get—I mean if you sell a solar panel do you get money for that?
Alex Dunn: Yes, we actually make money for every solar that we sell and vice versa if they sell Smart Home services to their Solar customers we pay them a bounty for that as well.
Rishad Purs: Okay. I had just one last question. What is the steady state cash flow on actual numbers? Do you disclose that or can you give us a sense of what it is based on like, you know, let’s say a 12% attrition and a 30 multiple (cross talking)
Todd Pedersen: Yes. Isn’t that what we just disclosed?
Alex Dunn: Yes. I mean, you can take the model we provide with all the detail in it and change the assumption to 12 and 30 and get that number. I mean, all the slide has the detail in terms of all the calculation.
Rishad Purs: Got it. Okay. All right, thank you.
Todd Pedersen: Thank you.
Operator: Your next question comes from the line of Sam McGovern at Credit Suisse. Your line is now open.
27
Sam McGovern: Hey guys. Thanks for taking my questions. Just in terms of the average RMR per new subscriber, obviously you guys have made good progress in terms of getting that up over the last year plus. As you look forward, is there sort of a limit in terms of what customers are willing to pay to sort of an upper limit where you can’t really get much further above that or how do you guys sort of think about the pricing of the product over time?
Alex Dunn: Yes, so something that’s interesting, we’ve never raised pricing on, you know, like services. So, as we looked at the types of services we’re selling into the home right now our current—the current—well this season’s offering, I would say could we sell it for more? Probably, but we think it’s a price that shows and proves value to the consumer. We do believe adding additional services like Cloud Storage and others, Internet in fact, get them all bundled, there’s no question that customers will pay more money. If you add High-Speed Wireless Internet and Cloud Storage, those are additional…
Todd Pedersen: And Solar.
Alex Dunn: And solar, those are additional services that people are currently paying for, and if they’re bundled in an integrated way, the way we intend to have them bundled, for sure we’ll get higher RMR, there’s no question. We are doing that. We ran some tests in the—with the Cloud Storage business and selling it as an additional service, additional RMR and had tremendous success with that. So, with the services that you saw us—or have seen us do this current year, this past quarter, we think that’s probably fair pricing and we don’t intend to raise that pricing for those services but we will add Solar. An average customer in Solar pays $100 a month and they don’t have a problem doing that because they’re paying a power bill the month before.
Sam McGovern: Got it. So you don’t think that there’s a total sort of sticker shock in terms of a price at which people won’t go above in terms of the total bundle?
Alex Dunn: No.
Sam McGovern: Great. Then just in terms of—going back to the Solar sales force move from one company to another, roughly how many sales people moved over just in terms of order of magnitude? Then what roughly was sort of the average years of tenure they had been allowed?
Alex Dunn: Yes, so there are about 300 sales reps that went over to Solar over time. It wasn’t just in the last months but over time. Average tenure of the sales reps that went over, I don’t—I’m going to tell you I’m going to—this is going to be a guess, but it’s probably in the three-year range average tenure. Maybe slightly more than that.
Sam McGovern: Perfect. No, a guess is (cross talking)…
28
Alex Dunn: (Inaudible) I would say on that though is that we—again, that also stops too. So, there’s essentially a no-hire agreement between the two companies, and so there’s no kind of flow of employees back and forth between the two companies.
Sam McGovern: Got it. Thanks guys. I’ll pass it along.
Todd Pedersen: Thank you.
Operator: Your next question comes from the line of Todd Morgan at Jefferies. Your line is open.
Todd Morgan: Thank you. Thanks for taking the questions. Just kind of a follow-up on the Wireless offering, the micro hub. Can you talk a little bit about the value proposition for customers? I guess you talked about a 50 megabit down speed. Also, kind of how hard is it to find those 10 additional customers you target? I imagine you’re trying to get them to switch from a (inaudible) provider.
Alex Dunn: Yes, so the value proposition is a couple of things. I mean the easiest and kind of most simple value proposition is 50 megabits up and down, which is everywhere we’re selling is a lot faster than what those customers have. That’s one. Two, I think one of the things that over the last three years is we’ve kind of built the technology and kind of tested this is our ability to get customers out of a bundle. What we have found, which is probably no surprise, is there is a lot of animosity towards the cable providers that customers are in, and so something that we try to focus on is not just the high-speed at a good price but really good customer service, picking the phone up, being out there quickly. We actually have really high net promoter scores on all of our services. So, customers that for the first time are actually given a real choice of being able to have something that is actually better or faster than what they currently have and that be kind of held hostage by their kind of current cable company are pretty excited to give us an opportunity to get their business. So, it’s been actually easier than we thought of selling just an Internet kind of decoupling a bundle and selling Internet only to the customer.
Todd Morgan: Great, that’s helpful. Thank you then.
Todd Pedersen: Thanks Todd.
Alex Dunn: Thanks.
Operator: Your next question comes from the line of Omar Saadeh out of GTM Research. Your line is now open.
29
Omar Saadeh: Hey guys. Thanks for taking my question. I just have one after—I mean, most of them were already answered I think in prior questions. Could you talk a bit about the distribution channels that you might have with other companies? I think Intelco was noted in a prior release.
Todd Pedersen: What was the last one? What was the name of the company you just mentioned?
Omar Saadeh: Intelco.
Alex Dunn: I don’t know who Intelco is. That doesn’t mean I’m sure that somebody in our business maybe doing something with them, but from a channel standpoint I mean the two channels that we generate, you know, a vast majority of all our accounts through our Direct-to-Home, which is roughly 80%, and then our inside sales group. Inside sales actually generates most of its leads through Internet lead generation, paid search, those types of things. Then we have smaller partnerships that may yield a few hundred accounts a month with other channel partners that are generating leads, but nothing that would kind of rise to the level of putting it in a press release.
Omar Saadeh: Okay, thank you.
Alex Dunn: Okay, thanks.
Operator: Your next question comes from the line of Kurt Klimenko (ph) at Firestone Capital. Your line is now open.
Kurt Klimenko: Thanks. Pardon me, my question’s been answered, thanks.
Alex Dunn: Thanks.
Todd Pedersen: Thanks Kurt.
Operator: Your next question comes from the line of Jonathan Levine at Neuberger Berman. Your line is now open.
Alex Dunn: Hi Jonathan.
Mark Davies: Jonathan?
Todd Pedersen: It looks like Jonathan’s (cross talking)
Jonathan Levine: Hey, can you hear me? Sorry?
Alex Dunn: Oh, there he is.
30
Todd Pedersen: Wait a minute.
Jonathan Levine: Hi. Just one quick housekeeping question. You guys reported the EBITDA of 78.8. Does that include the 12.5 million that you talked about? So the number should really be closer to 90?
Mark Davies: Yes. Yes, those four were included in the—lower than 90 to 78.
Jonathan Levine: Okay. Then the 6.9 million, on the back page and the calculation, what exactly is that, the other adjustments?
Todd Pedersen: Yes, so those are around the R&D new business initiatives. There’ll be a—that’s a detail we usually provide in the quarter—the Q, which the Q will be out shortly so you’ll have that complete detail.
Mark Davies: I think it’s much different than what you saw last quarter.
Todd Pedersen: Yes.
Mark Davies: It’s the same fundamental adjustments.
Todd Pedersen: The reduction in the amounts that we’re adding back into those line items.
Mark Davies: We’ll send out our Q tomorrow. I think it’s tomorrow so you can get that detail, Jonathan.
Jonathan Levine: Okay. So, the 12.5 and 6.9 though are two separate items, right?
Mark Davies: Yes.
Todd Pedersen: Yes.
Alex Dunn: Yes.
Jonathan Levine: Okay, great. That was it. Thank you.
Mark Davies: Right. Thank you.
Todd Pedersen: Thanks.
31
Operator: Your next question comes from the line of Rob Chapra (ph) at (Inaudible) Investments. Your line is now open.
Rob Chapra: Hi guys. A quick question for you. I know you guys were capping the bond markets, you know, sort of at the unsecured level when bonds were closer to par. How does—how do you think about the unsecured portion that you would potentially tap if it’s closer to 86 where it’s trading today?
Alex Dunn: I mean, I think we need to get those bonds trading back at par. Luckily, I think there’s a high tolerance for a variation in interest rate with our business. We do generated high IRR on a kind of a unit basis, but where the bonds are trading and we’re working hard to kind of get them back to par.
Mark Davies: Yes.
Rob Chapra: Okay, great.
Todd Pedersen: Thanks Rob.
Rob Chapra: Thanks guys.
Operator: Your next question comes from the line of Owen Douglas at Baird. Your line is now open.
Owen Douglas: Hi guys. Thanks for taking the questions from me. Had a couple ones here. One, I’m just trying to better understand as you guys think about the branding efforts you talked about changing the way you implement it going forward, but is that going to be going forward primarily a seasonal effort or more of a sustained throughout the year initiative?
Alex Dunn: No, so if we do branding it would be seasonal targeted around helping improve—because what we saw in the test was it actually pretty significantly improved the per rep productivity on the—of a sales rep. The problem with that is is that we pay that money and we paid the sales rep kind of full commission. So, if we do something moving forward it will be associated with the summer, so it would only be in the summer, and there would be kind of a corresponding reduction in commissions if we decided to do that.
Mark Davies: Yes, said another way, it has to fit in our creation multiple and it has to work financially. So you won’t—it will not be an impact that you—like this $8 million for this last two quarters you will not see that going forward.
32
Owen Douglas: Okay, understand. That makes a lot of sense as far as, you know, offsetting that versus the commissions. On another point, you mentioned that there were customer credits that were given out this quarter, I guess to compensate for the inconvenience caused by the IT roll-out. How are those being accounted? Is that a deduction to revenue or is that an additional expense that gets recorded in G&A?
Mark Davies: Just a straight reduction to revenue.
Owen Douglas: Okay, I see.
Mark Davies: So, it’s a hundred percent—100% margin impact manifesting itself in a revenue reduction. So, that’s not a—that’s an offset to monitoring revenue but the monitoring revenue is still solid at $49 million per month that we reported at the end of Q3.
Owen Douglas: Okay, I see. As far as those RMR numbers that were presented, those numbers, is that also accounting for the customer credits?
Mark Davies: No, the 49 is the ongoing kind of 899,000 customers generating $49 million a month. The credits reduces that revenue on a one-time basis.
Owen Douglas: Okay, I see.
Mark Davies: Does that make sense?
Owen Douglas: Yes, yes, I think so. If not, I’ll follow-up offline on that.
Mark Davies: Yes.
Owen Douglas: But just one additional question here. Just as you think about the number of these micro hubs, if you were to look forward to perhaps the next year or maybe, you know, two years is a more appropriate timeframe, what’s sort of a growth do you think you can get relative to the current base of micro hubs that you currently have installed?
Alex Dunn: I mean, I think—and we’ll again be coming out with some more specific numbers, but one of the reasons we’re very excited about the Internet offering is we’re seeing with the same sales person a significant increase in productivity in terms of how many customers they can sell per day. So, we’re very excited about the potential of taking the existing sales force or some subset of the existing sales force and having them generate Internet customers with—it could be Internet or the whole—all the services but with the Internet as the backbone at a much higher rate then we can create a customer around Security or Smart Home as a standalone service.
33
Mark Davies: Yes, and I would say that our intentions and the reason why we are excited about this and why we’re investing in it, it’s accretive on almost every level to our core business. So, if you think about our 30 multiple on creation cost, this should be less. We expect this to be less. If you think about the time to breakeven, time should be less. If you think about the productivity of putting customers on which rolls in the creation costs, much higher. So, our goal right now is just to make sure we get to that per unit economics. The real variable after that is how quickly you can fill out a hub to get to the full value of that and that’s kind of our sales model and so far it’s been an easier sale than selling Smart Home and Security on a per unit basis. So, that’s the goal.
Owen Douglas: Okay. If I think about it right now you guys have about eight hundred and—about—let’s call it 900,000 subscribers, as you look across your current network, what proportion roughly speaking would you say that you feel you’re already have the customer relationships where were you to get them to take up this Internet offering you could sort of reach a penetration of your 10 households per micro hub? Is that—you know, how should we think about it? Ten percent? Twenty percent? Thirty percent of your 900,000 subscriber base?
Alex Dunn: Yes, so I think you can—we don’t really think about it like that. One because we’re not going to go to a market specifically because we have a high concentration of customers. Something even maybe more interesting is we have purposely not—as we’ve entered into a market not tried to upsell our current customer base to build out the micro hubs. We really wanted to know if we could sell this as a standalone service. We know we can upgrade a lot of customers to this service. We have done that on the Solar side cross-selling the two services. We know we can do that. So, we wanted to know if a non-Vivint customer would see value in the offering that we have. Then the other question is is what—where our customers sit by market. We talked about topography and trees being a limiting factor and where we can roll-out in our current offering, our current technology. We haven’t really thought about it in percentages. We just know that when we send out a sales rep, the productivity of a sales rep selling the Wireless offering, which, by the way, includes VoIP and will…
Todd Pedersen: Space…
Alex Dunn: Space Monkey and then added on to that will be Home Automation and Security is very high. It’s very impressive. So, we’re not as—not that we won’t do it. We’ll take advantage of it, there’s no question, but we’re not so worried about it. We just know if we build out in that market and we do have customers that will fit inside of that network that we will be able to upgrade them because we’re upgrading non-Vivint customers at a very high rate.
34
Owen Douglas: Okay, understood. I’m just trying to get a sense of the proverbial low hanging fruit here because that…
Alex Dunn: Yes, (cross talking)
Owen Douglas: That’s the other thing which could really help improve the economics of this project and turn it to be a positive EBITDA contributor in the near term. So, if you wouldn’t mind just indulging me a bit. How should we sort of think about scoping this opportunity, that low hanging fruit?
Todd Pedersen: Yes, I think two points. One is, we don’t think we have any problem going to market with this in any space, in any place that has Vivint or not—doesn’t have Vivint. In fact, we’re selling 90% of our Internet that isn’t Vivint—that aren’t Vivint customers. We actually choose markets based on the geography, the topology of how we’d set up the network and the clustering of homes. What we’re actually finding is it’s easier to go in and sell Internet and then come back later and sell Home Automation. Now all of a sudden you have $120 customer. So, it’s the reverse. This is the tip of the spear. Internet is a tip of the spear for our Smart Home. It’s not the opposite way around. So, when we said we’d cover 30—we could cover probably 30 million homes, that’s a far greater opportunity low hanging fruit than it is trying to find where the 900,000 homes are set within Vivint. In fact, we don’t have the clustering of Vivint customers to go in and sell a neighborhood out. We have neighborhoods but not that kind of density. So the—a great derivative of this business is we get to sell Smart Homes during the winter, during the spring, we can sell it all year round by just selling Internet customers and upgrade to the Vivint suite. That’s how you (cross talking)…
Alex Dunn: That’s not the answer you’re looking for, but it’s just—it’s the truth that…
Todd Pedersen: It is—this is how it works.
Alex Dunn: It’s how it’s working.
Todd Pedersen: You need to look at it in terms of the unit of one and how the unit of one economics and can we get to 10 on filling up the hubs. To this point we’ve had pretty good success with that. We’re just not wanting to go out and blow through this immediately until everything has hardened. That’s why you see us with 5,000 customers instead of 15,000 customers at this time.
Owen Douglas: Okay, understood. Just to double-check on something here. You said—so right now you were talking about the initiative to lead with the Internet offering and then add on the more of the Smart Home technology product suite which you currently offer currently.
35
Todd Pedersen: Yes, so it’s—so right now, here’s what I would say. It’s not that it’s leading now because we’re not going to build out infrastructure across the US over the next months. It’s going to be years. We have two markets opened up right now. We might end up with three or four total next year. We’re—if you’ve seen us we kind of figure things out and we start to scale when we feel like we’ve got a process and a system dialed in. But we—in Utah and in Texas and the two markets we have opened up, we have teams, they’re Vivint people selling Wireless Internet, VoIP and Cloud Storage specifically. What Mark mentioned was we also have people that sell Security Home Automation specifically. They go back in after the Wireless network is built out and we have customer base and we have a very nice adoption rate of customers when we go back into a Wireless networked neighborhood and upgrade them to Home Automation and Security. So, it’s pretty interesting.
Not that it doesn’t happen in reverse. Because we obviously if we’re building out a network and someone is a Vivint, a current Vivint customer, we’re going to sign them up. It just isn’t our—that’s not the reason we’re going to a market. It just so happens that we started doing some initial testing sending sales reps into a networked neighborhood with Wireless Internet and the adoption rate is phenomenal. The adoption rate which is the reverse of the adoption rate—this low hanging fruit concept you had, it’s the opposite. We get the Internet built out. People are—someone said this, maybe Alex, that people really don’t like the incumbent players, the cablecos, and they like a company that will answer the phone, that will deliver quick service. By the way, for the most part we’re offering a service they can’t access right now. Fifty megabits up and down for $55 a month is a phenomenal value. So, they’re pleased with the Company, pleased with the service. At times their service is better and faster than even that. So, when we go back in and say “Hey, by the way, we do Security Home Automation, Smart Home,” they’re all ears. So, it’s been a very pleasant surprise.
Owen Douglas: Okay, sounds good. Sort of final ask, I’ll have to ask this question. But when should we expect to hear more on your financing needs? You mentioned that you’re going to go through the forecasting process to assess what those needs might be. When should we expect to hear something at least with regards to that 2015 capital raise?
Mark Davies: Yes, Q1. We’re going through our planning process working closely with internal and then obviously with Blackstone we’re thinking—you know, we’re anticipating what we’ll do with Wireless and we’ll be back to you in Q1 with kind of that timing.
Todd Pedersen: The plan, not necessarily to raise the money, but the plan…
36
Mark Davies: We won’t raise money in Q1 likely but we’ll talk to you about that.
Owen Douglas: Okay. Thank you very much guys.
Alex Dunn: Thanks Owen.
Todd Pedersen: Thanks Owen.
Dale R. Gerard: Hey John, we’ve got time for one more question.
Operator: We do have one more question from Saliq Khan at Imperial Capital. Your line is open.
Saliq Khan: Great. Thank you. Real quick housecleaning question guys. As I’m looking at the accounts payable overall, it looks like that you guys were able to either successfully renegotiate the contracts over there that’s why you saw that number pick up or something else that occurred, but in either case those numbers that I was looking at was the accrued payroll and commissions number. You saw that number dramatically pick up by 2.2 times the previous—by the end of December 31st. What exactly happened over there?
Mark Davies: We’re looking for the number that you have here in our back up.
Alex Dunn: So, you’re going from December to the end of—so, I mean that’s just the commission buildup for the summer selling season, if I’m thinking…
Mark Davies: It may be a timing issue on—but it’s the…
Alex Dunn: Space (ph) of the commission. Because if you’re going from December where we’re at kind of a low point in terms of the commissions that are accrued to a point now—I mean, most of our—90% of our commissions, the first backend payment which is about 90% of the commissions do—that they haven’t been paid for the summer are paid in this fourth quarter period in this October to November timeframe. So you would…
Mark Davies: That accrues through Q3—Q2 and Q3 and we pay it in Q4.
Saliq Khan: Got it, perfect. That just jumped out at me real quick so I wanted to ask. But, thank you guys.
Alex Dunn: Okay, thank you.
37
Mark Davies: Have a good night guys.
Todd Pedersen: Hey, again, we appreciate everyone getting on the phone today. We had a lot of great questions. Hopefully we answered all of them appropriately. If anyone needs to follow-up, please don’t call me, call Dale.
Alex Dunn: Thanks everyone.
Mark Davies: Take care. See you.
38
APX Group Holdings, Inc.
Financial and Operating Highlights
Third Quarter 2014
forward-looking statements
This presentation contains “forward looking statements”, including but not limited to, statements related to the performance of our business, our
financial results, our liquidity and capital resources, our plans, strategies and prospects, both business and financial and other non-historical statements. These statements are based on the beliefs and assumptions of our management. Although we
believe that our plans, intentions and expectations reflected in or suggested by these forward-looking statements are reasonable, we cannot assure you that we will achieve or realize these plans, intentions or expectations. Forward-looking
statements are inherently subject to risks, uncertainties and assumptions. Generally, statements that are not historical facts, including statements concerning our possible or assumed future actions, business strategies, events or results of
operations, are forward-looking statements. These statements may be preceded by, followed by or include the words
“believes,” “estimates,”
“expects,” “projects,” “forecasts,” “may,” “will,” “should,” “seeks,” “plans,” “scheduled,” “anticipates” or “intends” or similar
expressions.
Forward-looking statements are not guarantees of performance. You should not put undue reliance on these statements which speak only as of this date
hereof. You should understand that the following important factors, in addition to those discussed in “Risk Factors” in the Company’s annual report on form 10-K for the year ended December 31, 2013 (the“10-K”), filed
with the Securities Exchange Commission (SEC), as such factors may be updated from time to time in our periodic filings with the SEC, which are available on the SEC’s website at www.sec.gov, could affect our future results and could cause those
results or other outcomes to differ materially from those expressed or implied in our forward-looking statements:
risks of the security and home automation
industry, including risks of and publicity surrounding the sales, subscriber origination and retention process; the highly competitive nature of the security and home automation industry and product introductions and promotional activity by our
competitors; litigation, complaints or adverse publicity;
the impact of changes in consumer spending patterns, consumer preferences, local, regional, and national
economic conditions, crime, weather, demographic trends and employee availability; adverse publicity and product liability claims; increases and/or decreases in utility and other energy costs, increased costs related to utility or governmental
requirements; and cost increases or shortages in security and home automation technology products or components.
In addition, the origination and retention of new
subscribers will depend on various factors, including, but not limited to, market availability, subscriber interest, the availability of suitable components, the negotiation of acceptable contract terms with subscribers, local permitting, licensing
and regulatory compliance, and our ability to manage anticipated expansion and to hire, train and retain personnel, the financial viability of subscribers and general economic conditions. We undertake no obligations to update or revise publicly any
forward-looking statements, whether as a result of new information, future events or otherwise.
These and other factors that could cause actual results to differ
from those implied by the forward-looking statements in this presentation are more fully described in the “Risk Factors” section of our annual report filed on Form 10-K for the year ended December 31, 2013 as such factors may be
updated from time to time in our periodic filings with the SEC. The risks described in “Risk Factors” are not exhaustive. New risk factors emerge from time to time and it is not possible for us to predict all such risk factors, nor can we
assess the impact of all such risk factors on our business or the extent to which any factor or combination of factors may cause actual results to differ materially from those contained in any forward-looking statements. All forward-looking
statements attributable to us or persons acting on our behalf are expressly qualified in their entirety by the foregoing cautionary statements. We undertake no obligations to update or revise publicly any forward-looking statements, whether as a
result of new information, future events or otherwise.
| 2 |
non-GAAP financial measures
This presentation includes Adjusted EBITDA and Steady-State Free Cash Flow (“SSFCF”), which are supplemental measures that are not required by, or
presented in accordance with, accounting principles generally accepted in the United States (“GAAP”). Adjusted EBITDA and SSFCF are not measurements of our financial performance under GAAP and should not be considered as an alternative to
net income or any other measure derived in accordance with GAAP or as alternatives to cash flows from operating activities as a measure of our liquidity. We believe that Adjusted EBITDA provides useful information about flexibility under our
covenants to investors, lenders, financial analysts and rating agencies since these groups have historically used EBITDA-related measures in our industry, along with other measures, to estimate the value of a company, to make informed investment
decisions, and to evaluate a company’s ability to meet its debt service requirements. Adjusted EBITDA eliminates the effect of non-cash depreciation of tangible assets and amortization of intangible assets, much of which results from
acquisitions accounted for under the purchase method of accounting. Adjusted EBITDA also eliminates the effects of interest rates and changes in capitalization which management believes may not necessarily be indicative of a company’s
underlying operating performance. Adjusted EBITDA is also used by us to measure covenant compliance under the indenture governing our senior secured notes, the indenture governing our senior unsecured notes and the credit agreement governing our
revolving credit facility.
We believe that SSFCF is a useful measure of pre-levered cash that is generated by the business after the cost of replacing recurring
revenue lost to attrition, but before the cost of new subscribers driving recurring revenue growth. The use of SSFCF is subject to certain limitations. For example, SSFCF adjusts for cash items that are ultimately within management’s discretion
to direct and therefore the measure may imply that there is less or more cash that is available for the Company’s operations than the most comparable GAAP measure.
We caution investors that amounts presented in accordance with our definition of Adjusted EBITDA and SSFCF may not be comparable to similar measures disclosed by other issuers,
because not all issuers and analysts calculate Adjusted EBITDA and SSFCF in the same manner.
See Annex A of this presentation for a reconciliation of Adjusted
EBITDA and SSFCF to net loss for the Company, which we believe is the most closely comparable financial measure calculated in accordance with GAAP. Adjusted EBITDA and SSFCF should be considered in addition to and not as a substitute for, or
superior to, financial measures presented in accordance with GAAP.
| 3 |
participants
Todd
Pedersen Chief Executive Officer Alex Dunn President Mark Davies Chief Financial Officer Dale R. Gerard VP, Finance & Treasurer
| 4 |
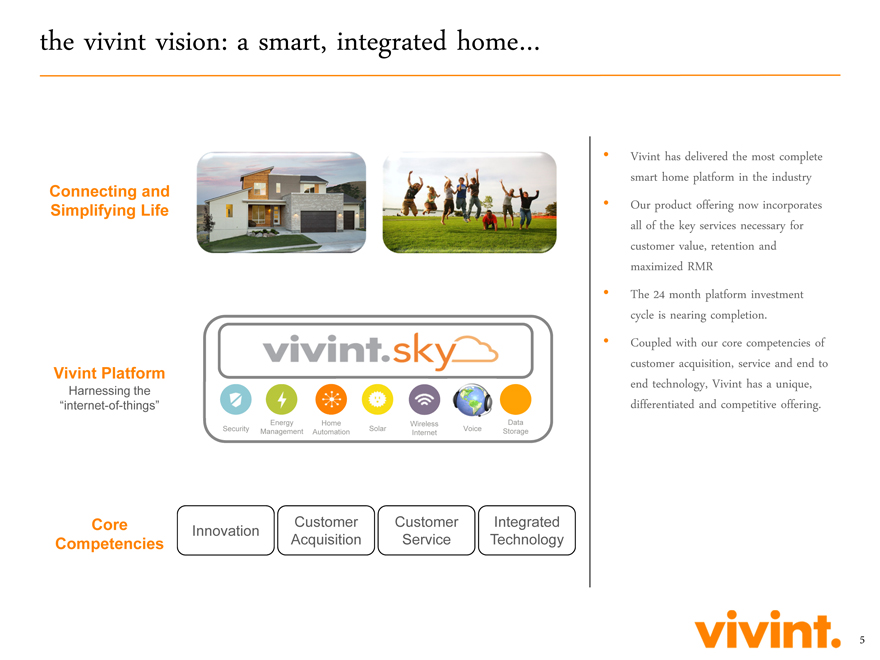
the vivint vision: a smart, integrated home…
Connecting and Simplifying Life
Vivint Platform
Harnessing the
“internet-of-things”
Core Competencies
Customer Customer Integrated
Innovation Acquisition Service Technology
Vivint has delivered the most complete smart home
platform in the industry
Our product offering now incorporates all of the key services necessary for customer value, retention and maximized RMR
The 24 month platform investment cycle is nearing completion.
Coupled with our core
competencies of customer acquisition, service and end to end technology, Vivint has a unique, differentiated and competitive offering.
| 5 |
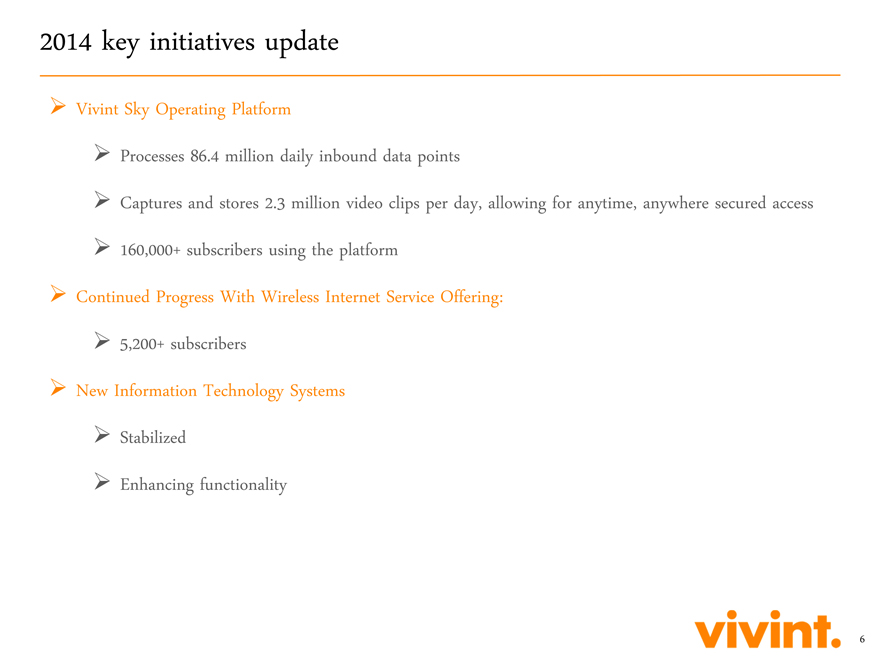
2014 key initiatives update
Vivint Sky Operating Platform
Processes 86.4 million daily inbound data
points
Captures and stores 2.3 million video clips per day, allowing for anytime, anywhere secured access 160,000+ subscribers using the platform Continued
Progress With Wireless Internet Service Offering: 5,200+ subscribers New Information Technology Systems Stabilized Enhancing functionality
| 6 |
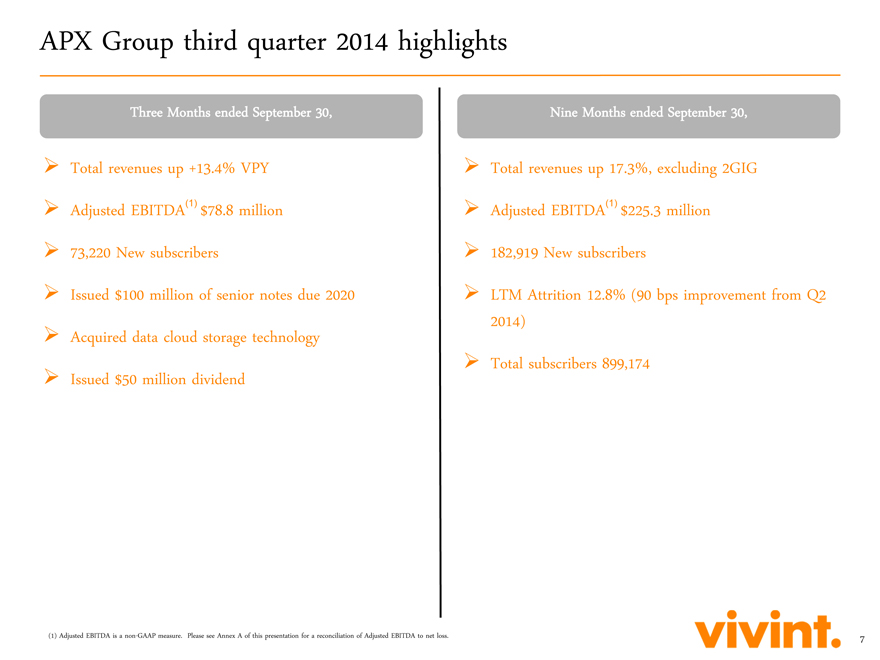
APX Group third quarter 2014 highlights
Three Months ended September 30,
Total revenues up +13.4% VPY
Adjusted EBITDA(1) $78.8 million
73,220 New subscribers
Issued $100 million of senior notes due 2020
Acquired data cloud storage technology
Issued $50 million dividend
Nine Months ended September 30,
Total revenues up 17.3%, excluding 2GIG
Adjusted EBITDA(1) $225.3 million
182,919 New subscribers
LTM Attrition 12.8% (90 bps improvement from Q2
2014)
Total subscribers 899,174
(1) Adjusted EBITDA is a non-GAAP measure. Please see Annex A of this presentation for a reconciliation of Adjusted EBITDA to net loss.
| 7 |
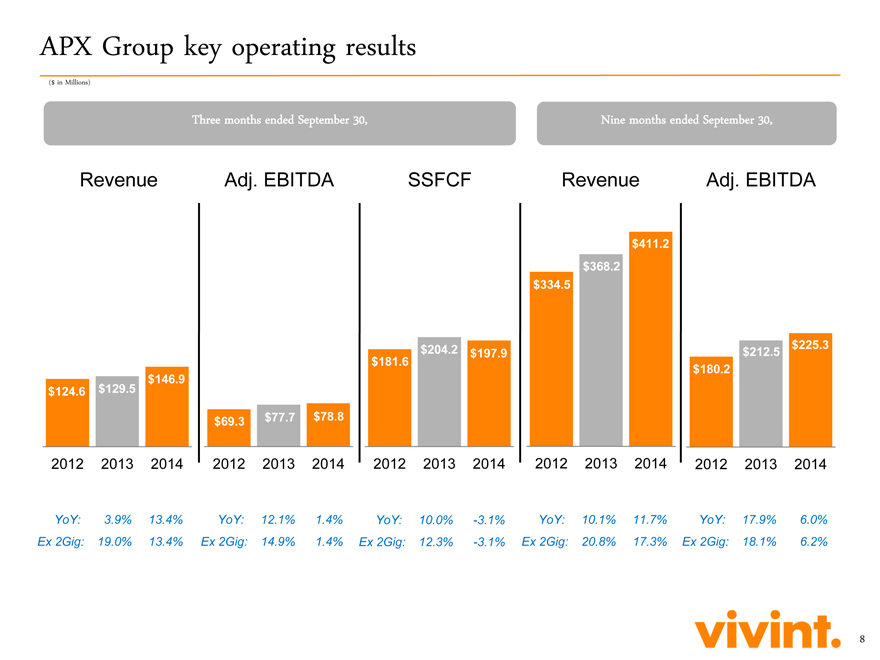
APX Group key operating results
($ in Millions)
Three months ended September 30, Nine months ended September 30,
Revenue Adj. EBITDA SSFCF Revenue Adj. EBITDA
$411.2
$368.2
$334.5
$204.2 $197.9 $212.5 $225.3
$181.6 $180.2
$146.9
$124.6 $129.5
$69.3 $77.7 $78.8
2012 2013 2014 2012 2013 2014 2012 2013 2014 2012 2013 2014 2012 2013 2014
YoY: 3.9% 13.4% YoY: 12.1% 1.4% YoY: 10.0% -3.1% YoY: 10.1% 11.7% YoY: 17.9% 6.0%
Ex 2Gig: 19.0% 13.4% Ex 2Gig: 14.9% 1.4% Ex 2Gig: 12.3% -3.1% Ex 2Gig: 20.8% 17.3% Ex 2Gig: 18.1% 6.2%
| 8 |
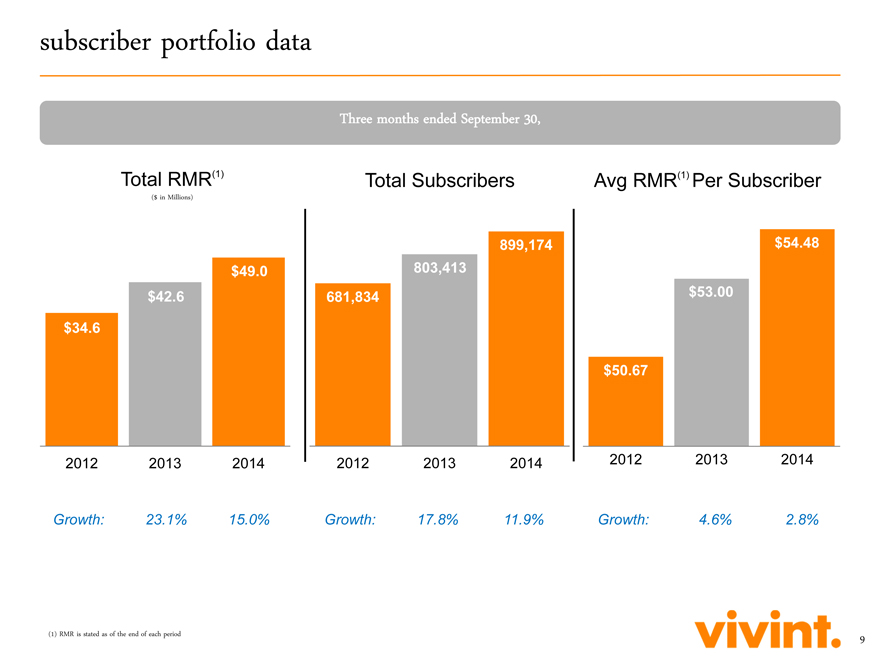
subscriber portfolio data Three months ended September 30, Total RMR(1) Total Subscribers Avg RMR(1) Per
Subscriber ($ in Millions) 899,174 $54.48 $49.0 803,413 $42.6 681,834 $53.00 $34.6 $50.67 2012 2013 2014 2012 2013 2014 2012 2013 2014
Growth: 23.1% 15.0% Growth:
17.8% 11.9% Growth: 4.6% 2.8% (1) RMR is stated as of the end of each period 9
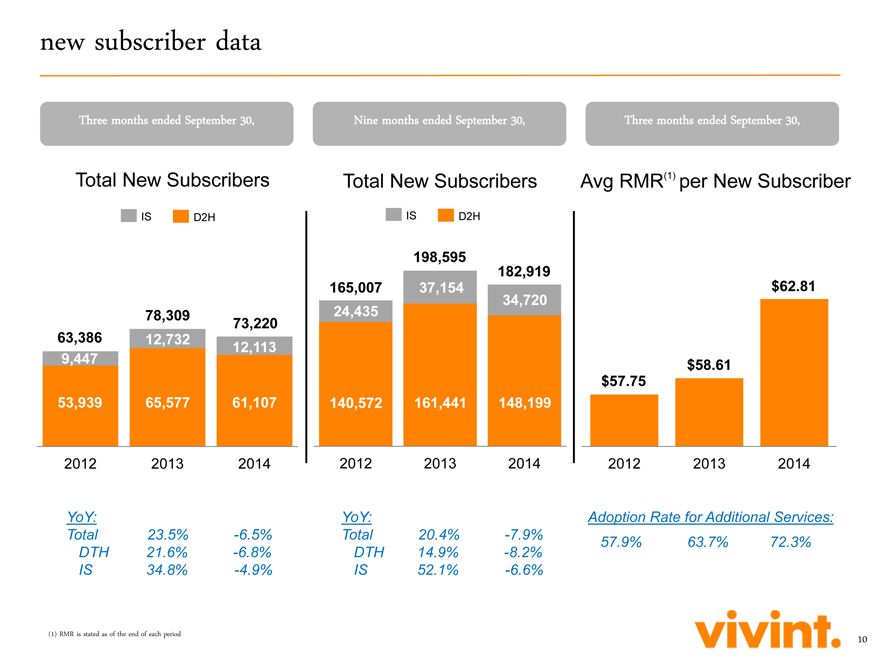
new subscriber data
Three
months ended September 30, Nine months ended September 30, Three months ended September 30,
Total New Subscribers Total New Subscribers Avg RMR(1)
per New Subscriber
IS D2H IS D2H
198,595
182,919
165,007 37,154 $62.81
34,720
78,309 24,435
73,220
63,386 12,732 12,113
9,447 $58.61
$57.75
53,939 65,577 61,107 140,572 161,441 148,199
2012 2013 2014 2012 2013 2014 2012 2013 2014
YoY: YoY: Adoption Rate for Additional Services:
Total 23.5% -6.5% Total
20.4% -7.9% 57.9% 63.7% 72.3%
DTH 21.6% -6.8% DTH 14.9% -8.2%
IS 34.8% -4.9%
IS 52.1% -6.6%
| (1) | RMR is stated as of the end of each period |
10
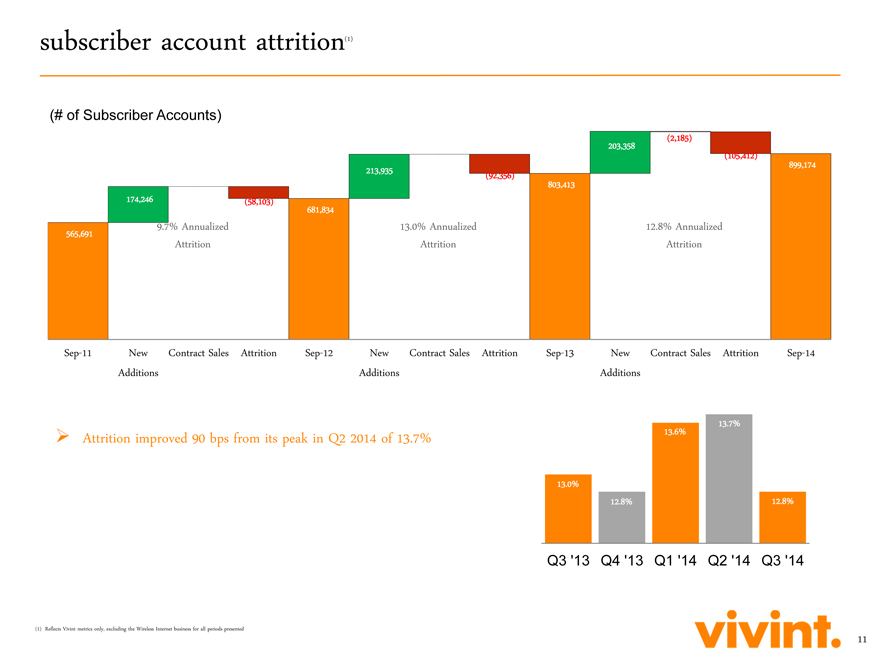
subscriber account attrition(1)
(# of Subscriber Accounts)
(2,185)
203,358
(105,412)
899,174
213,935 (92,356)
803,413
174,246 (58,103)
681,834
9.7% Annualized 13.0% Annualized 12.8% Annualized
565,691
Attrition Attrition Attrition
Sep-11 New Contract Attrition Sep-12 New Contract Attrition
Additions Sales Additions Sales
Attrition improved 90 bps from its peak in Q2 2014 of 13.7%
13.7%
13.6%
13.0%
12.8% 12.8%
Reflects Vivint metrics only, excluding the Wireless Internet business for all
periods presented
11
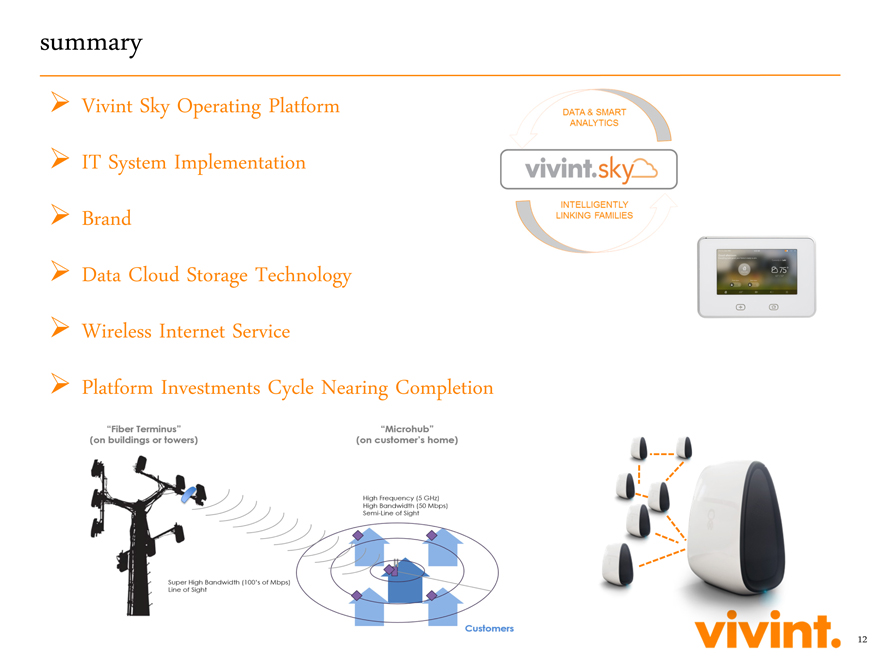
summary
Vivint Sky
Operating Platform IT System Implementation Brand Data Cloud Storage Technology Wireless Internet Service
Platform Investments Cycle Nearing Completion
12

Q & A
APX Group Holdings, Inc.
Consolidated Financial Statements
Three and Nine Months Ended
September 30, 2014 and 2013
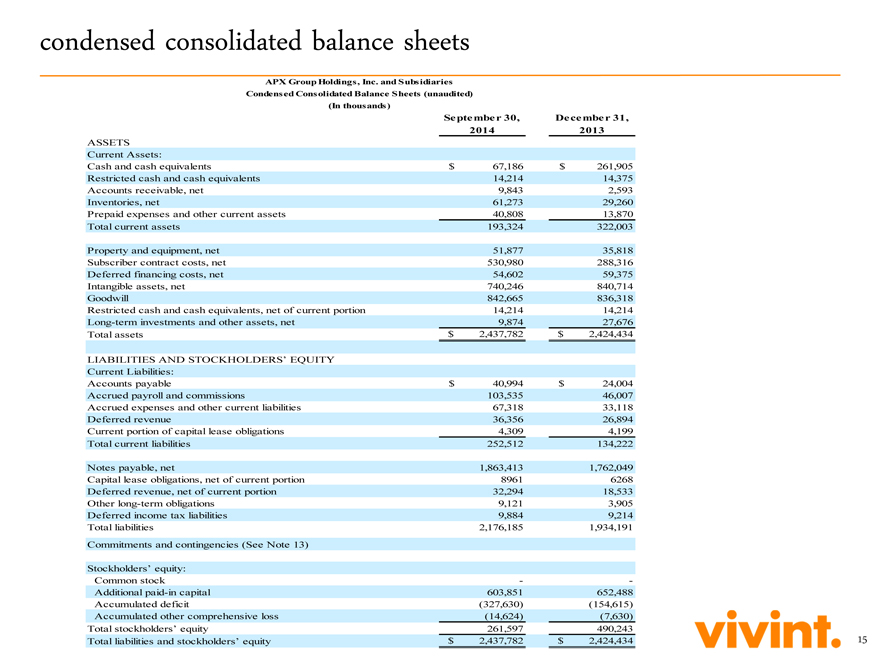
condensed consolidated balance sheets
APX Group Holdings, Inc. and Subsidiaries
Condensed Consolidated Balance Sheets (unaudited)
(In thousands)
Se pte mbe r 30, De ce mbe r 31,
2014 2013
ASSETS
Current Assets:
Cash and cash equivalents $ 67,186 $ 261,905
Restricted cash and cash equivalents 14,214 14,375
Accounts receivable, net 9,843 2,593
Inventories, net 61,273 29,260
Prepaid expenses and other current assets
40,808 13,870
Total current assets 193,324 322,003
Property and equipment,
net 51,877 35,818
Subscriber contract costs, net 530,980 288,316
Deferred
financing costs, net 54,602 59,375
Intangible assets, net 740,246 840,714
Goodwill 842,665 836,318
Restricted cash and cash equivalents, net of current
portion 14,214 14,214
Long-term investments and other assets, net 9,874 27,676
Total assets $ 2,437,782 $ 2,424,434
LIABILITIES AND STOCKHOLDERS’
EQUITY
Current Liabilities:
Accounts payable $ 40,994 $ 24,004
Accrued payroll and commissions 103,535 46,007
Accrued expenses and other current liabilities
67,318 33,118
Deferred revenue 36,356 26,894
Current portion of capital lease
obligations 4,309 4,199
Total current liabilities 252,512 134,222
Notes
payable, net 1,863,413 1,762,049
Capital lease obligations, net of current portion 8961 6268
Deferred revenue, net of current portion 32,294 18,533
Other long-term obligations 9,121 3,905
Deferred income tax liabilities 9,884 9,214
Total liabilities 2,176,185
1,934,191
Commitments and contingencies (See Note 13)
Stockholders’
equity:
Common stock — -
Additional paid-in capital 603,851 652,488
Accumulated deficit (327,630) (154,615)
Accumulated other comprehensive
loss (14,624) (7,630)
Total stockholders’ equity 261,597 490,243
Total liabilities and stockholders’ equity $ 2,437,782 $ 2,424,434
15
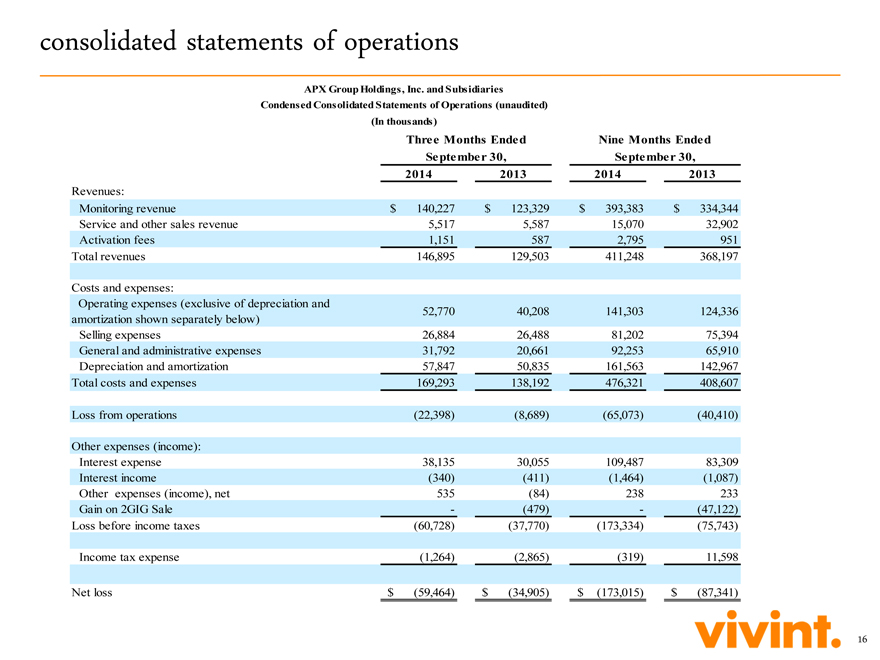
consolidated statements of operations
APX Group Holdings, Inc. and Subsidiaries
Condensed Consolidated Statements of Operations
(unaudited)
(In thousands)
Three Months Ended Nine Months Ended
September 30, September 30,
2014 2013 2014 2013
Revenues:
Monitoring revenue $ 140,227 $ 123,329 $ 393,383 $ 334,344
Service and other sales revenue 5,517 5,587 15,070 32,902
Activation fees 1,151 587 2,795 951
Total revenues 146,895 129,503 411,248 368,197
Costs and expenses:
Operating expenses (exclusive of depreciation and
52,770 40,208 141,303
124,336
amortization shown separately below)
Selling expenses 26,884 26,488
81,202 75,394
General and administrative expenses 31,792 20,661 92,253 65,910
Depreciation and amortization 57,847 50,835 161,563 142,967
Total costs and
expenses 169,293 138,192 476,321 408,607
Loss from operations (22,398) (8,689) (65,073) (40,410)
Other expenses (income):
Interest expense 38,135 30,055 109,487 83,309
Interest income (340) (411) (1,464) (1,087)
Other expenses (income), net 535
(84) 238 233
Gain on 2GIG Sale — (479) — (47,122)
Loss
before income taxes (60,728) (37,770) (173,334) (75,743)
Income tax expense (1,264) (2,865) (319) 11,598
Net loss $ (59,464) $ (34,905) $ (173,015) $ (87,341)
16
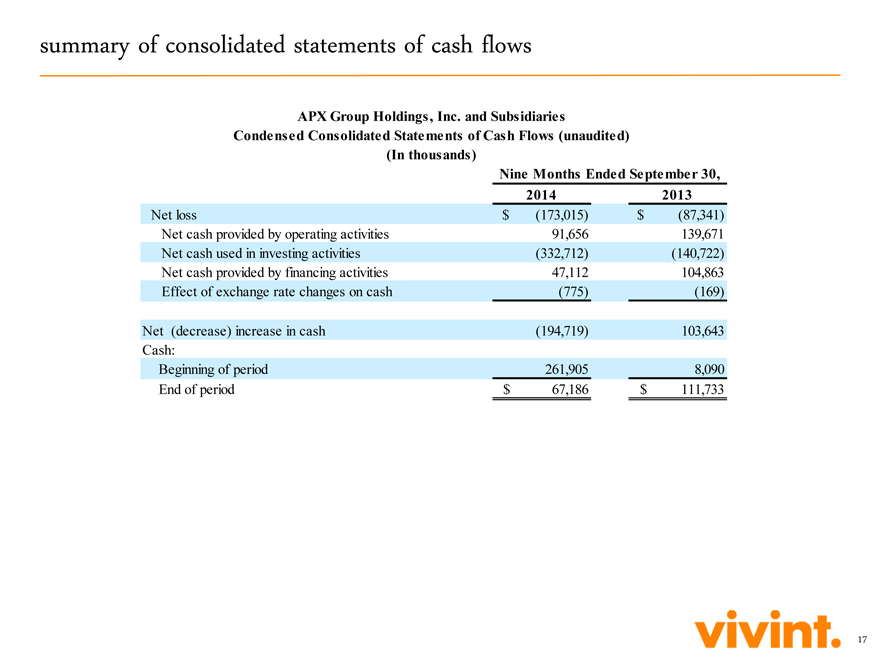
summary of consolidated statements of cash flows
APX Group Holdings, Inc. and Subsidiaries
Condensed Consolidated Statements of Cash Flows
(unaudited)
(In thousands)
Nine Months Ended September 30,
2014 2013
Net loss $ (173,015) $ (87,341)
Net cash provided by operating activities 91,656 139,671
Net cash used in investing activities
(332,712) (140,722)
Net cash provided by financing activities 47,112 104,863
Effect of exchange rate changes on cash (775) (169)
Net (decrease) increase in cash
(194,719) 103,643
Cash:
Beginning of period 261,905 8,090
End of period $ 67,186 $ 111,733
17
APX Group Holdings, Inc.
Annex A
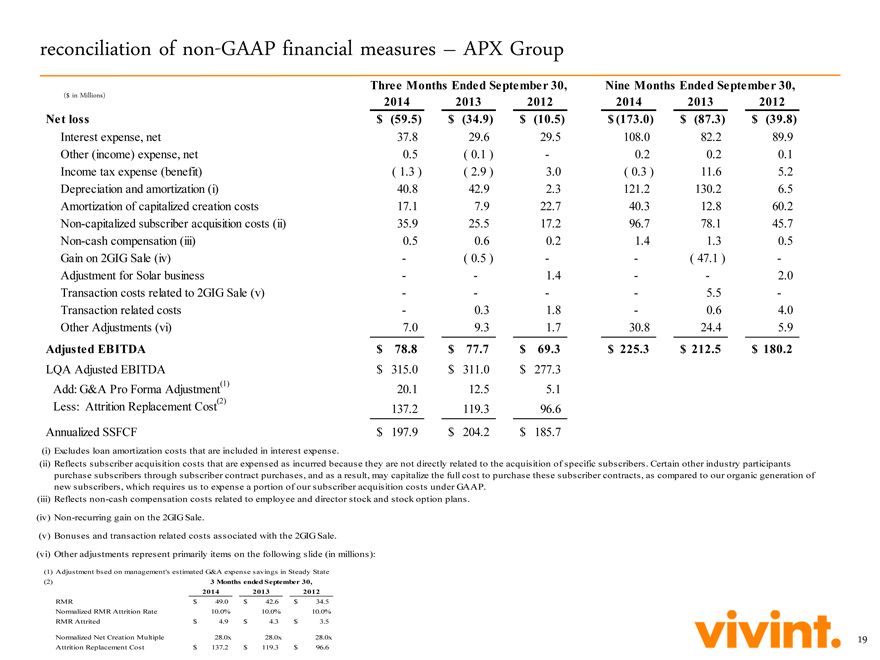
reconciliation of non-GAAP financial measures – APX Group Three Months Ended September 30, Nine
Months Ended September 30, ($ in Millions)
2014 2013 2012 2014 2013 2012 Net loss $ (59.5) $ (34.9) $ (10.5) $ (173.0) $ (87.3) $
(39.8) Interest expense, net 37.8 29.6 29.5 108.0 82.2 89.9
Other (income) expense, net 0.5 ( 0.1 ) — 0.2 0.2 0.1 Income tax expense (benefit) ( 1.3 ) ( 2.9 )
3.0 ( 0.3 ) 11.6 5.2 Depreciation and amortization (i) 40.8 42.9 2.3 121.2 130.2 6.5 Amortization of capitalized creation costs 17.1 7.9 22.7 40.3 12.8 60.2 Non-capitalized subscriber acquisition costs (ii) 35.9 25.5 17.2 96.7 78.1 45.7
Non-cash compensation (iii) 0.5 0.6 0.2 1.4 1.3 0.5 Gain on 2GIG Sale (iv) — ( 0.5 ) — — ( 47.1 ) - Adjustment for Solar business —
— 1.4 —— 2.0
Transaction costs related to 2GIG Sale (v) — — — — 5.5 - Transaction related costs — 0.3 1.8 — 0.6
4.0 Other Adjustments (vi) 7.0 9.3 1.7 30.8 24.4 5.9
Adjusted EBITDA $ 78.8 $ 77.7 $ 69.3 $ 225.3 $ 212.5 $ 180.2 LQA Adjusted EBITDA $ 315.0 $ 311.0 $ 277.3
Add: G&A Pro Forma Adjustment(1) 20.1 12.5 5.1
Less: Attrition Replacement Cost(2) 137.2 119.3 96.6 Annualized SSFCF $ 197.9 $ 204.2 $ 185.7 (i) Excludes loan
amortization costs that are included in interest expense. (ii) Reflects subscriber acquisition costs that are expensed as incurred because they are not directly related to the acquisition of specific subscribers. Certain other industry participants
purchase subscribers through subscriber contract purchases, and as a result, may capitalize the full cost to purchase these subscriber contracts, as compared to our organic generation of new subscribers, which requires us to expense a portion of our
subscriber acquisition costs under GAAP.
(iii) Reflects non-cash compensation costs related to employee and director stock and stock option plans. (iv)
Non-recurring gain on the 2GIG Sale.
| (v) | Bonuses and transaction related costs associated with the 2GIG Sale. (vi) Other adjustments represent primarily items on the following slide (in millions): |
| (1) | Adjustment bsed on management’s estimated G&A expense savings in Steady State (2) 3 Months ended September 30, 2014 2013 2012 RMR $ 49.0 $ 42.6 $ 34.5 |
Normalized RMR Attrition Rate 10.0% 10.0% 10.0%
RMR Attrited $ 4.9 $ 4.3 $ 3.5 Normalized Net Creation Multiple 28.0x 28.0x 28.0x
Attrition Replacement Cost $ 137.2 $ 119.3 $ 96.6 19
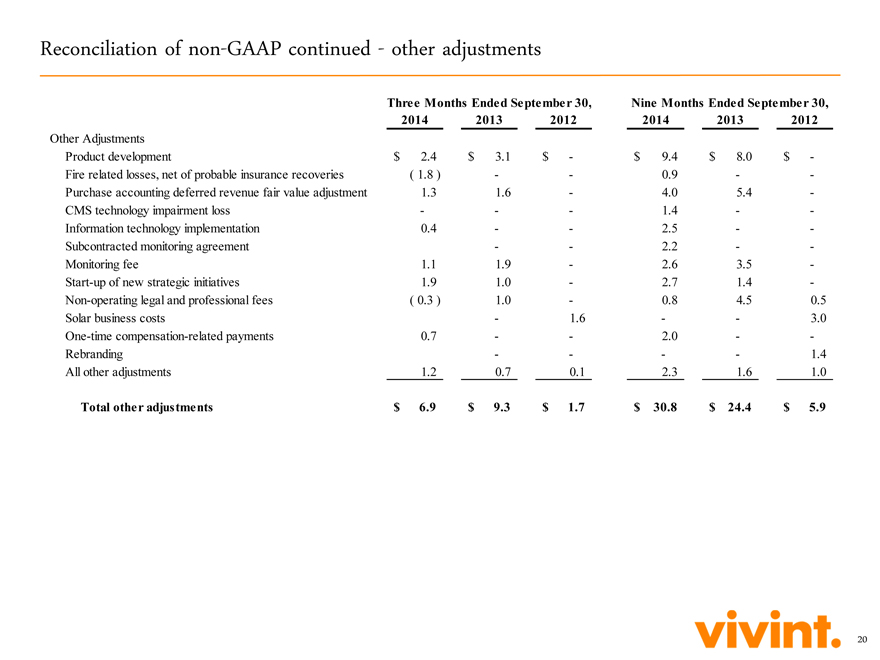
Reconciliation of non-GAAP continued—other adjustments
Three Months Ended September 30, Nine Months Ended September 30,
2014 2013 2012 2014
2013 2012
Other Adjustments
Product development $ 2.4 $ 3.1 $— $ 9.4 $
8.0 $ -
Fire related losses, net of probable insurance recoveries ( 1.8 ) —— 0.9 — -
Purchase accounting deferred revenue fair value adjustment 1.3 1.6 — 4.0 5.4 -
CMS
technology impairment loss ——— 1.4 — -
Information technology implementation 0.4 —— 2.5 — -
Subcontracted monitoring agreement —— 2.2 — -
Monitoring fee 1.1 1.9 — 2.6
3.5 -
Start-up of new strategic initiatives 1.9 1.0 — 2.7 1.4 -
Non-operating legal and professional fees ( 0.3 ) 1.0 — 0.8 4.5 0.5
Solar business costs — 1.6 —— 3.0
One-time
compensation-related payments 0.7 —— 2.0 — -
Rebranding —— —— 1.4
All other adjustments 1.2 0.7 0.1 2.3 1.6 1.0
Total other adjustments $ 6.9 $ 9.3 $ 1.7 $ 30.8
$ 24.4 $ 5.9
20
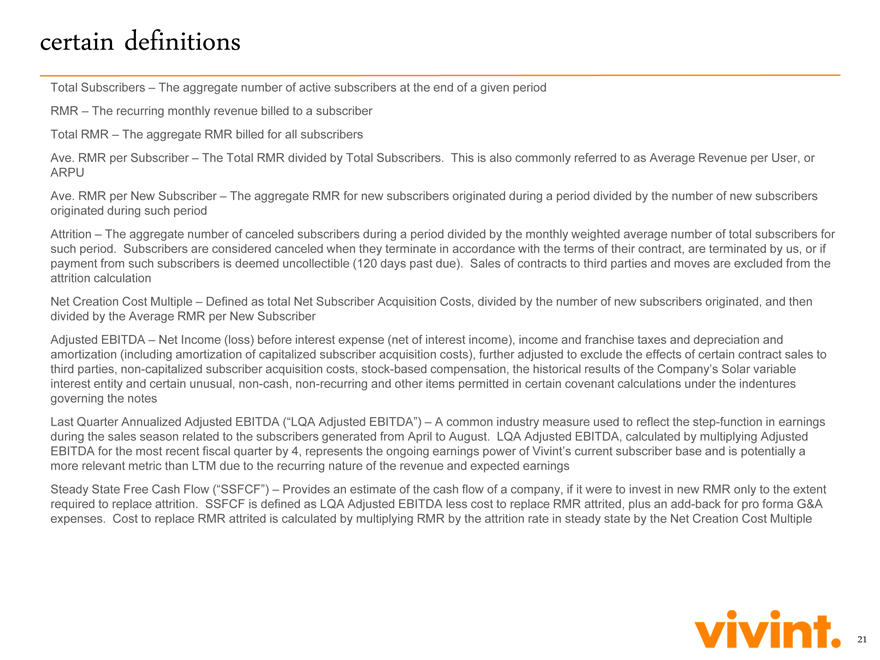
certain definitions
Total
Subscribers – The aggregate number of active subscribers at the end of a given period RMR – The recurring monthly revenue billed to a subscriber Total RMR – The aggregate RMR billed for all subscribers
Ave. RMR per Subscriber – The Total RMR divided by Total Subscribers. This is also commonly referred to as Average Revenue per User, or
ARPU
Ave. RMR per New Subscriber – The aggregate RMR for new subscribers originated
during a period divided by the number of new subscribers originated during such period Attrition – The aggregate number of canceled subscribers during a period divided by the monthly weighted average number of total subscribers for such period.
Subscribers are considered canceled when they terminate in accordance with the terms of their contract, are terminated by us, or if payment from such subscribers is deemed uncollectible (120 days past due). Sales of contracts to third parties and
moves are excluded from the attrition calculation Net Creation Cost Multiple – Defined as total Net Subscriber Acquisition Costs, divided by the number of new subscribers originated, and then divided by the Average RMR per New Subscriber
Adjusted EBITDA – Net Income (loss) before interest expense (net of interest income), income and franchise taxes and depreciation and amortization (including
amortization of capitalized subscriber acquisition costs), further adjusted to exclude the effects of certain contract sales to third parties, non-capitalized subscriber acquisition costs, stock-based compensation, the historical results of the
Company’s Solar variable interest entity and certain unusual, non-cash, non-recurring and other items permitted in certain covenant calculations under the indentures governing the notes Last Quarter Annualized Adjusted EBITDA (“LQA
Adjusted EBITDA”) – A common industry measure used to reflect the step-function in earnings during the sales season related to the subscribers generated from April to August. LQA Adjusted EBITDA, calculated by multiplying Adjusted
EBITDA for the most recent fiscal quarter by 4, represents the ongoing earnings power of Vivint’s current subscriber base and is potentially a more relevant
metric than LTM due to the recurring nature of the revenue and expected earnings Steady State Free Cash Flow (“SSFCF”) – Provides an estimate of the cash flow of a company, if it were to invest in new RMR only to the extent required
to replace attrition. SSFCF is defined as LQA Adjusted EBITDA less cost to replace RMR attrited, plus an add-back for pro forma G&A expenses. Cost to replace RMR attrited is calculated by multiplying RMR by the attrition rate in steady state by
the Net Creation Cost Multiple
21