Attached files
| file | filename |
|---|---|
| EX-21 - EX-21 - PENFORD CORP | d781083dex21.htm |
| EX-23 - EX-23 - PENFORD CORP | d781083dex23.htm |
| EX-31.1 - EX-31.1 - PENFORD CORP | d781083dex311.htm |
| EX-32 - EX-32 - PENFORD CORP | d781083dex32.htm |
| EX-24 - EX-24 - PENFORD CORP | d781083dex24.htm |
| EXCEL - IDEA: XBRL DOCUMENT - PENFORD CORP | Financial_Report.xls |
| EX-31.2 - EX-31.2 - PENFORD CORP | d781083dex312.htm |
Table of Contents
UNITED STATES
SECURITIES AND EXCHANGE COMMISSION
Washington, D.C. 20549
Form 10-K
(Mark One)
| x | ANNUAL REPORT PURSUANT TO SECTION 13 OR 15(d) OF THE SECURITIES EXCHANGE ACT OF 1934 |
For the Fiscal Year Ended August 31, 2014
| ¨ | TRANSITION REPORT PURSUANT TO SECTION 13 OR 15(d) OF THE SECURITIES EXCHANGE ACT OF 1934 |
For the transition period from to
Commission File Number 0-11488
Penford Corporation
(Exact name of registrant as specified in its charter)
| Washington | 91-1221360 | |
| (State or other jurisdiction of incorporation or organization) |
(I.R.S. Employer Identification No.) | |
| 7094 S. Revere Parkway Centennial, Colorado |
80112-3932 | |
| (Address of Principal Executive Offices) | (Zip Code) | |
Registrant’s telephone number, including area code: (303) 649-1900
Securities registered pursuant to Section 12(b) of the Act:
| Title of Each Class |
Name of Each Exchange on Which Registered | |
| Common Stock, $1.00 par value | The NASDAQ Global Market |
Securities registered pursuant to Section 12(g) of the Act: None
Indicate by check mark if the Registrant is a well-known seasoned issuer, as defined in Rule 405 of the Securities Act. Yes ¨ No x
Indicate by check mark if the Registrant is not required to file reports pursuant to Section 13 or Section 15(d) of the Act. Yes ¨ No x
Indicate by check mark whether the Registrant (1) has filed all reports required to be filed by Section 13 or 15(d) of the Securities Exchange Act of 1934 during the preceding 12 months (or for such shorter period that the Registrant was required to file such reports), and (2) has been subject to such filing requirements for at least the past 90 days. Yes x No ¨
Indicate by check mark whether the registrant has submitted electronically and posted on its corporate web site, if any, every Interactive Data File required to be submitted and posted pursuant to Rule 405 of Regulation S-T during the preceding 12 months (or for such shorter period that the registrant was required to submit and post such files). Yes x No ¨
Indicate by check mark if disclosure of delinquent filers pursuant to Item 405 of Regulation S-K is not contained herein, and will not be contained, to the best of Registrant’s knowledge, in definitive proxy or information statements incorporated by reference in Part III of this Form 10-K or any amendment to this Form 10-K. ¨
Indicate by check mark whether the Registrant is a large accelerated filer, an accelerated filer, a non-accelerated filer or a smaller reporting company. See definition of “accelerated filer” and “large accelerated filer” and “smaller reporting company” in Rule 12b-2 of the Exchange Act. (Check one).
| Large accelerated filer | ¨ | Accelerated filer | x | |||
| Non-accelerated filer | ¨ (Do not check if a smaller reporting company) | Smaller reporting company | ¨ |
Indicate by check mark whether the registrant is a shell company (as defined in Rule 12b-2 of the Exchange Act). Yes ¨ No x
The aggregate market value of the Registrant’s Common Stock held by non-affiliates of the Registrant as of February 28, 2014, the last business day of the Registrant’s second quarter of fiscal 2014, was approximately $160.1 million based upon the last sale price reported for such date on The NASDAQ Global Market. For purposes of making this calculation, Registrant has assumed that all the outstanding shares were held by non-affiliates, except for shares held by Registrant’s directors and officers and by each person who owns 10% or more of the outstanding Common Stock. However, this does not necessarily mean that there are not other persons who may be deemed to be affiliates of the Registrant.
The number of shares of the Registrant’s Common Stock outstanding as of November 11, 2014 was 12,788,527.
Documents Incorporated by Reference
The information required to be reported in Part III of this Annual Report on Form 10-K will be included in the Company’s definitive Proxy Statement relating to the 2015 Annual Meeting of Shareholders (to be incorporated herein by reference) or in an amendment to this Annual Report on Form 10-K.
Table of Contents
PENFORD CORPORATION
FISCAL YEAR 2014 FORM 10-K ANNUAL REPORT
1
Table of Contents
PART I
| Item 1: | Business |
Description of Business
Penford Corporation (which, together with its subsidiary companies, is referred to herein as “Penford” or the “Company”) is a developer, manufacturer and marketer of specialty natural-based ingredient systems for food and industrial applications, including fuel grade ethanol. Penford’s products provide convenient and cost-effective solutions derived from renewable sources. Sales of the Company’s products are generated using a combination of direct sales and distributor agreements. The Company’s strategically-located manufacturing facilities in the United States provide it with broad geographic coverage of its target markets. The Company has significant research and development capabilities, which are used in applying the complex chemistry of carbohydrate-based materials and in developing applications to address customer needs. In addition, the Company has specialty processing capabilities for a variety of modified starches.
Penford is a Washington corporation originally incorporated in September 1983. The Company commenced operations as a publicly-traded company on March 1, 1984.
In January 2012, the Company acquired, through purchase and capital lease, the net assets and operations of the business generally known as Carolina Starches, which manufactures and markets industrial potato starch based products and blends for the paper and packaging industries. The acquisition of this business has provided an important source of raw material to support continued growth in the Company’s Food Ingredients business and has broadened the Company’s portfolio of specialty modified industrial starches.
In March 2014, the Company acquired substantially all of the assets of Gum Technology, which distributes and blends gums and hydrocolloids for the food and beverage industries in North America and Asia. Gum Technology, an Arizona close corporation, specializes in developing and producing customized stabilizers to meet customers’ product formulation needs. This acquisition broadens the Company’s Food Ingredients portfolio of functional and specialty ingredient systems. See Note 17 to the Consolidated Financial Statements.
On October 14, 2014, the Company and Ingredion Incorporated (“Ingredion”) entered into an Agreement and Plan of Merger (the “Merger Agreement”) pursuant to which Ingredion will acquire the Company in an all-cash transaction valued at approximately $340.0 million. Upon closing of the merger, each outstanding share of the Company’s common stock will be converted into the right to receive $19.00 in cash. The merger is subject to certain closing conditions and covenants, and provides certain termination rights for the parties to the Merger Agreement. See Note 21 to the Consolidated Financial Statements.
Penford operates in two business segments, Industrial Ingredients and Food Ingredients. Each of the Company’s businesses utilizes the Company’s carbohydrate chemistry expertise to develop starch and gum-based ingredients for value-added applications that improve the quality and performance of customers’ products. Financial information about Penford’s segments and geographic areas is included in Note 18 to the Consolidated Financial Statements. Additional information on Penford’s two business segments follows:
| • | Industrial Ingredients, which in fiscal years 2014, 2013 and 2012 generated approximately 71%, 76% and 76%, respectively, of Penford’s revenue, is a supplier of chemically modified specialty starches to the paper and packaging industries. Industrial Ingredients also produces food grade corn starch for sale by the Company’s Food Ingredients business. Through a commitment to research and development, Industrial Ingredients develops customized product applications that help its customers realize improved manufacturing efficiencies and advancements in product performance. Industrial Ingredients has specialty processing capabilities for a variety of modified starches. Specialty products for industrial applications are designed to improve the strength and performance of customers’ products and efficiencies in the manufacture of coated and uncoated paper and paper packaging products. These starches are principally ethylated (chemically modified with ethylene oxide), oxidized (treated with sodium hypochlorite) and cationic (carrying a positive electrical charge). Ethylated and oxidized |
2
Table of Contents
| starches are used in coatings and as binders, providing strength and printability to fine white, magazine and catalog paper. Cationic and other liquid starches are generally used in the paper-forming process in paper production, providing strong bonding of paper fibers and other ingredients. |
| • | The Company’s Industrial Ingredients segment also produces and sells fuel grade ethanol from its facility in Cedar Rapids, Iowa. Ethanol production gives the Company the ability to select an additional output choice to capitalize on changing industry conditions and selling opportunities. Sales of ethanol in fiscal years 2014, 2013 and 2012 were 30%, 27% and 31%, respectively, of this segment’s reported revenue. |
| • | The Industrial Ingredients business produces certain by-products from its corn wet milling operations in Cedar Rapids, Iowa. These by-products include corn gluten feed and corn gluten meal, which are sold to various market participants for use in animal feed, and corn germ, which is sold to a producer of corn oil. Sales of by-products in fiscal years 2014, 2013 and 2012 were 20%, 23%, and 22%, respectively, of this segment’s reported revenue. |
| • | Food Ingredients, which in fiscal years 2014, 2013 and 2012 generated approximately 29%, 24% and 24%, respectively, of Penford’s revenue, is a developer and manufacturer of specialty starches, dextrins and gums to the food manufacturing and food service industries. This business’s expertise is in leveraging the inherent characteristics from potato, corn, tapioca, rice and gums to help improve its customers’ product performance. Food Ingredients’ specialty starches produced for food applications are used in coatings to provide crispness, improved taste and texture and increased product life for products such as french fries sold in restaurants. Food Ingredients starch products and gums are used to reduce fat levels, increase fiber content, modify texture and improve color and consistency in a variety of foods such as canned products, sauces, whole and processed meats, dry powdered mixes and bakery products. These products are also used as moisture binders and in companion pet products, such as dog treats and chews. |
Raw Materials
Corn: Penford’s North American corn wet milling plant is located in Cedar Rapids, Iowa, in the middle of the U.S. corn belt. Accordingly, the plant has truck-delivered corn available throughout the year from a number of suppliers at prices consistent with those available in the major U.S. grain markets.
Potato Starch: The Company’s facilities in Idaho Falls, Idaho; Richland, Washington; Plover, Wisconsin; Berwick, Pennsylvania and North Charleston, South Carolina use starch recovered as by-products from potato processors as the primary raw material to manufacture modified potato starches. The Company enters into contracts typically having durations of two to four years with potato processors in the United States and Canada to acquire potato-based raw materials.
Chemicals: The primary chemicals used in the manufacturing processes are readily available commodity chemicals. The prices for these chemicals are subject to price fluctuations due to market conditions.
Natural Gas: The primary energy source for most of Penford’s plants is natural gas. Penford contracts its natural gas supply with regional suppliers, generally under short-term supply agreements, and, at times, uses futures contracts to hedge the price of natural gas.
Gums: Many of the gums sold by the Company and used in its blends are derived from vegetable matter, such as beans, seaweed, cellulose or sap. The availability and cost of gums are dependent on climate conditions and the political environment in countries that supply the gums.
Corn, chemicals, natural gas and gums are not currently subject to availability constraints; however, demand for these items can significantly affect the prices. Penford’s current potato starch requirements constitute a material portion of the available North American supply. Penford estimates that it purchases approximately 70% of the recovered potato starch in North America. It is possible that, in the long term, continued growth in demand for potato starch-based ingredients and new product development could result in capacity constraints.
3
Table of Contents
Approximately 67% of the Company’s manufacturing costs consist of the costs of corn, potato starch, chemicals and natural gas. The remaining portion consists of the costs of labor, distribution, depreciation and maintenance of manufacturing plant and equipment and other utilities. The prices of raw materials may fluctuate, and increases in costs may affect Penford’s business adversely. To mitigate this risk, Penford hedges a portion of corn purchases, and, at times, natural gas purchases with futures and options contracts and enters into short-term supply agreements for other production requirements.
Research and Development
Penford’s research and development efforts cover a range of projects including technical service work focused on specific customer support projects, which require coordination with customers’ research efforts to develop innovative solutions to specific customer requirements. These projects are supplemented with longer-term, new product development and commercialization initiatives. Research and development expenses were $5.6 million, $5.9 million and $5.8 million for fiscal years 2014, 2013 and 2012, respectively.
Patents, Trademarks and Trade Names
Penford owns a number of patents, trademarks and trade names. The Company has approximately 28 current patents and pending patent applications, most of which are related to technologies in french fry coatings, coatings for the paper industry and animal nutrition. Penford’s issued patents expire at various times through 2033. The annual cost to maintain all of the Company’s patents is not significant. Most of Penford’s products are currently made with technology that is broadly available to companies that have the same level of scientific expertise and production capabilities as Penford.
Specialty starch ingredient brand names for industrial applications include, among others, Penford® gums, Pensize® binders, Penflex® sizing agent, Topcat® cationic additive and the Apollo® starch series. Product brand names and trademarks for food ingredient applications include PenFibe®, PenTech®, PenPure®, PenNovo®, PenBind®, PenCling® and PenPlus®. Gum products are sold under the GumPlete Coyote Brand® names.
Quarterly Fluctuations
Penford’s revenues and operating results vary from quarter to quarter for various reasons. For example, sales volumes of the Food Ingredients products used in food coatings are generally lower during Penford’s second fiscal quarter due to decreased consumption of some coated foods during the post-holiday season. In addition, the cost of natural gas in North America is generally higher in the winter months than the summer months.
Working Capital
The Company’s growth is funded through a combination of cash flows from operations and short- and long-term borrowings. For more information, see the “Liquidity and Capital Resources” section under “Management’s Discussion and Analysis of Financial Condition and Results of Operations” in Item 7 and the audited consolidated financial statements and the related notes included elsewhere in this Annual Report on Form 10-K.
Penford generally carries a one- to 45-day supply of materials required for production, depending on the lead time for specific items. Penford manufactures finished goods to customer orders or anticipated demand. The Company is therefore able to carry less than a 30-day supply of most products. Terms for trade receivables and trade payables are standard for the industry and region and generally do not exceed 30-45 day terms except for trade receivables for export sales.
Environmental Matters
Penford’s operations are governed by various federal, state and local environmental laws and regulations. These laws and regulations include the Clean Air Act, the Clean Water Act, the Resource Conservation and
4
Table of Contents
Recovery Act, the EPA Oil Pollution Control Act, the Occupational Safety and Health Administration’s hazardous materials regulations, the Toxic Substances Control Act, the Comprehensive Environmental Response Compensation and Liability Act and the Superfund Amendments and Reauthorization Act.
Permits are required by the various environmental agencies that regulate the Company’s operations. Penford believes that it has obtained all necessary material environmental permits required for its operations. Penford believes that its operations are in compliance with applicable environmental laws and regulations in all material aspects of its business. Penford estimates that annual compliance costs, excluding operational costs for emission control devices, wastewater treatment or disposal fees, are approximately $1.2 million.
Penford has adopted and implemented a comprehensive corporate-wide environmental management program. The program is managed and designed to structure the conduct of Penford’s business in a safe and fiscally responsible manner that protects and preserves the health and safety of employees, the communities surrounding the Company’s plants and the environment. The Company continuously monitors environmental legislation and regulations that may affect Penford’s operations.
During fiscal 2014, compliance with environmental regulations did not have a material impact on the Company’s operations. No unusual expenditures for environmental facilities and programs are anticipated in fiscal 2015.
Customers
Penford sells to a variety of customers and has several relatively large customers in each business segment. The Company’s sales of ethanol to its sole ethanol customer, Eco-Energy, Inc., represented approximately 22%, 21% and 24% of the Company’s net sales for fiscal years 2014, 2013 and 2012, respectively. Eco-Energy, Inc., a marketer and distributor of biofuels in the United States and Canada, is a customer of the Company’s Industrial Ingredients business.
Approximately 36%, 38% and 36% of the Company’s sales in fiscal 2014, 2013 and 2012, respectively, were made to customers who operate in the paper and packaging industries. Over the last few years, these industries suffered an economic downturn, which has resulted in the closure of a number of mills.
Competition
In its primary markets, Penford competes directly with approximately six other companies that manufacture specialty starches for the papermaking industry, approximately five other companies that manufacture specialty food ingredients and numerous producers of fuel grade ethanol. Penford also competes with a larger number of companies that provide synthetic and natural-based ingredients to industrial and food customers. Some of these competitors are larger companies, and have greater financial and technical resources than Penford. Application expertise, quality and service are the major competitive advantages for Penford.
Employees
As of August 31, 2014, Penford had 443 employees, of whom approximately 34% were members of a trade union. The collective bargaining agreement covering the Cedar Rapids-based manufacturing workforce expires in August 2015. The Company is currently engaged in labor contract negotiations with a new bargaining unit consisting of approximately 15 operating employees at its Richland, WA plant.
Sales and Distribution
Sales are generated using a combination of direct sales and distributor agreements. In many cases, Penford supports its sales efforts with technical and advisory assistance to customers. Penford generally ships its products upon receipt of purchase orders from its customers and, consequently, backlog is not significant.
5
Table of Contents
Since Penford’s customers are generally other manufacturers and processors, most of the Company’s products are distributed via rail or truck to customer facilities.
Export Sales
Export sales from Penford’s businesses in the United States accounted for approximately 8.0%, 8.0% and 7.6% of total sales in fiscal years 2014, 2013 and 2012, respectively. See Note 18 to the Consolidated Financial Statements for sales by country to which the product was shipped.
Available Information
Penford’s Internet address is www.penx.com. The Company makes available, free of charge through its Internet site, the Company’s annual reports on Form 10-K; quarterly reports on Form 10-Q; current reports on Form 8-K; Directors and Officers Forms 3, 4 and 5; and amendments to those reports, as soon as reasonably practicable after electronically filing such materials with, or furnishing them to, the Securities and Exchange Commission (“SEC”). The information found on Penford’s web site will not be considered to be part of this or any other report or other document filed with or furnished to the SEC. The SEC also maintains an Internet site, which contains reports, proxy and information statements and other information regarding issuers that file information electronically with the SEC. The SEC’s Internet address is www.sec.gov.
In addition, the Company makes available, through the Investor Center section of its Internet site, the Company’s Code of Business Conduct and Ethics and the written charters of its Board of Directors’ Audit, Governance and Executive Compensation and Development Committees.
Executive Officers of the Registrant
| Name |
Age | Title | ||||
| Thomas D. Malkoski |
58 | President and Chief Executive Officer | ||||
| Steven O. Cordier |
58 | Senior Vice President, Chief Financial Officer and Assistant Secretary | ||||
| Michael J. Friesema |
57 | Vice President – Corporate Development | ||||
| Timothy M. Kortemeyer |
48 | Vice President; President, Industrial Ingredients | ||||
| Christopher L. Lawlor |
64 | Vice President – Human Resources, General Counsel and Secretary | ||||
| John R. Randall |
70 | Vice President; President, Food Ingredients | ||||
Mr. Malkoski joined Penford Corporation as Chief Executive Officer and was appointed to the Board of Directors in January 2002. He was named President of Penford Corporation in January 2003. From 1997 to 2001, he served as President and Chief Executive Officer of Griffith Laboratories, North America, a formulator, manufacturer and marketer of ingredient systems to the food industry. Previously, he served in various senior management positions, including as Vice President/Managing Director of the Asia Pacific and South Pacific regions for Chiquita Brands International, an international marketer and distributor of bananas and other fresh produce. Mr. Malkoski began his career at the Procter and Gamble Company, a marketer of consumer brands, progressing through major product category management responsibilities. Mr. Malkoski holds a Masters of Business Administration degree from the University of Michigan.
Mr. Cordier is Penford’s Senior Vice President, Chief Financial Officer and Assistant Secretary. He joined Penford in July 2002 as Vice President and Chief Financial Officer and was promoted to Senior Vice President in November 2004. From September 2005 to April 2006, Mr. Cordier served as the interim Managing Director of Penford’s Australian and New Zealand operations. He came to Penford from Sensient Technologies Corporation, a manufacturer of specialty products for the food, beverage, pharmaceutical and technology industries, where he held a variety of senior financial management positions.
Mr. Friesema joined Penford in September 2010 as Director – Business Development and was promoted to Vice President – Corporate Development in August 2012. He came to Penford from Corn Products International, Inc. (now Ingredion), a manufacturer of starch and sweetener ingredients, where he most recently served as
6
Table of Contents
General Manager, Africa and Senior Director, Engineering, Asia-Africa Division. Prior to that, he was Chief Operating Officer and President – Food Ingredients for zuChem, Inc., a producer of unique sugars for use in the food, specialty and fine chemical markets.
Mr. Kortemeyer has served as Vice President of Penford Corporation since October 2005 and President, Industrial Ingredients since June 2006. He served as General Manager of the Industrial Ingredients business from August 2005 to June 2006. Mr. Kortemeyer joined Penford in 1999 and served as a Team Leader in the manufacturing operations of the Industrial Ingredients business until 2001. From 2001 until 2003, he was an Operations Manager and Quality Assurance Manager. From July 2003 to November 2004, Mr. Kortemeyer served as the business unit manager of the Company’s co-products business, and from November 2004 until August 2005, as the director of the Company’s specialty starches product lines, responsible for sales, marketing and business development.
Mr. Lawlor joined Penford in April 2005 as Vice President – Human Resources, General Counsel and Secretary. From 2002 to April 2005, Mr. Lawlor served as Vice President – Human Resources for Sensient Technologies Corporation, a manufacturer of specialty chemical and food products. From 2000 to 2002, he was Assistant General Counsel for Sensient. Mr. Lawlor was Vice President – Administration, General Counsel and Secretary for Kelley Company, Inc., a manufacturer of material handling and safety equipment from 1997 to 2000. Prior to joining Kelley Company, Mr. Lawlor was employed as an attorney at a manufacturer of paper and packaging products and in private practice with two national law firms.
Mr. Randall is Vice President of Penford Corporation and President, Food Ingredients. He joined Penford in February 2003 as Vice President and General Manager of Penford Food Ingredients and was promoted to President of the Food Ingredients division in June 2006. Prior to joining Penford, Mr. Randall was Vice President, Research & Development/Quality Assurance of Griffith Laboratories, USA, a specialty food ingredients business, from 1998 to 2003. From 1993 to 1998, Mr. Randall served in various research and development positions with KFC Corporation, a quick-service restaurant business, most recently as Vice President, New Product Development. Prior to 1993, Mr. Randall served in research and development leadership positions at Romanoff International, Inc., a manufacturer and marketer of gourmet specialty food products, and at Kraft/General Foods.
7
Table of Contents
| Item 1A: | Risk Factors |
Risk Factors Relating to Penford’s Business
The availability and cost of agricultural products Penford purchases are vulnerable to weather and other factors beyond its control. The Company’s ability to pass through cost increases for these products is limited by worldwide competition and other factors.
In fiscal 2014, approximately 50% of Penford’s manufacturing costs were the costs of corn, potato starch, gums and other agricultural raw materials. Weather conditions, plantings, government programs, policies and mandates and energy costs and global supply, among other things, have historically caused volatility in the supply and prices of these agricultural products. Due to local and/or international competition, the Company may not be able to pass through the increases in the cost of agricultural raw materials to its customers. To manage price volatility in the commodity markets, the Company may purchase inventory in advance or enter into exchange-traded futures contracts. Despite these hedging activities, the Company may not be successful in limiting its exposure to market fluctuations in the cost of agricultural raw materials. Increases in the cost of corn, potato starch and other agricultural raw materials due to weather conditions or other factors beyond Penford’s control and that cannot be passed through to customers will reduce Penford’s future profitability.
Increases in energy and chemical costs may reduce Penford’s profitability.
Energy and chemicals comprised approximately 8% and 9%, respectively, of the cost of manufacturing the Company’s products in fiscal 2014. Penford uses natural gas extensively in its Industrial Ingredients business to dry starch products, and, to a lesser extent, in the Food Ingredients business. The Company uses chemicals in all of the businesses to modify starch for specific product applications and customer requirements. The prices of these inputs to the manufacturing process fluctuate based on anticipated changes in supply and demand, weather and the prices of alternative fuels, including petroleum. The Company may use short-term purchase contracts or exchange-traded futures contracts to reduce the price volatility of natural gas; however, these strategies are not available for the chemicals the Company purchases. If the Company is unable to pass on increases in energy and chemical costs to its customers, margins and profitability would be adversely affected.
The loss of a major customer could have an adverse effect on Penford’s results of operations.
The Company’s sales of ethanol to its sole ethanol customer, Eco-Energy, Inc., represented approximately 22%, 21% and 24% of the Company’s net sales for fiscal years 2014, 2013 and 2012, respectively. Eco-Energy, Inc. is a marketer and distributor of biofuels in the United States and Canada. Sales to the Company’s top ten customers represented 55%, 56% and 60% of net sales for fiscal years 2014, 2013 and 2012, respectively. Generally, the Company does not have multi-year sales agreements with its customers. Many customers place orders on an as-needed basis and generally can change their suppliers without penalty. If Penford lost one or more of its major customers, or if one or more of its major customers significantly reduced its orders, sales, results of operations and cash flow would be adversely affected.
The Company is substantially dependent on its manufacturing facilities; any operational disruption could result in a reduction of the Company’s sales volumes and could cause it to incur substantial losses.
Penford’s revenues are, and will continue to be, derived from the sale of starch-based ingredients and ethanol that the Company manufactures at its facilities. The Company’s operations may be subject to significant interruption if any of its facilities experiences a major accident or is damaged by severe weather or other natural disasters, as occurred as a result of the flood of the Cedar River at the Company’s Cedar Rapids, Iowa facility in fiscal 2008. In addition, the Company’s operations may be subject to labor disruptions and unscheduled downtime, or other operational hazards inherent in the industry, such as equipment failures, fires, explosions, abnormal pressures, blowouts, pipeline ruptures, transportation accidents and natural disasters. Some of these operational hazards may cause personal injury or loss of life, severe damage to or destruction of property and equipment or
8
Table of Contents
environmental damage, and may result in suspension of operations and the imposition of civil or criminal penalties. The Company’s insurance may not be adequate to fully cover the potential operational hazards described above, or it may not be able to renew this insurance on commercially reasonable terms or at all.
The Company may experience an impairment charge related to its long-lived assets, which would decrease its earnings and net worth.
The Company reviews its long-lived assets for impairment whenever events or changes in circumstances indicate that the carrying amount of an asset may not be recoverable. Impairment is recognized when the fair values of long-lived assets are less than the carrying amount of the assets. The estimation of expected future net cash flows is inherently uncertain and involves significant judgment. These estimates rely, to a considerable extent, on assumptions regarding current and future economics, market conditions, availability of capital and forecasts of product sales and commodity and energy costs. If, in future periods, there are changes in the estimates or assumptions incorporated into the impairment review analysis, the changes could result in an adjustment to the carrying amount of the long-lived assets. There can be no assurance that management’s current projections of cash flows will be achieved or that an impairment charge will not be required in the future. An impairment charge could be material to the Company’s financial position and results of operations.
The agreements governing the Company’s debt contain various covenants that limit its ability to take certain actions and also require the Company to meet financial maintenance tests, and Penford’s failure to comply with any of the debt covenants could have a material adverse effect on the Company’s business, financial condition and results of operations.
The agreements governing Penford’s outstanding debt contain a number of significant covenants that, among other things, limit its ability to:
| • | incur additional debt or liens; |
| • | consolidate or merge with any person or transfer or sell all or substantially all of its assets; |
| • | make investments or acquisitions; |
| • | pay dividends or make certain other restricted payments; and |
| • | enter into transactions with affiliates. |
In addition, the Company’s revolving credit facility requires it to comply with specific financial ratios and tests, under which it is required to achieve specific financial and operating results. Events beyond the Company’s control may affect its ability to comply with these provisions. A breach of any of these covenants would result in a default under the Company’s revolving credit facility. In the event of any default that is not cured or waived, the Company’s lenders could elect to declare all amounts borrowed under the revolving credit facility, together with accrued interest thereon, due and payable. If any of the Company’s debt is accelerated, there is no assurance that the Company would have sufficient assets to repay that debt or that it would be able to refinance that debt on commercially reasonable terms or at all.
Changes in interest rates may affect Penford’s profitability.
As of August 31, 2014, approximately $76.0 million of its outstanding debt was subject to variable interest rates that move in direct relation to the LIBOR Index Rate or the prime rate in the United States, depending on the selection of borrowing options. Any significant changes in these interest rates would materially affect the Company’s profitability by increasing or decreasing its borrowing costs.
Unanticipated changes in tax rates or exposure to additional income tax liabilities could affect Penford’s profitability.
The Company is subject to income taxes in the federal and various state jurisdictions in the United States. The Company’s effective tax rates could be adversely affected by changes in the mix of earnings in tax
9
Table of Contents
jurisdictions with differing statutory tax rates, changes in the valuation of deferred tax assets and liabilities or changes in tax laws. The carrying value of deferred tax assets is dependent on the Company’s ability to generate future taxable income in the United States. The amount of income taxes paid is subject to interpretation of applicable tax laws in the jurisdictions in which the Company operates. Although the Company believes it has complied with all applicable income tax laws, there is no assurance that a tax authority will not have a different interpretation of the law or that any additional taxes imposed as a result of tax audits will not have an adverse effect on the Company’s results of operations and financial condition.
Pension expense and the funding of pension obligations are affected by factors outside the Company’s control, including the performance of plan assets, interest rates, actuarial data and experience and changes in laws and regulations.
The future funding obligations for the Company’s two U.S. defined benefit pension plans qualified with the Internal Revenue Service depend upon the level of benefits provided for by the plans, the future performance of assets set aside in trusts for these plans, the level of interest rates used to determine funding levels, actuarial data and experience and any changes in government laws and regulations. The pension plans hold a significant amount of equity and fixed income securities. When the values of these securities decline, pension expense can increase and materially affect the Company’s results. Decreases in interest rates that are not offset by contributions and asset returns could also increase the Company’s obligations under such plans. The Company is legally required to make contributions to the pension plans in the future, and those contributions could be material. The Company does not expect to make contributions to its pension plans during fiscal 2015.
The current capital and credit market conditions may adversely affect the Company’s access to capital, cost of capital and business operations.
The general economic and capital market conditions in the United States and other parts of the world continue to adversely affect access to capital and increase the cost of capital. If these conditions continue or become worse, the Company’s future cost of debt and equity capital and its access to capital markets could be adversely affected. An inability to obtain adequate financing from debt and equity sources could force the Company to self-fund strategic initiatives or even forgo some opportunities, potentially harming its financial position, results of operations and liquidity.
Economic conditions may impair the businesses of the Company’s customers and end user markets, which could adversely affect the Company’s business operations.
As a result of the continuing economic downturn and macro-economic challenges affecting the economy of the United States and other parts of the world, the businesses of some of the Company’s customers may not be successful in generating sufficient revenues. Customers may choose to delay or postpone purchases from the Company until the economy and their businesses strengthen. The Company’s Industrial Ingredients business is dependent upon end markets for paper and ethanol in North America. Paper markets have been under competitive pressure from substitutable electronic alternatives and may be further stressed by the continuing economic downturn. Ethanol markets have been under pressure from declining demand and volatile corn prices. Decisions by current or future customers to forego or defer purchases and/or customers’ inability to pay the Company for its products may adversely affect the Company’s earnings and cash flow.
The use and demand for ethanol and its supply may be affected by changes in federal and state legislation and regulation. Changes in legislation or regulation could cause the demand for ethanol to decline or its supply to increase, which could have a material adverse effect on the Company’s business.
Various federal and state laws, regulations and programs have affected the supply of ethanol and its use in fuel. Federal and state legislators and environmental regulators could adopt or modify laws, regulations or programs that could adversely affect the use and/or supply of ethanol. Of particular note, the Renewable Fuel
10
Table of Contents
Standard (“RFS”) currently requires an increasing amount of renewable fuels to be used in the United States. However, the United States Environmental Protection Agency (“EPA”) is currently considering various requests for waivers from compliance with the volume requirements of the RFS. If such waivers are granted, demand for the Company’s ethanol may decrease, and this may have a material effect on the Company’s results.
Penford depends on its senior management team; the loss of any member could adversely affect its operations.
Penford’s success depends on the management and leadership skills of its senior management team. The loss of any of these individuals, or the Company’s inability to attract, retain and maintain additional personnel, could affect the Company’s ability to fully implement its business strategy. There is no assurance that it will be able to retain its existing senior management personnel or attract additional qualified personnel when needed.
Penford is subject to stringent environmental and health and safety laws, which may require it to incur substantial compliance and remediation costs, thereby reducing profits.
Penford is subject to many federal, state and local environmental and health and safety laws and regulations, particularly with respect to the use, handling, treatment, storage, discharge and disposal of substances and hazardous wastes used or generated in its manufacturing processes. Compliance with these laws and regulations is a significant factor in the Company’s business. Penford has incurred and expects to continue to incur expenditures to comply with applicable environmental laws and regulations. The Company’s failure to comply with applicable environmental laws and regulations and permit requirements could result in civil or criminal fines, penalties or enforcement actions, including regulatory or judicial orders enjoining or curtailing operations or requiring corrective measures, installation of pollution control equipment or remedial actions.
The Company may be required to incur costs relating to the investigation or remediation of property, including property where it has disposed of its waste, and for addressing environmental conditions. Some environmental laws and regulations impose liability and responsibility on present and former owners, operators or users of facilities and sites for contamination at such facilities and sites without regard to causation or knowledge of contamination. Consequently, there is no assurance that existing or future circumstances, the development of new facts or the failure of third parties to address contamination at current or former facilities or properties will not require significant expenditures by the Company.
The Company expects to continue to be subject to increasingly stringent environmental and health and safety laws and regulations. It is difficult to predict the future interpretation and development of environmental and health and safety laws and regulations or their impact on the Company’s future earnings and operations. The Company anticipates that compliance will continue to require increased capital expenditures and operating costs. Any increase in these costs, or unanticipated liabilities arising, for example, out of discovery of previously unknown conditions or more aggressive enforcement actions, could adversely affect the Company’s results of operations, and there is no assurance that they will not have a material adverse effect on its business, financial condition and results of operations.
Penford’s unionized workforce could cause interruptions in the Company’s provision of services.
As of August 31, 2014, approximately 34% of the Company’s 443 employees were members of a trade union. In addition, the Company is currently engaged in contract negotiations with a new bargaining unit consisting of approximately 15 operating employees at its Richland, WA plant. Although the Company’s relations with the relevant unions are stable and the Company’s Cedar Rapids labor contract does not expire until August 2015, there is no assurance that the Company will not experience work disruptions or stoppages in the future, which could have a material adverse effect on its business and results of operations and adversely affect its relationships with its customers.
11
Table of Contents
The Company may fail to realize the benefits of the acquisition of substantially all the assets of Gum Technology, an Arizona close corporation.
As noted above, in March 2014, the Company acquired substantially all of the assets of Gum Technology, an Arizona close corporation, which distributes and blends gums and hydrocolloids for the food and beverage industries in North America and Asia, for approximately $9.9 million. Since the acquisition was recently completed, the Company has not yet determined whether it will be able to obtain all of the expected benefits from this acquisition. If not, the Company will suffer the loss of the expected benefits from this acquisition.
Risks Relating to the Proposed Merger with Ingredion
The merger is subject to various closing conditions, including governmental approvals, and other uncertainties and there can be no assurances as to whether and when it may be completed.
On October 14, 2014, the Company entered into the Merger Agreement with Ingredion and Prospect Sub, Inc. (“Merger Sub”), under which Merger Sub will merge with and into the Company, with the Company continuing as the surviving corporation and a wholly owned subsidiary of Ingredion. The consummation of the merger is subject to customary closing conditions. A number of the conditions are not within the Company’s control, and may prevent, delay or otherwise materially adversely affect the completion of the transaction. These conditions include, among other things, (a) receiving the required approval of the Company’s shareholders and (b) the expiration or termination of the applicable waiting period under the Hart-Scott-Rodino Act and any other foreign or U.S. laws that are designed or intended to prohibit, restrict or regulate actions having the purpose or effect of monopolization or restraint of trade or lessening of competition through merger or acquisition. It also is possible that a change, event, fact, effect or circumstance that could lead to a material adverse effect on Penford may occur, which may give Ingredion the ability to not complete the merger. The Company cannot predict with certainty whether and when any of the required closing conditions will be satisfied or if another uncertainty may arise. If the merger does not receive, or timely receive, the required regulatory approvals and clearances, or if another event occurs delaying or preventing the merger, such delay or failure to complete the merger may cause uncertainty or other negative consequences that may materially and adversely affect the Company’s sales, financial performance and operating results and the price per share for the Company’s common stock and perceived acquisition value.
If the Merger Agreement is terminated, the Company may, under certain circumstances, be obligated to pay a termination fee or a break-up fee to Ingredion.
If the merger is not completed, in certain circumstances, the Company would still be liable for significant transaction costs and could also be required to pay a termination fee of approximately $7.6 million. If the Merger Agreement is terminated, the expense reimbursement and the termination fee it may be required to pay, if any, under the Merger Agreement may require the Company to use available cash that would have otherwise been available for general corporate purposes. For these and other reasons, a failed merger could materially and adversely affect the Company’s business, operating results or financial condition, which in turn would materially and adversely affect the Company’s business and financial condition, the price per share of the Company’s common shares and the Company’s perceived acquisition value.
The Merger Agreement limits the Company’s ability to pursue alternative transactions to the proposed merger with Ingredion.
The Merger Agreement prohibits the Company and its directors, officers, representatives and agents, subject to narrow exceptions, from initiating, encouraging, soliciting or entering into discussions with any third party regarding alternative acquisition proposals. The prohibition limits the Company’s ability to pursue offers from other possible acquirers that may be superior to the pending merger. If the Company receives an unsolicited proposal from a third party that is superior and the Merger Agreement is terminated pursuant to its terms, the Company is contractually obligated to pay a termination fee of approximately $7.6 million to Ingredion. This termination fee makes it less likely that a third party will make an alternative acquisition proposal.
12
Table of Contents
While the merger is pending, the Company is subject to business uncertainties and contractual restrictions that could materially adversely affect its operations and the future of its business or result in a loss of employees.
The Merger Agreement includes restrictions on the conduct of the Company’s business prior to the completion of the merger, generally requiring the Company to conduct its business in the ordinary course and subjecting the Company to a variety of specified limitations absent Ingredion’s prior written consent. The Company may find that these and other contractual arrangements in the Merger Agreement may delay or prevent it from or limit its ability to respond effectively to competitive pressures, industry developments and future business opportunities that may arise during such period, even if the Company’s management thinks they may be advisable. The pendency of the merger may also divert management’s attention and the Company’s resources from ongoing business and operations. The Company’s employees, customers and suppliers may have uncertainties about the effects of the merger. In connection with the pending merger, it is possible that some customers, suppliers and other persons with whom the Company has a business relationship may delay or defer certain business decisions or might decide to seek to terminate, change or renegotiate their relationship with the Company as a result of the merger. Similarly, current and prospective employees may experience uncertainty about their future roles with the Company following completion of the merger, which may materially adversely affect the Company’s ability to attract and retain key employees. If any of these effects were to occur, it could materially and adversely impact the Company’s revenues, earnings, cash flows, other business results and financial condition, as well as the market price of the Company’s common shares and the Company’s perceived acquisition value, regardless of whether the merger is completed. In addition, whether or not the merger is completed, while it is pending, the Company will continue to incur costs, fees, expenses and charges related to the proposed merger, which may materially and adversely affect its business results and financial condition.
Failure to complete the merger could negatively impact the Company’s share price and its business and financial results.
There is no assurance that the merger or any other transaction will occur or that the conditions to the merger will be satisfied in a timely manner or at all. Further, there is no assurance that any event, change or other circumstances that could give rise to the termination of the Merger Agreement will not occur. Because the share price of the Company’s common stock after the announcement of the Merger Agreement may reflect an assumption that the merger will be completed, the share price of the Company’s common stock may drop, potentially significantly, if the merger is not completed. In addition, under circumstances defined in the Merger Agreement, if the merger is not completed, the Company may be required to pay a termination fee of up to approximately $7.6 million. Certain costs associated with the merger are already incurred or may be payable even if the merger is not completed. Further, a failed transaction may result in negative publicity and a negative impression of the Company in the investment community. Finally, any disruptions to the Company’s business resulting from the announcement and pendency of the merger and from intensifying competition from competitors, including any adverse changes in the Company’s relationships with its customers, vendors and employees or recruiting and retention efforts, could continue or accelerate in the event of a failed transaction. There can be no assurance that the Company’s business, these relationships or the Company’s financial condition will not be negatively impacted, as compared to prior to the announcement of the merger, if the merger is not consummated. If any of these effects were to occur, it could negatively impact the Company’s revenues, earnings, cash flows, other business results and financial condition, as well as the market price of the Company’s common stock and the Company’s perceived acquisition value.
Pending litigation against Penford and Company directors could result in an injunction preventing completion of the merger and significant litigation costs that could adversely affect the Company’s financial condition.
Since the announcement on October 15, 2014 of the signing of the Merger Agreement, the Company, as well as the members of its Board of Directors, have been named as defendants in one purported class action lawsuit filed on behalf of the Company’s shareholders challenging the proposed merger. The lawsuit generally alleges, among other things, that the members of the Company’s Board of Directors breached their fiduciary
13
Table of Contents
duties to Company shareholders by failing to take steps to maximize shareholder value or to engage in a fair sale process before approving the Merger Agreement, and that those breaches were aided and abetted by Ingredion and Merger Sub. The lawsuit seeks, among other things, injunctive relief to enjoin the defendants from completing the merger on the agreed-upon terms, rescission to the extent the merger terms have already been implemented, monetary relief and attorneys’ fees and costs. It is possible that other related lawsuits may subsequently be filed.
One of the conditions to the closing of the merger is that no injunction preventing the consummation of the merger and the other transactions contemplated by the Merger Agreement shall be in effect and that no rule, regulation, order or injunction shall have been enacted, entered, promulgated or enforced by any governmental entity that prohibits or makes illegal the consummation of the merger. Consequently, if the plaintiffs were to secure injunctive or other relief prohibiting, delaying, or otherwise adversely affecting the defendants’ ability to complete the merger, then such injunctive or other relief may prevent the merger from becoming effective within the expected time frame or at all. If completion of the merger is prevented or delayed, it could result in substantial costs to the Company and Ingredion. In addition, the Company and Ingredion are incurring and will continue incurring significant costs in connection with the lawsuit, including, for the Company, costs associated with the indemnification of its directors.
Risk Factors Relating to Penford’s Common Stock
Penford’s stock price has fluctuated significantly; the trading price of its common stock may fluctuate significantly in the future.
The trading price of the Company’s common stock has fluctuated significantly. In fiscal 2014, the stock price ranged from a low of $10.71 on June 24, 2014, to a high of $15.18 on October 15, 2013. The trading price of Penford’s common stock may fluctuate significantly in the future as a result of a number of factors, including:
| • | actual and anticipated variations in the Company’s operating results; |
| • | general economic and market conditions, including changes in demand for the Company’s products; |
| • | interest rates; |
| • | geopolitical conditions throughout the world; |
| • | perceptions of the strengths and weaknesses of the Company’s industries; |
| • | the Company’s ability to pay principal and interest on its debt when due; |
| • | developments in the Company’s relationships with its lenders, customers and/or suppliers; |
| • | the performance of the Company compared to its competitors; |
| • | announcements of alliances, mergers or other relationships by or between the Company’s competitors and/or its suppliers and customers; and |
| • | quarterly variations in the Company’s results of operations due to, among other things, seasonality in demand for products and fluctuations in the cost of raw materials. |
The stock markets in general have experienced broad fluctuations that have often been unrelated to the operating performance of particular companies. These broad market fluctuations may adversely affect the trading price of the Company’s common stock. Accordingly, Penford’s common stock may trade at prices significantly below an investor’s cost, and investors could lose all or part of their investment in the event that they choose to sell their shares.
Provisions of Washington law could discourage or prevent a potential takeover.
Washington law imposes restrictions on certain transactions between a corporation and certain significant shareholders. The Washington Business Corporation Act generally prohibits a “target corporation” from
14
Table of Contents
engaging in certain significant business transactions with an “acquiring person,” which is defined as a person or group of persons that beneficially owns 10% or more of the voting securities of the target corporation, for a period of five years after such acquisition, unless the transaction or acquisition of shares is approved by a majority of the members of the target corporation’s board of directors prior to the time of the acquisition. Such prohibited transactions include, among other things, (1) a merger or consolidation with, disposition of assets to, or issuance or redemption of stock to or from, the acquiring person; (2) a termination of 5% or more of the employees of the target corporation as a result of the acquiring person’s acquisition of 10% or more of the shares; and (3) allowing the acquiring person to receive any disproportionate benefit as a shareholder. After the five-year period, a “significant business transaction” may occur if it complies with “fair price” provisions specified in the statute. A corporation may not “opt out” of this statute.
| Item 1B: | Unresolved Staff Comments |
None.
15
Table of Contents
| Item 2: | Properties |
Penford’s facilities as of August 31, 2014 were as follows:
| Bldg. Area (Approx. Sq. Ft.) |
Land Area (Acres) |
Owned/ Leased |
Function of Facility | |||||||||
| Centennial, Colorado |
25,200 | — | Leased | Corporate headquarters and offices and research laboratories for the Food Ingredients segment | ||||||||
| Englewood, Colorado |
46,054 | — | Leased | |||||||||
| Cedar Rapids, Iowa |
759,000 | * | 29 | Owned | Manufacture of corn starch products and research laboratories for the Industrial Ingredients and Food Ingredients segments | |||||||
| Idaho Falls, Idaho |
30,000 | 4 | Owned | Manufacture of potato starch products for the Food Ingredients segment | ||||||||
| Richland, Washington (owned and leased) |
— | 4.4 | — | Manufacture of potato and tapioca starch products for the Food Ingredients segment | ||||||||
| Building 1 |
45,000 | — | Owned | |||||||||
| Building 2 |
9,600 | — | Leased | |||||||||
| Plover, Wisconsin (two facilities, one of which is located on leased land) |
||||||||||||
| Facility 1 |
45,000 | 9.5 | Owned | Manufacture of potato starch products for the Food Ingredients segment | ||||||||
| Facility 2 |
15,000 | 3.3 | Owned (leased land) |
Manufacture of potato starch products for the Food Ingredients segment | ||||||||
| Berwick, Pennsylvania |
31,200 | 2.1 | Leased | Manufacture of potato starch products for the Industrial Ingredients segment | ||||||||
| 20,000 | — | Leased | Office and warehouse | |||||||||
| North Charleston, South Carolina |
21,700 | 5.0 | Owned | Office and manufacture of potato starch products for the Industrial Ingredients segment | ||||||||
| Tucson, Arizona |
4,300 | — | Leased | Office and research laboratories for the Food Ingredients segment | ||||||||
| * | Approximately 119,150 square feet are subject to a long-term lease to the purchaser of the Company’s former dextrose business. |
Penford’s production facilities are strategically located near sources of raw materials. The Company believes that its facilities are maintained in good condition and that the capacities of its plants are sufficient to meet current production requirements. The Company invests in expansion, improvement and maintenance of property, plant and equipment as required.
| Item 3: | Legal Proceedings |
The Company regularly evaluates the status of claims and legal proceedings in which it is involved in order to assess whether a loss is probable or there is a reasonable possibility that a loss may have been incurred, and to determine if accruals are appropriate. The Company expenses legal costs as such costs are incurred.
16
Table of Contents
Pet Product Patent Litigation (T.F.H. Publications, Inc. v. Penford Products Co. et al)
In June 2011, the Company was notified that a complaint had been filed against a customer of a Company subsidiary, Penford Products Co., in the United States District Court for the District of New Jersey. The complaint alleged that certain pet products supplied by Penford Products to the customer infringed upon a patent owned by T.F.H. Publications, Inc. The customer tendered the defense of this lawsuit to Penford Products pursuant to the terms of its supply agreement with Penford Products. Penford Products thereafter commenced the defense of this litigation on behalf of the customer. In April 2012, the plaintiff filed an amended complaint alleging that certain additional products made by Penford Products for the same customer infringed upon two of the plaintiff’s patents. In November 2013, the plaintiff filed another amended complaint adding Penford Products as a defendant in the suit. The Plaintiff is seeking an injunction against infringement of its patents, as well as the recovery of an unspecified amount of damages.
The court held a claim construction hearing on August 7, 2013, and rendered an opinion dated April 30, 2014. The Company believes that the court’s opinion substantially supports its position that none of the products supplied by Penford Products infringes upon the patents in the suit. The Company has recently entered into settlement negotiations with the plaintiff, but there can be no assurance that these negotiations will be successfully completed. If the negotiations fail, the Company will continue to evaluate further steps in order to obtain the dismissal of the litigation. The Company cannot at this time determine the likelihood of any outcome or estimate any damages that might be awarded.
Estate of Brett D. Brown (Heather A. Brown as Administrator for the Estate of Brett D. Brown v. Penford Corporation and Penford Products Co)
In early October 2014, the Company was notified that a petition had been filed against it and its subsidiary company, Penford Products Co., in the Iowa District Court for Linn County by the Administrator for the Estate of Brett D. Brown alleging negligence by the Company in connection with the death of Brett D. Brown, a former employee of an electrical contractor for Penford Products, at the Company’s Cedar Rapids plant. The petition does not specify an amount of damages being sought. The Company expects to defend the matter and to deny all allegations of negligence or fault. Pursuant to an indemnification agreement, the Company has tendered the defense of this matter to Mr. Brown’s former employer, and, by virtue of the Company’s status as an additional insured, to the employer’s insurer. The Company cannot at this time determine the likelihood of any outcome or estimate any damages that might be awarded.
Merger Agreement Shareholder Litigation (David Pill, individually and on behalf of all others similarly situated v. Penford Corporation, Ingredion Incorporated, et al)
In early November 2014, the Company, its directors and others were served with a complaint purporting to institute a stockholder class action in the Superior Court of Washington, King County, in connection with the Agreement and Plan of Merger that the Company entered into with Ingredion Incorporated on October 14, 2014. The complaint alleges, among other things, breaches of fiduciary duties in connection with the proposed acquisition of the Company by Ingredion. The plaintiff seeks an injunction against the proposed transaction and unspecified damages. In addition to legal defenses, the Company believes that it has adequate insurance protection that is expected to provide coverage applicable to the defense of this matter.
Management is unable to provide additional information regarding any possible loss in connection with the foregoing claims and proceedings because (i) the Company currently believes that the claims are not adequately supported, and (ii) there are significant factual and/or legal issues to be resolved. With regard to these matters, management does not believe, based on currently available information, that the eventual outcomes will have a material adverse effect on the Company’s financial condition, results of operations or liquidity, although the outcomes could be material to the Company’s operating results for any particular period, depending, in part, upon the operating results for such period.
17
Table of Contents
NewPage Bankruptcy Preference Litigation (Pirinate Consulting v. Penford Products Co. and Carolina Starches, LLC)
In late August and early September 2013, two of the Company’s subsidiaries, Penford Products and Carolina Starches, LLC, were served with separate complaints filed by Pirinate Consulting Group, LLC, as Litigation Trustee, for the NP Creditor Litigation Trust, as successor in interest to the bankruptcy estate of NewPage Corporation, an industrial starch customer of each subsidiary, in the United States Bankruptcy Court for the District of Delaware. The complaint against Carolina Starches was settled in March 2014 in exchange for a payment of $10,000. The complaint against Penford Products was settled in October 2014 in exchange for a payment of $50,000.
Other Claims and Litigation
The Company is involved from time to time in various other claims and litigation arising in the normal course of business. In the judgment of management, which relies in part on information obtained from the Company’s outside legal counsel, the ultimate resolution of these other matters will not materially affect the consolidated financial position, results of operations or liquidity of the Company.
| Item 4: | Mine Safety Disclosures |
Not applicable.
18
Table of Contents
PART II
| Item 5: | Market for the Registrant’s Common Equity, Related Shareholder Matters and Issuer Purchases of Equity Securities |
Market Information and Holders of Common Stock
Penford’s common stock, $1.00 par value, trades on The NASDAQ Global Market under the symbol “PENX.” On November 11, 2014, there were 326 shareholders of record. The high and low sales prices of Penford’s common stock during the last two fiscal years are set forth below.
| Fiscal 2014 | Fiscal 2013 | |||||||||||||||
| High | Low | High | Low | |||||||||||||
| Quarter Ended November 30 |
$ | 15.18 | $ | 11.18 | $ | 7.99 | $ | 6.50 | ||||||||
| Quarter Ended February 28 |
$ | 14.41 | $ | 10.93 | $ | 11.27 | $ | 7.25 | ||||||||
| Quarter Ended May 31 |
$ | 15.09 | $ | 11.18 | $ | 12.89 | $ | 9.35 | ||||||||
| Quarter Ended August 31 |
$ | 14.82 | $ | 10.71 | $ | 15.98 | $ | 11.04 | ||||||||
Dividends
Pursuant to the Company’s current revolving credit agreement, the Company may declare and pay dividends on its common stock in an amount not to exceed, in any consecutive four quarters, the lesser of $10 million or 50% of Free Cash Flow, as defined. As of August 31, 2014, the Company was not permitted to pay dividends. See Note 6 to the Consolidated Financial Statements.
Issuer Purchases of Equity Securities
None.
19
Table of Contents
Performance Graph
The following graph compares the Company’s cumulative total shareholder return on its common stock for a five-year period (September 1, 2009 to August 31, 2014) with the cumulative total return of the Nasdaq Market Index and all companies traded on the Nasdaq Stock Market (“Nasdaq”) with a market capitalization of $100—$200 million, excluding financial institutions. The graph assumes that $100 was invested on September 1, 2009 in the Company’s common stock and in the stated indices. The comparison assumes that all dividends are reinvested. The Company’s performance as reflected in the graph is not indicative of the Company’s future performance.
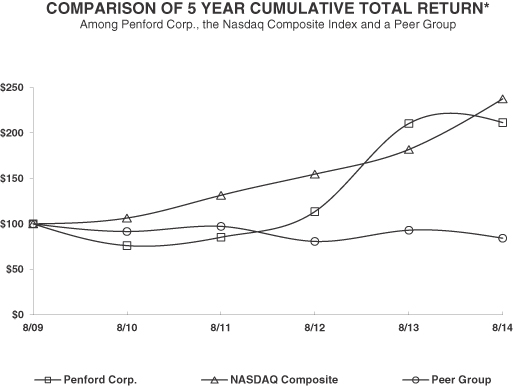
| * | $100 invested on 8/31/09 in stock or index, including reinvestment of dividends. Fiscal year ended August 31. |
ASSUMES $100 INVESTED ON SEPTEMBER 1, 2009
ASSUMES DIVIDEND REINVESTED
FISCAL YEAR ENDED AUGUST 31, 2014
| 2009 | 2010 | 2011 | 2012 | 2013 | 2014 | |||||||||||||||||||
| PENFORD CORPORATION |
$ | 100.00 | $ | 76.09 | $ | 85.40 | $ | 113.51 | $ | 210.40 | $ | 211.49 | ||||||||||||
| NASDAQ MARKET INDEX (U.S.) |
$ | 100.00 | $ | 106.46 | $ | 131.60 | $ | 154.71 | $ | 182.00 | $ | 237.54 | ||||||||||||
| NASDAQ MARKET CAP ($100-200M) |
$ | 100.00 | $ | 91.68 | $ | 97.27 | $ | 80.84 | $ | 93.08 | $ | 84.33 | ||||||||||||
Management does not believe there is either a published index or a group of companies whose overall business is sufficiently similar to the business of Penford to allow a meaningful benchmark against which the Company can be compared. The Company sells products based on specialty carbohydrate chemistry to several distinct markets, making overall comparisons to one of these markets misleading with respect to the Company as a whole. For these reasons, the Company has elected to use non-financial companies traded on Nasdaq with a similar market capitalization as a peer group.
20
Table of Contents
| Item 6: | Selected Financial Data |
The following table sets forth certain selected financial information for the five fiscal years as of and for the period ended August 31, 2014. This table should be read in conjunction with the Consolidated Financial Statements and the notes to these statements included in Item 8.
| Year Ended August 31, | ||||||||||||||||||||
| 2014 | 2013 | 2012 (3) | 2011 | 2010 (1) | ||||||||||||||||
| (Dollars in thousands, except share and per share data) | ||||||||||||||||||||
| Operating Data: |
||||||||||||||||||||
| Sales |
$ | 443,873 | $ | 467,250 | $ | 433,151 | $ | 373,763 | $ | 294,517 | ||||||||||
| Cost of sales |
$ | 389,566 | $ | 422,203 | $ | 389,241 | $ | 339,928 | $ | 271,063 | ||||||||||
| Gross margin percentage |
12.2 | % | 9.6 | % | 10.1 | % | 9.1 | % | 8.0 | % | ||||||||||
| Income (loss) from continuing operations |
$ | 7,753 | $ | 4,007 | $ | (9,566 | ) | $ | (5,117 | ) | $ | (9,629 | ) | |||||||
| Income (loss) from discontinued operations |
$ | — | $ | — | $ | — | $ | — | $ | 16,312 | ||||||||||
|
|
|
|
|
|
|
|
|
|
|
|||||||||||
| Net income (loss) |
$ | 7,753 | $ | 4,007 | $ | (9,566 | ) | $ | (5,117 | ) | $ | 6,683 | ||||||||
| Diluted earnings (loss) per share from continuing operations |
$ | 0.60 | $ | 0.32 | $ | (0.78 | ) | $ | (0.42 | ) | $ | (0.84 | ) | |||||||
| Diluted earnings (loss) per share from discontinued operations |
$ | — | $ | — | $ | — | $ | — | $ | 1.41 | ||||||||||
|
|
|
|
|
|
|
|
|
|
|
|||||||||||
| Diluted earnings (loss) per share |
$ | 0.60 | $ | 0.32 | $ | (0.78 | ) | $ | (0.42 | ) | $ | 0.57 | ||||||||
| Dividends declared per common share |
$ | — | $ | — | $ | — | $ | — | $ | — | ||||||||||
| Average common shares and equivalents – assuming dilution |
12,857,580 | 12,618,158 | 12,293,749 | 12,250,914 | 11,600,885 | |||||||||||||||
| Balance Sheet Data (as of August 31,): |
||||||||||||||||||||
| Total assets |
$ | 239,190 | $ | 224,618 | $ | 236,179 | $ | 212,414 | $ | 208,408 | ||||||||||
| Capital expenditures |
12,994 | 14,199 | 14,146 | 8,295 | 5,980 | |||||||||||||||
| Long-term debt |
76,665 | 72,739 | 84,004 | 23,802 | 21,038 | |||||||||||||||
| Total debt |
76,849 | 72,970 | 84,462 | 24,223 | 21,467 | |||||||||||||||
| Redeemable preferred stock, Series A (2) |
— | — | — | 38,982 | 34,104 | |||||||||||||||
| Shareholders’ equity |
92,133 | 82,893 | 68,850 | 85,465 | 83,572 | |||||||||||||||
| (1) | Income (loss) from continuing operations included (i) a pre-tax charge of approximately $1.0 million related to unamortized transaction fees associated with the Company’s prior credit facility when the Company refinanced its bank debt and (ii) a loss of approximately $1.6 million related to the termination of the Company’s interest rate swap agreements. Income (loss) from discontinued operations included the reclassification of $13.8 million of currency translation gains from other comprehensive income to earnings following the liquidation of most of the remaining net assets of the Australia/New Zealand Operations. |
| (2) | In fiscal 2010, the Company issued $40.0 million of Series A 15% cumulative non-voting, non-convertible preferred stock (“Series A Preferred Stock”) and 100,000 shares of Series B voting convertible preferred stock (“Series B Preferred Stock”) in a private placement to Zell Credit Opportunities Master Fund, L.P., an investment fund managed by Equity Group Investments, a private investment firm (the “Investor”). Proceeds from the preferred stock issuance of $40.0 million were used to repay bank debt. During fiscal 2012, the Company redeemed all of the Series A Preferred Stock with funds borrowed on the Company’s revolving line of credit. The amount redeemed was $40.0 million plus accrued dividends of $8.9 million. |
21
Table of Contents
| (3) | Income from continuing operations included (i) accelerated discount accretion of $5.5 million and (ii) amortization of issuance costs of $1.1 million, both related to the early redemption of the Series A Preferred Stock and recorded in other non-operating income (expense). The results of operations for Carolina Starches are included since the acquisition on January 11, 2012. |
22
Table of Contents
| Item 7: | Management’s Discussion and Analysis of Financial Condition and Results of Operations |
This Management’s Discussion and Analysis of Financial Condition and Results of Operations (“MD&A”) should be read in conjunction with the Company’s Consolidated Financial Statements and the accompanying notes. The notes to the Consolidated Financial Statements referred to in this MD&A are included in Part II Item 8, “Financial Statements and Supplementary Data.”
Overview
Penford generates revenues, income and cash flows by developing, manufacturing and marketing specialty natural-based ingredient systems for food and industrial applications, including fuel grade ethanol. The Company develops and manufactures ingredients with starch as a base, providing value-added applications to its customers. Penford’s starch products are manufactured primarily from corn and potatoes and are used principally as binders and coatings in paper, packaging and food production and as an ingredient in fuel.
Penford manages its business in two segments: Industrial Ingredients and Food Ingredients. These segments are based on broad categories of end-market users. See Note 18 to the Consolidated Financial Statements for additional information regarding the Company’s business segment operations.
In January 2012, the Company acquired, through purchase and capital lease, the net assets and operations of the business generally known as Carolina Starches, which manufactures and markets industrial potato starch based products and blends for the paper and packaging industries. The acquisition of this business has provided an important source of raw material to support continued growth in the Company’s Food Ingredients business and has broadened the Company’s portfolio of specialty modified industrial starches.
In March 2014, the Company acquired substantially all of the assets of Gum Technology, an Arizona close corporation, which distributes and blends gums and hydrocolloids for the food and beverage industries in North America and Asia. Gum Technology specializes in developing and producing customized stabilizers to meet customers’ product formulation needs. This acquisition broadened the Company’s Food Ingredients portfolio of functional and specialty ingredient systems. See Note 17 to the Consolidated Financial Statements.
On October 14, 2014, the Company and Ingredion entered into the Merger Agreement, pursuant to which Ingredion will acquire the Company in an all-cash transaction valued at approximately $340.0 million. Upon closing of the merger, each outstanding share of the Company’s common stock will be converted into the right to receive $19.00 in cash. The merger is subject to certain closing conditions and covenants and provides certain termination rights for the parties to the Merger Agreement. See Note 21 to the Consolidated Financial Statements.
In analyzing business trends, management considers a variety of performance and financial measures, including sales revenue growth, sales volume growth, gross margins and operating income of the Company’s business segments.
Results of Operations
Executive Overview – Consolidated Results of Operations
| • | Consolidated sales declined $23.4 million, or 5.0% to $443.9 million from $467.3 million a year ago. |
| • | The sales decrease was driven by lower pricing in both business units, particularly in the Industrial Ingredients segment, where average unit selling prices for industrial starch products are affected by the changes in corn costs. |
| • | Consolidated gross margin increased by $9.3 million driven primarily by lower corn costs and volume improvements in both businesses. The Industrial Ingredients business also updated its estimates of |
23
Table of Contents
| useful lives of certain machinery and equipment, which lowered depreciation expense for fiscal 2014 by $1.4 million. Harsh winter conditions in the second quarter of fiscal 2014 negatively affected gross margin in the Industrial Ingredients segment. |
| • | The Company amended one of its pension plans to cease further benefit accruals for participants. Consolidated pension expense for fiscal 2014 decreased by approximately $0.8 million due to the amendment. |
| • | The Company’s effective tax rate for fiscal 2014 was 38%. See below and Note 15 to the Consolidated Financial Statements. |
Results of Operations
Fiscal 2014 Compared to Fiscal 2013
Industrial Ingredients
| Year Ended August 31, | ||||||||
| 2014 | 2013 | |||||||
| (Dollars in thousands) | ||||||||
| Sales – industrial starch |
$ | 158,379 | $ | 177,382 | ||||
| Sales – ethanol |
96,718 | 96,852 | ||||||
| Sales – by-products |
62,186 | 81,782 | ||||||
|
|
|
|
|
|||||
| Total sales |
$ | 317,283 | $ | 356,016 | ||||
| Gross margin |
$ | 16,666 | $ | 10,647 | ||||
| Income (loss) from operations |
$ | 2,587 | $ | (3,238 | ) | |||
Industrial Ingredients fiscal 2014 sales of $317.3 million declined $38.7 million, or 10.9%, from fiscal 2013. Industrial starch sales of $158.4 million decreased 10.7% primarily due to a lower pass-through of corn costs to customers as corn prices declined during fiscal 2014. Sales of bioproducts, included in the industrial starch sales category, increased 11% on volume growth of 7% and an increase in average unit selling prices of 4%. Fiscal 2014 sales of ethanol were comparable to last year. A 6% increase in ethanol volumes was offset by a 6% decline in average per gallon sales prices. Sales of by-products decreased $19.6 million, or 24%, primarily due to lower pricing for corn by-products, as corn costs declined in fiscal 2014.
Gross margin increased $6.0 million to $16.6 million in fiscal 2014 from $10.6 million a year ago. Margins expanded due to lower raw material costs, primarily corn, of $14.1 million, higher sales volume of $1.7 million and a decrease in depreciation expense of $1.4 million, partially offset by lower pricing of $6.0 million, higher energy costs of $4.3 million and an increase of $1.2 million in maintenance and distribution costs caused by the harsh winter weather conditions in the second quarter of fiscal 2014, partially offset by a reduction of $0.4 million in other manufacturing costs. During the third quarter of fiscal 2014, the Industrial Ingredients segment changed its estimates of useful lives of certain machinery and equipment to better match depreciation expense with the periods in which these assets are expected to generate revenue. The change in estimated useful lives lowered depreciation expense as compared to the amount that would have been recorded using the historical estimated useful lives. The effect of this change on operating income of the Industrial Ingredients business for fiscal 2014 was an increase in operating income of $1.4 million. The Company expects, based on its current level of operations and investment in property, plant and equipment, that the effect of this change in depreciable lives for fiscal 2015 will be a decrease in depreciation expense from fiscal 2014 of approximately $3.4 million. See Note 2 to the Consolidated Financial Statements.
Operating income for fiscal 2014 expanded $5.8 million over fiscal 2013 due the improvement in gross margin. Operating and research and development expenses of $14.1 million were comparable to the prior year.
24
Table of Contents
Food Ingredients
| Year Ended August 31, | ||||||||
| 2014 | 2013 | |||||||
| (Dollars in thousands) | ||||||||
| Sales |
$ | 126,590 | $ | 111,234 | ||||
| Gross margin |
$ | 37,641 | $ | 34,399 | ||||
| Income from operations |
$ | 24,345 | $ | 23,265 | ||||
Sales of $126.6 million for the year ended August 31, 2014 increased 13.8%, or $15.4 million. The Gum Technology business, which was acquired in March 2014, contributed $5.1 million to fiscal 2014 sales growth. Sales, excluding Gum Technology, grew 9.3% on volume growth of 15%, partially offset by unfavorable product mix and pricing of 5%. Sales of non-coating and coating applications expanded 12% and 3%, respectively, during fiscal 2014.
Gross margin improved $3.2 million in fiscal 2014 over the prior year. Increased volume and lower manufacturing costs contributed $5.5 million and $2.4 million, respectively, to the gross margin expansion. Partially offsetting these factors were higher raw material costs of $3.9 million and unfavorable pricing and mix of $0.8 million. Income from operations grew $1.1 million on the increase in gross margin, partially offset by higher operating and research and development expenses. Operating and research and development expenses increased $2.2 million on higher employee costs of $1.3 million and additional expenses of Gum Technology of $0.9 million.
Corporate Operating Expenses
Corporate operating expenses increased $1.1 million on an increase in employee costs and higher professional fees.
Fiscal 2013 Compared to Fiscal 2012
Industrial Ingredients
| Year Ended August 31, | ||||||||
| 2013 | 2012 | |||||||
| (Dollars in thousands) | ||||||||
| Sales – industrial starch |
$ | 177,382 | $ | 156,945 | ||||
| Sales – ethanol |
96,852 | 101,874 | ||||||
| Sales – by-products |
81,782 | 71,788 | ||||||
|
|
|
|
|
|||||
| Total sales |
$ | 356,016 | $ | 330,607 | ||||
| Gross margin |
$ | 10,647 | $ | 11,744 | ||||
| Loss from operations |
$ | (3,238 | ) | $ | (928 | ) | ||
Industrial Ingredients fiscal 2013 sales of $356.0 million grew $25.4 million, or 7.7%, over fiscal 2012. Industrial starch sales of $177.4 million increased 13% due to (1) additional sales of $12.2 million from the January 2012 acquisition of Carolina Starches, (2) increased average unit pricing of $3.2 million and (3) the pass-through of higher corn costs to customers. Sales of bioproducts, included in the industrial starch sales category, were comparable to those generated in 2012. Fiscal 2013 sales of ethanol constituted 27.2% of industrial sales in fiscal 2013 compared to 30.8% in fiscal 2012. Sales of ethanol decreased $5.0 million due to a 7% decrease in volume, partially offset by a 3% increase in average unit pricing. Sales of by-products increased $10.0 million, or 13.9%, primarily due to favorable pricing for meal and feed.
Gross margin decreased $1.1 million to $10.6 million in fiscal 2013 from $11.7 million in fiscal 2012. Margins declined due to lower volume of $0.7 million, higher corn costs of $6.7 million that could not be passed through to customers and increased personnel costs of $2.0 million, partially offset by $8.0 million in favorable pricing and product mix and $0.3 million of lower manufacturing costs.
25
Table of Contents
The loss from operations for fiscal 2013 was $3.2 million compared with a loss of $0.9 million in fiscal 2012. The change in the operating loss was due to the decrease in gross margin described above, $0.9 million of additional operating expenses related the acquisition of Carolina Starches in the second quarter of fiscal 2012 and $0.6 million in higher employee costs for commercial and business development resources, partially offset by lower professional fees of $0.3 million.
Food Ingredients
| Year Ended August 31, | ||||||||
| 2013 | 2012 | |||||||
| (Dollars in thousands) | ||||||||
| Sales |
$ | 111,234 | $ | 102,544 | ||||
| Gross margin |
$ | 34,399 | $ | 32,165 | ||||
| Income from operations |
$ | 23,265 | $ | 21,591 | ||||
Sales of $111.2 million for the year ended August 31, 2013 increased 8.5%, or $8.7 million, on volume growth of 7% and favorable product mix and pricing of 2%. Sales of non-coating applications expanded 14%, with revenues from gluten-free, dairy and soups/sauces/gravy applications growing at double-digit rates. Sales of coating applications declined slightly on lower volume of 3%, partially offset by higher unit pricing of 1%.
Gross margin improved $2.2 million in fiscal 2013 over fiscal 2012. Increased volume and favorable pricing and mix contributed $2.1 million and $0.9 million, respectively, to the gross margin expansion. Partially offsetting these factors were higher raw material costs of $0.7 million and increased manufacturing costs of $0.1 million. Income from operations grew $1.7 million on the increase in gross margin, partially offset by higher operating and research and development expenses. Operating and research and development expenses increased $0.6 million on higher employee, marketing and software costs.
Corporate Operating Expenses
Corporate operating expenses increased less than $0.1 million on higher professional fees, partially offset by lower employee-related costs.
Non-Operating Income (Expense)
Other non-operating income (expense) consisted of the following:
| Year Ended August 31, | ||||||||||||
| 2014 | 2013 | 2012 | ||||||||||
| (Dollars in thousands) | ||||||||||||
| Loan forgiveness |
$ | 1,000 | $ | — | $ | — | ||||||
| Loss on extinguishment of debt |
(265 | ) | — | — | ||||||||
| Loss on redemption of Series A Preferred Stock |
— | — | (6,599 | ) | ||||||||
| Other |
31 | 75 | 413 | |||||||||
|
|
|
|
|
|
|
|||||||
| $ | 766 | $ | 75 | $ | (6,186 | ) | ||||||
|
|
|
|
|
|
|
|||||||
On August 1, 2014, the Company refinanced its bank debt. See Note 6 to the Consolidated Financial Statements. In connection with the refinancing, the Company recognized a pre-tax, non-cash charge to earnings of approximately $0.3 million in the fourth quarter of fiscal 2014 related to unamortized transaction fees associated with the prior credit facility.
In May 2014, the Company was notified by the Iowa Department of Economic Development that its obligations to maintain certain levels of employment at the Cedar Rapids plant had been met and that repayment of the $1.0 million forgivable loan had been waived. The Company recorded the loan forgiveness of $1.0 million as non-operating income. See Note 6 to the Consolidated Financial Statements.
26
Table of Contents
In fiscal 2012, the Company redeemed 100,000 shares of its Series A Preferred Stock at the original issue price of $40.0 million plus accrued dividends of $8.9 million. As a result of the early redemptions, the Company recorded accelerated discount accretion of $5.5 million and amortization of issuance costs of $1.1 million as a loss on redemption in other non-operating income (expense).
Interest Expense
Interest expense was $3.6 million, $4.0 million and $8.6 million in fiscal years 2014, 2013 and 2012, respectively. Interest expense declined in fiscal 2014 due to both lower average debt balances and lower interest rates compared to the previous year.
Interest expense decreased in fiscal 2013 compared to fiscal 2012 due to the redemption of the Company’s 15% Series A Preferred Stock in fiscal 2012. The dividend rate of 15% on the Series A Preferred Stock was higher than the interest rates on the Company’s bank debt, which are based on LIBOR (“London Interbank Offered Rate”) or the bank’s prime rate plus a margin.
Income Taxes
The effective tax rate of 38% for fiscal 2014 differed from the U.S. federal statutory rate primarily due to state income taxes, somewhat offset by the partial reversal of a tax valuation allowance due to the utilization of ethanol tax credit carryforwards and the net reductions in unrecognized tax benefits due to the lapsing of applicable statutes of limitations. See Note 15 to the Consolidated Financial Statements.
The effective tax rate of 27% for fiscal 2013 differed from the U.S. federal statutory rate primarily due to state income taxes and the tax effect of expiring and exercised stock options, offset by tax credits for research and development expenditures, net reductions in unrecognized tax benefits due to the lapsing of applicable statutes of limitation and the partial reversal of the Company’s valuation allowance due ethanol credit carryforwards. See Note 15 to the Consolidated Financial Statements.
In fiscal 2012, the Company recorded $4.8 million of tax expense on a pre-tax loss of $4.8 million. The effective tax rate for fiscal 2012 differed from the U.S. federal statutory rate due to $13.0 million of non-deductible expenses related to the Company’s Series A Preferred Stock ($5.4 million of dividends, $6.3 million of discount amortization and $1.3 million of amortization of issuance costs) and a $1.8 million valuation allowance related to the small ethanol producer tax credit carryforwards. Tax laws require that any net operating loss carryforwards be utilized before the Company can utilize the small ethanol producer tax credit carryforwards. Due to the near-term expiration of the small ethanol producer tax credit carryforward period, the Company did not believe it had sufficient positive evidence to substantiate that the small ethanol tax credit carryforwards were realizable at a more-likely-than-not level of assurance and recorded a $1.8 million valuation allowance. In fiscal years 2013 and 2014, approximately $0.3 million of the ethanol tax credit had been utilized; the remainder of the tax credit carryforward expired and the valuation allowance was reversed.
At August 31, 2014, the Company had $2.0 million of U.S. net deferred tax assets. Other than a valuation allowance of $0.1 million for state tax credits, a valuation allowance has not been provided on the net U.S. deferred tax assets as of August 31, 2014. The determination of the need for a valuation allowance requires significant judgment and estimates. The Company evaluates the requirement for a valuation allowance each quarter. The Company believes that it is more likely than not that future operations will generate sufficient taxable income to realize its deferred tax assets. However, there can be no assurance that management’s current plans will be achieved or that a valuation allowance will not be required in the future.
27
Table of Contents
Liquidity and Capital Resources
The Company’s primary sources of short- and long-term liquidity are cash flow from operations and its revolving line of credit, which expires on August 1, 2019. The Company expects to generate sufficient cash flow from operations and to have sufficient borrowing capacity and ability to fund its cash requirements during fiscal 2015.
| Year Ended August 31, | ||||||||||||
| 2014 | 2013 | 2012 | ||||||||||
| (Dollars in thousands) | ||||||||||||
| Net cash flow provided by operating activities |
$ | 18,054 | $ | 24,649 | $ | 2,560 | ||||||
| Net cash used in investing activities |
(22,325 | ) | (12,062 | ) | (22,418 | ) | ||||||
| Net cash provided by (used in) financing activities |
4,239 | (12,520 | ) | 19,731 | ||||||||
|
|
|
|
|
|
|
|||||||
| Net increase (decrease) in cash |
$ | (32 | ) | $ | 67 | $ | (127 | ) | ||||
|
|
|
|
|
|
|
|||||||
Operating Activities
At August 31, 2014, Penford had working capital of $59.4 million, and $76.0 million outstanding under its $145 million revolving credit facility. Cash flow generated from operations of $18.1 million in fiscal year 2014 decreased $6.6 million from the prior year. The decrease was primarily due to higher inventories at the Food Ingredients segment related to the acquisition of Gum Technology inventory and to support future sales levels. During fiscal 2015, the Company expects to utilize its remaining federal net operating loss carryforwards, which, depending on the level of taxable income generated in fiscal 2015, will require the Company to make cash federal income tax payments.
Cash flow generated from operations of $24.6 million in fiscal year 2013 increased $22.1 million from fiscal 2012. The increase was due to higher earnings, lower inventories, lower minimum pension contributions and reductions in interest costs with the redemption of the Company’s preferred stock in fiscal 2012.
Investing Activities
Capital expenditures were $13.0 million, $14.2 million and $14.1 million in fiscal years 2014, 2013 and 2012, respectively. Penford expects capital expenditures to be approximately $25 million in fiscal 2015. In fiscal 2013, the Company settled a claim against a contractor and its insurer that arose from engineering design work performed in connection with the construction of the Company’s ethanol plant. Approximately $2.1 million of the settlement was reflected as a reduction of the cost of the ethanol plant.
In March 2014, the Company acquired substantially all of the assets of Gum Technology, which distributes and blends gums and hydrocolloids for the food and beverage industries in North America and Asia. Gum Technology specializes in developing and producing customized stabilizers to meet customers’ product formulation needs. This acquisition broadens the Company’s Food Ingredients portfolio of functional and specialty ingredient systems. See Note 17 to the Consolidated Financial Statements.
In fiscal 2012, the Company purchased the businesses of Carolina Starches for $8.5 million in cash. Cash acquired in the purchase transaction was $0.2 million.
Financing Activities
Preferred Stock
In fiscal 2010, the Company issued $40.0 million of mandatorily redeemable Series A 15% cumulative non-voting, non-convertible preferred stock and 100,000 shares of Series B voting convertible preferred stock in a private placement to Zell Credit Opportunities Master Fund, L.P., an investment fund managed by Equity Group Investments, a private investment firm. Proceeds from the preferred stock issuance of $40.0 million were used to repay bank debt in fiscal 2010.
28
Table of Contents
During fiscal 2012, the Company redeemed all of its Series A Preferred Stock at the original issue price of $40.0 million plus accrued dividends of $8.9 million. As a result of the early redemption, the Company recorded accelerated discount accretion of $5.5 million and amortization of issuance costs of $1.1 million as a loss on the redemption in other non-operating income (expense). The redemptions were funded by available balances on the Company’s revolving line of credit.
During fiscal 2012, the Investor converted its 100,000 shares of Series B Preferred Stock into 1,000,000 shares of the Company’s common stock.
Bank Debt
In July 2012, in connection with the redemption of $40.0 million of Series A Preferred Stock, the Company refinanced its obligations then outstanding. The Company entered into a $130 million Fourth Amended and Restated Credit Agreement (the “2012 Agreement”) with a group of lenders with Bank of Montreal as Administrative Agent.
On August 1, 2014, the Company refinanced its obligations then outstanding under the 2012 Agreement and entered into a $145 million Credit Agreement (the “2014 Agreement”) with the following banks: Cooperatieve Centrale Raiffeisen-Boerenleenbank B.A., “Rabobank Nederland” New York Branch (“Rabobank”); KeyBank National Association; JPMorgan Chase Bank N.A.; First Midwest Bank; the Private Bank and Trust Company; GreenStone Farm Credit Services, ACA; Branch Banking and Trust Company; AgStar Financial Services PCA and Farm Credit Services of America, PCA. Under the 2014 Agreement, the Company may borrow $145 million in revolving lines of credit. The lenders’ revolving credit loan commitment may be increased under certain conditions. Under the 2014 Agreement, there are no scheduled principal payments prior to maturity on August 1, 2019.
On August 31, 2014, the Company had $76.0 million outstanding under the 2014 Agreement, which is subject to variable interest rates. Interest rates under the 2014 Agreement are based on either a base rate or a eurodollar rate, depending on the Company’s selection of available borrowing options, plus the applicable margin. The applicable margin varies from 1% to 2.5% for base rate loans and from 2% to 3.5% for eurodollar loans, depending on the Company’s Total Leverage Ratio, as defined in the 2014 Agreement.
The 2014 Agreement provides that the Total Leverage Ratio, which is computed as funded debt divided by earnings before interest, taxes, depreciation and amortization (as defined in the 2014 Agreement) shall not exceed 5.00 through August 31, 2015; 4.50 from November 30, 2015 through August 31, 2016; 4.25 from November 30, 2016 through August 31, 2017; and 3.75 thereafter. In addition, the Company must maintain a Fixed Charge Coverage Ratio, as defined in the 2014 Agreement, of not less than 1.25. Beginning in fiscal year 2015, annual capital expenditures are restricted to $25 million. Maximum annual capital expenditures may be increased to $35 million if the Total Leverage Ratio is less than 2.00 for the last two fiscal quarters of the year. To the extent that annual capital expenditures are less than the maximum, the difference between the actual and maximum capital expenditures will be added to the capital expenditures permitted in the immediately succeeding fiscal year. The Company’s obligations under the 2014 Agreement are secured by substantially all of the Company’s assets. The Company was in compliance with the covenants in the 2014 Agreement as of August 31, 2014.
Also on August 1, 2014, the Company entered into a $25 million Delayed Draw Term Loan Credit Agreement (the “Term Loan Agreement”) with Rabobank. The Term Loan Agreement provides the Company with a term loan facility in an aggregate principal amount up to $25 million. The term loan facility may be utilized in a series of up to six drawings until the 18-month anniversary of the date of the Term Loan Agreement. Any unused portion of the lender’s commitment to make term loans under this facility will expire on the 18-month anniversary of the closing date. The maturity date for loans under the Term Loan Agreement is July 31,
29
Table of Contents
2020, and there are no scheduled principal payments due prior to maturity. The Company’s obligations under the Term Loan Agreement are secured on a second-priority basis by substantially all of the Company’s assets. There were no borrowings outstanding under the Term Loan Agreement as of August 31, 2014.
The Term Loan Agreement provides that the Total Leverage Ratio, which is computed as funded debt divided by earnings before interest, taxes, depreciation and amortization (as defined in the Term Loan Agreement) shall not exceed 5.50 through August 31, 2015; 5.00 from November 30, 2015 through August 31, 2016; 4.75 from November 30, 2016 through August 31, 2017; and 4.25 thereafter. In addition, the Company must maintain a Fixed Charge Coverage Ratio, as defined in the Term Loan Agreement, of not less than 1.10.
Dividends
Pursuant to the 2014 Agreement, the Company may declare and pay dividends on its common stock in an amount not to exceed, in any consecutive four quarters, the lesser of $10 million or 50% of Free Cash Flow, as defined. As of August 31, 2014, the Company was not permitted to pay dividends. See Note 6 to the Consolidated Financial Statements.
Critical Accounting Estimates
The Company’s consolidated financial statements are prepared in accordance with accounting principles generally accepted in the United States. The process of preparing financial statements requires management to make estimates, judgments and assumptions that affect the Company’s financial position and results of operations. These estimates, judgments and assumptions are based on the Company’s historical experience and management’s knowledge and understanding of the current facts and circumstances. Management believes that its estimates, judgments and assumptions are reasonable based upon information available at the time this report was prepared. To the extent there are material differences between estimates, judgments and assumptions and actual results, the financial statements will be affected.
Management has reviewed the accounting estimates and related disclosures with the Audit Committee of the Board of Directors. The estimates that management believes are the most important to the financial statements and that require the most difficult, subjective and complex judgments included the following:
| • | Evaluation of the allowance for doubtful accounts receivable |
| • | Hedging activities |
| • | Benefit plans |
| • | Long-lived assets |
| • | Valuation of goodwill |
| • | Self-insurance program |
| • | Income taxes |
| • | Stock-based compensation |
A description of each of these follows:
Evaluation of the Allowance for Doubtful Accounts Receivable
Management makes judgments about the Company’s ability to collect outstanding receivables and provides allowances for the portion of receivables that the Company may not be able to collect. Penford estimates the allowance for uncollectible accounts based on historical experience, known troubled accounts, industry trends,
30
Table of Contents
economic conditions, how recently payments have been received and ongoing credit evaluations of its customers. If the estimates do not reflect the Company’s future ability to collect outstanding invoices, Penford may experience losses in excess of the reserves established. See Note 2 to the Consolidated Financial Statements.
Hedging Activities
Penford uses derivative instruments, primarily exchange-traded futures contracts, to reduce exposure to price fluctuations of commodities used in the manufacturing processes in the United States. The Company relies upon exchange settlement to address the default risk exposure. Penford has elected to designate these activities as hedges. For cash flow hedging activities, this election allows the Company to defer gains and losses on those derivative instruments until the underlying exposure affects earnings. For fair value hedging activities, the gain or loss on the derivative instruments offset gains or losses on the hedged item.
The requirements for the designation of hedges are very complex, and require judgments and analyses to qualify as hedges as defined by generally accepted accounting principles in the United States. These judgments and analyses include an assessment that the derivative instruments used are effective hedges of the underlying risks. If the Company were to fail to meet the requirements to qualify for derivative accounting, or if these derivative instruments are not designated as hedges, the Company would be required to mark these contracts to fair value at each reporting date through current earnings.
Effective August 1, 2014, the Company discontinued hedge accounting treatment for corn futures contracts as the hedging relationship no longer met the requirements for hedge accounting. See Note 13 to the Consolidated Financial Statements.
Benefit Plans
Penford has defined benefit plans for some employees, providing retirement benefits and coverage for retiree health care. Qualified third-party actuaries assist management in determining the recorded liabilities, expense and funded status of these employee benefit plans. Management makes several estimates and assumptions in order to measure the expense and funded status, including interest rates used to discount certain liabilities, rates of return on plan assets, rates of compensation increases, employee turnover rates, anticipated mortality rates and increases in the cost of medical care. The Company makes judgments about these assumptions based on historical investment results and experience, as well as available historical market data and trends. However, if these assumptions are wrong, it could materially affect the amounts reported in the Company’s future results of operations. Disclosure about these estimates and assumptions are included in Note 11 to the Consolidated Financial Statements. See “Defined Benefit Pension and Postretirement Benefit Plans” below.
Long-Lived Assets
The Company reviews long-lived assets for impairment when events or circumstances indicate that the carrying values may not be recoverable. An impairment loss would be recognized when estimated undiscounted future cash flows from the operation and disposition of the asset group are less than the carrying amount of the asset group. Asset groups have identifiable cash flows independent of other asset groups. Measurement of an impairment loss would be based on the excess of the carrying amount of the asset group over its fair value. Fair value is measured using an income approach (discounted cash flows) or a market-based approach. Estimating future cash flows requires significant judgment by management in such areas as future economic and industry-specific conditions, product pricing, sales volume and capital expenditures. There can be no assurance that management’s current projections of cash flows will be achieved or that an impairment charge will not be required in the future. An impairment charge could be material to the Company’s financial position and results of operations.
31
Table of Contents
Valuation of Goodwill
Penford is required to assess, on an annual basis, whether the value of goodwill reported on the balance sheet has been impaired, or more often if conditions exist that indicate that there might be impairment. These assessments require extensive and subjective judgments to assess the fair value of goodwill. While the Company engages qualified valuation experts to assist in this process, their work is based on the Company’s estimates of future operating results and allocation of goodwill to the business segments. If future operating results differ materially from the estimates, the value of goodwill and profitability could be adversely impacted.
Self-Insurance Program
The Company maintains a self-insurance program covering portions of workers’ compensation and group health liability costs. The amounts in excess of the self-insured levels are fully insured by third-party insurers. Liabilities associated with these risks are estimated in part by considering historical claims experience, severity factors and other actuarial assumptions. Projections of future losses are inherently uncertain because of the random nature of insurance claim occurrences and changes that could occur in actuarial assumptions. The financial results of the Company could be significantly affected if future claims and assumptions differ from those used in determining these liabilities.
Income Taxes
The determination of the Company’s provision for income taxes requires significant judgment, the use of estimates and the interpretation and application of complex tax laws. The Company’s provision for income taxes reflects a combination of income earned and taxed in the various U.S. federal and state taxing jurisdictions. Jurisdictional tax law changes, increases or decreases in permanent differences between book and tax items, accruals or adjustments of accruals for tax contingencies or valuation allowances and the Company’s change in the mix of earnings from these taxing jurisdictions all affect the overall effective tax rate.
The determination of the need for a valuation allowance on the Company’s net deferred tax assets requires significant judgment and estimates regarding future taxable income, the timing of the tax consequences of temporary differences between book and tax bases of assets and liabilities and feasible tax planning strategies. The Company evaluates the requirement for a valuation allowance each quarter.
A tax benefit from an uncertain tax position may be recognized when it is “more likely than not” that the tax return position will be sustained upon examination by the applicable taxing authorities based on the technical merits of the position. The amount recognized is measured as the largest amount of tax benefit that has a greater than 50% likelihood of being realized upon settlement. The liability for unrecognized tax benefits contains uncertainties because the Company is required to make assumptions and to apply judgment to estimate the exposures associated with the various tax filing positions. Management believes that the judgments and estimates it uses in evaluating its tax filing positions are reasonable; however, actual results could differ, and the Company may be exposed to significant gains and losses and the Company’s effective tax rate and cash flow in a given financial statement period could be materially affected. See Note 15 to the Consolidated Financial Statements.
Stock-Based Compensation
The Company provides compensation in the form of stock options or restricted shares of common stock to employees and non-employee directors under its 2006 Long-Term Incentive Plan. Share-based compensation cost is measured at the grant date based on the fair value of the award and is recognized as expense utilizing the accelerated multiple options approach over the requisite service period of the award, which equals the vesting period. Determining the appropriate fair value model and calculating the fair value of the share-based awards at the date of grant requires judgment, including estimating stock price volatility, forfeiture rates, the risk-free interest rate, dividends and expected option life. See Note 10 to the Consolidated Financial Statements.
32
Table of Contents
If circumstances change and the Company uses different assumptions for volatility, interest, dividends and option life in estimating the fair value of stock-based awards granted in future periods, stock-based compensation expense may differ significantly from the expense recorded in the current period. Forfeitures are estimated at the date of grant and revised in subsequent periods if actual forfeitures differ from those estimated. Therefore, if actual forfeiture rates differ significantly from those estimated, the Company’s results of operations could be materially impacted.
Contractual Obligations
As more fully described in Notes 6 and 9 to the Consolidated Financial Statements, the Company is a party to various debt and lease agreements at August 31, 2014 that contractually commit the Company to pay certain amounts in the future. Purchase obligations at August 31, 2014 represent an estimate of all open purchase orders and contractual obligations incurred during the Company’s normal course of business for commitments to purchase goods and services for production and inventory needs, such as raw materials, supplies, manufacturing arrangements, capital expenditures and maintenance. The terms of the majority of these obligations allow the Company or its suppliers the option to cancel or adjust the requirements based on business needs.
The following table summarizes such contractual commitments at August 31, 2014 (in thousands):
| 2015 | 2016-2017 | 2018-2019 | 2020 & After | Total | ||||||||||||||||
| Long-term debt and capital lease obligations (3) |
$ | 184 | $ | 434 | $ | 76,225 | $ | 6 | $ | 76,849 | ||||||||||
| Postretirement medical (1) |
854 | 1,942 | 2,348 | 7,638 | 12,782 | |||||||||||||||
| Defined benefit pensions (2) |
— | — | — | — | — | |||||||||||||||
| Operating lease obligations |
5,928 | 8,295 | 4,898 | 8,158 | 27,279 | |||||||||||||||
| Purchase obligations |
70,809 | 10,680 | 569 | — | 82,058 | |||||||||||||||
|
|
|
|
|
|
|
|
|
|
|
|||||||||||
| $ | 77,775 | $ | 21,351 | $ | 84,040 | $ | 15,802 | $ | 198,968 | |||||||||||
|
|
|
|
|
|
|
|
|
|
|
|||||||||||
| (1) | Represent estimated contributions to the unfunded postretirement medical plan in amounts needed to fund expected benefit payments for participants through fiscal 2024 based on actuarial assumptions. |
| (2) | The Company is not required to make contributions to its pension plans during fiscal 2015. Contributions to the pension plans in fiscal 2016 and beyond are not known. |
| (3) | Interest on the Company’s revolving bank debt varies with either the LIBOR Index Rate or the prime rate and the outstanding amount of debt, and is not included herein. |
Off-Balance Sheet Arrangements
The Company has no off-balance sheet arrangements that have or are reasonably likely to have a current or future material effect on the Company’s financial condition, changes in financial conditions, revenues or expenses, results of operations, liquidity, capital expenditures or capital resources.
Defined Benefit Pension and Postretirement Benefit Plans
Penford maintains two defined benefit pension plans and one defined benefit postretirement health care plan in the United States. In fiscal 2014, the Company amended its defined benefit pension plan for salaried employees to cease the further accrual of participant benefits. Pension expense for fiscal 2014 decreased by approximately $0.8 million due to the amendment.
The most significant assumptions used to determine benefit expense and benefit obligations are the discount rate and the expected return on assets assumption. See Note 11 to the Consolidated Financial Statements for the assumptions used by Penford.
33
Table of Contents
The discount rate used by the Company in determining benefit expense and benefit obligations reflects the yield of high quality (AA or better rating by a recognized rating agency) corporate bonds whose cash flows are expected to match the timing and amounts of projected future benefit payments. Benefit obligations and expense increase as the discount rate is reduced. The discount rates to determine net periodic expense used in 2014 (5.24%), 2013 (4.28%) and 2012 (5.87%) reflect the changes in bond yields over the past several years. Lowering the discount rate by 25 basis points would increase pension expense by approximately $0.2 million and other postretirement benefit expense would change by an insignificant amount. During fiscal 2014, bond yields declined and Penford decreased the discount rate for calculating its benefit obligations at August 31, 2014, as well as net periodic expense for fiscal 2015, to 4.39%.
The expected long-term return on assets assumption for the pension plans represents the weighted-average rate of return to be earned on plan assets over the period the benefits included in the benefit obligation are to be paid. Pension expense increases as the expected return on plan assets decreases. In developing the expected rate of return, the Company considers long-term historical market rates of return, as well as actual returns on the Company’s plan assets, and adjusts this information to reflect expected capital market trends. Penford also considers forward-looking return expectations by asset class, the contribution of active management and management fees paid by the plans. The plan assets are held in qualified trusts, and anticipated rates of return are not reduced for income taxes. The expected long-term return on assets assumption used to calculate net periodic pension expense was 7.0% for fiscal 2014. A 50-basis point decrease (increase) in the expected return on assets assumptions would increase (decrease) pension expense by approximately $0.3 million based on plan assets at August 31, 2014. The expected return on plan assets used in calculating fiscal 2015 pension expense is 7.0%.
Unrecognized net loss amounts reflect the difference between expected and actual returns on pension plan assets, as well as the effects of changes in actuarial assumptions. Unrecognized net losses in excess of certain thresholds are amortized into net periodic pension and postretirement benefit expense over the average remaining service life of active employees. As of August 31, 2014, unrecognized losses from all sources were $6.6 million for the pension plans and $1.6 million for the postretirement health care plan. Amortization of unrecognized net loss amounts is expected to increase net pension expense by approximately $0.1 million in fiscal 2015. Amortization of unrecognized net losses is not expected to increase net postretirement health care expense in fiscal 2015.
Penford recognized pension expense of $1.4 million, $3.9 million and $2.3 million in fiscal years 2014, 2013 and 2012, respectively. Penford expects pension expense to be approximately $0.2 million in fiscal 2015. The Company contributed $2.5 million, $1.1 million and $4.1 million to the pension plans in fiscal years 2014, 2013 and 2012, respectively. Penford estimates that it will not be required to make minimum contributions to the pension plans during fiscal 2015.
The Company recognized benefit expense for its postretirement health care plan of $0.9 million, $1.2 million and $1.0 million in fiscal years 2014, 2013 and 2012, respectively. Penford expects to recognize approximately $0.9 million in postretirement health care benefit expense in fiscal 2015. The Company contributed $0.8 million, $0.6 million and $0.5 million in fiscal years 2014, 2013 and 2012 to the postretirement health care plan and estimates that it will contribute $0.8 million in fiscal 2015.
Future changes in plan asset returns, assumed discount rates and various assumptions related to the participants in the defined benefit plans will affect future benefit expense and liabilities. The Company cannot predict what these changes will be.
Recent Accounting Pronouncements
Accounting Pronouncements Adopted
In February 2013, the Financial Accounting Standards Board (“FASB”) issued guidance requiring entities to provide information about the amounts reclassified out of accumulated other comprehensive income by component. Entities are required to present, either on the face of the financial statements or in the notes,
34
Table of Contents
significant amounts reclassified out of accumulated other comprehensive income by the respective line items of net income. This guidance did not change the current requirements for reporting net income or other comprehensive income. The Company adopted this guidance effective September 1, 2013, and the required disclosure is presented in Note 8 to the Consolidated Financial Statements.
In December 2011, the FASB issued guidance creating new disclosure requirements about the nature of an entity’s rights of setoff and related arrangements associated with its financial instruments and derivative instruments. The Company adopted this guidance effective September 1, 2013, and the required disclosure is presented in Note 13 to the Consolidated Financial Statements.
In July 2013, the FASB issued guidance designed to reduce diversity in practice of financial statement presentation of an unrecognized tax benefit when a net operating loss carryforward, a similar tax loss or a tax credit carryforward exists. The Company adopted this accounting presentation effective September 1, 2013. The Company complied with the prescribed accounting presentation in prior periods; therefore, the adoption of this guidance had no impact on the presentation of the Company’s financial statements.
Recent Accounting Pronouncements
On May 28, 2014, the FASB issued guidance that requires an entity to recognize the amount of revenue to which it expects to be entitled for the transfer of promised goods or services to customers. The guidance will replace most existing revenue recognition guidance when it becomes effective. The new standard is effective for the Company on September 1, 2017, and early application is not permitted. The standard permits the use of either the retrospective or cumulative effect transition method. The Company is evaluating the effect that this new guidance will have on its consolidated financial statements and related disclosures. The Company has not selected a transition method nor has it determined the effect of the standard on its ongoing financial reporting.
Forward-Looking Statements
This Annual Report on Form 10-K (“Annual Report”), including, but not limited, to statements found in the Notes to Consolidated Financial Statements and in Item 1 – Business and Item 7 – Management’s Discussion and Analysis of Financial Condition and Results of Operations, contains statements that are forward-looking statements within the meaning of the federal securities laws. In particular, statements pertaining to anticipated operations and business strategies contain forward-looking statements. Likewise, statements regarding anticipated changes in the Company’s business and anticipated market conditions are forward-looking statements. Forward-looking statements involve numerous risks and uncertainties and should not be relied upon as predictions of future events. Forward-looking statements depend on assumptions, dates or methods that may be incorrect or imprecise, and the Company may not be able to realize them. Forward-looking statements can be identified by the use of forward-looking terminology such as “believes,” “expects,” “may,” “will,” “should,” “seeks,” “approximately,” “intends,” “plans,” “estimates,” or “anticipates,” or the negative use of these words and phrases or similar words or phrases. Forward-looking statements can be identified by discussions of strategy, plans or intentions. The following factors, among others, could cause actual results and future events to differ materially from those set forth or contemplated in the forward-looking statements:
| • | competition; |
| • | the possibility of interruption of business activities due to equipment problems, accidents, strikes, weather or other factors; |
| • | product development risk; |
| • | changes in corn and other raw material prices and availability; |
| • | changes in general economic conditions or developments with respect to specific industries or customers affecting demand for the Company’s products, including unfavorable shifts in product mix or changes in government rules or incentives affecting ethanol consumption; |
35
Table of Contents
| • | unanticipated costs, expenses or third-party claims; |
| • | the risk that results may be affected by construction delays, cost overruns, technical difficulties, nonperformance by contractors or changes in capital improvement project requirements or specifications; |
| • | interest rate, chemical and energy cost volatility; |
| • | changes in returns on pension plan assets and/or assumptions used for determining employee benefit expense and obligations; |
| • | other unforeseen developments in the industries in which Penford operates; |
| • | the Company’s ability to successfully operate under and comply with the terms of its bank credit agreement, as amended; and |
| • | other factors described in Part I, Item 1A “Risk Factors.” |
| Item 7A: | Quantitative and Qualitative Disclosures about Market Risk |
Market Risk Sensitive Instruments and Positions
Penford is exposed to market risks that are inherent in the financial instruments that are used in the normal course of business. Penford may use various hedge instruments to manage or reduce market risk, but the Company does not use derivative financial instrument transactions for speculative purposes. The primary market risks are discussed below.
Interest Rate Risk
The Company’s exposure to market risk for changes in interest rates relates to its variable-rate borrowings. As of August 31, 2014, all of the Company’s outstanding bank debt is subject to variable interest rates, which are generally set for one or three months. The market risk associated with a 100-basis point adverse change in interest rates at August 31, 2014 was approximately $0.8 million.
Commodity Risk
The availability and price of corn, Penford’s most significant raw material, is subject to fluctuations due to unpredictable factors such as weather, plantings, domestic and foreign governmental farm programs and policies, changes in global demand and the worldwide production of corn. To reduce the price risk caused by market fluctuations, Penford generally follows a policy of using exchange-traded futures to hedge exposure to corn price fluctuations in North America. These futures contracts were designated for accounting purposes as hedging instruments through July 31, 2014. Effective August 1, 2014, the Company discontinued hedge accounting treatment for corn futures contracts as the hedging relationship no longer met the requirements for hedge accounting. See Note 13 to the Consolidated Financial Statements. A majority of the Company’s sales contracts for corn-based industrial starch ingredients contain a pricing methodology, which allows the Company to pass-through the majority of the changes in the commodity price of net corn.
Penford’s net corn position in the U.S. consists primarily of inventories, purchase contracts and exchange-traded futures contracts that hedge Penford’s exposure to commodity price fluctuations. The fair value of the position is based on quoted market prices. The Company has estimated its market risk as the potential loss in fair value resulting from a hypothetical 10% adverse change in prices. The fair value of the Company’s net corn position at August 31, 2014 and 2013 was approximately $2.1 million and $2.4 million, respectively. The market risk associated with a 10% adverse change in corn prices at August 31, 2014 and 2013 was approximately $213,000 and $240,000, respectively.
36
Table of Contents
Selling prices for ethanol fluctuate based on the availability and price of manufacturing inputs and the status of various government regulations and tax incentives. To reduce the risk of the price variability of ethanol, Penford enters into exchange-traded futures contracts to hedge exposure to ethanol price fluctuations. These futures contracts have been designated as hedging instruments.
Penford’s exchange-traded futures contracts hedge the forecasted sales of ethanol. The fair value of these contracts is based on quoted market prices. The Company has estimated its market risk as the potential loss in fair value resulting from a hypothetical 10% adverse change in prices. As of August 31, 2014 and 2013, the fair value of the ethanol exchange-traded futures contracts was a loss of $1.1 million and $1.0 million, respectively. The market risk associated with a 10% change in ethanol prices was estimated at $110,000 and $100,000 at August 31, 2014 and 2013, respectively.
37
Table of Contents
| Item 8: | Financial Statements and Supplementary Data |
| Page | ||||
| 39 | ||||
| 40 | ||||
| 41 | ||||
| 42 | ||||
| 43 | ||||
| 44 | ||||
| 76 | ||||
38
Table of Contents
PENFORD CORPORATION
| August 31, | ||||||||
| 2014 | 2013 | |||||||
| (In thousands, except per share data) | ||||||||
| Assets | ||||||||
| Current assets: |
||||||||
| Cash and cash equivalents |
$ | 189 | $ | 221 | ||||
| Trade accounts receivable, net |
42,035 | 43,432 | ||||||
| Inventories |
41,751 | 33,992 | ||||||
| Prepaid expenses |
3,857 | 3,100 | ||||||
| Material and supplies |
5,541 | 4,634 | ||||||
| Other |
5,071 | 4,735 | ||||||
|
|
|
|
|
|||||
| Total current assets |
98,444 | 90,114 | ||||||
| Property, plant and equipment, net |
114,804 | 112,141 | ||||||
| Restricted cash value of life insurance |
7,803 | 7,837 | ||||||
| Deferred tax assets |
— | 4,987 | ||||||
| Other assets |
1,991 | 1,248 | ||||||
| Other intangible assets, net |
6,019 | 313 | ||||||
| Goodwill, net |
10,129 | 7,978 | ||||||
|
|
|
|
|
|||||
| Total assets |
$ | 239,190 | $ | 224,618 | ||||
|
|
|
|
|
|||||
| Liabilities and Shareholders’ Equity | ||||||||
| Current liabilities: |
||||||||
| Cash overdraft, net |
$ | 6,146 | $ | 5,072 | ||||
| Current portion of long-term debt and capital lease obligations |
184 | 231 | ||||||
| Accounts payable |
21,452 | 20,656 | ||||||
| Short-term financing arrangements |
1,454 | 1,474 | ||||||
| Accrued liabilities |
9,779 | 8,207 | ||||||
|
|
|
|
|
|||||
| Total current liabilities |
39,015 | 35,640 | ||||||
| Long-term debt and capital lease obligations |
76,665 | 72,739 | ||||||
| Other postretirement benefits |
18,726 | 16,596 | ||||||
| Pension benefit liability |
5,752 | 10,552 | ||||||
| Other liabilities |
6,899 | 6,198 | ||||||
|
|
|
|
|
|||||
| Total liabilities |
147,057 | 141,725 | ||||||
|
|
|
|
|
|||||
| Commitments and contingencies |
||||||||
| Shareholders’ equity: |
||||||||
| Common stock, par value $1.00 per share, authorized 29,000 shares, issued 14,717 shares in 2014 and 14,479 shares in 2013, including treasury shares |
14,544 | 14,454 | ||||||
| Additional paid-in capital |
106,696 | 105,166 | ||||||
| Retained earnings |
11,402 | 3,649 | ||||||
| Treasury stock, at cost, 1,981 shares |
(32,757 | ) | (32,757 | ) | ||||
| Accumulated other comprehensive loss |
(7,752 | ) | (7,619 | ) | ||||
|
|
|
|
|
|||||
| Total shareholders’ equity |
92,133 | 82,893 | ||||||
|
|
|
|
|
|||||
| Total liabilities and shareholders’ equity |
$ | 239,190 | $ | 224,618 | ||||
|
|
|
|
|
|||||
The accompanying notes are an integral part of these statements.
39
Table of Contents
PENFORD CORPORATION
Consolidated Statements of Operations
| Year Ended August 31, | ||||||||||||
| 2014 | 2013 | 2012 | ||||||||||
| (Dollars in thousands, except share and per share data) |
||||||||||||
| Sales |
$ | 443,873 | $ | 467,250 | $ | 433,151 | ||||||
| Cost of sales |
389,566 | 422,203 | 389,241 | |||||||||
|
|
|
|
|
|
|
|||||||
| Gross margin |
54,307 | 45,047 | 43,910 | |||||||||
| Operating expenses |
33,407 | 29,773 | 28,013 | |||||||||
| Research and development expenses |
5,609 | 5,870 | 5,838 | |||||||||
|
|
|
|
|
|
|
|||||||
| Income from operations |
15,291 | 9,404 | 10,059 | |||||||||
| Interest expense |
(3,583 | ) | (3,989 | ) | (8,633 | ) | ||||||
| Other non-operating income (expense), net |
766 | 75 | (6,186 | ) | ||||||||
|
|
|
|
|
|
|
|||||||
| Income (loss) before income taxes |
12,474 | 5,490 | (4,760 | ) | ||||||||
| Income tax expense |
4,721 | 1,483 | 4,806 | |||||||||
|
|
|
|
|
|
|
|||||||
| Net income (loss) |
$ | 7,753 | $ | 4,007 | $ | (9,566 | ) | |||||
|
|
|
|
|
|
|
|||||||
| Weighted-average common shares and equivalents outstanding: |
||||||||||||
| Basic |
12,514,869 | 12,369,487 | 12,293,749 | |||||||||
| Diluted |
12,857,580 | 12,618,158 | 12,293,749 | |||||||||
| Earnings (loss) per common share: |
||||||||||||
| Basic |
$ | 0.62 | $ | 0.32 | $ | (0.78 | ) | |||||
| Diluted |
$ | 0.60 | $ | 0.32 | $ | (0.78 | ) | |||||
| Dividends declared per common share |
$ | — | $ | — | $ | — | ||||||
The accompanying notes are an integral part of these statements.
40
Table of Contents
PENFORD CORPORATION
Consolidated Statements of Comprehensive Income (Loss)
| Year Ended August 31, | ||||||||||||
| 2014 | 2013 | 2012 | ||||||||||
| (Dollars in thousands) | ||||||||||||
| Net income (loss) |
$ | 7,753 | $ | 4,007 | $ | (9,566 | ) | |||||
|
|
|
|
|
|
|
|||||||
| Other comprehensive income (loss): |
||||||||||||
| Change in fair value of derivatives, net of tax benefit (expense) of $5,409, $(457) and $(1,419) |
(8,676 | ) | 747 | 2,315 | ||||||||
| Loss (gain) from derivative transactions reclassified into earnings from other comprehensive income, net of tax benefit (expense) of $4,682, $(1,987) and $(863) |
7,510 | (3,241 | ) | (1,408 | ) | |||||||
| Actuarial gain (loss) on postretirement liabilities, net of tax benefit (expense) of $(478), $(5,547) and $5,722 |
767 | 9,049 | (9,336 | ) | ||||||||
| Loss from postretirement liabilities reclassified to earnings, net of tax benefit of $166, $869 and $242 |
266 | 1,419 | 395 | |||||||||
|
|
|
|
|
|
|
|||||||
| Other comprehensive income (loss) |
(133 | ) | 7,974 | (8,034 | ) | |||||||
|
|
|
|
|
|
|
|||||||
| Total comprehensive income (loss) |
$ | 7,620 | $ | 11,981 | $ | (17,600 | ) | |||||
|
|
|
|
|
|
|
|||||||
The accompanying notes are an integral part of these statements.
41
Table of Contents
PENFORD CORPORATION
Consolidated Statements of Cash Flows
| Year Ended August 31, | ||||||||||||
| 2014 | 2013 | 2012 | ||||||||||
| (Dollars in thousands) | ||||||||||||
| Operating activities: |
||||||||||||
| Net income (loss) |
$ | 7,753 | $ | 4,007 | $ | (9,566 | ) | |||||
| Adjustments to reconcile net income (loss) to net cash provided by operations: |
||||||||||||
| Depreciation and amortization |
11,814 | 13,326 | 14,127 | |||||||||
| Loss on redemption of Series A Preferred Stock |
— | — | 6,599 | |||||||||
| Stock-based compensation |
1,344 | 1,404 | 1,387 | |||||||||
| Loss on sale and disposal of assets |
103 | 22 | 26 | |||||||||
| Loss on early extinguishment of debt |
265 | — | — | |||||||||
| Deferred income tax expense |
4,713 | 1,825 | 4,965 | |||||||||
| Non-cash change in asset retirement obligations |
(304 | ) | — | — | ||||||||
| Non-cash loss (gain) on hedging transactions |
733 | 3,543 | (176 | ) | ||||||||
| Non-cash gain on loan forgiveness |
(1,000 | ) | — | — | ||||||||
| Excess tax benefit from stock-based compensation |
(152 | ) | (16 | ) | — | |||||||
| Other |
— | — | 20 | |||||||||
| Change in operating assets and liabilities: |
||||||||||||
| Trade accounts receivable, net |
2,601 | (7,063 | ) | (4,450 | ) | |||||||
| Other receivables |
(118 | ) | 2,554 | (744 | ) | |||||||
| Inventories |
(6,390 | ) | 6,137 | (6,460 | ) | |||||||
| Decrease (increase) in margin accounts |
(1,388 | ) | (5,088 | ) | 2,285 | |||||||
| Prepaid expenses |
(718 | ) | (274 | ) | (536 | ) | ||||||
| Accounts payable and accrued liabilities |
694 | 1,808 | 2,105 | |||||||||
| Pension and other postretirement benefit contributions |
(3,257 | ) | (1,687 | ) | (4,574 | ) | ||||||
| Pension and other postretirement benefit plan costs |
2,276 | 5,107 | 3,386 | |||||||||
| Payment of interest on Series A Preferred Stock, net |
— | — | (5,311 | ) | ||||||||
| Other |
(915 | ) | (956 | ) | (523 | ) | ||||||
|
|
|
|
|
|
|
|||||||
| Net cash flow provided by operating activities |
18,054 | 24,649 | 2,560 | |||||||||
|
|
|
|
|
|
|
|||||||
| Investing activities: |
||||||||||||
| Acquisitions of property, plant and equipment |
(12,994 | ) | (14,199 | ) | (14,146 | ) | ||||||
| Acquisition of Gum Technology |
(9,086 | ) | — | — | ||||||||
| Acquisition of Carolina Starches, net of cash acquired |
— | — | (8,347 | ) | ||||||||
| Settlement of ethanol construction claim |
— | 2,106 | — | |||||||||
| Other |
(245 | ) | 31 | 75 | ||||||||
|
|
|
|
|
|
|
|||||||
| Net cash used in investing activities |
(22,325 | ) | (12,062 | ) | (22,418 | ) | ||||||
|
|
|
|
|
|
|
|||||||
| Financing activities: |
||||||||||||
| Proceeds from revolving line of credit |
29,150 | 22,200 | 88,706 | |||||||||
| Payments on revolving line of credit |
(24,656 | ) | (33,300 | ) | (28,200 | ) | ||||||
| Payments on long-term debt |
(367 | ) | (200 | ) | (200 | ) | ||||||
| Redemption of Series A Preferred Stock |
— | — | (40,000 | ) | ||||||||
| Payments on capital lease obligations |
(160 | ) | (280 | ) | (249 | ) | ||||||
| Payment of loan fees |
(1,210 | ) | — | (973 | ) | |||||||
| Proceeds from financing arrangements |
1,992 | 2,019 | 2,255 | |||||||||
| Payments on financing arrangements |
(2,012 | ) | (1,438 | ) | (2,050 | ) | ||||||
| Exercise of stock options |
276 | 730 | — | |||||||||
| Excess tax benefit from stock-based compensation |
152 | 16 | — | |||||||||
| Increase (decrease) in cash overdraft |
1,074 | (2,265 | ) | 434 | ||||||||
| Other |
— | (2 | ) | 8 | ||||||||
|
|
|
|
|
|
|
|||||||
| Net cash provided by (used in) financing activities |
4,239 | (12,520 | ) | 19,731 | ||||||||
|
|
|
|
|
|
|
|||||||
| Increase (decrease) in cash and cash equivalents |
(32 | ) | 67 | (127 | ) | |||||||
| Cash and cash equivalents, beginning of year |
221 | 154 | 281 | |||||||||
|
|
|
|
|
|
|
|||||||
| Cash and cash equivalents, end of year |
$ | 189 | $ | 221 | $ | 154 | ||||||
|
|
|
|
|
|
|
|||||||
| Supplemental disclosure of cash flow information: |
||||||||||||
| Cash paid during the year for: |
||||||||||||
| Interest |
$ | 3,075 | $ | 3,623 | $ | 12,481 | ||||||
| Income taxes paid, net |
$ | 185 | $ | 125 | $ | 260 | ||||||
| Noncash investing and financing activities: |
||||||||||||
| Capital lease obligations incurred for certain equipment leases |
$ | 779 | $ | 88 | $ | 152 | ||||||
The accompanying notes are an integral part of these statements.
42
Table of Contents
PENFORD CORPORATION
Consolidated Statements of Shareholders’ Equity
| Year Ended August 31, | ||||||||||||
| 2014 | 2013 | 2012 | ||||||||||
| (Dollars in thousands) | ||||||||||||
| Common stock |
||||||||||||
| Balance, beginning of year |
$ | 14,454 | $ | 14,281 | $ | 13,243 | ||||||
| Series B preferred stock converted to common shares |
— | — | 1,000 | |||||||||
| Exercise of stock options |
65 | 121 | — | |||||||||
| Issuance of restricted stock, net |
25 | 52 | 38 | |||||||||
|
|
|
|
|
|
|
|||||||
| Balance, end of year |
14,544 | 14,454 | 14,281 | |||||||||
|
|
|
|
|
|
|
|||||||
| Preferred stock |
||||||||||||
| Balance, beginning of year |
— | — | 100 | |||||||||
| Series B preferred stock converted to common shares |
— | — | (100 | ) | ||||||||
|
|
|
|
|
|
|
|||||||
| Balance, end of year |
— | — | — | |||||||||
|
|
|
|
|
|
|
|||||||
| Additional paid-in capital |
||||||||||||
| Balance, beginning of year |
105,166 | 103,205 | 103,070 | |||||||||
| Tax deficiency on stock options and awards |
— | — | (314 | ) | ||||||||
| Stock-based compensation |
1,344 | 1,404 | 1,387 | |||||||||
| Exercise of stock options |
211 | 609 | — | |||||||||
| Issuance of restricted stock, net |
(25 | ) | (52 | ) | (38 | ) | ||||||
| Series B preferred stock converted to common shares |
— | — | (900 | ) | ||||||||
|
|
|
|
|
|
|
|||||||
| Balance, end of year |
106,696 | 105,166 | 103,205 | |||||||||
|
|
|
|
|
|
|
|||||||
| Retained earnings (deficit) |
||||||||||||
| Balance, beginning of year |
3,649 | (286 | ) | 9,368 | ||||||||
| Net income (loss) |
7,753 | 4,007 | (9,566 | ) | ||||||||
| Other |
— | (72 | ) | (88 | ) | |||||||
|
|
|
|
|
|
|
|||||||
| Balance, end of year |
11,402 | 3,649 | (286 | ) | ||||||||
|
|
|
|
|
|
|
|||||||
| Treasury stock |
(32,757 | ) | (32,757 | ) | (32,757 | ) | ||||||
|
|
|
|
|
|
|
|||||||
| Accumulated other comprehensive income (loss): |
||||||||||||
| Balance, beginning of year |
(7,619 | ) | (15,593 | ) | (7,559 | ) | ||||||
| Change in fair value of derivatives, net of tax |
(8,676 | ) | 747 | 2,315 | ||||||||
| Loss (gain) from derivative transactions reclassified into earnings from other comprehensive income, net of tax |
7,510 | (3,241 | ) | (1,408 | ) | |||||||
| Net (increase) decrease in postretirement liabilities, net of tax |
1,033 | 10,468 | (8,941 | ) | ||||||||
|
|
|
|
|
|
|
|||||||
| Balance, end of year |
(7,752 | ) | (7,619 | ) | (15,593 | ) | ||||||
|
|
|
|
|
|
|
|||||||
| Total shareholders’ equity |
$ | 92,133 | $ | 82,893 | $ | 68,850 | ||||||
|
|
|
|
|
|
|
|||||||
The accompanying notes are an integral part of these statements.
43
Table of Contents
Notes to Consolidated Financial Statements
Note 1 – Business
Penford Corporation (which, together with its subsidiary companies, is referred to herein as “Penford” or the “Company”) is a developer, manufacturer and marketer of specialty natural-based ingredient systems for food and industrial applications, including fuel grade ethanol. Penford’s products provide convenient and cost-effective solutions derived from renewable sources. Sales of the Company’s products are generated using a combination of direct sales and distributor agreements.
The Company has significant research and development capabilities, which are used in applying the complex chemistry of carbohydrate-based materials and in developing applications to address customer needs. In addition, the Company has specialty processing capabilities for a variety of modified starches.
Penford manages its business in two segments: Industrial Ingredients and Food Ingredients. These segments are based on broad categories of end-market users. The Food Ingredients segment produces specialty starches and gums for food applications. The Industrial Ingredients segment is a supplier of specialty starches to the paper, packaging and other industries, and is a producer of fuel grade ethanol. The Industrial Ingredients segment also sells the by-products from its corn wet milling manufacturing operations, primarily germ, fiber and gluten to customers who use these by-products as animal feed or to produce corn oil.
In January 2012, the Company completed the acquisition of the businesses operated by Carolina Starches, LLC and related entities (“Carolina Starches”) for $8.5 million in cash. Carolina Starches manufactures and markets cationic starches produced from potato, corn and tapioca. The acquisition of these businesses has provided an important source of raw material to support continued growth in the Food Ingredients business and has broadened the Company’s portfolio of specialty modified industrial starches. See Note 17.
In March 2014, the Company completed the acquisition of Gum Technology, an Arizona close corporation (“Gum Technology”), for a purchase price of $9.9 million, subject to certain adjustments. Gum Technology blends and distributes gums and hydrocolloids and customizes stabilizers to meet customers’ product formulation needs. The acquisition of this business will broaden the Company’s Food Ingredients portfolio of functional and specialty ingredient systems within its Food Ingredients segment. See Note 17.
On October 14, 2014, the Company and Ingredion Incorporated (“Ingredion”) entered into an Agreement and Plan of Merger (the “Merger Agreement”) pursuant to which Ingredion will acquire the Company in an all-cash transaction valued at approximately $340.0 million. Upon closing of the merger, each outstanding share of the Company’s common stock will be converted into the right to receive $19.00 in cash. The merger is subject to certain closing conditions and covenants and provides certain termination rights for the parties to the Merger Agreement. See Note 21.
Note 2 – Summary of Significant Accounting Policies
Basis of Presentation
The accompanying consolidated financial statements include the accounts of Penford and its wholly owned subsidiaries. All material intercompany balances and transactions have been eliminated. Transactions between segments are at cost plus a return on assets. Certain reclassifications have been made to prior years’ financial statements in order to conform to the current year presentation.
Use of Estimates
The preparation of financial statements in conformity with accounting principles generally accepted in the United States of America requires management to make estimates and assumptions that affect the reported
44
Table of Contents
amounts of assets and liabilities at the date of the financial statements, and the reported amounts of revenues and expenses during the reporting period. Estimates are used in accounting for, among other things, the allowance for doubtful accounts; the determination of potential write downs for lower-of-cost-or-market inventory evaluations; the reserve for obsolete inventory; accruals; legal contingencies; the determination of fair value of net assets acquired in a business combination; the determination of assumptions for pension and postretirement employee benefit costs; useful lives of property, plant and equipment; the assessment of a potential impairment of goodwill, indefinite-lived intangible assets or long-lived assets; and income taxes, including the determination of a need for a valuation allowance for deferred tax assets. Actual results may differ from previously estimated amounts.
Change in Estimate
During the third quarter of fiscal year 2014, the Company changed its estimates of useful lives of certain machinery and equipment used by the Industrial Ingredients segment to better match depreciation expense of these assets with the periods in which these assets are expected to generate revenue. The new estimated useful lives were established based on manufacturing engineering data and external benchmark data and were generally increased as compared to the previous estimates. The Company accounted for this as a prospective change in accounting estimate as of May 1, 2014, thereby impacting the quarter in which the change occurred and future periods. The change in the estimate lowered depreciation expense as compared to the amount that would have been recorded using the historical estimated useful lives. The effect of this change on net income and diluted earnings per share for the year ended August 31, 2014 was $899,000 and $0.07 per share, respectively.
Cash and Cash Equivalents
Cash and cash equivalents consist of cash and temporary investments with maturities of less than three months when purchased. Amounts are reported in the balance sheets at cost, which approximates fair value.
Cash Overdrafts
Cash overdrafts represent the amount by which outstanding checks issued, but not yet presented to banks for disbursement, exceed balances on deposit in the applicable bank accounts. The changes in cash overdrafts are included as a component of cash flows from financing activities in the consolidated statements of cash flows.
Allowance for Doubtful Accounts
The Company records accounts receivable at net realizable value, which includes an allowance for doubtful accounts to reflect any loss anticipated on the accounts receivable balances. The allowance for doubtful accounts reflects the Company’s best estimate of probable losses in the accounts receivable balances. Penford estimates the allowance for uncollectible accounts based on historical experience, known troubled accounts, industry trends, economic conditions, how recently payments have been received and ongoing credit evaluations of its customers. Activity in the allowance for doubtful accounts for fiscal 2014, 2013 and 2012 was as follows (dollars in thousands):
| Balance Beginning of Year |
Charged to Costs and Expenses |
Deductions and Other |
Balance End of Year |
|||||||||||||
| Year ended August 31: |
||||||||||||||||
| 2014 |
$ | 280 | $ | 115 | $ | (100 | ) | $ | 295 | |||||||
| 2013 |
$ | 78 | $ | 241 | $ | (39 | ) | $ | 280 | |||||||
| 2012 |
$ | 1,305 | $ | (42 | ) | $ | (1,185 | ) | $ | 78 | ||||||
In fiscal 2012, accounts receivable due from two paper industry customers were written off when they were deemed uncollectible.
45
Table of Contents
Concentrations of Risk
Approximately 36%, 38% and 36% of the Company’s sales in fiscal 2014, 2013 and 2012, respectively, were made to customers who operate in the paper and packaging industries. These industries suffered an economic downturn, which has resulted in the closure of a number of mills.
The Company has several relatively large customers in each business segment. The Company’s sales of ethanol to its sole ethanol customer, Eco-Energy, Inc., represented approximately 22%, 21% and 24% of the Company’s net sales for fiscal years 2014, 2013 and 2012, respectively. Eco-Energy, Inc., a marketer and distributor of biofuels in the United States and Canada, is a customer of the Company’s Industrial Ingredients business.
At August 31, 2014, Penford had 443 employees, of which approximately 34% were members of a trade union. The collective bargaining agreement covering the Cedar Rapids-based manufacturing workforce expires in August 2015. The Company is currently engaged in labor contract negotiations with a new bargaining unit consisting of approximately 15 operating employees at its Richland, WA plant.
Inventories
Inventories are stated at the lower of cost or net realizable value. Costs of agricultural raw materials are generally stated at weighted-average cost. Costs of other raw materials and finished goods are determined using actual costs on a first-in first-out method. Costs for materials and supplies, which constitute spare parts for the Company’s property, plant and equipment, are stated at weighted-average cost. Capitalized costs include materials, labor and manufacturing overhead related to the purchase and production of inventories.
Property, Plant and Equipment
The Company’s property consists primarily of plants and equipment used for manufacturing activities. Property, plant and equipment are recorded at cost less accumulated depreciation. Expenditures for maintenance and repairs are expensed as incurred. The Company uses the straight-line method to compute depreciation expense over the estimated useful lives of the depreciable assets. Equipment and vehicles generally have average useful lives ranging from three to thirty years and real estate between twelve to forty-six years. Depreciation, which includes depreciation of assets under capital leases, of $11.2 million, $12.8 million and $12.7 million was recorded in fiscal years 2014, 2013 and 2012, respectively. For income tax purposes, the Company generally uses accelerated depreciation methods.
Interest is capitalized on major construction projects while in progress. During fiscal years 2014, 2013 and 2012, the Company capitalized $2,000, $107,000 and $48,000, respectively, in interest costs.
The Company reviews its long-lived assets for impairment whenever events or changes in circumstances indicate that the carrying amount of an asset may not be recoverable. Impairment is recognized when estimated expected undiscounted future cash flows are less than the carrying amount of the assets. To the extent that impairment has occurred, the excess of the carrying amount of long-lived assets over its estimated fair value would be recognized as an impairment loss charged to earnings. No impairment charges were recorded in fiscal years 2014, 2013 or 2012.
Goodwill and Other Intangible Assets
Goodwill represents the excess of cost over the fair value of net assets acquired. The Company evaluates its goodwill for impairment annually as of June 1 and whenever events or circumstances make it more likely than not that impairment may have occurred. To determine whether goodwill is impaired, Penford compares the fair value of each reporting unit to that reporting unit’s carrying amount. If the fair value of the reporting unit is greater than its carrying amount goodwill is not considered impaired. If the fair value of the reporting unit is
46
Table of Contents
lower than its carrying amount, Penford then compares the implied fair value of the reporting unit’s goodwill with the carrying amount of that goodwill, and, if the carrying value is higher than the fair value, an impairment charge would be recorded. The implied fair value of a reporting unit is determined using a discounted cash flow method considering the Company’s market capitalization. No goodwill impairment charges were recorded in fiscal years 2014, 2013 or 2012.
Indefinite-lived assets consist of trade names and brands acquired in the acquisition of Gum Technology discussed in Note 17. These assets are tested annually for impairment as of June 1. Definite-lived intangible assets are amortized using the straight-line method over their expected economic useful lives.
Accrued Liabilities
Components of accrued liabilities were as follows (dollars in thousands):
| August 31, | ||||||||
| 2014 | 2013 | |||||||
| Employee-related costs |
$ | 5,271 | $ | 3,931 | ||||
| Other |
4,508 | 4,276 | ||||||
|
|
|
|
|
|||||
| Accrued liabilities |
$ | 9,779 | $ | 8,207 | ||||
|
|
|
|
|
|||||
Employee-related costs included accrued payroll, compensated absences, payroll taxes, benefits and incentives.
Revenue Recognition
Revenue from sales of products and shipping and handling revenue are recognized at the time title to the goods transfers to the customer. This transfer is considered complete when a sales agreement is in place, delivery has occurred, pricing is fixed or determinable and collection is reasonably assured. Proceeds from the sale of by-products from the Company’s corn wet milling operations are classified as sales in the Statements of Operations. Costs associated with shipping and handling are included in cost of sales.
Export Sales
Export sales accounted for approximately 8.0%, 8.0% and 7.6% of consolidated sales in fiscal years ended August 31, 2014, 2013 and 2012, respectively.
Derivatives
Penford uses derivative instruments to manage the exposures associated with commodity prices, interest rates and energy costs. The derivative instruments are reported at fair value in other current assets or current liabilities in the Consolidated Balance Sheets. The Company offsets the fair value amounts recognized for the right to reclaim cash collateral or the obligation to return cash collateral arising from derivative instruments recognized at fair value executed with the same counterparty under a master netting arrangement.
For derivative instruments designated and qualifying as fair value hedges, the gain or loss on the derivative instruments, as well as the offsetting gain or loss on the hedged firm commitments or inventory, are recognized in current earnings as a component of cost of sales. For derivative instruments designated and qualifying as cash flow hedges, the effective portion of the gain or loss on the derivative instruments is reported as a component of other comprehensive income (loss), net of applicable income taxes, and recognized in earnings when the hedged exposure affects earnings. The Company recognizes the gain or loss on the derivative instrument as a component of cost of goods sold in the period when the finished goods produced from the hedged item are sold or, for
47
Table of Contents
interest rate swaps, as a component of interest expense in the period the forecasted transaction is reported in earnings. If it is determined that the derivative instruments used are no longer effective at offsetting changes in cash flows or fair value of the hedged item, then the changes in fair value would be recognized in current earnings as a component of cost of sales or interest expense.
Research and Development
Research and development costs are expensed as incurred, except for costs of patents, which are capitalized and amortized over the lives of the patents. The Company’s research and development expenditures primarily consists of internal salaries, wages, consulting and supplies attributable to time spent on research and development activities. Other costs include depreciation and maintenance of research and development facilities and equipment, including assets at manufacturing locations that are engaged in pilot plant activities. Research and development costs expensed were $5.6 million, $5.9 million and $5.8 million in fiscal 2014, 2013 and 2012, respectively.
Stock-Based Compensation
The Company has a long-term incentive plan that provides for stock-based compensation, including the granting of stock options and shares of restricted stock to employees and directors. The Company utilizes the Black-Scholes option-pricing model to determine the fair value of stock options on the date of grant. This model derives the fair value of stock options based on certain assumptions related to expected stock price volatility, expected option life, risk-free interest rate and dividend yield. The grant-date fair value of restricted stock awards is equal to the market price of the Company’s common stock at the grant date.
The Company recognizes stock-based compensation expense utilizing the accelerated multiple options approach over the requisite service period, which equals the vesting period. See Note 10 for further detail. Shares issued pursuant to stock-based compensation agreements are issued from authorized but unissued shares.
Income Taxes
The provision for income taxes includes federal and state taxes currently payable and deferred income taxes arising from temporary differences between the financial statement carrying amounts of existing assets and liabilities and their respective tax bases. Deferred tax assets and liabilities are measured pursuant to tax laws using the rates expected to apply to taxable income in the years in which those temporary differences are expected to be recovered or settled. The impact on deferred tax assets and liabilities of a change in tax rates is recognized in income in the period that includes the date of enactment.
A valuation allowance is provided to the extent that it is more likely than not that deferred tax assets will not be realized. Tax benefits from uncertain tax positions are recognized when it is more likely than not that the position will be sustained upon examination based on the technical merits of the position. The amount recognized is measured as the largest amount of tax benefit that has a greater than 50% likelihood of being realized upon settlement. The Company recognizes interest and penalty expense associated with uncertain tax positions as a component of income tax expense.
Foreign Currency
Assets and liabilities of subsidiaries whose functional currency is deemed to be other than the U.S. dollar are translated at year end rates of exchange. Resulting translation adjustments are accumulated in the currency translation adjustments component of other comprehensive income. Statement of operations amounts are translated at average exchange rates prevailing during the year. Foreign currency transaction gains or losses in fiscal years 2014, 2013 and 2012 were not significant.
48
Table of Contents
Acquisitions
Acquisitions of businesses are accounted for using the acquisition method of accounting, and the financial statements include the results of the acquired operations from the date of acquisition. The purchase price of the acquired entity is allocated to the net assets acquired and net liabilities assumed based on the estimated fair value at the date of acquisition. The excess of cost over the fair value of the net assets acquired is recognized as goodwill.
Accounting Pronouncements Adopted
In February 2013, the Financial Accounting Standards Board (“FASB”) issued guidance requiring entities to provide information about the amounts reclassified out of accumulated other comprehensive income by component. Entities are required to present, either on the face of the financial statements or in the notes, significant amounts reclassified out of accumulated other comprehensive income by the respective line items of net income. This guidance did not change the current requirements for reporting net income or other comprehensive income. The Company adopted this guidance effective September 1, 2013, and the required disclosure is presented in Note 8.
In December 2011, the FASB issued guidance creating new disclosure requirements about the nature of an entity’s rights of setoff and related arrangements associated with its financial instruments and derivative instruments. The Company adopted this guidance effective September 1, 2013, and the required disclosure is presented in Note 13.
In July 2013, the FASB issued guidance designed to reduce diversity in practice of financial statement presentation of an unrecognized tax benefit when a net operating loss carryforward, a similar tax loss or a tax credit carryforward exists. The Company adopted this accounting presentation effective September 1, 2013. The Company complied with the prescribed accounting presentation in prior periods; therefore, the adoption of this guidance had no impact on the presentation of the Company’s consolidated financial statements.
Recent Accounting Pronouncements
On May 28, 2014, the FASB issued guidance that requires an entity to recognize the amount of revenue to which it expects to be entitled for the transfer of promised goods or services to customers. The guidance will replace most existing revenue recognition guidance when it becomes effective. The new standard is effective for the Company on September 1, 2017, and early application is not permitted. The standard permits the use of either the retrospective or cumulative effect transition method. The Company is evaluating the effect that this new guidance will have on its consolidated financial statements and related disclosures. The Company has not selected a transition method nor has it determined the effect of the standard on its ongoing financial reporting.
Note 3 – Inventories
Components of inventory were as follows:
| August 31, | ||||||||
| 2014 | 2013 | |||||||
| (Dollars in thousands) | ||||||||
| Raw materials |
$ | 10,069 | $ | 10,381 | ||||
| Work in progress |
1,322 | 1,913 | ||||||
| Finished goods |
30,360 | 21,698 | ||||||
|
|
|
|
|
|||||
| Total inventories |
$ | 41,751 | $ | 33,992 | ||||
|
|
|
|
|
|||||
To reduce the price volatility of corn used in fulfilling some of its starch sales contracts, Penford, from time to time, uses readily marketable exchange-traded futures as well as forward cash corn purchases. The exchange-traded futures are not purchased or sold for trading or speculative purposes and, when the futures contracts qualify for hedge accounting, they are designated as hedges. See Note 13. General and administrative expenses are not capitalized as a component of inventory.
49
Table of Contents
Note 4 – Property, Plant and Equipment, Net
Components of property, plant and equipment were as follows:
| August 31, | ||||||||
| 2014 | 2013 | |||||||
| (Dollars in thousands) | ||||||||
| Land and land improvements |
$ | 12,512 | $ | 11,881 | ||||
| Plant and equipment |
369,224 | 359,909 | ||||||
| Construction in progress |
7,603 | 5,255 | ||||||
|
|
|
|
|
|||||
| 389,339 | 377,045 | |||||||
| Accumulated depreciation |
(274,535 | ) | (264,904 | ) | ||||
|
|
|
|
|
|||||
| Property, plant and equipment, net |
$ | 114,804 | $ | 112,141 | ||||
|
|
|
|
|
|||||
The above table included approximately $1.3 million and $0.8 million of net property, plant and equipment under capital leases for fiscal years 2014 and 2013, respectively. At August 31, 2014 and 2013, the Company had approximately $0.9 million and $0.7 million, respectively, of payables related to property, plant and equipment.
Note 5 – Goodwill and Other Intangible Assets
The Company’s goodwill of $10.1 million and $8.0 million at August 31, 2014 and 2013, respectively, relates to the Company’s Food Ingredients reporting unit. See Note 17 for goodwill added in fiscal 2014 as a result of the acquisition of the net assets of Gum Technology. The Company completed its evaluation of the carrying value of goodwill as of June 1, 2014 and determined there was no impairment to the recorded value of goodwill. In order to identify potential impairments, Penford compared the fair value of its Food Ingredients reporting unit with its carrying amount, including goodwill. Penford then compared the implied fair value of goodwill with the carrying amount of that goodwill. The implied fair value of the reporting unit was determined using the discounted cash flow method, the implied market capitalization method and the guideline company method. The implied fair value of the reporting unit was computed using unobservable inputs, and the fair value measurements are categorized as Level 3 in the fair value hierarchy. Since there was no indication of impairment, Penford was not required to complete the second step of the process, which would measure the amount of any impairment. At June 1, 2014, the fair value of the Food Ingredients reporting unit was substantially in excess of its carrying value, and there are no changes in that conclusion as of August 31, 2014. There were no goodwill impairment losses at August 31, 2014 and 2013.
| Year Ended August 31, | ||||||||
| 2014 | 2013 | |||||||
| (Dollars in thousands) | ||||||||
| Goodwill, beginning of year |
$ | 7,978 | $ | 7,978 | ||||
| Acquisition of Gum Technology |
2,151 | — | ||||||
|
|
|
|
|
|||||
| Goodwill, end of year |
$ | 10,129 | $ | 7,978 | ||||
|
|
|
|
|
|||||
50
Table of Contents
Penford’s intangible assets consist of patents, customer lists and relationships, trade names/brand portfolio and non-compete agreements. Patents are being amortized over the weighted-average remaining amortization period of five years as of August 31, 2014. The fair value of customer relationships and non-compete agreements from the acquisition of Gum Technology are being amortized over their estimated useful lives of 13 years and 5 years, respectively. There are no residual values associated with intangible assets subject to amortization. The trade names/brand portfolio of $2.7 million from the acquisition of Gum Technology has an indefinite life and is not subject to amortization. This indefinite-lived asset was tested for impairment as of June 1, 2014, and there was no indication of impairment. There was no change in that conclusion as of August 31, 2014. The carrying amount and accumulated amortization of intangible assets were as follows:
| August 31, 2014 | August 31, 2013 | |||||||||||||||
| Carrying | Accumulated | Carrying | Accumulated | |||||||||||||
| Amount | Amortization | Amount | Amortization | |||||||||||||
| (Dollars in thousands) | ||||||||||||||||
| Intangible assets: |
||||||||||||||||
| Patents and other |
$ | 1,870 | $ | 1,572 | $ | 1,748 | $ | 1,538 | ||||||||
| Customer lists and relationships |
3,060 | 296 | 190 | 154 | ||||||||||||
| Trade names/brand portfolio |
2,910 | 35 | — | — | ||||||||||||
| Non-compete agreements |
190 | 108 | 100 | 33 | ||||||||||||
|
|
|
|
|
|
|
|
|
|||||||||
| Other intangible assets |
$ | 8,030 | $ | 2,011 | $ | 2,038 | $ | 1,725 | ||||||||
|
|
|
|
|
|
|
|
|
|||||||||
Amortization expense related to intangible assets was $0.3 million, $0.1 million and $0.1 million in fiscal years 2014, 2013 and 2012, respectively. The estimated aggregate annual amortization expense for intangibles is $0.3 million for the next five fiscal years, 2015 through 2019.
Note 6 – Debt
| August 31, | ||||||||
| 2014 | 2013 | |||||||
| (Dollars in thousands) | ||||||||
| Secured credit agreements – revolving loans, 3.16% weighted-average interest rate at August 31, 2014 |
$ | 76,000 | $ | 71,506 | ||||
| Iowa Department of Economic Development loans |
— | 1,233 | ||||||
| Capital lease obligations |
849 | 231 | ||||||
|
|
|
|
|
|||||
| 76,849 | 72,970 | |||||||
| Less: current portion of long-term debt and capital lease obligations |
184 | 231 | ||||||
|
|
|
|
|
|||||
| Long-term debt and capital lease obligations |
$ | 76,665 | $ | 72,739 | ||||
|
|
|
|
|
|||||
In July 2012, in connection with the redemption of $40 million of Series A Preferred Stock, the Company refinanced its obligations then outstanding. The Company entered into a $130 million Fourth Amended and Restated Credit Agreement (the “2012 Agreement”) with a group of lenders with Bank of Montreal as Administrative Agent.
On August 1, 2014, the Company refinanced its obligations then outstanding under the 2012 Agreement and entered into a $145 million Credit Agreement (the “2014 Agreement”) with the following banks: Cooperatieve Centrale Raiffeisen-Boerenleenbank B.A., “Rabobank Nederland” New York Branch (“Rabobank”); KeyBank National Association; JPMorgan Chase Bank N.A.; First Midwest Bank; the Private Bank and Trust Company; GreenStone Farm Credit Services, ACA; Branch Banking and Trust Company; AgStar Financial Services PCA and Farm Credit Services of America, PCA. Under the 2014 Agreement, the Company may borrow $145 million in revolving lines of credit. The lenders’ revolving credit loan commitment may be increased under certain conditions. Under the 2014 Agreement, there are no scheduled principal payments prior to maturity on August 1, 2019.
51
Table of Contents
On August 31, 2014, the Company had $76.0 million outstanding under the 2014 Agreement, which is subject to variable interest rates. Interest rates under the 2014 Agreement are based on either a base rate or a eurodollar rate, depending on the Company’s selection of available borrowing options, plus the applicable margin. The applicable margin varies from 1% to 2.5% for base rate loans and from 2% to 3.5% for eurodollar loans, depending on the Company’s Total Leverage Ratio, as defined in the 2014 Agreement.
The 2014 Agreement provides that the Total Leverage Ratio, which is computed as funded debt divided by earnings before interest, taxes, depreciation and amortization (as defined in the 2014 Agreement) shall not exceed 5.00 through August 31, 2015; 4.50 from November 30, 2015 through August 31, 2016; 4.25 from November 30, 2016 through August 31, 2017; and 3.75 thereafter. In addition, the Company must maintain a Fixed Charge Coverage Ratio, as defined in the 2014 Agreement, of not less than 1.25. Beginning in fiscal year 2015, annual capital expenditures are restricted to $25 million. Maximum annual capital expenditures may be increased to $35 million if the Total Leverage Ratio is less than 2.00 for the last two fiscal quarters of the year. To the extent that annual capital expenditures are less than the maximum, the difference between the actual and maximum capital expenditures will be added to the capital expenditures permitted in the immediately succeeding fiscal year. The Company’s obligations under the 2014 Agreement are secured by substantially all of the Company’s assets. The Company was in compliance with the covenants in the 2014 Agreement as of August 31, 2014.
Pursuant to the 2014 Agreement, the Company may declare and pay dividends on its common stock in an amount not to exceed, in any consecutive four quarters, the lesser of $10 million or 50% of Free Cash Flow, as defined. As of August 31, 2014, the Company was not permitted to pay dividends.
Also on August 1, 2014, the Company entered into a $25 million Delayed Draw Term Loan Credit Agreement (the “Term Loan Agreement”) with Rabobank. The Term Loan Agreement provides the Company with a term loan facility in an aggregate principal amount up to $25 million. The term loan facility may be utilized in a series of up to six drawings until the 18-month anniversary of the date of the Term Loan Agreement. Any unused portion of the lender’s commitment to make term loans under this facility will expire on the 18-month anniversary of the closing date. The maturity date for loans under the Term Loan Agreement is July 31, 2020, and there are no scheduled principal payments due prior to maturity. The Company’s obligations under the Term Loan Agreement are secured on a second-priority basis by substantially all of the Company’s assets. There were no borrowings outstanding under the Term Loan Agreement as of August 31, 2014.
The Term Loan Agreement provides that the Total Leverage Ratio, which is computed as funded debt divided by earnings before interest, taxes, depreciation and amortization (as defined in the Term Loan Agreement) shall not exceed 5.50 through August 31, 2015; 5.00 from November 30, 2015 through August 31, 2016; 4.75 from November 30, 2016 through August 31, 2017; and 4.25 thereafter. In addition, the Company must maintain a Fixed Charge Coverage Ratio, as defined in the Term Loan Agreement, of not less than 1.10.
In 2009, the Iowa Department of Economic Development (“IDED”) provided two five-year non-interest bearing loans to the Company with terms as follows: (1) a $1.0 million term loan to be repaid in 60 equal monthly payments of $16,667 beginning December 1, 2009; and (2) a $1.0 million loan, which was forgivable if the Company maintained certain levels of employment at the Cedar Rapids plant. During the third quarter of fiscal 2014, the Company repaid the outstanding balance on the $1.0 million term loan. In May 2014, the Company was notified by IDED that its obligations to maintain certain levels of employment at the Cedar Rapids plant had been met and that repayment of the $1.0 million forgivable loan had been waived. The Company recorded the loan forgiveness of $1.0 million as non-operating income.
52
Table of Contents
The maturities of debt existing at August 31, 2014 for the fiscal years beginning with fiscal 2015 were as follows (dollars in thousands):
| 2015 |
$ | 184 | ||
| 2016 |
209 | |||
| 2017 |
225 | |||
| 2018 |
221 | |||
| 2019 and thereafter |
76,010 | |||
|
|
|
|||
| $ | 76,849 | |||
|
|
|
Included in the Company’s long-term debt at August 31, 2014 were $0.8 million of capital lease obligations, of which $0.2 million was considered the current portion of long-term debt. See Note 9.
Note 7 – Stockholders’ Equity
Common Stock
| Year Ended August 31, | ||||||||||||
| 2014 | 2013 | 2012 | ||||||||||
| Common shares outstanding |
||||||||||||
| Balance, beginning of year |
14,454,181 | 14,280,718 | 13,243,385 | |||||||||
| Series B preferred stock converted to common shares |
— | — | 1,000,000 | |||||||||
| Exercise of stock options |
64,824 | 121,226 | — | |||||||||
| Issuance of restricted stock, net |
24,489 | 52,237 | 37,333 | |||||||||
|
|
|
|
|
|
|
|||||||
| Balance, end of year |
14,543,494 | 14,454,181 | 14,280,718 | |||||||||
|
|
|
|
|
|
|
|||||||
Common stock at August 31, 2014 and 2013 did not include 173,060 and 24,489 shares, respectively, of unvested restricted shares. There were no unvested restricted shares at August 31, 2012.
Preferred Stock, Series B
In fiscal 2012, the Investor converted its 100,000 shares of Series B Preferred Stock into 1,000,000 shares of the Company’s common stock.
Note 8 – Accumulated Other Comprehensive Income (Loss)
The components of accumulated other comprehensive loss and other comprehensive income (loss) are summarized below. The components of other comprehensive income (loss) and the income tax expense (benefit) allocated to each component of other comprehensive income (loss), including reclassification adjustments, are presented in the Consolidated Statements of Comprehensive Income (Loss).
| (In thousands) | Net Unrealized Gains (Losses) on Cash Flow Hedging Instruments |
Gains (Losses) on Postretirement Obligations |
Total Accumulated Other Comprehensive Loss |
|||||||||
| Balance at August 31, 2011 |
$ | 731 | $ | (8,290 | ) | $ | (7,559 | ) | ||||
| Other comprehensive income (loss), net of taxes |
907 | (8,941 | ) | (8,034 | ) | |||||||
|
|
|
|
|
|
|
|||||||
| Balance at August 31, 2012 |
1,638 | (17,231 | ) | (15,593 | ) | |||||||
| Other comprehensive income (loss), net of taxes |
(2,494 | ) | 10,468 | 7,974 | ||||||||
|
|
|
|
|
|
|
|||||||
| Balance at August 31, 2013 |
(856 | ) | (6,763 | ) | (7,619 | ) | ||||||
| Other comprehensive income (loss), net of taxes |
(1,166 | ) | 1,033 | (133 | ) | |||||||
|
|
|
|
|
|
|
|||||||
| Balance at August 31, 2014 |
$ | (2,022 | ) | $ | (5,730 | ) | $ | (7,752 | ) | |||
|
|
|
|
|
|
|
|||||||
53
Table of Contents
| Year Ended August 31, 2014 | ||||||||||||||
| (In thousands) | Location of Expense (Income) Recognized in Net Earnings |
Before Tax Amount |
Tax | Net of Tax Amount |
||||||||||
| Pension and other postretirement benefit plans: |
||||||||||||||
| Amortization of actuarial loss (gain) |
Cost of sales | $ | 263 | $ | (101 | ) | $ | 162 | ||||||
| Amortization of actuarial loss (gain) |
Operating/R&D expenses |
88 | (34 | ) | 54 | |||||||||
| Amortization of prior service cost |
Cost of sales | 45 | (17 | ) | 28 | |||||||||
| Amortization of prior service cost |
Operating/R&D expenses |
36 | (14 | ) | 22 | |||||||||
|
|
|
|
|
|
|
|||||||||
| Total reclassification adjustments |
432 | (166 | ) | 266 | ||||||||||
|
|
|
|
|
|
|
|||||||||
| Derivatives accounted for as hedges |
Cost of sales | 12,192 | (4,682 | ) | 7,510 | |||||||||
|
|
|
|
|
|
|
|||||||||
| Total reclassifications into income |
$ | 12,624 | $ | (4,848 | ) | $ | 7,776 | |||||||
|
|
|
|
|
|
|
|||||||||
Note 9 – Leases
Certain of the Company’s property, plant and equipment is leased under operating leases. Equipment and vehicle leases generally have lease terms ranging from one to fifteen years with renewal options and real estate leases range between five and twenty years with renewal options. In fiscal 2014, 2013 and 2012, rental expense under operating leases was $6.4 million, $6.3 million and $6.0 million, respectively. Future minimum lease payments for fiscal years beginning with fiscal year 2015 for noncancelable operating leases and capital leases having initial lease terms of more than one year were as follows (dollars in thousands):
| Capital Leases |
Operating Leases Minimum Lease Payments |
|||||||
| 2015 |
$ | 292 | $ | 5,928 | ||||
| 2016 |
290 | 4,690 | ||||||
| 2017 |
275 | 3,605 | ||||||
| 2018 |
239 | 2,737 | ||||||
| 2019 |
4 | 2,161 | ||||||
| Thereafter |
7 | 8,158 | ||||||
|
|
|
|
|
|||||
| Total minimum lease payments |
1,107 | $ | 27,279 | |||||
|
|
|
|||||||
| Less: amounts representing interest |
(258 | ) | ||||||
|
|
|
|||||||
| Net minimum lease payments |
$ | 849 | ||||||
|
|
|
|||||||
Minimum lease payments for rail car operating leases included in the table above were $22.9 million.
Note 10 – Stock-Based Compensation Plans
Penford maintains the 2006 Long-Term Incentive Plan (the “2006 Incentive Plan”) pursuant to which various stock-based awards may be granted to employees, directors and consultants. As of August 31, 2014, the aggregate number of shares of the Company’s common stock that were available to be issued as awards under the 2006 Incentive Plan was 176,542. In addition, any shares previously granted under the 1994 Stock Option Plan that are subsequently forfeited or not exercised will be available for future grants under the 2006 Incentive Plan. Non-qualified stock options and restricted stock awards granted under the 2006 Incentive Plan generally vest ratably over one to four years and expire seven years from the date of grant. See Note 21. In addition, the Company may from time to time award compensatory stock-based awards outside of the 2006 Incentive Plan to newly hired employees.
54
Table of Contents
General Option Information
A summary of the stock option activity for the year ended August 31, 2014 was as follows:
| Number of Shares |
Option Price Range |
Weighted- Average Exercise Price |
Weighted- Average Remaining Term (in years) |
Aggregate Intrinsic Value |
||||||||||||||||
| Outstanding balance, August 31, 2013 |
1,517,588 | $ | 4.66 – $21.73 | $ | 10.30 | |||||||||||||||
| Granted |
81,000 | 11.44 – 14.36 | 13.48 | |||||||||||||||||
| Exercised |
(82,500 | ) | 5.29 – 8.09 | 6.27 | ||||||||||||||||
| Cancelled |
(87,088 | ) | 6.88 – 19.77 | 15.13 | ||||||||||||||||
|
|
|
|||||||||||||||||||
| Outstanding balance, August 31, 2014 |
1,429,000 | 4.66 – 21.73 | 10.42 | 3.17 | $ | 6,160,400 | ||||||||||||||
|
|
|
|||||||||||||||||||
| Options exercisable at August 31, 2014 |
1,072,502 | $ | 4.66 – $21.73 | $ | 11.26 | 2.55 | $ | 4,084,100 | ||||||||||||
The aggregate intrinsic value disclosed in the table above represents the total pre-tax intrinsic value, based on the Company’s closing stock price of $13.62 per share as of August 31, 2014 that would have been received by the option holders had all option holders exercised on that date. The intrinsic value of options exercised during fiscal years 2014 and 2013 were $536,600 and $835,300, respectively. No stock options were exercised in fiscal year 2012.
Valuation and Expense
The Company utilizes the Black-Scholes option-pricing model to determine the fair value of stock options on the date of grant. This model derives the fair value of stock options based on certain assumptions related to expected stock price volatility, expected option life, risk-free interest rate and dividend yield. The Company’s expected volatility is based on the historical volatility of the Company’s stock price over the most recent period commensurate with the expected term of the stock option award. The estimated expected option life is based primarily on historical employee exercise patterns and considers whether and the extent to which the options are in-the-money. The risk-free interest rate assumption is based upon the U.S. Treasury yield curve appropriate for the term of the Company’s stock option awards, and the selected dividend yield assumption was determined in view of the Company’s historical and estimated dividend payout. The Company has no reason to believe that the expected volatility of its stock price or its option exercise patterns would differ significantly from historical volatility or option exercises.
On March 25, 2014, in connection with the acquisition of the net assets of Gum Technology, discussed in Note 17, the Company entered into compensatory stock option agreements outside of the Company’s 2006 Incentive Plan with three key employees of Gum Technology. Pursuant to these agreements, the Company granted options to purchase an aggregate of 45,000 shares of the Company’s common stock at an exercise price equal to the closing price as of the close of business on March 25, 2014. These options have a term of seven years and, subject to certain conditions, vest ratably over three years. In fiscal 2012, in connection with the acquisition of the business of Carolina Starches, the Company entered into compensatory stock option agreements outside of the Company’s 2006 Incentive Plan with the former owners of Carolina Starches. Pursuant to these agreements, the Company granted options to purchase an aggregate of 82,500 shares of the Company’s common stock at an exercise price equal to the closing price as of the close of business on January 11, 2012. These options have a term of seven years and, subject to certain conditions, vest ratably over a two-year period.
55
Table of Contents
Under the 2006 Incentive Plan, the Company granted 36,000 stock options during fiscal 2014, 3,000 of which vest over one year and 33,000 vest ratably over three years. The Company granted 120,000 stock options during fiscal 2013, 75,000 of which vest ratably over two years and 45,000 vest ratably over three years. The Company granted 678,000 stock options during fiscal 2012 that vest ratably over three years. The Company estimated the fair value of stock options granted using the following weighted-average assumptions, which resulted in the following weighted-average grant date fair value:
| 2014 | 2013 | 2012 | ||||
| Expected volatility |
55% | 68% | 68% | |||
| Expected life (years) |
5.0 | 4.7 | 4.9 | |||
| Interest rate |
1.1 - 2.1% | 0.5 - 1.0% | 0.5 - 1.1% | |||
| Dividend yield |
0% | 0% | 0% | |||
| Weighted-average fair values |
$6.44 | $4.60 | $3.13 |
As of August 31, 2014, the Company had $0.6 million of unrecognized compensation costs related to non-vested stock option awards that are expected to be recognized over a weighted-average period of 0.8 years.
Restricted Stock Awards
A summary of the restricted stock award activity for the year ended August 31, 2014 was as follows:
| Number of Shares |
Weighted- Average Grant-Date Fair Value |
|||||||
| Nonvested at August 31, 2013 |
24,489 | $ | 7.35 | |||||
| Granted |
173,060 | 12.64 | ||||||
| Vested |
(24,489 | ) | 7.35 | |||||
| Cancelled |
— | |||||||
|
|
|
|||||||
| Nonvested at August 31, 2014 |
173,060 | $ | 12.64 | |||||
|
|
|
|||||||
The grant-date fair value of the Company’s restricted stock awards is equal to the fair value of Penford’s common stock at the grant date. The total grant date fair value of awards vested in 2014, 2013, and 2012 was $0.2 million, $0.4 million and $1.0 million, respectively. On January 1, 2014, each non-employee director received an award of 1,556 shares of restricted stock under the 2006 Incentive Plan at the last reported sale price of the stock on the preceding trading day, which vests one year from grant date of the award. On January 1, 2013, each non-employee director received an award of 2,721 shares of restricted stock under the 2006 Incentive Plan at the last reported sale price of the stock on the preceding trading day, which vested one year from grant date of the award. On January 26, 2012, each non-employee director received an award of 3,539 shares of restricted stock under the 2006 Incentive Plan at the last reported sale price of the stock on the preceding trading day, which vested one year from grant date of the award. In the third quarter of fiscal 2014, certain key employees of the Company received awards of restricted stock aggregating 157,500 shares under the 2006 Incentive Plan at the closing stock price on the date of the grant. These shares vest ratably over three years. The Company recognizes compensation cost for restricted stock ratably over the vesting period.
As of August 31, 2014, the Company had $1.6 million of unrecognized compensation costs related to non-vested restricted stock awards that is expected to be recognized over a weighted-average period of 1.0 years.
56
Table of Contents
Compensation Expense
The Company recognizes stock-based compensation expense utilizing the accelerated multiple option approach over the requisite service period, which equals the vesting period. The following table summarizes the total stock-based compensation cost for fiscal years 2014, 2013 and 2012 and the effect on the Company’s Consolidated Statements of Operations (dollars in thousands):
| 2014 | 2013 | 2012 | ||||||||||
| Cost of sales |
$ | 21 | $ | — | $ | 48 | ||||||
| Operating expenses |
1,310 | 1,404 | 1,324 | |||||||||
| Research and development expenses |
13 | — | 15 | |||||||||
|
|
|
|
|
|
|
|||||||
| Total stock-based compensation expense |
$ | 1,344 | $ | 1,404 | $ | 1,387 | ||||||
| Income tax benefit |
(516 | ) | (534 | ) | (527 | ) | ||||||
|
|
|
|
|
|
|
|||||||
| Total stock-based compensation expense, net of tax |
$ | 828 | $ | 870 | $ | 860 | ||||||
|
|
|
|
|
|
|
|||||||
Note 11 – Pensions and Other Postretirement Benefits
Penford maintains two noncontributory defined benefit pension plans that cover approximately 56% of its employees. The defined benefit pension plans for salaried and bargaining unit hourly employees were closed to new participants effective January 1, 2005 and August 1, 2004, respectively. The Company also maintains a postretirement health care benefit plan covering its bargaining unit hourly retirees. Effective August 1, 2004, the Company’s postretirement health care benefit plan covering bargaining unit hourly employees was closed to new entrants and to any current employee who did not meet minimum requirements as to age plus years of service. For the plans described above, the Company determines the vested benefit obligation on the actuarial present value based on the employee’s expected date of retirement.
In fiscal 2014, the Company amended its Penford Corporation Retirement Plan, which is a defined benefit pension plan for certain salaried and other employees (the “Retirement Plan”), to cease the further accrual of participant benefits. As a result of the amendment to the Retirement Plan, the Company performed a remeasurement of the Retirement Plan’s pension benefit liability and the net periodic benefit cost. The discount rate for the remeasurement of the pension liability decreased from 5.24% as of August 31, 2013 to 4.91%. There was no change in the expected return on assets. Pension net periodic benefit cost decreased approximately $0.8 million in fiscal 2014 as a result of the curtailment.
57
Table of Contents
Obligations and Funded Status
The following represents information summarizing the Company’s pension and other postretirement benefit plans. A measurement date of August 31, 2014 was used for all plans.
| Year Ended August 31, | ||||||||||||||||
| Pension Benefits | Other Benefits | |||||||||||||||
| 2014 | 2013 | 2014 | 2013 | |||||||||||||
| (Dollars in thousands) | ||||||||||||||||
| Change in benefit obligation: |
||||||||||||||||
| Benefit obligation at September 1 |
$ | 57,278 | $ | 62,989 | $ | 17,356 | $ | 20,457 | ||||||||
| Service cost |
1,350 | 1,945 | 112 | 235 | ||||||||||||
| Interest cost |
2,866 | 2,648 | 890 | 860 | ||||||||||||
| Plan participants’ contributions |
— | — | 110 | 106 | ||||||||||||
| Plan curtailment |
(2,705 | ) | — | — | — | |||||||||||
| Actuarial (gain) loss |
(423 | ) | (107 | ) | (346 | ) | 267 | |||||||||
| Change in assumptions |
6,237 | (8,135 | ) | 2,243 | (3,912 | ) | ||||||||||
| Benefits paid |
(2,176 | ) | (2,062 | ) | (865 | ) | (657 | ) | ||||||||
|
|
|
|
|
|
|
|
|
|||||||||
| Benefit obligation at August 31 |
$ | 62,427 | $ | 57,278 | $ | 19,500 | $ | 17,356 | ||||||||
|
|
|
|
|
|
|
|
|
|||||||||
| Change in plan assets: |
||||||||||||||||
| Fair value of plan assets at September 1 |
$ | 46,726 | $ | 42,072 | $ | — | $ | — | ||||||||
| Actual return on plan assets |
9,623 | 5,580 | — | — | ||||||||||||
| Company contributions |
2,502 | 1,136 | 755 | 551 | ||||||||||||
| Plan participants’ contributions |
— | — | 110 | 106 | ||||||||||||
| Benefits paid |
(2,176 | ) | (2,062 | ) | (865 | ) | (657 | ) | ||||||||
|
|
|
|
|
|
|
|
|
|||||||||
| Fair value of the plan assets at August 31 |
$ | 56,675 | $ | 46,726 | $ | — | $ | — | ||||||||
|
|
|
|
|
|
|
|
|
|||||||||
| Funded status: |
||||||||||||||||
| Net liability – plan assets less than projected benefit obligation |
$ | (5,752 | ) | $ | (10,552 | ) | $ | (19,500 | ) | $ | (17,356 | ) | ||||
|
|
|
|
|
|
|
|
|
|||||||||
| Recognized as: |
||||||||||||||||
| Current accrued benefit liability |
$ | — | $ | — | $ | (774 | ) | $ | (760 | ) | ||||||
| Non-current accrued benefit liability |
(5,752 | ) | (10,552 | ) | (18,726 | ) | (16,596 | ) | ||||||||
|
|
|
|
|
|
|
|
|
|||||||||
| Net amount recognized |
$ | (5,752 | ) | $ | (10,552 | ) | $ | (19,500 | ) | $ | (17,356 | ) | ||||
|
|
|
|
|
|
|
|
|
|||||||||
Accumulated other comprehensive loss consisted of the following amounts that have not yet been recognized as components of net benefit cost (dollars in thousands):
| August 31, 2014 | August 31, 2013 | |||||||||||||||
| Pension Benefits |
Other Benefits |
Pension Benefits |
Other Benefits |
|||||||||||||
| Unrecognized prior service cost (credit) |
$ | 1,055 | $ | (3 | ) | $ | 1,288 | $ | (155 | ) | ||||||
| Unrecognized net actuarial loss |
6,600 | 1,579 | 10,091 | (318 | ) | |||||||||||
|
|
|
|
|
|
|
|
|
|||||||||
| Total |
$ | 7,655 | $ | 1,576 | $ | 11,379 | $ | (473 | ) | |||||||
|
|
|
|
|
|
|
|
|
|||||||||
Selected information related to the Company’s defined benefit pension plans that have benefit obligations in excess of fair value of plan assets is presented below (dollars in thousands):
| August 31, | ||||||||
| 2014 | 2013 | |||||||
| Projected benefit obligation |
$ | 62,427 | $ | 57,278 | ||||
| Accumulated benefit obligation |
$ | 62,427 | $ | 54,389 | ||||
| Fair value of plan assets |
$ | 56,675 | $ | 46,726 | ||||
58
Table of Contents
Net Periodic Benefit Cost
| Year Ended August 31, | ||||||||||||||||||||||||
| Pension Benefits | Other Benefits | |||||||||||||||||||||||
| 2014 | 2013 | 2012 | 2014 | 2013 | 2012 | |||||||||||||||||||
| (Dollars in thousands) | ||||||||||||||||||||||||
| Components of net periodic benefit cost |
||||||||||||||||||||||||
| Service cost |
$ | 1,350 | $ | 1,945 | $ | 1,521 | $ | 112 | $ | 235 | $ | 229 | ||||||||||||
| Interest cost |
2,866 | 2,648 | 2,729 | 890 | 860 | 972 | ||||||||||||||||||
| Expected return on plan assets |
(3,374 | ) | (2,869 | ) | (2,914 | ) | — | — | — | |||||||||||||||
| Amortization of prior service cost |
233 | 241 | 228 | (152 | ) | (152 | ) | (152 | ) | |||||||||||||||
| Amortization of actuarial loss |
351 | 1,932 | 773 | — | 267 | — | ||||||||||||||||||
|
|
|
|
|
|
|
|
|
|
|
|
|
|||||||||||||
| Benefit cost |
$ | 1,426 | $ | 3,897 | $ | 2,337 | $ | 850 | $ | 1,210 | $ | 1,049 | ||||||||||||
|
|
|
|
|
|
|
|
|
|
|
|
|
|||||||||||||
Assumptions
The Company assesses its benefit plan assumptions on a regular basis. Assumptions used in determining plan information were as follows:
| August 31, | ||||||||||||||||||||||||
| Pension Benefits | Other Benefits | |||||||||||||||||||||||
| 2014 | 2013 | 2012 | 2014 | 2013 | 2012 | |||||||||||||||||||
| Weighted-average assumptions used to calculate net periodic expense: |
||||||||||||||||||||||||
| Discount rate |
5.24 | % | 4.28 | % | 5.87 | % | 5.24 | % | 4.28 | % | 5.87 | % | ||||||||||||
| Expected return on plan assets |
7.00 | % | 7.00 | % | 8.00 | % | ||||||||||||||||||
| Rate of compensation increase |
3.00 | % | 3.00 | % | 3.00 | % | ||||||||||||||||||
| Weighted-average assumptions used to calculate benefit obligations at August 31: |
||||||||||||||||||||||||
| Discount rate |
4.39 | % | 5.24 | % | 4.28 | % | 4.39 | % | 5.24 | % | 4.28 | % | ||||||||||||
| Expected return on plan assets |
7.00 | % | 7.00 | % | 7.00 | % | ||||||||||||||||||
| Rate of compensation increase |
— | 3.00 | % | 3.00 | % | |||||||||||||||||||
The expected long-term return on assets assumption for the pension plans represents the average rate of return to be earned on plan assets over the period the benefits included in the benefit obligation are to be paid. In developing the expected rate of return, the Company considers long-term historical market rates of return, as well as actual returns on the Company’s plan assets, and adjusts this information to reflect expected capital market trends. Penford also considers forward-looking return expectations by asset class, the contribution of active management and management fees paid by the plans. The plan assets are held in qualified trusts and anticipated rates of return are not reduced for income taxes. The expected long-term return on assets assumption used to calculate net periodic pension expense was 7.0% for fiscal 2014. A decrease (increase) of 50 basis points in the expected return on assets assumptions would increase (decrease) pension expense by approximately $0.3 million based on the assets of the plans at August 31, 2014. The expected return on plan assets to be used in calculating fiscal 2015 pension expense is 7.0%.
The discount rate used by the Company in determining pension expense and pension obligations reflects the yield of high quality (AA or better rating by a recognized rating agency) corporate bonds whose cash flows are expected to match the timing and amounts of projected future benefit payments. The discount rates to determine net periodic expense used in fiscal 2014 (5.24%), fiscal 2013 (4.28%) and fiscal 2012 (5.87%), reflect the change in bond yields over the last several years. During fiscal 2014, bond yields decreased and Penford has decreased the discount rate for calculating its benefit obligations at August 31, 2014, as well as net periodic expense for
59
Table of Contents
fiscal 2015, to 4.39%. Lowering the discount rate by 25 basis points would increase pension expense by approximately $0.2 million. The effect of lowering the discount rate by 25 basis points on other postretirement benefit expense would not be material.
Unrecognized net loss amounts reflect the difference between expected and actual returns on pension plan assets, as well as the effects of changes in actuarial assumptions. Unrecognized net losses in excess of certain thresholds are amortized into net periodic pension and postretirement benefit expense over the average remaining service life of active employees. Amortization of unrecognized net loss amounts is expected to increase net pension expense by approximately $0.1 million in fiscal 2015. Amortization of unrecognized net losses is not expected to increase net postretirement health care expense in fiscal 2015.
| 2014 | 2013 | 2012 | ||||||||||
| Assumed health care cost trend rates: |
||||||||||||
| Current health care trend assumption |
7.00 | % | 7.80 | % | 8.00 | % | ||||||
| Ultimate health care trend rate |
4.50 | % | 4.50 | % | 4.50 | % | ||||||
| Year ultimate health care trend is reached |
2033 | 2032 | 2030 | |||||||||
The assumed health care cost trend rate could have a significant effect on the amounts reported. A one-percentage-point change in the assumed health care cost trend rate would have the following effects:
| 1-Percentage- Point Increase |
1-Percentage- Point Decrease |
|||||||
| (Dollars in thousands) | ||||||||
| Effect on total of service and interest cost components in fiscal 2014 |
$ | 148 | $ | (122 | ) | |||
| Effect on postretirement accumulated benefit obligation as of August 31, 2014 |
$ | 2,808 | $ | (2,324 | ) | |||
Plan Assets
The weighted-average asset allocations of the investment portfolio for the pension plans at August 31 were as follows:
| Target Allocation |
August 31, | |||||||||||
| 2014 | 2013 | |||||||||||
| U.S. equities |
62 | % | 62 | % | 55 | % | ||||||
| International equities |
13 | % | 13 | % | 15 | % | ||||||
| Fixed income investments |
25 | % | 25 | % | 25 | % | ||||||
| Real estate |
— | — | 5 | % | ||||||||
The investment strategy for the defined benefit pension assets is to maintain a diversified asset allocation in order to minimize the risk of large losses and maximize the long-term risk-adjusted rate of return. No plan assets are invested in Penford shares. There are no plan assets for the Company’s postretirement health care plan. At August 31, 2014, the assets of the pension plans were invested in publicly traded mutual funds and money market funds. The fair values of the assets of the pension plans were determined using Level 1 inputs. See Note 13, “Fair Value Measurements and Derivative Instruments,” for a description of the fair value hierarchy that prioritizes the inputs to valuation techniques used to measure fair value. The fair values of the assets of the Company’s pension plans at August 31, 2014 were as follows:
| August 31, 2014 | ||||
| (Dollars in thousands) | ||||
| U.S. equities |
$ | 35,287 | ||
| International equities |
7,296 | |||
| Fixed income investments |
14,092 | |||
|
|
|
|||
| Balance, August 31, 2014 |
$ | 56,675 | ||
|
|
|
|||
60
Table of Contents
Contributions and Benefit Payments
The Company’s funding policy for the defined benefit pension plans is to contribute amounts sufficient to meet the statutory funding requirements of the Employee Retirement Income Security Act of 1974 and the Pension Protection Act of 2006. The Company contributed $2.5 million, $1.1 million and $4.1 million in fiscal 2014, 2013 and 2012, respectively. The Company estimates that it will not be required to make minimum contributions to the pension plans during fiscal 2015.
Penford funds the benefit payments of its postretirement health care plan on a cash basis; therefore, the Company’s contributions to these plans in fiscal 2015 will approximate the benefit payments below.
Expected benefit payments are based on the same assumptions used to measure the benefit obligations and include benefits attributable to estimate future employee service.
| Pension | Other Postretirement |
|||||||
| (Dollars in millions) | ||||||||
| 2015 |
$ | 2.5 | $ | 1.0 | ||||
| 2016 |
2.6 | 1.0 | ||||||
| 2017 |
2.8 | 1.1 | ||||||
| 2018 |
2.9 | 1.2 | ||||||
| 2019 |
3.1 | 1.3 | ||||||
| 2020-2024 |
18.6 | 8.2 | ||||||
Note 12 – Other Employee Benefits
Savings and Stock Ownership Plan
The Company has a defined contribution savings plan by which eligible employees can elect a maximum salary deferral of 50%. The plan provides a 100% match on the first 3% of salary contributions and a 50% match on the next 3% per employee. The Company’s matching contributions were $1.3 million, $1.2 million and $1.0 million for fiscal years 2014, 2013 and 2012, respectively. Effective September 1, 2014, the plan provides a 125% match on the first 3% of salary contributions and a 75% match on the next 3% per employee.
Deferred Compensation Plan
The Company provided its directors and certain employees the opportunity to defer a portion of their salary, bonus and fees. The plan was closed to new contributions effective January 31, 2011. The deferrals earn interest based on Moody’s current Corporate Bond Yield. Deferred compensation interest of $185,000, $177,000 and $179,000 was accrued in fiscal years 2014, 2013 and 2012, respectively.
Supplemental Executive Retirement Plan
The Company sponsors a supplemental executive retirement plan, a non-qualified plan, which covers certain employees. No current executive officers participate in this plan. For fiscal 2014, 2013 and 2012, the net periodic pension expense accrued for this plan was $274,000, $271,000 and $258,000, respectively. The accrued obligation related to the plan was $2.7 million at August 31, 2014 and 2013. The plan was amended in fiscal 2011 such that no participant in the plan would accrue any additional benefits after January 31, 2011.
Health Care and Life Insurance Benefits
The Company offers health care and life insurance benefits to most active employees. Costs incurred to provide these benefits are charged to expense as incurred. Health care and life insurance expense, net of employee contributions, was $5.1 million, $5.9 million and $5.1 million in fiscal years 2014, 2013 and 2012, respectively.
61
Table of Contents
Note 13 – Fair Value Measurements and Derivative Instruments
Fair Value Measurements
Fair value is defined as the price that would be received from selling an asset or paid to transfer a liability (an exit price) in Penford’s principal or most advantageous market for the asset or liability in an orderly transaction between market participants on the measurement date. A fair value hierarchy was established that requires an entity to maximize the use of observable inputs and minimize the use of unobservable inputs when measuring fair value. Observable inputs are inputs that reflect the assumptions market participants would use in pricing the asset or liability developed based on market data obtained from sources outside the reporting entity. Unobservable inputs are inputs that reflect Penford’s own assumptions based on market data and on assumptions that market participants would use in pricing the asset or liability developed based on the best information available in the circumstances. The three levels of inputs that may be used to measure fair value are:
| • | Level 1 inputs are quoted prices (unadjusted) in active markets for identical assets or liabilities that the entity has the ability to access at the measurement date. |
| • | Level 2 inputs are other than quoted prices included within Level 1 that are observable for assets and liabilities such as (1) quoted prices for similar assets or liabilities in active markets, (2) quoted prices for identical or similar assets or liabilities in markets that are not active, or (3) inputs that are derived principally or corroborated by observable market date by correlation or other means. |
| • | Level 3 inputs are unobservable inputs to the valuation methodology for the assets or liabilities. |
Presented below are the fair values of the Company’s derivative instruments as of August 31, 2014 and 2013:
| As of August 31, 2014 |
Level 1 | Level 2 | Level 3 | Total | ||||||||||||
| (In thousands) | ||||||||||||||||
| Current assets (Other current assets): |
||||||||||||||||
| Commodity derivatives |
$ | (1,787 | ) | $ | — | $ | — | $ | (1,787 | ) | ||||||
|
|
|
|
|
|
|
|
|
|||||||||
| As of August 31, 2013 |
Level 1 | Level 2 | Level 3 | Total | ||||||||||||
| (In thousands) | ||||||||||||||||
| Current assets (Other current assets): |
||||||||||||||||
| Commodity derivatives |
$ | 512 | $ | — | $ | — | $ | 512 | ||||||||
|
|
|
|
|
|
|
|
|
|||||||||
The following table reconciles the gross fair value of assets and liabilities subject to offsetting arrangements to the net amounts recorded in the Consolidated Balance Sheets as other current assets:
| (In thousands) | Gross Amounts of Recognized Assets |
Gross Liabilities Offset in the Balance Sheets |
Net Amount of Assets (Liabilities) |
Cash Collateral on Deposit with Counterparty |
Net Fair Value as Recorded in Balance Sheets |
|||||||||||||||
| As of August 31, 2014 |
||||||||||||||||||||
| Commodity derivatives |
$ | 413 | $ | (2,200 | ) | $ | (1,787 | ) | $ | 3,490 | $ | 1,703 | ||||||||
|
|
|
|
|
|
|
|
|
|
|
|||||||||||
| As of August 31, 2013 |
||||||||||||||||||||
| Commodity derivatives |
$ | 997 | $ | (485 | ) | $ | 512 | $ | 1,700 | $ | 2,212 | |||||||||
|
|
|
|
|
|
|
|
|
|
|
|||||||||||
Other Financial Instruments
The carrying values of cash and cash equivalents, receivables and payables approximate their fair values because of their short maturities. The Company’s bank debt interest rate reprices with changes in market interest rates and, accordingly, the carrying amount of such debt approximates fair value.
Commodity Contracts
For derivative instruments designated as fair value hedges, the gain or loss on the derivative instruments, as well as the offsetting gain or loss on the hedged firm commitments and/or inventory, were recognized in current
62
Table of Contents
earnings as a component of cost of sales. For derivative instruments designated as cash flow hedges, the effective portion of the gain or loss on the derivative instruments was reported as a component of other comprehensive income (loss), net of applicable income taxes, and recognized in earnings when the hedged exposure affects earnings. The Company recognizes the gain or loss on the derivative instrument as a component of cost of sales in the period when the finished goods produced from the hedged item are sold. If it is determined that the derivative instruments used are no longer effective at offsetting changes in the price of the hedged item, then the changes in fair value would be recognized in current earnings as a component of cost of sales.
To reduce the price volatility of corn used in fulfilling some of its starch sales contracts, Penford uses readily marketable exchange-traded futures, as well as forward cash corn purchases. Penford also uses exchange-traded futures to hedge corn inventories, firm commitments to purchase corn and forecasted purchases of corn. The exchange-traded futures are not purchased or sold for trading or speculative purposes and were designated as hedges. Effective August 1, 2014, the Company discontinued hedge accounting treatment for corn futures contracts as the hedging relationship no longer met the requirements for hedge accounting. The effect of the loss of hedge accounting on the Consolidated Financial Statements was not material. Through July 31, 2014, the gains and losses on corn futures contracts designated as cash flow hedges were deferred in accumulated other comprehensive income (loss). At August 31, 2014, $2.1 million of pre-tax losses continued to be deferred in accumulated other comprehensive income (loss) for these corn futures contracts. These losses will be reclassified to cost of sales during fiscal years 2015 and 2016 as the originally forecasted cash flows occur.
Selling prices for ethanol fluctuate based on the availability and price of manufacturing inputs and the status of various government regulations and tax incentives. To reduce the risk of the price variability of ethanol, Penford enters into exchange-traded futures contracts to hedge exposure to ethanol price fluctuations. These futures contracts have been designated as hedges.
Hedged transactions are generally expected to occur within 12-16 months of the time the hedge is established. The deferred gain (loss), net of tax, recorded in other comprehensive income at August 31, 2014 that is expected to be reclassified into income within 12 months is $(1.9) million.
Prices for natural gas fluctuate due to anticipated changes in supply and demand and movement of prices of related or alternative fuels. To reduce the price risk caused by market fluctuations, Penford may enter into short-term purchase contracts or use exchange-traded futures contracts to reduce exposure to natural gas price fluctuations. These futures contracts were not designated as hedges in the three years ended August 31, 2014. Gains and losses on natural gas futures contracts in the three years ended August 31, 2014 were recognized in cost of sales in the Consolidated Statement of Operations. The Company had no natural gas futures contracts at August 31, 2014 or August 31, 2013.
As of August 31, 2014, the Company had the following outstanding futures contracts:
| Corn futures |
5,705,000 | Bushels | ||||||
| Ethanol swaps |
17,010,000 | Gallons |
63
Table of Contents
The following tables provide information about the fair values of the Company’s derivatives, by contract type, as of August 31, 2014 and 2013:
| Assets | Liabilities | |||||||||||||||||||||||
| (In thousands) | Fair Value August 31, | Fair Value August 31, | ||||||||||||||||||||||
| Balance Sheet Location | 2014 | 2013 | Balance Sheet Location | 2014 | 2013 | |||||||||||||||||||
| Derivatives designated as hedging instruments: |
||||||||||||||||||||||||
| Cash flow hedges: |
||||||||||||||||||||||||
| Corn futures |
Other current assets | $ | — | $ | — | Other current assets | $ | 320 | $ | 485 | ||||||||||||||
| Ethanol futures |
Other current assets | — | 997 | Other current assets | 1,880 | — | ||||||||||||||||||
| Fair value hedges: |
||||||||||||||||||||||||
| Corn futures |
Other current assets | 413 | — | Other current assets | — | — | ||||||||||||||||||
|
|
|
|
|
|
|
|
|
|||||||||||||||||
| $ | 413 | $ | 997 | $ | 2,200 | $ | 485 | |||||||||||||||||
|
|
|
|
|
|
|
|
|
|||||||||||||||||
The following tables provide information about the effect of derivative instruments on the financial performance of the Company for the fiscal years ended August 31, 2014, 2013 and 2012:
| (In thousands) | Amount of Gain (Loss) Recognized in AOCI |
Amount of Gain (Loss) Reclassified from AOCI into Income |
Amount of Gain (Loss) Recognized in Income |
|||||||||||||||||||||||||||||||||
| Year Ended August 31 | Year Ended August 31 | Year Ended August 31 | ||||||||||||||||||||||||||||||||||
| 2014 | 2013 | 2012 | 2014 | 2013 | 2012 | 2014 | 2013 | 2012 | ||||||||||||||||||||||||||||
| Derivatives designated as hedging instruments: |
||||||||||||||||||||||||||||||||||||
| Cash flow hedges: |
||||||||||||||||||||||||||||||||||||
| Corn futures (1) |
$ | (3,073 | ) | $ | (407 | ) | $ | 2,067 | $ | (3,349 | ) | $ | 5,351 | $ | 1,500 | $ | (2,307 | ) | $ | (870 | ) | $ | 36 | |||||||||||||
| Natural gas futures (1) |
— | — | — | — | — | (492 | ) | — | — | — | ||||||||||||||||||||||||||
| Ethanol futures (1) |
(11,012 | ) | 1,611 | 1,667 | (8,843 | ) | (123 | ) | 1,263 | (331 | ) | (151 | ) | — | ||||||||||||||||||||||
|
|
|
|
|
|
|
|
|
|
|
|
|
|
|
|
|
|
|
|||||||||||||||||||
| $ | (14,085 | ) | $ | 1,204 | $ | 3,734 | $ | (12,192 | ) | $ | 5,228 | $ | 2,271 | $ | (2,638 | ) | $ | (1,021 | ) | $ | 36 | |||||||||||||||
|
|
|
|
|
|
|
|
|
|
|
|
|
|
|
|
|
|
|
|||||||||||||||||||
| Fair Value Hedges: Corn |
$ | 52 | $ | 363 | $ | 98 | ||||||||||||||||||||||||||||||
|
|
|
|
|
|
|
|||||||||||||||||||||||||||||||
| Derivatives not designated as hedging instruments: |
||||||||||||||||||||||||||||||||||||
| Natural gas futures (1) |
$ | (662 | ) | $ | 94 | $ | (1,082 | ) | ||||||||||||||||||||||||||||
| Foreign currency contracts (1) |
— | — | 6 | |||||||||||||||||||||||||||||||||
| Soybean oil futures (1) |
— | — | 12 | |||||||||||||||||||||||||||||||||
| Soybean meal futures (1) |
18 | — | (14 | ) | ||||||||||||||||||||||||||||||||
|
|
|
|
|
|
|
|||||||||||||||||||||||||||||||
| $ | (644 | ) | $ | 94 | $ | (1,078 | ) | |||||||||||||||||||||||||||||
|
|
|
|
|
|
|
|||||||||||||||||||||||||||||||
| (1) | Gains and losses reported in cost of sales |
| (2) | Hedged items are firm commitments and inventory |
64
Table of Contents
Note 14 – Other Non-Operating Income (Expense)
Other non-operating income (expense) consisted of the following:
| Year Ended August 31, | ||||||||||||
| 2014 | 2013 | 2012 | ||||||||||
| (Dollars in thousands) | ||||||||||||
| Loan forgiveness |
$ | 1,000 | $ | — | $ | — | ||||||
| Loss on extinguishment of debt |
(265 | ) | — | — | ||||||||
| Loss on redemption of Series A Preferred Stock |
— | — | (6,599 | ) | ||||||||
| Other |
31 | 75 | 413 | |||||||||
|
|
|
|
|
|
|
|||||||
| $ | 766 | $ | 75 | $ | (6,186 | ) | ||||||
|
|
|
|
|
|
|
|||||||
On August 1, 2014, the Company refinanced its bank debt. See Note 6. In connection with the refinancing, the Company recorded a pre-tax, non-cash charge to earnings of approximately $0.3 million in the fourth quarter of fiscal 2014 related to unamortized transaction fees associated with the prior credit facility.
In May 2014, the Company was notified by the Iowa Department of Economic Development that its obligations to maintain certain levels of employment at the Cedar Rapids plant had been met and that repayment of the $1.0 million forgivable loan had been waived. The Company recorded the loan forgiveness of $1.0 million as non-operating income. See Note 6.
In fiscal 2012, the Company redeemed 100,000 shares of its Series A Preferred Stock at the original issue price of $40.0 million plus accrued dividends of $8.9 million. As a result of the early redemptions, the Company recorded accelerated discount accretion of $5.5 million and amortization of issuance costs of $1.1 million as a loss on redemption in other non-operating income (expense).
Note 15 – Income Taxes
The Company’s income (loss) before income taxes for fiscal years 2014, 2013 and 2012 was $12.5 million, $5.5 million, and $(4.8) million, respectively. Foreign income (loss) before income taxes for fiscal years 2014, 2013 and 2012 was $(0.02) million, $0.5 million, and $0.1 million, respectively. Foreign tax expense for all three years was zero.
U.S. income tax expense consisted of the following:
| Year Ended August 31, | ||||||||||||
| 2014 | 2013 | 2012 | ||||||||||
| (Dollars in thousands) | ||||||||||||
| Current: |
||||||||||||
| Federal |
$ | (77 | ) | $ | (422 | ) | $ | (162 | ) | |||
| State |
85 | 80 | 3 | |||||||||
|
|
|
|
|
|
|
|||||||
| 8 | (342 | ) | (159 | ) | ||||||||
| Deferred: |
||||||||||||
| Federal |
4,068 | 1,829 | 4,582 | |||||||||
| State |
645 | (4 | ) | 383 | ||||||||
|
|
|
|
|
|
|
|||||||
| 4,713 | 1,825 | 4,965 | ||||||||||
|
|
|
|
|
|
|
|||||||
| Total |
$ | 4,721 | $ | 1,483 | $ | 4,806 | ||||||
|
|
|
|
|
|
|
|||||||
65
Table of Contents
| Year Ended August 31, | ||||||||||||
| 2014 | 2013 | 2012 | ||||||||||
| (Dollars in thousands) | ||||||||||||
| Comprehensive tax expense allocable to: |
||||||||||||
| Income before taxes |
$ | 4,721 | $ | 1,483 | $ | 4,806 | ||||||
| Comprehensive income (loss) |
(83 | ) | 4,887 | (4,924 | ) | |||||||
|
|
|
|
|
|
|
|||||||
| $ | 4,638 | $ | 6,370 | $ | (118 | ) | ||||||
|
|
|
|
|
|
|
|||||||
A reconciliation of the statutory federal tax to the actual provision for taxes was as follows:
| Year Ended August 31, | ||||||||||||
| 2014 | 2013 | 2012 | ||||||||||
| (Dollars in thousands) | ||||||||||||
| Statutory tax rate |
35 | % | 35 | % | 35 | % | ||||||
| Statutory tax on income |
$ | 4,366 | $ | 1,921 | $ | (1,666 | ) | |||||
| State taxes, net of federal benefit |
501 | 94 | 219 | |||||||||
| Non-deductible expenses related to preferred stock |
— | — | 4,547 | |||||||||
| Research credit |
(33 | ) | (189 | ) | (73 | ) | ||||||
| Foreign taxes |
8 | (183 | ) | (38 | ) | |||||||
| Stock option exercises/expirations |
51 | 376 | — | |||||||||
| Prior year true up |
31 | (265 | ) | 95 | ||||||||
| Unrecognized tax benefits |
(165 | ) | (359 | ) | (165 | ) | ||||||
| Valuation allowance |
(156 | ) | (104 | ) | 1,787 | |||||||
| Other |
118 | 192 | 100 | |||||||||
|
|
|
|
|
|
|
|||||||
| Total provision |
$ | 4,721 | $ | 1,483 | $ | 4,806 | ||||||
|
|
|
|
|
|
|
|||||||
66
Table of Contents
The significant components of deferred tax assets and liabilities were as follows:
| August 31, | ||||||||
| 2014 | 2013 | |||||||
| (Dollars in thousands) | ||||||||
| Deferred tax assets: |
||||||||
| Alternative minimum tax credit |
$ | 3,645 | $ | 3,473 | ||||
| Postretirement benefits |
10,697 | 11,920 | ||||||
| Provisions for accrued expenses |
2,881 | 2,791 | ||||||
| Stock-based compensation |
2,581 | 2,453 | ||||||
| Net operating loss carryforward |
801 | 4,575 | ||||||
| Tax credit carryforwards |
2,743 | 4,373 | ||||||
| Net operating loss carryforward – foreign |
— | 10,853 | ||||||
| Hedging |
1,257 | 525 | ||||||
| Other |
867 | 2,092 | ||||||
|
|
|
|
|
|||||
| 25,472 | 43,055 | |||||||
| Less – valuation allowance |
(98 | ) | (12,537 | ) | ||||
|
|
|
|
|
|||||
| Total deferred tax assets |
25,374 | 30,518 | ||||||
|
|
|
|
|
|||||
| Deferred tax liabilities: |
||||||||
| Depreciation |
22,413 | 22,296 | ||||||
| Prepaid expenses |
867 | 842 | ||||||
| Other |
102 | 914 | ||||||
|
|
|
|
|
|||||
| Total deferred tax liabilities |
23,382 | 24,052 | ||||||
|
|
|
|
|
|||||
| Net deferred tax assets |
$ | 1,992 | $ | 6,466 | ||||
|
|
|
|
|
|||||
| Recognized as: |
||||||||
| Other current assets |
$ | 2,432 | $ | 1,479 | ||||
| Other liabilities |
(440 | ) | — | |||||
| Deferred tax asset |
— | 4,987 | ||||||
|
|
|
|
|
|||||
| Total net deferred tax assets |
$ | 1,992 | $ | 6,466 | ||||
|
|
|
|
|
|||||
Carryforwards
At August 31, 2014, the Company had a U.S. federal alternative minimum tax credit carryforward of $3.6 million with no expiration, research and development credit carryforwards of $1.7 million expiring 2025 through 2032 and a net operating loss carryforward of $0.2 million expiring in 2030. The Company also has U.S. state net operating loss carryforwards of $15.2 million with expiration dates between 2015 and 2030.
Valuation Allowance
At August 31, 2013, the Company had a $1.7 million valuation allowance related to small ethanol producer tax credit carryforwards that expired in fiscal 2014. Tax laws require that any net operating loss carryforwards be utilized before the Company could utilize the small ethanol producer tax credit carryforwards. Due to the near-term expiration of the small ethanol producer tax credit carryforward period, the Company did not believe it had sufficient positive evidence to substantiate that the small ethanol tax credit carryforwards were realizable at a more-likely-than-not level of assurance. During fiscal 2014, the valuation allowance was reversed as the Company utilized $0.2 million of the credit and the remainder expired unused.
At August 31, 2013, the Company had a $22,000 valuation allowance related to charitable contributions that expired in fiscal year 2014. Tax laws limit the deduction of charitable contributions to 10% of otherwise taxable income with the excess carried forward for five years. Utilization of net operating loss carryforwards are considered to reduce taxable income. In fiscal 2014, the valuation allowance was reversed as the charitable contributions expired unused.
67
Table of Contents
In fiscal 2014, the Company recorded a $98,000 valuation allowance related to two state tax credits. Tax laws require that any net operating loss carryforwards be utilized before the Company can utilize the state credits. In one of the states, the credit carryforward period is 3 years and in the other state, 14 years. The Company did not believe that it had sufficient positive evidence to substantiate that the state tax credit carryforwards would be utilized within the carryforward period.
At August 31, 2014, the Company had $2.0 million of U.S. net deferred tax assets. Other than for the state tax credits discussed above, a valuation allowance has not been provided on the net U.S. deferred tax assets as of August 31, 2014. The determination of the need for a valuation allowance requires significant judgment and estimates. The Company evaluates the requirement for a valuation allowance each quarter. The Company believes that it is more likely than not that future operations will generate sufficient taxable income to realize its deferred tax assets. However, there can be no assurance that management’s current plans will be achieved or that a valuation allowance will not be required in the future.
In the second quarter of fiscal 2014, the Company liquidated its Australian subsidiaries and received approval from the Australian tax authorities for the liquidation. As of August 31, 2013, the Company had provided a tax valuation allowance of $10.9 million against the entire Australian net deferred tax asset. During the quarter ended February 28, 2014, as a result of the liquidation, the previously recorded deferred tax asset and corresponding valuation allowance was reversed, resulting in no net effect on current or deferred income taxes.
Uncertain Tax Positions
The total amount of gross unrecognized tax benefits was $0.5 million at August 31, 2014, all of which, if recognized, would impact the Company’s effective tax rate. A reconciliation of the beginning and ending amount of unrecognized tax benefits was as follows (dollars in thousands):
| 2014 | 2013 | |||||||
| Unrecognized tax benefits at beginning of year |
$ | 706 | $ | 1,058 | ||||
| Additions for tax positions related to prior years |
14 | 134 | ||||||
| Additions for tax positions related to current year |
92 | 90 | ||||||
| Reductions due to lapse of applicable statute of limitations |
(309 | ) | (576 | ) | ||||
|
|
|
|
|
|||||
| Unrecognized tax benefits at end of year |
$ | 503 | $ | 706 | ||||
|
|
|
|
|
|||||
The Company’s policy is to recognize interest and penalty expense associated with uncertain tax positions as a component of income tax expense (benefit) in the Consolidated Statements of Operations. As of August 31, 2014 and 2013, the Company had $0.1 million and $0.1 million, respectively, of accrued interest and penalties included in the long-term tax liability. During fiscal 2014, the Company decreased the liability for unrecognized tax benefits by $15,000 for interest and $25,000 for penalties.
Other
The Company files tax returns in the U.S. federal jurisdiction and various U.S. state jurisdictions and is subject to examination by taxing authorities in all of those jurisdictions. From time to time, the Company’s tax returns are reviewed or audited by U.S. federal and various U.S. state taxing authorities. The Company believes that adjustments, if any, resulting from these reviews or audits would not be material, individually or in the aggregate, to the Company’s financial position, results of operations or liquidity. It is reasonably possible that the amount of unrecognized tax benefits related to certain of the Company’s tax positions will increase or decrease in the next twelve months as audits or reviews are initiated and settled. At this time, an estimate of the range of a reasonably possible change cannot be made. The Company is not subject to income tax examinations by U.S. federal or state jurisdictions for fiscal years prior to 2010.
68
Table of Contents
Note 16 – Earnings (Loss) per Common Share
Outstanding unvested share-based payment awards that contain rights to non-forfeitable dividends participate in undistributed earnings with common shareholders and, therefore, are included in computing earnings per share under the two-class method. Under the two-class method, net earnings are reduced by the amount of dividends declared in the period for each class of common stock and participating security. The remaining undistributed earnings are then allocated to common stock and participating securities, based on their respective rights to receive dividends. Restricted stock awards granted to certain employees and directors under the Company’s 2006 Incentive Plan, which contain non-forfeitable rights to dividends at the same rate as common stock, are considered participating securities.
Basic earnings (loss) per share reflect only the weighted-average common shares outstanding during the period. Diluted earnings (loss) per share reflect weighted-average common shares outstanding and the effect of any dilutive common stock equivalent shares. Diluted earnings (loss) per share is calculated by dividing net income (loss) by the average common shares outstanding plus additional common shares that would have been outstanding assuming the exercise of in-the-money stock options, using the treasury stock method. The following table presents the reconciliation of net income (loss) to net income (loss) applicable to common shares and the computation of diluted weighted-average shares outstanding for the fiscal years 2014, 2013 and 2012:
| Year Ended August 31, | ||||||||||||
| 2014 | 2013 | 2012 | ||||||||||
| (In thousands) | ||||||||||||
| Numerator: |
||||||||||||
| Net income (loss) |
$ | 7,753 | $ | 4,007 | $ | (9,566 | ) | |||||
| Less: allocation to participating securities |
(44 | ) | (11 | ) | — | |||||||
|
|
|
|
|
|
|
|||||||
| Net income (loss) applicable to common shares and equivalents |
$ | 7,709 | $ | 3,996 | $ | (9,566 | ) | |||||
|
|
|
|
|
|
|
|||||||
| Denominator: |
||||||||||||
| Weighted-average common shares and equivalents outstanding, basic |
12,515 | 12,369 | 12,294 | |||||||||
| Dilutive stock options and awards |
343 | 249 | — | |||||||||
|
|
|
|
|
|
|
|||||||
| Weighted-average common shares and equivalents outstanding, diluted |
12,858 | 12,618 | 12,294 | |||||||||
|
|
|
|
|
|
|
|||||||
Weighted-average restricted stock awards of 57,443 for fiscal year 2012 were excluded from the calculation of diluted earnings per share because they were antidilutive. Weighted-average stock options omitted from the denominator of the earnings per share calculation because they were antidilutive were 601,229, 896,354 and 1,648,704 for fiscal years 2014, 2013 and 2012, respectively.
Note 17 – Acquisitions
Gum Technology
On March 4, 2014, Penford Products Co. entered into an Asset Purchase Agreement with Gum Technology, an Arizona close corporation, (“Gum Technology” or “Seller”), and Allen J Freed and Sheryl I. Freed, the owners of Seller. On March 25, 2014, the Company acquired substantially all of the assets of Seller and assumed certain liabilities for a purchase price of $9.9 million, subject to working capital and certain other adjustments.
Gum Technology, based in Tucson, Arizona, distributes and blends gums and hydrocolloids, serving primarily the food and beverage industries in North America and Asia. Gum Technology specializes in developing and producing customized stabilizers to meet customers’ product formulation needs. This acquisition broadens the Company’s food ingredients portfolio of functional and specialty ingredient systems within the Food Ingredients segment.
69
Table of Contents
The funding of the purchase price was provided by borrowings under the Company’s credit facility. In connection with the acquisition, $750,000 of the purchase price (“Holdback”), included in the $9.9 million total purchase price, was retained by the Company as a fund to satisfy certain of the Seller’s post-closing obligations. The Holdback is payable to the Seller, net of amounts applied to satisfy the obligations of the Seller, in two installments at six and twelve months after the date of the acquisition. On September 25, 2014, the first payment of the Holdback of $375,000 was paid to Seller. The Company incurred approximately $86,000 of acquisition costs, which were recorded as operating expenses in the Consolidated Statements of Operations.
At August 31, 2014, the acquisition was reflected in the consolidated financial statements as follows:
| (In thousands) | ||||
| Cash paid at closing |
$ | 9,086 | ||
| Accrued liabilities: |
||||
| Working capital adjustment |
63 | |||
| Holdback |
750 | |||
|
|
|
|||
| Total purchase price |
$ | 9,899 | ||
|
|
|
|||
Goodwill represents the amount by which the purchase price exceeds the fair value of the net assets acquired and has been allocated to the Food Ingredients segment. It is estimated that all of the goodwill associated with this acquisition is deductible for tax purposes. Goodwill represents the synergies and benefits to the Company from the combination of starch and gum technologies. Pro forma results of operations have not been included as the pro forma revenues and earnings were not significant to the historical periods. Sales of $5.1 million related to the acquired Gum Technology business were included in the Food Ingredients results of operations for the year ended August 31, 2014. Due to the integration of Gum Technology into the Food Ingredients segment, it is not practicable to determine the net earnings of Gum Technology included in the Consolidated Statements of Operations since the acquisition.
The acquisition of the net assets of Gum Technology was accounted for as a business combination under the acquisition method. The allocation of the purchase price to the assets acquired and liabilities assumed, based on their fair values as of March 25, 2014, is presented below. The purchase price allocation was finalized in the fourth quarter.
| (In thousands) |
Preliminary Allocation |
Adjustments | Final Allocation |
|||||||||
| Working capital |
$ | 2,133 | $ | (26 | ) | $ | 2,107 | |||||
| Non-compete agreement |
490 | (400 | ) | 90 | ||||||||
| Customer relationships |
2,600 | 200 | 2,800 | |||||||||
| Trade names/brand portfolio |
2,700 | — | 2,700 | |||||||||
| Goodwill |
1,934 | 217 | 2,151 | |||||||||
| Other assets |
51 | — | 51 | |||||||||
|
|
|
|
|
|
|
|||||||
| Total purchase price |
$ | 9,908 | $ | (9 | ) | $ | 9,899 | |||||
|
|
|
|
|
|
|
|||||||
The Company entered into compensatory stock option agreements outside of the Company’s 2006 Incentive Plan with three key former employees of the Seller. Pursuant to these agreements, the Company granted options to purchase an aggregate of 45,000 shares of the Company’s common stock at an exercise price equal to the closing price as of the close of business on March 25, 2014. These options have a term of seven years and vest ratably over a three-year period. Stock-based compensation for these options recognized in operating expense for the year ended August 31, 2014 was approximately $76,000.
The Company entered into a five-year non-competition agreement with Gum Technology and the former owners of Gum Technology. The fair value of the agreement is being amortized on a straight-line basis over the term of the agreement. Other intangible assets identified were customer relationships, which are being amortized
70
Table of Contents
on a straight-line basis over 13 years, and a trade name portfolio, which is an indefinite-lived asset. The trade name portfolio for gum products is well recognized, and the Company plans to use the portfolio of names indefinitely. The fair values of these intangible assets were calculated utilizing Level 3 inputs to discounted cash flow models.
Carolina Starches
On January 11, 2012, Penford Carolina, LLC, a Delaware limited liability company and a wholly-owned subsidiary of the Company, entered into an Amended and Restated Business Sale and Membership Interest Purchase Agreement providing for the purchase of Carolina Starches for $8.5 million in cash. Penford Carolina, LLC manufactures, markets and sells industrial cationic starches produced from potato, corn and tapioca into the paper and packaging industry. The acquisition of these businesses has provided an important source of raw material to support continued growth in the Food Ingredients business and has broadened the Company’s portfolio of specialty modified industrial starches.
Note 18 – Segment Reporting
Financial information for the Company’s two segments, Industrial Ingredients and Food Ingredients, is presented below. Industrial Ingredients and Food Ingredients are broad categories of end-market users served by the Company’s U.S. operations. The Food Ingredients segment produces specialty starches and gums for food applications. The Industrial Ingredients segment is a supplier of specialty starches to the paper, packaging and other industries, and is a producer of fuel grade ethanol. The Industrial Ingredients segment also sells the by-products from its corn wet milling manufacturing operations, primarily germ, fiber and gluten to customers who use these by-products as animal feed or to produce corn oil.
71
Table of Contents
A third category for “corporate and other” activity has been presented to provide a reconciliation to amounts reported in the consolidated financial statements. Corporate and other represents the activities related to the corporate headquarters, such as public company reporting, personnel costs of the executive management team, corporate-wide professional services and consolidation entries. The accounting policies of the reportable segments are the same as those described in Note 2. The Company’s assets and manufacturing operations are located in the United States.
| Year Ended August 31, | ||||||||||||
| 2014 | 2013 | 2012 | ||||||||||
| (Dollars in thousands) | ||||||||||||
| Sales |
||||||||||||
| Industrial ingredients |
||||||||||||
| Industrial starch |
$ | 158,379 | $ | 177,382 | $ | 156,945 | ||||||
| Ethanol |
96,718 | 96,852 | 101,874 | |||||||||
| By-products |
62,186 | 81,782 | 71,788 | |||||||||
|
|
|
|
|
|
|
|||||||
| $ | 317,283 | $ | 356,016 | $ | 330,607 | |||||||
| Food ingredients |
126,590 | 111,234 | 102,544 | |||||||||
|
|
|
|
|
|
|
|||||||
| $ | 443,873 | $ | 467,250 | $ | 433,151 | |||||||
|
|
|
|
|
|
|
|||||||
| Depreciation and amortization |
||||||||||||
| Industrial ingredients |
$ | 9,219 | $ | 10,933 | $ | 10,879 | ||||||
| Food ingredients |
2,260 | 2,061 | 1,989 | |||||||||
| Corporate and other |
335 | 332 | 1,259 | |||||||||
|
|
|
|
|
|
|
|||||||
| $ | 11,814 | $ | 13,326 | $ | 14,127 | |||||||
|
|
|
|
|
|
|
|||||||
| Income (loss) from operations |
||||||||||||
| Industrial ingredients |
$ | 2,587 | $ | (3,238 | ) | $ | (928 | ) | ||||
| Food ingredients |
24,345 | 23,265 | 21,591 | |||||||||
| Corporate and other |
(11,641 | ) | (10,623 | ) | (10,604 | ) | ||||||
|
|
|
|
|
|
|
|||||||
| $ | 15,291 | $ | 9,404 | $ | 10,059 | |||||||
|
|
|
|
|
|
|
|||||||
| Capital expenditures, net |
||||||||||||
| Industrial ingredients |
$ | 8,566 | $ | 8,997 | $ | 8,700 | ||||||
| Food ingredients |
4,428 | 5,202 | 5,446 | |||||||||
| Corporate and other |
— | — | — | |||||||||
|
|
|
|
|
|
|
|||||||
| $ | 12,994 | $ | 14,199 | $ | 14,146 | |||||||
|
|
|
|
|
|
|
|||||||
| August 31, | ||||||||
| 2014 | 2013 | |||||||
| (Dollars in thousands) | ||||||||
| Total assets |
||||||||
| Industrial ingredients |
$ | 135,973 | $ | 133,120 | ||||
| Food ingredients |
89,781 | 68,550 | ||||||
| Corporate and other |
13,436 | 22,948 | ||||||
|
|
|
|
|
|||||
| $ | 239,190 | $ | 224,618 | |||||
|
|
|
|
|
|||||
The net assets and results of operations since the acquisition of Gum Technology in March 2014 are reported in the Food Ingredients segment. The net assets of Carolina Starches, acquired in January 2012, are reported in the Food Ingredients segment. The results of operations from the Carolina Starches businesses are reported in the Industrial Ingredients segment.
72
Table of Contents
Reconciliation of income (loss) from operations for the Company’s segments to income (loss) before income taxes as reported in the consolidated financial statements follows:
| Year Ended August 31, | ||||||||||||
| 2014 | 2013 | 2012 | ||||||||||
| (Dollars in thousands) | ||||||||||||
| Income from operations |
$ | 15,291 | $ | 9,404 | $ | 10,059 | ||||||
| Interest expense |
(3,583 | ) | (3,989 | ) | (8,633 | ) | ||||||
| Other non-operating income (expense) |
766 | 75 | (6,186 | ) | ||||||||
|
|
|
|
|
|
|
|||||||
| Income (loss) before income taxes |
$ | 12,474 | $ | 5,490 | $ | (4,760 | ) | |||||
|
|
|
|
|
|
|
|||||||
Sales, attributed to the area to which the product was shipped, were as follows:
| Year Ended August 31, | ||||||||||||
| 2014 | 2013 | 2012 | ||||||||||
| (Dollars in thousands) | ||||||||||||
| United States |
$ | 408,253 | $ | 429,957 | $ | 400,070 | ||||||
|
|
|
|
|
|
|
|||||||
| Canada |
9,932 | 8,662 | 5,653 | |||||||||
| Mexico |
11,360 | 11,419 | 12,761 | |||||||||
| Columbia |
6,211 | 7,379 | 6,678 | |||||||||
| Japan |
1,591 | 5,112 | 4,380 | |||||||||
| Other |
6,526 | 4,721 | 3,609 | |||||||||
|
|
|
|
|
|
|
|||||||
| Non-United States |
35,620 | 37,293 | 33,081 | |||||||||
|
|
|
|
|
|
|
|||||||
| Total |
$ | 443,873 | $ | 467,250 | $ | 433,151 | ||||||
|
|
|
|
|
|
|
|||||||
Note 19 – Quarterly Financial Data (Unaudited)
The following tables set forth selected unaudited consolidated quarterly financial information for the Company’s two most recent fiscal years:
| Fiscal 2014 |
First Quarter |
Second Quarter |
Third Quarter |
Fourth Quarter |
Total | |||||||||||||||
| (Dollars in thousands, except per share data) | ||||||||||||||||||||
| Sales |
$ | 109,251 | $ | 106,107 | $ | 119,429 | $ | 109,086 | $ | 443,873 | ||||||||||
| Cost of sales |
98,542 | 93,938 | 104,561 | 92,525 | 389,566 | |||||||||||||||
|
|
|
|
|
|
|
|
|
|
|
|||||||||||
| Gross margin |
10,709 | 12,169 | 14,868 | 16,561 | 54,307 | |||||||||||||||
| Net income |
$ | 488 | $ | 1,240 | $ | 3,071 | $ | 2,954 | $ | 7,753 | ||||||||||
| Earnings per common share: |
||||||||||||||||||||
| Basic |
$ | 0.04 | $ | 0.10 | $ | 0.24 | $ | 0.23 | $ | 0.62 | ||||||||||
| Diluted |
$ | 0.04 | $ | 0.10 | $ | 0.24 | $ | 0.23 | $ | 0.60 | ||||||||||
| Dividends declared |
$ | — | $ | — | $ | — | $ | — | $ | — | ||||||||||
| Fiscal 2013 |
First Quarter |
Second Quarter |
Third Quarter |
Fourth Quarter |
Total | |||||||||||||||
| (Dollars in thousands, except per share data) | ||||||||||||||||||||
| Sales |
$ | 118,022 | $ | 110,082 | $ | 121,719 | $ | 117,427 | $ | 467,250 | ||||||||||
| Cost of sales |
104,764 | 99,081 | 108,528 | 109,830 | 422,203 | |||||||||||||||
|
|
|
|
|
|
|
|
|
|
|
|||||||||||
| Gross margin |
13,258 | 11,001 | 13,191 | 7,597 | 45,047 | |||||||||||||||
| Net income (loss) |
$ | 1,707 | $ | 1,191 | $ | 2,058 | $ | (949 | ) | $ | 4,007 | |||||||||
| Earnings (loss) per common share: |
||||||||||||||||||||
| Basic |
$ | 0.14 | $ | 0.10 | $ | 0.17 | $ | (0.08 | ) | $ | 0.32 | |||||||||
| Diluted |
$ | 0.14 | $ | 0.10 | $ | 0.16 | $ | (0.08 | ) | $ | 0.32 | |||||||||
| Dividends declared |
$ | — | $ | — | $ | — | $ | — | $ | — | ||||||||||
73
Table of Contents
Note 20 – Legal Proceedings and Contingencies
The Company regularly evaluates the status of claims and legal proceedings in which it is involved in order to assess whether a loss is probable or there is a reasonable possibility that a loss may have been incurred, and to determine if accruals are appropriate. The Company expenses legal costs as such costs are incurred.
Pet Product Patent Litigation (T.F.H. Publications, Inc. v. Penford Products Co. et al)
In June 2011, the Company was notified that a complaint had been filed against a customer of a Company subsidiary, Penford Products, Co., in the United States District Court for the District of New Jersey. The complaint alleged that certain pet products supplied by Penford Products to the customer infringed upon a patent owned by T.F.H. Publications, Inc. The customer tendered the defense of this lawsuit to Penford Products pursuant to the terms of its supply agreement with Penford Products. Penford Products thereafter commenced the defense of this litigation on behalf of the customer. In April 2012, the plaintiff filed an amended complaint alleging that certain additional products made by Penford Products for the same customer infringed upon two of the plaintiff’s patents. In November 2013, the plaintiff filed another amended complaint adding Penford Products as a defendant in the suit. The Plaintiff is seeking an injunction against infringement of its patents, as well as the recovery of an unspecified amount of damages.
The court held a claim construction hearing on August 7, 2013, and rendered an opinion dated April 30, 2014. The Company believes that the court’s opinion substantially supports its position that none of the products supplied by Penford Products infringes upon the patents in the suit. The Company has recently entered into settlement negotiations with the plaintiff, but there can be no assurance that these negotiations will be successfully completed. If the negotiations fail, the Company will continue to evaluate further steps in order to obtain the dismissal of the litigation. The Company cannot at this time determine the likelihood of any outcome or estimate any damages that might be awarded.
Estate of Brett D. Brown (Heather A. Brown as Administrator for the Estate of Brett D. Brown v. Penford Corporation and Penford Products Co.)
In early October 2014, the Company was notified that a petition had been filed against it and its subsidiary company, Penford Products Co., in the Iowa District Court for Linn County by the Administrator for the Estate of Brett D. Brown alleging negligence by the Company in connection with the death of Brett D. Brown, a former employee of an electrical contractor for Penford Products, at the Company’s Cedar Rapids plant. The petition does not specify an amount of damages being sought. The Company expects to defend the matter and to deny all allegations of negligence or fault. Pursuant to an indemnification agreement, the Company has tendered the defense of this matter to Mr. Brown’s former employer, and, by virtue of the Company’s status as an additional insured, to the employer’s insurer. The Company cannot at this time determine the likelihood of any outcome or estimate any damages that might be awarded.
Merger Agreement Shareholder Litigation (David Pill, individually and on behalf of all others similarly situated v. Penford Corporation, Ingredion Incorporated, et al)
In early November 2014, the Company, its directors and others were served with a complaint purporting to institute a stockholder class action in the Superior Court of Washington, King County, in connection with the Agreement and Plan of Merger that the Company entered into with Ingredion Incorporated on October 14, 2014. The complaint alleges, among other things, breaches of fiduciary duties in connection with the proposed acquisition of the Company by Ingredion. The plaintiff seeks an injunction against the proposed transaction and unspecified damages. In addition to legal defenses, the Company believes that it has adequate insurance protection that is expected to provide coverage applicable to the defense of this matter.
Management is unable to provide additional information regarding any possible loss in connection with the foregoing claims and proceedings because (i) the Company currently believes that the claims are not adequately supported, and (ii) there are significant factual and/or legal issues to be resolved. With regard to these matters, management does not believe, based on currently available information, that the eventual outcomes will have a
74
Table of Contents
material adverse effect on the Company’s financial condition, results of operations or liquidity, although the outcomes could be material to the Company’s operating results for any particular period, depending, in part, upon the operating results for such period.
NewPage Bankruptcy Preference Litigation (Pirinate Consulting v. Penford Products Co. and Carolina Starches, LLC)
In late August and early September 2013, two of the Company’s subsidiaries, Penford Products and Carolina Starches, LLC, were served with separate complaints filed by Pirinate Consulting Group, LLC, as Litigation Trustee, for the NP Creditor Litigation Trust, as successor in interest to the bankruptcy estate of NewPage Corporation, an industrial starch customer of each subsidiary, in the United States Bankruptcy Court for the District of Delaware. The complaint against Carolina Starches was settled in March 2014 in exchange for a payment of $10,000. The complaint against Penford Products was settled in October 2014 in exchange for a payment of $50,000.
Other Claims and Litigation
The Company is involved from time to time in various other claims and litigation arising in the normal course of business. In the judgment of management, which relies in part on information obtained from the Company’s outside legal counsel, the ultimate resolution of these other matters will not materially affect the consolidated financial position, results of operations or liquidity of the Company.
Note 21 – Subsequent Event
On October 14, 2014, the Company, Ingredion Incorporated (“Ingredion”) and Prospect Sub, Inc., a wholly owned subsidiary of Ingredion, entered into an Agreement and Plan of Merger (the “Merger Agreement”) pursuant to which Ingredion will acquire the Company in an all-cash transaction valued at approximately $340 million in the aggregate. Upon the terms and conditions set forth in the Merger Agreement, Merger Sub will merge with and into the Company (the “Merger”), and the Company will become a wholly owned subsidiary of Ingredion.
Pursuant to the Merger Agreement, upon the closing of the Merger (the “Closing”), each outstanding share of the Company’s common stock, other than the shares owned directly or indirectly by Ingredion or Merger Sub (which will be cancelled) and shares with respect to which dissenter’s rights are properly exercised and not withdrawn under Washington law, will automatically be converted into the right to receive $19.00 in cash (the “Merger Consideration”), without interest and subject to any withholding of taxes required by applicable law. Each Company option outstanding immediately prior to the Merger, whether or not then vested and exercisable, will be cancelled and converted into the right to receive, for each share of common stock subject to such stock option, an amount in cash, without interest, equal to the excess, if any, of the Merger Consideration over the per share exercise price of such option. In addition, other issued and outstanding equity-based awards will be cancelled and converted into the right to receive, for each share of common stock payable thereunder, the Merger Consideration, without interest.
The consummation of the Merger is subject to customary closing conditions and covenants. The Merger Agreement also contains covenants that require the Company‘s Board of Directors to recommend that the Company’s shareholders approve the Merger Agreement. The Merger Agreement provides certain termination rights for the Company, Ingredion and Merger Sub, including (i) the Company’s right to terminate the Merger Agreement in order to enter into an acquisition agreement with respect to a superior acquisition proposal after complying with certain obligations; (ii) Ingredion’s ability to terminate the Merger Agreement if there is a change of recommendation by the Company’s board; and (iii) the Company’s and Ingredion’s right to termination the Merger Agreement if the Merger has not been consummated by the outside date, including due to anti-trust regulatory reasons. In connection with the termination of the Merger Agreement under specified circumstances, the Company will be required to pay Ingredion a termination fee equal to approximately $7.6 million. In the event the Company’s shareholders do not approve the Merger and the Merger Agreement is terminated, the Company will be required to pay Ingredion a fee equal to $2.0 million, which is intended for expenses.
75
Table of Contents
Report of Independent Registered Public Accounting Firm
The Board of Directors and Shareholders
Penford Corporation:
We have audited the accompanying consolidated balance sheets of Penford Corporation and subsidiaries (the Company) as of August 31, 2014 and 2013, and the related consolidated statements of operations, comprehensive income (loss), cash flows, and shareholders’ equity for each of the years in the three-year period ended August 31, 2014. These consolidated financial statements are the responsibility of the Company’s management. Our responsibility is to express an opinion on these consolidated financial statements based on our audits.
We conducted our audits in accordance with the standards of the Public Company Accounting Oversight Board (United States). Those standards require that we plan and perform the audit to obtain reasonable assurance about whether the financial statements are free of material misstatement. An audit includes examining, on a test basis, evidence supporting the amounts and disclosures in the financial statements. An audit also includes assessing the accounting principles used and significant estimates made by management, as well as evaluating the overall financial statement presentation. We believe that our audits provide a reasonable basis for our opinion.
In our opinion, the consolidated financial statements referred to above present fairly, in all material respects, the financial position of Penford Corporation and subsidiaries as of August 31, 2014 and 2013, and the results of their operations and their cash flows for each of the years in the three-year period ended August 31, 2014, in conformity with U.S. generally accepted accounting principles.
We also have audited, in accordance with the standards of the Public Company Accounting Oversight Board (United States), the Company’s internal control over financial reporting as of August 31, 2014, based on criteria established in Internal Control – Integrated Framework (1992) issued by the Committee of Sponsoring Organizations of the Treadway Commission (COSO), and our report dated November 13, 2014 expressed an adverse opinion on the effectiveness of the Company’s internal control over financial reporting.
/s/ KPMG LLP
Denver, Colorado
November 13, 2014
76
Table of Contents
Report of Independent Registered Public Accounting Firm
The Board of Directors and Shareholders
Penford Corporation:
We have audited Penford Corporation and subsidiaries’ (the Company) internal control over financial reporting as of August 31, 2014, based on criteria established in Internal Control – Integrated Framework (1992) issued by the Committee of Sponsoring Organizations of the Treadway Commission (COSO). The Company’s management is responsible for maintaining effective internal control over financial reporting and for its assessment of the effectiveness of internal control over financial reporting included in the accompanying Management’s Report on Internal Control over Financial Reporting (Item 9A(b)). Our responsibility is to express an opinion on the Company’s internal control over financial reporting based on our audit.
We conducted our audit in accordance with the standards of the Public Company Accounting Oversight Board (United States). Those standards require that we plan and perform the audit to obtain reasonable assurance about whether effective internal control over financial reporting was maintained in all material respects. Our audit included obtaining an understanding of internal control over financial reporting, assessing the risk that a material weakness exists, and testing and evaluating the design and operating effectiveness of internal control based on the assessed risk. Our audit also included performing such other procedures as we considered necessary in the circumstances. We believe that our audit provides a reasonable basis for our opinion.
A company’s internal control over financial reporting is a process designed to provide reasonable assurance regarding the reliability of financial reporting and the preparation of financial statements for external purposes in accordance with generally accepted accounting principles. A company’s internal control over financial reporting includes those policies and procedures that (1) pertain to the maintenance of records that, in reasonable detail, accurately and fairly reflect the transactions and dispositions of the assets of the company; (2) provide reasonable assurance that transactions are recorded as necessary to permit preparation of financial statements in accordance with generally accepted accounting principles, and that receipts and expenditures of the company are being made only in accordance with authorizations of management and directors of the company; and (3) provide reasonable assurance regarding prevention or timely detection of unauthorized acquisition, use, or disposition of the company’s assets that could have a material effect on the financial statements.
Because of its inherent limitations, internal control over financial reporting may not prevent or detect misstatements. Also, projections of any evaluation of effectiveness to future periods are subject to the risk that controls may become inadequate because of changes in conditions, or that the degree of compliance with the policies or procedures may deteriorate.
A material weakness is a deficiency, or a combination of deficiencies, in internal control over financial reporting, such that there is a reasonable possibility that a material misstatement of the company’s annual or interim financial statements will not be prevented or detected on a timely basis. A material weakness related to resources necessary for effective internal control over financial reporting has been identified and included in management’s assessment.
We also have audited, in accordance with the standards of the Public Company Accounting Oversight Board (United States), the consolidated balance sheets of the Company as of August 31, 2014 and 2013, and the related consolidated statements of operations, comprehensive income (loss), cash flows, and shareholders’ equity for each of the years in the three-year period ended August 31, 2014. This material weakness was considered in determining the nature, timing, and extent of audit tests applied in our audit of the 2014 consolidated financial statements, and this report does not affect our report dated November 13, 2014, which expressed an unqualified opinion on those consolidated financial statements.
In our opinion, because of the effect of the aforementioned material weakness on the achievement of the objectives of the control criteria, the Company has not maintained effective internal control over financial reporting as of August 31, 2014, based on criteria established in Internal Control – Integrated Framework (1992) issued by COSO.
77
Table of Contents
The Company acquired Gum Technology during 2014, and management excluded from its assessment of the effectiveness of the Company’s internal control over financial reporting as of August 31, 2014, Gum Technology’s internal control over financial reporting associated with total assets of $11.0 million and total revenues of $5.1 million included in the consolidated financial statements of the Company as of and for the year ended August 31, 2014. Our audit of internal control over financial reporting of the Company also excluded an evaluation of the internal control over financial reporting of Gum Technology.
/s/ KPMG LLP
Denver, Colorado
November 13, 2014
78
Table of Contents
| Item 9. | Changes in and Disagreements with Accountants on Accounting and Financial Disclosure |
Not applicable.
| Item 9A. | Controls and Procedures |
(a) Evaluation of Disclosure Controls and Procedures
The Company has established disclosure controls and procedures to ensure that the information required to be disclosed by the Company in the reports that it files or submits under the Exchange Act is recorded, processed, summarized and reported within the time periods specified in Securities and Exchange Commission rules and forms and that such information is accumulated and communicated to management of the Company, with the participation of its Chief Executive Officer and Chief Financial Officer (“Certifying Officers”), as appropriate, to allow timely decisions regarding required disclosure.
Management of the Company, with the participation and supervision of its Certifying Officers, evaluated the effectiveness of the design and operation of its disclosure controls and procedures pursuant to Exchange Act Rule 13a-15(b). Based on the evaluation as of August 31, 2014, management has concluded that the Company’s disclosure controls and procedures were not effective because of the material weakness in the Company’s internal control over financial reporting described below.
(b) Management’s Report on Internal Control Over Financial Reporting
Management is responsible for establishing and maintaining adequate internal control over financial reporting for the Company. Internal control over financial reporting, as defined in Rules 13a-15(f) and 15d-15(f) under the Exchange Act, is a process designed by, or under the supervision of, the chief executive officer and chief financial officer, or persons performing similar functions, and effected by the board of directors, management and other personnel, to provide reasonable assurance regarding the reliability of the Company’s financial reporting for external purposes in accordance with accounting principles generally accepted in the United States of America. Internal control over financial reporting includes (i) maintaining records that in reasonable detail accurately and fairly reflect the Company’s transactions; (ii) providing reasonable assurance that transactions are recorded as necessary for preparation of the Company’s financial statements; (iii) providing reasonable assurance that receipts and expenditures of the Company’s assets are made in accordance with management’s authorization; and (iv) providing reasonable assurance that unauthorized acquisition, use or disposition of the Company’s assets that could have a material effect on the financial statements would be prevented or detected on a timely basis. Because of its inherent limitations, internal control over financial reporting may not prevent or detect misstatements. Also, projections of any evaluation of effectiveness to future periods are subject to the risk that controls may become inadequate because of changes in conditions, or that the degree of compliance with the policies or procedures may deteriorate. Accordingly, even effective internal control over financial reporting can only provide reasonable assurance of achieving their control objectives.
Under the supervision and with the participation of management, including the certifying officers, the Company conducted an evaluation of the effectiveness of its internal control over financial reporting. In making this assessment, management used the criteria set forth by the Committee of Sponsoring Organizations of the Treadway Commission (“COSO”) in Internal Control – Integrated Framework (1992). The Company acquired Gum Technology during 2014, and management excluded from its assessment of the effectiveness of the Company’s internal control over financial reporting as of August 31, 2014, Gum Technology’s internal control over financial reporting associated with total assets of $11.0 million and total revenues of $5.1 million included in the Consolidated Financial Statements of the Company as of and for the year ended August 31, 2014. Based on the evaluation performed, management identified the following material weakness in its internal control over financial reporting as of August 31, 2014. A material weakness, as defined in Rule 12b-2 under the Exchange Act, is a deficiency, or combination of deficiencies, in internal control over financial reporting such that there is a reasonable possibility that a material misstatement of the company’s annual or interim financial statements will not be prevented or detected on a timely basis.
79
Table of Contents
Material Weakness Identified Relating to Resources Necessary for Effective Internal Control Over Financial Reporting
The Company determined a material weakness related to the monitoring and implementation of internal controls over financial reporting existed. Specifically, the Company lacks sufficient resources to have an effective control function that involves assessments of risk at an appropriate level of detail, controls designed with the right level of precision and responsive to those risks, and control implementation, including evidence of operating effectiveness. This material weakness resulted in a misstatement in accounting for corn hedges that was corrected prior to the issuance of the Company’s financial statements. Furthermore, a reasonable possibility exists that material misstatements in the Company’s financial statements will not be prevented or detected on a timely basis.
Because of the above described material weakness in internal control over financial reporting, management concluded that its internal control over financial reporting was not effective as of August 31, 2014.
KPMG LLP, an independent registered public accounting firm, has audited the Consolidated Financial Statements included in this Annual Report on Form 10-K and, as part of its audit, has issued an audit report on the effectiveness of the Company’s internal control over financial reporting, which is included in Item 8 of this Form 10-K.
(c) Remediation of Previously Disclosed Material Weaknesses
In connection with the evaluation of internal control over financial reporting as of August 31, 2013, the Company identified that a material weakness in internal control over financial reporting existed relating to the effective design of controls over the accuracy of prices used to value ending inventory.
To remediate this material weakness in the Company’s internal control over financial reporting relating to inventory, the Company implemented additional quarterly and monthly procedures to review and ensure the accuracy of prices used to value ending inventory, to reconcile inventory held at third party locations and to properly resolve related reconciling items.
The Company has completed the documentation and testing of the design and effectiveness of the corrective actions described above and, as of August 31, 2014, has concluded that the previously disclosed material weakness related to inventory has been remediated as of August 31, 2014.
(d) Changes in Internal Controls over Financial Reporting
Other than the remediation of the previously reported material weaknesses relating to inventory noted above, there were no significant changes in the Company’s internal control over financial reporting that occurred during the quarter ended August 31, 2014 that have materially affected, or are reasonably likely to materially affect, the Company’s internal control over financial reporting.
(e) Management’s Plans for Remediation of the Material Weakness
Management is continuing its efforts to implement effective controls throughout the organization, which efforts include additional training of key control owners, reassigning some key controls to different owners and retaining external expertise. During 2014, the Company retained a number of new resources throughout the organization in its efforts to sufficiently promote effective internal control over financial reporting. As of August 31, 2014, management has concluded that the Company has completed and documented its assessments of risk at an appropriate level of detail and designed controls with the right level of precision and responsive to those risks. As the Company implements these plans, management may determine that additional steps may be necessary to remediate the material weakness.
80
Table of Contents
| Item 9B. | Other Information |
On November 10, 2014, the Company’s Board of Directors and its Executive Compensation and Development Committee approved the payment of bonuses to the Company’s salaried employees, including bonuses to the Company’s named executive officers. The following bonuses were awarded to named executives: Mr. Malkoski, $475,000; Mr. Cordier, $205,000; Mr. Kortemeyer, $120,000; Mr. Randall, $135,000; and Mr. Lawlor, $135,000.
81
Table of Contents
PART III
| Item 10. | Directors, Executive Officers and Corporate Governance |
The applicable information set forth under the headings “Election of Directors,” “Governance of the Company,” and “Section 16(a) Beneficial Ownership Reporting Compliance” in the definitive Proxy Statement for the 2015 Annual Meeting of Shareholders (the “2015 Proxy Statement”), to be filed not later than 120 days after the end of the fiscal year covered by this report, will be incorporated herein by reference or such information will be included in an amendment to this Annual Report. Information regarding the Executive Officers of the Registrant is set forth in Part I, Item 1 of this Annual Report.
The Company has adopted a Code of Business Conduct and Ethics (the “Code”) that is applicable to all members of the Board of Directors, all officers, including the Chief Executive Officer, Chief Financial Officer and Vice President of Accounting, as well as all other employees. This Code embodies the commitment of the Company and its subsidiaries to conduct business in accordance with the highest ethical standards and applicable laws, rules and regulations. The Code is available on the Company’s Internet site at www.penx.com under the Investor Center section.
| Item 11. | Executive Compensation |
The applicable information set forth under the headings “Compensation Discussion and Analysis,” “Executive Compensation,” “Director Compensation,” and “Governance of the Company” and “Report of the Executive Compensation and Development Committee” in the 2015 Proxy Statement will be incorporated herein by reference or such information will be included in an amendment to this Annual Report.
| Item 12. | Security Ownership of Certain Beneficial Owners and Management and Related Stockholder Matters |
The applicable information set forth under the heading “Ownership of Company Stock” in the 2015 Proxy Statement will be incorporated herein by reference or such information will be included in an amendment to this Annual Report.
Securities Authorized for Issuance under Equity Compensation Plans
The following table provides information regarding Penford’s equity compensation plans at August 31, 2014. Equity compensation not approved by security holders represents compensatory stock options granted to the former owners of Carolina Starches and key employees of Gum Technology. See Note 10 to the Consolidated Financial Statements.
Equity Compensation Plan Information Table
| Plan category |
(a) Number of securities to be issued upon exercise of outstanding options, warrants and rights |
(b) Weighted- average exercise price of outstanding options, warrants and rights |
(c) Number of securities remaining available for future issuance under equity compensation plans (excluding securities reflected in column (a)) |
|||||||||
| Equity compensation plans approved by security holders: |
||||||||||||
| 1994 Stock Option Plan (1) |
219,875 | $ | 15.16 | — | ||||||||
| 2006 Long-Term Incentive Plan (2) |
1,136,625 | $ | 9.47 | 176,542 | ||||||||
|
|
|
|
|
|||||||||
| Total |
1,356,500 | $ | 10.39 | 176,542 | ||||||||
|
|
|
|
|
|||||||||
| Equity compensation not approved by security holders: |
||||||||||||
| Stock options to owners of acquired businesses |
72,500 | $ | 10.88 | — | ||||||||
82
Table of Contents
| (1) | This plan has been terminated and no additional options are available for grant. The options that are subsequently forfeited or not exercised are available for issuance under the 2006 Long-Term Incentive Plan. |
| (2) | Shares available for issuance under the 2006 Long-Term Incentive Plan can be granted pursuant to stock options, stock appreciation rights, restricted stock or units or performance-based cash awards. Does not include 173,060 issued but unvested shares of common stock at August 31, 2014. |
Material Terms of Stock Options to Owners and Key Employees of Acquired Businesses. On January 11, 2012, in connection with the Company’s acquisition of the Carolina Starches businesses, the Company entered into stock option agreements with R. Bentley Cheatham, Dwight L. Carlson and Steven P. Brower, the former owners of Carolina Starches. Pursuant to these agreements, Penford granted each such individual nonqualified stock options to purchase up to 27,500 shares of the Company’s common stock, $1.00 par value per share, at an exercise price equal to the closing price as of the close of business on January 11, 2012. Each stock option grant was approved by a majority of the Company’s independent directors, and was granted as an inducement material to each recipient’s entering into employment with a subsidiary of the Company in accordance with Nasdaq Listing Rule 5635(c)(4). Pursuant to the terms of the stock option agreements, the options have a term of seven years and will vest over a two-year period, with one-half of the options vesting on the first anniversary of the grant date and the remainder becoming vested on the second anniversary of the grant date, provided that the recipient has not been terminated by the Company for cause or resigned by such date. The vesting of these options will accelerate and the award will become exercisable in full effectively immediately prior to a change of control of the Company. At August 31, 2014, 27,500 of these options were outstanding.
On March 25, 2014, in connection with the Company’s acquisition of the net assets of Gum Technology, the Company entered into stock option agreements with three key former employees of Gum Technology. Pursuant to these agreements, Penford granted these individuals nonqualified stock options to purchase up to 45,000 shares of the Company’s common stock, $1.00 par value per share, at an exercise price equal to the closing price as of the close of business on March 25, 2014. Each stock option grant was approved by a majority of the Company’s independent directors, and was granted as an inducement material to each recipient’s entering into employment with a subsidiary of the Company in accordance with Nasdaq Listing Rule 5635(c)(4). Pursuant to the terms of the stock option agreements, the options have a term of seven years and will vest over a three-year period, with one-third of the options vesting on each of the first three anniversaries of the grant date, provided that the recipient has not been terminated by the Company for cause or resigned by such date. The vesting of these options will accelerate and the award will become exercisable in full effectively immediately prior to a change of control of the Company. At August 31, 2014, all of these options were outstanding.
| Item 13. | Certain Relationships and Related Transactions, and Director Independence |
The applicable information relating to certain relationships and related transactions of the Company will be set forth under the heading “Transactions with Related Persons” in the 2015 Proxy Statement and will be incorporated herein by reference or such information will be included in an amendment to this Annual Report. Information related to director independence will be set forth under the heading of “Governance of the Company” and “Election of Directors” in the 2015 Proxy Statement and will be incorporated herein by reference or such information will be included in an amendment to this Annual Report.
| Item 14. | Principal Accountant Fees and Services |
The applicable information concerning principal accountant fees and services appears under the heading “Fees Paid to KPMG LLP” in the 2015 Proxy Statement and is incorporated herein by reference.
83
Table of Contents
PART IV
| Item 15. | Exhibits and Financial Statement Schedules |
(a)(1) Financial Statements
Financial statements required to be filed for the registrant under Items 8 or 15 are included in Part II, Item 8.
(2) Financial Statement Schedules
All schedules for which provision is made in the applicable accounting regulations of the Securities and Exchange Commission are omitted because they are not applicable or the information is included in the Consolidated Financial Statements in Part II, Item 8.
(3) Exhibits
See index to Exhibits on page 85.
(b) Exhibits
See Item 15(a)(3) above.
(c) Financial Statement Schedules
None.
84
Table of Contents
Pursuant to the requirements of Section 13 or 15(d) of the Securities Exchange Act of 1934, the registrant has duly caused this report to be signed on its behalf by the undersigned, thereunto duly authorized, on this 13th day of November, 2014.
| PENFORD CORPORATION |
| /s/ Thomas D. Malkoski |
| Thomas D. Malkoski |
| President and Chief Executive Officer |
Pursuant to the requirements of the Securities Exchange Act of 1934, this report has been signed below by the following persons on behalf of the registrant and in the capacities indicated below on November 13, 2014.
| Signature |
Title | |
| /s/ Thomas D. Malkoski |
President, Chief Executive Officer and Director (Principal Executive Officer) | |
| Thomas D. Malkoski | ||
| /s/ Steven O. Cordier |
Senior Vice President and Chief Financial Officer (Principal Financial and Accounting Officer) | |
| Steven O. Cordier | ||
| /s/ Paul H. Hatfield |
Chairman of the Board of Directors | |
| Paul H. Hatfield | ||
| /s/ Evan Behrens |
Director | |
| Evan Behrens | ||
| /s/ William E. Buchholz |
Director | |
| William E. Buchholz | ||
| /s/ Jeffrey T. Cook |
Director | |
| Jeffrey T. Cook | ||
| /s/ R. Randolph Devening |
Director | |
| R. Randolph Devening | ||
| /s/ John C. Hunter III |
Director | |
| John C. Hunter III | ||
| /s/ Sally G. Narodick |
Director | |
| Sally G. Narodick | ||
| /s/ Edward F. Ryan |
Director | |
| Edward F. Ryan | ||
| /s/ James E. Warjone |
Director | |
| James E. Warjone | ||
| /s/ Matthew Zell |
Director | |
| Matthew Zell | ||
85
Table of Contents
Exhibits identified in parentheses below, on file with the Securities and Exchange Commission, are incorporated by reference. Copies of exhibits can be obtained at no cost by writing to Penford Corporation, 7094 S. Revere Parkway, Centennial, Colorado 80112.
| Exhibit No. |
Item | |
| 2.1 | Agreement and Plan of Merger by and among the Company, Ingredion and Merger Sub, dated as of October 14, 2014 (filed as an exhibit to Registrant’s File No. 000-11488, Form 8-K dated October 14, 2014, filed October 15, 2014). Certain schedules referenced in the Agreement and Plan of Merger have been omitted in accordance with Item 601(b)(2) of Regulation S-K. A copy of any omitted schedule will be furnished supplementally to the SEC upon request. | |
| 3.1 | Restated and Amended Articles of Incorporation, as amended (filed as an exhibit to Registrant’s File No. 000-11488, Form 10-K for the fiscal year ended August 31, 2006) | |
| 3.2 | Amended and Restated Bylaws (filed as an exhibit to Registrant’s File No. 000-11488, Form 10-K for the fiscal year ended August 31, 2012) | |
| 3.3 | Articles of Amendment of Penford Corporation for Series A 15% Cumulative Non-Voting Non-Convertible Preferred Stock (filed as an exhibit to Registrant’s File No. 000-11488, Form 8-K dated April 6, 2010, filed April 9, 2010) | |
| 3.4 | Articles of Amendment of Penford Corporation for Series B Voting Convertible Preferred Stock (filed as an exhibit to Registrant’s File No. 000-11488, Form 8-K dated April 6, 2010, filed April 9, 2010) | |
| 10.1 | Penford Corporation Deferred Compensation Plan, amended and restated as of January 1, 2005 (filed as an exhibit to Registrant’s File No. 000-11488, Form 10-K for the year ended August 31, 2007, filed November 9, 2007) * | |
| 10.2 | Form of Change of Control Agreement and Annexes between Penford Corporation and Messrs. Cordier, Kortemeyer, Lawlor, Malkoski and Randall and certain other key employees (a representative copy of these agreements is filed as an exhibit to Registrant’s File No. 000-11488, Form 10-Q for the quarter ended February 28, 2006, filed April 10, 2006)* | |
| 10.3 | Form of Amendment to Change in Control Agreement (filed as an exhibit to Registrant’s File No. 000-11488, Form 10-Q for the quarter ended November 30, 2008, filed January 9, 2009)* | |
| 10.4 | Form of Second Amendment to Change in Control Agreement (filed as an exhibit to Registrant’s File No. 000-11488, Form 10-K for the year ended August 31, 2010, filed November 12, 2010)* | |
| 10.5 | Penford Corporation 1993 Non-Employee Director Restricted Stock Plan (filed as an exhibit to Registrant’s File No. 000-11488, Form 10-Q for the quarter ended November 30, 1993)* | |
| 10.6 | Penford Corporation 1994 Stock Option Plan as amended and restated as of January 8, 2002 (filed as an exhibit to Registrant’s File No. 000-11488, Proxy Statement filed with the Commission on January 18, 2002)* | |
| 10.7 | Penford Corporation Stock Option Plan for Non-Employee Directors (filed as a exhibit to Registrant’s File No. 000-11488, Form 10-Q for the quarter ended May 31, 1996, filed July 15, 1996)* | |
| 10.8 | Penford Corporation 2006 Long-Term Incentive Plan (incorporated by reference to Appendix A to Registrant’s File No. 000-11488, Proxy Statement filed December 20, 2005)* | |
| 10.9 | Form of Penford Corporation’s 2006 Long-Term Incentive Plan Stock Option Grant Notice, including the Stock Option Agreement and Notice of Exercise (incorporated by reference to the exhibits to the Registrant’s File No. 000-11488, Current Report on Form 8-K filed February 21, 2006)* | |
86
Table of Contents
| Exhibit No. |
Item | |
| 10.10 | Form of Penford Corporation 2006 Long-Term Incentive Plan Restricted Stock Award Notice and Agreement (filed as an exhibit to Registrant’s File No. 000-11488, Form 10-K for the year ended August 31, 2007, filed November 9, 2007) * | |
| 10.11 | Penford Corporation 2006 Long-Term Incentive Plan, as amended (incorporated by reference to Appendix A to Registrant’s File No. 000-11488, Proxy Statement filed December 21, 2011)* | |
| 10.12 | Second Amended and Restated Credit Agreement dated as of October 5, 2006 (filed as an exhibit to Registrant’s File No. 000-11488, Form 8-K dated October 5, 2006, filed October 10, 2006) | |
| 10.13 | First Amendment to Second Amended and Restated Credit Agreement (filed as an exhibit to Registrant’s File No. 000-11488, Form 10-Q for the quarter ended May 31, 2008, filed July 10, 2008) | |
| 10.14 | Second Amendment to Second Amended and Restated Credit Agreement, Resignation of Agent and Appointment of Successor Agent dated as of February 26, 2009 (filed as an exhibit to Registrant’s File No. 000-11488, Form 8-K dated February 26, 2009, filed March 3, 2009) | |
| 10.15 | Third Amendment to Second Amended and Restated Credit Agreement (filed as an exhibit to Registrant’s File No. 000-11488, Form 10-Q for the quarter ended May 31, 2009, filed July 10, 2009) | |
| 10.16 | Director Special Assignments Policy dated August 26, 2005 (filed as an exhibit to Registrant’s File No. 000-11488, Form 8-K dated August 26, 2005, filed September 1, 2005)* | |
| 10.17 | Non-Employee Director Compensation Term Sheet (filed as an exhibit to Registrant’s File No. 000-11488, Form 10-K for the year ended August 31, 2007, filed November 9, 2007) * | |
| 10.18 | Form of Performance-Based Cash Award Agreement under the 2006 Long-Term Incentive Plan (filed as an exhibit to Registrant’s File No. 000-11488, Form 10-Q for the quarter ended November 30, 2009, filed January 8, 2010) * | |
| 10.19 | Securities Purchase Agreement by and between Penford Corporation and Zell Credit Opportunities Master Fund, L.P., dated April 7, 2010 (filed as an exhibit to Registrant’s File No. 000-11488, Form 8-K dated April 6, 2010, filed April 9, 2010) | |
| 10.20 | Investor Rights Agreement by and between Penford Corporation and Zell Credit Opportunities Master Fund, L.P., dated April 7, 2010 (filed as an exhibit to Registrant’s File No. 000-11488, Form 8-K dated April 6, 2010, filed April 9, 2010) | |
| 10.21 | Standstill Letter Agreement by and between Penford Corporation and Zell Credit Opportunities Master Fund, L.P., dated April 7, 2010 (filed as an exhibit to Registrant’s File No. 000-11488, Form 8-K dated April 6, 2010, filed April 9, 2010) | |
| 10.22 | Third Amended and Restated Credit Agreement among the Company, Penford Products Co., Bank of Montreal, Bank of America National Association and Cooperatieve Centrale Raiffeisen-Boerenleenbank B.A., “Rabobank Nederland” New York Branch, dated April 7, 2010 (filed as an exhibit to Registrant’s File No. 000-11488, Form 8-K dated April 6, 2010, filed April 9, 2010) | |
| 10.23 | Fourth Amended and Restated Credit Agreement dated July 9, 2012 among the Company, certain of its subsidiary companies, and the following banks; Bank of Montreal, as Administrative Agent; Cooperatieve Centrale Raiffeisen-Boerenleenbank B.A., “Rabobank Nederland” New York Branch, as Syndication Agent; JPMorgan Chase, N.A. and KeyBank National Association, as Co-Documentation Agents; First Midwest Bank; Bank of America National Association; Greenstone Farm Credit Services, ACA; and Private Bank and Trust Company (filed as an exhibit to Registrant’s File No. 000-11488, Form 8-K dated July 9, 2012, filed July 11, 2012) | |
87
Table of Contents
| Exhibit No. |
Item | |
| 10.24 | Amended and Restated Business Sale and Membership Interest Purchase Agreement between the Company and each of R. Bentley Cheatham, Dwight Carlson, Steven P. Brower, Keystone Starches, LLC, 7675 South Rail Road, LLC, and 1 Freas Avenue, LLC (filed as an exhibit to Registrant’s File No. 000-11488, Form 8-K dated November 8, 2011, filed January 10, 2012) | |
| 10.25 | Form of Stock Option Agreement with each of R. Bentley Cheatham, Dwight Carlson and Steven P. Brower (filed as an exhibit to Registrant’s Registration Statement on Form S-8 (File No. 333-182753), filed on July 19, 2012)* | |
| 10.26 | Credit Agreement dated as of August 1, 2014 among the Company, certain of its subsidiaries, and the following banks: Cooperatieve Centrale Raiffeisen-Boerenleenbank B. A., “Rabobank Nederland,” New York Branch, as Administrative Agent; KeyBank National Association, as Syndication Agent; JPMorgan Chase Bank, N.A. and The Private Bank and Trust Company, as Co-Documentation Agents; First Midwest Bank; GreenStone Farm Credit Services, ACA; Branch Banking and Trust Company; AgStar Financial Services PCA and Farm Credit Services of America, PCA (filed as an exhibit to Registrant’s File No. 000-11488, Form 8-K dated August 1, 2014, filed August 4, 2014) | |
| 10.27 | Delayed Draw Term Loan Credit Agreement dated as of August 1, 2014 among the Company, certain of its subsidiaries, and Cooperatieve Centrale Raiffeisen-Boerenleenbank B. A., “Rabobank Nederland,” New York Branch, as Administrative Agent and lender (filed as an exhibit to Registrant’s File No. 000-11488, Form 8-K dated August 1, 2014, filed August 4, 2014) | |
| 21 | Subsidiaries of the Registrant | |
| 23 | Consent of KPMG LLP | |
| 24 | Power of Attorney | |
| 31.1 | Certifications of Chief Executive Officer pursuant to Section 302 of the Sarbanes-Oxley Act of 2002 | |
| 31.2 | Certifications of Chief Financial Officer pursuant to Section 302 of the Sarbanes-Oxley Act of 2002 | |
| 32 | Certifications of Chief Executive Officer and Chief Financial Officer pursuant to Section 906 of the Sarbanes-Oxley act of 2002 | |
| 101 | The following materials for the Registrant’s Annual Report on Form 10-K/A for the fiscal year ended August 31, 2014 formatted in XBRL: (1) the Consolidated Balance Sheets; (2) the Consolidated Statements of Operations; (3) the Consolidated Statements of Comprehensive Income (Loss); (4) the Consolidated Statements of Cash Flows; and (5) Notes to Consolidated Financial Statements. | |
| * | Denotes management contract or compensatory plan or arrangement |
88