Attached files
| file | filename |
|---|---|
| EX-10.2 - EXHIBIT 10.2 - SAExploration Holdings, Inc. | v394039_ex10-2.htm |
| EX-99.1 - EXHIBIT 99.1 - SAExploration Holdings, Inc. | v394039_ex99-1.htm |
| EX-10.1 - EXHIBIT 10.1 - SAExploration Holdings, Inc. | v394039_ex10-1.htm |
| 8-K - FORM 8-K - SAExploration Holdings, Inc. | v394039_8k.htm |
Exhibit 99.2

NASDAQ: SAEX HOUSTON, TX JEFFERIES GLOBAL ENERGY CONFERENCE

This presentation includes certain forward - looking statements, including statements regarding future financial performance, future growth and future acquisitions . These statements are based on SAE’s current expectations or beliefs and are subject to uncertainty and changes in circumstances . Actual results may vary materially from those expressed or implied by the statements herein due to changes in economic, business, competitive and/or regulatory factors, and other risks and uncertainties affecting the operation of SAE’s business . These risks, uncertainties and contingencies include : fluctuations in the levels of exploration and development activity in the oil and gas industry ; intense industry competition ; a limited number of customers ; the need to manage rapid growth ; delays , reductions or cancellations of service contracts ; operational disruptions due to seasonality, weather or other external factors ; crew productivity ; the availability of capital resources ; high levels of indebtedness, substantial international business exposing SAE to currency fluctuations and global factors, including economic, political and military uncertainties ; the need to comply with diverse and complex laws and regulations ; and other factors set forth in SAE’s filings with the Securities and Exchange Commission . The information set forth herein should be read in light of such risks . Except as required by law, SAE is not under any obligation to, and expressly disclaims any obligation to, update or alter its forward - looking statements, whether as a result of new information, future events, changes in assumptions or otherwise . Safe Harbor 2 NASDAQ: SAEX

Corporate Profile 3 NASDAQ: SAEX Summary ■ Ticker Symbol : ■ Stock Price (as of 11 / 10 / 14 ) : ■ 52 - Week Range : ■ Avg . Daily Volume ( 30 - day) : ■ Total Shares Outstanding : ■ Market Capitalization : ■ Total Long - Term Debt : ■ Executive and Board Ownership : ■ Corporate Headquarters : Nasdaq: SAEX $4.32 $4.32 - $10.00 13,221 14,870,549 ~$64.2 million ~$150.0 million ~54% Houston, TX Source: Nasdaq stock exchange and company filings
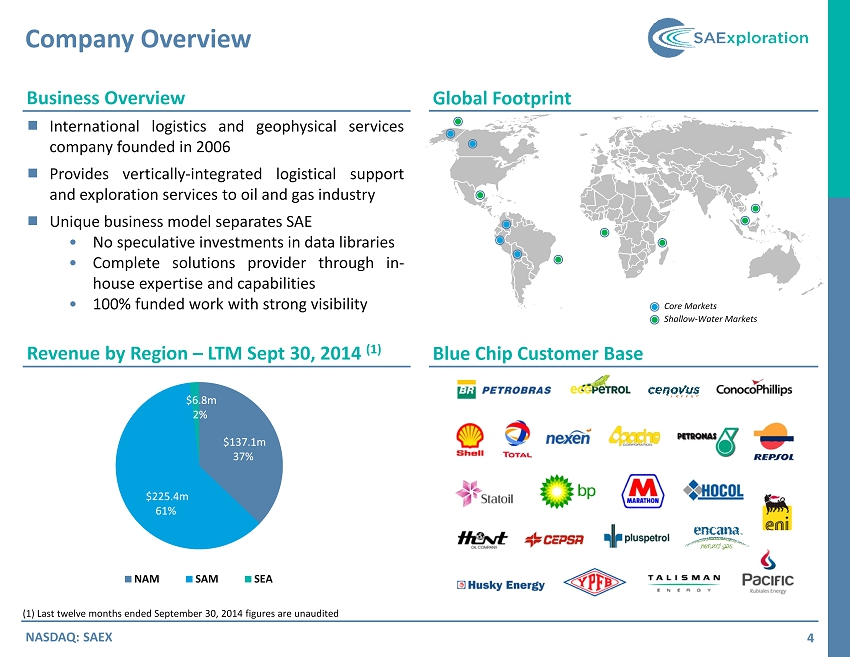
Company Overview 4 Business Overview Global Footprint Blue Chip Customer Base Revenue by Region – LTM Sept 30, 2014 (1) ■ International logistics and geophysical services company founded in 2006 ■ Provides vertically - integrated logistical support and exploration services to oil and gas industry ■ Unique business model separates SAE • No speculative investments in data libraries • Complete solutions provider through in - house expertise and capabilities • 100 % funded work with strong visibility NASDAQ: SAEX Core Markets (1) Last twelve months ended September 30, 2014 figures are unaudited Shallow - Water Markets $137.1m 37% $225.4m 61% $6.8m 2% NAM SAM SEA
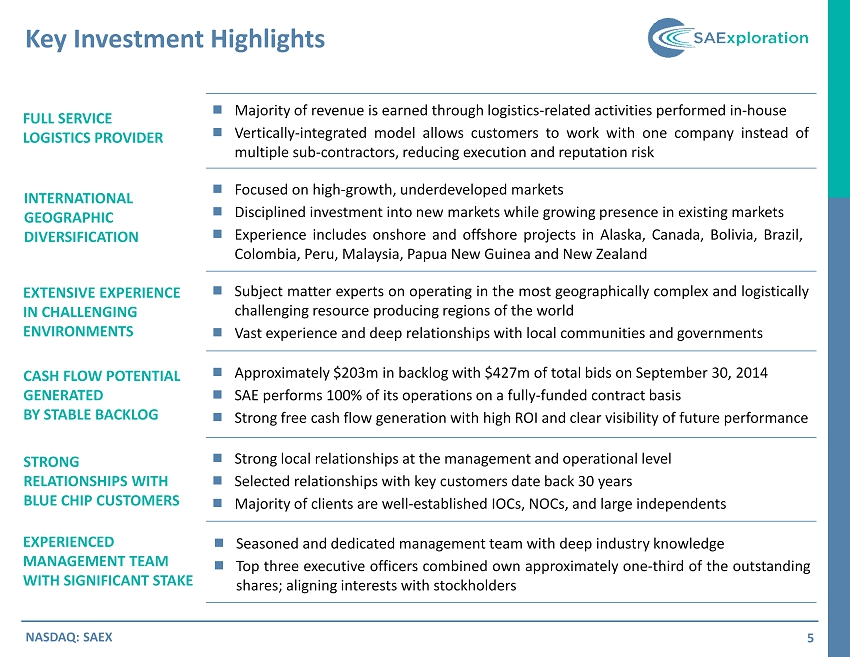
FULL SERVICE LOGISTICS PROVIDER ■ Majority of revenue is earned through logistics - related activities performed in - house ■ Vertically - integrated model allows customers to work with one company instead of multiple sub - contractors, reducing execution and reputation risk CASH FLOW POTENTIAL GENERATED BY STABLE BACKLOG ■ Focused on high - growth, underdeveloped markets ■ Disciplined investment into new markets while growing presence in existing markets ■ Experience includes onshore and offshore projects in Alaska, Canada, Bolivia, Brazil, Colombia, Peru, Malaysia, Papua New Guinea and New Zealand INTERNATIONAL GEOGRAPHIC DIVERSIFICATION ■ Subject matter experts on operating in the most geographically complex and logistically challenging resource producing regions of the world ■ Vast experience and deep relationships with local communities and governments EXTENSIVE EXPERIENCE IN CHALLENGING ENVIRONMENTS ■ Approximately $ 203 m in backlog with $ 427 m of total bids on September 30 , 2014 ■ SAE performs 100 % of its operations on a fully - funded contract basis ■ Strong free cash flow generation with high ROI and clear visibility of future performance STRONG RELATIONSHIPS WITH BLUE CHIP CUSTOMERS ■ Strong local relationships at the management and operational level ■ Selected relationships with key customers date back 30 years ■ Majority of clients are well - established IOCs, NOCs, and large independents Key Investment Highlights 5 NASDAQ: SAEX EXPERIENCED MANAGEMENT TEAM WITH SIGNIFICANT STAKE ■ Seasoned and dedicated management team with deep industry knowledge ■ Top three executive officers combined own approximately one - third of the outstanding shares ; aligning interests with stockholders
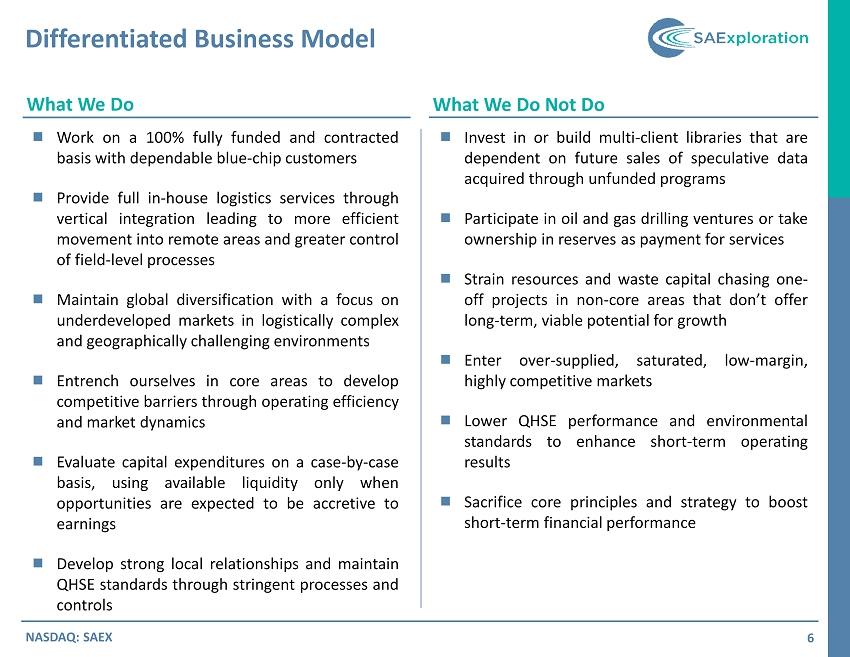
Differentiated Business Model 6 What We Do What We Do Not Do NASDAQ: SAEX ■ Work on a 100 % fully funded and contracted basis with dependable blue - chip customers ■ Provide full in - house logistics services through vertical integration leading to more efficient movement into remote areas and greater control of field - level processes ■ Maintain global diversification with a focus on underdeveloped markets in logistically complex and geographically challenging environments ■ Entrench ourselves in core areas to develop competitive barriers through operating efficiency and market dynamics ■ Evaluate capital expenditures on a case - by - case basis, using available liquidity only when opportunities are expected to be accretive to earnings ■ Develop strong local relationships and maintain QHSE standards through stringent processes and controls ■ Invest in or build multi - client libraries that are dependent on future sales of speculative data acquired through unfunded programs ■ Participate in oil and gas drilling ventures or take ownership in reserves as payment for services ■ Strain resources and waste capital chasing one - off projects in non - core areas that don’t offer long - term, viable potential for growth ■ Enter over - supplied, saturated, low - margin, highly competitive markets ■ Lower QHSE performance and environmental standards to enhance short - term operating results ■ Sacrifice core principles and strategy to boost short - term financial performance
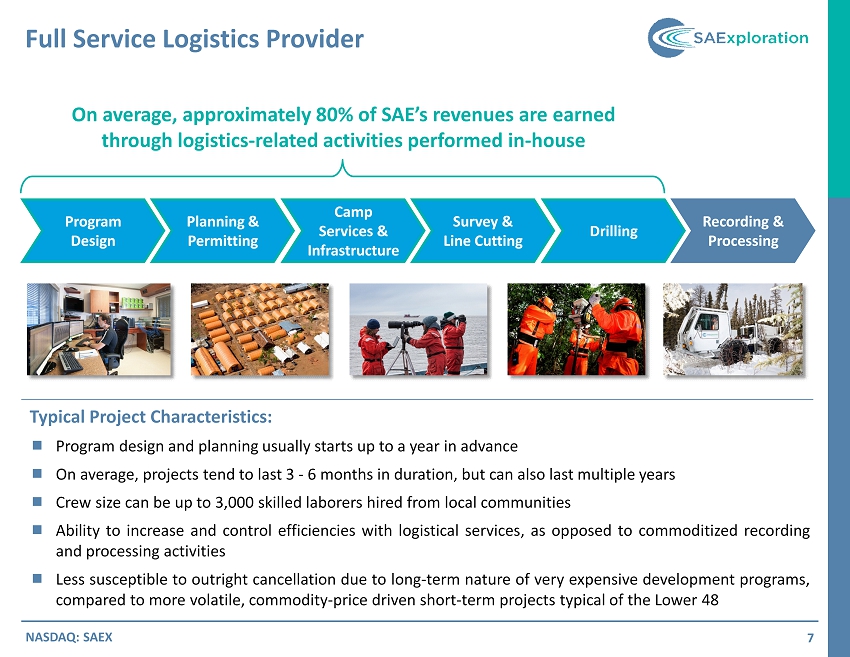
Full Service Logistics Provider 7 NASDAQ: SAEX Program Design Planning & Permitting Camp Services & Infrastructure Survey & Line Cutting Drilling Recording & Processing On average, approximately 80% of SAE’s revenues are earned through logistics - related activities performed in - house Typical Project Characteristics : ■ Program design and planning usually starts up to a year in advance ■ On average, projects tend to last 3 - 6 months in duration, but can also last multiple years ■ Crew size can be up to 3 , 000 skilled laborers hired from local communities ■ Ability to increase and control efficiencies with logistical services, as opposed to commoditized recording and processing activities ■ Less susceptible to outright cancellation due to long - term nature of very expensive development programs, compared to more volatile, commodity - price driven short - term projects typical of the Lower 48
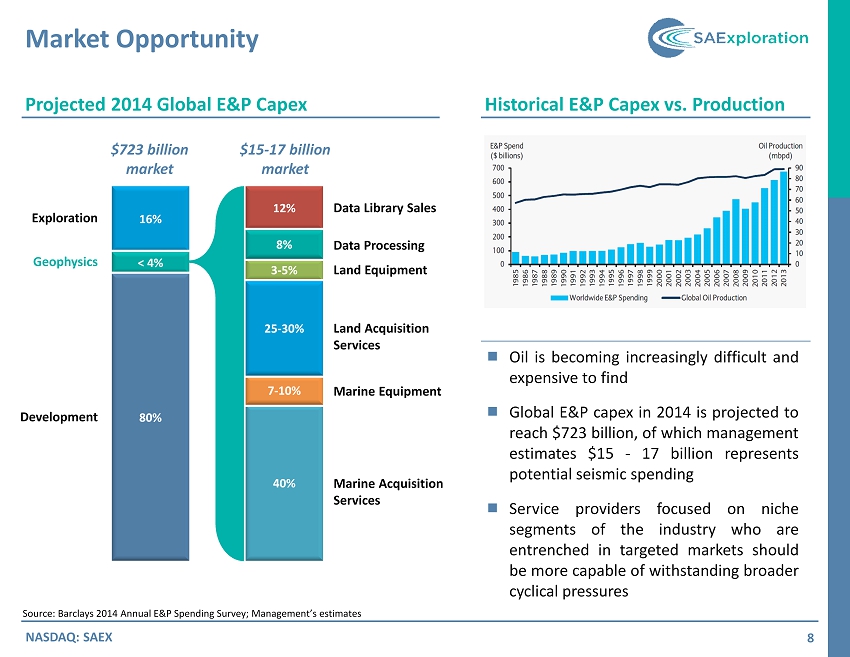
16% < 4% 80% 3 - 5% 12% 8% 40% 7 - 10% 25 - 30% $723 billion market $15 - 17 billion market Exploration Geophysics Development Data Library Sales Data Processing Land Equipment Land Acquisition Services Marine Equipment Marine Acquisition Services Market Opportunity 8 NASDAQ: SAEX Historical E&P Capex vs. Production ■ Oil is becoming increasingly difficult and expensive to find ■ Global E&P capex in 2014 is projected to reach $ 723 billion, of which management estimates $ 15 - 17 billion represents potential seismic spending ■ Service providers focused on niche segments of the industry who are entrenched in targeted markets should be more capable of withstanding broader cyclical pressures Source: Barclays 2014 Annual E&P Spending Survey; Management’s estimates Projected 2014 Global E&P Capex

International Focus on Niche Markets 9 NASDAQ: SAEX SAE was built on the expertise and ability to operate in the most geographically complex and logistically challenging resource - producing regions of the world ■ Very large reservoirs in relatively unexplored regions ■ Countries continue to expand and develop, demanding more energy to fuel growth ■ Most counties utilize concession leasing which contains required levels of exploration spending ■ Projects are becoming more complex as preconceived boundaries are expanded SOUTH AMERICA ■ A stable and mature 3D market where wireless technology is the norm ■ Tax incentives for exploration in Alaska are also leading to increased exploration activity ■ Developments in Mexico provide additional catalysts to exploit first - mover advantage NORTH AMERICA Shallow - Water Markets Core Markets ■ Exploration activities have continued to increase in underserved and undeveloped shallow - water markets globally ■ Primary opportunities in Southeast Asia, but offshore Brazil, Africa, Mexico and Alaska also offer attractive bidding environments ■ Differentiation aided by adoption of and expertise with ocean bottom nodal technology SHALLOW - WATER
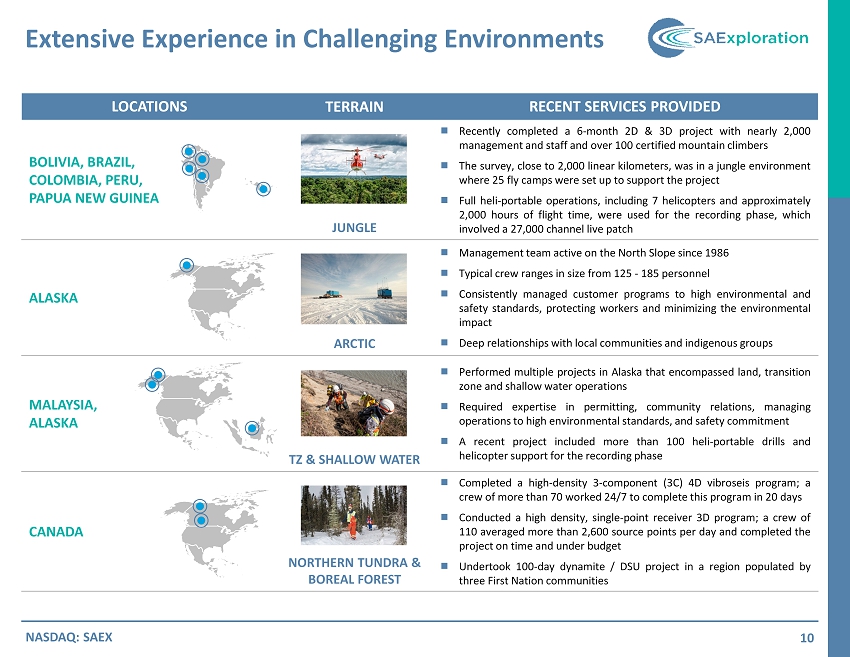
LOCATIONS TERRAIN RECENT SERVICES PROVIDED BOLIVIA, BRAZIL, COLOMBIA, PERU, PAPUA NEW GUINEA JUNGLE ■ Recently completed a 6 - month 2 D & 3 D project with nearly 2 , 000 management and staff and over 100 certified mountain climbers ■ The survey, close to 2 , 000 linear kilometers, was in a jungle environment where 25 fly camps were set up to support the project ■ Full heli - portable operations, including 7 helicopters and approximately 2 , 000 hours of flight time, were used for the recording phase, which involved a 27 , 000 channel live patch ALASKA ARCTIC ■ Management team active on the North Slope since 1986 ■ Typical crew ranges in size from 125 - 185 personnel ■ Consistently managed customer programs to high environmental and safety standards, protecting workers and minimizing the environmental impact ■ Deep relationships with local communities and indigenous groups MALAYSIA, ALASKA TZ & SHALLOW WATER ■ Performed multiple projects in Alaska that encompassed land, transition zone and shallow water operations ■ Required expertise in permitting, community relations, managing operations to high environmental standards, and safety commitment ■ A recent project included more than 100 heli - portable drills and helicopter support for the recording phase CANADA NORTHERN TUNDRA & BOREAL FOREST ■ Completed a high - density 3 - component ( 3 C) 4 D vibroseis program ; a crew of more than 70 worked 24 / 7 to complete this program in 20 days ■ Conducted a high density, single - point receiver 3 D program ; a crew of 110 averaged more than 2 , 600 source points per day and completed the project on time and under budget ■ Undertook 100 - day dynamite / DSU project in a region populated by three First Nation communities Extensive Experience in Challenging Environments 10 NASDAQ: SAEX

Quality, Health, Safety & Environment (“QHSE”) 11 NASDAQ: SAEX Historical Lost - Time Injury (LTIF) & Total Recordable Case (TRCF) Frequencies vs OGP Targets ■ SAE maintains an industry - leading quality, health, safety and environmental program ■ Internal QHSE requirements are more stringent than industry standards, despite operating in some of the harshest environments in the world ■ Superior QHSE performance record is a key competitive advantage and has assisted in establishing and maintaining customer relationships with some of the largest oil and gas producers in the world 0.09 1.08 0.00 0.40 0.80 1.20 1.60 2.00 Nov-13 Dec-13 Jan-14 Feb-14 Mar-14 Apr-14 May-14 Jun-14 Jul-14 Aug-14 Sep-14 Oct-14 TRCF - LTIF SAE LTIF - Rolling SAE TRCF - Rolling OGP LTIF Target OGP TRCF Target
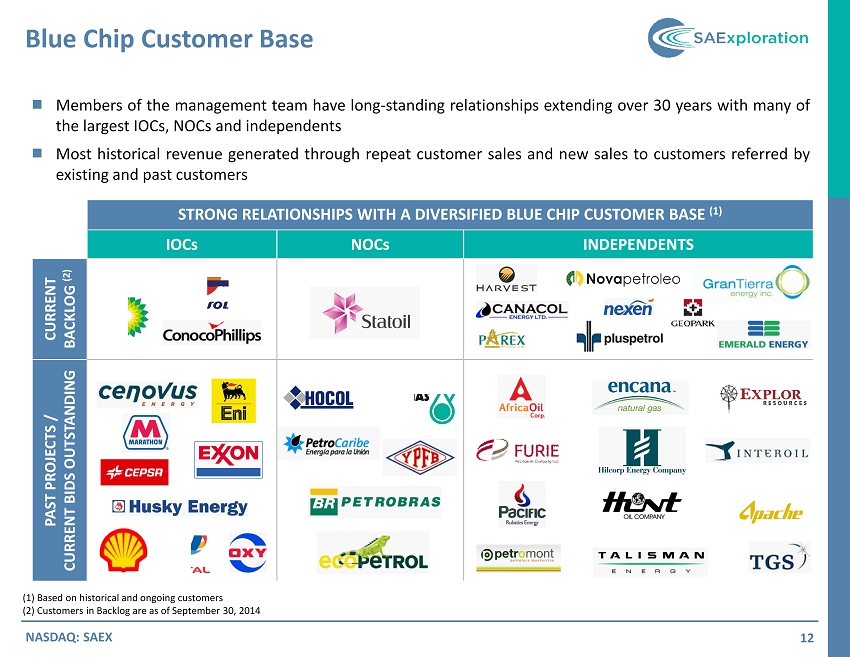
STRONG RELATIONSHIPS WITH A DIVERSIFIED BLUE CHIP CUSTOMER BASE (1) IOCs NOCs INDEPENDENTS CURRENT BACKLOG (2) PAST PROJECTS / CURRENT BIDS OUTSTANDING Blue Chip Customer Base 12 (1) Based on historical and ongoing customers (2) Customers in Backlog are as of September 30, 2014 ■ Members of the management team have long - standing relationships extending over 30 years with many of the largest IOCs, NOCs and independents ■ Most historical revenue generated through repeat customer sales and new sales to customers referred by existing and past customers NASDAQ: SAEX
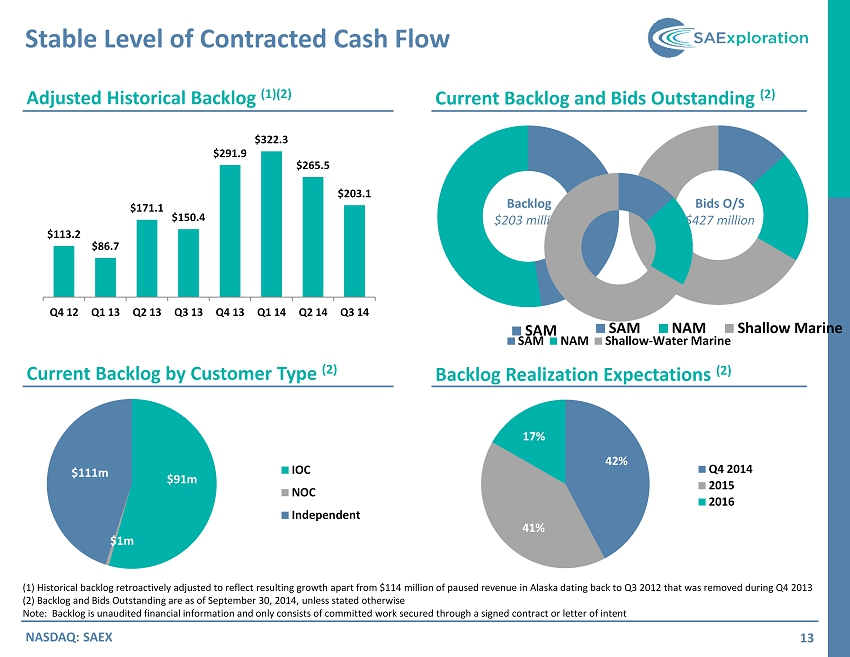
SAM Stable Level of Contracted Cash Flow 13 NASDAQ: SAEX Adjusted Historical Backlog (1)(2) Current Backlog and Bids Outstanding (2) Backlog Realization Expectations (2 ) Backlog $203 million Bids O/S $427 million (1) Historical backlog retroactively adjusted to reflect resulting growth apart from $114 million of paused revenue in Alaska da ting back to Q3 2012 that was removed during Q4 2013 (2) Backlog and Bids Outstanding are as of September 30, 2014, unless stated otherwise Note: Backlog is unaudited financial information and only consists of committed work secured through a signed contract or le tte r of intent Current Backlog by Customer Type (2 ) $113.2 $86.7 $171.1 $150.4 $291.9 $322.3 $265.5 $203.1 Q4 12 Q1 13 Q2 13 Q3 13 Q4 13 Q1 14 Q2 14 Q3 14 SAM NAM Shallow Marine 42% 41% 17% Q4 2014 2015 2016 $91m $1m $111m IOC NOC Independent SAM NAM Shallow-Water Marine
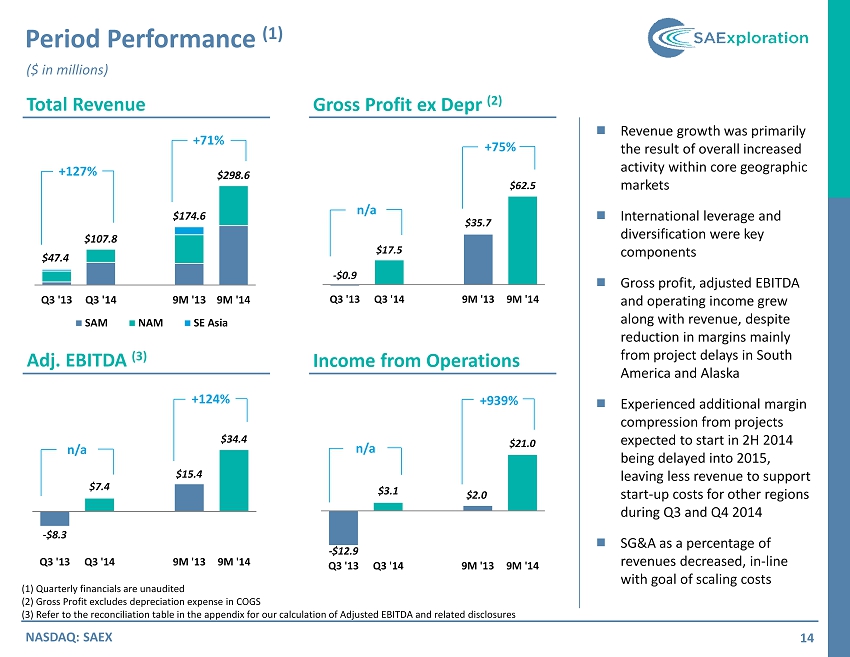
- $8.3 $7.4 $15.4 $34.4 Q3 ’13 Q3 ’14 9M ’13 9M ’14 - $12.9 $3.1 $2.0 $21.0 Q3 ’13 Q3 ’14 9M ’13 9M ’14 - $0.9 $17.5 $35.7 $62.5 Q3 ’13 Q3 ’14 9M ’13 9M ’14 $47.4 $107.8 $174.6 $298.6 Q3 ’13 Q3 ’14 9M ’13 9M ’14 SAM NAM SE Asia Period Performance (1) 14 NASDAQ: SAEX Total Revenue Gross Profit ex Depr (2) Income from Operations Adj. EBITDA (3) (1) Quarterly financials are unaudited (2) Gross Profit excludes depreciation expense in COGS (3) Refer to the reconciliation table in the appendix for our calculation of Adjusted EBITDA and related disclosures ■ Revenue growth was primarily the result of overall increased activity within core geographic markets ■ International leverage and diversification were key components ■ Gross profit, adjusted EBITDA and operating income grew along with revenue, despite reduction in margins mainly from project delays in South America and Alaska ■ Experienced additional margin compression from projects expected to start in 2H 2014 being delayed into 2015, leaving less revenue to support start - up costs for other regions during Q3 and Q4 2014 ■ SG&A as a percentage of revenues decreased, in - line with goal of scaling costs ($ in millions) +127% +71% n/a +75% n/a +124% n/a +939%
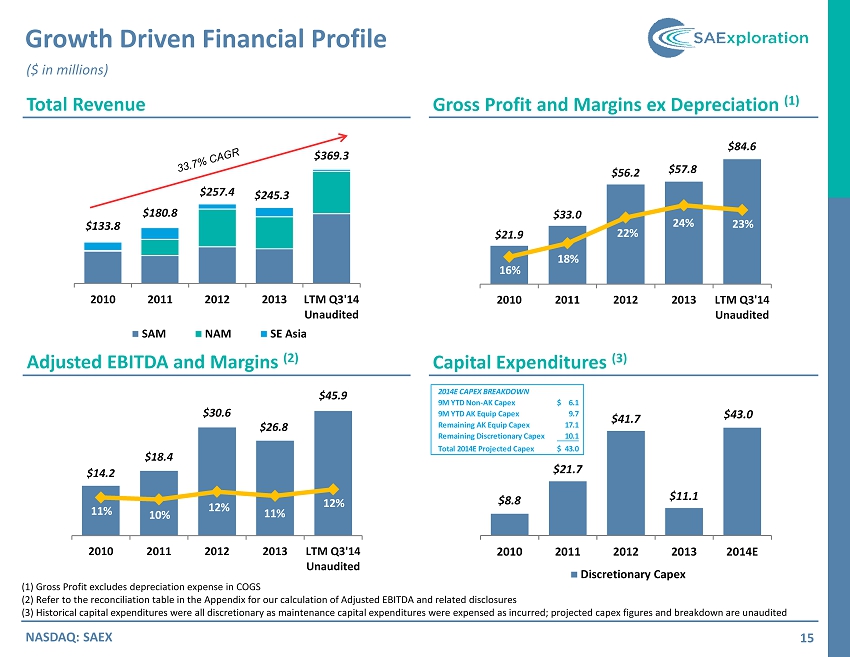
$8.8 $21.7 $41.7 $11.1 $43.0 2010 2011 2012 2013 2014E Discretionary Capex Growth Driven Financial Profile 15 NASDAQ: SAEX Total Revenue Gross Profit and Margins ex Depreciation (1) Capital Expenditures (3) (1) Gross Profit excludes depreciation expense in COGS (2) Refer to the reconciliation table in the Appendix for our calculation of Adjusted EBITDA and related disclosures (3) Historical capital expenditures were all discretionary as maintenance capital expenditures were expensed as incurred; pro jec ted capex figures and breakdown are unaudited Adjusted EBITDA and Margins (2) ($ in millions) $21.9 $33.0 $56.2 $57.8 $84.6 16% 18% 22% 24% 23% 13% 15% 18% 20% 23% 25% 28% 30% $0 $10 $20 $30 $40 $50 $60 $70 2010 2011 2012 2013 LTM Q3’14 Unaudited 2014E CAPEX BREAKDOWN 9M YTD Non-AK Capex 6.1$ 9M YTD AK Equip Capex 9.7 Remaining AK Equip Capex 17.1 Remaining Discretionary Capex 10.1 Total 2014E Projected Capex 43.0$ $133.8 $180.8 $257.4 $245.3 $369.3 2010 2011 2012 2013 LTM Q3’14 Unaudited SAM NAM SE Asia $14.2 $18.4 $30.6 $26.8 $45.9 11% 10% 12% 11% 12% 2% 3% 4% 5% 6% 7% 8% 9% 10% 11% 12% 13% 14% 15% 16% 17% 18% 19% 20% 21% 22% 23% 24% 25% 26% 27% 28% 29% 30% $0 $5 $10 $15 $20 $25 $30 $35 2010 2011 2012 2013 LTM Q3’14 Unaudited
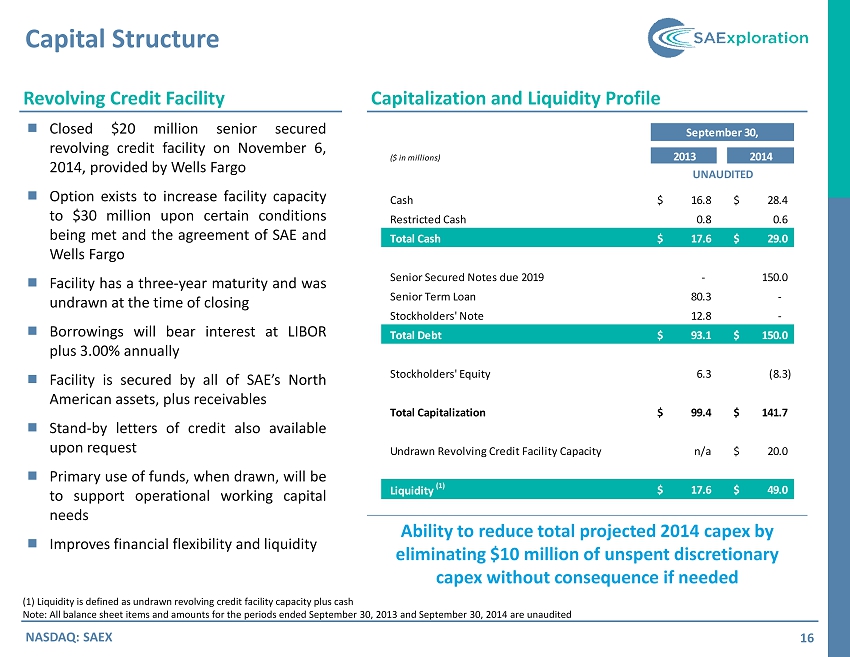
Capital Structure 16 NASDAQ: SAEX Capitalization and Liquidity Profile Revolving Credit Facility ■ Closed $ 20 million senior secured revolving credit facility on November 6 , 2014 , provided by Wells Fargo ■ Option exists to increase facility capacity to $ 30 million upon certain conditions being met and the agreement of SAE and Wells Fargo ■ Facility has a three - year maturity and was undrawn at the time of closing ■ Borrowings will bear interest at LIBOR plus 3 . 00 % annually ■ Facility is secured by all of SAE’s North American assets, plus receivables ■ Stand - by letters of credit also available upon request ■ Primary use of funds, when drawn, will be to support operational working capital needs ■ Improves financial flexibility and liquidity (1) Liquidity is defined as undrawn revolving credit facility capacity plus cash Note: All balance sheet items and amounts for the periods ended September 30, 2013 and September 30, 2014 are unaudited September 30, ($ in millions) 2013 2014 UNAUDITED Cash 16.8$ 28.4$ Restricted Cash 0.8 0.6 Total Cash 17.6$ 29.0$ Senior Secured Notes due 2019 - 150.0 Senior Term Loan 80.3 - Stockholders’ Note 12.8 - Total Debt 93.1$ 150.0$ Stockholders’ Equity 6.3 (8.3) Total Capitalization 99.4$ 141.7$ Undrawn Revolving Credit Facility Capacity n/a 20.0$ Liquidity (1) 17.6$ 49.0$ Ability to reduce total projected 2014 capex by eliminating $10 million of unspent discretionary capex without consequence if needed
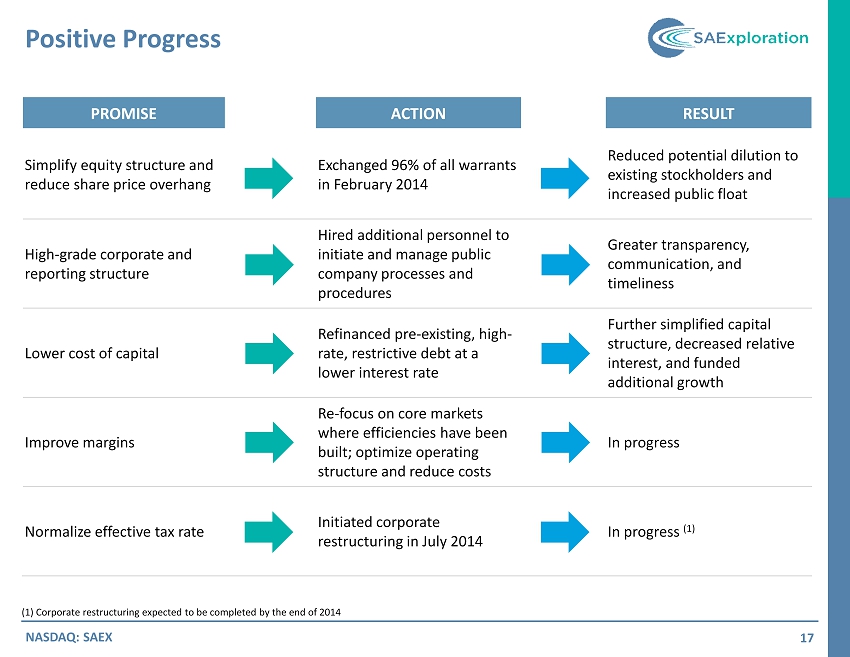
Positive Progress 17 NASDAQ: SAEX PROMISE ACTION RESULT Simplify equity structure and reduce share price overhang Exchanged 96% of all warrants in February 2014 Reduced potential dilution to existing stockholders and increased public float High - grade corporate and reporting structure Hired additional personnel to initiate and manage public company processes and procedures Greater transparency, communication, and timeliness Lower cost of capital Refinanced pre - existing, high - rate, restrictive debt at a lower interest rate Further simplified capital structure, decreased relative interest, and funded additional growth Improve margins Re - focus on core markets where efficiencies have been built; optimize operating structure and reduce costs In progress Normalize effective tax rate Initiated corporate restructuring in July 2014 In progress (1) (1) Corporate restructuring expected to be completed by the end of 2014
Strategic Direction 18 NASDAQ: SAEX Growth Catalysts ■ Near - term growth expected to include meaningful contribution from Alaska, which should provide onshore and offshore activity with a significant ramp - up during the upcoming winter season on the North Slope, as evidenced by multiple contracts currently in place ■ Offshore activity in niche, complex shallow and deep - water markets throughout various geographies expected to be a key driver with increasing demand for ocean - bottom nodal (“OBN”) technology in water depths up to 3 , 000 meters • Southeast Asia, Alaska, Brazil , Africa and Mexico include possible underdeveloped markets in need of OBN solutions ■ Further growth potential related to the development of possible opportunities in Mexico, where first - mover advantage can be obtained through existing cooperation agreement with Comesa Long - Term Initiatives ■ Continue organic growth with existing resources and implement sustainable cost structures to manage cycles ■ Improve margins by refocusing on core markets with targeted growth and defensible positions ■ Maximize profitability and maintain healthy balance of growth and free cash flow ■ De - lever financial profile through growth in earnings and strategic deployment of available cash without compromising liquidity ■ Evaluate accretive opportunities to diversify exposure deeper into customers’ overall development cycles
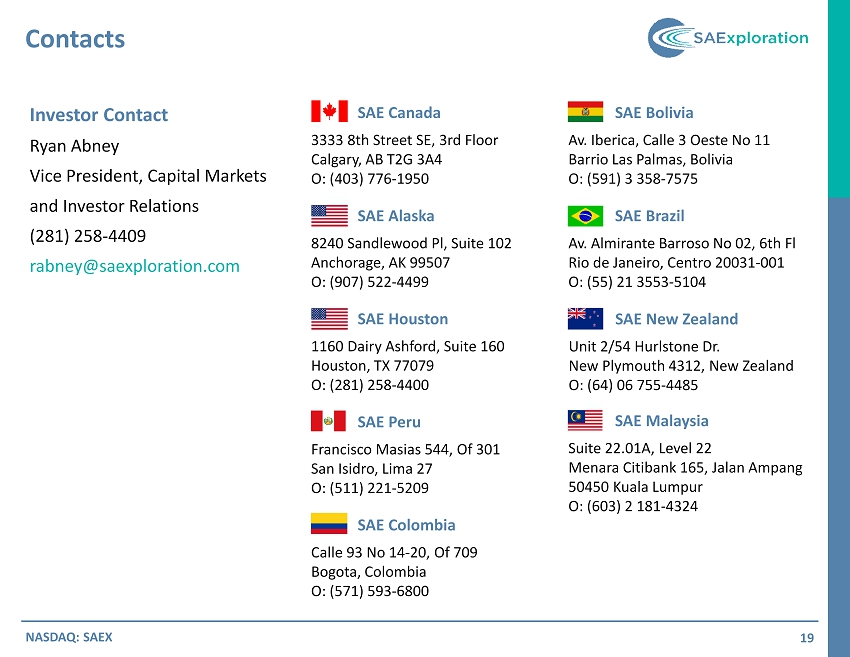
Investor Contact Ryan Abney Vice President, Capital Markets and Investor Relations (281) 258 - 4409 rabney@saexploration.com Contacts 19 NASDAQ: SAEX SAE Canada 3333 8th Street SE, 3rd Floor Calgary, AB T2G 3A4 O : (403) 776 - 1950 SAE Alaska 8240 Sandlewood Pl, Suite 102 Anchorage, AK 99507 O : (907) 522 - 4499 SAE Houston 1160 Dairy Ashford, Suite 160 Houston, TX 77079 O : (281) 258 - 4400 SAE Peru Francisco Masias 544, Of 301 San Isidro, Lima 27 O : (511) 221 - 5209 SAE Colombia Calle 93 No 14 - 20, Of 709 Bogota , Colombia O : (571) 593 - 6800 SAE Bolivia Av. Iberica , Calle 3 Oeste No 11 Barrio Las Palmas, Bolivia O : (591) 3 358 - 7575 SAE Brazil Av. Almirante Barroso No 02, 6th Fl Rio de Janeiro, Centro 20031 - 001 O : (55) 21 3553 - 5104 SAE Malaysia Suite 22.01A, Level 22 Menara Citibank 165, Jalan Ampang 50450 Kuala Lumpur O: (603) 2 181 - 4324 SAE New Zealand Unit 2/54 Hurlstone Dr. New Plymouth 4312, New Zealand O: (64) 06 755 - 4485

Appendix
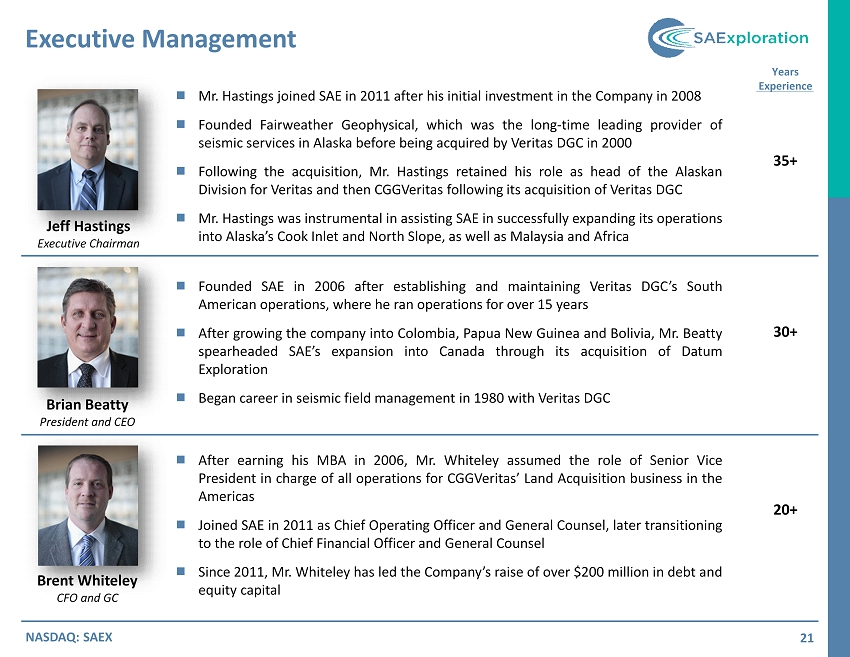
Executive Management 21 NASDAQ: SAEX Jeff Hastings Executive Chairman Brian Beatty President and CEO Brent Whiteley CFO and GC Years Experience 35+ 30+ 20+ ■ After earning his MBA in 2006 , Mr . Whiteley assumed the role of Senior Vice President in charge of all operations for CGGVeritas ’ Land Acquisition business in the Americas ■ Joined SAE in 2011 as Chief Operating Officer and General Counsel, later transitioning to the role of Chief Financial Officer and General Counsel ■ Since 2011 , Mr . Whiteley has led the Company’s raise of over $ 200 million in debt and equity capital ■ Founded SAE in 2006 after establishing and maintaining Veritas DGC’s South American operations, where he ran operations for over 15 years ■ After growing the company into Colombia, Papua New Guinea and Bolivia, Mr . Beatty spearheaded SAE’s expansion into Canada through its acquisition of Datum Exploration ■ Began career in seismic field management in 1980 with Veritas DGC ■ Mr . Hastings joined SAE in 2011 after his initial investment in the Company in 2008 ■ Founded Fairweather Geophysical, which was the long - time leading provider of seismic services in Alaska before being acquired by Veritas DGC in 2000 ■ Following the acquisition, Mr . Hastings retained his role as head of the Alaskan Division for Veritas and then CGGVeritas following its acquisition of Veritas DGC ■ Mr . Hastings was instrumental in assisting SAE in successfully expanding its operations into Alaska’s Cook Inlet and North Slope, as well as Malaysia and Africa
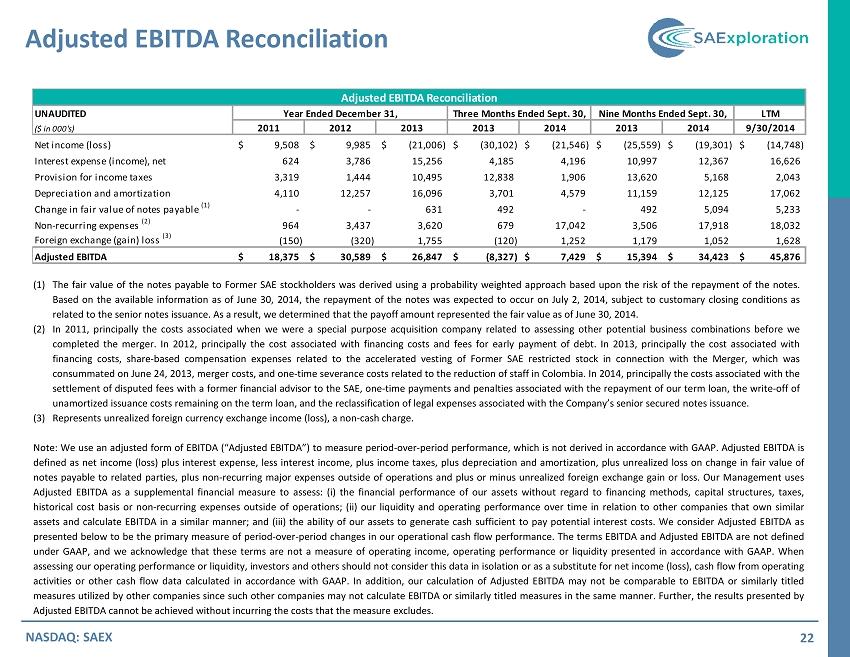
(1) The fair value of the notes payable to Former SAE stockholders was derived using a probability weighted approach based upon the risk of the repayment of the notes . Based on the available information as of June 30 , 2014 , the repayment of the notes was expected to occur on July 2 , 2014 , subject to customary closing conditions as related to the senior notes issuance . As a result, we determined that the payoff amount represented the fair value as of June 30 , 2014 . (2) In 2011 , principally the costs associated when we were a special purpose acquisition company related to assessing other potential business combinations before we completed the merger . In 2012 , principally the cost associated with financing costs and fees for early payment of debt . In 2013 , principally the cost associated with financing costs, share - based compensation expenses related to the accelerated vesting of Former SAE restricted stock in connection with the Merger, which was consummated on June 24 , 2013 , merger costs, and one - time severance costs related to the reduction of staff in Colombia . In 2014 , principally the costs associated with the settlement of disputed fees with a former financial advisor to the SAE, one - time payments and penalties associated with the repayment of our term loan, the write - off of unamortized issuance costs remaining on the term loan, and the reclassification of legal expenses associated with the Company’s senior secured notes issuance . (3) Represents unrealized foreign currency exchange income (loss), a non - cash charge . Note : We use an adjusted form of EBITDA (“Adjusted EBITDA”) to measure period - over - period performance, which is not derived in accordance with GAAP . Adjusted EBITDA is defined as net income (loss) plus interest expense, less interest income, plus income taxes, plus depreciation and amortization, plus unrealized loss on change in fair value of notes payable to related parties, plus non - recurring major expenses outside of operations and plus or minus unrealized foreign exchange gain or loss . Our Management uses Adjusted EBITDA as a supplemental financial measure to assess : (i) the financial performance of our assets without regard to financing methods, capital structures, taxes, historical cost basis or non - recurring expenses outside of operations ; (ii) our liquidity and operating performance over time in relation to other companies that own similar assets and calculate EBITDA in a similar manner ; and (iii) the ability of our assets to generate cash sufficient to pay potential interest costs . We consider Adjusted EBITDA as presented below to be the primary measure of period - over - period changes in our operational cash flow performance . The terms EBITDA and Adjusted EBITDA are not defined under GAAP, and we acknowledge that these terms are not a measure of operating income, operating performance or liquidity presented in accordance with GAAP . When assessing our operating performance or liquidity, investors and others should not consider this data in isolation or as a substitute for net income (loss), cash flow from operating activities or other cash flow data calculated in accordance with GAAP . In addition, our calculation of Adjusted EBITDA may not be comparable to EBITDA or similarly titled measures utilized by other companies since such other companies may not calculate EBITDA or similarly titled measures in the same manner . Further, the results presented by Adjusted EBITDA cannot be achieved without incurring the costs that the measure excludes . Adjusted EBITDA Reconciliation 22 NASDAQ: SAEX Adjusted EBITDA Reconciliation UNAUDITED Year Ended December 31, Three Months Ended Sept. 30, Nine Months Ended Sept. 30, LTM ($ in 000’s) 2011 2012 2013 2013 2014 2013 2014 9/30/2014 Net income (loss) 9,508$ 9,985$ (21,006)$ (30,102)$ (21,546)$ (25,559)$ (19,301)$ (14,748)$ Interest expense (income), net 624 3,786 15,256 4,185 4,196 10,997 12,367 16,626 Provision for income taxes 3,319 1,444 10,495 12,838 1,906 13,620 5,168 2,043 Depreciation and amortization 4,110 12,257 16,096 3,701 4,579 11,159 12,125 17,062 Change in fair value of notes payable (1) - - 631 492 - 492 5,094 5,233 Non-recurring expenses (2) 964 3,437 3,620 679 17,042 3,506 17,918 18,032 Foreign exchange (gain) loss (3) (150) (320) 1,755 (120) 1,252 1,179 1,052 1,628 Adjusted EBITDA 18,375$ 30,589$ 26,847$ (8,327)$ 7,429$ 15,394$ 34,423$ 45,876$