Attached files
| file | filename |
|---|---|
| 8-K - ROSETTA RESOURCES INC 8-K 11-12-2014 - NBL Texas, LLC | form8k.htm |
Exhibit 99.1

Rosetta Resources Inc.Investor Presentation November 2014 PERMIAN BASIN + EAGLE FORD

Cautionary Statements 2 This presentation includes forward-looking statements. Forward-looking statements related to future events, such as expectations regarding our capital program, development plans, production rates, resource potential, transportation capacity, net present value and projected liquidity. These statements are not guarantees of future performance and actual outcomes may differ materially. Factors that could affect the Company's business include, but are not limited to: oil and gas prices, operating hazards, drilling risks, unsuccessful exploratory activities; unexpected cost increases; potential liability for remedial actions under existing or future environmental regulations; potential liability resulting from pending or future litigation; limited access to capital or significantly higher cost of capital related to illiquidity or uncertainty in the domestic or international financial markets; as well as changes in tax, environmental and other laws applicable to our business. Other factors that could cause actual results to differ materially from those described in the forward-looking statements include other economic, business, competitive and/or regulatory factors affecting our business generally as set forth in our filings with the Securities and Exchange Commission. Unless legally required, the Company undertakes no obligation to update publicly any forward-looking statements, whether as a result of new information, future events or otherwise. For filings reporting year-end 2013 reserves, the SEC permits the optional disclosure of probable and possible reserves. The Company has elected not to report probable and possible reserves in its filings with the SEC. We use the term “net risked resources” or “inventory” to describe the Company’s internal estimates of volumes of natural gas and oil that are not classified as proved reserves but are potentially recoverable through exploratory drilling or additional drilling or recovery techniques. Estimates of unproved resources are by their nature more speculative than estimates of proved reserves and accordingly are subject to substantially greater risk of actually being realized by the Company. Estimates of unproved resources may change significantly as development provides additional data, and actual quantities that are ultimately recovered may differ substantially from prior estimates.

Test Future Growth Opportunities to Expand Inventory Advancing delineation of Delaware Basin multi-stacked lateral potentialRefining and expanding testing of Upper Eagle Ford pilotsAssessing Gaines County acreage in Midland BasinPursuing new growth targets through bolt-on acquisitions in core areas Successfully ExecuteBusiness Plan Grow total production and liquids volumes while applying cross-basin knowledgeContinue to improve performance of drilling and completion operationsMaintain competitive overall cost structure and marginsCapture firm transportation and processing capacity MaintainFinancial Strength & Flexibility Actively manage strong balance sheet for optimum financial flexibilityMaintain adequate liquidity throughout cyclesManage exposure to commodity price risk through prudent hedging program Company Strategy – Key Elements 3

Rosetta Resources Overview 4 Permian Gaines Co. ~13,000 net acresMidland Basin – Exploratory Reeves Co. ~47,000 net acresDelaware Basin – Delineating Permian Eagle Ford~60,000 net acres (100% operated) Central Dimmit Co. Area~8,500 net acres, Dimmit Co. Tom Hanks~3,500 net acres, LaSalle Co. Lopez ~500 net acres, Live Oak Co. Karnes Trough ~1,900 net acres in oil windowDewitt & Gonzales Co. Briscoe Ranch~3,600 net acres, Dimmit Co. Encinal~12,700 net acres, Webb & LaSalle Co. Steiren Area~2,500 net acres in oil windowAtascosa Co. Gates Ranch~26,200 net acres, Webb Co. 0 10 20 Miles Market Summary(November 7, 2014 Close) Ticker: ROSE Market capitalization: $2.4 billion Share price: $38.48 Enterprise value: $4.3 billion Note: Acreage numbers are rounded
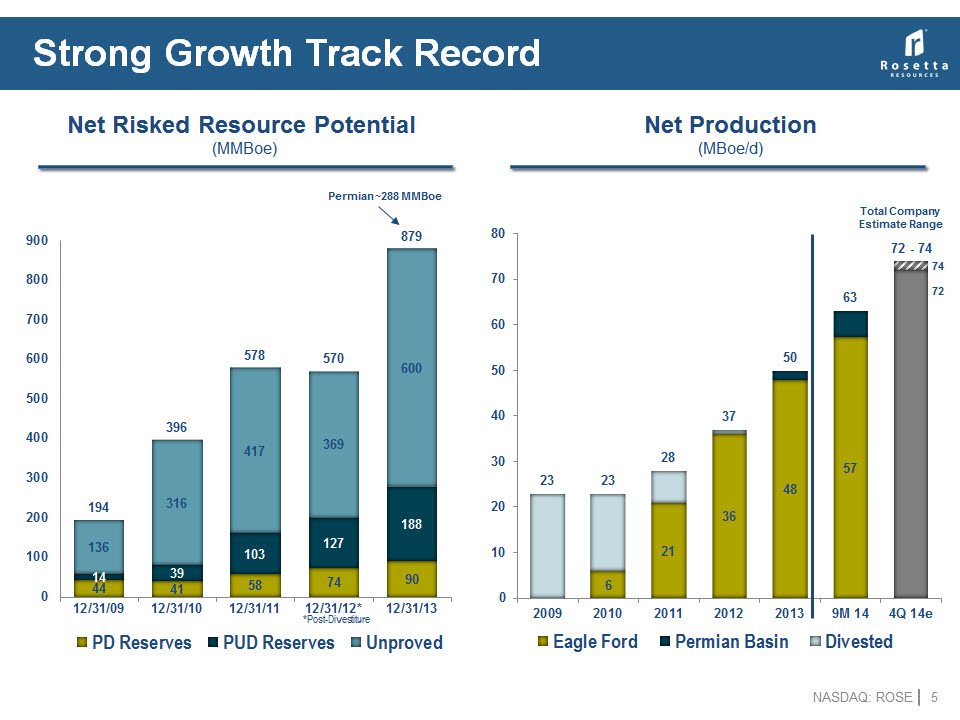
Strong Growth Track Record 5 Net Production(MBoe/d) 72 74 Total CompanyEstimate Range Permian ~288 MMBoe Net Risked Resource Potential (MMBoe) *Post-Divestiture
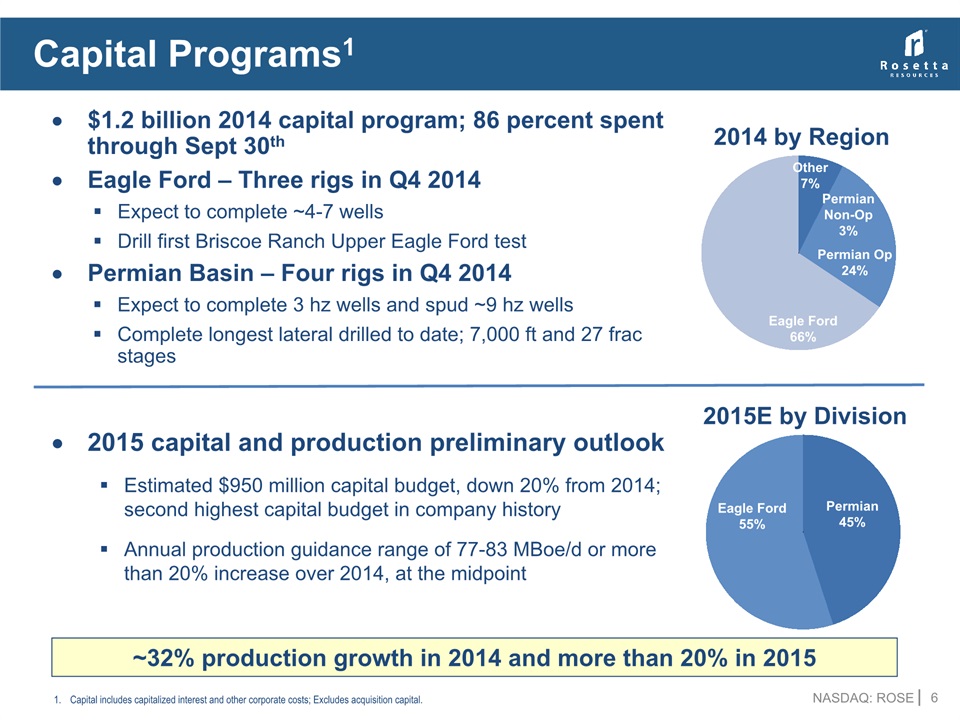
Capital Programs1 6 Permian 45% Eagle Ford55% ~32% production growth in 2014 and more than 20% in 2015 $1.2 billion 2014 capital program; 86 percent spent through Sept 30th Eagle Ford – Three rigs in Q4 2014Expect to complete ~4-7 wellsDrill first Briscoe Ranch Upper Eagle Ford testPermian Basin – Four rigs in Q4 2014Expect to complete 3 hz wells and spud ~9 hz wellsComplete longest lateral drilled to date; 7,000 ft and 27 frac stages Other7% Permian Op24% Eagle Ford66% PermianNon-Op3% 2015E by Division 2014 by Region 2015 capital and production preliminary outlookEstimated $950 million capital budget, down 20% from 2014; second highest capital budget in company historyAnnual production guidance range of 77-83 MBoe/d or more than 20% increase over 2014, at the midpoint Capital includes capitalized interest and other corporate costs; Excludes acquisition capital.

Total Company Inventory+/- 1,500 net wells -- remaining as of 9/30/2014 (excluding Upper Eagle Ford, Encinal & Gaines Co.) 7 Asset Name Net acres Wellscompletedby Rosetta Wells awaiting completion Well Spacing Remainingnet locations1 Avg Cost / Well$M (5000’ lateral) Gates Ranch (100% WI / 75% NRI) 26,200 184 24 55 247 $5.5 - $6.0 8 UEF Briscoe Ranch (100% WI / 81.3% NRI) 3,600 29 11 50 39 Central Dimmit2 (100% WI / 75 – 77% NRI) 8,500 23 10 60 91 1 UEF Tom Hanks(100% WI / 77% NRI) 3,500 15 6 50 40 Lopez(100% WI / 75% NRI) 500 3 - 50 5 $7.5 - $8.0 Steiren (Undelineated)(100% WI / 75 - 77% NRI) 2,500 - - 50 21 $5.5 - $6.0 Total Eagle Ford3 Inventory 44,800 263 51 50 - 60 443 $5.5 - $8.0 Permian 3rd Bone Spring Hz4 47,000(Reeves Co) 1 1 80 296 $8.0 - $9.0 Permian WC ‘A’ Hz4 14 5 80 450 Permian WC ‘B’ Hz4 - - 80 158 Permian WC ’C’ Hz4 1 - 80 105 Total Permian Inventory 47,000 16 7 80 1,009 $8.0 - $9.0 Total Company Inventory 91,800 279 57 50 - 80 1,452 $5.5 - $9.0 Remaining net locations may vary based on changes in well lateral lengthsCentral Dimmit includes L&E, Vivion and Light Ranch Excludes producing areas in Karnes Trough that are fully developed (26 completions). Excludes 6 producing wells completed in Encinal area.Horizontal operated and non-operated project count includes potential in multiple horizons (Wolfcamp A, B, C, and 3rd Bone Spring); assuming 660’ between laterals or 80-acre spacing

Permian Basin Division

Permian Division – Reeves County~47,000 net acres 9 2014 Activity Summary – 1st Nine Mos. Reeves County (Op) Vertical Horizontal TOTAL Wells Drilledby Rosetta 15 22 37 Wells Completedby Rosetta 19 14 33 Wells Placedon Production 18 15 33 Wells Drilled Awaiting Completion 5 6 11 Successfully completed seven horizontal wells, six WC ‘A and one 3rd Bone Spring; total average gross 7-day IP ~1,300 Boe/dProduced 8.2 MBoe/d, an increase of 82 percent versus second quarter Flowing back Intrepid 27-38 #2H WC ‘A’ well, longest lateral to date; completed with 27 stages across an effective 7,000-foot lateral HIGHLIGHTS 3rd Quarter 20149 completions:7 horizontal2 vertical Intrepid Flowing Back Operating Interest Non-operating Interest

Regional structure map of the Permian Basin Modified by Beaubouef at al. (1999) from Wright. 1962 and Fitchen 1997 Permian Asset PotentialStacked Zones Provide Collection of Horizontal Development Opportunities 10 Primary Completion Targets In comparison, the lower Eagle Ford reservoir thickness is ~100 feet at Gates Ranch 1,300’ Rosetta’s Reeves Co. acreage position Rosetta’s Gaines Co. acreage position(Exploratory)

Permian – Horizontal Development Plan 9/30/2014 11 Horizontal project count is operated and non operated and includes multiple horizons (Wolfcamp A, B, C, and 3rd Bone Spring). OperatedNon-Operated 1,348 Gross (Avg. 75% WI)Horizontal Well Locations1 Deacon Jim 6 #1H7-IP 69330-IP 273 Johnny Ringo St 9 2H7-IP 1,39330-IP 1,068 Sam Bass 15 1H7-IP 63830-IP 625 Sheriff Woody 10 #1H7-IP 1,66930-IP 1,399 Calamity Jane 22 1H 7-IP 1,96630-IP 1,687 Black Jack 16 3H7-IP 1,15430-IP 1,039 Gaucho 15 1H7-IP 104930-IP 809 Gaucho 15 2H7-IP 82930-IP 526 Intrepid 27-38 #2HFlowing Back A BS A A A A A A A City of Pecos 13 #3H7-IP 1,05330-IP 769 Balmorhea Ranch 32-157-IP 96930-IP 739 Dynamite Dan 37 #1H7-IP 1,30230-IP 1,116 Black Jack 16 1H7-IP 1,39530-IP 1,216 Tall Texan 36 #4H7-IP 1,60830-IP 1,271 Roy Bean 42 1H7-IP 36130-IP 298 Black Jack 16 2H7-IP 1,33830-IP 1,088 Monroe 39 #4H7-IP 1,47430-IP 1,238 Balmorhea Ranch 41 3H7-IP 98730-IP 863 A A A A A C A A A DRILLED AWAITING COMPLETION COMPLETION ACTIVITY SINCE 6/30/14 COMPLETED BEFORE 6/30/2014

Completion Design ImprovementsRate Comparisons 12 3rd Bone SpringWolfcamp AWolfcamp C 309 Denotes old completion design;excludes Wolfcamp ‘C’ well Denotes new completion design;excludes 3rd Bone Spring well and Deacon Jim (NE step-out) 4Q 2013 – 1Q 2014 2Q 2014 3Q 2014 1. Source: Tudor, Pickering, Holt & Co.

Permian Asset Potential Multiple Benches in Delineation Phase Across Rosetta’s Acreage 13 OperatedNon-Operated 3rd Bone Spring Wolfcamp A Wolfcamp B Wolfcamp C Completed Prior 3Q2014 Proposed 2014 Activity Offset Operations

Permian – Reeves CountyUpper Wolfcamp Horizontal Type Curve (1/30/2014) 14 Months on Production 3-Stream BOEPD* P50 Type Curve Average Well Costs($MM) $8.5 ($8-$9 range) 30-Day IP RateBoe/d (gross) 1,090 Composite EURMBoe (gross) 550 (500-600 range) % Oil 74% % NGL 10% *All production data normalized to 5,000' lateral length; well production data updated as of 10/30/2014.Note: Rosetta reports reserves and production in 3-stream. Rosetta assumptions for gas shrink and NGL yield applied to offset operators’ 2-stream public data. 3Q 2014 WC ‘A’ Completions30-Day Avg (BOEPD)Normalized to 5000’ City of Pecos 13 #3H 893 Tall Texan St 36 #4H 1,785 Sheriff Woody 10 #1H 1,960 Monroe 39 A #4H 1,342 Dynamite Dan 37 #1H 1,364 Deacon Jim 6 #1H 326

South Texas Division

South Texas Division – Eagle Ford 16 2014 Activity Summary – 1st Nine Mos. GatesRanch BriscoeRanch CentralDimmit TomHanks Encinal TOTAL Wells Drilledby Rosetta 48 8 15 7 2 80 WellsCompleted 52 13 12 11 2 90 Wells Placedon Production 54 13 9 11 2 89 Wells Drilled Awaiting Completion 24 11 10 6 0 51 HIGHLIGHTSProduced 65 MBoe/d, an increase of 34 percent from 2013 and 15 percent versus second quarterTesting potential of Upper Eagle Ford across multiple areasPlan to drill first Upper Eagle Ford well at Briscoe Ranch in Q4 2014
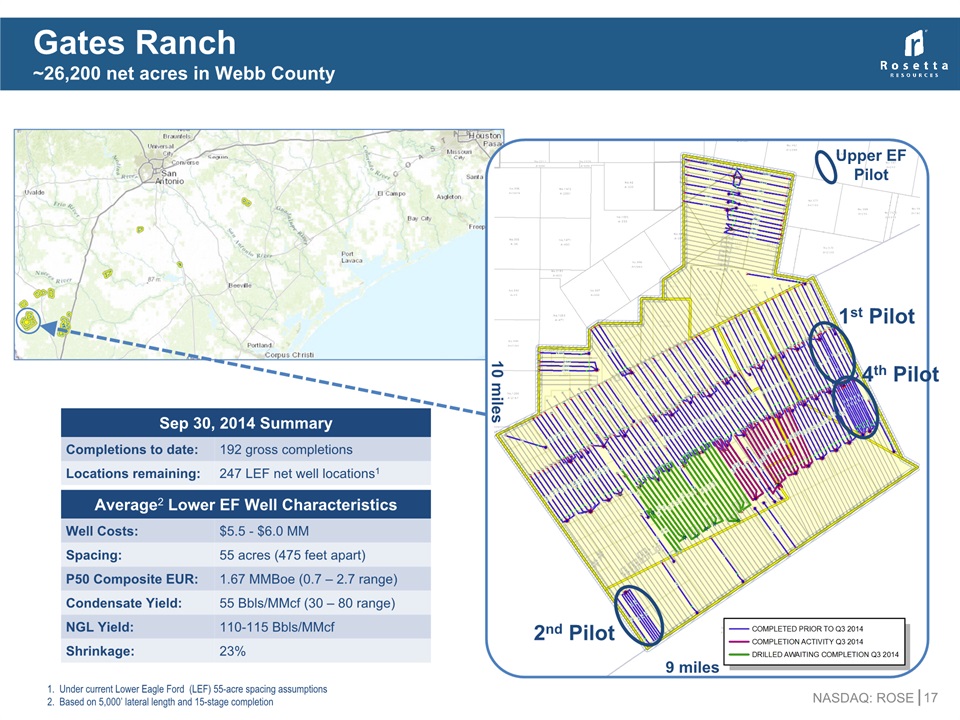
Gates Ranch~26,200 net acres in Webb County 17 Sep 30, 2014 Summary Completions to date: 192 gross completions Locations remaining: 247 LEF net well locations1 Average2 Lower EF Well Characteristics Well Costs: $5.5 - $6.0 MM Spacing: 55 acres (475 feet apart) P50 Composite EUR: 1.67 MMBoe (0.7 – 2.7 range) Condensate Yield: 55 Bbls/MMcf (30 – 80 range) NGL Yield: 110-115 Bbls/MMcf Shrinkage: 23% Under current Lower Eagle Ford (LEF) 55-acre spacing assumptionsBased on 5,000’ lateral length and 15-stage completion 9 miles 10 miles 1st Pilot 2nd Pilot 4th Pilot Upper EF Pilot

Central Dimmit County Area~8,500 net acres located in Dimmit County 18 Sep 30, 2014 Summary Completions to date: 24 gross completions Locations remaining: 91 LEF net well locations Average Well Costs: $5.5 – $6.0 MM Lasseter & Eppright Light Ranch 2 completions Vivion 3rd Upper EF Pilot 3 completions
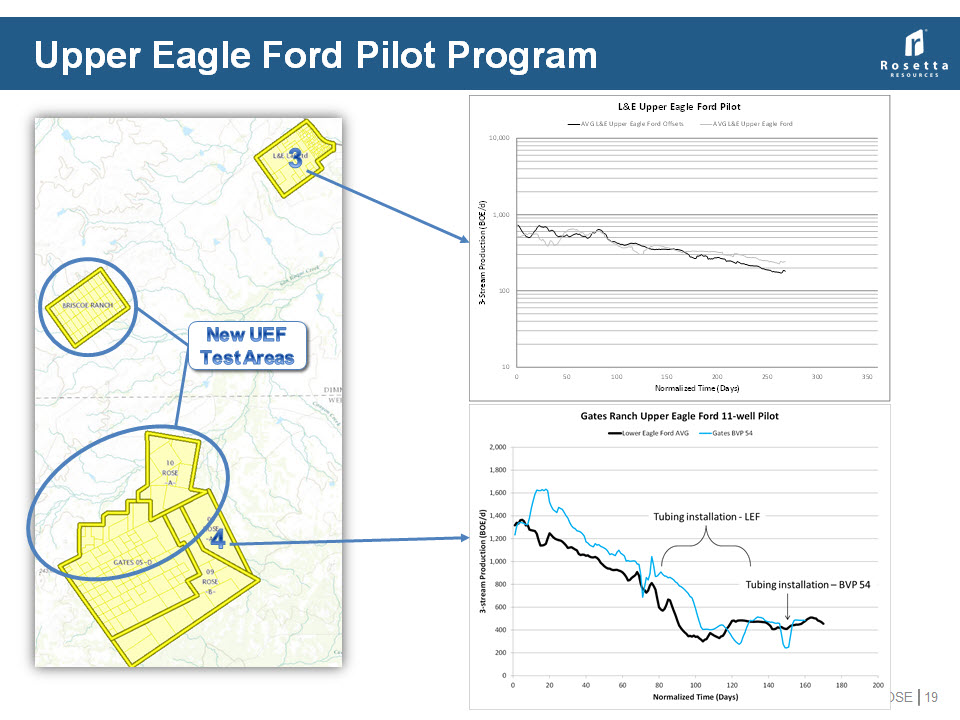
Upper Eagle Ford Pilot Program 19 3 4 New UEFTest Areas

Marketing and Financial Overview
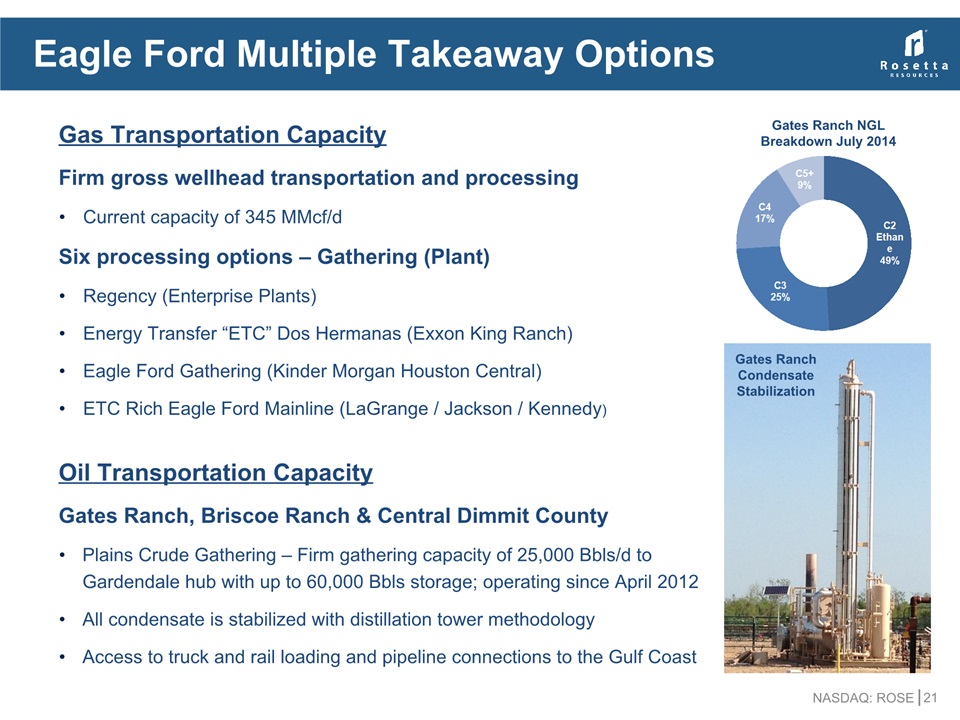
Gas Transportation CapacityFirm gross wellhead transportation and processingCurrent capacity of 345 MMcf/d Six processing options – Gathering (Plant)Regency (Enterprise Plants)Energy Transfer “ETC” Dos Hermanas (Exxon King Ranch)Eagle Ford Gathering (Kinder Morgan Houston Central)ETC Rich Eagle Ford Mainline (LaGrange / Jackson / Kennedy) Oil Transportation CapacityGates Ranch, Briscoe Ranch & Central Dimmit CountyPlains Crude Gathering – Firm gathering capacity of 25,000 Bbls/d to Gardendale hub with up to 60,000 Bbls storage; operating since April 2012All condensate is stabilized with distillation tower methodology Access to truck and rail loading and pipeline connections to the Gulf Coast Eagle Ford Multiple Takeaway Options 21 Gates Ranch NGLBreakdown July 2014 Gates RanchCondensate Stabilization

Permian Basin Marketing OilCurrently trucked from leasesGathering options under evaluationOil gravity averages 43 degrees and receives no gravity deductsNew Permian takeaway pipelines on the way (Bridge Tex, PE2, Cactus)Midland–Cushing differentials improving; currently trading below $5 in Q4 2014, down from the ~$10 differential seen in Q3 2014Natural GasGas is rich and is processed at two plants Most leases under long-term gathering agreementResidue gas sales tied to Waha and Permian indicesNGLsNGLs extracted under firm, multi-year gathering/processing agreementsCombination of net proceeds and Mont Belvieu pricing 22

Commodity Derivatives Position – Nov 4, 2014 23 $37.10 $83.33X$109.63 $93.13 $89.81 $90.28 $31.90 Liquid Derivatives(Bbls/d) Natural Gas Derivatives(MMBtu/d x 1,000)

Debt and Capital Structure 24 ($MM) ($MM) Capital Structure Debt Structure

Liquidity 25 Adequate liquidity to fund 2014 and estimated 2015 capital program$950 million borrowing base$800 million committed amount$140 million outstanding on October 31st Total Liquidity(Millions)

Investment Summary Drill-bit focused producer with core acreage positions in Eagle Ford and Permian Basin playsAttractive core Delaware Basin position gaining momentumSuccessful operator in the high-return Eagle Ford area, reducing well costs adding significant net asset valueLarge inventory of future growth opportunities with multiple stacked lateral potentialSolid reputation of financial strength and business flexibility to support growth throughout industry cycles 26 Rosetta Resources – Growing Value in a Rock Solid CombinationPERMIAN BASIN + EAGLE FORD

Appendix

Attractive Well Economics (Typical Well) Metrics Gates Ranch BriscoeRanch Tom Hanks L&E Horizontal Upper Wolfcamp Far South Southeast NorthCentral Far North Average WI NRI 100% 100% 100% 100% 100% 100% 100% 100% 75% 75% 75% 75% 81% 77% 75% 75% Average Cost / Well, gross ($MM) $5.75 $5.75 $5.75 $5.75 $5.75 $6.0 $5.75 $8.5 Gross 30-day IP (Boe/d) 1,500 1,500 1,400 1,400 1,180 720 685 1,090 Gross EUR (MBoe)P50, Unrisked 2,35016% Oil39% NGL 2,15016% Oil39% NGL 1,12220% Oil37% NGL 1,01120% Oil37% NGL 73425% Oil40% NGL 34682% Oil8% NGL 52450% Oil26% NGL 55074% Oil10% NGL Rate of Return BFIT (%) 97% 87% 49% 52% 48% 43% 30% 23% PV10 BFIT ($MM) $17.1 $14.8 $6.3 $5.8 $4.9 $4.0 $2.9 $2.9 Payout BFIT (yrs) 1.0 1.1 1.6 1.4 1.5 1.6 2.3 2.9 Net Developed F&D ($/Boe) 3.24 3.54 6.74 7.48 9.61 22.54 14.64 20.58 28 Note: EURs and economic metrics are “Unrisked”. Horizontal wells based on 5,000’ lateral length, unless noted. Capital costs utilize sand proppant for completions.Type curves are available on the ‘Investors’ page on the company website, www.rosettaresources.com.Oil price assumptions, $/Bbl - $78.51 in 2015, $79.62 in 2016, $80.39 thereafter.NGL price assumptions, $/Bbl - $28.32 in 2015, $28.72 in 2016, $29.62 thereafter.Gas price assumptions, $/MMBtu - $3.89 in 2015, $3.97 in 2016, $4.08 thereafter.

Reeves County Horizontal Delineation ProgramRecent Well Performance Reflecting Enhanced Completion Design Early Design New Design Average Lateral Length 5,000’ 5,000’ # of Stages 17 19 Spacing between stages 290’ 260’ Proppant Type Sand Sand Proppant per Stage, Mlbs 240 310 Proppant per Lateral Ft, lbs 830 1,200 Addition of slickwater fluid component to activate natural features and increase fracture complexityShorter stage spacing to create larger stimulated rock volume (SRV)Increased proppant volume to focus on creating larger SRV 29 Boe/d Q3 2014Completions1 Pre-2Q 2014 Completions 1Excludes 3rd Bone Spring well and Deacon Jim (NE step-out)

Eagle Ford Horizontal ProgramWell Cost Guidance Reduced by $500M Reflecting Change in Completion Design Past Design New Design Average Lateral Length 5,000’ 5,000’ # of Stages 15 15-21 Spacing between stages 300’ 240-330’ Proppant Type Ceramic Sand Proppant per Stage, Mlbs 275 360-500 Proppant per Lateral Ft, lbs 825 1,500+ Shifting focus of completion design with change in proppantPast Focus: Maximize conductivityNew Focus: Maximize stimulated rock volume while obtaining necessary conductivity for optimum flowReplacing ceramic proppant with sand pumped in much larger volumesAnalyzed performance of 12 Gates Ranch sand wells vs offsetting ceramic wellsChange applies to Gates Ranch, Briscoe Ranch, L&E, Vivion and Tom Hanks 30

Upper Eagle Ford Pilot ProgramFuture Plans are to pilot test the Upper Eagle Ford at North Gates & Briscoe Ranch ... 31 Lower Eagle Ford Landing Zones A’ A 4-22 5-22 BVP 25 BVP 50 51 52 BVP 53 BVP 54 L&E B31 A A’ Pilot #1(East Gates) Pilot #4(East Gates) Pilot #2(South Gates) Pilot #3(L&E) Future Pilot(North Gates) Future Pilot(Briscoe) Target

($ in millions) FY 2011 FY 2012 FY 2013 2014 First Nine Months Net Income $100.5 $159.3 $199.4 $128.1 Income tax expense 55.7 95.9 110.6 72.6 Interest expense, net of interest capitalized 21.3 24.3 36.0 53.6 Other income (expense), net 0.9 0.1 0.3 12.5 Depreciation, depletion and amortization 123.2 154.2 218.6 293.7 EBITDA $301.6 $433.8 $564.9 $560.5 Unrealized derivative loss (gain) (1.2) (19.7) 16.3 (17.2) Stock-based compensation expense 29.0 18.5 11.0 9.8 Adjusted EBITDA* $329.4 $432.6 $592.2 $553.1 Adjusted EBITDA Reconciliation EBITDA is calculated as net income, excluding income tax expense, interest expense, net of interest capitalized, other income (expense), net, and depreciation, depletion and amortization. Adjusted EBITDA is calculated as EBITDA excluding unrealized gains or losses on derivative instruments and stock-based compensation expense. *2013 Adjusted EBITDA of $592MM has not been adjusted to add back non-recurring items of Reserve for Commercial Dispute $20.4MM and Acquisition Costs $2.3MM.2014 Adjust EBITDA of $574.3 has not been adjusted to add back non-recurring items of Reserve for Commercial Dispute $5.8MM , Acquisition Costs $0.6MM, and Loss on Debt Extinguishment of $12.6MM 32