Attached files
| file | filename |
|---|---|
| EX-32.1 - EXHIBIT 32.1 - NBL Texas, LLC | ex32_1.htm |
| EX-31.1 - EXHIBIT 31.1 - NBL Texas, LLC | ex31_1.htm |
| EX-21.1 - EXHIBIT 21.1 - NBL Texas, LLC | ex21_1.htm |
| EX-23.2 - EXHIBIT 23.2 - NBL Texas, LLC | ex23_2.htm |
| EX-23.1 - EXHIBIT 23.1 - NBL Texas, LLC | ex23_1.htm |
| EX-99.1 - EXHIBIT 99.1 - NBL Texas, LLC | ex99_1.htm |
| EX-31.2 - EXHIBIT 31.2 - NBL Texas, LLC | ex31_2.htm |
| EX-10.42 - EXHIBIT 10.42 - NBL Texas, LLC | ex10_42.htm |
UNITED
STATES
SECURITIES
AND EXCHANGE COMMISSION
Washington,
D.C. 20549
FORM
10-K
|
x
|
Annual
Report Pursuant To Section 13 or 15(d) of The Securities Exchange Act of
1934
|
For
The Fiscal Year Ended December 31, 2009
OR
|
o
|
Transition
Report Pursuant To Section 13 Or 15(d) of The Securities Exchange Act of
1934
|
Commission
File Number: 000-51801
ROSETTA
RESOURCES INC.
(Exact
name of registrant as specified in its charter)
|
Delaware
|
43-2083519
|
|
(State
or other jurisdiction of incorporation or organization)
|
(I.R.S.
Employer Identification No.)
|
|
717
Texas, Suite 2800, Houston, TX
|
77002
|
|
(Address
of principal executive offices)
|
(Zip
Code)
|
|
Registrant's
telephone number, including area code: (713)
335-4000
|
|
Securities
Registered Pursuant to Section 12(b) of the Act:
|
The
Nasdaq Stock Market LLC
|
|
|
Common
Stock, $.001 Par Value
|
(Nasdaq
Global Select Market)
|
|
(Title
of Class)
|
(Name
of Exchange on which registered)
|
Securities
Registered Pursuant to Section 12 (g) of the Act:
None
Indicate by check mark if the registrant is a well-known seasoned issuer, as defined in Rule 405 of the Securities Act.
Yes o No x
Indicate
by check mark if the registrant is not required to file reports pursuant to
Section 13 or 15(d) of the Act.
Yes o No x
Indicate
by check mark whether the registrant (1) has filed all reports required to be
filed by Section 13 or 15(d) of the Securities Exchange Act of 1934 during the
preceding 12 months (or for such shorter period that the registrant was required
to file such reports), and (2) has been subject to such filing requirements for
the past 90 days. Yes x No o
Indicate
by check mark whether the registrant has submitted electronically and posted on
its corporate Web site, if any, every Interactive Data File required to be
submitted and posted pursuant to Rule 405 of Regulation S-T (§ 232.405 of
this chapter) during the preceding 12 months (or for such shorter period that
the registrant was required to submit and post such
files). Yes o No o
Indicate
by check mark if disclosure of delinquent filers pursuant to Item 405 of
Regulation S-K is not contained herein, and will not be contained, to the best
of the registrant’s knowledge, in definitive proxy or information statements
incorporated by reference in Part III of this Form 10-K or any amendment to this
Form 10-K. o
Indicate
by check mark whether the registrant is a large accelerated filer, an
accelerated filer, a non-accelerated filer or a smaller reporting
company. See the definitions of “large accelerated filer,”
“accelerated filer” and “smaller reporting company” in Rule 12b-2 of the
Exchange Act.
|
Large
accelerated filer o
|
Accelerated
filer x
|
||
|
Non-Accelerated
filer o
|
Smaller
Reporting Company o
|
||
|
(Do
not check if a smaller reporting
company)
|
|||
Indicate
by check mark whether the registrant is a shell company (as defined in Rule
12b-2 of the Exchange Act). Yes o No x
The
aggregate market value of the voting and non-voting common equity held by
Non-affiliates of the registrant as of June 30, 2009 was approximately $446.9
million based on the closing price of $8.76 per share on the Nasdaq Global
Select Market.
The
number of shares of the registrant’s Common Stock, $.001 par value per share
outstanding as of February 24, 2010 was 52,589,439.
Documents
Incorporated By Reference
Portions
of the definitive proxy statement relating to the 2010 annual meeting of
stockholders to be filed with the Securities and Exchange Commission are
incorporated by reference in answer to Part III of this Form
10-K.
2
|
Table of Contents
|
||
|
Part
I –
|
Page
|
|
|
4
|
||
|
15
|
||
|
22
|
||
|
23
|
||
|
23
|
||
|
Part
II –
|
||
|
24
|
||
|
25
|
||
|
26
|
||
|
42
|
||
|
44
|
||
|
79
|
||
|
79
|
||
|
79
|
||
|
Part
III –
|
||
|
80
|
||
|
80
|
||
|
80
|
||
|
80
|
||
|
80
|
||
|
Part
IV –
|
||
|
81
|
||
CAUTIONARY
NOTE REGARDING FORWARD-LOOKING STATEMENTS
This Form
10-K contains forward-looking statements regarding factors that we believe may
affect our performance in the future. Such statements typically are identified
by terms expressing our future expectations or projections of revenues,
earnings, earnings per share, cash flow, market share, capital expenditures,
effects of operating initiatives, gross profit margin, debt levels, interest
costs, tax benefits and other financial items. All forward-looking statements
are based on assumptions about future events and are therefore inherently
uncertain, and actual results may differ materially from those expected or
projected. Important factors that may cause our actual results to differ
materially from expectations or projections include those described under the
heading “Risk Factors” in Item 1A of this Form 10-K. Forward-looking
statements speak only as of the date of this report, and we undertake no
obligation to update or revise such statements to reflect new circumstances or
unanticipated events as they occur.
For a
glossary of oil and natural gas terms, see page 85.
Part
I
Items 1 and 2. Business and Properties
General
We are an
independent oil and gas company engaged in the exploration, development,
acquisition and production of oil and gas properties. Our operations
are concentrated in the core areas of the Sacramento Basin of California, the
Rockies, and South Texas. In addition, we have non-core positions in
the State Waters of Texas and the Gulf of Mexico. We are a Delaware
corporation based in Houston, Texas. Our headquarters are located at
717 Texas, Suite 2800, Houston, Texas 77002, where we sublease two floors of
office space from Calpine and lease a third floor. We also maintain a division
office in Denver, Colorado, where we were assigned a lease by Calpine and now
deal directly with the landlord. We also have field offices in
Laredo, Texas, Rio Vista, California and Wray, Colorado. All office leases were
negotiated at market prices applicable to their respective
location.
Rosetta
Resources Inc. (together with our consolidated subsidiaries, the “Company” or
“Rosetta”) was formed in June 2005 to acquire the domestic oil and natural gas
business formerly owned by Calpine Corporation and its affiliates
(“Calpine”). We have subsequently acquired numerous other oil and
natural gas properties. We have grown our existing property base by
developing and exploring our acreage, purchasing new undeveloped leases, and
acquiring oil and gas producing properties and drilling prospects from
third parties. We operate in one business segment. See
Item 8. “Financial Statements and Supplementary Data, Note 15 - Operating
Segments.”
We
sell a significant portion of our gas to Calpine pursuant to certain gas
purchase and sales contracts, including the gas sales agreement for the
dedicated California production which was amended and restated in connection
with the parties’ settlement agreement dated October 22, 2008. These original
gas purchase and sales contracts and the amended and restated gas purchase and
sales contract for the dedicated California production are discussed further
under Part I. Items 1 and 2. ”Business and Properties - Marketing and
Customers.”
Our
Strategy
Our
strategy is to increase stockholder value by delivering visible and sustainable
growth from unconventional onshore domestic basins. This strategy
represents a shift in our business model that is consistent with our goal to
become a successful resource player with sufficient project inventory to drive
growth. We recognize that there may be cycles, such as the current
economic downturn, that could impact our ability to fully execute this strategy
on a short-term basis. However, we believe our strategy is
fundamentally sound and emphasizes (i) identifying and developing inventory
in existing core properties, (ii) establishing and testing positions in new
resource plays, (iii) efficiently exploring and exploiting our assets, (iv)
pursuing selective acquisitions and divestitures, (v) applying
technological expertise, (vi) focusing on cost control and (vii) maintaining
financial flexibility. We seek to implement our strategy while
working to protect stockholder interests by focusing on sound stewardship,
managing our capital resources wisely, monitoring emerging trends, minimizing
liabilities through governmental compliance and protecting the
environment. Below is a discussion of the key elements of our
strategy:
Identifying and
Developing Inventory in Existing Core Properties. Project inventory is a
key to our strategy and we believe our legacy assets have significant remaining
inventory potential. We have designated the Sacramento Basin of
California, the Rockies and South Texas as core areas and intend to expand our
asset base in these areas through additional leasing and acquisitions, where
applicable, in order to build inventory. As importantly, we intend to
further develop the upside potential of these core properties by conducting
thorough resource assessments of our existing assets, working over existing
wells, drilling in-fill locations, drilling step-out wells to expand known field
outlines, testing and implementing downspacing potential, recompleting and
testing behind pipe pays, lowering field line pressures through compression and
optimizing for additional reserve recovery. We believe that applying
an “unconventional lens” to these assets will generate inventory to fuel future
growth.
Establishing and
Testing Positions in New Resource Plays. We intend to extend
our operational footprint into new core areas within North America that are
characterized by a significant presence of resource potential that can be
exploited utilizing our technological expertise. We strive to
minimize the cost of entry into these plays by being disciplined in our
leasehold acquisition activities and prudently paced during the testing
phase.
Efficiently
Exploring and Exploiting our Assets. We intend to generate
growth in existing and new areas by applying our technological and operational
expertise to our inventory of projects. We believe that this is a key
to creating value from resource plays.
Pursuing
Selective Acquisitions and Divestitures. We regularly evaluate possible
acquisitions of producing properties, undeveloped acreage and drilling prospects
in our existing core areas, as well as areas where we believe we can establish
new core areas with resource potential. We focus on opportunities
with identified inventory where we believe our reservoir management and
operational expertise will enhance the value and performance of the acquired
properties through repeatable drilling programs. Periodically, we
also evaluate possible divestitures of non-core properties that we believe have
limited future potential or that do not fit our risk profile. In
2009, we sold certain non-core assets for a total of approximately $20
million.
Applying
Technological Expertise. We intend to maintain, further develop and apply
the technological expertise that helped us achieve a net drilling success rate
of 83% for the year ended December 31, 2009 and helped us maximize field
recoveries. Our definition of drilling success is a well that is
producing or capable of production, including natural gas wells awaiting
pipeline connections to commence deliveries and oil wells awaiting connection to
production facilities. We use advanced geological and geophysical technologies,
detailed petrophysical analyses, advanced reservoir engineering and
sophisticated drilling, completion and stimulation techniques to grow our
reserves, production and project inventory.
Focusing on Cost
Control. We manage all elements of our cost structure including drilling
and operating costs as well as overhead costs. We strive to minimize our
drilling and operating costs by concentrating our activities within existing and
new resource play areas where we can achieve efficiencies through economies of
scale.
Maintaining
Financial Flexibility. As of December 31, 2009, we had drawn $190.0
million and had $160.0 million available for borrowing under our revolving line
of credit. Additionally, we expect internally generated cash flow to provide
additional financial flexibility. We intend to continue to actively
manage our exposure to commodity price risk in the marketing of our oil and
natural gas production. As part of this strategy, we entered into natural gas
fixed-price swaps for a portion of our expected production through
2011. As of December 31, 2009, 13% and 13% of our expected natural
gas production was hedged using swaps and costless collars, respectively, with
settlement in 2010, and 5% and 23% of our expected natural gas production was
hedged using swaps and costless collars, respectively, with settlement in
2011. The swaps to settle in 2010 have an average price of $7.46 per
MMBtu and the collars have floor and ceiling prices of $5.75 per MMBtu and $7.40
per MMBtu, respectively. The swaps to settle in 2011 have an average
price of $5.72 per MMBtu and the collars have floor and ceiling prices of $5.80
per MMBtu and $7.58 per MMBtu, respectively. In January 2010,
we entered into additional costless collar transactions to hedge 10,000 MMBtu/d
of our expected production for July 2010 through December 2012. The
costless collars have a floor price of $5.75 per MMBtu and a ceiling price of
$6.50 per MMBtu through 2011 and $7.15 per MMBtu in 2012. In February
2010, we entered into natural gas fixed-price swaps to hedge 10,000 MMBtu/d of
our expected production for July 2010 through December 2011 at an average price
of $5.91 per MMBtu. We also entered into a series of interest rate
swap agreements during 2009 to hedge the change in variable interest rates
associated with our debt under our credit facility through December
2010.
Our
Strengths
Our
business strategy and our goal to become a successful resource player are not
proprietary. However, we believe we possess several strengths that
could differentiate our performance over time. We believe our key
strengths are as follows:
High Quality
Asset Base. We own what we believe is a unique asset base in key onshore
hydrocarbon basins. Approximately 85% of our reserves are natural gas
and, except for some minor non-core properties, most of our assets are located
in our core areas of the Sacramento Basin of California, the Rockies, and South
Texas. Thus, we are both relatively concentrated, yet geographically
diverse. Our concentration allows us to achieve scale, while the
geographic diversity exposes us to different commodity pricing locations,
including some premium markets. In addition, a significant portion of
our legacy asset base requires relatively low levels of maintenance capital,
which enhances our flexibility to allocate capital. In combination
with our new resource plays, our asset base is capable of yielding growth from a
large and growing inventory of projects. We also believe our current
asset base provides a strong platform for additional acquisitions.
Resource
Assessment Capability and Inventory Generation. We have established
multi-disciplinary teams that are skilled at conducting comprehensive resource
assessments on a field and regional basis. This work helps us
indentify and catalog an inventory of low to moderate risk opportunities
that provide us with multiple years of drilling projects. We expect
to continue to add to our diversified portfolio of non-proved resource inventory
over time from both our legacy properties, as well as from our emerging resource
plays.
Operational
Control. We operate approximately 87% of our estimated proved reserves,
which allows us to more effectively manage expenses and control the timing of
capital spending on our exploration and development activities. In
addition, we have a very high working interest in most of our properties and a
high percentage of acreage that is held by production. These factors
also give us greater flexibility over our activities.
Experienced
Management Team. Our executive management team has an average of 30 years
of experience in the energy industry with specific experience in the areas where
our core properties are located. In November 2007, Randy L. Limbacher became our
President and Chief Executive Officer (“CEO”). In February 2010, Mr. Limbacher
became our Chairman of the Board. Mr. Limbacher has more than 29 years of
experience in the energy industry, most recently serving as President,
Exploration and Production - Americas for ConocoPhillips. Since coming to
Rosetta, Mr. Limbacher has continued to hire personnel with technical and
commercial experience in unconventional resource plays.
Proven Technical
and Land Personnel with Access to Technological Resources. Our technical
staff includes 57 geologists, geophysicists, landmen, engineers and technicians
with an average of over 14 years of relevant technical experience. Our staff has
experience in analyzing complex structural and stratigraphic plays using 3-D
geophysical expertise, producing and optimizing low pressure natural gas
reservoirs, detecting low contrast, low permeability pay opportunities,
drilling, completing and fracing of deep tight natural gas reservoirs, operating
in complex basins and managing coalbed methane operations. These core
competencies helped us to achieve a net drilling success rate of 83% for the
year ended December 31, 2009 and helped maximize recovery from our
reservoirs.
Our
Operating Areas
We own
core producing and non-producing oil and natural gas properties in proven or
prospective basins that are primarily located in California, the Rockies, and
South Texas. We also have non-core positions in the State Waters of
Texas and the Gulf of Mexico. For the year ended December 31, 2009,
we drilled 43 gross and 36 net wells, with a net success rate of 83%. The
following is a summary of our major operating areas.
California
Historically,
the Sacramento Basin is one of California’s most prolific gas producing areas,
containing a majority of the state’s largest gas fields. It is
located near the Northern California natural gas markets and has an established
natural gas gathering and pipeline infrastructure. We are one of the
largest producers and leaseholders in the basin.
As of
December 31, 2009, we owned approximately 60,000 net acres in the Rio Vista
Field and other fields in the Sacramento Basin areas. We believe our
acreage in the basin holds significant low-risk, low-cost reserves, and numerous
workover and recompletion opportunities. Additional reserve potential
exists in gathering system optimization projects, fracture stimulation
opportunities in lower permeability, low contrast pays, and deeper gas bearing
sands.
For the
year ended December 31, 2009, our average net daily production from the Rio
Vista Field and surrounding fields in the Sacramento Basin was 42.4
MMcfe/d. In 2009, we drilled one gross well which was
successful.
Rio Vista Field. The Rio
Vista Gas Unit and a significant portion of the deep rights below the Rio Vista
Gas Unit, which together constitute the greater Rio Vista Field, is the largest
onshore natural gas field in California and one of the 15 largest natural gas
fields in the United States. The field has produced a cumulative 3.7 Tcfe of
natural gas reserves to date since its discovery in 1936. We currently produce
from or have behind-pipe reserves in multiple zones at depths ranging from 2,000
feet to 11,000 feet in the field. The Rio Vista Field is a faulted, downthrown
rollover anticline, elongated to the northwest. The current productive area is
approximately ten miles long and nine miles wide. We completed a successful low
cost, by-passed pay recompletion program during 2009. Our 2009
recompletion program consisted of 40 projects with a total combined capital cost
of $2.1 million.
As of
December 31, 2009, there was one workover rig currently working on our wells in
the Rio Vista area. We plan to conduct approximately 20 workovers,
recompletions or reactivation operations on field wells during
2010. Moreover, a majority of our time and effort in 2010 will be
devoted to resource assessments within the Rio Vista Gas Field. The
resource assessments are expected to generate future drilling and recompletion
inventory for 2011 and beyond.
Rockies
As of
December 31, 2009, we owned approximately 160,000 net acres in the Rockies and
had approximately 230,000 net acres under an exploration option in the Alberta
Basin of Montana. Our production is concentrated in three basins: the
DJ Basin, San Juan Basin and Greater Green River Basin. Our average
net daily production for the year ended December 31, 2009 was 19.0
MMcfe/d. In 2009, we drilled five gross wells, all of which were
successful.
DJ Basin, Colorado. As
of December 31, 2009, we had a majority working interest in approximately 94,000
net acres with 154 square miles of 3-D seismic data. In 2009, due to
low commodity prices, we chose to not drill and focused our efforts on resource
assessment. For the year ended December 31, 2009, our average net
daily production from the DJ Basin was 7.9 MMcfe/d. We commenced a
105-well drilling program in the first quarter of 2010 and expect to be
completed by mid-year. This program is matched with favorable hedges
in the Rockies that will improve project returns.
San Juan Basin, New Mexico.
The San Juan Basin is the second most prolific gas basin in North America, with
significant contribution coming from the Fruitland Coal Bed Methane (“CBM”)
trend. There is CBM production from depths of 1,600 feet surrounding our
leasehold. As of December 31, 2009, we had a 100% working interest in
approximately 16,000 net acres. In 2009, we drilled 3 CBM
wells, all of which were successful. For the year ended December 31,
2009, our average net daily production from the San Juan Basin was
5.0 MMcfe/d.
Pinedale,
Wyoming. On December 11, 2008, we purchased a 90% working
interest in 1,280 acres of the Pinedale field from Pinedale Energy LLC, a
subsidiary of Constellation Energy Group, Inc. We purchased 28
productive natural gas wells and one salt water disposal well. On
February 4, 2009, we purchased the remaining 10% working interest in the 1,280
acres in the Pinedale field from Nielsen & Associates, Inc. and obtained
operatorship of the properties. Detailed resource assessment work
commenced in the fourth quarter of 2009, which led to the implementation of
three recompletions before year end. As assessment work continues in
2010, it is anticipated that new drilling and recompletion inventory will be
identified. For the year ended December 31, 2009, our average net
daily production from Pinedale was 6.0 MMcfe/d.
Alberta Basin,
Montana. The Alberta Basin play is a westward analog of the
industry’s Bakken and Three Forks plays of the Williston Basin of Montana and
North Dakota. On December 24, 2008, Rosetta received approval from
the Bureau of Indian Affairs to option approximately 200,000 net acres located
on the Blackfeet Indian Reservation in Western Montana. In 2009, we
initiated the technical assessment of our acreage position by drilling two test
wells, of which one was vertical and one was horizontal. We also
continued land acquisition and consolidation efforts through fee and allottee
leasing. As of year-end, our acreage position increased to
approximately 240,000 net acres, including approximately 230,000 net acres under
exploration option agreements.
South
Texas
As of
December 31, 2009, we owned approximately 170,000 net acres in South
Texas. Our production in South Texas comes from the Lobo, Olmos, and
Perdido sand trends and the Eagle Ford Shale trend and averaged 55.7 MMcfe/d for
the year ended December 31, 2009. In 2009, we drilled 31 gross wells,
of which 25 were successful. Additionally, we have significantly
expanded our acreage holdings in the rapidly developing Eagle Ford Shale trend,
and we maintain a significant position in the emerging Dinn Sand
trend.
Lobo Trend. We are
a significant producer in the South Texas Lobo Trend, with 470 square miles of
3-D seismic and 255 operated producing wells. Our working interests
range from 50% to 100%, but most of our acreage is 100% owned and
operated. In 2009, we shot a new proprietary 3-D seismic survey
covering 112 square miles of our Lobo acreage. The data has been
processed and is being evaluated to identify additional drilling
locations. For the year ended December 31, 2009, our average net
daily production from the Lobo trend was 44.1 MMcfe/d. In 2009, we
drilled 27 gross wells, of which 21 were successful.
Discovered
in 1973, the Lobo trend of South Texas is a complex, highly faulted sand that
has produced over 8 Tcf of natural gas. The Lobo trend produces from tight sands
with low permeabilities and high pressures at depths from 7,500 to 10,000
feet.
Eagle Ford Shale
Trend. The Eagle Ford Shale trend has emerged as a focus area
for Rosetta in South Texas. In 2009, we continued to acquire
additional sizable acreage tracts with potential in this evolving shale gas
play. Since 2008, we have accumulated approximately 53,000 net acres
in the Eagle Ford Shale trend. Most of this acreage also has
potential in the Austin Chalk and Edwards formations, as well as the newly
emerging Pearsall Shale gas trend. In 2009, we drilled four gross
wells to gather and evaluate the shale with core and log data. We
then took two wells horizontal, completing both wells, each having approximately
4,000 foot laterals, with 10-stage hydraulic fracture treatments. For
the quarter ended December 31, 2009, our average net daily production was 4.3
MMcfe/d.
Olmos Trend. On
December 23, 2008, we closed on the acquisition of a 70% non-operated working
interest in 231 gross producing Olmos wells in the Olmos trend of South
Texas. Production from these wells averaged 3.8 MMcfe/d for the year
ended December 31, 2009.
Perdido Sand Trend. We own a
50% non-operated working interest in the South Texas Perdido Sand trend. The
Perdido Sands are comprised of tight natural gas sands and are in isolated fault
blocks that are stratigraphically trapped below the Upper Wilcox structures at
approximately 8,000 to 9,500 feet. We plan to continue to coordinate
with the operator to improve horizontal and vertical drilling techniques to
lower cost and increase performance. For the year ended
December 31, 2009, our average net daily production was 6.5 MMcfe/d from 37
producing wells (24 horizontal and 13 vertical).
Dinn Sand
Trend. In 2008, we acquired a significant acreage position
with approximately 100% operated working interest adjacent to our existing
Perdido development trend. This leasehold acquisition has
potential in the intermediate depth Dinn Sand trend. The Dinn Sand
has been sparsely developed with vertical wells, and has potential for
additional horizontal and vertical well development over most of the
leasehold. Additionally, much of the leasehold has potential for
extending the Perdido Sand trend horizontal development from our adjacent
non-operated 50% working interest acreage to this operated 100% working interest
leasehold.
Other
Onshore
In the
Other Onshore region, we currently have approximately 12,000 net acres under
lease with an average non-operated working interest of 47%. Some of
these properties are potential divestiture candidates in the
future.
Texas
State Waters
We own a 50% operated
working interest through a joint venture in Sabine Lake, within Texas State
Waters of Jefferson County and Louisiana State Waters of Cameron Parish, and
additional non-operated properties in Texas State Waters near Nueces
Bay. During 2009, we drilled three gross wells which were
successful. Net production averaged 5.4 MMcfe/d during
2009. As of December 31, 2009, we held interests in approximately
4,000 net acres with 72 square miles of 3-D seismic data. These
properties are considered to be non-core and are likely divestiture
candidates.
Gulf
of Mexico
Federal Waters. We
own working interests in 12 offshore blocks ranging from 20% to 100% working
interest with approximately 28,000 net acres. For the year ended
December 31, 2009, our average net daily production from these blocks was 6.4
MMcfe/d. These properties are considered to be non-core and are
likely divestiture candidates.
Title
to Properties
Our
properties are subject to customary royalty interests, liens incident to
operating agreements, liens for current taxes and other burdens, including other
mineral encumbrances and restrictions as well as mortgage liens on at least 80%
of our proved reserves in accordance with our credit facilities. We do not
believe that any of these burdens materially interfere with our use of the
properties in the operation of our business.
We
believe that we generally have satisfactory title to or rights in all of our
producing properties. As is customary in the oil and natural gas industry, we
make minimal investigation of title at the time we acquire undeveloped
properties. We make title investigations and receive title opinions of local
counsel only before we commence drilling operations. We believe that we have
satisfactory title to all of our other assets. Although title to our properties
is subject to encumbrances in certain cases, we believe that none of these
burdens will materially detract from the value of our properties or from our
interest therein or will materially interfere with our use in the operation of
our business.
Crude
Oil and Natural Gas Operations
Production
by Operating Area
The
following table presents certain information with respect to our production data
for the period presented:
|
For
the Year Ended December 31, 2009
|
||||||||||||||||
|
Natural
Gas
(Bcf)
|
NGLs
(MBbls)
|
Oil
(MBbls)
|
Equivalents
(Bcfe)
|
|||||||||||||
|
California
|
15.3 | - | 28.3 | 15.5 | ||||||||||||
|
Rockies
|
6.8 | - | 19.8 | 6.9 | ||||||||||||
|
South
Texas
|
16.3 | 548.4 | 117.0 | 20.3 | ||||||||||||
|
Other
Onshore
|
2.8 | 33.8 | 94.0 | 3.6 | ||||||||||||
|
Texas
State Waters
|
1.5 | 21.1 | 62.3 | 2.0 | ||||||||||||
|
Gulf
of Mexico
|
1.8 | 16.8 | 72.5 | 2.3 | ||||||||||||
|
Total
|
44.5 | 620.1 | 393.9 | 50.6 | ||||||||||||
For
additional information regarding our oil and gas production, production prices
and production costs see Item 7. “Management’s Discussion and
Analysis of Financial Condition and Results of Operations – Operating
Expenses.”
Proved
Reserves
There are
a number of uncertainties inherent in estimating quantities of proved reserves,
including many factors beyond our control, such as commodity pricing. Therefore,
the reserve information in this report represents only estimates. Reserve
engineering is a subjective process of estimating underground accumulations of
oil and natural gas that cannot be measured in an exact manner. The accuracy of
any reserve estimate is a function of the quality of available data and of
engineering and geological interpretation and judgment. As a result, estimates
of different engineers may vary. In addition, results of drilling, testing and
production subsequent to the date of an estimate may justify revising the
original estimate. Accordingly, initial reserve estimates are often different
from the quantities of oil and natural gas that are ultimately recovered. The
meaningfulness of such estimates depends primarily on the accuracy of the
assumptions upon which they were based. Except to the extent that we acquire
additional properties containing proved reserves or conduct successful
exploration and development activities, or both, our proved reserves will
decline as reserves are produced.
As of
December 31, 2009, we had an estimated 351.1 Bcfe of proved oil and natural
gas reserves, including 296.8 Bcf of natural gas, 3,825 MBbls of oil and
condensate and 5,221 MBbls of NGLs, of which 75% was proved
developed. As of December 31, 2009 and based on the 2009 twelve-month
first day of the month historical average referenced prices as adjusted for
basis and quality differentials, our reserves had an estimated standardized
measure of discounted future net cash flows of $465 million. In
December 2008, the Securities and Exchange Commission (“SEC”) issued its final
rule, Modernization of Oil and Gas Reporting (Release No. 33-8995), which is
effective for reporting 2009 reserve information. The primary impacts
of the SEC’s final rule on our reserve estimates include:
|
|
·
|
the
use of the twelve-month first day of the month historical average prices
adjusted for basis and quality differentials for West Texas Intermediate
oil of $57.65 per Bbl and Henry Hub natural gas of $3.87 per MMBtu
compared to the use of year-end prices adjusted for basis and quality
differentials for West Texas Intermediate oil of $76.00 per Bbl and Henry
Hub natural gas of $5.79 per MMBtu at December 31, 2009 as previously
required under SEC guidelines;
|
|
|
·
|
the
requirement that all proved undeveloped locations be developed within five
years. As of December 31, 2009, we did not have any proved
undeveloped locations to be developed beyond five years and we have the
intent to develop all of our proved undeveloped locations within this five
year timeframe; and
|
|
|
·
|
the
inclusion of proved undeveloped locations beyond one-offset is allowed if
there is reasonable certainty of economic producibility. A few
of our undeveloped locations are beyond one-offset and current production
data, logs, microseismic, and geologic data supports reasonable certainty
of economic producibility.
|
Under the
SEC’s final rule, prior period reserves were not
restated.
The
following table sets forth, by operating area, a summary of our estimated net
proved reserve information as of December 31, 2009:
|
Estimated
Proved Reserves at December 31, 2009 (1)(2)
|
||||||||||||||||||||||||||||||||||||||||
|
Developed
|
Undeveloped
|
|||||||||||||||||||||||||||||||||||||||
|
Natural
Gas
(Bcf)
|
NGLs
(MMBbls)
|
Oil
(MMBbls)
|
Total
(Bcfe)
|
Natural
Gas
(Bcf)
|
NGLs
(MMBbls)
|
Oil
(MMBbls)
|
Total
(Bcfe)
|
Total
(Bcfe)
|
Percent
of Total
Reserves
|
|||||||||||||||||||||||||||||||
|
California
|
74.88 | - | 0.05 | 75.17 | 14.55 | - | 0.01 | 14.60 | 89.8 | 26 | % | |||||||||||||||||||||||||||||
|
Rockies
|
64.80 | - | 0.25 | 66.27 | 3.86 | - | - | 3.86 | 70.1 | 20 | % | |||||||||||||||||||||||||||||
|
South
Texas
|
69.72 | 2.06 | 0.52 | 85.17 | 40.21 | 2.84 | 1.47 | 66.07 | 151.3 | 43 | % | |||||||||||||||||||||||||||||
|
Other
Onshore
|
13.63 | 0.00 | 0.52 | 16.75 | - | - | - | - | 16.7 | 5 | % | |||||||||||||||||||||||||||||
|
Texas
State Waters
|
4.10 | 0.24 | 0.27 | 7.16 | - | - | - | - | 7.2 | 2 | % | |||||||||||||||||||||||||||||
|
Gulf
of Mexico
|
9.48 | 0.05 | 0.72 | 14.10 | 1.54 | 0.03 | 0.02 | 1.89 | 16.0 | 4 | % | |||||||||||||||||||||||||||||
|
Total
|
236.61 | 2.35 | 2.33 | 264.62 | 60.16 | 2.87 | 1.50 | 86.42 | 351.1 | 100 | % | |||||||||||||||||||||||||||||
___________________________________
|
|
(1)
|
These
estimates are based upon a reserve report prepared using internally
developed reserve estimates and criteria in compliance with the SEC
guidelines and audited by Netherland Sewell & Associates, Inc.
(hereafter “NSAI”), independent petroleum engineers. See Item
7. “Management’s Discussion and Analysis of Financial Condition
and Results of Operations - Critical Accounting Policies and Estimates”
and Item 8. “Financial Statements and Supplementary Data - Supplemental
Oil and Gas Disclosures.” NSAI’s report is attached as Exhibit
99.1 to this Form 10-K.
|
|
|
(2)
|
The
reserve volumes and values were determined under the method prescribed by
the SEC, which for 2009 requires the use of an average price, calculated
as the twelve-month first day of the month historical average price for
the twelve-month period prior to the end of the reporting period, unless
prices are defined by contractual arrangements, excluding escalations
based upon future conditions. For years prior to 2009, the SEC
rules required the use of year-end
prices.
|
All of
our proved undeveloped reserves are scheduled for development within five years
and at December 31, 2009, we did not have any proved undeveloped reserves
greater than five years.
As of
December 31, 2009, we had proved undeveloped reserves of 86.4 Bcfe, an increase
of 15.6 Bcfe relative to December 31, 2008. Significant additions to
proved undeveloped reserves resulted primarily from additional proved
undeveloped locations in our Eagle Ford Shale acreage.
In
accordance with SEC guidelines, the reserve engineers’ estimates of future net
revenues from our properties, and the present value of the properties, are made
using the twelve-month first day of the month historical average oil and gas
prices for the December 31, 2009 reserves and oil and gas sales prices in effect
as of the end of the period of such estimates for prior periods, and are held
constant throughout the life of the properties, except where the guidelines
permit alternate treatment, including the use of fixed and determinable
contractual price escalations. Historically, the prices for oil and
gas have been volatile and are likely to continue to be volatile in the
future.
The table
below sets forth our proved reserves calculated according to prior SEC
guidelines using the year-end oil and natural gas prices adjusted for basis and
quality differentials rather than the twelve-month first day of the month
historical average prices adjusted for basis and quality
differentials:
|
Proved
Reserves
|
||||||||||||||||
|
Natural
Gas
(Bcf)
|
NGLs
(MMBbls)
|
Oil
(MMBbls)
|
Total
(Bcfe)
|
|||||||||||||
|
Price
Scenario 1 (1)
|
355.7 | 5.6 | 3.7 | 411.6 | ||||||||||||
___________________________________
|
|
(1)
|
Price
Scenario 1 assumes a West Texas Intermediate oil price adjusted for basis
and quality differentials of $76.00 per Bbl and a Henry Hub natural gas
price adjusted for basis and quality differentials of $5.79 per MMBtu at
December 31, 2009.
|
Internal
Control
The
preparation of our reserve estimates are completed in accordance with our
prescribed internal control procedures, which include verification of input data
into a reserve forecasting and economic evaluation software, as well as
management review. The Company’s primary reserves estimator is the
Company’s Chief Engineer and Operations General Manager who has twenty-two years
of experience in the petroleum industry with 18 years of experience in the
evaluation of reserves and income attributable to oil and gas properties. She
holds a Bachelor of Science in Petroleum Engineering, a Bachelor of Science in
Geosciences and a Master of Business Administration from the University of
Tulsa. She also holds a Master of Science in Petroleum Engineering
from the University of Houston. She obtained a Doctor of
Jurisprudence from South Texas College of Law and is a member of Phi Delta Phi
honorary law society and the Society of Petroleum Engineers.
Our
corporate reservoir engineering department reports to our Chief Engineer and
Operations General Manager who maintains oversight and compliance responsibility
for the internal reserve estimate process and provides appropriate data to
independent third party engineers for the annual audit of our year-end reserves.
The management of our corporate reservoir engineering group, including the Chief
Engineer, consists of two degreed petroleum engineers, with an average of 26
years of industry experience in reservoir engineering/management.
Qualifications
of Third Party Engineers
The
technical personnel responsible for preparing the reserve estimates at NSAI meet
the requirements regarding qualifications, independence, objectivity, and
confidentiality set forth in the Standards Pertaining to the Estimating and
Auditing of Oil and Gas Reserves Information promulgated by the Society of
Petroleum Engineers. NSAI is an independent firm of petroleum
engineers, geologists, geophysicists, and petrophysicists; it does not own an
interest in our properties and is not employed on a contingent fee
basis. NSAI’s President and Chief Operating Officer is a licensed
professional engineer with more than 30 years of experience and the geoscientist
charged with the audit is a licensed professional with 25 years of
experience.
2009
Capital Expenditures
The
following table summarizes information regarding our development and exploration
capital expenditures for the years ended December 31, 2009, 2008
and 2007:
|
Year
Ended December 31,
|
||||||||||||
|
2009
|
2008
|
2007
|
||||||||||
|
(In
thousands)
|
||||||||||||
|
Capital
Expenditures by Operating Area:
|
||||||||||||
|
California
|
$ | 7,453 | $ | 42,429 | $ | 58,493 | ||||||
|
Rockies
|
17,227 | 25,015 | 23,904 | |||||||||
|
South
Texas
|
59,547 | 94,567 | 105,301 | |||||||||
|
Other
Onshore
|
2,974 | 12,927 | 29,796 | |||||||||
|
Texas
State Waters
|
4,545 | 8,541 | 27,000 | |||||||||
|
Gulf
of Mexico (1)
|
(2,788 | ) | 422 | 28,523 | ||||||||
|
Leasehold
|
22,066 | 17,883 | 8,838 | |||||||||
|
Acquisitions
|
3,624 | 115,074 | 38,656 | |||||||||
|
Delay
rentals
|
1,683 | 1,451 | 1,409 | |||||||||
|
Geological
and geophysical/seismic
|
8,558 | 4,571 | 4,422 | |||||||||
|
Total
capital expenditures (2)
|
$ | 124,889 | $ | 322,880 | $ | 326,342 | ||||||
___________________________________
|
|
(1)
|
During
the first quarter of 2009, a capital expenditure accrual for approximately
$3.6 million was removed from capitalized costs. The accrued
capital expenditure related to a property for which we had a non-operating
interest. The well was drilled and operated by a third party
prior to 2009. During the latter part of 2008, the operator
sold their interest to a different third party and it was determined that
there were to be no future capital obligations to the original
operator. As such, the accrued capital expenditure was
removed. Actual capital expenditures in the Gulf of Mexico
during 2009 totaled approximately $0.8 million and were primarily related
to drilling and completion costs and plug and abandonment
costs.
|
|
|
(2)
|
Capital
expenditures for the year ended December 31, 2009 exclude capitalized
internal costs directly identified with acquisition, exploration and
development activities of $4.8 million, capitalized interest of $1.2
million and corporate other capital costs of $4.1
million. Capital expenditures for the year ended December 31,
2008 exclude capitalized internal costs directly identified with
acquisition, exploration and development activities of $7.1 million,
capitalized interest of $1.4 million and corporate other capital costs of
$3.0 million. Capital expenditures for the year ended December 31, 2007
exclude capitalized internal costs directly identified with acquisition,
exploration and development activities of $5.5 million, capitalized
interest of $2.4 million and corporate other capital costs of $1.8
million. Corporate other capital costs consist of costs related
to IT software/hardware, office furniture and fixtures and license
transfer fees.
|
Productive
Wells and Acreage
The
following table sets forth our interest in undeveloped acreage, developed
acreage and productive wells in which we own a working interest as of
December 31, 2009. “Gross” represents the total number of acres or
wells in which we own a working interest. “Net” represents our
proportionate working interest resulting from our ownership in the gross acres
or wells. Productive wells are wells in which we have a working interest and
that are capable of producing oil or natural gas.
|
Productive
Wells (1)
|
||||||||||||||||||||||||||||||||
|
Undeveloped
Acres
|
Developed
Acres
|
Gross
|
Net
|
|||||||||||||||||||||||||||||
|
Gross
|
Net
|
Gross
|
Net
|
Natural
Gas
|
Oil
|
Natural
Gas
|
Oil
|
|||||||||||||||||||||||||
|
California
|
23,712 | 16,178 | 53,671 | 44,188 | 158 | - | 147 | - | ||||||||||||||||||||||||
|
Rockies
(2)
|
148,714 | 131,200 | 36,016 | 28,527 | 264 | 2 | 232 | 1 | ||||||||||||||||||||||||
|
South
Texas
|
113,315 | 99,902 | 103,229 | 69,546 | 531 | 2 | 411 | 2 | ||||||||||||||||||||||||
|
Other
Onshore
|
9,379 | 3,260 | 29,259 | 9,034 | 236 | 15 | 30 | 6 | ||||||||||||||||||||||||
|
Texas
State Waters
|
4,913 | 2,456 | 4,800 | 1,302 | 1 | - | 1 | - | ||||||||||||||||||||||||
|
Gulf
of Mexico
|
7,500 | 5,000 | 35,752 | 22,513 | 2 | 1 | 1 | 1 | ||||||||||||||||||||||||
|
Total
|
307,533 | 257,996 | 262,727 | 175,110 | 1,192 | 20 | 822 | 10 | ||||||||||||||||||||||||
___________________________________
|
|
(1)
|
Offshore
productive wells are based on intervals rather than well
bores.
|
|
|
(2)
|
Excludes
230,000 net undeveloped acres under exploration option in the Alberta
Basin of Montana.
|
Of our
productive wells listed above, there were 13 and 14 multiple completions in
Texas and California, respectively.
The
following table shows our interest in undeveloped acreage as of
December 31, 2009 that is subject to expiration in 2010, 2011, 2012 and
thereafter:
|
2010
|
2011
|
2012
|
Thereafter
|
|||||||||||
|
Gross
|
Net
|
Gross
|
Net
|
Gross
|
Net
|
Gross
|
Net
|
|||||||
|
127,466
|
111,294
|
87,863
|
76,050
|
47,812
|
40,088
|
44,392
|
30,564
|
|||||||
Drilling
Activity
The
following table sets forth the number of gross exploratory and development wells
we drilled or in which we participated during the last three fiscal years. The
number of wells drilled refers to the number of wells completed at any time
during the respective fiscal year. Productive wells are either
producing wells or wells capable of commercial production.
|
Gross
Wells
|
||||||||||||||||||||||||
|
Exploratory
|
Development
|
|||||||||||||||||||||||
|
Productive
|
Dry
|
Total
|
Productive
|
Dry
|
Total
|
|||||||||||||||||||
|
2009
|
7.0 | - | 7.0 | 30.0 | 6.0 | 36.0 | ||||||||||||||||||
|
2008
|
3.0 | 1.0 | 4.0 | 160.0 | 20.0 | 180.0 | ||||||||||||||||||
|
2007
|
11.0 | 7.0 | 18.0 | 149.0 | 28.0 | 177.0 | ||||||||||||||||||
The
following table sets forth, for each of the last three fiscal years, the number
of net exploratory and net development wells drilled by us based on our
proportionate working interest in such wells.
|
Net
Wells
|
||||||||||||||||||||||||
|
Exploratory
|
Development
|
|||||||||||||||||||||||
|
Productive
|
Dry
|
Total
|
Productive
|
Dry
|
Total
|
|||||||||||||||||||
|
2009
|
6.1 | - | 6.1 | 23.4 | 6.0 | 29.4 | ||||||||||||||||||
|
2008
|
1.9 | 1.0 | 2.9 | 132.7 | 15.9 | 148.6 | ||||||||||||||||||
|
2007
|
7.5 | 5.1 | 12.6 | 130.2 | 26.5 | 156.7 | ||||||||||||||||||
As of
December 31, 2009, we had one well in process. This well is located
in the Alberta Basin and we own a 100% working interest in this
well.
Marketing
and Customers
We have
entered into a natural gas purchase and sales contract with Calpine Energy
Services (“CES”) for the dedicated California production, which runs through
December 2019. Under the terms of this agreement, we are obligated to
sell all our existing and future production from our California leases in
production as of May 1, 2005 based on market
prices. For the month of December 2009, this dedicated
California production comprised approximately 33% of our overall daily
equivalent production.
Under the
terms of the purchase and sales contract with CES, cash payment for all natural
gas volumes that are contractually sold to CES on the previous day are deposited
into our bank account. If the funds are not deposited one business day in
arrears in accordance with our contracts, we are not obligated to continue to
sell our production to CES and these sales may cease immediately. We would then
be in a position to market this natural gas production to other parties. CES has
60 days to pay amounts owed to us, at which time, provided CES has fully cured
such payment default, we are obligated under the contract to resume natural gas
sales to CES.
We may
market our remaining natural gas production in California to parties other than
CES. All of our other production (other than our dedicated California
production being sold to CES, as described above) is sold to various purchasers,
including CES, at market rates. We market all of our oil and gas
production and have expanded our internal capabilities in this regard, both by
hiring experienced personnel and implementing our own licensed
systems.
Major
Customers
For the
year ended December 31, 2009, we had one major customer, CES, which accounted
for approximately 57% of our consolidated annual revenue.
Competition
The oil
and natural gas industry is highly competitive, and we compete with a
substantial number of other companies that have greater resources than we do.
Many of these companies explore for, produce and market oil and natural gas,
carry on refining operations and market the resulting products on a worldwide
basis. The primary areas in which we encounter substantial competition are in
locating and acquiring desirable leasehold acreage for our drilling and
development operations, locating and acquiring attractive producing oil and
natural gas properties, and obtaining purchasers and transporters of the oil and
natural gas we produce. There is also competition between producers of oil and
natural gas and other industries producing alternative energy and fuel.
Furthermore, competitive conditions may be substantially affected by various
forms of energy legislation and/or regulation considered from time to time by
the federal, state and local government. It is not possible to
predict the nature of any such legislation or regulation that may ultimately be
adopted or its effects upon our future operations. Such legislation and
regulations may, however, substantially increase the costs of exploring for,
developing, producing or marketing natural gas and oil and may prevent or delay
the commencement or continuation of a given operation. The effect of these risks
cannot be accurately predicted.
Seasonal
Nature of Business
Generally,
but not always, the demand for natural gas decreases during the summer months
and increases during the winter months. Seasonal anomalies such as
mild winters or abnormally hot summers sometimes lessen this fluctuation. In
addition, certain natural gas users utilize natural gas storage facilities and
purchase some of their anticipated winter requirements during the summer. This
can also lessen seasonal demand fluctuations. Seasonal weather conditions and
lease stipulations can limit our drilling and producing activities and other oil
and natural gas operations in certain areas. These seasonal anomalies can
increase competition for equipment, supplies and personnel during the spring and
summer months, which could lead to shortages and increase costs or delay our
operations.
Government
Regulation
The
oil and gas industry is subject to extensive laws that are subject to
change. These laws have a significant impact on oil and gas
exploration, production and marketing activities, and increase the cost of doing
business, and consequently, affect profitability. Some of the legislation and
regulation affecting the oil and gas industry carry significant penalties for
failure to comply. While there can be no assurance that we will not incur fines
or penalties, we believe we are currently in material compliance with the
applicable federal, state and local laws. Because enactment of new
laws affecting the oil and gas business is common and because existing laws are
often amended or reinterpreted, we are unable to predict the future cost or
impact of complying with such laws. We do not expect that any of
these laws would affect us in a materially different manner than any other
similarly sized oil and gas company operating in the United
States. The following are significant types of legislation affecting
our business.
Exploration
and Production Regulation
Oil and
natural gas production is regulated under a wide range of federal, state and
local statutes, rules, orders and regulations, including laws related to
location of wells, drilling and casing of wells, well production limitations;
spill prevention plans; surface use and restoration; platform, facility and
equipment removal; the calculation and disbursement of royalties; the plugging
and abandonment of wells; bonding; permits for drilling operations; and
production, severance and ad valorem taxes. Oil and gas companies can encounter
delays in drilling from the permitting process and requirements. Our
operations are subject to regulations governing operation restrictions and
conservation matters, including provisions for the unitization or pooling of oil
and natural gas properties, the establishment of maximum rates of production
from oil and natural gas wells, and prevention of flaring or venting of natural
gas. The conservation laws have the effect of limiting the amount of oil and gas
we can produce from our wells and limit the number of wells or the locations at
which we can drill.
Environmental
Regulation
General. Our
operations are subject to extensive environmental, health and safety regulation
by federal, state and local agencies. These requirements govern the
handling, generation, storage and management of hazardous substances, including
how these substances are released or discharged into the air, water, surface and
subsurface. These laws and regulations often require permits and approvals from
various agencies before we can commence or modify our operations or facilities,
and on occasion (especially on federally-managed land) require the preparation
of an environmental impact assessment or study (which can result in the
imposition of various conditions and mitigation measures) prior to or in
connection with obtaining such permits. In connection with releases
of hydrocarbons or hazardous substances into the environment, we may be
responsible for the costs of remediation even if we did not cause the release or
were not otherwise at fault, under applicable laws. These costs can
be substantial and we evaluate them regularly as part of our environmental and
asset retirement programs. Failure to comply with applicable laws,
permits or regulations can result in project or operational delays, civil or in
some cases criminal fines and penalties and remedial obligations.
Sacramento and San Joaquin Rivers
Delta. In November 2009, the California State legislature
enacted and the governor signed a package of four bills, as well as an $11.14
billion bond measure to be voted on by the California voters in the November
2010 election. These bills promise to restore and maintain the delta
resulting from the confluence of the Sacramento and San Joaquin rivers, while
simultaneously sending needed water to the farmers in the western San Joaquin
Valley and to urban and farming water users to the south. The Company
currently produces about one third of its natural gas in this delta. We are
involved in monitoring and providing comments to the anticipated plans, rules
and regulations to be proposed by the State committees responsible for
implementing this legislation. To the extent that the State elects to
proceed with a peripheral canal, certain of the proposed options for the route
of such a canal have the potential to impact some of our land and access rights
in our Rio Vista Gas Field. In addition, proposed habitat restoration
goals under the regulatory programs may be significant, and may include reduced
or discontinued maintenance of certain existing levees to allow marshlands to
return to their natural state. As a result, the implementation of
this legislation and associated regulatory programs (and any potential
peripheral canal) may increase significantly the Company’s costs to maintain
certain levees, and may affect our operations in the Rio Vista Gas
Field.
Climate
Change. Current and future regulatory initiatives directed at
climate change may increase our operating costs and may, in the future, reduce
the demand for some of our produced materials. The United
States Congress is currently considering legislation on climate
change. In June 2009, the U.S. House of Representatives passed a
comprehensive clean energy and climate bill (H.R. 2454, also known as
“Waxman-Markey”). In the Senate, the Boxer-Kerry climate bill has
been reported out of the Senate Environment and Public Works
Committee. These bills have a variety of provisions and differences,
but in substance they both propose a “cap and trade” approach to greenhouse gas
regulation. Under such an approach, companies would be required to
hold sufficient emission allowances to cover their greenhouse gas
emissions. Over time, the total number of allowances would be reduced
or expire, thereby relying on market-based incentives to allocate investment in
emission reductions across the economy. As the number of available
allowances declines, the cost would presumably increase. In addition
to the prospect of federal legislation, several states have adopted or are in
the process of adopting greenhouse gas reporting or cap-and-trade
programs. Therefore, while the outcome of the federal and state
legislative processes is currently uncertain, if such an approach were adopted
(either by domestic legislation, international treaty obligation or domestic
regulation), we would expect our operating costs to increase as we buy
additional allowances or embark on emission reduction programs.
Even
without further federal legislation, the United States Environmental Protection
Agency (EPA) may act to regulate greenhouse gas emissions. In April
2007, the United States Supreme Court concluded that greenhouse gas emissions
from automobiles were “air pollutants” within the meaning of the applicable
provisions of the federal Clean Air Act. Relying in part on that
precedent, in December 2009, the EPA released an Endangerment and Cause or
Contribute Findings for Greenhouse Gases, which became effective in January
2010. This regulatory finding sets the foundation for future EPA
greenhouse gas regulation under the Clean Air Act. The EPA also
promulgated a new greenhouse gas reporting rule, which became effective in
December 2009, and which requires facilities that emit more than 25,000 tons per
year of carbon dioxide-equivalent emissions to prepare and file certain emission
reports. The portion of the rule pertaining to fugitive and vented
methane emissions from the oil and gas sector has not yet been incorporated into
the final rule and remains proposed. If this portion of the proposed
rule is ultimately promulgated, some of our facilities may be subject to the
reporting requirements. Finally, in September 2009, the EPA proposed
a new regulation, subject to public comment and not yet effective, which would
impose additional permitting requirements on certain stationary
sources. Depending on the final outcome of this rulemaking, some of
our facilities may be subject to additional operating and other permit
requirements. As a result of these regulatory initiatives, our operating costs
may increase in compliance with these programs, although we are not situated
differently in this respect from our competitors in the industry.
Hydraulic
Fracturing. Congress is also considering legislation that
would repeal the current exemption in the Safe Drinking Water Act’s underground
injection control program for hydraulic fracturing. We and our
competitors use hydraulic fracturing in our shale gas operations. If
this legislation is passed, it would impose additional requirements on our
hydraulic fracturing operations, we would face additional requirements,
including permitting requirements, financial assurances, public disclosure
obligations, monitoring and reporting requirements. Such a result
could increase our operating costs. The disclosure requirements also
could increase the possibility of third-party or government legal challenges to
hydraulic fracturing. Even without such legislation, hydraulic
fracturing has come under increased regulatory scrutiny in certain locations,
such as New York, although our operations have not yet been
affected.
Wyoming Air
Permit. On February 12, 2010, we received a Notice of
Violation (“Notice”) from the Wyoming Department of Environmental Quality
(“Wyoming DEQ”) regarding a multiple wellsite facility for wet gas/condensate
production and six associated wells located in Sublette County, Wyoming
(collectively, the “Wellsite”). The Notice alleges that we did not obtain
a construction permit prior to constructing the Wellsite, and that we operated
the Wellsite in violation of applicable regulations by allegedly having failed
to control air emissions from six associated wells. The Notice threatens
referral of this matter to the Wyoming Attorney General for “appropriate
penalties,” which could include civil penalties or injunctive relief. We
have responded to the Notice, are in the process of implementing corrective
action and have agreed with the Wyoming DEQ to discuss possible settlement of
this matter. If we do not reach a settlement, we will contest any
associated litigation. No civil penalties have been imposed nor has the Wyoming
DEQ yet requested a specific civil penalty amount, although the maximum daily
penalty for such violations is $10,000 per violation per day. Given the
preliminary stage of this matter and the inherent uncertainty of enforcement
actions of this nature, the Company is presently unable to predict the ultimate
outcome of this enforcement action.
Insurance
Matters
As is
common in the oil and natural gas industry, we do not insure fully against all
risks associated with our business either because such insurance is unavailable
or because premium costs are considered prohibitive. A loss not fully covered by
insurance could have a materially adverse effect on our financial position,
results of operations or cash flows. We maintain insurance at
industry customary levels to limit our financial exposure in the event of a
substantial environmental claim resulting from sudden, unanticipated and
accidental discharges of certain prohibited substances into the
environment. Such insurance might not cover the complete amount of
such a claim and would not cover fines or penalties for a violation of an
environmental law. In analyzing our operations and insurance needs,
and in recognition that we have a large number of individual well locations with
varied geographical distribution, we compared premium costs to the likelihood of
material loss of production. Based on this analysis, we have elected, at this
time, not to carry loss of production or business interruption insurance for our
operations. We carry limited property insurance for loss or damage caused by
earthquakes and our energy package insurance, including property insurance, is
limited to $4 million in the aggregate for any single named windstorm with a
$2.5 million retention.
Filings
of Reserve Estimates with Other Agencies
We
annually file estimates of our oil and gas reserves with the United States
Department of Energy (“DOE”) for those properties which we
operate. During 2009, we filed estimates of our oil and gas reserves
as of December 31, 2008 with the DOE, which differ by five percent or less from
the reserve data presented in the Annual Report on Form 10-K for the year ended
December 31, 2008. For information concerning proved
natural gas and crude oil reserves, refer to Item 8. Financial Statements
and Supplementary Data, Supplemental Oil and
Gas Disclosures.
Employees
As of
February 22, 2010, we had 203 full time employees. We also contract for the
services of consultants involved in land, regulatory, accounting, financial,
legal and other disciplines, as needed. As of February 22, 2010, we
had contracted approximately 22 consultants. None of our employees
are represented by labor unions or covered by any collective bargaining
agreement. We believe that our relations with our employees are
satisfactory.
Available
Information
Through
our website, http://www.rosettaresources.com, you can access, free of
charge, our
filings with the SEC, including our annual reports on Form 10-K, quarterly
reports on Form 10-Q, current reports on Form 8-K, and amendments to those
reports filed or furnished pursuant to Section 13(a) or 15(d) of the Exchange
Act, our proxy statements, our Code of Business Conduct and Ethics, Nominating
and Corporate Governance Committee Charter, Audit Committee Charter, and
Compensation Committee Charter. You may also read and copy any
materials that we file with the SEC at the SEC’s Public Reference Room at 100 F
Street, NE, Room 1580, Washington, D.C. 20549. You may obtain
information on the operation of the Public Reference Room by calling the SEC at
1-800-SEC-0330. In addition, the SEC maintains a website that contains reports,
proxy and information statements and other information that is filed
electronically with the SEC. The website can be accessed at http://www.sec.gov.
Item 1A. Risk Factors
Broad
industry or economic factors may adversely affect the timing of and extent to
which we can effectively implement our strategy shift to an onshore
unconventional resource player.
Our
strategy shift is an important element of positioning us for more predictable,
sustainable future performance. In conjunction with pursuing this
shift, we recognize that several factors could impact our ability to execute the
shift, including: (i) a sustained downturn of commodity prices, (ii) a lack of
inventory potential within existing assets, (iii) an inability to attract and
retain the personnel necessary to implement an unconventional resource business
model, and (iv) a lack of access to credit. We have processes in
place to track and monitor these trends on an ongoing basis. At this
time, we believe the rationale and the goals for the strategy shift are intact;
however, current market conditions could impact the pace of the planned
shift.
Adverse
capital and credit market conditions may significantly affect our ability to
meet liquidity needs, access to capital and cost of capital.
While
there are signs that the economy may be improving, the potential remains for
further volatility and disruption in the capital and credit
markets. During 2009, the markets produced downward pressure on stock
prices and credit capacity for certain issuers without regard to those issuers’
underlying financial strength. If these levels of market disruption
and volatility return, our business, financial condition and results of
operations, as well as our ability to access capital, may all be negatively
impacted.
The
deterioration in the credit markets, combined with a decline in commodity
prices, may impact our capital expenditure level and also our counterparty
risk.
While we
seek to fund our capital expenditures primarily from cash flows from operating
activities, we have in the past also drawn on unused capacity under our existing
revolving credit facility for capital expenditures. While we have not
received any indication from our lenders that our ability to draw on our
existing revolving credit facility has been restricted, it is possible that our
borrowing base, which is based on our oil and gas reserves and is subject to
review and adjustment on a semi-annual basis, with the next review scheduled to
begin on April 1, 2010, and other interim adjustments, may be reduced when it is
reviewed. In the event that our borrowing base is reduced,
outstanding borrowings in excess of the revised base will be due
immediately. As we do not have a substantial amount of unpledged
property, we may not have the financial resources to make the mandatory
prepayments. A reduction in our ability to borrow under our existing
revolving credit facility, combined with a reduction in cash flow from operating
activities resulting from a decline in commodity prices, may require us
to reduce our capital expenditures further, which may in turn adversely
affect our ability to carry out our business plan. Furthermore, if we lack
the resources to dedicate sufficient capital expenditures to our existing oil
and gas leases, we may be unable to produce adequate quantities of oil and gas
to retain these leases and they may expire due to a lack of
production. The loss of leases could have a material adverse effect
on our results of operations.
The
impairment of financial institutions or counterparty credit default could
adversely affect us.
We have
exposure to different counterparties, and we have entered into transactions with
counterparties in the financial services industry, including commercial banks,
investment banks, insurance companies, other investment funds and other
institutions. These transactions expose us to credit risk in the
event of default by our counterparties. Further deterioration in the
credit markets may impact the credit ratings of our current and potential
counterparties and affect their ability to fulfill their existing obligations to
us and their willingness to enter into future transactions with
us. We have exposure to these financial institutions in the form of
oil and gas derivative contracts, which protect our cash flows when commodity
prices decline. During periods of low oil and gas prices, we may have
significant exposure to our derivative counterparties and the value of our
derivative positions may provide a significant amount of cash
flow. We also maintain insurance policies with insurance companies to
protect us against certain risks inherent in our business. In
addition, if any lender under our credit facility is unable to fund its
commitment, our liquidity will be reduced by an amount up to the aggregate
amount of such lender’s commitment under our credit
facility. Currently, no single lender in our credit facility has
commitments representing more than 13% of our total
commitments. However, if banks continue to consolidate, we may
experience a more concentrated credit risk.
Oil
and natural gas prices are volatile, and a decline in oil and natural gas prices
would significantly affect our financial results and impede our
growth. Additionally, our results are subject to commodity price
fluctuations related to seasonal and market conditions and reservoir and
production risks.
Our
revenue, profitability and cash flow depend substantially upon the prices and
demand for oil and natural gas. The markets for these commodities are volatile,
and even relatively modest drops in prices can significantly affect our
financial results and impede our growth. Prices for oil and natural gas
fluctuate widely in response to relatively minor changes in the supply and
demand for oil and natural gas, market uncertainty and a variety of additional
factors beyond our control, such as:
|
|
–
|
Domestic
and foreign supply of oil and natural
gas;
|
|
|
–
|
Price
and quantity of foreign imports;
|
|
|
–
|
Actions
of the Organization of Petroleum Exporting Countries and state-controlled
oil companies relating to oil price and production
controls;
|
|
|
–
|
Consumer
demand;
|
|
|
–
|
Conservation
of resources;
|
|
|
–
|
Regional
price differentials and quality differentials of oil and natural
gas;
|
|
|
–
|
Domestic
and foreign governmental regulations, actions and
taxes;
|
|
|
–
|
Political
conditions in or affecting other oil producing and natural gas producing
countries, including the current conflicts in the Middle East and
conditions in South America and
Russia;
|
|
|
–
|
Weather
conditions and natural disasters;
|
|
|
–
|
Technological
advances affecting oil and natural gas
consumption;
|
|
|
–
|
Overall
U.S. and global economic
conditions;
|
|
|
–
|
Price
and availability of alternative
fuels;
|
|
|
–
|
Seasonal
variations in oil and natural gas
prices;
|
|
|
–
|
Variations
in levels of production; and
|
|
|
–
|
The
completion of exploration and production
projects.
|
Further,
oil and natural gas prices do not necessarily fluctuate in direct relationship
to each other. Because the majority of our estimated proved reserves are natural
gas reserves, our financial results are more sensitive to movements in natural
gas prices. Lower oil and natural gas prices may not only decrease our revenues
on a per unit basis but also may reduce the amount of oil and natural gas that
we can produce economically. Thus, a continued weakness in commodity prices may
result in our having to make substantial downward adjustments to our estimated
proved reserves and could have a material adverse effect on our financial
position, results of operations and cash flows.
Development
and exploration drilling activities do not ensure reserve replacement and thus
our ability to produce revenue.
Development
and exploration drilling and strategic acquisitions are the main methods of
replacing reserves. However, development and exploration drilling operations may
not result in any increases in reserves for various reasons. Development and
exploration drilling operations may be curtailed, delayed or cancelled as a
result of:
|
|
–
|
Lack
of acceptable prospective acreage;
|
|
|
–
|
Inadequate
capital resources;
|
|
|
–
|
Weather
conditions and natural disasters;
|
|
|
–
|
Title
problems;
|
|
|
–
|
Compliance
with governmental regulations;
|
|
|
–
|
Mechanical
difficulties; and
|
|
|
–
|
Unavailability
or high cost of equipment, drilling rigs, supplies or
services.
|
Our
future oil and natural gas production depends on our success in finding or
acquiring additional reserves. If we fail to replace reserves through drilling
or acquisitions, our level of production and cash flows will be affected
adversely. In general, production from oil and natural gas properties declines
as reserves are depleted, with the rate of decline depending on reservoir
characteristics. Our total proved reserves decline as reserves are produced. Our
ability to make the necessary capital investment to maintain or expand our asset
base of oil and natural gas reserves would be impaired to the extent cash flow
from operations is reduced and external sources of capital become limited or
unavailable. We may not be successful in exploring for, developing or acquiring
additional reserves.
We
sell a significant amount of our production to one customer.
We have a
natural gas purchase and sale contract with CES, which runs through December
2019. Under this contract, we are obligated to sell all of our existing and
future production from our California leases in production as of May 1,
2005 at market prices. For the month of December 2009, this
dedicated California production comprised approximately 33% of our overall
production based on an equivalent unit basis. Additionally, under separate
monthly spot agreements, we may sell some of our natural gas production to
Calpine, which could increase our credit exposure to Calpine. Under the terms of
our contract with CES and spot agreements with CES, all natural gas volumes that
are contractually sold to CES are collateralized by CES making margin payments
one business day in arrears to our collateral account equal to the previous
day’s natural gas sales. In the event of a default by CES, we could be exposed
to the loss of up to four days of natural gas sales revenue under these
contracts, which at prices and volumes in effect as of December 31, 2009
would be approximately $1.0 million.
We
will require additional capital to fund our future activities. If we fail to
obtain additional capital, we may not be able to implement fully our business
plan, which could lead to a decline in reserves.
Future
projects and acquisitions will depend on our ability to obtain financing beyond
our cash flow from operations. We may finance our business plan and operations
primarily with internally generated cash flow, bank borrowings and sales of
common stock. In the future, we will require substantial capital to
fund our business plan and operations. Sufficient capital may not be available
on acceptable terms or at all. If we cannot obtain additional capital resources,
we may curtail our drilling, development and other activities or be forced to
sell some of our assets on unfavorable terms.
The
terms of our credit facilities contain a number of covenants. If we
are unable to comply with these covenants, our lenders could accelerate the
repayment of our indebtedness.
The terms
of our credit facilities subject us to a number of covenants that impose
restrictions on us, including our ability to incur indebtedness and liens, make
loans and investments, make capital expenditures, sell assets, engage in
mergers, consolidations and acquisitions, enter into transactions with
affiliates, enter into sale and leaseback transactions and pay dividends on our
common stock. We are also required by the terms of our credit facilities to
comply with financial covenant ratios. A more detailed description of
our credit facilities is included in Item 7. “Management’s Discussion and
Analysis of Financial Condition and Results of Operations - Liquidity
and Capital Resources” and the footnotes to the Consolidated Financial
Statements.
A breach
of any of the covenants imposed on us by the terms of our indebtedness,
including the financial covenants under our credit facilities, could result in a
default under such indebtedness. In the event of a default, the lenders for our
revolving credit facility could terminate their commitments to us, and they and
the lenders of our second lien term loan could accelerate the repayment of all
of our indebtedness. In such case, we may not have sufficient funds to pay the
total amount of accelerated obligations, and our lenders under the credit
facilities could proceed against the collateral securing the facilities, which
is substantially all of our assets. Any acceleration in the repayment of our
indebtedness or related foreclosure could adversely affect our
business.
Properties
we acquire may not produce as expected, and we may be unable to determine
reserve potential, identify liabilities associated with the properties or obtain
protection from sellers against such liabilities.
We
continually review opportunities to acquire producing properties, undeveloped
acreage and drilling prospects; however, such reviews are not capable of
identifying all potential conditions. Generally, it is not feasible to review in
depth every individual property involved in each acquisition. Ordinarily, we
will focus our review efforts on higher value properties or properties with
known adverse conditions and will sample the remainder.
However,
even a detailed review of records and properties may not necessarily reveal
existing or potential problems or permit a buyer to become sufficiently familiar
with the properties to assess fully their condition, any deficiencies, and
development potential. Inspections may not always be performed on every well,
and environmental problems, such as ground water contamination are not
necessarily observable even when an inspection is undertaken.
We
believe we have good and defensible title to all our properties, including those
held by production. As is customary in the industry, before we drill our
exploration and development wells, we secure external legal opinions on our
legal title for the properties involved. We also may perform curative work
with respect to significant defects to title. We are typically responsible for
curing any title defects at our expense. This curative work may include the
acquisition of additional property rights in order to perfect our ownership for
development and production of the mineral estate. We also may be required to
respond to claims regarding possible threats to our title to our properties,
including clouds on our title, concerning which, if we are unsuccessful could
result in the worst case, to the loss of our title. In those situations,
we are subject to increased costs in defending our title against possible claims
and if we are unsuccessful in this regard, possible damages, including amounts
of revenues from prior production during those time periods for which a claim
for revenue may be brought.
Our
exploration and development activities may not be commercially
successful.
Exploration
activities involve numerous risks, including the risk that no commercially
productive oil or natural gas reservoirs will be discovered. In addition, the
future cost and timing of drilling, completing and producing wells is often
uncertain. Furthermore, drilling operations may be curtailed, delayed or
cancelled as a result of a variety of factors, including:
|
|
–
|
Unexpected
drilling conditions; pressure or irregularities in formations; equipment
failures or accidents;
|
|
|
–
|
Adverse
weather conditions, including hurricanes, which are common in the Gulf of
Mexico during certain times of the year; compliance with governmental
regulations; unavailability or high cost of drilling rigs, equipment or
labor;
|
|
|
–
|
Possible
federal, state, regional and municipal regulatory moratoriums on new
permits, delays in securing new permits, changes to existing permitting
requirements without “grandfathering” of existing permits and possible
prohibition and limitations with regard to certain completion
activities;
|
|
|
–
|
Reductions
in oil and natural gas prices; and
|
|
|
–
|
Limitations
in the market for oil and natural
gas.
|
Our
decisions to purchase, explore, develop and exploit prospects or properties
depend in part on data obtained through geophysical and geological analyses,
production data and engineering studies, the results of which are often
uncertain. Even when used and properly interpreted, 3-D seismic data and
visualization techniques only assist geoscientists in identifying subsurface
structures and hydrocarbon indicators. They do not allow the interpreter to know
conclusively if hydrocarbons are present or producible economically. In
addition, the use of 3-D seismic and other advanced technologies requires
greater pre-drilling expenditures than traditional drilling strategies. Because
of these factors, we could incur losses as a result of exploratory drilling
expenditures. Poor results from exploration activities could have a material
adverse effect on our future financial position, results of operations and cash
flows.
Numerous
uncertainties are inherent in our estimates of oil and natural gas reserves and
our estimated reserve quantities and present value calculations may not be
accurate. Any material inaccuracies in these reserve estimates or underlying
assumptions will affect materially the estimated quantities and present value of
our reserves.
Estimates
of proved oil and natural gas reserves and the future net cash flows
attributable to those reserves are prepared by our engineers and audited by
independent petroleum engineers and geologists. There are numerous
uncertainties inherent in estimating quantities of proved oil and natural gas
reserves and cash flows attributable to such reserves, including factors beyond
our engineers' control. Reserve engineering is a subjective process of
estimating underground accumulations of oil and natural gas that cannot be
measured in an exact manner. The accuracy of an estimate of quantities of
reserves, or of cash flows attributable to such reserves, is a function of the
available data, assumptions regarding future oil and natural gas prices,
expenditures for future development and exploration activities, engineering and
geological interpretation and judgment. Additionally, reserves and future cash
flows may be subject to material downward or upward revisions, based upon
production history, development and exploration activities and prices of oil and
natural gas. As an example, our internally generated reserve report for year end
2009 includes the downward revision of 60.5 Bcfe of proved reserves due to the
use of the twelve-month first day of the month historical average price compared
to year-end commodity prices, or approximately 15% of previously estimated
reserves. Actual future production, revenue, taxes, development
expenditures, operating expenses, underlying information, quantities of
recoverable reserves and the value of cash flows from such reserves may vary
significantly from the assumptions and underlying information set forth herein.
In addition, different reserve engineers may make different estimates of
reserves and cash flows based on the same available data. The present value of
future net revenues from our proved reserves referred to in this report is not
necessarily the actual current market value of our estimated oil and natural gas
reserves. In accordance with SEC requirements, we base the estimated discounted
future net cash flows from our proved reserves on fixed prices and costs as of
the date of the estimate. Our reserves as of December 31, 2009 were
based on the twelve-month first day of the month historical average West Texas
Intermediate oil prices adjusted for basis and quality differentials of $57.65
per Bbl and the twelve-month first day of the month historical average Henry Hub
gas prices adjusted for basis and quality differentials of $3.87 per MMbtu
compared to the year-end prices adjusted for basis and quality differentials of
$41.00 per Bbl and $5.71 per MMBtu, respectively, at December 31,
2008. Actual future prices and costs fluctuate over time and may
differ materially from those used in the present value estimate. In addition,
discounted future net cash flows are estimated assuming royalties to the
Minerals Management Service, royalty owners and other state and federal
regulatory agencies with respect to our affected properties, and will be paid or
suspended during the life of the properties based upon oil and natural gas
prices as of the date of the estimate. Since actual future prices fluctuate over
time, royalties may be required to be paid for various portions of the life of
the properties and suspended for other portions of the life of the
properties.
The
timing of both the production and expenses from the development and production
of oil and natural gas properties will affect both the timing of actual future
net cash flows from our proved reserves and their present value. In addition,
the 10% discount factor that we use to calculate the net present value of future
net cash flows for reporting purposes in accordance with the SEC’s rules may not
necessarily be the most appropriate discount factor. The effective interest rate
at various times and the risks associated with our business or the oil and
natural gas industry, in general, will affect the appropriateness of the 10%
discount factor in arriving at an accurate net present value of future net cash
flows.
We
are subject to the full cost ceiling limitation which has resulted in a
write-down of our estimated net reserves and may result in a write-down in the
future if commodity prices continue to decline.
Under the
full cost method, we are subject to quarterly calculations of a “ceiling” or
limitation on the amount of our oil and gas properties that can be capitalized
on our balance sheet. If the net capitalized costs of our oil and gas properties
exceed the cost ceiling, we are subject to a ceiling test write-down of our
estimated net reserves to the extent of such excess. If required, it would
reduce earnings and impact stockholders’ equity in the period of occurrence and
result in lower amortization expense in future periods. The discounted present
value of our proved reserves is a major component of the ceiling calculation and
represents the component that requires the most subjective
judgments. The current ceiling calculation utilizes a twelve-month
first day of the month historical average price and does not allow for us to
re-evaluate the calculation subsequent to the end of the period if prices
increase. It also dictates that costs in effect as of the last day of
the quarter are held constant. Prior to December 31, 2009, ceiling
calculation guidance dictated that prices in effect as of the last day of the
quarter or annual period be used and allowed a write-down to be reduced or
avoided if prices increased subsequent to the end of a quarter or annual period
but prior to the issuance of our financial statements in which a write-down
might otherwise be required. As of December 31, 2009, the use of the
recovery of prices after the end of the period is no longer
permitted. The risk that we will be required to write down the
carrying value of oil and natural gas properties increases when natural gas and
crude oil prices are depressed or volatile. In addition, a write-down
of proved oil and natural gas properties may occur if we experience substantial
downward adjustments to our estimated proved reserves. Expense
recorded in one period may not be reversed in a subsequent period even though
higher natural gas and crude oil prices may have increased the ceiling
applicable in the subsequent period.
For the
year ended December 31, 2009, we recognized a non-cash, pre-tax ceiling test
impairment of $379.5 million in the first quarter. For the year ended
December 31, 2008, we recognized a non-cash, pre-tax ceiling test
impairment of $205.7 million and $238.7 million in the third and fourth
quarters, respectively. Due to the volatility of commodity prices,
should natural gas prices continue to decline in the future, it is possible that
additional write-downs could occur.
In
addition, write-downs of proved oil and natural gas properties may occur if we
experience substantial downward adjustments to our estimated proved
reserves. For example, we recognized a downward revision to our
proved reserves in the third and fourth quarters of 2008. As we
are continuing to evaluate and test our asset base, it is possible that we may
recognize additional revisions to our proved reserves in the
future.
See Item
7. “Management’s Discussion and Analysis of Financial Condition and Results of
Operations - Critical Accounting Policies and Estimates” for further
information.
Government
laws and regulations can change.
Our
activities are subject to federal, state, regional and local laws and
regulations. Extensive laws, regulations and rules relate to activities and
operations in the oil and gas industry. Some of the laws,
regulations and rules contain provisions for significant fines and penalties for
non-compliance. Changes in laws and regulations could affect our
costs of operations and our profitability. Changes in laws and
regulations could also affect production levels, royalty obligations, price
levels, environmental requirements, and other matters affecting our
business. We are unable to predict changes to existing laws and
regulations or additions to laws and regulations. Such changes could
significantly impact our business, results of operations, cash flows, financial
position and future growth.
Our
business requires a sufficient level of staff with technical expertise,
specialized knowledge and training and a high degree of management
experience.
Our
success is largely dependent upon our ability to attract and retain personnel
with the skills and experience required for our business. An inability to
sufficiently staff our operations or the loss of the services of one or more
members of our senior management or of numerous employees with technical skills
could have a negative effect on our business, financial position, results of
operations, cash flows and future growth.
Market
conditions or transportation impediments may hinder our access to oil and
natural gas markets or delay our production.
Market
conditions, the unavailability of satisfactory oil and natural gas processing
and transportation or the remote location of certain of our drilling operations
may hinder our access to oil and natural gas markets or delay our production.
The availability of a ready market for our oil and natural gas production
depends on a number of factors, including the demand for and supply of oil and
natural gas and the proximity of reserves to pipelines or trucking and terminal
facilities. In the Gulf of Mexico operations, the availability of a ready market
depends on the proximity of and our ability to tie into existing production
platforms owned or operated by others and the ability to negotiate commercially
satisfactory arrangements with the owners or operators. Under
interruptible or short term transportation agreements, the transportation of our
gas may be interrupted due to capacity constraints on the applicable system, for
maintenance or repair of the system or for other reasons specified by the
particular agreements. We may be required to shut in natural gas
wells or delay initial production for lack of a market or because of inadequacy
or unavailability of natural gas pipelines or gathering system capacity. When
that occurs, we are unable to realize revenue from those wells until the
production can be tied to a gathering system. This can result in considerable
delays from the initial discovery of a reservoir to the actual production of the
oil and natural gas and realization of revenues.
Competition
in the oil and natural gas industry is intense, and many of our competitors have
resources that are greater than ours.
We
operate in a highly competitive environment for acquiring prospects and
productive properties, marketing oil and natural gas and securing equipment and
trained personnel. Many of our competitors, major and large independent oil and
natural gas companies, possess and employ financial, technical and personnel
resources substantially greater than our resources. Those companies may be able
to develop and acquire more prospects and productive properties than our
financial or personnel resources permit. Our ability to acquire additional
prospects and discover reserves in the future will depend on our ability to
evaluate and select suitable properties and consummate transactions in a highly
competitive environment. Also, there is substantial competition for capital
available for investment in the oil and natural gas industry. Larger competitors
may be better able to withstand sustained periods of unsuccessful drilling and
absorb the burden of changes in laws and regulations more easily than we can,
which would adversely affect our competitive position. We may not be able to
compete successfully in the future in acquiring prospective reserves, developing
reserves, marketing hydrocarbons, attracting and retaining quality personnel and
raising additional capital.
The
unavailability or high cost of drilling rigs, equipment, supplies, personnel and
oil field services could adversely affect our ability to execute our exploration
and development plans on a timely basis and within our budget.
Our
industry is cyclical and, from time to time, there is a shortage of drilling
rigs, equipment, supplies or qualified personnel. During these periods, the
costs and delivery times of rigs, equipment and supplies are substantially
greater. In addition, the demand for, and wage rates of, qualified drilling rig
crews rise as the number of active rigs in service increases. If oil and gas
prices increase in the future, increasing levels of exploration and production
could result in response to these stronger prices, and as a result, the demand
for oilfield services could rise, and the costs of these services could
increase, while the quality of these services may suffer. If the unavailability
or high cost of drilling rigs, equipment, supplies or qualified personnel were
particularly severe in Texas, California and the Rockies, we could be materially
and adversely affected because our operations and properties are concentrated in
those areas.
Operating
hazards, natural disasters or other interruptions of our operations could result
in potential liabilities, which may not be fully covered by our
insurance.
The oil
and natural gas business involves certain operating hazards such
as:
|
|
–
|
Well
blowouts;
|
|
|
–
|
Cratering;
|
|
|
–
|
Explosions;
|
|
|
–
|
Uncontrollable
flows of oil, natural gas, or well
fluids;
|
|
|
–
|
Fires;
|
|
|
–
|
Hurricanes,
tropical storms, earthquakes, mud slides, and
flooding;
|
|
|
–
|
Pollution;
and
|
|
|
–
|
Releases
of toxic gas.
|
The
occurrence of one of the above may result in injury, loss of life, property
damage, suspension of operations, environmental damage and remediation and/or
governmental investigations and penalties.
In
addition, our operations in California are especially susceptible to damage from
natural disasters such as earthquakes and fires and involve increased risks of
personal injury, property damage and marketing interruptions. Any of these
operating hazards could cause serious injuries, fatalities or property damage,
which could expose us to liabilities. The payment of any of these liabilities
could reduce, or even eliminate, the funds available for exploration,
development, and acquisition, or could result in a loss of our properties. Our
insurance policies provide limited coverage for losses or liabilities relating
to pollution, with broader coverage for sudden and accidental occurrences. Our
insurance might be inadequate to cover our liabilities. For example, we are not
fully insured against earthquake risk in California because of high premium
costs. Insurance covering earthquakes or other risks may not be available at
premium levels that justify its purchase in the future, if at all. In addition,
we are subject to energy package insurance coverage limitations related to any
single named windstorm. The insurance market in general and the energy insurance
market in particular have been difficult markets over the past several years.
Insurance costs could increase over the next few years and we may decrease
coverage and retain more risk to mitigate future cost increases. If we incur
substantial liability and the damages are not covered by insurance or are in
excess of policy limits, or if we incur a liability at a time when we are not
able to obtain liability insurance, then our business, financial position,
results of operations and cash flows could be materially adversely
affected. Because of the expense of the associated premiums and the
diversification of risk, we do not have any insurance coverage for any loss of
production as may be associated with these operating hazards.
Environmental
matters and costs can be significant.
The oil
and natural gas business is subject to various federal, state, and local laws
and regulations relating to discharge of materials into, and protection of, the
environment. Such laws and regulations may impose liability on us for
pollution clean-up, remediation, restoration and other liabilities arising from
or related to our operations. Any noncompliance with these laws and regulations
could subject us to material administrative, civil or criminal penalties or
other liabilities. Additionally, our compliance with these laws may, from time
to time, result in increased costs to our operations or decreased
production. We also may be liable for environmental damages caused by
the previous owners or operators of properties we have purchased or are
currently operating. The cost of future compliance is uncertain and is subject
to various factors, including future changes to laws and
regulations. We have no assurance that future changes in or additions
to the environmental laws and regulations will not have a significant impact on
our business, results of operations, cash flows, financial condition and future
growth.
Possible
regulations related to global warming and climate change could have an adverse
effect on our operations and the demand for oil and natural gas.
Recent
scientific studies have suggested that emissions of certain gases, commonly
referred to as "greenhouse gases," may be contributing to the warming of the
Earth's atmosphere. Methane, a primary component of natural gas, and
carbon dioxide, a byproduct of the burning of refined oil products and natural
gas, are examples of greenhouse gases. The U.S. Congress is
considering climate-related legislation to reduce emissions of greenhouse
gases. In addition, at least 20 states have developed measures to
regulate emissions of greenhouse gases, primarily through the planned
development of greenhouse gas emissions inventories and/or regional greenhouse
gas cap and trade programs. The U.S. Environmental Protection Agency
has adopted regulations requiring reporting of greenhouse gas emissions from
certain facilities and is considering additional regulation of greenhouse gases
as "air pollutants" under the existing federal Clean Air Act. Passage
of climate change legislation or other regulatory initiatives by Congress or
various states, or the adoption of regulations by the EPA or analogous state
agencies, that regulate or restrict emissions of greenhouse gases (including
methane or carbon dioxide) in areas in which we conduct business could have an
adverse effect on our operations and the demand for oil and natural
gas.
Our
acquisition strategy could fail or present unanticipated problems for our
business in the future, which could adversely affect our ability to make
acquisitions or realize anticipated benefits of those acquisitions.
Our
growth strategy includes acquiring oil and natural gas businesses and properties
if favorable economics and strategic objectives can be served. We may not be
able to identify suitable acquisition opportunities or finance and complete any
particular acquisition successfully.
Furthermore,
acquisitions involve a number of risks and challenges, including:
|
|
–
|
Diversion
of management’s attention;
|
|
|
–
|
Ability
or impediments to conducting thorough due diligence
activities;
|
|
|
–
|
The
need to integrate acquired
operations;
|
|
|
–
|
Potential
loss of key employees of the acquired
companies;
|
|
|
–
|
Potential
lack of operating experience in a geographic market of the acquired
business; and
|
|
|
–
|
An
increase in our expenses and working capital
requirements.
|
Any of
these factors could adversely affect our ability to achieve anticipated levels
of cash flows from the acquired businesses and properties or realize other
anticipated benefits of those acquisitions.
We
are vulnerable to risks associated with operating in the Gulf of Mexico and
inland waters region.
Our
operations and financial results could be significantly impacted by unique
conditions in the Gulf of Mexico and inland waters region because we explore and
produce in that area. As a result of this activity, we are vulnerable to the
risks associated with operating in the Gulf of Mexico and inland waters region,
including those relating to:
|
|
–
|
Adverse
weather conditions and natural
disasters;
|
|
|
–
|
Availability
of required performance bonds and
insurance;
|
|
|
–
|
Oil
field service costs and
availability;
|
|
|
–
|
Compliance
with environmental and other laws and
regulations;
|
|
|
–
|
Remediation
and other costs resulting from oil spills or releases of hazardous
materials; and
|
|
|
–
|
Failure
of equipment or facilities.
|
Further,
production of reserves from reservoirs in the Gulf of Mexico and inland waters
region generally decline more rapidly than from fields in many other producing
regions of the world. This results in recovery of a relatively higher percentage
of reserves from properties during the initial years of production, and as a
result, our reserve replacement needs from new prospects may be greater there
than for our operations elsewhere. Also, our revenues and return on capital will
depend significantly on prices prevailing during these relatively short
production periods.
Hedging
transactions may limit our potential revenue, result in financial losses or
reduce our income.
We have
entered into natural gas price hedging arrangements with respect to a portion of
our expected production through 2011. As of December 31, 2009, 13% and 13% of
our expected natural gas production was hedged using swaps and costless collars,
respectively, with settlement in 2010, and 5% and 23% of our expected natural
gas production was hedged using swaps and costless collars, respectively, with
settlement in 2011, based on anticipated future gas production. The
swaps to settle in 2010 have an average price of $7.46 per MMBtu and the collars
have floor and ceiling prices of $5.75 per MMBtu and $7.40 per MMBtu,
respectively. The swaps to settle in 2011 have an average price of
$5.72 per MMBtu and the collars have floor and ceiling prices of $5.80 per MMBtu
and $7.58 per MMBtu, respectively. In January 2010, we entered into
additional costless collar transactions to hedge 10,000 MMBtu/d of our expected
production for July 2010 through December 2012. The costless collars
have a floor price of $5.75 per MMBtu and a ceiling price of $6.50 per MMBtu
through 2011 and $7.15 per MMBtu in 2012. In February 2010, we
entered into natural gas fixed-price swaps to hedge 10,000 MMBtu/d of our
expected production for July 2010 through December 2011 at an average price of
$5.91 per MMBtu. Such transactions may limit our potential revenue if
oil and natural gas prices were to rise substantially over the price established
by the hedge. In addition, such transactions may expose us to the risk of loss
in certain circumstances, including instances in which our production is less
than expected, there is a widening of price differentials between delivery
points for our production and the delivery point assumed in the hedge
arrangement, or the counterparties to our hedging agreements fail to perform
under the contracts. Our current hedge positions are with
counterparties that are lenders in our credit facilities. Our lenders are
comprised of banks and financial institutions that could default or fail to
perform under our contractual agreements. A default under any of these
agreements could negatively impact our financial performance.
We have
also entered into a series of interest rate swap agreements to hedge the change
in the variable interest rates associated with our debt under our credit
facility. If interest rates should fall below the rate established in
the hedge, we will not receive the benefit of the lower interest
rates.
Certain
federal income tax deductions currently available with respect to oil and gas
exploration and development may be eliminated as a result of future
legislation.
Among the
changes contained in the President’s Fiscal Year 2011 budget proposal, released
by the White House on February 1, 2010, is the elimination or deferral of
certain key U.S. federal income tax deductions currently available to oil and
gas exploration and production companies. Such changes include, but are not
limited to, (i) the repeal of the percentage depletion allowance for oil and gas
properties; (ii) the elimination of current deductions for intangible drilling
and development costs; (iii) the elimination of the deduction for certain U.S.
production activities; and (iv) an extension of the amortization period for
certain geological and geophysical expenditures. Additionally, the Senate
version of the Oil Industry Tax Break Repeal Act of 2009, introduced on April
23, 2009, the Senate version of the Energy Fairness for America Act, introduced
on May 20, 2009 and the President’s Fiscal Year 2010 budget proposal, released
on February 26, 2009, include many of the proposals outlined in the President’s
Fiscal Year 2011 budget proposal. It is unclear, however, whether any such
changes will be enacted or how soon such changes could be
effective. The passage of any legislation as a result of the budget
proposal, either Senate bill or any other similar change in U.S. federal income
tax law could eliminate or defer certain tax deductions within the industry that
are currently available with respect to oil and gas exploration and development,
and any such change could negatively affect our financial condition and results
of operations.
Item 1B. Unresolved Staff Comments
None
Item 3. Legal Proceedings
Wyoming Air
Permit. On February 12, 2010, we received a Notice of
Violation (“Notice”) from the Wyoming Department of Environmental Quality
(“Wyoming DEQ”) regarding a multiple wellsite facility for wet gas/condensate
production and six associated wells located in Sublette County, Wyoming
(collectively, the “Wellsite”). The Notice alleges that we did not obtain
a construction permit prior to constructing the Wellsite, and that we operated
the Wellsite in violation of applicable regulations by allegedly having failed
to control air emissions from six associated wells. The Notice threatens
referral of this matter to the Wyoming Attorney General for “appropriate
penalties,” which could include civil penalties or injunctive relief. We
have responded to the Notice, are in the process of implementing corrective
action and have agreed with the Wyoming DEQ to discuss possible settlement of
this matter. If we do not reach a settlement, we will contest any
associated litigation. No civil penalties have been imposed nor has the Wyoming
DEQ yet requested a specific civil penalty amount, although the maximum daily
penalty for such violations is $10,000 per violation per day. Given the
preliminary stage of this matter and the inherent uncertainty of enforcement
actions of this nature, the Company is presently unable to predict the ultimate
outcome of this enforcement action.
We are
party to various other oil and natural gas litigation matters arising out of the
ordinary course of business. While the outcome of these proceedings
cannot be predicted with certainty, we do not expect these other matters to have
a material adverse effect on the consolidated financial statements.
Item 4. Submission of Matters to a Vote of Security
Holders
No
matters were submitted to a vote of our security holders during the fourth
quarter of 2009.
Part
II
Item 5. Market for Registrant’s Common Equity, Related
Stockholder Matters and Issuer Purchases of Equity Securities
Trading
Market
Our
common stock is listed on The NASDAQ Global Select Market® under the symbol
“ROSE”. The following table sets forth for the 2009 and 2008 periods
indicated the high and low sale prices of our common stock:
|
2009
|
2008
|
||||||||||||||||
|
High
|
Low
|
High
|
Low
|
||||||||||||||
|
January
1 - March 31
|
$ | 8.37 | $ | 3.52 |
January
1 - March 31
|
$ | 21.42 | $ | 16.20 | ||||||||
|
April
1 - June 30
|
10.17 | 4.81 |
April
1 - June 30
|
29.65 | 19.15 | ||||||||||||
|
July
1 - September 30
|
15.60 | 7.08 |
July
1 - September 30
|
29.20 | 16.67 | ||||||||||||
|
October
1 - December 31
|
20.62 | 12.35 |
October
1 - December 31
|
18.23 | 5.97 | ||||||||||||
The
number of shareholders of record on February 24, 2010 was approximately 10,500.
However, we estimate that we have a significantly greater number of beneficial
shareholders because a substantial number of our common shares are held of
record by brokers or dealers for the benefit of their customers.
We have
not paid a cash dividend on our common stock and currently intend to retain
earnings to fund the growth and development of our business. Any future change
in our policy will be made at the discretion of our board of directors in light
of our financial condition, capital requirements, earnings prospects and any
limitations imposed by our lenders or investors, as well as other factors the
Board of Directors may deem relevant. Our Senior Secured Revolving
Line of Credit agreement restricts our ability to pay cash dividends on our
common stock. See Item 8. “Financial Statements and Supplementary
Data Note 10 – Long-Term Debt.”
The
following table sets forth certain information with respect to repurchases of
our common stock during the three months ended December 31, 2009:
|
Period
|
Total
Number of Shares Purchased (1)
|
Average
Price Paid per Share
|
Total
Number of Shares Purchased as Part of Publicly Announced Plans or
Programs
|
Maximum
Number (or Approximate Dollar Value) of Shares that May yet Be Purchased
Under the Plans or Programs
|
||||||||||||
|
October
1 - October 31
|
2,700 | $ | 14.46 | - | - | |||||||||||
|
November
1 - November 30
|
10,043 | 13.77 | - | - | ||||||||||||
|
December
1 - December 31
|
351 | 16.47 | - | - | ||||||||||||
___________________________________
|
|
(1)
|
All
of the shares were surrendered by our employees to pay tax withholding
upon the vesting of restricted stock awards. These repurchases
were not part of a publicly announced program to repurchase shares of our
common stock, nor do we have a publicly announced program to repurchase
shares of common stock.
|
Stock
Performance Graph
The
following performance graph and related information shall not be deemed
“soliciting material” or to be “filed” with the Securities and Exchange
Commission, nor shall such information be incorporated by reference into any
future filing under the Securities Act of 1933 or Securities Exchange Act of
1934, each as amended, except to the extent that the Company specifically
incorporates it by reference into such filing.
The
following common stock performance graph shows the performance of Rosetta
Resources Inc. common stock up to December 31, 2009. As required by
applicable rules of the SEC, the performance graph shown below was prepared
based on the following assumptions:
|
|
·
|
A
$100 investment was made in Rosetta Resources Inc. common stock at the
opening trade price of $19.00 per share on February 13, 2006 (the first
full trading day following the Company’s initial public offering of its
common stock), and $100 was invested in each of the Standard & Poor’s
500 Index (S&P 500) and the Standard & Poor’s MidCap 400 Oil &
Gas Exploration & Production Index (S&P 400 E&P) at the
opening price on February 13, 2006.
|
|
|
·
|
All
dividends are reinvested for each measurement
period.
|
The
S&P 400 E&P Index is widely recognized in our industry and includes a
representative group of independent peer companies (weighted by market capital)
that are engaged in comparable exploration, development and production
operations.
Total
Return Among Rosetta Resources Inc., the S&P 500 Index and the S&P 400
O&G E&P Index
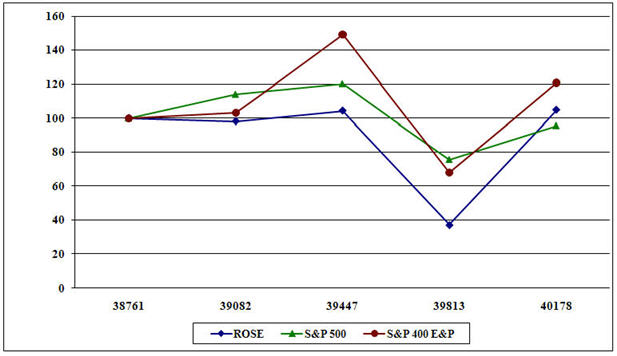
|
2/13/2006 (1)
|
12/31/2006
|
12/31/2007
|
12/31/2008
|
12/31/2009
|
||||||||||||||||
|
ROSE
|
$ | 100.00 | $ | 98.26 | $ | 104.37 | $ | 37.26 | $ | 104.84 | ||||||||||
|
S&P
500
|
100.00 | 113.86 | 120.12 | 75.67 | 95.70 | |||||||||||||||
|
S&P
400 E&P
|
100.00 | 103.24 | 149.13 | 67.84 | 120.86 | |||||||||||||||
___________________________________
(1)
February 13, 2006 was the first full trading day following the effective date of
our registration statement filed in connection with our initial public
offering.
Item 6. Selected Financial Data
The
following table sets forth our selected financial data. For the years
ended December 31, 2009, 2008, 2007 and 2006 and the six months ended
December 31, 2005 (Successor), the financial data has been derived from the
consolidated financial statements of Rosetta Resources Inc. For the
six months ended June 30, 2005 (Predecessor), the financial data was derived
from the combined financial statements of the domestic oil and natural gas
properties of Calpine and are presented on a carve-out basis to include the
historical operations of the domestic oil and natural gas
business. You should read the following selected historical
consolidated/combined financial data in connection with Item 7. “Management’s
Discussion and Analysis of Financial Condition and Results of Operations” and
the audited Consolidated Financial Statements and related notes included
elsewhere in this Form 10-K.
Additionally,
the historical financial data reflects successful efforts accounting for oil and
natural gas properties for the Predecessor periods described above and the full
cost method of accounting for oil and natural gas properties effective
July 1, 2005 for the Successor periods. In addition, on January
1, 2003, Calpine adopted authoritative guidance regarding the accounting for
stock-based compensation to measure the cost of employee services received in
exchange for an award of equity instruments, whereas we adopted the intrinsic
value method of accounting for stock options and stock awards pursuant to
authoritative guidance regarding stock issued to employees effective July 2005,
and as required, have subsequently adopted the guidance for stock-based
compensation under the most recent authoritative guidance for share-based
payments effective January 1, 2006.
|
Successor-Consolidated
|
Predecessor
- Combined
|
|||||||||||||||||||||||
|
Year
Ended
December
31,
|
Six
Months Ended
December
31,
|
Six
Months Ended
June
30,
|
||||||||||||||||||||||
|
2009
(1)
|
2008
(1)
|
2007
|
2006
|
2005
|
2005
|
|||||||||||||||||||
|
Operating
Data:
|
||||||||||||||||||||||||
|
Total
revenue
|
$ | 293,951 | $ | 499,347 | $ | 363,489 | $ | 271,763 | $ | 113,104 | $ | 103,831 | ||||||||||||
|
Net
income (loss)
|
(219,176 | ) | (188,110 | ) | 57,205 | 44,608 | 17,535 | 18,681 | ||||||||||||||||
|
Income
(loss) per share:
|
||||||||||||||||||||||||
|
Net
income (loss)
|
||||||||||||||||||||||||
|
Basic
|
(4.30 | ) | (3.71 | ) | 1.14 | 0.89 | 0.35 | 0.37 | ||||||||||||||||
|
Diluted
|
(4.30 | ) | (3.71 | ) | 1.13 | 0.88 | 0.35 | 0.37 | ||||||||||||||||
|
Cash
dividends declared per common share
|
- | - | - | - | - | - | ||||||||||||||||||
|
Balance
Sheet Data (At the end of the Period)
|
||||||||||||||||||||||||
|
Total
assets
|
879,584 | 1,154,378 | 1,357,214 | 1,219,405 | 1,119,269 | - | ||||||||||||||||||
|
Long-term
debt
|
288,742 | 300,000 | 245,000 | 240,000 | 240,000 | - | ||||||||||||||||||
|
Stockholders'
equity
|
493,095 | 726,372 | 872,955 | 822,289 | 715,423 | - | ||||||||||||||||||
____________________________________
|
|
(1)
|
Includes
a $379.5 million and a $444.4 million non-cash, pre-tax impairment charge
for the years ended December 31, 2009 and 2008,
respectively.
|
Item 7. Management’s Discussion and Analysis of Financial
Condition and Results of Operations
Overview
During
the past two years, Rosetta significantly transformed itself as a company. The
actions taken to affect this business shift were underpinned by a relatively
straightforward goal: to position the Company for visible and sustainable future
growth. We believe that achieving this goal is essential in order for Rosetta to
create long-term shareholder value. As part of our transformation, we took many
steps to improve the underlying fundamentals of virtually every aspect of our
business. Most notably, we committed to building a portfolio of high quality
unconventional assets with significant project inventory potential. In addition,
we sought to establish the technical and organizational competencies required
for executing a resource-driven business model. These asset and competency
efforts were matched with a fiscal approach that maintained relative
conservatism and a focus on cost control and efficiency. While we will continue
to evolve and optimize each of these areas over time, we believe we made
significant progress in transforming Rosetta into a “resource-player” since the
effort began in early 2008.
We
believe that our 2009 performance offers tangible evidence that our strategy
shift is yielding success. Against one of the most challenging business climates
in years, we lived within our means while delivering results from our activities
in new and legacy asset programs. Of significance, we note the
following highlights with respect to our performance in 2009:
|
|
·
|
We
tested two new shale plays, namely the Eagle Ford Shale in South Texas and
the Alberta Basin Bakken Shale in Montana. In the Eagle Ford, we grew our
acreage position and drilled four wells in the play. We completed two
wells, both of which were discoveries. The discoveries set up the
potential for a significant future development effort that will start in
2010.
|
|
|
·
|
In
the Alberta Basin Bakken Shale, we drilled two wells on our large
exploratory acreage position. We drilled and completed one horizontal well
and drilled one additional vertical well. We acquired core samples and ran
extensive log suites in both wells to obtain important geologic and
reservoir data about the play. Since we consider this early stage
exploration, we intend to fully analyze and evaluate our drilling,
completion and logging results in order to optimize our 2010 program
activity.
|
|
|
·
|
In
addition to testing our new shale plays, we advanced the studies of our
legacy assets using an “unconventional lens” approach. Under
this approach, our assets are thoroughly analyzed and re-engineered to
identify remaining resource potential. We believe our legacy
onshore assets, especially the DJ Basin and the Sacramento Basin, contain
significant remaining resource potential that was overlooked under a
historical exploitation approach that utilized conventional techniques. We
believe the project inventory potential of our legacy assets is a
competitive advantage for Rosetta.
|
|
|
·
|
We
identified assets for possible sale and established an ongoing process to
divest of non-core assets. During 2009, we designated our Gulf of Mexico,
Texas State Waters and several small assets as “non-core” given that they
do not have the unconventional resource characteristics we seek. We
generated approximately $20 million of proceeds from sales of a portion of
our non-core assets in 2009.
|
|
|
·
|
In
addition to asset sales, we took other measures to ensure our financial
flexibility during the year. We monitored capital program results on a
continuous basis and shifted or adjusted spending as necessary. We
refinanced our existing debt and extended our maturities. We hedged
selectively during the latter part of 2009 into a period of relative
commodity price strength.
|
In 2009,
our portfolio actions, in combination with prudent fiscal measures, strengthened
our ability to deliver on the visible and sustainable growth that we are
striving for as a resource player. Accordingly, we believe we enter 2010 at an
inflection point on performance. We believe that we are in the relatively early
stages of creating value from our meaningful positions in the new Eagle Ford and
Alberta Basin Bakken shale plays. With success in either or both of these plays,
we could recognize significant reserve and production upside to our current
levels. Furthermore, success in either or both of these plays could shift our
product mix toward a higher percentage of oil, which would provide attractive
diversification for Rosetta. Finally, we believe the inventory potential from
our legacy onshore assets provides a high-value base of production and reserves
with relatively low capital intensity. In combination with our new shale plays,
we believe Rosetta possesses a unique combination of assets for a company of our
size.
Our
business goals for 2010 are predicated on an announced 2010 capital program of
$280 million, subject to program results and timing. We expect to initiate
development activities in the Eagle Ford, where our efforts will likely focus in
the condensate-prone area surrounding our 2009 Gates Ranch discovery. We expect
to continue testing our Alberta Basin Bakken position, as well as conduct modest
programs in several legacy assets. We intend to continue our effort to build
lease positions in existing core areas, if possible, but also to pursue entry
into new basins of interest. We prefer organic opportunities, but we are also
expanding our capability to evaluate and pursue acquisition opportunities that
fit our business model. We believe this balanced approach is appropriate for
long-term success; however, it is not our intention or desire to pursue
acquisitions solely for the sake of growth, but rather that fit our strategic
and economic objectives.
We
recognize that, despite what we believe was a successful year in 2009, the
operating environment for our industry continues to be somewhat uncertain and
Rosetta’s success in 2010 or beyond is not assured. Commodity prices,
particularly for natural gas, continue to be impacted by anemic demand and the
lack of a meaningful supply response to lower prices in 2009. Access to some
oilfield services are starting to tighten. Attractive acquisitions or leasing
opportunities remain extremely competitive. Finally, given the early stage of
the Eagle Ford and Alberta Basin Bakken plays, there is still significant risk
to those programs. We attempt to manage these risks by carefully monitoring the
environment, working closely with our suppliers and vendors, staying abreast of
the marketplace, and moving at a deliberative pace in our new play programs.
Nevertheless, regardless of how effectively we manage these risks, they
represent threats to our ability to achieve our growth goals and build our asset
base.
In
approving our 2010 capital budget of $280 million, we indicated that the program
could be funded from internally generated cash flows plus cash on hand at an
average gas price of roughly $6 per Mcf and an average oil price of roughly $70
per Bbl. In that price environment, we believe that we have sufficient
liquidity and operational flexibility at this time to fund and actively manage
our stated capital expenditures program. We monitor our liquidity situation
continuously. We intend to maintain a position in which we can execute prudent
and timely decisions should commodity prices, services costs, or market
conditions change. In the event that we encounter a situation in
which we do not have sufficient internal funds to execute our planned capital
program, fund incremental organic opportunities or pursue attractive
acquisitions, we would consider curtailing our capital spending, drawing on the
unused capacity under our existing revolving credit facility or accessing
capital markets. As of December 31, 2009, we had $160.0 million of available
borrowing capacity under our revolving credit facility. We have not
received any indication from our lenders that draws under the credit facility
are restricted below current availability at this time and we are proactively
communicating with them on a routine basis. We affirmed our borrowing base in
the third quarter of 2009 at $350.0 million and the next redetermination is
scheduled to begin in March 2010. Our ability to raise additional capital
depends on the current state of the financial markets, which are subject to
general economic and industry conditions. Therefore, the availability
and price of capital in the financial markets could negatively affect our
liquidity position and cost of borrowed money.
In order
to ensure that Rosetta preserves the necessary financial flexibility, we work
closely with our lenders to stay abreast of market and creditor conditions. Of
note, our capital expenditures are primarily in areas where Rosetta acts as
operator and has high working interests. As a result, we do not
believe we have significant exposure to joint interest partners who
may be unable to fund their portion of any capital program, but we monitor
partner situations routinely.
Financial
Highlights
Our
consolidated financial statements reflect total revenue of $294.0 million on
total volumes of 50.6 Bcfe for the year ended December 31,
2009. Operating loss for the year ended December 31, 2009 was $326.7
million and included depreciation, depletion and amortization (“DD&A”)
expense of $121.0 million, a non-cash, pre-tax full cost ceiling test impairment
charge of $379.5 million, lease operating expense of $60.8 million and $7.5
million of compensation expense for stock-based compensation granted to
employees included in General and administrative costs. Total net other income
for the year ended December 31, 2009 was comprised of interest expense (net of
capitalized interest) on our long-term debt offset by interest income on
short-term cash investments.
Results
of Operations
The
following table summarizes the components of our revenues for the periods
indicated, as well as each period’s production volumes and average
prices:
|
Year
Ended December 31,
|
||||||||||||
|
2009
|
2008
|
2007
|
||||||||||
|
(In
thousands, except per unit amounts)
|
||||||||||||
|
Revenues:
|
||||||||||||
|
Natural
gas sales
|
$ | 250,684 | $ | 398,268 | $ | 295,644 | ||||||
|
Oil
sales
|
21,763 | 55,736 | 40,148 | |||||||||
|
NGL
sales
|
21,504 | 45,343 | 27,697 | |||||||||
|
Total
revenues
|
$ | 293,951 | $ | 499,347 | $ | 363,489 | ||||||
|
Production:
|
||||||||||||
|
Gas
(Bcf)
|
44.5 | 47.7 | 39.1 | |||||||||
|
Oil
(MBbls)
|
393.9 | 546.4 | 561.2 | |||||||||
|
NGLs
(MBbls)
|
620.1 | 440.8 | 557.0 | |||||||||
|
Total
equivalents (Bcfe)
|
50.6 | 53.6 | 45.8 | |||||||||
|
$
per unit:
|
||||||||||||
|
Avg.
gas price per Mcf
|
$ | 5.63 | $ | 8.35 | $ | 7.56 | ||||||
|
Avg.
gas price per Mcf excluding hedging
|
3.91 | 8.74 | 6.97 | |||||||||
|
Avg.
oil price per Bbl
|
55.25 | 102.00 | 71.54 | |||||||||
|
Avg.
NGL price per Bbl
|
34.68 | 102.87 | 49.73 | |||||||||
|
Avg.
revenue per Mcfe
|
5.81 | 9.32 | 7.94 | |||||||||
Revenues
Our
revenues are derived from the sale of our oil and natural gas production, which
includes the effects of qualifying commodity hedge contracts. Our
revenues may vary significantly from period to period as a result of changes in
commodity prices or volumes of production sold.
Year
Ended December 31, 2009 Compared to the Year Ended December 31,
2008
Total
revenue for the year ended December 31, 2009 was $294.0 million, which is a
decrease of $205.4 million, or 41%, from the year ended December 31,
2008. Approximately 85% of revenue was attributable to natural gas
sales.
Natural
Gas. For the year
ended December 31, 2009, natural gas revenue decreased by 37%, or $147.6
million, including the realized impact of derivative instruments, from the
comparable period in 2008, to $250.7 million. Of this decrease, $27.1
million is attributable to decreased volumes and $120.5 million is attributable
to lower average realized prices in 2009. The average realized
natural gas price including the effects of hedging decreased 33%, or $2.72, to
$5.63 per Mcf for the year ended December 31, 2009 as compared to $8.35 per Mcf
for the same period in 2008. In 2009, the Henry Hub natural gas spot price
averaged $3.87 per Mcf compared to the 2008 average of $9.13 per
Mcf. The effect of gas hedging activities on natural gas revenue for
the year ended December 31, 2009 was an increase of $76.6 million, or an
increase of $1.72 per Mcf, as compared to a decrease of $18.7 million, or a
decrease of $0.39 per Mcf, for the year ended December 31,
2008. Production volumes decreased overall by 7%, or 3.2 Bcf for the
year ended December 31, 2009, primarily due to natural decline in our non-core
Gulf of Mexico properties as well as the suspension of drilling programs during
2009 in areas where we were active during 2008 as well as the suspension of
non-essential workover and recompletion activity in all areas for a portion of
2009 for the purpose of cash management during the industry
downturn.
Crude
Oil. For the year
ended December 31, 2009, oil revenue decreased by 61%, or $34.0 million,
primarily due to the decrease of $46.75 per Bbl in the average oil price from
$102.00 per Bbl for the year ended December 31, 2008 as compared to $55.25 per
Bbl for the year ended December 31, 2009. Oil volumes also decreased
by 28%, or 152.5 MBbls, to 393.9 MBbls for the year ended December 31, 2009 from
546.4 MBbls for the year ended December 31, 2008. The decrease in oil
production volumes was due to natural decline in our non-core Gulf of Mexico and
Texas State Waters properties.
NGLs. For
the year ended December 31, 2009, NGL revenue decreased by 53%, or $23.8
million, primarily due to the decrease of $68.19 per Bbl in the average NGL
price from $102.87 per Bbl for the year ended December 31, 2008 as compared to
$34.68 per Bbl for the year ended December 31, 2009. NGL volumes
increased by 41%, or 179.3 MBbls, to 620.1 MBbls for the year ended December 31,
2009 from 440.8 MBbls for the year ended December 31, 2008. The
increase in NGL production volumes was due to the recognition in 2009 of
processed liquid volumes for the first time from our Lobo trend
properties.
Year
Ended December 31, 2008 Compared to the Year Ended December 31,
2007
Total
revenue for the year ended December 31, 2008 was $499.3 million, which is an
increase of $135.9 million, or 37%, from the year ended December 31,
2007. Approximately 80% of revenue was attributable to natural gas
sales.
Natural
Gas. For the year
ended December 31, 2008, natural gas revenue increased by 35%, or $102.6
million, including the realized impact of derivative instruments, from the
comparable period in 2007, to $398.3 million. Of this increase, $37.6
million is attributable to increased volumes and $65.0 million is attributable
to favorable average realized prices in 2008. Production volumes for
the year ended December 31, 2008 increased by 22%, or 8.6 Bcf, primarily due to
the increase in the number of productive wells during 2008. Net
productive wells increased from 606 in 2007 to 825 in 2008. The
effect of gas hedging activities on natural gas revenue for the year ended
December 31, 2008 was a decrease of $18.7 million, or a decrease of $0.39 per
Mcf, as compared to an increase of $22.9 million, or an increase of $0.59 per
Mcf, for the year ended December 31, 2007. The average realized
natural gas price including the effects of hedging increased 10% or $0.79 per
Mcf to $8.35 per Mcf for the year ended December 31, 2008 as compared to the
same period in 2007 of $7.56 per Mcf. In 2008, the Henry Hub natural gas spot
price averaged $9.13 per Mcf compared to the 2007 average of $7.17 per
Mcf.
Crude
Oil. For the year
ended December 31, 2008, oil revenue increased by 39%, or $15.6 million,
primarily due to the increase of $30.46 per Bbl in the average oil price from
$71.54 per Bbl for the year ended December 31, 2007 as compared to $102.00 per
Bbl for the year ended December 31, 2008. At December 31, 2008, the
West Texas Intermediate price for oil was $41.00 per Bbl compared to $92.50 per
Bbl at December 31, 2007. Oil volumes decreased by 3%, or 14.8 MBbls, to 546.4
MBbls for the year ended December 31, 2008 from 561.2 MBbls for the year ended
December 31, 2007. The decrease in oil production volumes in 2008 was
associated with decreased production in the Gulf of Mexico primarily due to the
effects of Hurricane Ike and Sabine Lake well work in September 2008 as well as
lower production in Other Onshore.
NGLs. For
the year ended December 31, 2008, NGL revenue increased by 64%, or $17.6
million, primarily due to the increase of $53.14 per Bbl in the average NGL
price from $49.73 per Bbl for the year ended December 31, 2007 as compared to
$102.87 per Bbl for the year ended December 31, 2008. NGL volumes
decreased by 21%, or 116.2 MBbls, to 440.8 MBbls for the year ended December 31,
2008 from 557.0 MBbls for the year ended December 31, 2007. The
decrease in NGL production volumes was associated with the effects of Hurricane
Ike in the Gulf of Mexico and Sabine Lake.
Operating
Expenses
The
following table summarizes our production costs and operating expenses for the
periods indicated:
|
Year
Ended December 31,
|
||||||||||||
|
2009
|
2008
|
2007
|
||||||||||
|
(In
thousands, except per unit amounts)
|
||||||||||||
|
Lease
operating expense
|
$ | 60,773 | $ | 55,694 | $ | 47,044 | ||||||
|
Production
taxes
|
6,131 | 13,528 | 6,417 | |||||||||
|
Depreciation,
depletion and amortization
|
121,042 | 198,862 | 152,882 | |||||||||
|
Impairment
of oil and gas properties
|
379,462 | 444,369 | - | |||||||||
|
General
and administrative costs
|
46,993 | 52,846 | 43,867 | |||||||||
|
$
per unit:
|
||||||||||||
|
Avg.
lease operating expense per Mcfe
|
$ | 1.20 | $ | 1.04 | $ | 1.03 | ||||||
|
Avg.
production taxes per Mcfe
|
0.12 | 0.25 | 0.14 | |||||||||
|
Avg.
DD&A per Mcfe
|
2.39 | 3.71 | 3.34 | |||||||||
|
Avg.
production costs per Mcfe (1)
|
3.59 | 4.75 | 4.36 | |||||||||
|
Avg.
G&A per Mcfe
|
0.93 | 0.99 | 0.96 | |||||||||
____________________________________
|
|
(1)
|
Production
costs per Mcfe include lease operating expense and
DD&A.
|
Year
Ended December 31, 2009 Compared to the Year Ended December 31,
2008
Lease Operating
Expense. Lease operating expense increased $5.1 million for
the year ended December 31, 2009 as compared to the same period for 2008. This
overall increase is primarily due to the 2008 South Texas Constellation,
Pinedale and Petroflow acquisitions as 2009 was the first full year of recording
expenses. Lease operating expense includes workover costs of
$0.08 per Mcfe, ad valorem taxes of $0.29 per Mcfe and insurance of $0.03 per
Mcfe for the year ended December 31, 2009 as compared to workover costs of $0.14
per Mcfe, ad valorem taxes of $0.21 per Mcfe and insurance of $0.03 per Mcfe for
the same period in 2008.
Production
Taxes. Production taxes as a percentage of oil and natural gas
sales were 2.1% for the year ended December 31, 2009 as compared to 2.7% for the
year ended December 31, 2008. This decrease is the result of
decreased production and prices for the year ended December 31, 2009 as compared
to the same period for 2008.
Depreciation, Depletion, and
Amortization. DD&A expense decreased $77.8 million for the
year ended December 31, 2009 as compared to the same period for
2008. The decrease is due to a 6% decrease in total production and a
lower DD&A rate for 2009 compared to 2008 due to the full cost ceiling test
impairment charges recognized during the second half of 2008 and during the
first quarter of 2009, which decreased the full cost pool. The
DD&A rate for the year ended December 31, 2009 was $2.39 per Mcfe while the
rate for the year ended December 31, 2008 was $3.71 per Mcfe.
Impairment of Oil and Gas
Properties. Based upon the quarterly ceiling test computations
using hedge adjusted market prices during the year ended December 31, 2009, at
March 31, 2009, the net capitalized costs of oil and natural gas properties
exceeded the cost center ceiling and a pre-tax, non-cash impairment expense of
$379.5 million was recorded. There was no impact on the ceiling test
of applying the new SEC guidance. Whereas based upon the quarterly
ceiling test computations using hedge adjusted market prices during the year
ended December 31, 2008, the net capitalized costs of oil and natural gas
properties exceeded the cost center ceiling and a pre-tax, non-cash impairment
expense of $444.4 million was recorded.
General and Administrative
Costs. General and administrative costs, net of capitalized
exploration and development overhead costs of $4.8 million, decreased by $5.9
million for the year ended December 31, 2009 as compared to the same period for
2008. The decrease in general and administrative costs incurred in
the current period is primarily related to decreases of $12.1 million in legal
fees related to the Calpine litigation, which settled during 2008, and an
increase of $1.4 million in billable field personnel offset by a $3.1 million
decrease in capitalizable geological and geophysical expenses, a $2.2 million
increase in salaries and wages resulting from the additional technical personnel
hired during 2009 and a $2.7 million increase in bonus expense.
Year
Ended December 31, 2008 Compared to the Year Ended December 31,
2007
Lease Operating
Expense. Lease operating expense increased $8.7 million for
the year ended December 31, 2008 as compared to the same period for 2007. This
overall increase is primarily due to the increase in the number of productive
wells as well as increased production of 17% for 2008 which led to higher costs
for equipment rentals, maintenance and repairs, and costs associated with
non-operated properties. Lease operating expense includes workover
costs of $0.14 per Mcfe, ad valorem taxes of $0.21 per Mcfe and insurance of
$0.03 per Mcfe for the year ended December 31, 2008 as compared to workover
costs of $0.11 per Mcfe, ad valorem taxes of $0.26 per Mcfe and insurance of
$0.05 per Mcfe for the same period in 2007.
Production
Taxes. Production taxes as a percentage of oil and natural gas
sales were 2.7% for the year ended December 31, 2008 as compared to 1.8% for the
year ended December 31, 2007. This increase is the result of
increased production in areas that do not qualify for tax credits for the year
ended December 31, 2008 as compared to the same period for
2007.
Depreciation, Depletion, and
Amortization. DD&A expense increased $46.0 million for the
year ended December 31, 2008 as compared to the same period for
2007. The increase is due to a 17% increase in total production and a
higher DD&A rate for 2008 due to the decrease in oil and natural gas
reserves as compared to 2007. The DD&A rate for the year ended
December 31, 2008 was $3.71 per Mcfe while the rate for the year ended December
31, 2007 was $3.34 per Mcfe due to the increase in finding
costs.
Impairment of Oil and Gas
Properties. Based upon the quarterly ceiling test computations
using hedge adjusted market prices during the year ended December 31, 2008, and
in conjunction with the downward revisions of a portion of our reserves in the
third and fourth quarters of 2008, the net capitalized
costs of oil and natural gas properties exceeded the cost center ceiling and a
pre-tax, non-cash impairment expense of $444.4 million was
recorded. There were no ceiling test impairments during the year
ended December 31, 2007.
General and Administrative
Costs. General and administrative costs, net of capitalized
exploration and development overhead costs of $7.1 million, increased by $9.0
million for the year ended December 31, 2008 as compared to the same period for
2007, with capitalized exploration and development overhead costs of $5.5
million. The increase in costs incurred in 2008 were primarily
related to increases in legal fees related to the Calpine litigation of $6.9
million and increases in payroll expenses of $2.1 million resulting from
increased headcount and a $1.3 million accrual related to the severance of a
former executive officer, as well as the absence of approximately $5.0 million
in CEO transition costs that were incurred in 2007 but not
2008.
Total
Other Expense
Other
expense includes interest expense, interest income and other income/expense, net
which decreased $7.3 million for the year ended December 31, 2009 as compared to
the same period in 2008. The decrease in other expense is primarily
the result of a $12.4 million charge related to the settlement of litigation
with Calpine in 2008 for which there were no related expenses during 2009 offset
by a $4.6 million increase in interest expense due to higher interest rates on
the restated credit facilities and increased amortization of deferred loan fees
and original issue discount related to the restated credit facilities during the
first quarter of 2009.
Other
expense increased $10.2 million for the year ended December 31, 2008 to $25.6
million as compared to $15.4 million in the same period in 2007. The
increase in other expense was the result of a $12.4 million charge related to
the Calpine Settlement partially offset by $3.0 million decrease in interest
expense in 2008.
Provision
for Income Taxes
Our 2009
income tax benefit of $125.8 million was primarily due to the first quarter
ceiling test write-down. For the year ended December 31, 2009, the
effective tax rate was 36.5% compared to the effective tax rate of 37.5% for the
year ended December 31, 2008 and 37.3% for the year ended December 31,
2007. The provision for income taxes differs from the taxes computed
at the federal statutory income tax rate primarily due to the effect of state
taxes, a tax shortfall arising from our deferred compensation plans, and other
permanent differences.
We
provide for deferred income taxes on the difference between the tax basis of an
asset or liability and its carrying amount in our financial statements in
accordance with authoritative guidance for accounting for income
taxes. This difference will result in taxable income or deductions in
future years when the reported amount of the asset or liability is recovered or
settled, respectively. Considerable judgment is required in determining when
these events may occur and whether recovery of an asset is more likely than
not. Deferred tax assets are reduced by a valuation allowance when,
in the opinion of management, it is more likely than not that some portion or
all of the deferred tax assets will not be realized. At December 31,
2009, we have a deferred tax asset of approximately $169.7 million resulting
primarily from the difference between the book basis and tax basis of our oil
and natural gas properties compared to a deferred tax asset of approximately
$42.7 million at December 31, 2008. We have concluded that it is more
likely than not that this deferred tax asset will be realized through future
taxable income generated by the production of our oil and natural gas
properties.
Liquidity
and Capital Resources
Our
primary source of liquidity and capital is our operating cash flow. We also
maintain a revolving line of credit, which can be accessed as needed to
supplement operating cash flow.
Operating Cash
Flow. Our cash flows depend on many factors, including the
price of oil and natural gas and the success of our development and exploration
activities as well as future acquisitions. We actively manage our exposure to
commodity price fluctuations by executing derivative transactions to hedge the
change in prices of a portion of our production, thereby mitigating our exposure
to price declines, but these transactions may also limit our earnings potential
in periods of rising natural gas prices. The effects of these derivative
transactions on our natural gas sales are discussed above under “Results of
Operations – Natural Gas.” The majority of our capital expenditures
is discretionary and could be curtailed if our cash flows decline from expected
levels. Current economic conditions and lower commodity prices could
adversely affect our cash flow and liquidity. We will continue to monitor our
cash flow and liquidity and, if appropriate, we may consider adjusting our
capital expenditure program.
Senior Secured Revolving Line of
Credit. On April 9, 2009, we amended and restated our
revolving credit agreement (the “Restated Revolver”) with BNP Paribas, as
Administrative Agent, and the other lenders identified therein to provide for a
senior secured revolving line of credit in the amount of up to $600.0 million
and to extend its term until July 1, 2012. Availability under the Restated
Revolver is restricted to the borrowing base, which is subject to review and
adjustment on a semi-annual basis and other interim adjustments, including
adjustments based on our hedging arrangements. Our borrowing base is
dependent on a number of factors, including our level of reserves as well as the
pricing outlook at the time of the redetermination. A reduction in capital
spending could result in a reduced level of reserves thus causing a reduction in
the borrowing base. After the redetermination in October 2009, the borrowing
base under the Restated Revolver is $350.0 million. Amounts
outstanding under the Restated Revolver bear interest at specified margins over
the London Interbank Offered Rate (LIBOR) of 2.25% to 3.00%. Borrowings under
the Restated Revolver are collateralized by perfected first priority liens and
security interests on substantially all of our assets, including a mortgage lien
on oil and natural gas properties having at least 80% of the pre-tax SEC PV-10
reserve value, a guaranty by all of our domestic subsidiaries, and a pledge of
100% of the membership interests of domestic subsidiaries. These collateralized
amounts under the mortgages are subject to semi-annual reviews based on updated
reserve information. We are subject to the financial covenants of a minimum
current ratio of not less than 1.0 to 1.0 as of the end of each fiscal quarter
and a maximum leverage ratio of not greater than 3.5 to 1.0, calculated at the
end of each fiscal quarter for the four fiscal quarters then ended, measured
quarterly after giving pro forma effect to acquisitions and
divestitures. At December 31, 2009, our current ratio was 4.3 and the
leverage ratio was 1.6. In addition, we are subject to covenants
limiting dividends and other restricted payments, transactions with affiliates,
incurrence of debt, changes of control, asset sales, and liens on properties. We
were in compliance with all covenants at December 31, 2009. As of
February 26, 2010, we had $190.0 million outstanding, which is due and payable
on July 1, 2012, with $160.0 million available for borrowing under the Restated
Revolver.
Second Lien Term Loan.
On April 9, 2009, we also amended and restated our term loan
(the “Restated Term Loan”) with BNP Paribas, as Administrative Agent, and other
lenders and extended its term until October 2, 2012. Borrowings under the
Restated Term Loan were initially set at $75.0 million and bear interest at
LIBOR plus 8.5% with a LIBOR floor of 3.5%. The Restated Term Loan had an option
to increase fixed and floating rate borrowings by up to $25.0 million to $100.0
million prior to May 9, 2009. We exercised this option on April 21, 2009, and
the increased borrowings consisted of $5.0 million of floating rate borrowings
and $20.0 million of fixed rate borrowings at 13.75%. The loan is collateralized
by second priority liens on substantially all of our assets. We are subject to
the financial covenants of a minimum asset coverage ratio of not less than 1.5
to 1.0 and a maximum leverage ratio of not more than 4.0 to 1.0, calculated at
the end of each fiscal quarter for the four fiscal quarters then ended, measured
quarterly after giving pro forma effect to acquisitions and
divestitures. At December 31, 2009, our asset coverage ratio was 2.7
and the leverage ratio was 1.6. In addition, we are subject to
covenants limiting dividends and other restricted payments, transactions with
affiliates, incurrence of debt, changes of control, asset sales, and liens on
properties. We were in compliance with all covenants at December 31,
2009. As of December 31, 2009, we had $80.0 million of variable rate
borrowings and $20.0 million of fixed rate borrowings outstanding under the
Restated Term Loan. At December 31, 2009, the principal balance of
the Restated Term Loan was due and payable on October 2,
2012. We have the right to prepay the Restated Term Loan
at any time on or after the first anniversary of the effective date (April 10,
2010), in whole or in part, from April 10, 2010 to April 10, 2011 with a premium
equal to 2% of such amount prepaid or subsequent to April 10, 2011 without
premium or penalty provided that each prepayment is in an amount that is an
integral multiple of $1.0 million and not less than $1.0 million, or if such
amount is less than $1.0 million, the outstanding principal
amount.
Working
Capital
At
December 31, 2009, we had a working capital surplus of $45.7 million as compared
to a working capital surplus of $28.6 million at December 31,
2008. Our working capital is affected primarily by fluctuations in
the fair value of our commodity derivative instruments, deferred taxes
associated with hedging activities, cash and cash equivalents balance and our
capital spending program. The surplus for 2009 was largely caused by
the increases in our cash balance. As of December 31, 2009, the
working capital asset balances of our cash and cash equivalents and derivative
instruments were approximately $61.3 million and $9.0 million, respectively, and
there was no balance for current deferred tax assets. In addition,
the associated working capital liability balances for accrued liabilities were
approximately $37.1 million as of December 31, 2009.
Cash
Flows
|
Year
Ended December 31,
|
||||||||||||
|
2009
|
2008
|
2007
|
||||||||||
|
(In
thousands)
|
||||||||||||
|
Cash
flows provided by operating activities
|
$ | 160,501 | $ | 374,719 | $ | 257,307 | ||||||
|
Cash
flows used in investing activities
|
(123,865 | ) | (393,070 | ) | (322,041 | ) | ||||||
|
Cash
flows (used in) provided by financing activities
|
(18,235 | ) | 57,990 | 5,170 | ||||||||
|
Net
increase (decrease) in cash and cash equivalents
|
$ | 18,401 | $ | 39,639 | $ | (59,564 | ) | |||||
Operating Activities. Key
drivers of net cash provided by operating activities are commodity prices,
production volumes and costs and expenses, which primarily include operating
costs, taxes other than income taxes, transportation and general and
administrative expenses. Net cash provided by operating activities
continued to be a primary source of liquidity and capital used to finance our
capital expenditures for the year ended December 31, 2009.
Cash
flows provided by operating activities decreased by $214.2 million for the year
ended December 31, 2009 as compared to the same period for 2008. This decrease
is largely due to lower oil and natural gas prices and production during 2009
compared to 2008. For the year ended December 31, 2009, we had net
losses of $219.2 million with a decrease in production of 6% as compared to the
year ended December 31, 2008 with net losses of $188.1 million.
Cash
flows provided by operating activities increased by $117.4 million for the year
ended December 31, 2008 as compared to the same period for 2007. This increase
is largely due to higher oil and natural gas prices during 2008 compared to
2007. For the year ended December 31, 2008, we had net losses of
$188.1 million with an increase of production of 17% as compared to the year
ended December 31, 2007 with net income of $57.2 million.
Investing
Activities. The primary driver of cash used in investing
activities is capital spending.
Cash
flows used in investing activities decreased by $269.2 million for the year
ended December 31, 2009 as compared to the same period for 2008, which primarily
reflected reduced expenditures for the acquisition and development of oil and
gas properties and drilling. Acquisitions of oil and gas properties
decreased $159.3 million and purchases of oil and gas assets decreased $87.4
million from 2008 to 2009 as a result of our decision to exercise prudence and
caution with our capital spending in order to preserve our liquidity and
maximize our financial position during a period of low commodity prices and
reduced demand for natural gas. For the year ended December 31, 2009,
we incurred approximately $135.0 million in capital expenditures as compared to
$334.4 million for the year ended December 31, 2008. During the year
ended December 31, 2009, we participated in the drilling of 43 gross wells as
compared to the drilling of 184 gross wells for the year ended December 31,
2008.
Cash
flows used in investing activities increased by $71.0 million for the year ended
December 31, 2008 as compared to the same period for 2007, which reflected
expenditures for the acquisition and development of oil and gas properties and
drilling. The Company acquired the Petroflow properties in the San
Juan Basin for $29.0 million, the Pinedale and South Texas properties for
approximately $55.0 million, and the Calpine non-consent properties as part of
the Calpine Settlement for $30.9 million. Additionally, acquisition
costs for the year ended December 31, 2008 include a non-cash purchase price
adjustment of $36.7 million related to the release of suspended revenues and
non-consent liabilities associated with non-consent properties as part of the
settlement of litigation with Calpine, as well as an $8.0 million reduction in
accrued capital costs. For the year ended December 31, 2008, we
incurred approximately $334.4 million in capital expenditures as compared to
$336.1 million for the year ended December 31, 2007. During the year
ended December 31, 2008, we participated in the drilling of 184 gross wells as
compared to the drilling of 195 gross wells for the year ended December 31,
2007.
Financing
Activities. The primary driver of cash used in financing
activities is equity transactions and issuance and repayments of
debt.
Cash
flows provided by financing activities decreased by $76.2 million for the year
ended December 31, 2009 as compared to the same period for 2008. The
net decrease is primarily related to payments of $40.0 million made in 2009
against the Restated Revolver and $5.9 million of deferred loan fees related to
the restated credit facilities netted with $28.4 million of borrowings in 2009
compared to $55.0 million of borrowings in 2008. In addition, there
was a decrease of approximately $3.6 million in the stock options exercised for
the year ended December 31, 2009 compared to 2008.
Cash
flows provided by financing activities increased by $52.8 million for the year
ended December 31, 2008 as compared to the same period for 2007. The
net increase is primarily related to net borrowings of $55.0 million made in
2008 against the Revolver. In addition, there was an increase of
approximately $3.0 million in the stock options exercised for the year ended
December 31, 2008 compared to 2007.
Commodity
Price Risk, Interest Rate Risk and Related Hedging Activities
The
energy markets have historically been very volatile, and there can be no
assurance that oil and natural gas prices will not be subject to wide
fluctuations in the future. To mitigate our exposure to changes in commodity
prices, management hedges oil and natural gas prices from time to time primarily
through the use of certain derivative instruments including fixed price swaps,
basis swaps, costless collars and put options. Although not risk free, we
believe these activities will reduce our exposure to commodity price
fluctuations and thereby achieve a more predictable cash flow. Consistent with
this policy, we have entered into a series of natural gas fixed-price swaps and
costless collars, which are intended to establish a fixed price or an average
floor and ceiling price for 13% to 23% of our expected natural gas production
through 2011. The fixed-price swap agreements we have entered into require
payments to (or receipts from) counterparties based on the differential between
a fixed price and a variable price for a notional quantity of natural gas
without the exchange of underlying volumes. The notional amounts of these
financial instruments were based on expected proved production from existing
wells at inception of the hedge instruments.
Borrowings
under our Restated Revolver and Restated Term Loan mature on July 1, 2012 and
October 2, 2012, respectively, and bear interest at a LIBOR-based rate. This
exposes us to risk of earnings loss due to increases in market interest rates.
To mitigate this exposure, we have entered into a series of interest rate swap
agreements through December 2010. If we determine the risk may become
substantial and the costs are not prohibitive, we may enter into additional
interest rate swap agreements in the future.
The
following table sets forth the results of commodity and interest rate swap
hedging transaction settlements:
|
For
the Year Ended December 31,
|
||||||||
|
2009
|
2008
|
|||||||
|
Natural
Gas
|
||||||||
|
Quantity
settled (MMBtu)
|
20,856,465 | 26,684,616 | ||||||
|
Increase
(decrease) in natural gas sales revenue (In thousands)
|
$ | 76,567 | $ | (18,669 | ) | |||
|
Interest
Rate Swaps
|
||||||||
|
Increase
in interest expense (In thousands)
|
$ | (1,289 | ) | $ | (1,158 | ) | ||
In
accordance with the authoritative guidance for derivatives, all derivative
instruments, not designated as a normal purchase sale, are recorded on the
balance sheet at fair market value and changes in the fair market value of the
derivatives are recorded each period in current earnings or other comprehensive
income, depending on whether a derivative is designated as a hedge transaction,
and depending on the type of hedge transaction. Our derivative contracts are
cash flow hedge transactions in which we are hedging the variability of cash
flow related to a forecasted transaction. Changes in the fair market value of
these derivative instruments are reported in other comprehensive income and
reclassified as earnings in the period(s) in which earnings are impacted by the
variability of the cash flow of the hedged item. We assess the effectiveness of
hedging transactions on a quarterly basis, consistent with documented risk
management strategy for the particular hedging relationship. Changes in the fair
market value of the ineffective portion of cash flow hedges, if any, are
included in other income (expense).
As of
December 31, 2009, our commodity and interest rate hedge positions were with
counterparties that were also lenders in our credit facilities. This allows us
to secure any margin obligation resulting from a negative change in the fair
market value of the derivative contracts in connection with our credit
obligations and eliminate the need for independent collateral
postings. As of December 31, 2009, we had no deposits for
collateral.
Capital
Requirements
The
historical capital expenditures summary table is included in Items 1 and 2.
Business and Properties and is incorporated herein by reference.
Our
capital expenditures for the year ended December 31, 2009 were $135.0 million,
including capitalized internal costs directly identified with acquisition,
exploration and development activities of $4.8 million, capitalized interest of
$1.2 million and corporate and other capital costs of $4.1
million. We have plans to carefully execute an organic capital
program in 2010 that can be funded from internally generated cash flows and
available cash in a $6 per Mcf and a $70 per Bbl price
environment. We also have the discretion to use our available
borrowing base and proceeds from divestitures to fund capital expenditures,
including acquisitions.
Commitments
and Contingencies
As is
common within the industry, we have entered into various commitments and
operating agreements related to the exploration and development of and
production from proved oil and natural gas properties. It is management’s
belief that such commitments will be met without a material adverse effect on
our financial position, results of operations or cash flows.
Contractual Obligations. At
December 31, 2009, the aggregate amounts of our contractually obligated
payment commitments for the next five years are as follows:
|
Payments
Due By Period
|
||||||||||||||||||||
|
Total
|
2010
|
2011
to 2012
|
2013
to 2014
|
2015
& Beyond
|
||||||||||||||||
|
(In
thousands)
|
||||||||||||||||||||
|
Senior
secured revolving line of credit
|
$ | 190,000 | $ | - | $ | 190,000 | $ | - | $ | - | ||||||||||
|
Second
lien term loan
|
100,000 | - | 100,000 | - | - | |||||||||||||||
|
Operating
leases
|
12,872 | 3,025 | 6,204 | 3,643 | - | |||||||||||||||
|
Interest
payments on long-term debt (1)
|
48,875 | 18,264 | 30,611 | - | - | |||||||||||||||
|
Rig
commitments
|
3,542 | 3,542 | - | - | - | |||||||||||||||
|
Total
contractual obligations
|
$ | 355,289 | $ | 24,831 | $ | 326,815 | $ | 3,643 | $ | - | ||||||||||
___________________________________
(1)
Future interest payments were calculated based on interest rates and amounts
outstanding at December 31, 2009.
Asset Retirement Obligation.
We also had total liabilities of $28.9 million related to asset retirement
obligations recorded in Accrued liabilities and Other long-term liabilities at
December 31, 2009 that are excluded from the table above. Due to the nature
of these obligations, we cannot determine precisely when the payments will be
made to settle these obligations. See Item 8. “Financial Statements and
Supplementary Data, Note 9 - Asset Retirement
Obligation.”
Contingencies
We are
party to various litigation matters arising out of the normal course of
business. Although the ultimate outcome of each of these matters cannot be
absolutely determined, and the liability we may ultimately incur with respect to
any one of these matters in the event of a negative outcome may be in excess of
amounts currently accrued with respect to such matters, management does not
believe any such matters will have a material adverse effect on our financial
position, results of operation or cash flows.
Critical
Accounting Policies and Estimates
The
discussion and analysis of our financial condition and results of operations are
based upon the Consolidated Financial Statements, which have been prepared in
accordance with accounting principles generally accepted in the United States of
America. The preparation of these financial statements requires us to make
estimates and assumptions that affect the reported amounts of assets,
liabilities, revenues and expenses, related disclosure of contingent assets and
liabilities and proved oil and gas reserves. Certain accounting policies involve
judgments and uncertainties to such an extent that there is reasonable
likelihood that materially different amounts could have been reported under
different conditions, or if different assumptions had been used. We evaluate our
estimates and assumptions on a regular basis. We base our estimates on
historical experience and various other assumptions that are believed to be
reasonable under the circumstances, the results of which form the basis for
making judgments about the carrying values of assets and liabilities that are
not readily apparent from other sources. Actual results may differ from these
estimates and assumptions used in preparation of our financial statements.
Below, we have provided expanded discussion of our more significant accounting
policies, estimates and judgments for our financial statements. We believe these
accounting policies reflect the more significant estimates and assumptions used
in preparation of the financial statements.
We also
describe the most significant estimates and assumptions we make in applying
these policies. See Item 8. “Financial Statements and Supplementary
Data, Note 2 - Summary of Significant Accounting Policies,” for a discussion of
additional accounting policies and estimates made by
management.
Principles of
Consolidation
The
accompanying consolidated financial statements as of December 31, 2009, 2008 and
2007, contain the accounts of the Company and its majority owned subsidiaries
after eliminating all significant intercompany balances and
transactions.
Oil
and Gas Activities
Accounting
for oil and gas activities is subject to special, unique rules. Two generally
accepted methods of accounting for oil and gas activities are the successful
efforts method and the full cost method. The most significant differences
between these two methods are the treatment of exploration costs and the manner
in which the carrying value of oil and gas properties are amortized and
evaluated for impairment. The successful efforts method requires certain
exploration costs to be expensed as they are incurred while the full cost method
provides for the capitalization of these costs. Both methods generally provide
for the periodic amortization of capitalized costs based on proved reserve
quantities. Impairment of oil and gas properties under the successful efforts
method is based on an evaluation of the carrying value of individual oil and gas
properties against their estimated fair value. The assessment for
impairment under the full cost method requires an evaluation of the carrying
value of oil and gas properties included in a cost center against the net
present value of future cash flows from the related proved reserves using a
twelve-month average price computed as an average of first day of the month
prices, period-end costs and a 10% discount rate. Prior to December
31, 2009, the assessment for impairment under the full cost method required the
use of period-end pricing when evaluating the carrying value of oil and gas
properties against the net present value of future cash flows from the related
proved reserves.
Full
Cost Method
We use
the full cost method of accounting for our oil and gas activities. Under this
method, all costs incurred in the acquisition, exploration and development of
oil and gas properties are capitalized into a cost center (the amortization
base), whether or not the activities to which they apply are
successful. As all of our operations are located in the U.S., all of
our costs are included in one cost pool. Such amounts include the
cost of drilling and equipping productive wells, dry hole costs, lease
acquisition costs and delay rentals. Capitalized costs also include salaries,
employee benefits, costs of consulting services and other expenses that directly
relate to our oil and gas activities. Interest costs related to
unproved properties are also capitalized. Costs associated with
production and general corporate activities are expensed in the period incurred.
The capitalized costs of our oil and gas properties, plus an estimate of our
future development and abandonment costs, are amortized on a unit-of-production
method based on our estimate of total proved reserves. Unevaluated costs are
excluded from the full cost pool and are periodically considered for
impairment. Upon evaluation, these costs are transferred to the full
cost pool and amortized. Our financial position and results of
operations would have been significantly different had we used the successful
efforts method of accounting for our oil and gas activities, since we generally
reflect a higher level of capitalized costs as well as a higher DD&A rate on
our oil and natural gas properties.
Proved
Oil and Gas Reserves
Our
engineering estimates of proved oil and gas reserves directly impact financial
accounting estimates, including DD&A expense and the full cost ceiling
limitation. Proved oil and gas reserves are the estimated quantities of oil and
gas reserves that geological and engineering data demonstrate with reasonable
certainty to be recoverable in future years from known reservoirs under
period-end economic and operating conditions. The process of estimating
quantities of proved reserves is very complex, requiring significant subjective
decisions in the evaluation of all geological, engineering and economic data for
each reservoir. Accordingly, our reserve estimates are developed
internally and subsequently, provided to NSAI who then performs an annual
year-end reserve report audit. The data for a given reservoir may change
substantially over time as a result of numerous factors including additional
development activity, evolving production history and continual reassessment of
the viability of production under varying economic conditions. Changes in oil
and gas prices, operating costs and expected performance from a given reservoir
also will result in revisions to the amount of our estimated proved
reserves. The estimate of proved oil and natural gas reserves
primarily impact property, plant and equipment amounts in the consolidated
balance sheet and the DD&A amounts in the consolidated statement of
operations. Current guidance dictates the use of a twelve-month first
day of the month historical average price adjusted for basis and quality
differentials for oil and natural gas and holds costs in effect as of the last
day of the quarter or annual period constant in calculating
reserves. Prior to 2009, the guidance dictated that year-end prices
adjusted for basis and quality differentials and costs be used in calculating
reserves. For more information regarding reserve estimation,
including historical reserve revisions, refer to Item 8. “Financial
Statements and Supplementary Data - Supplemental Oil and Gas
Disclosures.”
Full
Cost Ceiling Limitation
Under the
full cost method, we are subject to quarterly calculations of a “ceiling” or
limitation on the amount of costs associated with our oil and gas properties
that can be capitalized on our balance sheet. This ceiling limits
such capitalized costs to the present value of estimated future cash flows from
proved oil and natural gas reserves (including the effect of any related hedging
activities) reduced by future operating expenses, development expenditures,
abandonment costs (net of salvage values) to the extent not included in oil and
gas properties pursuant to authoritative guidance, and estimated future income
taxes thereon. If net capitalized costs exceed the applicable cost
center ceiling, we are subject to a ceiling test write-down to the extent of
such excess. If required, it would reduce earnings and stockholders’ equity in
the period of occurrence and result in lower DD&A expense in future periods.
The discounted present value of our proved reserves is a major component of the
ceiling calculation and represents the component that requires the most
subjective judgments. The current ceiling calculation utilizes a twelve-month
first day of the month historical average price. The costs in effect
as of the last day of the quarter or annual period are held
constant. Prior to December 31, 2009, ceiling calculation guidance
dictated that prices in effect as of the last day of the quarter or annual
period be used and allowed a write-down to be reduced or avoided if prices
increased subsequent to the end of a quarter but prior to the issuance of our
financial statements in which a write-down might otherwise be
required. As of December 31, 2009, the use of the recovery of prices
after the end of the period is no longer permitted. The full cost
ceiling test impairment calculations also take into consideration the effects of
hedging contracts that are designated for hedge accounting. Given the
fluctuation of natural gas and oil prices, it is reasonably possible that the
estimated discounted future net cash flows from our proved reserves will change
in the near term. If natural gas and oil prices decline, or if we have downward
revisions to our estimated proved reserves, it is possible that write-downs of
our oil and gas properties could occur in the future. For more
information regarding the full cost ceiling limitation, refer to Item 8.
“Financial Statements and Supplementary Data, Note 2 – Summary of Significant
Accounting Policies.”
Depreciation,
Depletion and Amortization
The
quantities of estimated proved oil and gas reserves are a significant component
of our calculation of depletion expense and revisions in such estimates may
alter the rate of future depletion expense. Holding all other factors constant,
if reserves are revised upward, earnings would increase due to lower depletion
expense. Likewise, if reserves are revised downward, earnings would decrease due
to higher depletion expense or due to a ceiling test write-down. A
five percent positive or negative revision to proved reserves would decrease or
increase the DD&A rate by approximately $0.09 to $0.10 per
Mcfe. This estimated impact is based on current data at December 31,
2009 and actual events could require different adjustments to
DD&A.
Costs Withheld From
Amortization
Costs
associated with unevaluated properties are excluded from our amortization base
until we have evaluated the properties. The costs associated with unevaluated
leasehold acreage wells currently drilling and capitalized interest are
initially excluded from our amortization base. Leasehold costs are either
transferred to our amortization base with the costs of drilling a well on the
lease or are assessed quarterly for possible impairment. In addition,
a portion of incurred (if not previously included in the amortization base) and
future estimated development costs associated with qualifying major development
projects may be temporarily excluded from amortization. To qualify, a project
must require significant costs to ascertain the quantities of proved reserves
attributable to the properties under development (e.g., the installation of an
offshore production platform from which development wells are to be drilled).
Incurred and estimated future development costs are allocated between completed
and future work. Any temporarily excluded costs are included in the amortization
base upon the earlier of when the associated reserves are determined to be
proved or impairment is indicated.
Our
decision to withhold costs from amortization and the timing of the transfer of
those costs into the amortization base involve a significant amount of judgment
and may be subject to changes over time based on several factors, including our
drilling plans, availability of capital, project economics and results of
drilling on adjacent acreage. At December 31, 2009, our full cost pool had
approximately $42.3 million of costs excluded from the amortization
base.
Future
Development and Abandonment Costs
Future
development costs include costs incurred to obtain access to proved reserves
such as drilling costs and the installation of production equipment and such
costs are included in the calculation of DD&A expense. Future abandonment
costs include costs to dismantle and relocate or dispose of our production
platforms, gathering systems and related structures and restoration costs of
land and seabed. We develop estimates of these costs for each of our properties
based upon the property’s geographic location, type of production structure,
well depth, currently available procedures and ongoing consultations with
construction and engineering consultants. Because these costs typically extend
many years into the future, estimating these future costs is difficult and
requires management to make judgments that are subject to future revisions based
upon numerous factors, including changing technology and the political and
regulatory environment. We review our assumptions and estimates of future
development and future abandonment costs on an annual basis.
We
provide for future abandonment costs in accordance with authoritative guidance
for accounting for asset retirement obligations. This guidance requires that a
liability for the discounted fair value of an asset retirement obligation be
recorded in the period in which it is incurred and the corresponding cost
capitalized by increasing the carrying amount of the related long-lived asset.
The liability is accreted to its present value each period, and the capitalized
cost is depreciated over the useful life of the related
asset. Holding all other factors constant, if our estimate of future
abandonment and development costs is revised upward, earnings would decrease due
to higher DD&A expense. Likewise, if these estimates are revised downward,
earnings would increase due to lower DD&A expense.
Derivative
Transactions and Hedging Activities
We enter
into derivative transactions to hedge against changes in oil and natural gas
prices and changes in interest rates related to outstanding debt under our
credit agreements primarily through the use of fixed price swap agreements,
basis swap agreements, costless collars and put options. Consistent with our
hedge policy, we entered into a series of derivative transactions to hedge a
portion of our expected natural gas production through 2011. As of
December 31, 2009, 13% and 13% of our expected natural gas production was hedged
using swaps and costless collars, respectively, with settlement in 2010 and 5%
and 23% of our expected natural gas production was hedged using swaps and
costless collars, respectively, with settlement in 2011, based on our annual
reserve report. We also entered into a series of interest rate swap agreements
to hedge the change in interest rates associated with our variable rate debt
through December of 2010. These transactions are recorded in our
financial statements in accordance with authoritative guidance for accounting
for derivative instruments and hedging activities. Although not risk
free, we believe this policy will reduce our exposure to commodity price
fluctuations and changes in interest rates and thereby achieve a more
predictable cash flow. We do not enter into derivative agreements for trading or
other speculative purposes.
In
accordance with amended guidance, all derivative instruments, unless designated
as normal purchase and normal sale, are recorded on the balance sheet at fair
market value and changes in the fair market value of the derivatives are
recorded each period in current earnings or other comprehensive income,
depending on whether a derivative is designated as a hedge transaction, and
depending on the type of hedge transaction. Our derivative contracts are cash
flow hedge transactions in which we are hedging the variability of cash flows
related to a forecasted transaction. Changes in the fair market value of these
derivative instruments are reported in other comprehensive income and
reclassified as earnings in the period(s) in which earnings are impacted by the
variability of the cash flow of the hedged item. We assess the effectiveness of
hedging transactions quarterly, consistent with our documented risk management
strategy for the particular hedging relationship. Changes in the fair market
value of the ineffective portion of cash flow hedges are included in Other
(income) expense on the Consolidated Statement of Operations.
Fair
Value Measurements
In
September 2006, the Financial Accounting Standards Board (“FASB”) issued
authoritative guidance regarding fair value measurements. This
guidance defined fair value, established a framework for measuring fair value,
expanded the related disclosure requirements and was effective for financial
statements issued for fiscal years beginning after November 15, 2007, and
interim periods within those years. This guidance did not require any
new fair value measurements; however, it did require some entities to change
their measurement practices. In February 2008, the FASB issued
additional guidance which delayed the effective date of fair value accounting
for nonfinancial assets and liabilities, except for items that are recognized or
disclosed at fair value in the financial statements on a recurring basis (at
least annually), until fiscal years beginning after November 15,
2008. Effective January 1, 2008, we implemented the guidance for
measuring the fair value of financial assets and
liabilities. Beginning January 1, 2009, we implemented the guidance
for nonfinancial assets and liabilities. The adoption of this
guidance did not have an impact on our consolidated financial position, results
of operations or cash flows. In October 2008, the FASB issued
guidance on determining the fair value of a financial asset when the market for
that asset is not active. This guidance clarifies the application of fair
value accounting in a market that is not active and provides an example to
illustrate key considerations in determining the fair value of a financial asset
when the market for that financial asset is not active. This guidance was
effective upon issuance, including prior periods for which financial statements
have not been issued. We applied this guidance to financial assets
measured at fair value on a recurring basis at September 30,
2009. The adoption of this guidance did not have a significant impact
on our consolidated financial position, results of operations or cash
flows. In April 2009, the FASB issued authoritative guidance to
provide additional application guidance and enhance disclosures regarding fair
value measurements and impairments of securities. This guidance
provides guidelines for making fair value measurements for assets and
liabilities for which the volume and level of activity for the asset or
liability have significantly decreased or for transactions that are not orderly
more consistent with the principles presented in earlier guidance, enhances
consistency in financial reporting by increasing the frequency of fair value
disclosures, and provides additional guidance designed to create greater clarity
and consistency in accounting for and presenting impairment losses on securities
for other-than-temporary impairments. This guidance is effective for
interim and annual periods ending after June 15, 2009, with early adoption
permitted for periods ending after March 15, 2009. We applied this
guidance for the period ended June 30, 2009 and the adoption did not have a
significant impact on the Company’s consolidated financial position, results of
operations or cash flows. See Item 8. “Financial Statements and
Supplementary Data, Note 7 - Fair Value Measurements.”
Stock-Based
Compensation
We
account for stock-based compensation in accordance with authoritative guidance
regarding the accounting for stock-based compensation. Under the provisions of
this guidance, stock-based compensation cost for options is estimated at the
grant date based on the award’s fair value as calculated by the Black-Scholes
option-pricing model and is recognized as expense over the requisite service
period. The Black-Scholes model requires various highly judgmental assumptions
including volatility, forfeiture rates and expected option life. If any of the
assumptions used in the Black-Scholes model change significantly, stock-based
compensation expense for future grants may differ materially from that recorded
in the current period. Stock-based compensation cost for restricted
stock is estimated at the grant date based on the award’s fair value which is
equal to the average high and low common stock price on the date of grant and is
recognized as expense over the requisite service period. Stock-based
compensation for performance share units (“PSUs”) is measured at the end of each
reporting period through the settlement date using the quarter-end closing
common stock prices for awards that are solely based on performance conditions
or a Monte Carlo model for awards that contain market conditions to reflect the
current fair value. Compensation expense is recognized ratably over
the performance period based on our estimated achievement of the established
metrics. Compensation expense for awards with performance conditions
will only be recognized for those awards for which it is probable that the
performance conditions will be achieved and which are expected to
vest. The compensation expense will be estimated based upon an
assessment of the probability that the performance metrics will be achieved,
current and historical forfeitures, and the Board’s anticipated vesting
percentage. Compensation expense for awards with market conditions is
measured at the end of each reporting period based on the fair value derived
from the Monte Carlo model which incorporates a risk-neutral valuation approach
to value these awards. The Monte Carlo model requires various highly
judgmental assumptions to determine the fair value of the
awards. This model samples paths of ours and the S&P 400 O&G
E&P Industry Index (the “Index”)’s stock price and calculates the resulting
change in cash flow multiple at the end of the forecasted performance
period. This model iterates these randomly forecasted results until
the distribution of results converge on a mean or estimated fair value.
The five primary inputs for the Monte Carlo model are the risk-free rate,
independent analyst cash flow per share estimates for the Index and us,
volatility of the equities of the Index and us, expected dividends, where
applicable, and various historical market data. The risk-free rate was generated
from Bloomberg for United States Treasuries with a two-year tenor.
Volatility was set equal to the annualized daily volatility measured over a
historic 400-day period ending on the reporting date for the Index and
us. No forfeiture rate is assumed for this type of
award. Expense related to these awards can be volatile based on the
Company’s comparative performance at the end of each quarter. If any
of the assumptions used in the Monte Carlo model change significantly,
stock-based compensation expense may differ materially in the future from that
recorded in the current period. See Item 8. “Financial Statements and
Supplementary Data, Note 12 – Stock-based
Compensation”.
Revenue
Recognition
We use
the sales method of accounting for the sale of our natural
gas. When actual natural gas sales volumes exceed our delivered
share of sales volumes, an over-produced imbalance occurs. To the extent an
over-produced imbalance exceeds our share of the remaining estimated proved
natural gas reserves for a given property, we record a
liability.
Since
there is a ready market for natural gas, crude oil and natural gas liquids
(“NGLs”), we sell our products soon after production at various locations at
which time title and risk of loss pass to the buyer. Revenue is recorded when
title passes based on our net interest or nominated deliveries of production
volumes. We record our share of revenues based on production volumes and
contracted sales prices. The sales price for natural gas, NGLs and crude oil are
adjusted for transportation cost and other related deductions. The
transportation costs and other deductions are based on contractual or historical
data and do not require significant judgment. Subsequently, these deductions and
transportation costs are adjusted to reflect actual charges based on third party
documents once received by us. Historically, these adjustments have been
insignificant. In addition, natural gas and crude oil volumes sold are not
significantly different from our share of production.
We pay
royalties on natural gas, crude oil and NGLs in accordance with the particular
contractual provisions of the lease. Royalty liabilities are recorded
in the period in which the natural gas, crude oil or NGLs are produced and are
included in Royalties Payable on our Consolidated Balance Sheet.
Income
Taxes
We
provide for deferred income taxes on the difference between the tax basis of an
asset or liability and its carrying amount in our financial statements in
accordance with authoritative guidance for accounting for income
taxes. This difference will result in taxable income or deductions in
future years when the reported amount of the asset or liability is recovered or
settled, respectively. Considerable judgment is required in determining when
these events may occur and whether recovery of an asset is more likely than
not. Deferred tax assets are reduced by a valuation allowance when,
in the opinion of management, it is more likely than not that some portion or
all of the deferred tax assets will not be realized.
Estimating
the amount of the valuation allowance is dependent on estimates of future
taxable income, alternative minimum tax income and change in stockholder
ownership that would trigger limits on use of net operating losses under the
Internal Revenue Code Section 382. We have a significant deferred tax
asset associated with our oil and gas properties. We have concluded
that it is more likely than not that we will realize this deferred tax asset in
future years and therefore, we have not recorded a valuation allowance as of
December 31, 2009. See Item 8. “Financial Statements and
Supplementary Data, Note 13 - Income
Taxes.”
Additionally,
our federal and state income tax returns are generally not filed before the
consolidated financial statements are prepared, therefore we estimate the tax
basis of our assets and liabilities at the end of each period as well as the
effects of tax rate changes, tax credits and net operating and capital loss
carryforwards and carrybacks. Adjustments related to differences between the
estimates we used and actual amounts we reported are recorded in the period in
which we file our income tax returns. These adjustments and changes in our
estimates of asset recovery could have an impact on our results of operations. A
one percent change in our effective tax rate would have affected our calculated
income tax expense (benefit) by approximately $3.5 million for the year ended
December 31, 2009.
Authoritative
guidance for accounting for uncertainty in income taxes requires that we
recognize the financial statement benefit of a tax position only after
determining that the relevant tax authority would more likely than not sustain
the position following an audit. For tax positions meeting the more
likely than not threshold, the amount recognized in the financial statements is
the largest benefit that has a greater than 50% likelihood of being realized
upon ultimate settlement with the relevant tax authority.
Recent
Accounting Developments
The
following recently issued accounting developments have been applied or may
impact the Company in future periods.
Business
Combinations. In December 2007, the FASB revised the authoritative
guidance for business combinations, extending its applicability to all
transactions and other events in which one entity obtains control over one or
more other businesses. The revised guidance broadens the fair value
measurement and recognition of assets acquired, liabilities assumed, and
interests transferred as a result of business combinations and requires that
acquisition-related costs incurred prior to the acquisition be
expensed. The revised guidance also expands the definition of what
qualifies as a business, and this expanded definition could include prospective
oil and gas purchases. This could cause us to expense transaction
costs for future oil and gas property purchases that we have historically
capitalized. Additionally, this guidance expands the required
disclosures to improve the financial statement users’ abilities to evaluate the
nature and financial effects of business combinations. This guidance
is effective for business combinations for which the acquisition date is on or
after January 1, 2009. The adoption of the revised guidance did not
have a significant impact on our consolidated financial position, results of
operations or cash flows.
Noncontrolling Interests in
Consolidated Financial Statements. In December 2007, the
FASB issued authoritative guidance which improves the relevance, comparability
and transparency of the financial information that a reporting entity provides
in its consolidated financial statements by establishing accounting and
reporting standards for the non-controlling interest in a subsidiary and for the
deconsolidation of a subsidiary. This guidance is effective for
fiscal years beginning after December 15, 2008. The adoption of this
guidance did not have a significant impact on our consolidated financial
position, results of operations or cash flows.
Disclosures about Derivative
Instruments and Hedging Activities. In March 2008, the
FASB issued authoritative guidance related to disclosures about derivative
instruments and hedging activities, which is intended to improve financial
reporting about derivative instruments and hedging activities by requiring
enhanced disclosures. This guidance is effective for fiscal years
beginning after November 15, 2008. We adopted the disclosure
requirements beginning January 1, 2009. See Item 8. “Financial
Statements and Supplementary Data, Note 6 - Commodity Hedging Contracts and
Other Derivatives.”
Fair Value
Measurements. In February 2008, the FASB issued authoritative
guidance which delayed the effective date of fair value accounting for
nonfinancial assets and liabilities, except for items that are recognized or
disclosed at fair value in the financial statements on a recurring basis (at
least annually), until fiscal years beginning after November 15,
2008. Beginning January 1, 2009, we implemented the guidance for
nonfinancial assets and liabilities. The adoption of this guidance
did not have an impact on our consolidated financial position, results of
operations or cash flows. In October 2008, the FASB issued guidance
on determining the fair value of a financial asset when the market for that
asset is not active. This guidance clarifies the application of fair value
accounting in a market that is not active and provides an example to illustrate
key considerations in determining the fair value of a financial asset when the
market for that financial asset is not active. This guidance was effective
upon issuance, including prior periods for which financial statements have not
been issued. We applied this guidance to financial assets measured at fair
value on a recurring basis at September 30, 2009. See Item 8. “Financial
Statements and Supplementary Data, Note 5 - Fair Value Measurements.” The
adoption of this guidance did not have a significant impact on our consolidated
financial position, results of operations or cash flows.
In April
2009, the FASB issued authoritative guidance to provide additional application
guidance and enhance disclosures regarding fair value measurements and
impairments of securities. This guidance provides guidelines for
making fair value measurements for assets and liabilities for which the volume
and level of activity for the asset or liability have significantly decreased or
for transactions that are not orderly more consistent with the principles
presented in earlier guidance, enhances consistency in financial reporting by
increasing the frequency of fair value disclosures, and provides additional
guidance designed to create greater clarity and consistency in accounting for
and presenting impairment losses on securities for other-than-temporary
impairments. This guidance is effective for interim and annual
periods ending after June 15, 2009, with early adoption permitted for periods
ending after March 15, 2009. We applied this guidance for the period
ended June 30, 2009 and the adoption did not have a significant impact on our
consolidated financial position, results of operations or cash
flows.
In
January 2010, the FASB issued authoritative guidance related to improving
disclosures about fair value measurements. This guidance requires separate
disclosures of the amounts of transfers in and out of Level 1 and Level 2 fair
value measurements and a description of the reason for such transfers. In the
reconciliation for Level 3 fair value measurements using significant
unobservable inputs, information about purchases, sales, issuances and
settlements shall be presented separately. These disclosures will be required
for interim and annual reporting periods effective January 1, 2010, except for
the disclosures related to the purchases, sales, issuances and settlements in
the roll forward activity of Level 3 fair value measurements, which are
effective on January 1, 2011. This guidance will require additional
disclosures but will not impact our consolidated financial position, results of
operations or cash flows.
Subsequent
Events. In May 2009, the FASB issued authoritative guidance on
subsequent events to incorporate accounting guidance that originated as auditing
standards into the body of authoritative literature issued by the
FASB. This guidance requires the evaluation of subsequent events
through the date the financial statements are issued or are available for issue
and the disclosure of the date through which subsequent events were evaluated
and the basis for that date. This guidance is effective for interim
and annual financial periods ending after June 15, 2009. We adopted
the requirements of this guidance for the period ended June 30, 2009 and the
adoption did not have a significant impact on our consolidated financial
position, results of operations or cash flows. On February 25, 2010,
the FASB amended this guidance to remove the requirement to disclose the date
through which an entity has evaluated subsequent events. See Item 8. “Financial
Statements and Supplementary Data, Note 16 – Subsequent
Events.”
Variable Interest Entities.
In June 2009, the FASB issued authoritative guidance related to variable
interest entities which changes how a reporting entity determines when an entity
that is insufficiently capitalized or is not controlled through voting rights
should be consolidated and modifies the approach for determining the primary
beneficiary of a variable interest entity. This guidance will require a
reporting entity to provide additional disclosures about its involvement with
variable interest entities and any significant changes in risk exposure due to
that involvement. The guidance related to variable interest entities will be
effective on January 1, 2010 and will not have an impact on our
consolidated financial position, results of operations or cash
flows.
FASB
Codification. In July 2009, the FASB issued guidance making
the FASB Accounting Standards Codification the single source of authoritative
nongovernmental U.S. GAAP. The Codification is not intended to change
GAAP, however, it will represent a significant change in researching issues and
referencing U.S. GAAP in financial statements and accounting
policies. This guidance is effective for financial statements issued
for interim and annual periods ending after September 15, 2009. We
applied this guidance as of the period ended September 30, 2009.
Oil and Gas Reporting
Requirements. In December 2008, the SEC issued Release No.
33-8995, “Modernization of Oil and Gas Reporting” (the
“Release”). The disclosure requirements under this Release require
reporting of oil and gas reserves using an average price based upon the prior
twelve-month period rather than year-end prices and the use of new technologies
to determine proved reserves if those technologies have been demonstrated to
result in reliable conclusions about reserves volumes. Companies will
also be allowed, but not required, to disclose probable and possible reserves in
SEC filings. In addition, companies will be required to report the
independence and qualifications of its reserves preparer or auditor and file
reports when a third party is relied upon to prepare reserves estimates or
conduct a reserves audit. The new disclosure requirements become
effective beginning with our annual report on Form 10-K for the year ending
December 31, 2009. In October 2009, the SEC issued Staff Accounting
Bulletin (“SAB”) No. 113 to bring existing SEC guidance into conformity with the
Release. The principle revisions of the guidance include changing the
price used in determining quantities of oil and gas reserves, as noted above;
eliminating the option to use post-quarter-end prices to evaluate write-offs of
excess capitalized costs under the full cost method of accounting; removing the
exclusion of unconventional methods used in extracting oil and gas from oil
sands or shale as an oil and gas producing activity; and removing certain
questions and interpretative guidance which are no longer
necessary. In January 2010, the FASB issued its guidance on oil
and gas reserve estimation and disclosure, aligning their requirements with the
SEC’s final rule. The Company applied this guidance at December 31,
2009 as a change in accounting principle that is inseparable from a change in
accounting estimate. This methodology was different than that applied
at December 31, 2008 and March 31, 2009, each of which resulted in a ceiling
test write-down. The effect of the adoption at December 31, 2009 was
not significant to our financial statements. The adoption of the new rule will
result in future amounts recorded for depreciation, depletion and amortization
and ceiling limitations being different from what would have been recorded if
the new rules would not have been mandated. See Item 8. “Financial
Statements and Supplementary Data, Supplemental Oil and Gas
Disclosures.”
Off-Balance
Sheet Arrangements
At
December 31, 2009 and 2008, we did not have any off-balance sheet
arrangements.
Forward-Looking
Statements
This
report includes forward-looking information regarding Rosetta that is intended
to be covered by the “forward-looking statements” within the meaning of the
Private Securities Litigation Reform Act of 1995, Section 27A of the Securities
Act of 1933, as amended, and Section 21E of the Securities Exchange Act of 1934,
as amended. All statements other than statements of historical fact included or
incorporated by reference in this report are forward-looking statements,
including without limitation all statements regarding future plans, business
objectives, strategies, expected future financial position or performance,
expected future operational position or performance, budgets and projected
costs, future competitive position, or goals and/or projections of management
for future operations. In some cases, you can identify a forward-looking
statement by terminology such as “may,” “will,” “could,” “should,” “expect,”
“plan,” “project,” “intend,” “anticipate,” “believe,” “estimate,” “predict,”
“potential,” “pursue,” “target” or “continue,” the negative of such terms or
variations thereon, or other comparable terminology.
The
forward-looking statements contained in this report are largely based on our
expectations for the future, which reflect certain estimates and assumptions
made by our management. These estimates and assumptions reflect our best
judgment based on currently known market conditions, operating trends, and other
factors. Although we believe such estimates and assumptions to be reasonable,
they are inherently uncertain and involve a number of risks and uncertainties
that are beyond our control. As such, management’s assumptions about future
events may prove to be inaccurate. For a more detailed description of the risks
and uncertainties involved, see Item 1A. “Risk Factors” in Part I. of this
report. We do not intend to publicly update or revise any
forward-looking statements as a result of new information, future events,
changes in circumstances, or otherwise. These cautionary statements qualify all
forward-looking statements attributable to us, or persons acting on our behalf.
Management cautions all readers that the forward-looking statements contained in
this report are not guarantees of future performance, and we cannot assure any
reader that such statements will be realized or that the events and
circumstances they describe will occur. Factors that could cause actual results
to differ materially from those anticipated or implied in the forward-looking
statements herein include, but are not limited to:
|
–
|
the
supply and demand for natural gas and
oil;
|
|
–
|
the
price of oil and natural gas;
|
|
–
|
general
economic conditions, either internationally, nationally or in
jurisdictions affecting our
business;
|
|
–
|
conditions
in the energy and economic markets;
|
|
–
|
our
ability to access the capital markets on favorable terms or at
all;
|
|
–
|
our
ability to obtain credit and/or capital in desired amounts and/or on
favorable terms;
|
|
–
|
the
ability and willingness of our current or potential counterparties or
vendors to enter into transactions with us and/or to fulfill their
obligations to us;
|
|
–
|
failure
of our joint interest partners to fund any or all of their portion of any
capital program;
|
|
–
|
the
occurrence of property acquisitions or
divestitures;
|
|
–
|
reserve
levels;
|
|
–
|
inflation;
|
|
–
|
competition
in the oil and natural gas
industry;
|
|
–
|
the
availability and cost of relevant raw materials, goods and
services;
|
|
–
|
the
availability and cost of processing and
transportation;
|
|
–
|
changes
or advances in technology;
|
|
–
|
potential
reserve revisions;
|
|
–
|
future
processing volumes and pipeline
throughput;
|
|
–
|
developments
in oil-producing and natural gas-producing
countries;
|
|
–
|
drilling
and exploration risks;
|
|
–
|
several
possible new legislative initiatives and regulatory changes
potentially adversely impacting our business and industry, including, but
not limited to, national healthcare, cap and trade, hydraulic
fracturing, state and federal corporate income taxes, retroactive royalty
or production tax regimes, changes in environmental regulations,
environmental risks and liability under federal, state and local
environmental laws and regulations;
|
|
–
|
effects
of the application of applicable laws and regulations, including changes
in such regulations or the interpretation
thereof;
|
|
–
|
present
and possible future claims, litigation and enforcement
actions;
|
|
–
|
lease
termination due to lack of activity or other disputes with mineral lease
and royalty owners, whether regarding calculation and payment of royalties
or otherwise;
|
|
–
|
the
weather, including the occurrence of any adverse weather conditions and/or
natural disasters affecting our business;
and
|
|
–
|
any
other factors that impact or could impact the exploration of oil or
natural gas resources, including but not limited to the geology of a
resource, the total amount and costs to develop recoverable reserves,
legal title, regulatory, natural gas administration, marketing and
operational factors relating to the extraction of oil and natural
gas.
|
Item 7A. Quantitative and Qualitative Disclosures
about Market Risk
The
primary objective of the following information is to provide forward-looking
quantitative and qualitative information about our potential exposure to market
risks. The term “market risk” refers to the risk of loss arising from adverse
changes in oil and natural gas prices and interest rates. The disclosures are
not meant to be precise indicators of expected future losses, but rather
indicators of reasonable possible losses. This forward-looking information
provides indicators of how we view and manage our ongoing market risk exposures.
All of our market risk sensitive instruments were entered into for purposes
other than speculative trading. See Item 7. “Management’s Discussion
and Analysis of Financial Condition and Results of Operations - Commodity Price
Risk, Interest Rate Risk and Related Hedging Activities.”
Commodity Price Risk. Our
major market risk exposure is in the pricing of our oil and natural gas
production. Realized pricing is primarily driven by the prevailing worldwide
price for crude oil and spot market prices applicable to our U.S. natural gas
production. Pricing for oil and natural gas production has been volatile and
unpredictable for several years, and we expect this volatility to continue in
the future. The prices we receive for production depend on many factors outside
of our control.
Our
fixed-price swap agreements are used to fix the sales price for our anticipated
future oil and natural gas production. Upon settlement, we receive a fixed price
for the hedged commodity and pay our counterparty a floating market price, as
defined in each instrument. These instruments are settled monthly. When the
floating price exceeds the fixed price for a contract month, we pay our
counterparty. When the fixed price exceeds the floating price, our counterparty
is required to make a payment to us. We have designated these swaps as cash flow
hedges.
We use
derivative transactions to manage exposure to changes in commodity prices and
interest rates. Our objective for holding derivative instruments is to achieve a
consistent level of cash flow to support a portion of our planned capital
spending. Our use of derivative transactions for hedging activities could
materially affect our results of operations, in particular quarterly or annual
periods since such instruments can limit our ability to benefit from favorable
interest rate movements. We do not enter into derivative instruments for
speculative purposes.
We
believe the use of derivative transactions, although not free of risk, allows us
to reduce our exposure to oil and natural gas sales price fluctuations and
interest rates and thereby achieve a more predictable cash flow. While the use
of derivative instruments limits the downside risk of adverse price movements,
their use may also limit future revenues from favorable price movements.
Moreover, our derivative contracts generally do not apply to all of our
production or variable rate debt and thus provide only partial price protection
against declines in commodity prices or rising interest rates. We expect that
the amount of our derivative contracts will vary from time to time.
On
December 31, 2009, we had open natural gas derivative hedges in an asset
position with a fair value of $7.4 million. A 10 percent increase in
natural gas prices would reduce the fair value by approximately $10.3 million,
while a 10 percent decrease in natural gas prices would increase the fair value
by approximately $10.5 million. The effects of these derivative
transactions on our natural gas sales are discussed above under “Results of
Operations – Natural Gas”. These fair value changes assume volatility
based on prevailing market parameters at December 31, 2009. In
addition, the majority of our capital expenditures is discretionary and could be
curtailed if our cash flows decline from expected levels.
Our
current cash flow hedge positions are with counterparties who are lenders in our
credit facilities. Based upon communications with these
counterparties, we expect the obligations under these transactions to continue
to be met. We evaluated nonperformance risk using current credit default swap
values and default probabilities for each counterparty and recorded a downward
adjustment to the fair value of our derivative assets in the amount of $0.01
million at December 31, 2009. We currently know of no circumstances
that would limit access to our credit facility or require a change in our debt
or hedging structure.
At
December 31, 2009, we had the following financial fixed price swap and
costless collar positions outstanding with average underlying prices that
represent hedged prices of commodities at various market locations:
|
Settlement
Period
|
Derivative
Instrument
|
Hedge
Strategy
|
Notional
Daily Volume
MMBtu
|
Total
of Notional Volume
MMBtu
|
Average
Floor/Fixed Prices per
MMBtu
|
Average
Ceiling Prices per MMBtu
|
Natural
Gas Production Hedged (1)
|
Fair
Market Value
Asset/(Liability)
(In
thousands)
|
||||||||||||||||||
|
2010
|
Swap
|
Cash
flow
|
15,000 | 5,475,000 | $ | 7.46 | $ | - | 13 | % | $ | 8,834 | ||||||||||||||
|
2010
|
Costless
Collar
|
Cash
flow
|
15,041 | 5,490,000 | 5.75 | 7.40 | 13 | % | 548 | |||||||||||||||||
|
2011
|
Swap
|
Cash
flow
|
5,000 | 1,825,000 | 5.72 | 5 | % | (408 | ) | |||||||||||||||||
|
2011
|
Costless
Collar
|
Cash
flow
|
25,000 | 9,125,000 | 5.80 | 7.58 | 23 | % | (1,552 | ) | ||||||||||||||||
| 21,915,000 | $ | 7,422 | ||||||||||||||||||||||||
____________________________________
|
|
(1)
|
Estimated
based on anticipated future gas
production.
|
In
January 2010, we entered into additional costless collar transactions to hedge
10,000 MMBtu/d of our expected production for July 2010 through December
2012. The costless collars have a floor price of $5.75 per MMBtu and
a ceiling price of $6.50 per MMBtu through 2011 and $7.15 per MMBtu in
2012. In February 2010, we entered into natural gas fixed-price swaps
to hedge 10,000 MMBtu/d of our expected production for July 2010 through
December 2011 at an average price of $5.91 per MMBtu.
Interest Rate Risks. We have
entered into a series of fixed rate swap agreements for a portion of our
variable rate debt. Our fixed-rate swap agreements are used to fix
the interest rate we pay under our variable rate credit facilities. The
fixed-rate swaps are freestanding financial agreements that require us and the
counterparty to net cash settle our gains and losses on a monthly
basis. Upon settlement, we receive a floating market LIBOR rate and
pay our counterparty a fixed interest rate, as defined in each instrument. When
the floating rate exceeds the fixed rate for a contract month, our counterparty
pays us. When the fixed price exceeds the floating price, we are required to
make a payment to our counterparty. We have designated these swaps as cash flow
hedges. At December 31, 2009, we had open interest rate swap hedges
in a liability position of $0.6 million. A 10 percent increase in
interest rates would increase the fair value by approximately $0.06 million,
while a 10 percent decrease in interest rates would decrease the fair value by
approximately $0.06 million. These fair value changes assume
volatility based on prevailing market parameters at December 31,
2009.
We have
hedged the interest rates on $100.0 million of our variable rate debt through
December 31, 2010. At December 31, 2009 we had the following
financial fixed interest rate swap positions outstanding:
|
Settlement
Period
|
Derivative
Instrument
|
Hedge
Strategy
|
Average
Fixed Rate
|
Fair
Market Value
Asset/(Liability)
(In
thousands)
|
||||||
|
January
1 - December 31, 2010
|
Swap
|
Cash
Flow
|
1.24 | % | $ | (635 | ) | |||
Item 8. Financial Statements and Supplementary
Data
Index
to Financial Statements
|
Page
|
|
|
Report
of Independent Registered Public Accounting Firm
|
45
|
|
Consolidated
Balance Sheet at December 31, 2009 and 2008
|
46
|
|
Consolidated
Statement of Operations for the years ended December 31, 2009, 2008 and
2007
|
47
|
|
Consolidated
Statement of Cash Flows for the years ended December 31, 2009, 2008 and
2007
|
48
|
|
Consolidated
Statement of Stockholders' Equity for the years ended December 31, 2009,
2008 and 2007
|
49
|
|
Notes
to Consolidated Financial Statements
|
50
|
Report
of Independent Registered Public Accounting Firm
To the
Board of Directors
and
Stockholders of Rosetta Resources Inc.
In our
opinion, the accompanying consolidated balance sheets and the related
consolidated statements of operations, of cash flows and of stockholders' equity
present fairly, in all material respects, the financial position of Rosetta
Resources Inc. and its subsidiaries (the "Company") at December 31, 2009 and
2008, and the results of their operations and their cash flows for each of the
three years in the period ended December 31, 2009 in conformity with accounting
principles generally accepted in the United States of America. Also
in our opinion, the Company maintained, in all material respects, effective
internal control over financial reporting as of December 31, 2009, based on
criteria established in Internal Control - Integrated
Framework issued by the Committee of Sponsoring Organizations of the
Treadway Commission (COSO). The Company's management is responsible
for these financial statements, for maintaining effective internal control over
financial reporting and for its assessment of the effectiveness of internal
control over financial reporting, included in Management's Annual Report on
Internal Control Over Financial Reporting appearing under Item
9A. Our responsibility is to express opinions on these financial
statements and on the Company's internal control over financial reporting based
on our integrated audits. We conducted our audits in accordance with
the standards of the Public Company Accounting Oversight Board (United
States). Those standards require that we plan and perform the audits
to obtain reasonable assurance about whether the financial statements are free
of material misstatement and whether effective internal control over financial
reporting was maintained in all material respects. Our audits of the
financial statements included examining, on a test basis, evidence supporting
the amounts and disclosures in the financial statements, assessing the
accounting principles used and significant estimates made by management, and
evaluating the overall financial statement presentation. Our audit of
internal control over financial reporting included obtaining an understanding of
internal control over financial reporting, assessing the risk that a material
weakness exists, and testing and evaluating the design and operating
effectiveness of internal control based on the assessed risk. Our
audits also included performing such other procedures as we considered necessary
in the circumstances. We believe that our audits provide a reasonable basis for
our opinions.
As
discussed in Note 2, at December 31, 2009 the Company changed the manner in
which its oil and gas reserves are estimated as well as the manner in which
prices are determined to calculate the ceiling limit on capitalized oil and gas
costs.
A
company’s internal control over financial reporting is a process designed to
provide reasonable assurance regarding the reliability of financial reporting
and the preparation of financial statements for external purposes in accordance
with generally accepted accounting principles. A company’s internal
control over financial reporting includes those policies and procedures that (i)
pertain to the maintenance of records that, in reasonable detail, accurately and
fairly reflect the transactions and dispositions of the assets of the company;
(ii) provide reasonable assurance that transactions are recorded as necessary to
permit preparation of financial statements in accordance with generally accepted
accounting principles, and that receipts and expenditures of the company are
being made only in accordance with authorizations of management and directors of
the company; and (iii) provide reasonable assurance regarding prevention or
timely detection of unauthorized acquisition, use, or disposition of the
company’s assets that could have a material effect on the financial
statements.
Because
of its inherent limitations, internal control over financial reporting may not
prevent or detect misstatements. Also, projections of any evaluation
of effectiveness to future periods are subject to the risk that controls may
become inadequate because of changes in conditions, or that the degree of
compliance with the policies or procedures may deteriorate.
/s/
PricewaterhouseCoopers LLP
February
26, 2010
Houston,
Texas
Item
8. Financial Statements and Supplementary Data
Rosetta
Resources Inc.
Consolidated
Balance Sheet
(In
thousands, except share amounts)
|
December
31,
|
||||||||
|
2009
|
2008
|
|||||||
|
Assets
|
||||||||
|
Current
assets:
|
||||||||
|
Cash
and cash equivalents
|
$ | 61,256 | $ | 42,855 | ||||
|
Restricted
cash
|
- | 1,421 | ||||||
|
Accounts
receivable
|
32,691 | 41,885 | ||||||
|
Derivative
instruments
|
8,983 | 34,742 | ||||||
|
Prepaid
expenses
|
2,837 | 5,046 | ||||||
|
Other
current assets
|
6,415 | 4,071 | ||||||
|
Total
current assets
|
112,182 | 130,020 | ||||||
|
Oil
and natural gas properties, full cost method, of which $42.3 million at
December 31, 2009 and $50.3 million at December 31, 2008 were excluded
from amortization
|
2,030,433 | 1,900,672 | ||||||
|
Other
fixed assets
|
12,417 | 9,439 | ||||||
| 2,042,850 | 1,910,111 | |||||||
|
Accumulated
depreciation, depletion, and amortization, including
impairment
|
(1,452,248 | ) | (935,851 | ) | ||||
|
Total
property and equipment, net
|
590,602 | 974,260 | ||||||
|
Deferred
loan fees
|
4,921 | 1,168 | ||||||
|
Deferred
tax asset
|
169,732 | 42,652 | ||||||
|
Other
assets
|
2,147 | 6,278 | ||||||
|
Total
other assets
|
176,800 | 50,098 | ||||||
|
Total
assets
|
$ | 879,584 | $ | 1,154,378 | ||||
|
Liabilities
and Stockholders' Equity
|
||||||||
|
Current
liabilities:
|
||||||||
|
Accounts
payable
|
$ | 2,279 | $ | 2,268 | ||||
|
Accrued
liabilities
|
37,107 | 48,824 | ||||||
|
Royalties
payable
|
16,064 | 17,388 | ||||||
|
Derivative
instruments
|
236 | 985 | ||||||
|
Prepayment
on gas sales
|
7,542 | 19,382 | ||||||
|
Deferred
income taxes
|
3,258 | 12,575 | ||||||
|
Total
current liabilities
|
66,486 | 101,422 | ||||||
|
Long-term
liabilities:
|
||||||||
|
Derivative
instruments
|
1,960 | - | ||||||
|
Long-term
debt
|
288,742 | 300,000 | ||||||
|
Other
long-term liabilities
|
29,301 | 26,584 | ||||||
|
Total
liabilities
|
$ | 386,489 | $ | 428,006 | ||||
|
Commitments
and contingencies (Note 11)
|
||||||||
|
Stockholders'
equity:
|
||||||||
|
Preferred
stock, $0.001 par value; authorized 5,000,000 shares; no shares
issued in 2009 or 2008
|
- | - | ||||||
|
Common
stock, $0.001 par value; authorized 150,000,000 shares; issued 51,254,709
shares and 51,031,481 shares at December 31, 2009 and 2008,
respectively
|
51 | 51 | ||||||
|
Additional
paid-in capital
|
780,196 | 773,676 | ||||||
|
Treasury
stock, at cost; 199,955 and 155,790 shares at December 31, 2009 and 2008,
respectively
|
(3,473 | ) | (2,672 | ) | ||||
|
Accumulated
other comprehensive income
|
4,259 | 24,079 | ||||||
|
Accumulated
deficit
|
(287,938 | ) | (68,762 | ) | ||||
|
Total
stockholders' equity
|
493,095 | 726,372 | ||||||
|
Total
liabilities and stockholders' equity
|
$ | 879,584 | $ | 1,154,378 | ||||
The
accompanying notes to the financial statements are an integral part
hereof.
Rosetta
Resources Inc.
Consolidated
Statement of Operations
(In
thousands, except per share amounts)
|
Year
Ended December 31,
|
||||||||||||
|
2009
|
2008
|
2007
|
||||||||||
|
Revenues:
|
||||||||||||
|
Natural
gas sales
|
$ | 250,684 | $ | 398,268 | $ | 295,644 | ||||||
|
Oil
sales
|
21,763 | 55,736 | 40,148 | |||||||||
|
NGL
sales
|
21,504 | 45,343 | 27,697 | |||||||||
|
Total
revenues
|
293,951 | 499,347 | 363,489 | |||||||||
|
Operating
costs and expenses:
|
||||||||||||
|
Lease
operating expense
|
60,773 | 55,694 | 47,044 | |||||||||
|
Depreciation,
depletion, and amortization
|
121,042 | 198,862 | 152,882 | |||||||||
|
Impairment
of oil and gas properties
|
379,462 | 444,369 | - | |||||||||
|
Treating
and transportation
|
5,675 | 6,323 | 4,230 | |||||||||
|
Marketing
fees
|
593 | 3,064 | 2,450 | |||||||||
|
Production
taxes
|
6,131 | 13,528 | 6,417 | |||||||||
|
General
and administrative costs
|
46,993 | 52,846 | 43,867 | |||||||||
|
Total
operating costs and expenses
|
620,669 | 774,686 | 256,890 | |||||||||
|
Operating
income (loss)
|
(326,718 | ) | (275,339 | ) | 106,599 | |||||||
|
Other
(income) expense:
|
||||||||||||
|
Interest
expense, net of interest capitalized
|
19,258 | 14,688 | 17,734 | |||||||||
|
Interest
income
|
(97 | ) | (1,600 | ) | (1,674 | ) | ||||||
|
Other
(income) expense, net
|
(876 | ) | 12,510 | (698 | ) | |||||||
|
Total
other expense
|
18,285 | 25,598 | 15,362 | |||||||||
|
Income
(loss) before provision for income taxes
|
(345,003 | ) | (300,937 | ) | 91,237 | |||||||
|
Income
tax expense (benefit)
|
(125,827 | ) | (112,827 | ) | 34,032 | |||||||
|
Net
income (loss)
|
$ | (219,176 | ) | $ | (188,110 | ) | $ | 57,205 | ||||
|
Earnings
(loss) per share:
|
||||||||||||
|
Basic
|
$ | (4.30 | ) | $ | (3.71 | ) | $ | 1.14 | ||||
|
Diluted
|
$ | (4.30 | ) | $ | (3.71 | ) | $ | 1.13 | ||||
|
Weighted
average shares outstanding:
|
||||||||||||
|
Basic
|
50,979 | 50,693 | 50,379 | |||||||||
|
Diluted
|
50,979 | 50,693 | 50,589 | |||||||||
The
accompanying notes to the financial statements are an integral part
hereof.
Rosetta
Resources Inc.
Consolidated
Statement of Cash Flows
(In
thousands)
|
Year
Ended December 31,
|
||||||||||||
|
2009
|
2008
|
2007
|
||||||||||
|
Cash
flows from operating activities
|
||||||||||||
|
Net
income (loss)
|
$ | (219,176 | ) | $ | (188,110 | ) | $ | 57,205 | ||||
|
Adjustments
to reconcile net income (loss) to net cash from operating
activities
|
||||||||||||
|
Depreciation,
depletion and amortization
|
121,042 | 198,862 | 152,882 | |||||||||
|
Impairment
of oil and gas properties
|
379,462 | 444,369 | - | |||||||||
|
Deferred
income taxes
|
(124,632 | ) | (116,519 | ) | 33,915 | |||||||
|
Amortization
of deferred loan fees recorded as interest expense
|
2,102 | 1,027 | 1,180 | |||||||||
|
Amortization
of original issue discount recorded as interest expense
|
342 | - | - | |||||||||
|
Stock
compensation expense
|
7,836 | 7,234 | 6,831 | |||||||||
|
Other
non-cash items
|
- | (512 | ) | (181 | ) | |||||||
|
Change
in operating assets and liabilities:
|
||||||||||||
|
Accounts
receivable
|
9,194 | 13,163 | (18,640 | ) | ||||||||
|
Income
taxes receivable
|
- | (776 | ) | - | ||||||||
|
Prepaid
expenses
|
2,209 | 5,367 | (1,652 | ) | ||||||||
|
Other
current assets
|
(2,344 | ) | 178 | (1,284 | ) | |||||||
|
Other
assets
|
(484 | ) | 191 | 144 | ||||||||
|
Accounts
payable
|
11 | 5,031 | 10,909 | |||||||||
|
Accrued
liabilities
|
(1,897 | ) | 7,322 | 3,998 | ||||||||
|
Royalties
payable
|
(13,164 | ) | (2,108 | ) | 12,000 | |||||||
|
Net
cash provided by operating activities
|
160,501 | 374,719 | 257,307 | |||||||||
|
Cash
flows from investing activities
|
||||||||||||
|
Acquisition
of oil and gas properties
|
(3,844 | ) | (163,187 | ) | (38,656 | ) | ||||||
|
Purchases
of oil and gas assets
|
(141,016 | ) | (228,464 | ) | (284,541 | ) | ||||||
|
Disposals
of oil and gas properties and assets
|
19,574 | - | - | |||||||||
|
(Increase)
decrease in restricted cash
|
1,421 | (1,421 | ) | - | ||||||||
|
Other
|
- | 2 | 1,156 | |||||||||
|
Net
cash used in investing activities
|
(123,865 | ) | (393,070 | ) | (322,041 | ) | ||||||
|
Cash
flows from financing activities
|
||||||||||||
|
Borrowings
on revolving credit facility
|
28,400 | 55,000 | 10,000 | |||||||||
|
Payments
on revolving credit facility
|
(40,000 | ) | - | (5,000 | ) | |||||||
|
Deferred
loan fees
|
(5,855 | ) | - | - | ||||||||
|
Proceeds
from stock options exercised
|
21 | 3,617 | 653 | |||||||||
|
Purchases
of treasury stock
|
(801 | ) | (627 | ) | (483 | ) | ||||||
|
Net
cash (used in) provided by financing activities
|
(18,235 | ) | 57,990 | 5,170 | ||||||||
|
Net
increase (decrease) in cash
|
18,401 | 39,639 | (59,564 | ) | ||||||||
|
Cash
and cash equivalents, beginning of year
|
42,855 | 3,216 | 62,780 | |||||||||
|
Cash
and cash equivalents, end of year
|
$ | 61,256 | $ | 42,855 | $ | 3,216 | ||||||
|
Supplemental
disclosures:
|
||||||||||||
|
Cash
paid for interest expense, net of capitalized interest
|
$ | 16,813 | $ | 13,658 | $ | 18,862 | ||||||
|
Cash
(received) paid for tax
|
$ | (1,196 | ) | $ | 4,470 | $ | 115 | |||||
|
Supplemental
non-cash disclosures:
|
||||||||||||
|
Capital
expenditures included in accrued liabilities
|
$ | 18,199 | $ | 26,555 | $ | 34,599 | ||||||
|
Release
of suspended revenues and non-consent liabilities resulting from Calpine
Settlement included in Accounts payable and Acquisition of oil and gas
properties
|
$ | - | $ | 36,713 | $ | - | ||||||
The
accompanying notes to the financial statements are an integral part
hereof.
Rosetta
Resources Inc.
Consolidated
Statement of Stockholders’ Equity
(In
thousands, except share amounts)
|
Common
Stock
|
Additional
Paid-In
Capital
|
Treasury
Stock
|
Accumulated
Other
|
Retained
Earnings
/ Accumulated
Deficit
|
Total
|
|||||||||||||||||||||||||||
|
Shares
|
Amount
|
Share
|
Amount
|
Comprehensive (Loss)/Income
|
Stockholders'
Equity
|
|||||||||||||||||||||||||||
|
Balance
at December 31, 2006
|
50,405,794 | $ | 50 | $ | 755,343 | 85,788 | $ | (1,562 | ) | $ | 6,315 | $ | 62,143 | $ | 822,289 | |||||||||||||||||
|
Stock
options exercised
|
40,104 | - | 653 | - | - | - | - | 653 | ||||||||||||||||||||||||
|
Treasury
stock - employee tax payment
|
- | - | - | 23,515 | (483 | ) | - | - | (483 | ) | ||||||||||||||||||||||
|
Stock-based
compensation
|
- | - | 6,831 | - | - | - | - | 6,831 | ||||||||||||||||||||||||
|
Vesting
of restricted stock
|
96,750 | - | - | - | - | - | - | - | ||||||||||||||||||||||||
|
Comprehensive
income:
|
- | - | - | - | - | - | - | - | ||||||||||||||||||||||||
|
Net
income
|
- | - | - | - | - | - | 57,205 | 57,205 | ||||||||||||||||||||||||
|
Change
in fair value of derivative hedging instruments
|
- | - | - | - | - | 1,276 | - | 1,276 | ||||||||||||||||||||||||
|
Hedge
settlements reclassified to income
|
- | - | - | - | - | (22,926 | ) | - | (22,926 | ) | ||||||||||||||||||||||
|
Tax
benefit related to cash flow hedges
|
- | - | - | - | - | 8,110 | - | 8,110 | ||||||||||||||||||||||||
|
Comprehensive
income
|
- | - | - | - | - | - | - | 43,665 | ||||||||||||||||||||||||
|
Balance
at December 31, 2007
|
50,542,648 | $ | 50 | $ | 762,827 | 109,303 | $ | (2,045 | ) | $ | (7,225 | ) | $ | 119,348 | $ | 872,955 | ||||||||||||||||
|
Stock
options exercised
|
214,119 | 1 | 3,615 | - | - | - | - | 3,616 | ||||||||||||||||||||||||
|
Treasury
stock - employee tax payment
|
- | - | - | 46,487 | (627 | ) | - | - | (627 | ) | ||||||||||||||||||||||
|
Stock-based
compensation
|
- | - | 7,234 | - | - | - | - | 7,234 | ||||||||||||||||||||||||
|
Vesting
of restricted stock
|
274,714 | - | - | - | - | - | - | - | ||||||||||||||||||||||||
|
Comprehensive
loss:
|
- | - | - | - | - | - | - | - | ||||||||||||||||||||||||
|
Net
loss
|
- | - | - | - | - | - | (188,110 | ) | (188,110 | ) | ||||||||||||||||||||||
|
Change
in fair value of derivative hedging instruments
|
- | - | - | - | - | 30,057 | - | 30,057 | ||||||||||||||||||||||||
|
Hedge
settlements reclassified to income
|
- | - | - | - | - | 19,829 | - | 19,829 | ||||||||||||||||||||||||
|
Tax
expense related to cash flow hedges
|
- | - | - | - | - | (18,582 | ) | - | (18,582 | ) | ||||||||||||||||||||||
|
Comprehensive
loss
|
- | - | - | - | - | - | - | (156,806 | ) | |||||||||||||||||||||||
|
Balance
at December 31, 2008
|
51,031,481 | $ | 51 | $ | 773,676 | 155,790 | $ | (2,672 | ) | $ | 24,079 | $ | (68,762 | ) | $ | 726,372 | ||||||||||||||||
|
Stock
options exercised
|
14,125 | - | 21 | - | - | - | - | 21 | ||||||||||||||||||||||||
|
Treasury
stock - employee tax payment
|
- | - | - | 44,165 | (801 | ) | - | - | (801 | ) | ||||||||||||||||||||||
|
Stock-based
compensation
|
- | - | 6,499 | - | - | - | - | 6,499 | ||||||||||||||||||||||||
|
Vesting
of restricted stock
|
209,103 | - | - | - | - | - | - | - | ||||||||||||||||||||||||
|
Comprehensive
loss:
|
- | - | - | - | - | - | - | - | ||||||||||||||||||||||||
|
Net
loss
|
- | - | - | - | - | - | (219,176 | ) | (219,176 | ) | ||||||||||||||||||||||
|
Change
in fair value of derivative hedging instruments
|
- | - | - | - | - | 43,693 | - | 43,693 | ||||||||||||||||||||||||
|
Hedge
settlements reclassified to income
|
- | - | - | - | - | (75,278 | ) | - | (75,278 | ) | ||||||||||||||||||||||
|
Tax
expense related to cash flow hedges
|
- | - | - | - | - | 11,765 | - | 11,765 | ||||||||||||||||||||||||
|
Comprehensive
loss
|
- | - | - | - | - | - | - | (238,996 | ) | |||||||||||||||||||||||
|
Balance
at December 31, 2009
|
51,254,709 | $ | 51 | $ | 780,196 | 199,955 | $ | (3,473 | ) | $ | 4,259 | $ | (287,938 | ) | $ | 493,095 | ||||||||||||||||
The
accompanying notes to the financial statements are an integral part
hereof.
Rosetta
Resources Inc.
Notes
to Consolidated Financial Statements
|
(1)
|
Organization
and Operations of the Company
|
Nature of
Operations. Rosetta Resources Inc. (together with its
consolidated subsidiaries, the “Company”) is an independent oil and gas company
that is engaged in oil and natural gas exploration, development, production and
acquisition activities in the United States. The Company’s main operations are
primarily concentrated in the Sacramento Basin of California, the Rockies, the
Lobo and Perdido Trends in South Texas, the State Waters of Texas and the Gulf
of Mexico.
In
preparing these financial statements, the Company has evaluated events and
transactions for potential recognition or disclosure through February 26, 2010,
the date the financial statements were issued. See Item
8. “Financial Statements and Supplementary Data, Note 16 – Subsequent
Events.”
Certain
reclassifications of prior year balances have been made to conform such amounts
to current year classifications. These reclassifications have no
impact on net income (loss).
|
(2)
|
Summary
of Significant Accounting Policies
|
Change
in accounting principle
As more
fully described below in Property Plant and Equipment,
net and Supplemental Oil and Gas Disclosures within these consolidated
financial statements, in January 2010 the FASB issued Accounting Standards
Update 2010-03, "Extractive Activities -- Oil and Gas", which conforms the
authoritative guidance to the requirements of the new SEC rules released in
December 2008 "Modernization of Oil and Gas Reporting" and are effective
December 31, 2009. The principle revisions under the new authoritative guidance
include changing the manner in which oil and gas reserves are estimated as well
as the manner in which prices are determined to calculate the ceiling limit on
capitalized oil and gas costs. This change in accounting has been treated
in these financial statements as a change in accounting principle that is
inseparable from a change in accounting estimate.
The
effect of the adoption at December 31, 2009 was not significant to the Company's
financial statements. The adoption of the new rule will result in future amounts
recorded for depreciation, depletion and amortization and ceiling limitations
being different from what would have been recorded if the new rules would not
have been mandated.
FASB
Codification
In July
2009, the FASB issued guidance making the FASB Accounting Standards Codification
the single source of authoritative nongovernmental U.S. GAAP. The
Codification is not intended to change GAAP, however, it will represent a
significant change in researching issues and referencing U.S. GAAP in financial
statements and accounting policies. This guidance is effective for
financial statements issued for interim and annual periods ending after
September 15, 2009. The Company applied this guidance as of the
period ended September 30, 2009.
Principles
of Consolidation and Basis of Presentation
The
accompanying consolidated financial statements for the years ended December 31,
2009, 2008 and 2007 contain the accounts of Rosetta Resources Inc. and its
majority owned subsidiaries after eliminating all significant intercompany
balances and transactions.
Use
of Estimates in Preparation of Financial Statements
The
preparation of the consolidated financial statements in conformity with
accounting principles generally accepted in the United States of America
requires management to make estimates and assumptions that affect the reported
amounts of assets and liabilities, and disclosure of contingent assets and
liabilities at the date of the financial statements and the reported amounts of
revenue and expense during the reporting period. Certain accounting policies
involve judgments and uncertainties to such an extent that there is reasonable
likelihood that materially different amounts could have been reported under
different conditions, or if different assumptions had been used. The
Company evaluates their estimates and assumptions on a regular
basis. The Company bases their estimates on historical experience and
various other assumptions that are believed to be reasonable under the
circumstances, the results of which form the basis for making judgments about
the carrying values of assets and liabilities that are not readily apparent from
other sources. Actual results may differ from these estimates and assumptions
used in preparation of the Company’s financial statements. The most significant
estimates with regard to these financial statements relate to the provision for
income taxes including uncertain tax positions, the outcome of pending
litigation, stock-based compensation, valuation of derivative
instruments, future development and abandonment costs, estimates to certain oil
and gas revenues and expenses and estimates of proved oil and natural gas
reserve quantities used to calculate depletion, depreciation and impairment of
proved oil and natural gas properties and equipment.
Cash and Cash
Equivalents
The
Company considers all highly liquid investments with an original maturity of
three months or less to be cash equivalents.
With
respect to the current market environment for liquidity and access to credit,
the Company, through banks participating in its credit facility, has invested
available cash in interest and non-interest bearing demand deposit accounts in
those participating banks and in money market accounts and funds whose
investments are limited to United States Government Securities, securities
backed by the United States Government, or securities of United States
Government agencies. The Company has followed this policy and believes this is
an appropriate approach for the investment of Company funds.
Restricted
Cash
At
December 31, 2009, the Company had no restricted cash. Restricted
cash of $1.4 million at December 31, 2008 consisted of cash deposited by the
Company in an escrow account, which was created in conjunction with the South
Texas acquisitions for potential environmental remediation costs associated with
acquired properties.
Allowance
for Doubtful Accounts
The
Company regularly reviews all aged accounts receivables for collectability and
establishes an allowance as necessary for individual customer
balances.
Property,
Plant and Equipment, Net
The
Company follows the full cost method of accounting for oil and natural gas
properties. Under the full cost method, all costs incurred in
acquiring, exploring and developing properties, including salaries, benefits and
other internal costs directly attributable to these activities, are capitalized
when incurred into cost centers that are established on a country-by-country
basis, and are amortized as reserves in the cost center in which they are
produced, subject to a limitation that the capitalized costs not exceed the
value of those reserves. In some cases, however, certain significant costs, such
as those associated with offshore U.S. operations, unevaluated properties and
significant development projects are deferred separately without amortization
until the specific property to which they relate is found to be either
productive or nonproductive, at which time those deferred costs and any reserves
attributable to the property are included in the computation of amortization in
the cost center. All costs incurred in oil and natural gas producing
activities are regarded as integral to the acquisition, discovery and
development of whatever reserves ultimately result from the efforts as a whole,
and are thus associated with the Company’s reserves. The Company capitalizes
internal costs directly identified with acquisition, exploration and development
activities. The Company capitalized $4.8 million, $7.1 million and
$5.5 million of internal costs for the years ended December 31, 2009, 2008 and
2007, respectively. Unevaluated costs are excluded from the full cost
pool and are periodically evaluated for impairment at which time they are
transferred to the full cost pool to be amortized. Upon evaluation,
costs associated with productive properties are transferred to the full cost
pool and amortized. Gains or losses on the sale of oil and natural gas
properties are generally included in the full cost pool unless a significant
portion of the pool or reserves are sold.
The
Company assesses the impairment for oil and natural gas properties quarterly
using a ceiling test to determine if impairment is necessary. This
ceiling limits capitalized costs to the present value of estimated future cash
flows from proved oil and natural gas reserves (including the effect of any
related hedging activities) reduced by future operating expenses, development
expenditures, abandonment costs (net of salvage values) to the extent not
included in oil and gas properties pursuant to authoritative guidance, and
estimated future income taxes thereon. Prior to December 31, 2009,
the ceiling calculation dictated that prices and costs in effect as of the last
day of the quarter be held constant. The current ceiling calculation
utilizes prices calculated as a twelve-month average price using first day of
the month prices and costs in effect as of the last day of the quarter are held
constant. Prior to December 31, 2009, for periods in which a
write-down was required, if oil and gas prices increased subsequent to the end
of a quarter or annual period but prior to the issuance of the financial
statements, the Company was allowed to adjust the write-down to reflect the
higher prices. As of December 31, 2009, the use of the recovery of
prices after the end of the period is no longer permitted. A ceiling
test write-down is a charge to earnings and cannot be reinstated even if the
cost ceiling increases at a subsequent reporting date. If required,
it would reduce earnings and impact shareholders’ equity in the period of
occurrence and result in lower DD&A expense in the future. The
average rates of DD&A were $2.39, $3.71 and $3.34 per Mcfe in 2009, 2008 and
2007, respectively.
The table
below sets forth relevant assumptions utilized in the quarterly ceiling test
computations for the respective periods noted:
|
2009
|
||||||||||||||||||||
|
Total
Impairment
|
December
31(3)
|
September
30(1)
|
June
30
|
March
31
|
||||||||||||||||
|
Henry
Hub natural gas price (per MMBtu)(4)
|
$ | 3.87 | $ | 4.59 | $ | 3.89 | $ | 3.63 | ||||||||||||
|
West
Texas Intermediate oil price (per Bbl)(4)
|
57.65 | 76.25 | 66.25 | 46.00 | ||||||||||||||||
|
Increase
(decrease) of calculated ceiling value due to cash flow hedges (pre-tax)
(in thousands)
|
45,000 | 29,334 | 55,299 | 79,664 | ||||||||||||||||
|
Impairment
recorded (pre-tax) (in thousands)
|
$ | 379,462 | - | - | - | 379,462 | ||||||||||||||
|
Potential
impairment absent the effects of hedging (pre-tax) (in thousands)
(5)
|
29,482 | - | 26,337 | 459,126 | ||||||||||||||||
|
2008
|
||||||||||||||||||||
|
Total
Impairment
|
December
31
|
September
30
|
June
30
|
March
31
|
||||||||||||||||
|
Henry
Hub natural gas price (per MMBtu)(4)
|
$ | 5.71 | $ | 7.12 | $ | 13.10 | $ | 9.37 | ||||||||||||
|
West
Texas Intermediate oil price (per Bbl)(4)
|
41.00 | 96.37 | 140.22 | 105.63 | ||||||||||||||||
|
Increase
(decrease) of calculated ceiling value due to cash flow hedges (pre-tax)
(in thousands)
|
47,142 | 37,440 | (141,123 | ) | (60,043 | ) | ||||||||||||||
|
Impairment
recorded (pre-tax) (in thousands)
|
$ | 444,369 | 238,710 | 205,659 | - | - | ||||||||||||||
|
Potential
impairment absent the effects of hedging (pre-tax) (in thousands)
(5)
|
285,852 | 243,099 | - | - | ||||||||||||||||
|
2007
|
||||||||||||||||||||
|
Total
Impairment
|
December
31(2)
|
September
30
|
June
30
|
March
31
|
||||||||||||||||
|
Henry
Hub natural gas price (per MMBtu)(4)
|
$ | 8.91 | $ | 6.38 | $ | 6.80 | $ | 7.34 | ||||||||||||
|
West
Texas Intermediate oil price (per Bbl)(4)
|
98.88 | 82.88 | 69.63 | 66.20 | ||||||||||||||||
|
Increase
(decrease) of calculated ceiling value due to cash flow hedges (pre-tax)
(in thousands)
|
(34,616 | ) | 46,056 | 34,582 | 23,904 | |||||||||||||||
|
Impairment
recorded (pre-tax) (in thousands)
|
$ | - | - | - | - | - | ||||||||||||||
|
Potential
impairment absent the effects of hedging (pre-tax) (in thousands)
(5)
|
- | 31,657 | - | - | ||||||||||||||||
____________________________________
|
|
(1)
|
The
Company’s ceiling test was calculated using hedge adjusted market prices
of gas and oil at September 30, 2009, which were based on a Henry Hub
price of $3.30 per MMBtu and a West Texas Intermediate oil price of $67.00
per Bbl (adjusted for basis and quality differentials). Cash
flow hedges of natural gas production in place at September 30, 2009
increased the calculated ceiling value by approximately $50.7 million
(pre-tax). The use of these prices would have resulted in a
pre-tax write-down of $18.8 million at September 30, 2009. As
allowed under the full cost accounting rules at the time, the Company
re-evaluated the ceiling test on October 29, 2009 using the market price
for Henry Hub of $4.59 per MMBtu and West Texas Intermediate oil price of
$76.25 per Bbl (adjusted for basis and quality
differentials). At these prices, cash flow hedges of natural
gas production in place increased the calculated ceiling value by
approximately $29.3 million (pre-tax). Utilizing these prices,
the calculated ceiling amount exceeded the Company’s net capitalized cost
of oil and gas properties. As a result, no write-down was
recorded for the quarter ended September 30,
2009.
|
|
|
(2)
|
The
Company’s ceiling test was calculated using hedge adjusted market prices
of gas and oil at December 31, 2007, which were based on a Henry Hub price
of $6.80 per MMBtu and a West Texas Intermediate oil price of $92.50 per
Bbl (adjusted for basis and quality differentials). Cash flow
hedges of natural gas production in place at December 31, 2007 increased
the calculated ceiling value by approximately $32.1 million
(pre-tax). The use of these prices would have resulted in a
pre-tax write-down of $21.5 million at December 31, 2007. As
allowed under the full cost accounting rules at the time, the Company
re-evaluated the ceiling test on February 22, 2008 using the market price
for Henry Hub of $8.91 per MMBtu and West Texas Intermediate oil price of
$98.88 per Bbl (adjusted for basis and quality
differentials). At these prices, cash flow hedges of natural
gas production in place decreased the calculated ceiling value by
approximately $34.6 million (pre-tax). Utilizing these prices,
the calculated ceiling amount exceeded the Company’s net capitalized cost
of oil and gas properties. As a result, no write-down was
recorded for the quarter ended December 31,
2007.
|
|
|
(3)
|
The
December 31, 2009 oil and natural gas prices are calculated as a
twelve-month historical average of the first day of the month prices for
the West Texas Intermediate oil price and the Henry Hub natural gas
price.
|
|
|
(4)
|
Adjusted
for basis and quality
differentials.
|
|
|
(5)
|
Represents
the total potential impairment excluding the effects of
hedging. Where there is no potential impairment for the period,
the Company was able to utilize higher prices subsequent to period end and
there would have been no impairment recognized with or without the effects
of hedging.
|
Due to
the volatility of commodity prices, should oil and natural gas prices decline in
the future, we experience a significant downward adjustment to our estimated
proved reserves, and/or our commodity hedges settle and are not
replaced, it is possible that another write-down of our oil and gas properties
could occur.
Other
property, plant and equipment primarily includes furniture, fixtures and
automobiles, which are recorded at cost and depreciated on a straight-line basis
over useful lives of five to seven years. Repair and maintenance costs are
charged to expense as incurred while renewals and betterments are capitalized as
additions to the related assets in the period incurred. Gains or losses from the
disposal of property, plant and equipment are recorded in the period incurred.
The net book value of the property, plant and equipment that is retired or sold
is charged to accumulated depreciation, asset cost and amortization, and the
difference is recognized as a gain or loss in the results of operations in the
period the retirement or sale transpires.
Future
Development and Abandonment Costs
Future
development costs include costs incurred to obtain access to proved reserves,
such as drilling costs and the installation of production equipment, and such
costs are included in the calculation of DD&A expense. Future
abandonment costs include costs to dismantle and relocate or dispose of our
production platforms, gathering systems and related structures and restoration
costs of land and seabed. We develop estimates of these costs for each of our
properties based upon their geographic location, type of production structure,
well depth, currently available procedures and ongoing consultations with
construction and engineering consultants. Because these costs typically extend
many years into the future, estimating these future costs is difficult and
requires management to make judgments that are subject to future revisions based
upon numerous factors, including changing technology and the political and
regulatory environment. We review our assumptions and estimates of future
development and future abandonment costs on an annual basis.
We
provide for future abandonment costs in accordance with authoritative guidance
regarding the accounting for asset retirement obligations. This
guidance requires that a liability for the fair value of an asset retirement
obligation be recorded in the period in which it is incurred and the
corresponding cost capitalized by increasing the carrying amount of the related
long-lived asset. The liability is accreted to its present value each period,
and the capitalized cost is depreciated over the useful life of the related
asset.
Capitalized
Interest
The
Company capitalizes interest on capital invested in projects related to
unevaluated properties and significant development projects in accordance with
authoritative guidance for the capitalization of interest cost. As
proved reserves are established or impairment determined, the related
capitalized interest is included in costs subject to amortization.
Fair Value of Financial
Instruments
The
carrying value of cash and cash equivalents, accounts receivable, other current
assets and current liabilities reported in the consolidated balance sheet
approximate fair value because of their short-term
nature. Derivatives are also recorded on the balance sheet at fair
value. The carrying amount of long-term debt reported in the
consolidated balance sheet at December 31, 2009 is $288.7
million. The Company calculated the fair value of its long-term debt
as of December 31, 2009 in accordance with the authoritative guidance for fair
value measurements using a discounted cash flow technique that incorporates a
market interest yield curve with adjustments for duration, optionality, and risk
profile. Based on this calculation, the Company has determined the
fair market value of its debt to be $303.0 million at December 31,
2009. The fair market value of debt at December 31, 2008 was $275.0
million.
Concentrations of Credit
Risk
Financial
instruments, which potentially subject the Company to concentrations of credit
risk, consist primarily of cash, accounts receivable and derivative instruments.
The Company’s accounts receivable and derivative instruments are concentrated
among entities engaged in the energy industry within the United States and
financial institutions, respectively.
Deferred
Loan Fees
Loan fees
incurred in connection with the credit facility are recorded on the Company’s
Consolidated Balance Sheet as deferred loan fees. The deferred loan fees are
amortized to interest expense over the term of the related debt using the
straight-line method, which approximates the effective interest
method.
Derivative
Instruments and Hedging Activities
The
Company uses derivative instruments to manage market risks resulting from
fluctuations in commodity prices of natural gas and crude oil. The Company also
uses derivatives to manage interest rate risk associated with its debt under its
credit facility. The Company periodically enters into derivative
contracts, including price swaps or costless price collars, which may require
payments to (or receipts from) counterparties based on the differential between
a fixed price or interest rate and a variable price or LIBOR rate for a
fixed notional quantity or amount without the exchange of underlying
volumes. The notional amounts of these financial instruments were based on
expected proved production from existing wells at inception of the hedge
instruments or debt under its current credit agreements.
Derivatives
are recorded on the balance sheet at fair market value and changes in the fair
market value of derivatives are recorded each period in current earnings or
other comprehensive income, depending on whether a derivative is designated and
qualifies as a hedge. The Company’s derivatives consist of cash flow hedges in
which the Company is hedging the variability of cash flows related to a
forecasted transaction. Changes in the fair market value of these derivative
instruments designated as cash flow hedges are reported in accumulated other
comprehensive income and reclassified to earnings in the periods in which the
contracts are settled. The ineffective portion of the cash flow hedge is
recognized in current period earnings as other income (expense). Gains and
losses on derivative instruments that do not qualify for hedge accounting are
included in revenue in the period in which they occur. The resulting
cash flows from derivatives are reported as cash flows from operating
activities.
At the
inception of a derivative contract, the Company may designate the derivative as
a cash flow hedge. For all derivatives designated as cash flow hedges, the
Company formally documents the relationship between the derivative contract and
the hedged items, as well as the risk management objective for entering into the
derivative contract. To be designated as a cash flow hedge transaction, the
relationship between the derivative and hedged items must be highly effective in
achieving the offset of changes in cash flows attributable to the risk both at
the inception of the derivative and on an ongoing basis. The Company measures
hedge effectiveness on a quarterly basis and hedge accounting is discontinued
prospectively if it is determined that the derivative is no longer effective in
offsetting changes in the cash flows of the hedged item and gains and losses are
recognized in income. Gains and losses included in accumulated other
comprehensive income related to cash flow hedge derivatives that become
ineffective remain unchanged until the related production is delivered. If the
Company determines it is not probable that a forecasted transaction will occur,
deferred gains or losses on the hedging instrument are recognized in earnings
immediately. The Company does not enter into derivative agreements
for trading or other speculative purposes. See Item 8. “Financial
Statements and Supplementary Data, Note 6 – Commodity Hedging Contracts and
Other Derivatives” for a description of the derivative contracts which the
Company executes.
Environmental
Environmental
expenditures are expensed or capitalized, as appropriate, depending on their
future economic benefit. Expenditures that relate to an existing condition
caused by past operations, and that do not have future economic benefit, are
expensed. Liabilities related to future costs are recorded on an undiscounted
basis when environmental assessments and/or remediation activities are probable
and the cost can be reasonably estimated. There were no significant
environmental liabilities at December 31, 2009 or 2008.
Stock-Based
Compensation
Stock-based
compensation cost for options is estimated at the grant date based on the
award’s fair value as calculated by the Black-Scholes option-pricing model and
is recognized as expense over the requisite service period. The Black-Scholes
model requires various highly judgmental assumptions including volatility,
forfeiture rates and expected option life. If any of the assumptions used in the
Black-Scholes model change significantly, stock-based compensation expense for
future grants may differ materially from that recorded in the current
period. Stock-based compensation cost for restricted stock is
estimated at the grant date based on the award’s fair value which is equal to
the average high and low common stock price on the date of grant and is
recognized as expense over the requisite service period.
Stock-based
compensation for PSUs is measured at the end of each reporting period through
the settlement date using the quarter-end closing common stock prices for awards
that are solely based on performance conditions or a Monte Carlo model for
awards that contain market conditions to reflect the current fair
value. Compensation expense is recognized ratably over the
performance period based on the Company’s estimated achievement of the
established metrics. Compensation expense for awards with performance
conditions will only be recognized for those awards for which it is probable
that the performance conditions will be achieved and which are expected to
vest. The compensation expense will be estimated based upon an
assessment of the probability that the performance metrics will be achieved,
current and historical forfeitures, and the Board’s anticipated vesting
percentage. Compensation expense for awards with market conditions is
measured at the end of each reporting period based on the fair value derived
from the Monte Carlo model. The Monte Carlo model requires various
highly judgmental assumptions including volatility and future cash flow
projections. If any of the assumptions used in the Monte Carlo model
change significantly, stock-based compensation expense may differ materially in
the future from that recorded in the current period.
Any
excess tax benefit arising from our deferred compensation plans is recognized as
a credit to additional paid in capital when realized and is calculated as the
amount by which the tax deduction received exceeds the deferred tax asset
associated with the recorded stock compensation expense. The Company
has approximately $0.3 million of related excess tax benefits which will be
recognized upon utilization of our net operating loss
carryforward. Current authoritative guidance requires the cash flows
that result from tax deductions in excess of the compensation expense to be
recognized as financing activities.
Preferred
Stock
The
Company is authorized to issue 5,000,000 shares of preferred stock with
preferences and rights as determined by the Company’s Board of
Directors. As of December 31, 2009 and 2008, there were no shares of
preferred stock outstanding.
Treasury
Stock
Shares of
common stock were repurchased by the Company as the shares were surrendered by
the employees to pay tax withholding upon the vesting of restricted stock
awards. These repurchases were not part of a publicly announced
program to repurchase shares of the Company’s common stock, nor does the Company
have a publicly announced program to repurchase shares of common
stock.
Revenue
Recognition
The
Company uses the sales method of accounting for the sale of its natural
gas. When actual natural gas sales volumes exceed our delivered
share of sales volumes, an over-produced imbalance occurs. To the extent an
over-produced imbalance exceeds our share of the remaining estimated proved
natural gas reserves for a given property, the Company records a
liability. At December 31, 2009 and 2008, imbalances were
insignificant.
Since
there is a ready market for natural gas, crude oil and NGLs, the Company sells
its products soon after production at various locations at which time title and
risk of loss pass to the buyer. Revenue is recorded when title passes based on
the Company’s net interest or nominated deliveries of production volumes. The
Company records its share of revenues based on production volumes and contracted
sales prices. The sales price for natural gas, NGLs and crude oil are adjusted
for transportation cost and other related deductions. The transportation costs
and other deductions are based on contractual or historical data and do not
require significant judgment. Subsequently, these deductions and transportation
costs are adjusted to reflect actual charges based on third party documents once
received by the Company. Historically, these adjustments have been
insignificant. In addition, natural gas and crude oil volumes sold are not
significantly different from the Company’s share of production.
The
Company calculates and pays royalties on natural gas, crude oil and NGLs in
accordance with the particular contractual provisions of the
lease. Royalty liabilities are recorded in the period in which the
natural gas, crude oil or NGLs are produced and are included in Royalties
Payable on the Company’s Consolidated Balance Sheet.
Income
Taxes
Deferred
income taxes are provided to reflect the tax consequences in future years of
differences between the financial statement and tax basis of assets and
liabilities using the liability method in accordance with the provisions set
forth in the authoritative guidance regarding the accounting for income
taxes. Income taxes are provided based on earnings reported for tax
return purposes in addition to a provision for deferred income taxes and are
measured using enacted tax rates and laws that will be in effect when the
differences are expected to reverse. A valuation allowance is established to
reduce deferred tax assets if it is more likely than not that the related tax
benefits will not be realized.
Authoritative
guidance for accounting for uncertainty in income taxes requires that the
Company recognize the financial statement benefit of a tax position only after
determining that the relevant tax authority would more likely than not sustain
the position following an audit. For tax positions meeting the more
likely than not threshold, the amount recognized in the financial statements is
the largest benefit that has a greater than 50% likelihood of being realized
upon ultimate settlement with the relevant tax authority.
Recent
Accounting Developments
The
following recently issued accounting developments have been applied or may
impact the Company in future periods.
Business
Combinations. In December 2007, the FASB revised the authoritative
guidance for business combinations, extending its applicability to all
transactions and other events in which one entity obtains control over one or
more other businesses. The revised guidance broadens the fair value
measurement and recognition of assets acquired, liabilities assumed, and
interests transferred as a result of business combinations and requires that
acquisition-related costs incurred prior to the acquisition be
expensed. The revised guidance also expands the definition of what
qualifies as a business, and this expanded definition could include prospective
oil and gas purchases. This could cause the Company to expense
transaction costs for future oil and gas property purchases that we have
historically capitalized. Additionally, this guidance expands the
required disclosures to improve the financial statement users’ abilities to
evaluate the nature and financial effects of business
combinations. This guidance is effective for business combinations
for which the acquisition date is on or after January 1, 2009. The
adoption of the revised guidance did not have a significant impact on the
Company’s consolidated financial position, results of operations or cash
flows.
Noncontrolling Interests in
Consolidated Financial Statements. In December 2007, the
FASB issued authoritative guidance which improves the relevance, comparability
and transparency of the financial information that a reporting entity provides
in its consolidated financial statements by establishing accounting and
reporting standards for the non-controlling interest in a subsidiary and for the
deconsolidation of a subsidiary. This guidance is effective for
fiscal years beginning after December 15, 2008. The adoption of this
guidance did not have a significant impact on the Company’s consolidated
financial position, results of operations or cash flows.
Disclosures about Derivative
Instruments and Hedging Activities. In March 2008, the
FASB issued authoritative guidance related to disclosures about derivative
instruments and hedging activities, which is intended to improve financial
reporting about derivative instruments and hedging activities by requiring
enhanced disclosures. This guidance is effective for fiscal years
beginning after November 15, 2008. The Company adopted the disclosure
requirements beginning January 1, 2009. See Item 8. “Financial
Statements and Supplementary Data, Note 6 - Commodity Hedging Contracts and
Other Derivatives.”
Fair Value
Measurements. In February 2008, the FASB issued authoritative
guidance which delayed the effective date of fair value accounting for
nonfinancial assets and liabilities, except for items that are recognized or
disclosed at fair value in the financial statements on a recurring basis (at
least annually), until fiscal years beginning after November 15,
2008. Beginning January 1, 2009, the Company implemented the guidance
for nonfinancial assets and liabilities. The adoption of this
guidance did not have an impact on the Company’s consolidated financial
position, results of operations or cash flows. In October 2008, the
FASB issued guidance on determining the fair value of a financial asset when the
market for that asset is not active. This guidance clarifies the
application of fair value accounting in a market that is not active and provides
an example to illustrate key considerations in determining the fair value of a
financial asset when the market for that financial asset is not active.
This guidance was effective upon issuance, including prior periods for
which financial statements have not been issued. The Company applied this
guidance to financial assets measured at fair value on a recurring basis at
September 30, 2009. See Item 8. “Financial Statements and
Supplementary Data, Note 5 - Fair Value Measurements.” The adoption of this
guidance did not have a significant impact on the Company’s consolidated
financial position, results of operations or cash flows.
In April
2009, the FASB issued authoritative guidance to provide additional application
guidance and enhance disclosures regarding fair value measurements and
impairments of securities. This guidance provides guidelines for
making fair value measurements for assets and liabilities for which the volume
and level of activity for the asset or liability have significantly decreased or
for transactions that are not orderly more consistent with the principles
presented in earlier guidance, enhances consistency in financial reporting by
increasing the frequency of fair value disclosures, and provides additional
guidance designed to create greater clarity and consistency in accounting for
and presenting impairment losses on securities for other-than-temporary
impairments. This guidance is effective for interim and annual
periods ending after June 15, 2009, with early adoption permitted for periods
ending after March 15, 2009. The Company applied this guidance for
the period ended June 30, 2009 and the adoption did not have a significant
impact on the Company’s consolidated financial position, results of operations
or cash flows.
In
January 2010, the FASB issued authoritative guidance related to improving
disclosures about fair value measurements. This guidance requires separate
disclosures of the amounts of transfers in and out of Level 1 and Level 2 fair
value measurements and a description of the reason for such transfers. In the
reconciliation for Level 3 fair value measurements using significant
unobservable inputs, information about purchases, sales, issuances and
settlements shall be presented separately. These disclosures will be required
for interim and annual reporting periods effective January 1, 2010, except for
the disclosures related to the purchases, sales, issuances and settlements in
the roll forward activity of Level 3 fair value measurements, which are
effective on January 1, 2011. This guidance will require additional
disclosures but will not impact the Company’s consolidated financial position,
results of operations or cash flows.
Subsequent
Events. In May 2009, the FASB issued authoritative guidance on
subsequent events to incorporate accounting guidance that originated as auditing
standards into the body of authoritative literature issued by the
FASB. This guidance requires the evaluation of subsequent events
through the date the financial statements are issued or are available for issue
and the disclosure of the date through which subsequent events were evaluated
and the basis for that date. This guidance is effective for interim
and annual financial periods ending after June 15, 2009. The Company
adopted the requirements of this guidance for the period ended June 30, 2009 and
the adoption did not have a significant impact on our consolidated financial
position, results of operations or cash flows. On February 25, 2010,
the FASB amended this guidance to remove the requirement to disclose the date
through which an entity has evaluated subsequent events. See Item 8. “Financial
Statements and Supplementary Data, Note 16 – Subsequent
Events.”
Variable Interest Entities.
In June 2009, the FASB issued authoritative guidance related to variable
interest entities which changes how a reporting entity determines when an entity
that is insufficiently capitalized or is not controlled through voting rights
should be consolidated and modifies the approach for determining the primary
beneficiary of a variable interest entity. This guidance will require a
reporting entity to provide additional disclosures about its involvement with
variable interest entities and any significant changes in risk exposure due to
that involvement. The guidance related to variable interest entities will be
effective on January 1, 2010 and will not have an impact on the Company’s
consolidated financial position, results of operations or cash
flows.
Oil and Gas Reporting
Requirements. In December 2008, the SEC issued Release No.
33-8995, “Modernization of Oil and Gas Reporting” (the
“Release”). The disclosure requirements under this Release require
reporting of oil and gas reserves using an average price based upon the prior
twelve-month period rather than year-end prices and the use of new technologies
to determine proved reserves if those technologies have been demonstrated to
result in reliable conclusions about reserves volumes. Companies will
also be allowed, but not required, to disclose probable and possible reserves in
SEC filings. In addition, companies will be required to report the
independence and qualifications of its reserves preparer or auditor and file
reports when a third party is relied upon to prepare reserves estimates or
conduct a reserves audit. The new disclosure requirements become
effective for the Company beginning with our annual report on Form 10-K for the
year ending December 31, 2009. In October 2009, the SEC issued Staff
Accounting Bulletin (“SAB”) No. 113 to bring existing SEC guidance into
conformity with the Release. The principle revisions of the guidance
include changing the price used in determining quantities of oil and gas
reserves, as noted above; eliminating the option to use post-quarter-end prices
to evaluate write-offs of excess capitalized costs under the full cost method of
accounting; removing the exclusion of unconventional methods used in extracting
oil and gas from oil sands or shale as an oil and gas producing activity; and
removing certain questions and interpretative guidance which are no longer
necessary. In January 2010, the FASB issued its guidance on
oil and gas reserve estimation and disclosure, aligning their requirements with
the SEC’s final rule. The Company applied this guidance at December
31, 2009 as a change in accounting principle that is inseparable from a change
in accounting estimate. This methodology was different than that
applied at December 31, 2008 and March 31, 2009, each of which resulted in a
ceiling test write-down. The effect of the adoption at December 31,
2009 was not significant to the Company's financial statements. The adoption of
the new rule will result in future amounts recorded for depreciation, depletion
and amortization and ceiling limitations being different from what would have
been recorded if the new rules would not have been mandated. See Item
8. “Financial Statements and Supplementary Data, Supplemental Oil and Gas
Disclosures.”
|
(3)
|
Accounts
Receivable
|
Accounts
receivable consists of the following:
|
December
31,
|
||||||||
|
2009
|
2008
|
|||||||
|
(In
thousands)
|
||||||||
|
Natural
gas, NGLs and oil revenue sales
|
$ | 29,938 | $ | 37,982 | ||||
|
Joint
interest billings
|
2,328 | 3,422 | ||||||
|
Short-term
receivable for royalty recoupment
|
425 | 481 | ||||||
|
Total
|
32,691 | 41,885 | ||||||
There are
no balances in accounts receivable that are considered to be uncollectible and
an allowance was unnecessary at December 31, 2009 and 2008.
|
(4)
|
Property,
Plant and Equipment
|
The
Company’s total property, plant and equipment consists of the
following:
|
December
31,
|
||||||||
|
2009
|
2008
|
|||||||
|
(In
thousands)
|
||||||||
|
Proved
properties
|
$ | 1,949,515 | $ | 1,813,527 | ||||
|
Unproved/unevaluated
properties
|
42,344 | 50,252 | ||||||
|
Gas
gathering system and compressor stations
|
38,574 | 36,893 | ||||||
|
Other
|
12,417 | 9,439 | ||||||
|
Total
|
2,042,850 | 1,910,111 | ||||||
|
Less:
Accumulated depreciation, depletion, and amortization
|
(1,452,248 | ) | (935,851 | ) | ||||
| $ | 590,602 | $ | 974,260 | |||||
Included
in the Company’s oil and natural gas properties are asset retirement costs of
$21.9 million and $23.2 million at December 31, 2009 and 2008, respectively,
including additions of $1.9 million and $1.7 million for the year ended December
31, 2009 and 2008, respectively.
As
discussed in Note 2, pursuant to full cost accounting rules, the Company must
perform a ceiling test each quarter on its proved oil and gas assets within each
separate cost center. The Company recorded a non-cash, pre-tax
write-down of $379.5 million at March 31, 2009. There were no other
ceiling test write-downs recorded during the year ended December 31,
2009. However, due to the volatility of commodity prices, should oil
and natural gas prices decline in the future, it is possible that an additional
write-down could occur.
The
Company also recorded a non-cash, pre-tax write-down of $205.7 million at
September 30, 2008. Due to continued declines in oil and gas prices
and a downward revision of 8 Bcfe due to year-end commodity prices, at December
31, 2008, capitalized costs of our proved oil and gas properties exceeded our
ceiling, resulting in an additional non-cash, pre-tax write-down of
$238.7 million.
Capitalized
costs excluded from DD&A as of December 31, 2009 and 2008, are as follows by
the year in which such costs were incurred:
|
December
31, 2009
|
||||||||||||||||||||
|
Total
|
2009
|
2008
|
2007
|
Prior
|
||||||||||||||||
|
(in
thousands)
|
||||||||||||||||||||
|
Onshore:
|
||||||||||||||||||||
|
Development
cost
|
$ | 505 | $ | 505 | $ | - | $ | - | $ | - | ||||||||||
|
Exploration
cost
|
8,732 | 8,732 | - | - | - | |||||||||||||||
|
Acquisition
cost of undeveloped acreage
|
31,326 | 14,165 | 14,734 | 2,398 | 29 | |||||||||||||||
|
Capitalized
interest
|
1,781 | 83 | 1,347 | 349 | 2 | |||||||||||||||
| 42,344 | 23,485 | 16,081 | 2,747 | 31 | ||||||||||||||||
|
Offshore:
|
||||||||||||||||||||
|
Development
cost
|
- | - | - | - | - | |||||||||||||||
|
Exploration
cost
|
- | - | - | - | - | |||||||||||||||
|
Acquisition
cost of undeveloped acreage
|
- | - | - | - | - | |||||||||||||||
|
Capitalized
interest
|
- | - | - | - | - | |||||||||||||||
| - | - | - | - | - | ||||||||||||||||
|
Total
capitalized costs excluded from DD&A
|
$ | 42,344 | $ | 23,485 | $ | 16,081 | $ | 2,747 | $ | 31 | ||||||||||
|
December
31, 2008
|
||||||||||||||||||||
|
Total
|
2008
|
2007
|
2006
|
Prior
|
||||||||||||||||
|
(in
thousands)
|
||||||||||||||||||||
|
Onshore:
|
||||||||||||||||||||
|
Development
cost
|
$ | 13,320 | $ | 13,320 | $ | - | $ | - | $ | - | ||||||||||
|
Exploration
cost
|
3,555 | 3,555 | - | - | - | |||||||||||||||
|
Acquisition
cost of undeveloped acreage
|
29,926 | 23,958 | 4,949 | 988 | 31 | |||||||||||||||
|
Capitalized
interest
|
2,552 | 1,978 | 433 | 141 | - | |||||||||||||||
| 49,353 | 42,811 | 5,382 | 1,129 | 31 | ||||||||||||||||
|
Offshore:
|
||||||||||||||||||||
|
Development
cost
|
- | - | - | - | - | |||||||||||||||
|
Exploration
cost
|
- | - | - | - | - | |||||||||||||||
|
Acquisition
cost of undeveloped acreage
|
786 | - | - | 786 | - | |||||||||||||||
|
Capitalized
interest
|
113 | - | - | 113 | - | |||||||||||||||
| 899 | - | - | 899 | - | ||||||||||||||||
|
Total
capitalized costs excluded from DD&A
|
$ | 50,252 | $ | 42,811 | $ | 5,382 | $ | 2,028 | $ | 31 | ||||||||||
It is
anticipated that the acquisition of undeveloped acreage and associated
capitalized interest of $33.1 million and development and exploration costs of
$9.2 million will be included in oil and gas properties subject to amortization
within five years and one year, respectively.
Property
Acquisitions. During the first quarter of 2009, the Company
acquired the remaining 10% working interest in the 1,280-acre position Pinedale
Anticline in the Rockies for $3.8 million and obtained
operatorship.
During
the fourth quarter of 2008, the Company acquired a 90% working interest in a
1,280-acre position in the Pinedale Anticline in the Rockies for $35.0 million
and a 70% working interest in certain properties in the Catarina Field and a 35%
working interest in a significant acreage position in the Eagle Ford shale in
South Texas for $20.0 million.
During
the second quarter of 2008, the Company acquired a 50% working interest position
in approximately 12,000 gross acres in the Rockies for $29.0
million.
During
the second quarter of 2007, the Company acquired properties located in the
Sacramento Basin at a total purchase price of $38.7 million.
Gas Gathering System and Compressor
Stations. In December 2008, we purchased approximately 62 miles of
low pressure gathering from Pacific Gas and Electric for $1.3
million. The gathering system is located in the heart of the
Rio Vista field and gathers much of our low pressure production within the Rio
Vista field. The gas gathering system and compressor stations of
$38.6 million and $36.9 million at December 31, 2009 and 2008, respectively, are
primarily located in California and the Rockies, and are recorded at cost and
depreciated on a straight-line basis over useful lives of 15
years. The accumulated depreciation for the gas gathering system at
December 31, 2009 and 2008 was $7.7 million and $5.3 million,
respectively. The depreciation expense associated with the gas
gathering system and compressor stations for the years ended December 31, 2009,
2008 and 2007 was $2.5 million, $2.2 million, and $1.5 million,
respectively.
Other Property and Equipment.
Other property and equipment at December 31, 2009 and 2008 of $12.4 million and
$9.4 million, respectively, consists primarily of furniture and
fixtures. The accumulated depreciation associated with other assets
at December 31, 2009 and 2008 was $4.3 million and $2.6 million,
respectively. For the years ended December 31, 2009, 2008 and 2007
depreciation expense for other property and equipment was $1.7 million, $1.2
million, and $0.8 million, respectively.
|
(5)
|
Deferred
Loan Fees
|
At
December 31, 2009 and 2008, deferred loan fees were $4.9 million and $1.2
million, respectively. Total amortization expense for deferred loan fees was
$2.1 million, $1.0 million and $1.2 million for the years ended December 31,
2009, 2008 and 2007, respectively.
|
(6)
|
Commodity
Hedging Contracts and Other
Derivatives
|
The
following financial fixed price swap and costless collar transactions were
outstanding with associated notional volumes and average underlying prices that
represent hedged prices of commodities at various market locations at December
31, 2009:
|
Settlement
Period
|
Derivative
Instrument
|
Hedge
Strategy
|
Notional
Daily Volume
MMBtu
|
Total
of Notional Volume
MMBtu
|
Average
Floor/Fixed Prices per
MMBtu
|
Average
Ceiling Prices per MMBtu
|
Natural
Gas Production Hedged (1)
|
Fair
Market Value
Asset/(Liability)
(In
thousands)
|
||||||||||||||||||
|
2010
|
Swap
|
Cash
flow
|
15,000 | 5,475,000 | $ | 7.46 | $ | - | 13 | % | $ | 8,834 | ||||||||||||||
|
2010
|
Costless
Collar
|
Cash
flow
|
15,041 | 5,490,000 | 5.75 | 7.40 | 13 | % | 548 | |||||||||||||||||
|
2011
|
Swap
|
Cash
flow
|
5,000 | 1,825,000 | 5.72 | 5 | % | (408 | ) | |||||||||||||||||
|
2011
|
Costless
Collar
|
Cash
flow
|
25,000 | 9,125,000 | 5.80 | 7.58 | 23 | % | (1,552 | ) | ||||||||||||||||
| 21,915,000 | $ | 7,422 | ||||||||||||||||||||||||
____________________________________
|
|
(1)
|
Estimated
based on anticipated future gas
production.
|
The
Company has hedged the interest rates on $100.0 million of its
outstanding debt through December 31, 2010. As of December 31,
2009, the Company had the following financial interest rate swap positions
outstanding:
|
Settlement
Period
|
Derivative
Instrument
|
Hedge
Strategy
|
Average
Fixed Rate
|
Fair
Market Value
Asset/(Liability)
(In
thousands)
|
||||||
|
January
1 - December 31, 2010
|
Swap
|
Cash
Flow
|
1.24 | % | $ | (635 | ) | |||
The
Company’s current cash flow hedge positions are with counterparties who are also
lenders in the Company’s credit facilities. This eliminates the need
for independent collateral postings with respect to any margin obligation
resulting from a negative change in fair market value of the derivative
contracts in connection with the Company’s hedge related credit
obligations. As of December 31, 2009, the Company made no deposits
for collateral.
The
following table sets forth the results of hedge transaction settlements for the
respective period for the Consolidated Statement of Operations:
|
For
the Year Ended December 31,
|
||||||||
|
2009
|
2008
|
|||||||
|
Natural
Gas
|
||||||||
|
Quantity
settled (MMBtu)
|
20,856,465 | 26,684,616 | ||||||
|
Increase
(decrease) in natural gas sales revenue (In thousands)
|
$ | 76,567 | $ | (18,669 | ) | |||
|
Interest
Rate Swaps
|
||||||||
|
Increase
in interest expense (In thousands)
|
$ | (1,289 | ) | $ | (1,158 | ) | ||
As of
December 31, 2009, the Company expects to reclassify gains of $8.7 million to
earnings from the balance in accumulated other comprehensive income (loss) on
the Consolidated Balance Sheet during the next twelve months.
The
Company is exposed to certain risks relating to its ongoing business
operations. The primary risks managed using derivative instruments
are commodity price risk and interest rate risk. Forward contracts on
various commodities are entered into to manage the price risk associated with
forecasted sales of the Company’s natural gas and oil
production. Interest rate swaps are entered into to manage interest
rate risk associated with the Company’s variable-rate borrowings.
Authoritative
guidance for derivatives requires companies to recognize all derivative
instruments as either assets or liabilities at fair value in the statement of
financial position. In accordance with this guidance, the Company
designates commodity forward contracts as cash flow hedges of forecasted sales
of natural gas and oil production and interest rate swaps as cash flow hedges of
interest rate payments due under variable-rate borrowings.
Additional
Disclosures about Derivative Instruments and Hedging Activities
Cash
Flow Hedges
For
derivative instruments that are designated and qualify as a cash flow hedge, the
effective portion of the gain or loss on the derivative is reported as a
component of other comprehensive income and reclassified into earnings in the
same period or periods during which the hedged transaction affects
earnings. Gains and losses on the derivative representing either
hedge ineffectiveness or hedge components excluded from the assessment of
effectiveness are recognized in current earnings.
As of
December 31, 2009, the Company had outstanding natural gas commodity forward
contracts with a notional volume of 21,915,000 MMBtus that were entered into to
hedge forecasted natural gas sales.
As of
December 31, 2009, the total notional amount of the Company’s
receive-variable/pay-fixed interest rate swaps was $100.0
million. The Company includes the realized gain or loss on the hedged
items (that is, interest on variable-rate borrowings) in the same line item –
Interest expense, net of interest capitalized – as the offsetting gain or loss
on the related interest rate swaps.
Information
on the location and amounts of derivative fair values in the statement of
financial position and derivative gains and losses in the statement of
operations as of December 31, 2009 is as follows:
|
Fair
Values of Derivative Instruments
|
|||||
|
Derivative
Assets (Liabilities)
|
|||||
|
December
31, 2009
|
|||||
|
Balance
Sheet Location
|
Fair
Value
|
||||
|
Derivatives
designated as hedging instruments
|
(in
thousands)
|
||||
|
Interest
rate swap
|
Derivative
Instruments - current assets
|
$ | (399 | ) | |
|
Interest
rate swap
|
Derivative
Instruments - current liabilities
|
(236 | ) | ||
|
Interest
rate swap
|
Derivative
Instruments - non-current liabilities
|
- | |||
|
Interest
rate swap
|
Other
assets - non-current assets
|
- | |||
|
Commodity
contracts
|
Derivative
Instruments - current assets
|
9,382 | |||
|
Commodity
contracts
|
Derivative
Instruments - non-current liabilities
|
(1,960 | ) | ||
|
Total
derivatives designated as hedging instruments
|
$ | 6,787 | |||
|
Total
derivatives not designated as hedging instruments
|
$ | - | |||
|
Total
derivatives
|
$ | 6,787 | |||
|
Amount
of Gain or (Loss) Recognized in OCI on Derivative (Effective
Portion)
|
Location of Gain or (Loss) Reclassified from Accumulated OCI into Income (Effective Portion) |
Amount
of Gain or (Loss) Reclassified from Accumulated OCI into Income (Effective
Portion)
|
Location of Gain or (Loss) Recognized in Income on Derivative (Ineffective Portion and Amount Excluded from Effectiveness Testing) |
Amount
of Gain or (Loss) Recognized in Income on Derivative (Ineffective Portion
and Amount Excluded from Effectiveness Testing) (1)
|
||||||||||
|
Derivatives
in Cash Flow Hedging Relationships
|
Twelve
Months Ended December 31, 2009
|
Twelve
Months Ended December 31, 2009
|
Twelve
Months Ended December 31, 2009
|
|||||||||||
|
(in
thousands)
|
(in
thousands)
|
(in
thousands)
|
||||||||||||
|
Interest
rate swap
|
$ | (1,923 | ) |
Interest
expense, net of interest capitalized
|
$ | (767 | ) |
Interest
expense, net of interest capitalized
|
$ | (522 | ) | |||
|
Commodity
contracts
|
45,616 |
Natural
gas sales
|
76,567 |
Natural
gas sales
|
- | |||||||||
|
Total
|
$ | 43,693 |
Total
|
$ | 75,800 |
Total
|
$ | (522 | ) | |||||
____________________________________
|
|
(1)
|
The
amount of gain or (loss) recognized in income represents $0.5 million
related to the ineffective portion of the hedging relationships. Nothing
was excluded from the assessment of hedge
effectiveness.
|
On April
9, 2009, the Company entered into an amended and restated revolving credit
agreement replacing the previous revolving credit agreement. At the
time of the amended and restated revolving credit agreement, the Company had two
outstanding interest rate swaps which established a fixed interest rate for a
portion of the previous outstanding revolver that were designated as cash flow
hedges and which became ineffective. During the second quarter of
2009, the Company ceased cash flow hedge accounting for these interest rate
swaps which resulted in approximately $0.5 million in interest
expense. Because these swaps matured during the quarter ended June
30, 2009, the Company did not recognize any unrealized mark to market gains or
losses within the Consolidated Statement of Operations related to the swaps
during the period. For the twelve months ended December 31, 2009,
there were no gains or losses recognized in income representing hedge components
excluded from the assessment of effectiveness.
|
(7)
|
Fair
Value Measurements
|
The
Company adopted the authoritative guidance for fair value measurements effective
January 1, 2008 for financial assets and liabilities and effective January 1,
2009 for non-financial assets and liabilities. The Company’s
financial assets and liabilities are measured at fair value on a recurring
basis. The Company discloses its recognized non-financial assets and
liabilities, such as asset retirement obligations and other property and
equipment, at fair value on a non-recurring basis. For non-financial
assets and liabilities, the Company is required to disclose information that
enables users of its financial statements to assess the inputs used to develop
these measurements. As none of the Company’s non-financial assets and
liabilities are impaired during the period-ended December 31, 2009, and no other
fair value measurements are required to be recognized on a non-recurring basis,
no additional disclosures are provided at December 31, 2009.
As
defined in the guidance, fair value is the amount that would be received to sell
an asset or paid to transfer a liability in an orderly transaction between
market participants at the measurement date (“exit price”). To
estimate fair value, the Company utilizes market data or assumptions that market
participants would use in pricing the asset or liability, including assumptions
about risk and the risks inherent in the inputs to the valuation
technique. These inputs can be readily observable, market
corroborated or generally unobservable. The guidance establishes a
fair value hierarchy that prioritizes the inputs to valuation techniques used to
measure fair value. The hierarchy gives the highest priority to
unadjusted quoted market prices in active markets for identical assets or
liabilities (“Level 1”) and the lowest priority to unobservable inputs (“Level
3”). The three levels of the fair value hierarchy are as
follows:
|
|
–
|
Level
1 inputs are quoted prices (unadjusted) in active markets for identical
assets or liabilities.
|
|
|
–
|
Level
2 inputs are quoted prices for similar assets and liabilities in active
markets or inputs that are observable for the asset or liability, either
directly or indirectly through market corroboration, for substantially the
full term of the financial
instrument.
|
|
|
–
|
Level
3 inputs are measured based on prices or valuation models that require
inputs that are both significant to the fair value measurement and less
observable from objective sources.
|
Level 3
instruments include money market funds, natural gas swaps, natural gas zero
cost collars and interest rate swaps. The Company’s money market funds
represent cash equivalents whose investments are limited to United States
Government Securities, securities backed by the United States Government, or
securities of United States Government agencies. The fair value
represents cash held by the fund manager as of December 31, 2009 and
2008. The Company identified the money market funds as Level 3
instruments due to the fact that quoted prices for the underlying investments
cannot be obtained and there is not an active market for the underlying
investments. The Company utilizes counterparty and third party broker
quotes to determine the valuation of its derivative
instruments. Fair values derived from counterparties and brokers are
further verified using relevant NYMEX futures contracts and exchange traded
contracts for each derivative settlement location.
The
following table sets forth by level within the fair value hierarchy the
Company’s financial assets and liabilities that were accounted for at fair value
on a recurring basis as of December 31, 2009 and 2008. As required, financial
assets and liabilities are classified in their entirety based on the lowest
level of input that is significant to the fair value measurement. The Company’s
assessment of the significance of a particular input to the fair value
measurement requires judgment and may affect the valuation of fair value assets
and liabilities and their placement within the fair value hierarchy
levels.
|
Fair
value as of December 31, 2009
|
||||||||||||||||
|
Level
1
|
Level
2
|
Level
3
|
Total
|
|||||||||||||
|
(In
thousands)
|
||||||||||||||||
|
Assets
(liabilities):
|
||||||||||||||||
|
Money
market funds
|
$ | - | $ | - | $ | 2,035 | $ | 2,035 | ||||||||
|
Commodity
derivative contracts
|
- | - | 7,422 | 7,422 | ||||||||||||
|
Interest
rate swap contracts
|
- | - | (635 | ) | (635 | ) | ||||||||||
|
Total
|
$ | - | $ | - | $ | 8,822 | $ | 8,822 | ||||||||
|
Fair
value as of December 31, 2008
|
||||||||||||||||
|
Level
1
|
Level
2
|
Level
3
|
Total
|
|||||||||||||
|
(In
thousands)
|
||||||||||||||||
|
Assets
(liabilities):
|
||||||||||||||||
|
Money
market funds
|
$ | - | $ | - | $ | 5,025 | $ | 5,025 | ||||||||
|
Commodity
derivative contracts
|
- | - | 39,357 | 39,357 | ||||||||||||
|
Interest
rate swap contracts
|
- | - | (985 | ) | (985 | ) | ||||||||||
|
Total
|
$ | - | $ | - | $ | 43,397 | $ | 43,397 | ||||||||
The
determination of the fair values above incorporates various
factors. These factors include the credit standing of the
counterparties involved, the impact of credit enhancements and the impact of the
Company’s nonperformance risk on its liabilities. The Company considered credit
adjustments for the counterparties using current credit default swap values and
default probabilities for each counterparty in determining fair value and
recorded a downward adjustment to the fair value of its derivative assets in the
amount of $0.01 million at December 31, 2009.
The table
below presents a reconciliation of the assets and liabilities classified as
Level 3 in the fair value hierarchy during the years ended December 31, 2009 and
2008. Level 3 instruments presented in the table consist of net derivatives
that, in management’s judgment, reflect the assumptions a marketplace
participant would have used at December 31, 2009 and 2008.
|
For
the year ended December 31, 2009
|
||||||||||||
|
Derivatives
Asset
(Liability)
|
Money
Market Funds
Asset
(Liability)
|
Total
|
||||||||||
|
(in
thousands)
|
||||||||||||
|
Balance
at January 1, 2009
|
$ | 38,372 | $ | 5,025 | $ | 43,397 | ||||||
|
Total
(gains) losses (realized or unrealized)
|
||||||||||||
|
included
in earnings
|
- | 10 | 10 | |||||||||
|
included
in other comprehensive income
|
43,693 | - | 43,693 | |||||||||
|
Purchases,
issuances and settlements
|
(75,278 | ) | (3,000 | ) | (78,278 | ) | ||||||
|
Transfers
in and out of level 3
|
- | - | - | |||||||||
|
Balance
at December 31, 2009
|
$ | 6,787 | $ | 2,035 | $ | 8,822 | ||||||
|
The
amount of total gains or losses for the period included in earnings
attributable to the change in unrealized gains or losses relating to
assets still held at December 31, 2009
|
$ | - | $ | - | $ | - | ||||||
|
For
the year ended December 31, 2008
|
||||||||||||
|
Derivatives
Asset
(Liability)
|
Money
Market Funds
Asset
(Liability)
|
Total
|
||||||||||
|
(in
thousands)
|
||||||||||||
|
Balance
at January 1, 2008
|
$ | (10,792 | ) | $ | - | $ | (10,792 | ) | ||||
|
Total
(gains) losses (realized or unrealized)
|
||||||||||||
|
included
in earnings
|
- | 25 | 25 | |||||||||
|
included
in other comprehensive income
|
29,337 | - | 29,337 | |||||||||
|
Purchases,
issuances and settlements
|
19,827 | 5,000 | 24,827 | |||||||||
|
Transfers
in and out of level 3
|
- | - | - | |||||||||
|
Balance
at December 31, 2008
|
$ | 38,372 | $ | 5,025 | $ | 43,397 | ||||||
|
The
amount of total gains or losses for the period included in earnings
attributable to the change in unrealized gains or losses relating to
assets still held at December 31, 2008
|
$ | - | $ | - | $ | - | ||||||
|
(8)
|
Accrued
Liabilities
|
The
Company’s accrued liabilities consist of the following:
|
December
31,
|
||||||||
|
2009
|
2008
|
|||||||
|
(In
thousands)
|
||||||||
|
Accrued
capital costs
|
$ | 18,200 | $ | 26,555 | ||||
|
Accrued
payroll and employee incentive expense
|
7,137 | 5,721 | ||||||
|
Accrued
lease operating expense
|
8,011 | 12,196 | ||||||
|
Asset
retirement obligation
|
956 | 1,359 | ||||||
|
Other
|
2,803 | 2,993 | ||||||
|
Total
|
$ | 37,107 | $ | 48,824 | ||||
|
(9)
|
Asset
Retirement Obligation
|
Activity
related to the Company’s asset retirement obligation (“ARO”) is as
follows:
|
For
the Year Ended December 31,
|
||||||||
|
2009
|
2008
|
|||||||
|
(In
thousands)
|
||||||||
|
ARO
at the beginning of the period
|
$ | 27,944 | $ | 22,670 | ||||
|
Revision
of previous estimate
|
(1,886 | ) | 1,785 | |||||
|
Liabilities
incurred during period
|
1,855 | 1,727 | ||||||
|
Liabilities
settled during period
|
(1,328 | ) | (363 | ) | ||||
|
Accretion
expense
|
2,335 | 2,125 | ||||||
|
ARO
at the end of the period
|
$ | 28,920 | $ | 27,944 | ||||
Of the
total ARO, the current portion is approximately $1.0 million and $1.4 million at
December 31, 2009 and 2008, respectively, and is included in Accrued liabilities
on the Consolidated Balance Sheet. The long-term portion of ARO is
approximately $27.9 million and $26.5 million at December 31, 2009 and 2008,
respectively, and is included in Other long-term liabilities on the Consolidated
Balance Sheet.
|
(10)
|
Long-Term
Debt
|
Long-term
debt consists of the following:
|
December
31,
|
||||||||
|
2009
|
2008
|
|||||||
|
(In
thousands)
|
||||||||
|
Amended
and Restated Senior Revolving Credit Agreement
|
$ | 190,000 | $ | 225,000 | ||||
|
Amended
and Restated Second Lien Term Loan
|
100,000 | 75,000 | ||||||
| 290,000 | 300,000 | |||||||
|
Less:
|
||||||||
|
Original
issue discount on amended and restated second lien term
loan
|
(1,258 | ) | - | |||||
|
Current
portion of long-term debt
|
- | - | ||||||
| $ | 288,742 | $ | 300,000 | |||||
Senior Secured Revolving Line of
Credit. On April 9, 2009, the Company entered into the
Restated Revolver providing a senior secured revolving line of credit in the
amount of up to $600.0 million, replacing the prior revolving credit agreement,
and extending its term until July 1, 2012. Availability under the Restated
Revolver is restricted to the borrowing base, which is subject to review and
adjustment on a semi-annual basis and other interim adjustments, including
adjustments based on the Company’s hedging arrangements. The borrowing base
under the Restated Revolver was set at $375.0 million as of September 30, 2009.
The semi-annual borrowing base review was completed during October 2009, and the
borrowing base under the Restated Revolver was reduced from $375.0 million to
$350.0 million. Amounts outstanding under the Restated Revolver bear interest,
as amended, at specified margins over LIBOR of 2.25% to
3.00%. Borrowings under the Restated Revolver are
collateralized by perfected first priority liens and security interests on
substantially all of the Company’s assets, including a mortgage lien on oil and
natural gas properties having at least 80% of the pre-tax SEC PV-10 reserve
value, a guaranty by all of the Company’s domestic subsidiaries, and a pledge of
100% of the membership interests of domestic subsidiaries. These collateralized
amounts under the mortgages are subject to semi-annual reviews based on updated
reserve information. The Company is subject to the financial covenants of a
minimum current ratio of not less than 1.0 to 1.0 as of the end of each fiscal
quarter and a maximum leverage ratio of not greater than 3.5 to 1.0, calculated
at the end of each fiscal quarter for the four fiscal quarters then ended,
measured quarterly. At December 31, 2009, the Company’s current ratio
was 4.3 and the leverage ratio was 1.6. In addition, the Company is subject to
covenants, including limiting dividends and other restricted payments,
transactions with affiliates, incurrence of debt, changes of control, asset
sales, and liens on properties. The Company was in compliance with
all covenants at December 31, 2009. On October 22, 2009, the Company
entered into the First Amendment to the Restated Revolver that deletes the
“Reference Bank Cost of Funds Rate” option in the definition of Alternate Base
Rate, allows the Company to make investments in US government securities, which
mature in 15 months rather than one year, provides for certain other
modifications to permitted investments, and provides for the release of the
Lenders’ lien on a certain deposit account. The Company paid a
facility fee on the total commitment of $4.6 million. As of December 31, 2009,
the Company had $190.0 million outstanding with $160.0 million available
for borrowing under the revolving line of credit. All amounts drawn
under the Restated Revolver are due and payable on July 1, 2012. As
of February 26, 2010, the Company had $190.0 million outstanding with $160.0
million available for borrowing under the revolving line of
credit.
Second Lien Term Loan.
On April 9, 2009, the Company also entered into the Restated
Term Loan and extended its term until October 2, 2012. Borrowings under the
Restated Term Loan were initially set at $75.0 million and bear interest at
LIBOR plus 8.5% with a LIBOR floor of 3.5%. In accordance with authoritative
guidance for derivative instruments and hedging activities, the Company
evaluated the LIBOR floor as an embedded derivative and concluded that because
the terms are clearly and closely related to the debt instrument, it does not
represent an embedded derivative that must be accounted for separately. The
Restated Term Loan had an option to increase fixed and floating rate borrowings
by up to $25.0 million to $100.0 million prior to May 9, 2009. The Company
exercised this option on April 21, 2009, and the increased borrowings consisted
of $5.0 million of floating rate borrowings and $20.0 million of fixed rate
borrowings at 13.75%. The loan is collateralized by second priority liens on
substantially all of the Company’s assets. The Company is subject to the
financial covenants of a minimum asset coverage ratio of not less than 1.5 to
1.0 and a maximum leverage ratio of not more than 4.0 to 1.0, calculated at the
end of each fiscal quarter for the four fiscal quarters then ended, measured
quarterly. At December 31, 2009, the Company’s asset coverage ratio
was 2.7 and the leverage ratio was 1.6. In addition, the Company is subject to
covenants, including limiting dividends and other restricted payments,
transactions with affiliates, incurrence of debt, changes of control, asset
sales, and liens on properties. The Company was in compliance with
all covenants at December 31, 2009. On October 22, 2009, the Company
also entered into the First Amendment to the Restated Term Loan that deletes the
“Reference Bank Cost of Funds Rate” option in the definition of Alternate Base
Rate, allows the Company to make investments in US government securities, which
mature in 15 months rather than one year, provides for certain other
modifications to permitted investments, and provides for the release of the
Lenders’ lien on a certain deposit account. The Company paid an original issue
discount of $1.6 million and a facility fee of $0.9 million on the total
commitment. As of December 31, 2009, the Company had $80.0 million of
variable rate borrowings and $20.0 million of fixed rate borrowings outstanding
under the Restated Term Loan. All amounts drawn under the Restated
Term Loan are due and payable on October 2, 2012. The Company has the
right to prepay the Restated Term Loan at any time on or after the first
anniversary of the effective date (April 10, 2010), in whole or in part, from
April 10, 2010 to April 10, 2011 with a premium equal to 2% of such amount
prepaid or subsequent to April 10, 2011 without premium or penalty provided that
each prepayment is in an amount that is an integral multiple of $1.0 million and
not less than $1.0 million, or if such amount is less than $1.0 million, the
outstanding principal amount. The Company may not prepay the Restated
Term Loan prior to April 10, 2010. There were no
additional borrowings under the Restated Term Loan subsequent to December 31,
2009 through the date of this Annual Report on Form 10-K.
Aggregate
maturities of long-term debt at December 31, 2009 due in the next five
years are $290.0 million due in 2012. At December 31, 2009, the
Company’s weighted average borrowing rate was 6.24%.
|
(11)
|
Commitments
and Contingencies
|
The
Company is party to various oil and natural gas litigation matters arising out
of the normal course of business. The ultimate outcome of each of these matters
cannot be absolutely determined, and the liability the Company may ultimately
incur with respect to any one of these matters in the event of a negative
outcome may be in excess of amounts currently accrued for with respect to such
matters. Management does not believe any such matters will have a material
adverse effect on the Company’s financial position, results of operations or
cash flows.
Lease
Obligations and Other Commitments
The
Company has operating leases for office space and other property and equipment.
The Company incurred rental expense of $4.3 million, $3.3 million and
$2.6 million for the years ended December 31, 2009, 2008 and 2007,
respectively.
Future
minimum annual rental commitments under non-cancelable leases at
December 31, 2009 are as follows (In thousands):
|
2010
|
$ | 3,025 | ||
|
2011
|
3,103 | |||
|
2012
|
3,101 | |||
|
2013
|
3,130 | |||
|
2014
|
513 | |||
|
Thereafter
|
- | |||
| $ | 12,872 |
The
Company also has drilling rig commitments of $3.5 million for 2010.
|
(12)
|
Stock-Based
Compensation
|
Stock-based
compensation expense recorded for all share-based payment arrangements for the
years ended December 31, 2009, 2008 and 2007 was $7.5 million, $7.2 million and
$6.8 million, respectively, with an associated tax benefit of $2.7 million,
$2.9 million and $2.5 million, respectively. During 2009, the Company
capitalized $0.4 million of stock-based compensation expense. The
remaining unrecognized compensation expense associated with total unvested
awards as of December 31, 2009 was approximately $7.0 million.
2005
Long-Term Incentive Plan
In July
2005, the Board of Directors adopted the Rosetta 2005 Long-Term Incentive Plan
(the “Plan”) whereby stock is granted to employees, officers and directors of
the Company. The Plan allows for the grant of stock options, stock awards,
restricted stock, restricted stock units, stock appreciation rights, performance
awards and other incentive awards. Employees, non-employee directors and other
service providers of the Company and its affiliates who, in the opinion of the
Compensation Committee or another Committee of the Board of Directors (the
“Committee”), are in a position to make a significant contribution to the
success of the Company and the Company’s affiliates are eligible to participate
in the Plan. The Plan provides for administration by the Committee, which
determines the type and size of award and sets the terms, conditions,
restrictions and limitations applicable to the award within the confines of the
Plan’s terms. The maximum number of shares available for grant under the Plan
was increased from 3,000,000 shares to 4,950,000 shares by vote of the
shareholders in 2008. The shares available for grant include these
4,950,000 shares plus any shares of common stock that become available under the
Plan for any reason other than exercise, such as shares traded for the related
tax liabilities of employees. The maximum number of shares of common stock
available for grant of awards under the Plan to any one participant is
(i) 300,000 shares during any fiscal year in which the participant begins
work for Rosetta and (ii) 200,000 shares during each fiscal year
thereafter.
Stock
Options
The
Company has granted stock options under its 2005 Long-Term Incentive Plan (the
“Plan”). Options generally expire ten years from the date of
grant. The exercise price of the options cannot be less than the fair
market value per share of the Company’s common stock on the grant
date. The majority of options generally vest over a three year
period.
The
weighted average fair value at date of grant for options granted during the
years ended December 31, 2009, 2008 and 2007 was $3.42 per share, $9.19 per
share, and $9.51 per share, respectively. The fair value of options
granted is estimated on the date of grant using the Black-Scholes option-pricing
model with the following assumptions:
|
Year
Ended December 31,
|
||||||||||||
|
2009
|
2008
|
2007
|
||||||||||
|
Expected
option term (years)
|
6.5 | 6.5 | 6.5 | |||||||||
|
Expected
volatility
|
42.45% - 56.95 | % | 42.45 | % | 42.45 | % | ||||||
|
Expected
dividend rate
|
0.00 | % | 0.00 | % | 0.00 | % | ||||||
|
Risk
free interest rate
|
2.42% - 3.19 | % | 3.48% - 3.84 | % | 4.36% - 5.00 | % | ||||||
The
Company has assumed an annual forfeiture rate of 13% for the options granted in
2009 based on the Company’s history for this type of award to various employee
groups, compared to an annual forfeiture rate of 11% for options granted in
2008. Compensation expense is recognized ratably over the requisite
service period.
The
following table summarizes information related to outstanding and exercisable
options held by the Company’s employees and directors at December 31,
2009:
|
Shares
|
Weighted
Average Exercise Price
Per
Share
|
Weighted
Average Remaining Contractual Term
(In
years)
|
Aggregate
Intrinsic Value
(In
thousands)
|
|||||||||||||
|
Outstanding
at December 31, 2007
|
972,600 | $ | 17.45 | |||||||||||||
|
Granted
|
209,375 | 19.13 | ||||||||||||||
|
Exercised
|
(214,119 | ) | 16.89 | |||||||||||||
|
Forfeited
|
(26,100 | ) | 17.57 | |||||||||||||
|
Outstanding
at December 31, 2008
|
941,756 | $ | 17.94 | |||||||||||||
|
Granted
|
384,514 | 7.56 | ||||||||||||||
|
Exercised
|
(14,125 | ) | 16.16 | |||||||||||||
|
Forfeited
|
(64,176 | ) | 17.16 | |||||||||||||
|
Outstanding
at December 31, 2009
|
1,247,969 | $ | 14.80 | |||||||||||||
|
Options
vested and exercisable at December 31, 2009
|
718,548 | $ | 17.94 | 5.25 | $ | 1,797 | ||||||||||
Stock-based
compensation expense recorded for stock option awards for the years ended
December 31, 2009, 2008 and 2007 was $1.1 million, $1.7 million and $3.9
million, respectively. Unrecognized expense as of December 31, 2009
for all outstanding stock options is $1.0 million and will be recognized over a
weighted average period of 1.64 years.
The total
intrinsic value of options exercised during the years ended December 31, 2009,
2008 and 2007 is $0.1 million, $1.4 million and $0.2 million,
respectively.
Restricted
Stock
The
Company has granted restricted stock under its 2005 Long-Term Incentive
Plan. The majority of restricted stock vests over a three-year
period. The fair value of restricted stock grants is based on the
value of the Company’s common stock on the date of
grant. Compensation expense is recognized ratably over the requisite
service period. The Company also assumes an annual forfeiture rate of
13% for these awards based on the Company’s history for this type of award to
various employee groups.
The
following table summarizes information related to restricted stock held by the
Company’s employees and directors at December 31, 2009:
|
Shares
|
Weighted
Average Grant Date Fair Value
|
|||||||
|
Non-vested
shares outstanding at December 31, 2007
|
455,425 | $ | 18.50 | |||||
|
Granted
|
607,079 | 20.06 | ||||||
|
Vested
|
(274,714 | ) | 18.31 | |||||
|
Forfeited
|
(70,351 | ) | 19.54 | |||||
|
Non-vested
shares outstanding at December 31, 2008
|
717,439 | $ | 19.78 | |||||
|
Granted
|
670,673 | 7.25 | ||||||
|
Vested
|
(209,103 | ) | 19.34 | |||||
|
Forfeited
|
(54,351 | ) | 16.48 | |||||
|
Non-vested
shares outstanding at December 31, 2009
|
1,124,658 | $ | 12.55 | |||||
The
non-vested restricted stock outstanding at December 31, 2009 generally vests at
a rate of 25% on the first anniversary of the date of grant, 25% on the second
anniversary and 50% on the third anniversary. The fair value of
awards vested for the year ended December 31, 2009 was $1.8
million.
Stock-based
compensation expense recorded for restricted stock awards for the years ended
December 31, 2009, 2008 and 2007 was $5.1 million, $5.5 million and $2.9
million, respectively. Unrecognized expense as of December 31, 2009
for all outstanding restricted stock awards is $6.0 million and will be
recognized over a weighted average period of 1.70 years.
Performance
Share Units
Pursuant
to the approved Amended and Restated 2005 Long-Term Incentive Plan, the
Company’s Compensation Committee agreed to allocate a portion of the 2009
long-term incentive grants to executives as PSUs. The PSUs are
payable, at the Company’s option, either in shares of common stock or as a cash
payment equivalent to the fair market value of a share of common stock at
settlement based on the achievement of certain performance metrics or market
conditions at the end of a three-year performance period. The
Company’s current intent is to settle these awards in
cash. Consequently, the PSUs are accounted for as
liability-classified awards and are included as a component of other long-term
liabilities. At the end of the three-year performance period, the
number of shares vested can range from 0% to 200% of the targeted amount as
determined by the Compensation Committee of the Board of
Directors. The PSUs have no voting rights. PSUs may be
vested solely at the discretion of the Board in the event of a participant’s
involuntary termination of employment for reasons other than cause or
termination for good reason but will be forfeited in the event of the
participant’s voluntary termination or involuntary termination for
cause. Any PSUs not vested by the Board at the end of a performance
period will expire.
As
discussed in Note 2, compensation expense associated with PSUs is measured at
the end of each reporting period through the settlement date using the
quarter-end closing common stock prices for awards that are solely based on
performance conditions or a Monte Carlo model for awards that contain market
conditions to reflect the current fair value. Compensation expense is
recognized ratably over the performance period based on the Company’s estimated
achievement of the established metrics. Compensation expense for
awards with performance conditions will only be recognized for those awards for
which it is probable that the performance conditions will be achieved and which
are expected to vest. The compensation expense will be estimated
based upon an assessment of the probability that the performance metrics will be
achieved, current and historical forfeitures, and the Board’s anticipated
vesting percentage. Compensation expense for awards with market
conditions is measured at the end of each reporting period based on the fair
value derived from the Monte Carlo model.
At
December 31, 2009, one-third of the PSUs granted to executive employees include
various market-based components requiring complex modeling to value the grant
and these grants vest at the end of a three-year performance period based on the
comparative performance of the Company’s change in cash flow multiple (share
price divided by trailing twelve months cash flow per share) against the change
in cash flow multiple of the Index. The Company uses a Monte Carlo model
which incorporates a risk-neutral valuation approach to value these
awards. This model samples paths of the Company’s and the Index’s stock
price and calculates the resulting change in cash flow multiple at the end of
the forecasted performance period. This model iterates these
randomly forecasted results until the distribution of results converge on a mean
or estimated fair value. The five primary inputs for the Monte Carlo model
are the risk-free rate, independent analyst cash flow per share estimates for
the Company and the Index, volatility of the equities of the Company and the
Index, expected dividends, where applicable, and various historical market data.
The risk-free rate was generated from Bloomberg for United States Treasuries
with a two-year tenor. Volatility was set equal to the annualized daily
volatility measured over a historic 400-day period ending on the reporting date
for the Company and the Index. No forfeiture rate is assumed
for this type of award. Expense related to these awards can be
volatile based on the Company’s comparative performance at the end of each
quarter.
The
following assumptions were used as of December 31, 2009 for the Monte Carlo
model to value the expense and liability components of the awards that contain
market conditions:
|
December
31, 2009
|
||||
|
Expected
term of award (years)
|
3 | |||
|
Risk-free
interest rate
|
1.28 | % | ||
|
Rosetta
volatility
|
79.43 | % | ||
|
Index
volatility
|
79.40 | % | ||
|
Rosetta/Index
correlation
|
82 | % | ||
The
following table summarizes information related to PSUs held by the Company’s
officers at December 31, 2009:
|
Units
|
||||
|
Unvested
PSUs at December 31, 2008
|
- | |||
|
Granted
|
355,848 | |||
|
Vested
|
- | |||
|
Forfeited
|
(10,318 | ) | ||
|
Unvested
PSUs at December 31, 2009
|
345,530 | |||
The fair
value per unit at December 31, 2009 was $19.92 for awards with performance
conditions and $19.70 for awards with market conditions. As of
December 31, 2009, the Company recognized $1.3 million of compensation expense
and long-term liability associated with the PSUs. At the current fair
value and assuming that the Board elects 100% pay-out for the PSUs for all
metrics, total compensation expense related to the PSUs to be recognized ratably
over the 3-year service period would be $6.9 million at December 31,
2009. The total compensation expense will be measured and adjusted
quarterly until settlement based on the quarter-end closing common stock prices
and the Monte Carlo model valuations.
|
(13)
|
Income
Taxes
|
The
Company’s income tax expense (benefit) consists of the following:
|
Year
Ended December 31,
|
||||||||||||
|
2009
|
2008
|
2007
|
||||||||||
|
(In
thousands)
|
||||||||||||
|
Current:
|
||||||||||||
|
Federal
|
$ | (1,611 | ) | $ | 2,304 | $ | - | |||||
|
State
|
416 | 1,388 | 115 | |||||||||
| (1,195 | ) | 3,692 | 115 | |||||||||
|
Deferred:
|
||||||||||||
|
Federal
|
(119,111 | ) | (107,568 | ) | 31,979 | |||||||
|
State
|
(5,521 | ) | (8,951 | ) | 1,938 | |||||||
| (124,632 | ) | (116,519 | ) | 33,917 | ||||||||
|
Total
income tax expense (benefit) (1)
|
$ | (125,827 | ) | $ | (112,827 | ) | $ | 34,032 | ||||
____________________________________
|
|
(1)
|
Interest
and penalties are classified as a component of tax expense in the
Consolidated Statement of
Operations.
|
The
differences between income taxes computed using the statutory federal income tax
rate and that shown in the statement of operations are summarized as
follows:
|
Year
Ended December 31,
|
||||||||||||||||||||||||
|
2009
|
2008
|
2007
|
||||||||||||||||||||||
|
(In
thousands)
|
(%)
|
(In
thousands)
|
(%)
|
(In
thousands)
|
(%)
|
|||||||||||||||||||
|
US
Statutory Rate
|
$ | (120,751 | ) | 35.0 | % | $ | (105,327 | ) | 35.0 | % | $ | 31,933 | 35.0 | % | ||||||||||
|
Income/franchise
tax, net of federal benefit
|
(5,545 | ) | 1.6 | % | (7,562 | ) | 2.5 | % | 2,053 | 2.3 | % | |||||||||||||
|
Permanent
differences and other
|
469 | (0.1 | )% | 62 | 0.0 | % | 46 | 0.0 | % | |||||||||||||||
|
Total
tax expense (benefit)
|
$ | (125,827 | ) | 36.5 | % | $ | (112,827 | ) | 37.5 | % | $ | 34,032 | 37.3 | % | ||||||||||
The
effective tax rate in all periods is the result of the earnings in various
domestic tax jurisdictions that apply a broad range of income tax rates. The
provision for income taxes differs from the tax computed at the federal
statutory income tax rate due primarily to state taxes. Future effective tax
rates could be adversely affected if unfavorable changes in tax laws and
regulations occur, or if the Company experiences future adverse determinations
by taxing authorities.
The
components of deferred taxes are as follows:
|
December
31,
|
||||||||
|
2009
|
2008
|
|||||||
|
(In
thousands)
|
||||||||
|
Deferred
tax assets
|
||||||||
|
Oil
and gas properties basis differences
|
$ | 130,562 | $ | 39,089 | ||||
|
Alternative
Minimum Tax credit
|
693 | 2,443 | ||||||
|
Accrued
liabilities not currently deductible
|
6,501 | 2,603 | ||||||
|
Hedge
activity
|
730 | - | ||||||
|
Net
operating loss carryforward
|
31,429 | 621 | ||||||
|
Other
|
(183 | ) | 1,158 | |||||
|
Total
deferred tax assets
|
169,732 | 45,914 | ||||||
|
Hedge
activity
|
(3,258 | ) | (14,294 | ) | ||||
|
Other
|
- | (1,543 | ) | |||||
|
Total
gross deferred tax liabilities
|
(3,258 | ) | (15,837 | ) | ||||
|
Net
deferred tax assets
|
$ | 166,474 | $ | 30,077 | ||||
The
Company had a deferred tax asset related to federal and state net operating loss
carryforwards of approximately $31.4 million and $9.7 million at December 31,
2009 and 2008, respectively. The federal net operating loss
carryforward will begin to expire in 2025. Additionally, the Company
had a deferred tax asset related to oil and gas properties basis of $130.8
million and $39.1 million at December 31, 2009 and 2008,
respectively. Realization of the deferred tax assets is dependent, in
part, on generating sufficient taxable income prior to expiration of the loss
carryforwards. The amount of the deferred tax asset considered realizable,
however, could be reduced in the near term if estimates of future taxable income
during the carryforward period are reduced. There is no valuation allowance
recorded on deferred tax assets as the Company believes it is more likely than
not that the asset will be utilized.
As of
December 31, 2009, the Company is not aware of any uncertain tax positions
requiring adjustments to its tax liability. If applicable, the
Company will record to the income tax provision any interest and penalties
related to unrecognized tax positions.
The
Company files income tax returns in the U.S. and in various state
jurisdictions. With few exceptions, the Company is subject to US
federal, state and local income tax examinations by tax authorities for tax
periods 2005 and forward.
Estimated
interest and penalties related to potential underpayment on any unrecognized tax
benefits are classified as a component of tax expense in the consolidated
statement of operations. The Company has not recorded any interest or
penalties associated with unrecognized tax benefits.
|
(14)
|
Earnings
Per Share
|
Basic
earnings per share (“EPS”) is computed by dividing income available to common
stockholders by the weighted average number of shares outstanding for the
period. Diluted EPS reflects the potential dilution that could occur
if contracts to issue common stock and stock options were exercised at the end
of the period.
The
following is a calculation of basic and diluted weighted average shares
outstanding:
|
Year
Ended December 31,
|
||||||||||||
|
2009
|
2008
|
2007
|
||||||||||
|
(In
thousands)
|
||||||||||||
|
Basic
weighted average number of shares outstanding
|
50,979 | 50,693 | 50,379 | |||||||||
|
Dilution
effect of stock option and awards at the end of the period
(1)
|
- | - | 210 | |||||||||
|
Diluted
weighted average number of shares outstanding
|
50,979 | 50,693 | 50,589 | |||||||||
|
Anti-dilutive
stock options and awards
|
1,364 | 592 | 385 | |||||||||
___________________________________
|
|
(1)
|
Because
the Company recognized a net loss for the years ended December 31, 2009
and 2008, no unvested stock awards and options were included in computing
earnings per share because the effect was anti-dilutive. In
computing earnings per share, no adjustments were made to reported net
income (loss).
|
|
(15)
|
Operating
Segments
|
The
Company has one reportable segment, oil and natural gas exploration and
production, as determined in accordance with authoritative guidance regarding
disclosure about segments of an enterprise and related
information. Also, as all of the Company’s operations are located in
the U.S., all of the Company’s costs are included in one cost
pool. See below for information by geographic location.
Geographic
Area Information
The
Company owns oil and natural gas interests in six main geographic areas, all
within the United States or its territorial waters. Geographic revenue and
property, plant and equipment information below are based on physical location
of the assets at the end of each period:
|
Year
Ended December 31,
|
||||||||||||
|
2009
(1)
|
2008
(1)
|
2007
(1)
|
||||||||||
|
Natural
gas, oil and NGL Revenue
|
(In
thousands)
|
|||||||||||
|
California
|
$ | 65,295 | $ | 141,569 | $ | 110,607 | ||||||
|
Rockies
|
21,999 | 29,491 | 10,676 | |||||||||
|
South
Texas
|
90,043 | 204,791 | 143,886 | |||||||||
|
Texas
State Waters
|
10,465 | 49,745 | 8,789 | |||||||||
|
Other
Onshore
|
17,742 | 44,809 | 25,905 | |||||||||
|
Gulf
of Mexico
|
11,840 | 47,611 | 40,700 | |||||||||
| $ | 217,384 | $ | 518,016 | $ | 340,563 | |||||||
|
December
31,
|
||||||||
|
2009
|
2008
|
|||||||
|
Oil
and Natural Gas Properties and Other Fixed Assets
|
(In
thousands)
|
|||||||
|
California
|
$ | 624,765 | $ | 619,593 | ||||
|
Rockies
|
202,502 | 175,294 | ||||||
|
South
Texas
|
791,934 | 712,464 | ||||||
|
Texas
State Waters
|
70,667 | 65,085 | ||||||
|
Other
Onshore
|
186,912 | 171,855 | ||||||
|
Gulf
of Mexico
|
153,653 | 156,381 | ||||||
|
Other
|
12,417 | 9,439 | ||||||
| $ | 2,042,850 | $ | 1,910,111 | |||||
___________________________________
|
|
(1)
|
Excludes
the effects of hedging gains of $76.6 million for the year ended December
31, 2009, hedging losses of $18.7 million for the year ended December 31,
2008 and hedging gains of $22.9 million for the year ended December 31,
2007.
|
Major
Customers
For the
year ended December 31, 2009, the Company had one major customer, CES, which
accounted for approximately 57% of the Company’s consolidated annual
revenue. The Company’s annual consolidated revenue from CES accounted
for approximately 61% and 55% for the years ended December 31, 2008 and 2007,
respectively, and is reflected in oil and natural gas sales. For the
years ended December 31, 2009, 2008 and 2007, revenues from sales to CES were
$117.8 million, $305.9 million, and $201.4 million,
respectively. There was no receivable from CES at December 31,
2009 or 2008. Under the gas purchase and sale contract, CES is
required to collateralize payments under the contract by daily margin payments
into the Company’s collateral account, which are then settled at the end of the
month. At December 31, 2009 and 2008, the Company had $7.5 million and
$19.4 million in the margin account for December sales to CES which is included
in Prepayment on gas sales on the Consolidated Balance Sheet.
|
(16)
|
Subsequent
Events
|
On
January 26, 2010, the Company entered into a purchase and sale agreement with
St. Mary Land & Exploration Company to purchase the remaining 30% working
interest and obtain operatorship in the Catarina Field for approximately $5.9
million, subject to any applicable purchase price adjustments. The
purchase is effective as of January 1, 2010 and closing shall occur on or before
March 4, 2010, but no later than May 1, 2010.
In
January 2010, the Company entered into additional costless collar transactions
to hedge 10,000 MMBtu/d of its expected production for July 2010 through
December 2012. The costless collars have a floor price of $5.75 per
MMBtu and a ceiling price of $6.50 per MMBtu through 2011 and $7.15 per MMBtu in
2012. In February 2010, the Company entered into natural gas
fixed-price swaps to hedge 10,000 MMBtu/d of its expected production for July
2010 through December 2011 at an average price of $5.91 per
MMBtu.
Supplemental
Oil and Gas Disclosures
(Unaudited)
The
following disclosures for the Company are made in accordance with authoritative
guidance regarding disclosures about oil and natural gas producing activities.
Users of this information should be aware that the process of estimating
quantities of proved, proved developed and proved undeveloped crude oil and
natural gas reserves is very complex, requiring significant subjective decisions
in the evaluation of all available geological, engineering and economic data for
each reservoir. The data for a given reservoir may also change substantially
over time as a result of numerous factors including, but not limited to,
additional development activity, evolving production history and continual
reassessment of the viability of production under varying economic conditions.
Consequently, material revisions to existing reserve estimates occur from time
to time. Although every reasonable effort is made to ensure that reserve
estimates reported represent the most accurate assessments possible, the
significance of the subjective decisions required and variances in available
data for various reservoirs make these estimates generally less precise than
other estimates presented in connection with financial statement
disclosures. Additionally, in December 2008, the SEC issued new
disclosure requirements that require reporting of oil and gas reserves using an
average first day of the month historical price based upon the prior
twelve-month period rather than year-end prices and the use of reliable
technologies to determine proved reserves if those technologies have been
demonstrated to result in reasonable certainty of economic producibility of
reserves volumes. Under this guidance, companies are required to
report the independence and qualifications of its reserves preparer or auditor
and file reports when a third party is relied upon to prepare reserves estimates
or conduct a reserves audit. These new disclosure requirements became
effective beginning with the annual report on Form 10-K for the year ending
December 31, 2009. In October 2009, the SEC issued Staff Accounting
Bulletin (“SAB”) No. 113 to bring existing SEC guidance into conformity with the
Release. The principle revisions of the guidance include
changing the price used in determining quantities of oil and gas reserves, as
noted above; eliminating the option to use post-quarter-end prices to evaluate
write-offs of excess capitalized costs under the full cost method of accounting;
removing the exclusion of unconventional methods used in extracting oil and gas
from oil sands or shale as an oil and gas producing activity; and removing
certain questions and interpretative guidance which are no longer
necessary. In January 2010, the FASB issued its guidance on oil and
gas reserve estimation and disclosure, aligning their requirements with the
SEC’s final rule.
Proved
reserves are those quantities of oil and gas, which by analysis of geoscience
and engineering data, can be estimated with reasonable certainty to be
economically producible from a given date forward, from known reservoirs, and
under existing economic conditions, operating methods, and government regulation
before the time at which contracts providing the right to operate expire, unless
evidence indicates that renewal is reasonably certain, regardless of whether the
estimate is a deterministic estimate or probabilistic estimate.
Proved
developed reserves are proved reserves that can be expected to be recovered (a)
through existing wells with existing equipment and operating methods or in which
the cost of the required equipment is relatively minor compared with the cost of
a new well or (b) through installed extraction equipment and infrastructure
operational at the time of the reserve estimate if the extraction is by means
not involving a well.
Proved
undeveloped reserves are reserves that are expected to be recovered from new
wells on undrilled acreage or from existing wells where a relatively major
expenditure is required for recompletion. Reserves on undrilled acreage shall be
limited to those directly offsetting development spacing areas that are
reasonably certain of production when drilled, unless evidence using reliable
technology exists that establishes reasonable certainty of economic
producibility at greater distances. Undrilled locations can be
classified as having undeveloped reserves only if a development plan has been
adopted indicating that they are scheduled to be drilled within five years,
unless the specific circumstances justify a longer time. Estimates
for proved undeveloped reserves are not attributed to any acreage for which an
application of fluid injection or other improved recovery technique is
contemplated, unless such techniques have been proved effective by actual
projects in the same reservoir or an analogous reservoir, or by other evidence
using reliable technology establishing reasonable certainty.
Estimates
of proved developed and proved undeveloped reserves as of December 31, 2009 are
based on estimates made by the Company’s engineers and audited by NSAI,
independent engineers. The Company’s primary reserves estimator is
the Company’s Chief Engineer and Operations General Manager who has twenty-two
years of experience in the petroleum industry with 18 years of experience in the
evaluation of reserves and income attributable to oil and gas properties. She
holds a Bachelor of Science in Petroleum Engineering, a Bachelor of Science in
Geosciences and a Master of Business Administration from the University of
Tulsa. She also holds a Master of Science in Petroleum Engineering
from the University of Houston. She obtained a Doctor of
Jurisprudence from South Texas College of Law and is a member of Phi Delta Phi
honorary law society and the Society of Petroleum
Engineers. Estimates of proved developed and proved undeveloped
reserves as of December 31, 2008 and 2007 were based on estimates made by
NSAI who were engaged by and provided their reports to our senior management
team. We make representations to the independent engineers that we have provided
all relevant operating data and documents, and in turn, we review these reserve
reports provided by the independent engineers to ensure completeness and
accuracy. NSAI performs petroleum engineering consulting services
under the Texas Board of Professional Engineers. NSAI’s President and
Chief Operating Officer is a licensed professional engineer with more than 30
years of experience and the geoscientist charged with the audit is a licensed
professional with 25 years of experience.
The
preparation of our reserve estimates are completed in accordance with the
Company’s prescribed internal control procedures, which include verification of
input data into a reserve forecasting and economic evaluation software, as well
as management review. The technical persons responsible for preparing the
reserve estimates meet the required standards regarding qualifications and
objectivity. Additionally, the Company engages qualified, independent
reservoir engineers to audit the internally generated reserve report in
accordance with all SEC reserve estimation guidelines.
A
twelve-month first day of the month historical average price as of December 31,
2009 was used for future sales of natural gas, crude oil and NGLs. As
of December 31, 2008 and 2007, market prices as of each year-end were used for
future sales of natural gas, crude oil and NGLs. Future operating costs,
production and ad valorem taxes and capital costs were based on current costs as
of each year-end, with no escalation. There are numerous uncertainties inherent
in estimating quantities of proved reserves and in projecting the future rates
of production and timing of development expenditures. Reserve data represent
estimates only and should not be construed as being exact. Moreover, the
standardized measure should not be construed as the current market value of the
proved oil and natural gas reserves or the costs that would be incurred to
obtain equivalent reserves. A market value determination would include many
additional factors including (a) anticipated future changes in natural gas
and crude oil prices, production and development costs, (b) an allowance
for return on investment, (c) the value of additional reserves, not
considered proved at present, which may be recovered as a result of further
exploration and development activities, and (d) other business
risk.
Capitalized
Costs Relating to Oil and Gas Producing Activities
The
following table sets forth the capitalized costs relating to the Company’s
natural gas and crude oil producing activities at December 31, 2009, 2008
and 2007:
|
2009
|
2008
|
2007
|
||||||||||
|
(In
thousands)
|
||||||||||||
|
Proved
properties
|
$ | 1,949,515 | $ | 1,813,527 | $ | 1,499,046 | ||||||
|
Unproved
properties
|
42,344 | 50,252 | 40,903 | |||||||||
|
Total
|
1,991,859 | 1,863,779 | 1,539,949 | |||||||||
|
Less:
Accumulated depreciation, depletion, and amortization
|
(1,440,204 | ) | (927,961 | ) | (291,321 | ) | ||||||
|
Net
capitalized costs
|
$ | 551,655 | $ | 935,818 | $ | 1,248,628 | ||||||
Pursuant
to authoritative guidance for accounting for asset retirement obligations, net
capitalized costs include asset retirement costs of $21.9 million, $23.2 million
and $20.1 million as of December 31, 2009, 2008 and 2007,
respectively.
Costs
Incurred in Oil and Natural Gas Property Acquisition, Exploration and
Development Activities
The
following table sets forth costs incurred related to the Company’s oil and
natural gas activities for the years ended December 31, 2009, 2008 and
2007:
|
Year
Ended December 31,
|
||||||||||||
|
2009
|
2008
|
2007
|
||||||||||
|
(In
thousands)
|
||||||||||||
|
Acquisition
costs of properties
|
||||||||||||
|
Proved
|
$ | 11,490 | $ | 103,177 | $ | 40,760 | ||||||
|
Unproved
|
28,246 | 32,276 | 23,824 | |||||||||
|
Subtotal
|
39,736 | 135,453 | 64,584 | |||||||||
|
Exploration
costs
|
24,550 | 35,735 | 90,117 | |||||||||
|
Development
costs
|
65,183 | 152,260 | 178,894 | |||||||||
|
Total
|
$ | 129,469 | $ | 323,448 | $ | 333,595 | ||||||
Results
of operations for oil and natural gas producing activities
|
Year
Ended December 31,
|
||||||||||||
|
2009
(1)
|
2008
(1)
|
2007
(1)
|
||||||||||
|
(In
thousands)
|
||||||||||||
|
Natural
gas, oil, and NGL producing revenues
|
$ | 217,384 | $ | 518,016 | $ | 340,563 | ||||||
|
Production
costs
|
73,172 | 78,609 | 60,140 | |||||||||
|
Depreciation,
depletion, and amortization
|
121,042 | 198,862 | 152,882 | |||||||||
|
Impairment
of oil and gas properties
|
379,462 | 444,369 | - | |||||||||
|
Income
(loss) before income taxes
|
(356,292 | ) | (203,824 | ) | 127,541 | |||||||
|
Income
tax provision (benefit)
|
(130,047 | ) | (76,434 | ) | 47,573 | |||||||
|
Results
of operations
|
$ | (226,245 | ) | $ | (127,390 | ) | $ | 79,968 | ||||
___________________________________
|
|
(1)
|
Excludes
the effects of hedging gains of $76.6 million for the year ended December
31, 2009, hedging losses of $18.7 million for the year ended December 31,
2008 and hedging gains of $22.9 million for the year ended December 31,
2007.
|
The
results of operations for oil and natural gas producing activities exclude
interest charges and general and administrative expenses. Sales are
based on market prices.
Net
Proved and Proved Developed Reserve Summary
The
following table sets forth the Company’s net proved and proved developed
reserves (all within the United States) at December 31, 2009, 2008, and
2007, as estimated by the Company’s reservoir engineers and audited by
independent petroleum consultants in 2009 and as estimated by independent
petroleum consultants for 2008 and 2007 and the changes in the net proved
reserves for each of the three years then ended. There was no
restatement of 2008 and 2007 reserves as a result of the new reserve reporting
guidance.
|
Natural
gas
(Bcf)(1):
|
Natural
gas liquids
and
crude oil
(MBbl)(2)(3):
|
Bcfe
(1)
equivalents
(4):
|
||||||||||
|
Net
proved reserves at December 31, 2006 (5)
|
390 | 2,930 | 408 | |||||||||
|
Revisions
of previous estimates
|
(30 | ) | - | (30 | ) | |||||||
|
Purchases
in place
|
10 | - | 10 | |||||||||
|
Extensions,
discoveries and other additions
|
72 | 652 | 76 | |||||||||
|
Sales
in place
|
- | - | - | |||||||||
|
Production
|
(42 | ) | (561 | ) | (46 | ) | ||||||
|
Net
proved reserves at December 31, 2007 (5)
|
400 | 3,021 | 418 | |||||||||
|
Revisions
of previous estimates (6)
|
(77 | ) | 779 | (72 | ) | |||||||
|
Purchases
in place
|
63 | 293 | 65 | |||||||||
|
Extensions,
discoveries and other additions
|
38 | 418 | 40 | |||||||||
|
Sales
in place
|
- | - | - | |||||||||
|
Production
|
(48 | ) | (908 | ) | (53 | ) | ||||||
|
Net
proved reserves at December 31, 2008
|
376 | 3,603 | 398 | |||||||||
|
Revisions
of previous estimates (7)
|
(67 | ) | 3,146 | (48 | ) | |||||||
|
Purchases
in place
|
3 | 25 | 3 | |||||||||
|
Extensions,
discoveries and other additions
|
32 | 3,603 | 54 | |||||||||
|
Sales
in place
|
(3 | ) | (317 | ) | (6 | ) | ||||||
|
Production
|
(44 | ) | (1,014 | ) | (50 | ) | ||||||
|
Net
proved reserves at December 31, 2009
|
297 | 9,046 | 351 | |||||||||
Net
proved developed reserves
|
Proved
Developed Reserves
|
||||||||||||
|
Natural
gas
(Bcf)
(1)
|
Natural
gas liquids and crude oil (MBbl) (2) (3)
|
Equivalents
Bcfe
(4)
|
||||||||||
|
December
31, 2007 (5) (8)
|
286 | 2,658 | 302 | |||||||||
|
December
31, 2008 (8)
|
308 | 3,253 | 327 | |||||||||
|
December
31, 2009
|
237 | 4,669 | 265 | |||||||||
___________________________________
|
|
(1)
|
Billion
cubic feet or billion cubic feet equivalent, as
applicable
|
|
|
(2)
|
Thousand
barrels
|
|
|
(3)
|
Includes
crude oil, condensate and natural gas
liquids
|
|
|
(4)
|
Natural
gas liquids and crude oil volumes have been converted to equivalent
natural gas volumes using a conversion factor of six cubic feet of natural
gas to one barrel of natural gas liquids and crude
oil.
|
|
|
|
(5)
|
Excludes
estimated reserves pertaining to interests in certain leases and wells
associated with the Non-Consent
Properties.
|
|
|
(6)
|
Downward
revision of 64 Bcfe of proved reserves and 8 Bcfe due to year-end
commodity prices. The Company’s downward revision of 64 Bcfe of
proved reserves consisted of performance revisions of 35 Bcfe in
California and 25 Bcfe in the South Texas Lobo trend with the remainder
spread across a variety of asset areas. In both cases, the
performance revisions were driven by new data and not by a change in
reserve evaluation methodology.
|
|
|
(7)
|
Downward
revision of 48 Bcfe of proved reserves primarily due to the use of the
twelve-month first day of the month historical average oil and gas price
used to calculate the December 31, 2009 reserves instead of the use of
year-end commodity prices as previously
required.
|
|
|
(8)
|
There
was no restatement of 2008 and 2007 proved developed reserves as a result
of the new reserve reporting
guidance.
|
Standardized
Measure of Discounted Future Net Cash Flows Relating to Proved Oil and Natural
Gas Reserves
The
following information has been developed utilizing procedures prescribed by
authoritative guidance and based on natural gas and crude oil reserve and
production volumes estimated by internal reserves engineers and audited by
independent petroleum reservoir engineers. This information may be useful for
certain comparison purposes but should not be solely relied upon in evaluating
the Company or its performance. In accordance with SEC requirements, the
estimated discounted future net revenues from proved reserves are generally
based on average first day of the month oil and gas prices in effect for the
prior twelve months in 2009 and costs as of the date of the estimate and, in
2008 and 2007, prices and costs as of the date of the estimate.
Actual future prices and costs may be materially higher or lower than the
average prices and costs are as of the date of the estimate. Further,
information contained in the following table should not be considered as
representative of realistic assessments of future cash flows, nor should the
standardized measure of discounted future net cash flows be viewed as
representative of the current value of the Company’s oil and natural gas
assets. Changes in reserve reporting requirements negatively impacted
the Company’s Standardized Measure of Discounted Future Net Cash Flows Relating
to Proved Oil and Natural Gas Reserves as the twelve-month first day of the
month historical average price was significantly lower than the year-end price
at December 31, 2009.
The
future cash flows presented below are based on sales prices, cost rates and
statutory income tax rates in existence as of the date of the projections. It is
expected that material revisions to some estimates of natural gas and crude oil
reserves may occur in the future, development and production of the reserves may
occur in periods other than those assumed, and actual prices realized and costs
incurred may vary significantly from those used. Income tax expense has been
computed using expected future tax rates and giving effect to tax deductions and
credits available, under current laws, and which relate to oil and natural gas
producing activities.
Management
does not rely upon the following information in making investment and operating
decisions. Such decisions are based upon a wide range of factors, including
estimates of probable as well as proved reserves and varying price and cost
assumptions considered more representative of a range of possible economic
conditions that may be anticipated.
The
following table sets forth the standardized measure of discounted future net
cash flows from projected production of the Company’s natural gas and crude oil
reserves for the years ended December 31, 2009, 2008 and 2007:
|
Year
Ended December 31, 2009
|
||||||||||||
|
Proved
Developed
|
Proved
Undeveloped
|
Total
|
||||||||||
|
(In
millions)
|
||||||||||||
|
Future
cash inflows
|
$ | 1,153 | $ | 407 | $ | 1,560 | ||||||
|
Future
production costs
|
(503 | ) | (90 | ) | (593 | ) | ||||||
|
Future
development costs
|
(58 | ) | (142 | ) | (200 | ) | ||||||
|
Future
income taxes (1)
|
- | - | - | |||||||||
|
Future
net cash flows
|
592 | 175 | 767 | |||||||||
|
Discount
to present value at 10% annual rate
|
(209 | ) | (93 | ) | (302 | ) | ||||||
|
Standardized
measure of discounted future net cash flows relating to proved natural
gas, natural gas liquids and crude oil reserves
|
$ | 383 | $ | 82 | $ | 465 | ||||||
|
Year
Ended December 31, 2008
|
||||||||||||
|
Proved
Developed
|
Proved
Undeveloped
|
Total
|
||||||||||
|
(In
millions)
|
||||||||||||
|
Future
cash inflows
|
$ | 1,983 | $ | 454 | $ | 2,437 | ||||||
|
Future
production costs
|
(686 | ) | (90 | ) | (776 | ) | ||||||
|
Future
development costs
|
(95 | ) | (174 | ) | (269 | ) | ||||||
|
Future
income taxes
|
(143 | ) | (23 | ) | (166 | ) | ||||||
|
Future
net cash flows
|
1,059 | 167 | 1,226 | |||||||||
|
Discount
to present value at 10% annual rate
|
(402 | ) | (83 | ) | (485 | ) | ||||||
|
Standardized
measure of discounted future net cash flows relating to proved natural
gas, natural gas liquids and crude oil reserves
|
$ | 657 | $ | 84 | $ | 741 | ||||||
|
Year
Ended December 31, 2007
|
||||||||||||
|
Proved
Developed
|
Proved
Undeveloped
|
Total
|
||||||||||
|
(In
millions)
|
||||||||||||
|
Future
cash inflows
|
$ | 2,183 | $ | 843 | $ | 3,026 | ||||||
|
Future
production costs
|
(640 | ) | (179 | ) | (819 | ) | ||||||
|
Future
development costs
|
(88 | ) | (214 | ) | (302 | ) | ||||||
|
Future
income taxes
|
(247 | ) | (76 | ) | (323 | ) | ||||||
|
Future
net cash flows
|
1,208 | 374 | 1,582 | |||||||||
|
Discount
to present value at 10% annual rate
|
(458 | ) | (170 | ) | (628 | ) | ||||||
|
Standardized
measure of discounted future net cash flows relating to proved natural
gas, natural gas liquids and crude oil reserves
|
$ | 750 | $ | 204 | $ | 954 | ||||||
________________________________________
|
|
(1)
|
For
the year ended December 31, 2009, the future revenues and expenses
associated with oil and gas properties did not exceed the Company’s
current tax basis of oil and gas properties, thus resulting in no future
income tax expense. This is calculated using the twelve-month
first day of the month historical average
pricing.
|
Changes
in Standardized Measure of Discounted Future Net cash Flows
The
following table sets forth the changes in the standardized measure of discounted
future net cash flows at December 31, 2009, 2008 and 2007:
|
(In
millions)
|
||||
|
Balance
December 31, 2006 (1)
|
$ | 722 | ||
|
Sales
and transfers of natural gas, natural gas liquids and crude oil produced,
net of production costs
|
(303 | ) | ||
|
Net
changes in prices and production costs
|
253 | |||
|
Extensions,
discoveries, additions and improved recovery, net of related
costs
|
283 | |||
|
Development
costs incurred
|
92 | |||
|
Revisions
of previous quantity estimates and development costs
|
(76 | ) | ||
|
Accretion
of discount
|
79 | |||
|
Net
change in income taxes
|
(113 | ) | ||
|
Purchases
of reserve in place
|
38 | |||
|
Sales
of reserves in place
|
- | |||
|
Changes
in timing and other
|
(21 | ) | ||
|
Balance
December 31, 2007 (1)
|
954 | |||
|
Sales
and transfers of natural gas, natural gas liquids and crude oil produced,
net of production costs
|
(439 | ) | ||
|
Net
changes in prices and production costs
|
(73 | ) | ||
|
Extensions,
discoveries, additions and improved recovery, net of related
costs
|
123 | |||
|
Development
costs incurred
|
98 | |||
|
Revisions
of previous quantity estimates and development costs
|
(191 | ) | ||
|
Accretion
of discount
|
114 | |||
|
Net
change in income taxes
|
95 | |||
|
Purchases
of reserve in place
|
119 | |||
|
Sales
of reserves in place
|
- | |||
|
Changes
in timing and other
|
(59 | ) | ||
|
Balance
December 31, 2008
|
741 | |||
|
Sales
and transfers of natural gas, natural gas liquids and crude oil produced,
net of production costs
|
(221 | ) | ||
|
Net
changes in prices and production costs
|
(348 | ) | ||
|
Extensions,
discoveries, additions and improved recovery, net of related
costs
|
69 | |||
|
Development
costs incurred
|
114 | |||
|
Revisions
of previous quantity estimates and development costs
|
(71 | ) | ||
|
Accretion
of discount
|
84 | |||
|
Net
change in income taxes
|
100 | |||
|
Purchases
of reserve in place
|
5 | |||
|
Sales
of reserves in place
|
(9 | ) | ||
|
Changes
in timing and other
|
1 | |||
|
Balance
December 31, 2009
|
$ | 465 | ||
___________________________________
|
|
(1)
|
Excludes
non-consent properties related to the Calpine
litigation.
|
Rosetta
Resources Inc.
Selected
Data
Quarterly
Information
(Unaudited)
Summaries
of the Company’s results of operations by quarter for the years ended 2009 and
2008 are as follows:
|
2009
|
||||||||||||||||
|
First
Quarter
|
Second
Quarter
|
Third
Quarter
|
Fourth
Quarter
|
|||||||||||||
|
(In
thousands, except per share data)
|
||||||||||||||||
|
Revenues
|
$ | 79,441 | $ | 73,550 | $ | 64,484 | $ | 76,476 | ||||||||
|
Impairment
of oil and gas properties
|
(379,462 | ) | - | - | - | |||||||||||
|
Operating
income (loss)
|
(375,177 | ) | 12,820 | 14,788 | 20,851 | |||||||||||
|
Net
income (loss)
|
(238,133 | ) | 4,035 | 5,731 | 9,191 | |||||||||||
|
Basic
earnings (loss) per share
|
(4.68 | ) | 0.08 | 0.11 | 0.19 | |||||||||||
|
Diluted
earnings (loss) per share
|
(4.68 | ) | 0.08 | 0.11 | 0.19 | |||||||||||
|
2008
|
||||||||||||||||
|
First
Quarter
|
Second
Quarter
|
Third
Quarter
|
Fourth
Quarter
|
|||||||||||||
|
(In
thousands, except per share data)
|
||||||||||||||||
|
Revenues
|
$ | 128,333 | $ | 154,467 | $ | 130,036 | $ | 86,512 | ||||||||
|
Impairment
of oil and gas properties
|
- | - | (205,659 | ) | (238,710 | ) | ||||||||||
|
Operating
income (loss)
|
45,908 | 66,730 | (155,806 | ) | (232,170 | ) | ||||||||||
|
Net
income (loss)
|
27,489 | 39,315 | (99,375 | ) | (155,539 | ) | ||||||||||
|
Basic
earnings (loss) per share
|
0.54 | 0.78 | (1.96 | ) | (3.06 | ) | ||||||||||
|
Diluted
earnings (loss) per share
|
0.54 | 0.77 | (1.96 | ) | (3.06 | ) | ||||||||||
|
Item 9.
|
Changes
in and Disagreements With Accountants on Accounting and Financial
Disclosure
|
None
|
Item 9A.
|
Controls
and Procedures
|
Evaluation
of Disclosure Controls and Procedures
Under the
supervision and with the participation of our management, including our Chief
Executive Officer and Chief Financial Officer, we conducted an evaluation of the
effectiveness of the design and operation of our disclosure controls and
procedures, as defined in Rules 13a-15(e) and 15d-15(e) under the Securities
Exchange Act of 1934, as amended (“Exchange Act”), as of December 31,
2009. Based on that evaluation, the Chief Executive Officer and Chief
Financial Officer concluded that, as of December 31, 2009, our disclosure
controls and procedures were effective in providing reasonable assurance that
information required to be disclosed by us in the reports filed or submitted by
us under the Exchange Act is recorded, processed, summarized and reported within
the time periods specified in the SEC’s rules and forms, and that such
information is accumulated and communicated to the Company’s management,
including the Chief Executive Officer and Chief Financial Officer, as
appropriate, to allow timely decisions regarding required
disclosure.
Management’s
Annual Report on Internal Control Over Financial Reporting
Management,
including our Chief Executive Officer and Chief Financial Officer, is
responsible for establishing and maintaining adequate internal control over
financial reporting, as such term is defined in Exchange Act Rule 13a –
15(f). Management conducted an assessment as of December 31, 2009 of
the effectiveness of our internal control over financial reporting based on the
framework in Internal Control
– Integrated Framework issued by the Committee of Sponsoring
Organizations of the Treadway Commission (“COSO”). Based on that
evaluation, management concluded that our internal control over financial
reporting was effective as of December 31, 2009, based on criteria in Internal Control – Integrated
Framework issued by the COSO.
The
effectiveness of the Company’s internal control over financial reporting as of
December 31, 2009, has been audited by PricewaterhouseCoopers LLP, an
independent registered public accounting firm, as stated in their report, which
is included in Item 8. “Financial Statements and Supplementary Data” of this
Annual Report on Form 10-K.
Changes
in Internal Control Over Financial Reporting
There has
been no change in our internal control over financial reporting (as defined in
Rules 13a-15(f) and 15d-15(f) under the Exchange Act) during the quarter ended
December 31, 2009 that has materially affected, or is reasonably likely to
materially affect, our internal control over financial reporting.
|
Item 9B.
|
Other
Information
|
None.
PART
III
|
Item 10.
|
Directors,
Executive Officers and Corporate
Governance
|
The
information required to be contained in this Item is incorporated by reference
to our definitive proxy statement to be filed with respect to our 2010 annual
meeting under the headings “Security Ownership of Directors and Executive
Officers,” “Company Nominees for Director,” “Section 16(a) Beneficial Ownership
Reporting Compliance,” and “Corporate Governance and Committees of the
Board.”
|
Item 11.
|
Executive
Compensation
|
The
information required to be contained in this Item is incorporated by reference
to our definitive proxy statement to be filed with respect to our 2010 annual
meeting under the headings “Executive Compensation,” “Information Concerning the
Board of Directors,” and “Compensation Committee Report.”
|
Item 12.
|
Security
Ownership of Certain Beneficial Owners and Management and Related
Stockholder Matters
|
This
information required to be contained in this Item is incorporated by reference
to our definitive proxy statement to be filed with respect to our 2010 annual
meeting under the headings ”Security Ownership of Certain Beneficial Owners and
Management” and “Securities Authorized for Issuance Under Equity Compensation
Plans.”
|
Item 13.
|
Certain
Relationships and Related Transactions, and Director
Independence
|
The
information required to be contained in this Item is incorporated by reference
to our definitive proxy statement to be filed with respect to our 2010 annual
meeting under the heading “Certain Transactions” and “Corporate Governance and
Committees of the Board.”
|
Item 14.
|
Principal
Accountant Fees and Services
|
The
information required to be contained in this Item is incorporated by reference
to our definitive proxy statement to be filed with respect to our 2010 annual
meeting under the heading “Audit and Non-Audit Fees
Summary.”
Part
IV
|
Item 15.
|
Exhibits
and Financial Statement Schedules
|
|
|
a.
|
The
following documents are filed as a part of this report or incorporated
herein by reference:
|
|
|
(1)
|
Our
Consolidated Financial Statements are listed on page 44 of this
report.
|
|
|
(2)
|
Financial
Statement Schedules:
|
None
|
|
(3)
|
Exhibits:
|
The
following documents are included as exhibits to this report:
|
Exhibit
Number
|
Description
|
|
|
3.1
|
Certificate
of Incorporation (incorporated herein by reference to Exhibit 3.1 to the
Company’s Registration Statement on Form S-1 filed on October 7, 2005
(Registration No. 333-128888)).
|
|
|
3.2
|
Amended
and Restated Bylaws (incorporated herein by reference to Exhibit 3.2 to
the Company’s Current Report on Form 8-K filed on December 10, 2008
(Registration No. 000-51801)).
|
|
|
4.1
|
Registration
Rights Agreement (incorporated herein by reference to Exhibit 4.1 to the
Company’s Registration Statement on Form S-1 filed on October 7, 2005
(Registration No. 333-128888)).
|
|
|
10.1
|
Purchase
and Sale Agreement with Calpine Corporation, Calpine Gas Holdings, L.L.C.
and Calpine Fuels Corporation (incorporated herein by reference to Exhibit
10.1 to the Company’s Registration Statement on Form S-1 filed on October
7, 2005 (Registration No. 333-128888)).
|
|
|
10.2
|
Transfer
and Assumption Agreements with Calpine Corporation and Subsidiaries of
Rosetta Resources Inc. (incorporated herein by reference to Exhibit 10.2
to the Company’s Registration Statement on Form S-1 filed on October 7,
2005 (Registration No. 333-128888)).
|
|
|
10.3
|
Settlement
Agreement and Amendment with Calpine Corporation (incorporated herein by
reference to Exhibit 10.3 to the Company’s Annual Report on Form 10-K
filed on March 2, 2009 (Registration No. 000-51801)).
|
|
|
10.4
|
Amended
and Restated Base Contract for Sale and Purchase of Natural Gas with
Calpine Energy Services, L.P. (incorporated herein by reference to Exhibit
10.4 to the Company’s Annual Report on Form 10-K filed on March 2, 2009
(Registration No. 000-51801)).
|
|
|
10.5
|
Services
Agreement with Calpine Producer Services, L.P. (incorporated herein by
reference to Exhibit 10.5 to the Company’s Registration Statement on Form
S-1 filed on October 7, 2005 (Registration No.
333-128888)).
|
|
|
10.9
†
|
Amended
and Restated 2005 Long-Term Incentive Plan (incorporated herein by
reference to Exhibit 10.9 to the Company’s Annual Report on Form 10-K
filed on March 2, 2009 (Registration No. 000-51801)).
|
|
|
10.10
†
|
Form
of Option Grant Agreement (incorporated herein by reference to Exhibit
10.10 to the Company’s Registration Statement on Form S-1 filed on October
7, 2005 (Registration No.
333-128888)).
|
|
10.11
†
|
Form
of Restricted Stock Agreement (incorporated herein by reference to Exhibit
10.11 to the Company’s Registration Statement on Form S-1 filed on October
7, 2005 (Registration No. 333-128888)).
|
|
|
10.12
†
|
Form
of Bonus Restricted Stock Agreement (incorporated herein by reference to
Exhibit 10.12 to the Company’s Registration Statement on Form S-1 filed on
October 7, 2005 (Registration No. 333-128888)).
|
|
|
10.18
|
Amended
and Restated Senior Revolving Credit Agreement (incorporated herein by
reference to Exhibit 10.18 to the Company’s Current Report on Form 8-K
filed on April 15, 2009 (Registration No.
000-51801)).
|
|
10.19
|
Amended
and Restated Second Lien Term Loan Agreement (incorporated herein by
reference to Exhibit 10.19 to the Company’s Current Report on Form 8-K
filed on April 15, 2009 (Registration No. 000-51801)).
|
|
|
10.20
|
Guarantee
and Collateral Agreement (incorporated herein by reference to Exhibit
10.20 to the Company’s Registration Statement on Form S-1 filed on October
7, 2005 (Registration No. 333-128888)).
|
|
|
10.21
|
Second
Lien Guarantee and Collateral Agreement (incorporated herein by reference
to Exhibit 10.21 to the Company’s Registration Statement on Form S-1 filed
on October 7, 2005 (Registration No. 333-128888)).
|
|
|
10.24
|
First
Amendment to Guarantee and Collateral Agreement (incorporated herein by
reference to Exhibit 10.24 to the Company’s Registration Statement on Form
S-1 filed on October 7, 2005 (Registration No.
333-128888)).
|
|
|
10.25
|
First
Amendment to Second Lien Guarantee and Collateral Agreement (incorporated
herein by reference to Exhibit 10.25 to the Company’s Registration
Statement on Form S-1 filed on October 7, 2005 (Registration No.
333-128888)).
|
|
|
10.26
|
Deposit
Account Control Agreement (incorporated herein by reference to Exhibit
10.26 to the Company’s Registration Statement on Form S-1 filed on October
7, 2005 (Registration No. 333-128888)).
|
|
|
10.31
†
|
Amended
and Restated Employment Agreement with Randy L. Limbacher
(incorporated herein by reference to Exhibit 10.31 to the Company’s Annual
Report on Form 10-K filed on March 2, 2009 (Registration No.
000-51801)).
|
|
|
10.32
†
|
Amended
and Restated Employment Agreement with Michael J. Rosinski (incorporated
herein by reference to Exhibit 10.32 to the Company’s Annual Report on
Form 10-K filed on March 2, 2009 (Registration No.
000-51801)).
|
|
|
10.33
†
|
Amended
Employment Agreement with Charles S. Chambers (incorporated herein by
reference to Exhibit 10.3 to Quarterly Report on Form 10-Q filed on
November 9, 2007).
|
|
|
10.34
|
Partial
Transfer and Settlement Agreement with Calpine Corporation (incorporated
herein by reference to Exhibit 10.4 to Quarterly Report on Form 10-Q filed
on November 9, 2007).
|
|
|
10.35
|
Marketing
and Related Services Agreement with Calpine Natural Gas Services, L.P.
(incorporated herein by reference to Exhibit 10.5 to Form 10-Q filed on
November 9, 2007).
|
|
|
10.36
†
|
Indemnification
Agreement with Directors and Officers (incorporated herein by reference to
Exhibit 10.36 to the Company’s Annual Report on Form 10-K filed on March
2, 2009 (Registration No. 000-51801)).
|
|
|
10.37
†
|
Amended and
Restated Employment Agreement with Michael H. Hickey
(incorporated herein by reference to Exhibit 10.37 to the Company’s Annual
Report on Form 10-K filed on March 2, 2009 (Registration No.
000-51801)).
|
|
|
10.38
†
|
Amended
and Restated Employment Agreement with Edward E. Seeman (incorporated
herein by reference to Exhibit 10.38 to Form 10-K filed February 29,
2008).
|
|
|
10.39
†
|
2005
Long-Term Incentive Plan Performance Share Unit Award Agreement
(incorporated herein by reference to Exhibit 10.39 to the Company’s Annual
Report on Form 10-K filed on March 2, 2009 (Registration No.
000-51801)).
|
|
|
10.40
†
|
Executive
Employee Change of Control Plan (incorporated herein by reference to
Exhibit 10.40 to the Company’s Annual Report on Form 10-K filed on March
2, 2009 (Registration No. 000-51801)).
|
|
|
10.41
†
|
Executive
Employee Severance Plan (incorporated herein by reference to Exhibit 10.41
to the Company’s Annual Report on Form 10-K filed on March 2, 2009
(Registration No. 000-51801)).
|
|
|
10.42
†*
|
Executive
Employee Change of Control Plan
|
|
|
10.44
|
First
Amendment dated October 22, 2009 to Amended and Restated Senior Revolving
Credit Agreement (incorporated herein by reference to Exhibit 10.44 to the
Company’s Quarterly Report on Form 10-Q filed on November 6, 2009
(Registration No. 000-51801)).
|
|
|
10.45
|
First
Amendment dated October 22, 2009 to Amended and Restated Second Lien Term
Loan Agreement (incorporated herein by reference to Exhibit 10.45 to the
Company’s Quarterly Report on Form 10-Q filed on November 6, 2009
(Registration No. 000-51801)).
|
|
21.1*
|
Subsidiaries
of the registrant
|
|
|
23.1*
|
Consent
of PricewaterhouseCoopers LLP
|
|
|
23.2*
|
Consent
of Netherland, Sewell & Associates, Inc.
|
|
|
31.1*
|
Certification
of Periodic Financial Reports by Chief Executive Officer in satisfaction
of Section 302 of the Sarbanes-Oxley Act of 2002.
|
|
|
31.2*
|
Certification
of Periodic Financial Reports by Chief Financial Officer in satisfaction
of Section 302 of the Sarbanes-Oxley Act of 2002.
|
|
|
32.1*
|
Certification
of Periodic Financial Reports by Chief Executive Officer and Chief
Financial Officer in satisfaction of Section 906 of the Sarbanes-Oxley Act
of 2002.
|
|
|
99.1*
|
Report
of Netherland, Sewell & Associates,
Inc.
|
____________________________________
|
*
|
Filed
herewith
|
|
†
|
Management
contract or compensatory plan or arrangement required to be filed as an
exhibit hereto.
|
Signatures
Pursuant
to the requirements of Section 13 or 15(d) of the Securities Exchange Act of
1934, the registrant has duly caused this report to be signed on its behalf by
the undersigned thereunto duly authorized, on February 26, 2010.
|
ROSETTA
RESOURCES INC.
|
||
|
By:
|
/s/
Randy L. Limbacher
|
|
|
Randy
L. Limbacher, Chairman of the Board, President and
|
||
|
Chief
Executive Officer
|
||
Pursuant
to the requirements of the Securities Exchange Act of 1934, this report has been
signed below by the following persons on behalf of the registrant and in the
capacity and on the dates indicated:
|
Signature
|
Title
|
Date
|
||
|
/s/
Randy L. Limbacher
|
Chairman
of the Board, President and Chief Executive Officer
|
February
26, 2010
|
||
|
Randy
L. Limbacher
|
(Principal
Executive Officer)
|
|||
|
/s/
Michael J. Rosinski
|
Executive
Vice President and Chief Financial Officer
|
February
26, 2010
|
||
|
Michael
J. Rosinski
|
(Principal
Financial Officer)
|
|||
|
/s/
W. Rufus Estis
|
Vice
President, Controller
|
February
26, 2010
|
||
|
W.
Rufus Estis
|
(Principal
Accounting Officer)
|
|||
|
/s/
D. Henry Houston
|
Lead Director
|
February
26, 2010
|
||
|
D.
Henry Houston
|
||||
|
/s/
Richard W. Beckler
|
Director
|
February
26, 2010
|
||
|
Richard
W. Beckler
|
||||
|
/s/
Matt Fitzgerald
|
Director
|
February
26, 2010
|
||
|
Matt
Fitzgerald
|
||||
|
/s/
Philip L. Frederickson
|
Director
|
February
26, 2010
|
||
|
Philip
L. Frederickson
|
||||
|
/s/
Josiah O. Low, III
|
Director
|
February
26, 2010
|
||
|
Josiah
O. Low, III
|
||||
|
/s/
Donald D. Patteson, Jr.
|
Director
|
February
26, 2010
|
||
|
Donald
D. Patteson, Jr.
|
Glossary
of Oil and Natural Gas Terms
We are in
the business of exploring for and producing oil and natural gas. Oil and natural
gas exploration is a specialized industry. Many of the terms used to describe
our business are unique to the oil and natural gas industry. The following is a
description of the meanings of some of the oil and natural gas industry terms
used in this report.
3-D
Seismic. (Three-Dimensional Seismic Data) Geophysical data
that depicts the subsurface strata in three dimensions. 3-D seismic data
typically provides a more detailed and accurate interpretation of the subsurface
strata than two-dimensional seismic data.
Amplitude.
The difference between the maximum displacement of a seismic wave and the point
of no displacement, or the null point.
(Amplitude plays)
anomalies. An abrupt increase in seismic amplitude that can in some
instances indicate the presence of hydrocarbons.
Analogous
reservoir. Analogous reservoirs, as used in resource
assessments, have similar rock and fluid properties, reservoir conditions
(depth, temperature, and pressure) and drive mechanisms, but are typically at a
more advanced stage of development than the reservoir of interest and thus may
provide concepts to assist in the interpretation of more limited data and
estimation of recovery. When used to support proved reserves,
analogous reservoir refers to a reservoir that shares all of the following
characteristics with the reservoir of interest: (i) the same geological
formation (but not necessarily in pressure communication with the reservoir of
interest; (ii) the same environment of deposition; (iii) similar geologic
structure; and (iv) the same drive mechanism.
Anticline.
An arch-shaped fold in rock in which layers are upwardly convex, often forming a
hydrocarbon trap. Anticlines may form hydrocarbon traps, particularly in folds
with reservoir-quality rocks in their core and impermeable seals in the outer
layers of the fold.
Bbl. One
stock tank barrel, or 42 U.S. gallons liquid volume, of oil or other liquid
hydrocarbons.
Bcf.
Billion cubic feet of natural gas.
Bcfe.
Billion cubic feet equivalent determined using the ratio of six Mcf of natural
gas to one Bbl of crude oil, condensate or natural gas liquids.
Behind Pipe
Pays. Reserves expected to be recovered from zones in existing wells,
which will require additional completion work or future recompletion prior to
the start of production.
Block. A
block depicted on the Outer Continental Shelf Leasing and Official Protraction
Diagrams issued by the U.S. Minerals Management Service or a similar depiction
on official protraction or similar diagrams, issued by a state bordering on the
Gulf of Mexico.
Btu or British
thermal unit. The quantity of heat required to raise the temperature of
one pound of water by one degree Fahrenheit.
Coalbed
methane. Coal is a carbon-rich sedimentary rock that forms from the
remains of plants deposited as peat in swampy environments. Natural gas
associated with coal, called coal gas or coalbed methane, can be produced
economically from coal beds in some areas.
Completion.
The installation of permanent equipment for the production of oil or natural
gas.
Deterministic
estimate. The method of estimating reserves or resources is
called deterministic when a single value for each parameter (from the
geoscience, engineering or economic data) in the reserves calculation is used in
the reserves estimation procedure.
Developed
acreage. The number of acres that are allocated or assignable to
productive wells or wells capable of production.
Developed oil and
gas reserves. Developed oil and gas reserves are reserves of any category
that can be expected to be recovered: (i) through existing wells with
existing equipment and operating methods or in which the cost of the related
equipment is relatively minor compared to the cost of a new well; and (ii)
through installed extraction equipment and infrastructure operational at the
time of the reserves estimate if the extraction is by means not involving a
well.
Development
project. A development project is the means by which petroleum
resources are brought to the status of economically producible. As
examples, the development of a single reservoir or field, an incremental
development in a producing field or the integrated development of a group of
several fields and associated facilities with a common ownership may constitute
a development project.
Development
well. A well drilled within the proved boundaries of an oil or natural
gas reservoir with the intention of completing the stratigraphic horizon known
to be productive.
Dry hole.
A well found to be incapable of producing hydrocarbons in sufficient quantities
such that proceeds from the sale of such production exceeds production expenses
and taxes.
Dry hole
costs. Costs incurred in drilling a well, assuming a well is not
successful, including plugging and abandonment costs.
Economically
producible. The term economically producible, as it relates to
a resource, means a resource that generates revenue that exceeds, or is
reasonably expected to exceed, the costs of the operation. The value
of the products that generate revenue shall be determined at the terminal point
of oil and gas producing activities.
Estimated
ultimate recovery. Estimated ultimate recovery is the sum of
reserves remaining as of a given date and cumulative production as of that
date.
Exploitation. Optimizing
oil and gas production from producing properties or establishing additional
reserves in producing areas through additional drilling or the application of
new technology.
Exploratory
well. A well drilled to find and produce oil or natural gas reserves not
classified as proved, to find a new reservoir in a field previously found to be
productive of oil or natural gas in another reservoir or to extend a known
reservoir.
Fault. A
break or planar surface in brittle rock across which there is observable
displacement.
Faulted
downthrown rollover anticline. An arch-shaped fold in rock in which the
convex geological structure is tipped as opposed to perpendicular to the ground
and in which a visible break or displacement has occurred in brittle rock, often
forming a hydrocarbon trap.
Field. An
area consisting of either a single reservoir or multiple reservoirs all grouped
on or related to the same individual geological structural feature and/or
stratigraphic condition.
Finding and
development costs. Capital costs incurred in the acquisition,
exploration, development and revisions of proved oil and natural gas reserves
divided by proved reserve additions.
Fracing or
fracture stimulation technology. The technique of improving a well’s
production or injection rates by pumping a mixture of fluids into the formation
and rupturing the rock, creating an artificial channel. As part of this
technique, sand or other material may also be injected into the formation to
keep the channel open, so that fluids or natural gases may more easily flow
through the formation.
Gas. Natural
gas.
Gross acres or
gross wells. The total acres or wells, as the case may be, in which a
working interest is owned.
Horizontal
drilling. A drilling operation in which a portion of the well is drilled
horizontally within a productive or potentially productive formation. This
operation usually yields a well that has the ability to produce higher volumes
than a vertical well drilled in the same formation.
Hydrocarbon
indicator. A type of seismic amplitude anomaly, seismic event, or
characteristic of seismic data that can occur in a hydrocarbon-bearing
reservoir.
Infill well.
A well drilled between known producing wells to better exploit the
reservoir.
Injection well or
injection. A well which is used to place liquids or natural gases into
the producing zone during secondary/tertiary recovery operations to assist in
maintaining reservoir pressure and enhancing recoveries from the
field.
Lease operating
expenses. The expenses of lifting oil or natural gas from a producing
formation to the surface, constituting part of the current operating expenses of
a working interest, and also including labor, superintendence, supplies,
repairs, short-lived assets, maintenance, allocated overhead costs, workover, ad
valorem taxes, insurance and other expenses incidental to production, but
excluding lease acquisition or drilling or completion expenses.
MBbls.
Thousand barrels of crude oil or other liquid hydrocarbons.
Mcf.
Thousand cubic feet of natural gas.
Mcfe.
Thousand cubic feet equivalent determined using the ratio of six Mcf of natural
gas to one Bbl of oil, condensate or natural gas liquids.
MMBbls.
Million barrels of oil or other liquid hydrocarbons.
MMBtu.
Million British Thermal Units.
MMcf.
Million cubic feet of natural gas.
MMcfe.
Million cubic feet equivalent determined using the ratio of six Mcf of
natural gas to one Bbl of oil, condensate or natural gas liquids.
MMcfe/d.
MMcfe per day.
Net acres or net
wells. The sum of the fractional working interests owned in gross acres
or wells, as the case may be.
Nonoperated
working interests. The working interest or fraction thereof in a lease or
unit, the owner of which is without operating rights by reason of an operating
agreement.
NYMEX. New
York Mercantile Exchange.
Operated working
interests. Where the working interests for a property are co-owned, and
where more than one party elects to participate in the development of a lease or
unit, there is an operator designated “for full control of all operations within
the limits of the operating agreement” for the development and production of the
wells on the co-owned interests. The working interests of the operating party
become the “operated working interests.”
Pay. A
reservoir or portion of a reservoir that contains economically producible
hydrocarbons. The overall interval in which pay sections occur is the
gross pay; the smaller portions of the gross pay that meet local criteria for
pay (such as a minimum porosity, permeability and hydrocarbon saturation) are
net pay.
Payout.
Generally refers to the recovery by the incurring party of its costs of
drilling, completing, equipping and operating a well before another party’s
participation in the benefits of the well commences or is increased to a new
level.
Permeability.
The ability, or measurement of a rock’s ability, to transmit fluids, typically
measured in darcies or millidarcies. Formations that transmit fluids readily are
described as permeable and tend to have many large, well-connected
pores.
Porosity.
The percentage of pore volume or void space, or that volume within rock that can
contain fluids.
PV-10 or present
value of estimated future net revenues. An estimate of the present value
of the estimated future net revenues from proved oil and natural gas reserves at
a date indicated after deducting estimated production and ad valorem taxes,
future capital costs and operating expenses, but before deducting any estimates
of federal income taxes. The estimated future net revenues are discounted at an
annual rate of 10%, in accordance with the Securities and Exchange Commission’s
practice, to determine their “present value.” The present value is shown to
indicate the effect of time on the value of the revenue stream and should not be
construed as being the fair market value of the properties. Estimates of future
net revenues are made using oil and natural gas prices and operating costs at
the date indicated and held constant for the life of the reserves.
Probabilistic
estimate. The method of estimation of reserves or resources is
called probabilistic when the full range of values that could reasonably occur
for each unknown parameter (from the geoscience and engineering data) is used to
generate a full range of possible outcomes and their associated probabilities of
occurrence.
Productive
well. A well that is producing or is capable of production, including
natural gas wells awaiting pipeline connections to commence deliveries and oil
wells awaiting connection to production facilities.
Prospect.
A specific geographic area which, based on supporting geological, geophysical or
other data and also preliminary economic analysis using reasonably anticipated
prices and costs, is deemed to have potential for the discovery of commercial
hydrocarbons.
Proved oil and
gas reserves or Proved reserves. Proved oil and gas reserves
are those quantities of oil and natural gas, which, by analysis of geoscience
and engineering data, can be estimated with reasonable certainty to be
economically producible from a given date forward, from known reservoirs, and
under existing economic conditions, operating methods, and government regulation
prior to the time at which contracts providing the right to operate expire,
unless evidence indicates that renewal is reasonably certain, regardless of
whether deterministic or probabilistic methods are used for
estimation. The project to extract the hydrocarbons must have
commenced, or the operator must be reasonably certain that it will commence the
project, within a reasonable time.
The area
of the reservoir considered as proved includes all of the following: (i) the
area identified by drilling and limited by fluid contacts, if any; and (ii)
adjacent undrilled portions of the reservoir that can, with reasonable
certainty, be judged to be continuous with it and to contain economically
producible oil and gas on the basis of available geoscience and engineering
data.
In the
absence of data on fluid contacts, proved quantities in a reservoir are limited
by the lowest known hydrocarbons as seen in a well penetration unless
geoscience, engineering or performance data and reliable technology establish a
lower contact with reasonable certainty. Where direct observation
from well penetrations has defined a highest known oil elevation and the
potential exists for an associated gas cap, proved oil reserves may be assigned
in the structurally higher portions of the reservoir only if geoscience,
engineering or performance data and reliable technology establish the higher
contact with reasonable certainty.
Reserves
which can be produced economically through application of improved recovery
techniques (including, but not limited to, fluid injection) are included in the
proved classification when: (i) successful testing by a pilot project in an area
of the reservoir with properties no more favorable than in the reservoir as a
whole, the operation of an installed program in the reservoir or an analogous
reservoir or other evidence using reliable technology establishes the reasonable
certainty of the engineering analysis on which the project or program was based;
and (ii) the project has been approved for development by all necessary parties
and entities, including governmental entities.
Existing
economic conditions include prices and costs at which economic producibility
from a reservoir is to be determined. The price shall be the
twelve-month first day of the month historical average price during the
twelve-month period prior to the ending date of the period covered by the
report, determined as an unweighted arithmetic average of the
first-day-of-the-month price for each month within such period, unless prices
are defined by contractual arrangements, excluding escalations based upon future
conditions.
Proved
undeveloped reserves. Proved undeveloped oil and gas reserves are
reserves that are expected to be recovered from new wells on undrilled acreage,
or from existing wells where a relatively major expenditure is required for
recompletion. Reserves on undrilled acreage are limited to those drilling units
offsetting productive units that are reasonably certain of production when
drilled. Proved reserves for other undrilled units are claimed only where it can
be demonstrated with certainty that there is continuity of production from the
existing productive formation. Estimates for proved undeveloped reserves will
not be attributable to any acreage for which an application of fluid injection
or other improved recovery technique is contemplated, unless such techniques
have been proved effective by actual tests in the area and in the same
reservoir.
Proved reserve
additions. The sum of additions to proved reserves from
extensions, discoveries, improved recovery, acquisitions and revisions of
previous estimates.
Reasonable
certainty. If deterministic methods are used, reasonable
certainty means a high degree of confidence that the quantities will be
recovered. If probabilistic methods are used, there should be at
least a 90% probability that the quantities actually recovered will equal or
exceed the estimate. A high degree of confidence exists if the
quantity is much more likely to be achieved than not, and, as changes due to
increased availability of geoscience (geological, geophysical and geochemical),
engineering and economic data are made to estimated ultimate recovery with time,
reasonably certain estimated ultimate recovery is much more likely to increase
or remain constant than to decrease.
Reliable
technology. Reliable technology is a grouping of one or more
technologies (including computational methods) that has been field tested and
has been demonstrated to provide reasonably certain results with consistency and
repeatability in the formation being evaluated or in an analogous
formation.
Reserves. Reserves
are estimated remaining quantities of oil and gas and related substances
anticipated to be economically producible, as of a given date, by application of
development projects to known accumulations. In addition, there must
exist, or there must be a reasonable expectation that there will exist, the
legal right to produce or a revenue interest in the production, installed means
of delivering oil and gas or related substances to market and all permits and
financing required to implement the project.
Reserve
additions. Changes in proved reserves due to revisions of
previous estimates, extensions, discoveries, improved recovery and other
additions and purchases of reserves in-place.
Reserve life
index. This index is calculated by dividing year-end reserves by the
average production during the past year to estimate the number of years of
remaining production.
Reservoir.
A porous and permeable underground formation containing a natural accumulation
of producible oil and/or natural gas that is confined by impermeable rock or
water barriers and is individual and separate from other
reservoirs.
Resources. Resources
are quantities of oil and gas estimated to exist in naturally occurring
accumulations. A portion of the resources may be estimated to be
recoverable and another portion may be considered
unrecoverable. Resources include both discovered and undiscovered
accumulations.
Secondary
recovery. An artificial method or process used to restore or increase
production from a reservoir after the primary production by the natural
producing mechanism and reservoir pressure has experienced partial depletion.
Natural gas injection and waterflooding are examples of this
technique.
Shelf.
Areas in the Gulf of Mexico with depths less than 1,300 feet. Our shelf area and
operations also includes a small amount of properties and operations in the
onshore and bay areas of the Gulf Coast.
Stratigraphy.
The study of the history, composition, relative ages and distribution of layers
of the earth’s crust.
Stratigraphic
trap. A sealed geologic container capable of retaining hydrocarbons that
was formed by changes in rock type or pinch-outs, unconformities, or sedimentary
features such as reefs.
Tcf.
Trillion cubic feet of natural gas.
Tcfe.
Trillion cubic feet equivalent determined using the ratio of six Mcf of natural
gas to one Bbl of oil, condensate or natural gas liquids.
Trap. A
configuration of rocks suitable for containing hydrocarbons and sealed by a
relatively impermeable formation through which hydrocarbons will not
escape.
Undeveloped
acreage. Lease acreage on which wells have not been drilled or completed
to a point that would permit the production of commercial quantities of oil or
natural gas regardless of whether or not such acreage contains proved
reserves.
Undeveloped oil
and gas reserves or Undeveloped reserves. Undeveloped oil and
gas reserves are reserves of any category that are expected to be recovered from
new wells on undrilled acreage, or from existing wells where a relatively major
expenditure is required for recompletion. Reserves on undrilled
acreage shall be limited to those directly offsetting development spacing areas
that are reasonably certain of production when drilled, unless evidence using
reliable technology exists that establishes reasonable certainty of economic
producibility at greater distances. Undrilled locations can be
classified as having undeveloped reserves only if a development plan has been
adopted indicating that they are scheduled to be drilled within five years,
unless the specific circumstances justify a longer time. Under no
circumstances shall estimates for undeveloped reserves be attributable to any
acreage for which an application of fluid injection or other improved recovery
technique is contemplated, unless such techniques have been proved effective by
actual projects in the same reservoir or an analogous reservoir, or by other
evidence using reliable technology establishing reasonable
certainty.
Waterflooding.
A secondary recovery operation in which water is injected into the producing
formation in order to maintain reservoir pressure and force oil toward and into
the producing wells.
Working
interest. The operating interest that gives the owner the right to drill,
produce and conduct operating activities on the property and receive a share of
production.
Workover.
The repair or stimulation of an existing production well for the purpose of
restoring, prolonging or enhancing the production of hydrocarbons.
Workover
rig. A portable rig used to repair or adjust downhole equipment on an
existing well.
/d. “Per
day” when used with volumetric units or dollars.
Index
to Exhibits
|
Exhibit
Number
|
Description
|
|
|
3.1
|
Certificate
of Incorporation (incorporated herein by reference to Exhibit 3.1 to the
Company’s Registration Statement on Form S-1 filed on October 7, 2005
(Registration No. 333-128888)).
|
|
|
3.2
|
Amended
and Restated Bylaws (incorporated herein by reference to Exhibit 3.2 to
the Company’s Current Report on Form 8-K filed on December 10, 2008
(Registration No. 000-51801)).
|
|
|
4.1
|
Registration
Rights Agreement (incorporated herein by reference to Exhibit 4.1 to the
Company’s Registration Statement on Form S-1 filed on October 7, 2005
(Registration No. 333-128888)).
|
|
|
10.1
|
Purchase
and Sale Agreement with Calpine Corporation, Calpine Gas Holdings, L.L.C.
and Calpine Fuels Corporation (incorporated herein by reference to Exhibit
10.1 to the Company’s Registration Statement on Form S-1 filed on October
7, 2005 (Registration No. 333-128888)).
|
|
|
10.2
|
Transfer
and Assumption Agreements with Calpine Corporation and Subsidiaries of
Rosetta Resources Inc. (incorporated herein by reference to Exhibit 10.2
to the Company’s Registration Statement on Form S-1 filed on October 7,
2005 (Registration No. 333-128888)).
|
|
|
10.3
|
Settlement
Agreement and Amendment with Calpine Corporation (incorporated herein by
reference to Exhibit 10.3 to the Company’s Annual Report on Form 10-K
filed on March 2, 2009 (Registration No. 000-51801)).
|
|
|
10.4
|
Amended
and Restated Base Contract for Sale and Purchase of Natural Gas with
Calpine Energy Services, L.P. (incorporated herein by reference to Exhibit
10.4 to the Company’s Annual Report on Form 10-K filed on March 2, 2009
(Registration No. 000-51801)).
|
|
|
10.5
|
Services
Agreement with Calpine Producer Services, L.P. (incorporated herein by
reference to Exhibit 10.5 to the Company’s Registration Statement on Form
S-1 filed on October 7, 2005 (Registration No.
333-128888)).
|
|
|
10.9
†
|
Amended
and Restated 2005 Long-Term Incentive Plan (incorporated herein by
reference to Exhibit 10.9 to the Company’s Annual Report on Form 10-K
filed on March 2, 2009 (Registration No. 000-51801)).
|
|
|
10.10
†
|
Form
of Option Grant Agreement (incorporated herein by reference to Exhibit
10.10 to the Company’s Registration Statement on Form S-1 filed on October
7, 2005 (Registration No. 333-128888)).
|
|
|
10.11
†
|
Form
of Restricted Stock Agreement (incorporated herein by reference to Exhibit
10.11 to the Company’s Registration Statement on Form S-1 filed on October
7, 2005 (Registration No. 333-128888)).
|
|
|
10.12
†
|
Form
of Bonus Restricted Stock Agreement (incorporated herein by reference to
Exhibit 10.12 to the Company’s Registration Statement on Form S-1 filed on
October 7, 2005 (Registration No. 333-128888)).
|
|
|
10.18
|
Amended
and Restated Senior Revolving Credit Agreement (incorporated herein by
reference to Exhibit 10.18 to the Company’s Current Report on Form 8-K
filed on April 15, 2009 (Registration No. 000-51801)).
|
|
|
10.19
|
Amended
and Restated Second Lien Term Loan Agreement (incorporated herein by
reference to Exhibit 10.19 to the Company’s Current Report on Form 8-K
filed on April 15, 2009 (Registration No. 000-51801)).
|
|
|
10.20
|
Guarantee
and Collateral Agreement (incorporated herein by reference to Exhibit
10.20 to the Company’s Registration Statement on Form S-1 filed on October
7, 2005 (Registration No. 333-128888)).
|
|
|
10.21
|
Second
Lien Guarantee and Collateral Agreement (incorporated herein by reference
to Exhibit 10.21 to the Company’s Registration Statement on Form S-1 filed
on October 7, 2005 (Registration No. 333-128888)).
|
|
|
10.24
|
First
Amendment to Guarantee and Collateral Agreement (incorporated herein by
reference to Exhibit 10.24 to the Company’s Registration Statement on Form
S-1 filed on October 7, 2005 (Registration No.
333-128888)).
|
|
|
10.25
|
First
Amendment to Second Lien Guarantee and Collateral Agreement (incorporated
herein by reference to Exhibit 10.25 to the Company’s Registration
Statement on Form S-1 filed on October 7, 2005 (Registration No.
333-128888)).
|
|
10.26
|
Deposit
Account Control Agreement (incorporated herein by reference to Exhibit
10.26 to the Company’s Registration Statement on Form S-1 filed on October
7, 2005 (Registration No. 333-128888)).
|
|
|
10.31
†
|
Amended
and Restated Employment Agreement with Randy L. Limbacher
(incorporated herein by reference to Exhibit 10.31 to the Company’s Annual
Report on Form 10-K filed on March 2, 2009 (Registration No.
000-51801)).
|
|
|
10.32
†
|
Amended
and Restated Employment Agreement with Michael J. Rosinski (incorporated
herein by reference to Exhibit 10.32 to the Company’s Annual Report on
Form 10-K filed on March 2, 2009 (Registration No.
000-51801)).
|
|
|
10.33
†
|
Amended
Employment Agreement with Charles S. Chambers (incorporated herein by
reference to Exhibit 10.3 to Quarterly Report on Form 10-Q filed on
November 9, 2007).
|
|
|
10.34
|
Partial
Transfer and Settlement Agreement with Calpine Corporation (incorporated
herein by reference to Exhibit 10.4 to Quarterly Report on Form 10-Q filed
on November 9, 2007).
|
|
|
10.35
|
Marketing
and Related Services Agreement with Calpine Natural Gas Services, L.P.
(incorporated herein by reference to Exhibit 10.5 to Form 10-Q filed on
November 9, 2007).
|
|
|
10.36
†
|
Indemnification
Agreement with Directors and Officers (incorporated herein by reference to
Exhibit 10.36 to the Company’s Annual Report on Form 10-K filed on March
2, 2009 (Registration No. 000-51801)).
|
|
|
10.37
†
|
Amended and
Restated Employment Agreement with Michael H. Hickey
(incorporated herein by reference to Exhibit 10.37 to the Company’s Annual
Report on Form 10-K filed on March 2, 2009 (Registration No.
000-51801)).
|
|
|
10.38
†
|
Amended
and Restated Employment Agreement with Edward E. Seeman (incorporated
herein by reference to Exhibit 10.38 to Form 10-K filed February 29,
2008).
|
|
|
10.39
†
|
2005
Long-Term Incentive Plan Performance Share Unit Award Agreement
(incorporated herein by reference to Exhibit 10.39 to the Company’s Annual
Report on Form 10-K filed on March 2, 2009 (Registration No.
000-51801)).
|
|
|
10.40
†
|
Executive
Employee Change of Control Plan (incorporated herein by reference to
Exhibit 10.40 to the Company’s Annual Report on Form 10-K filed on March
2, 2009 (Registration No. 000-51801)).
|
|
|
10.41
†
|
Executive
Employee Severance Plan (incorporated herein by reference to Exhibit 10.41
to the Company’s Annual Report on Form 10-K filed on March 2, 2009
(Registration No. 000-51801)).
|
|
|
10.42 †*
|
Executive
Employee Change of Control Plan
|
|
|
10.44
|
First
Amendment dated October 22, 2009 to Amended and Restated Senior Revolving
Credit Agreement (incorporated herein by reference to Exhibit 10.44 to the
Company’s Quarterly Report on Form 10-Q filed on November 6, 2009
(Registration No. 000-51801)).
|
|
|
10.45
|
First
Amendment dated October 22, 2009 to Amended and Restated Second Lien Term
Loan Agreement (incorporated herein by reference to Exhibit 10.45 to the
Company’s Quarterly Report on Form 10-Q filed on November 6, 2009
(Registration No. 000-51801)).
|
|
|
21.1*
|
Subsidiaries
of the registrant
|
|
|
23.1*
|
Consent
of PricewaterhouseCoopers LLP
|
|
|
23.2*
|
Consent
of Netherland, Sewell & Associates, Inc.
|
|
|
31.1*
|
Certification
of Periodic Financial Reports by Chief Executive Officer in satisfaction
of Section 302 of the Sarbanes-Oxley Act of 2002.
|
|
|
31.2*
|
Certification
of Periodic Financial Reports by Chief Financial Officer in satisfaction
of Section 302 of the Sarbanes-Oxley Act of 2002.
|
|
|
32.1*
|
Certification
of Periodic Financial Reports by Chief Executive Officer and Chief
Financial Officer in satisfaction of Section 906 of the Sarbanes-Oxley Act
of 2002.
|
|
99.1*
|
Report
of Netherland, Sewell & Associates,
Inc.
|
|
*
|
Filed
herewith
|
|
†
|
Management
contract or compensatory plan or arrangement required to be filed as an
exhibit hereto.
|
92