Attached files
| file | filename |
|---|---|
| 8-K - FORM 8-K - FreightCar America, Inc. | d819509d8k.htm |
 November
2014 Exhibit 99.1 |
 Forward-Looking Statements
2
This presentation contains statements relating to our expected financial performance
and/or future business prospects, events and plans that are “forward-looking
statements” as defined under the Private Securities Litigation Reform Act of
1995. Forward-looking statements represent our estimates and assumptions only
as of the date of this presentation. Our actual results may differ materially from the
results described in or anticipated by our forward-looking statements due to certain
risks and uncertainties. These potential risks and uncertainties include, among other
things: the cyclical nature of our business; adverse economic and market conditions;
fluctuating costs of raw materials, including steel and aluminum, and delays in the
delivery of raw materials; our ability to maintain relationships with our suppliers of
railcar components; our reliance upon a small number of customers that represent a large
percentage of our sales; the variable purchase patterns of our customers and the timing
of completion, delivery and customer acceptance of orders; the highly competitive nature
of our industry; the risk of lack of acceptance of our new railcar offerings by our
customers; and the additional risk factors described in our filings with the Securities
and Exchange Commission. We expressly disclaim any duty to provide updates to any
forward-looking statements made in this presentation, whether as a result of new
information, future events or otherwise. |
 About Us
Diverse business model —
manufacturing, leasing, services
Full range of railcar types, excluding tank cars
Industry leader in coal cars
Manufacturing facilities in Cherokee, Alabama (Shoals);
Roanoke, Virginia; and Danville, Illinois
Scalable and flexible operations
3 |
 Investment
Highlights New and redesigned products have provided growth
opportunities and expanded access to a $2.7 billion annual
railcar delivery market (excluding tank cars)*
Robust environment for broad range of freight cars
Coal car market leader
International growth opportunities
Q3 2014 backlog (railcar units) up 90% over prior year
YTD 2014 revenues and EPS up significantly over 2013
Strong balance sheet with no debt
* Based on Company estimates using 2014 industry data
4 |
 Diversified
Business Model 5
Coal Cars
Other Open
Top Hoppers
and
Gondolas
Covered
Hoppers
Boxcars
Intermodal
Cars
Non-
Intermodal
Flat Cars
Manufacturing
Parts Sales
Maintenance
and Repair
Services
Leasing |
 Diverse Customer
Base Railroads
Shippers
6
Financial Institutions |
 Freight
Cars Intermodal
Covered Hoppers
7
Cement
Frac sand
Grain and DDG
Potash and soda ash
Food-grade service
Plastic pellets
Trucking industry issues drive
modal shifts
o
Driver shortages
o
Highway congestion
Expansion of Panama Canal
Cost savings opportunities for
shippers |
 Select Other
Freight Cars Bulkhead Flat
8
World Class Engineering Capabilities
Hybrid Aggregate Hopper
66-Foot Mill Gondola
Steel Aggregate Hopper |
 Leader in Coal
Cars Aluminum Coal Car
Stainless Steel/Hybrid Coal Car
Aluminum
58% of total North American coal cars
Primarily Western service
Demand driven by electricity
generation and industrial production
Relatively young fleet; not expected to
see meaningful demand for some time
Steel
42% of total North American coal cars
Primarily Eastern service
Demand driven by replacement of
aging fleet
Replacement cycle will continue over
long term
9 |
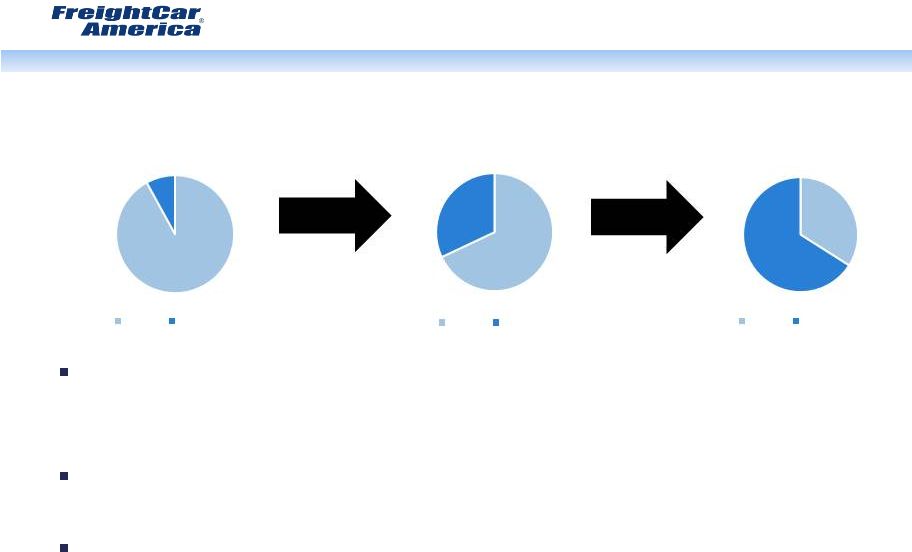 Diversification
Strategy - Manufacturing
Investment in Shoals facility and new product development led to
successful transition from reliance on coal cars to near-full range of
freight car types
Provides growth opportunities in strong covered hopper, intermodal
and other freight car markets
Diversification can reduce revenue and earnings volatility while
maintaining position as premier coal car manufacturer
10
92%
8%
2008-2012 Avg.
(Units Delivered)
Coal
Non-Coal
68%
32%
2013
(Units Delivered)
34%
66%
Q3 2014 Backlog
(Units)
Coal
Non-Coal
Coal
Non-Coal |
 Footprint
– Shoals Facility
State-of-the-art facility subleased
February 2013
On line July 2013
Initial build-out completed June
2014
New line to be added in Q2 2015
Proximity to key suppliers
Flexible manufacturing capacity for
a wide variety of freight cars
Primary facility for non-coal cars
11 |
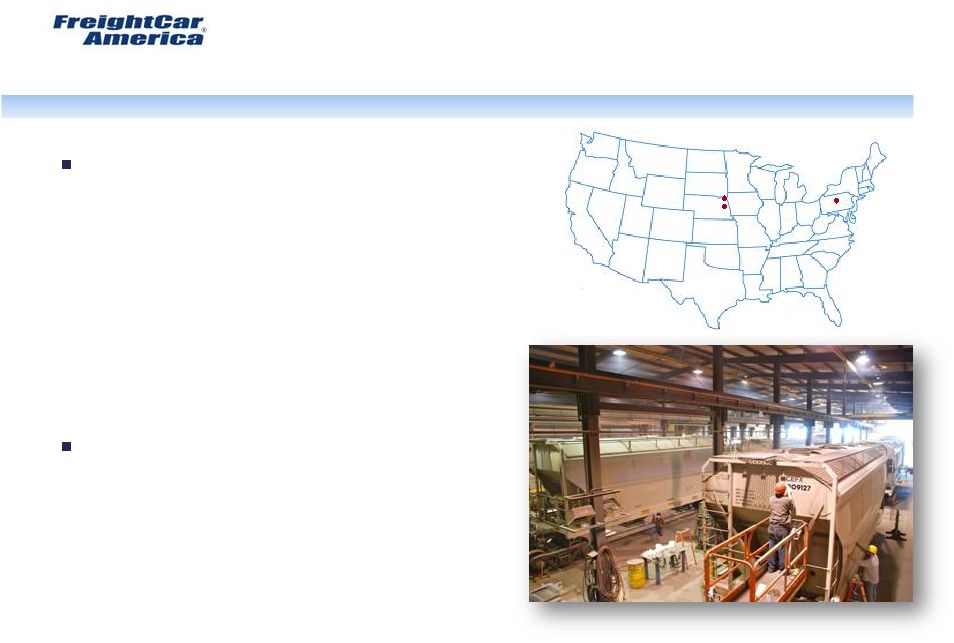
 Footprint
– Roanoke and
Danville Facilities
Primary facilities for coal
car manufacturing
Scalable and flexible
work force
Low fixed costs
12 |
 Footprint
– Services
2 railcar maintenance and
repair facilities
•
Strategically located on high-
volume corridors
•
Servicing coal and other car types
•
Routine maintenance, regulatory
programs, car modifications and
rebuilds
Parts sales for variety of car
types
•
2 warehouses serving high-volume
Powder River Basin and East Coast
corridors
Grand Island, NE
Hastings, NE
Johnstown,
PA
13 |
 Freight Car
Market Overview Growing freight car market
•
Greater demand to support growing
North American energy market
•
Intermodal is the second largest
category for loadings and revenues
for railroads
•
Increasing North American
consumption and expansion of
Panama Canal
•
Higher demand for environmental
compliance and construction
aggregates
•
Strengthening covered hopper
market
•
Slower railroad speeds
14 |
 Coal Car Market
Overview Currently, coal constitutes 20% of
loadings and gross revenues and 40% of
tonnage for U.S. Class I railroads
Near term, coal car demand is challenged
Long-term opportunities
15
•
Coal projected to account for at least 32%
of the US’s electricity generation through 2040
•
U.S. coal production forecasted to
grow modestly through 2040
•
Approximately 1/4 of the estimated 240,000 coal
cars in service are 30+ years in age |
 Railcar
Industry Delivery Forecast
†
Strong market demand has
tightened industry capacity
Strong 3-year CAGR
projections (2013-2016)
•
Open-Top Hoppers +79%
•
Intermodal +53%
•
Gondolas +39%
•
Covered Hoppers +25%
16
†
September 2014 (Q3) FTR Rail Equipment Outlook
*Units, North America
0
10,000
20,000
30,000
40,000
50,000
60,000
70,000
80,000
90,000
2011
2012
2013
2014F
2015F
2016F
2017F
2018F
Box Cars
Covered Hopper
Gondolas
Flat
Cars
(Including
Intermodal)
Tank Cars
Other Cars
Open-Top Hoppers |
 Complementary
Services Diversify Revenue Mix
Increasing demand for repair
services
•
New technologies increasing frequency
of railcar repairs
•
Aging national coal car fleet will
require increasing maintenance
•
New tank car regulations could tighten
industry capacity
Less cyclical than freight car
manufacturing
Large, fragmented market*
•
Total replacement parts: $3.5B
•
Total freight car maintenance and
repair: $1.8B
•
Coal car maintenance and repair:
$500M
17
Drop Table -
Grand Island, Nebraska
* Based on Company estimates |
 International
Growth Opportunities
Global middle-class population growth, coupled with
an increasing trend toward urbanization, should
drive demand for all railcar types
Significant portion of world’s electricity needs will be
met by coal, driving rapidly expanding coal
production in countries with large reserves
•
Significant growth in global electricity demand will drive 44%
increase in coal production through 2040*
•
Railcar export potential from the U.S.
•
International railcar manufacturing opportunities
18
*USEIA International Energy Outlook 2013 |
 Growth Drivers
- Summary
Transportation industry dynamics favor rail
Long term, coal will continue to play an important role
for U.S. electricity generation
Growing freight car market due to increasing North
American consumption and higher demand for support
of energy market
Maintenance and repair is large, fragmented market
Demand for repair services increasing due to increased
frequency of railcar repairs and aging national coal car
fleet
International growth opportunities
19 |
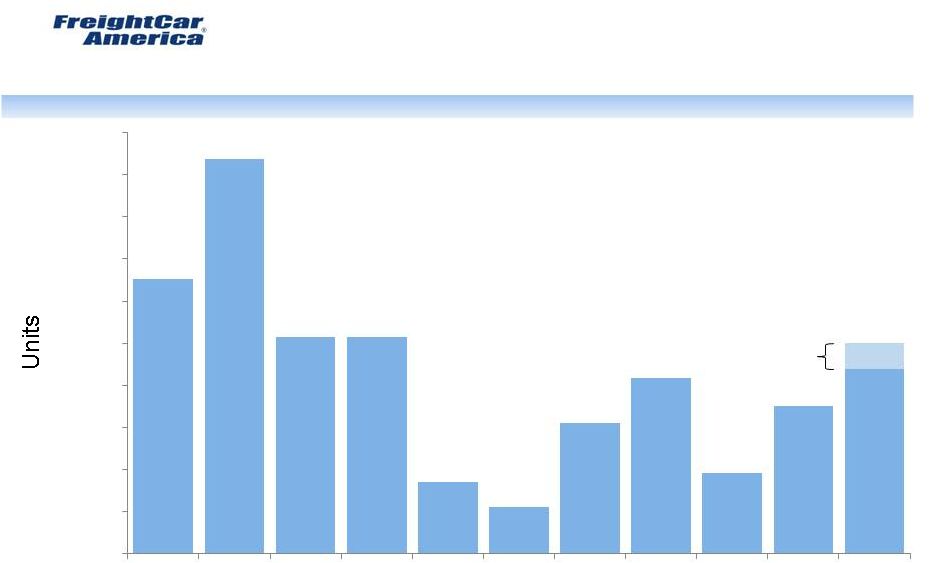 Company
Deliveries *Reflects Company estimates of full-year deliveries
20
0
2,000
4,000
6,000
8,000
10,000
12,000
14,000
16,000
18,000
20,000
2005
2006
2007
2008
2009
2010
2011
2012
2013
2014*
2015*
13,031
18,764
10,282
10,276
3,377
2,229
6,188
8,325
3,821
7,000
9,000
2015
Projected
Range
10,000 |
 Growing Company
Backlog 21
Growth reflects
diversification strategy
into non-coal cars
20,729
9,315
5,399
2,424
265
2,054
8,303
2,881
6,826
7,727
8,493
13,514
$0
$200
$400
$600
$800
$1,000
$1,200
$1,400
$1,600
0
2,000
4,000
6,000
8,000
10,000
12,000
14,000
16,000
18,000
20,000
22,000
24,000
2005
2006
2007
2008
2009
2010
2011
2012
2013
Q1
2014
Q2
2014
Q3
2014
Units
Dollar Value
Valued at $1.1 billion;
non-coal cars comprise
66% of units |
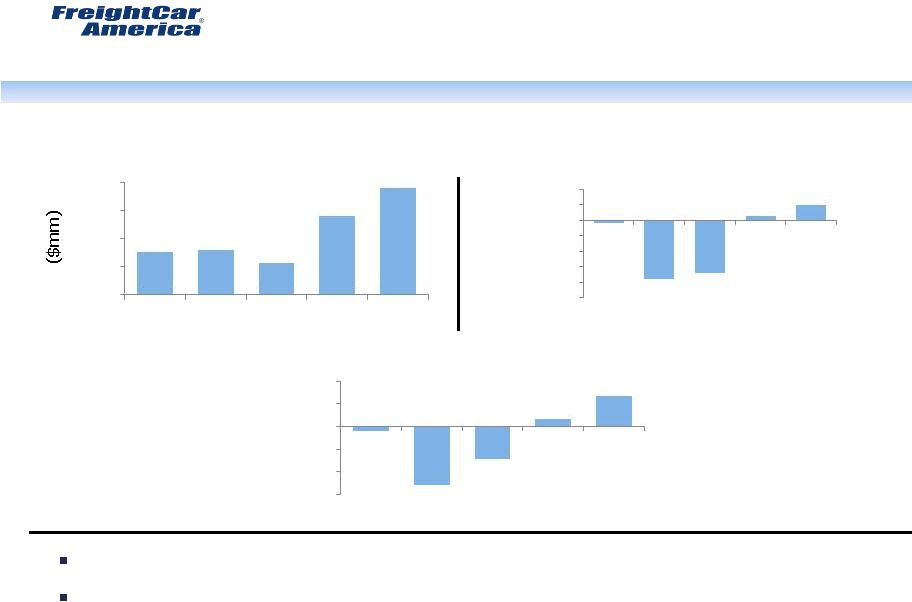
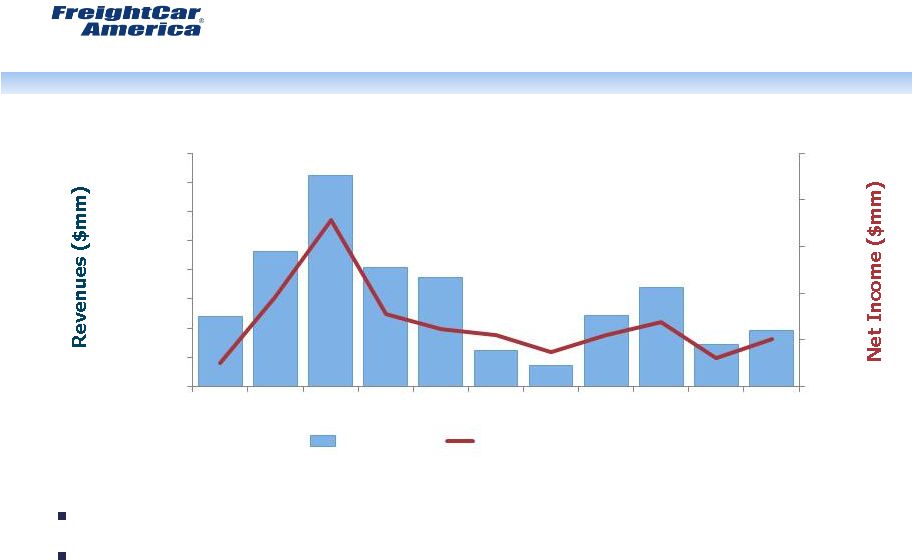 Revenue and
Earnings History Diversification strategy targets growth while mitigating
cyclicality YTD 2014 revenues and earnings up significantly over 2013
22
$482
$927
$817
$746
$249
$143
$487
$677
$290
$386
($50)
$0
$50
$100
$150
$200
$0
$200
$400
$600
$800
$1,000
$1,200
$1,400
$1,600
2004
2005
2006
2007
2008
2009
2010
2011
2012
2013
Q3
YTD
2014
Revenues
Net Income
$1,445 |
 Recent Financial
History Q3 2014 Y/Y revenue growth of 151% driven by unit growth
Q3 2014 Y/Y operating income margin improvement a result of higher unit
volume and operating leverage
23
$75.9
$79.7
$56.1
$139.7
$190.3
$0
$50
$100
$150
$200
Q3 13
Q4 13
Q1 14
Q2 14
Q3 14
Revenues
-30%
-24%
-18%
-12%
-
6%
0%
6%
12%
Q3 13
Q4 13
Q1 14
Q2 14
Q3 14
Operating Income Margin
$(0.08)
$(1.03)
$(0.58)
$0.13
$0.53
-$1.20
-$0.80
-$0.40
$0.00
$0.40
$0.80
Q3 13
Q4 13
Q1 14
Q2 14
Q3 14
EPS
-22.7%
-20.6%
1.7%
5.9%
-1.2% |
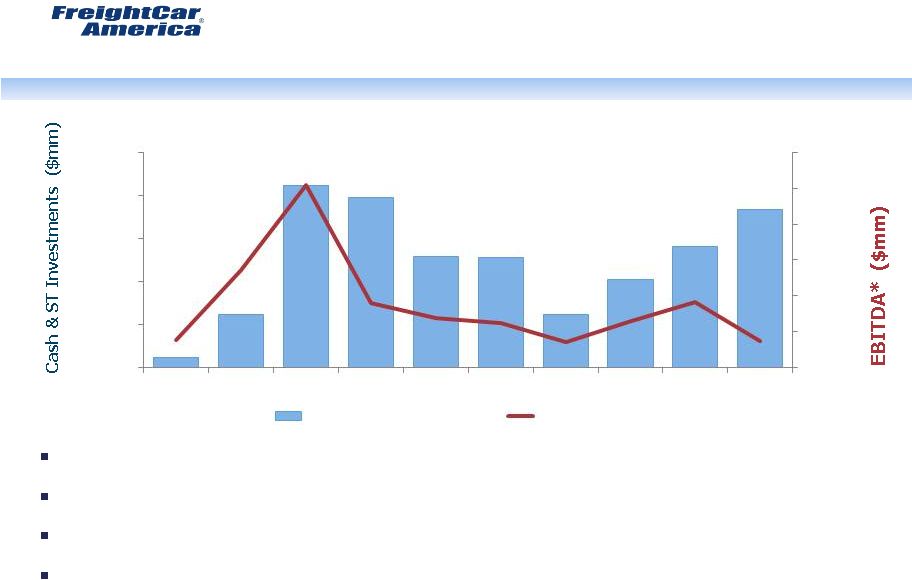 Strong Balance
Sheet Cash & short-term investments of $74 million and no debt at September 30,
2014 Strong cash position maintained to manage through industry cycles
Strict working capital management
Pension and OPEB liabilities of $64 million at end of 2013
24
*See page 27 for additional information
$11
$62
$212
$197
$129
$128
$62
$102
$140
$184
($50)
$0
$50
$100
$150
$200
$250
$0
$50
$100
$150
$200
$250
2004
2005
2006
2007
2008
2009
2010
2011
2012
2013
Cash & ST Investments
EBITDA* |
 FreightCar
America Outlook Unit delivery projections of 7,000 for 2014
Unit delivery projections between 9,000 and 10,000 for 2015
Revenue levels are dependent on manufacturing mix (new vs.
rebuild and car type)
25 |
 Growing
Shareholder Value 26
Capitalize
on
Diversified
Product
Portfolio
Maintain
Coal Car
Market
Leadership
Grow
Services
Contribution
International
Market
Opportunities
Manage
Business for
the Long
Term
Capitalize
on |
 Non-GAAP
Reconciliation EBITDA
27
($ in thousands)
2004
2005
2006
2007
2008
2009
2010
2011
2012
2013
2013
2014
Net income (loss)
($24,860)
$45,693
$128,733
$27,459
$11,420
$4,784
($12,862)
$4,939
$19,095
($19,295)
($7,008)
$1,098
Interest income
(282)
(1,225)
(5,860)
(8,349)
(3,827)
(124)
(89)
(6)
(11)
(64)
(59)
(48)
Interest expense and deferred
financing costs
14,315
11,858
658
652
677
793
965
226
384
809
481
854
Income tax provision (benefit)
(7,962)
21,762
75,530
15,389
6,769
248
(9,511)
354
13,771
(5,537)
633
252
Depreciation and amortization
7,350
7,810
5,442
3,910
4,380
5,658
7,015
8,821
8,398
10,077
7,289
7,481
EBITDA
($11,439)
$85,898
$204,503
$39,061
$19,419
$11,359
($14,482)
$14,334
$41,637
($14,010)
$1,336
$9,637
Nine months ended
September 30,
EBITDA is defined as net income (loss) before interest income, interest expense and deferred
financing costs, income tax provision (benefit) and depreciation and amortization. We
believe that EBITDA is useful to investors in evaluating our operating performance compared to that of other companies in our industry. In
addition, our management uses EBITDA to evaluate our operating performance. The calculation of
EBITDA eliminates the effects of financing, income taxes and the accounting effects of
capital spending. These items may vary for different companies for reasons unrelated to the overall operating performance of a
company’s business. EBITDA is not a financial measure presented in accordance with
GAAP. Accordingly, when analyzing our operating performance, investors should not
consider EBITDA in isolation or as a substitute for net income (loss), cash flows from operating activities or other statements of operations or cash flow
data prepared in accordance with GAAP. Our calculation of EBITDA is not necessarily comparable
to that of other similarly titled measures provided by other companies.
We recognize that the usefulness of EBITDA has certain limitations. EBITDA does not
include the provision for income taxes and, because the payment of income taxes is a
necessary element of our costs, any measure that excludes income tax expense may have material limitations. EBITDA does not include depreciation
and amortization and, because we use capital assets, depreciation and amortization expense is a
necessary element of our costs and ability to generate profits and any measure that
excludes depreciation and amortization expense may have material limitations. EBITDA does not reflect cash expenditures or future
requirements for capital expenditures or contractual commitments and does not reflect changes
in, or cash requirements for, working capital needs. We compensate for the
foregoing limitations by using EBITDA as a comparative tool, together with GAAP measures, to assist in the evaluation of our operating
performance.
|