Attached files
| file | filename |
|---|---|
| EX-32 - EX-32 - FreightCar America, Inc. | d357109dex32.htm |
| EX-31.2 - EX-31.2 - FreightCar America, Inc. | d357109dex312.htm |
| EX-31.1 - EX-31.1 - FreightCar America, Inc. | d357109dex311.htm |
| EX-23 - EX-23 - FreightCar America, Inc. | d357109dex23.htm |
| EX-21 - EX-21 - FreightCar America, Inc. | d357109dex21.htm |
| EX-10.27 - EX-10.27 - FreightCar America, Inc. | d357109dex1027.htm |
Table of Contents
UNITED STATES
SECURITIES AND EXCHANGE COMMISSION
Washington, D.C. 20549
FORM 10-K
| ☒ | ANNUAL REPORT PURSUANT TO SECTION 13 OR 15(d) OF THE SECURITIES EXCHANGE ACT OF 1934 |
For the fiscal year ended December 31, 2016
or
| ☐ | TRANSITION REPORT PURSUANT TO SECTION 13 OR 15(d) OF THE SECURITIES EXCHANGE ACT OF 1934 |
Commission file number: 000-51237
FREIGHTCAR AMERICA, INC.
(Exact name of registrant as specified in its charter)
| Delaware | 25-1837219 | |
| (State or other jurisdiction of incorporation or organization) |
(I.R.S. Employer Identification No.) | |
| Two North Riverside Plaza, Suite 1300, Chicago, Illinois | 60606 | |
| (Address of principal executive offices) | (Zip Code) | |
(800) 458-2235
(Registrant’s telephone number, including area code)
Securities registered pursuant to Section 12(b) of the Act:
| Title of class |
Name of Each Exchange on Which Registered | |
| Common stock, par value $0.01 per share | Nasdaq Global Market |
Securities registered pursuant to Section 12(g) of the Act: None
Indicate by check mark if the registrant is a well-known seasoned issuer, as defined in Rule 405 of the Securities Act. YES ☐ NO ☒
Indicate by check mark if the registrant is not required to file reports pursuant to Section 13 or Section 15(d) of the Act. YES ☐ NO ☒
Indicate by check mark whether the registrant (1) has filed all reports required to be filed by Section 13 or 15(d) of the Securities Exchange Act of 1934 during the preceding 12 months (or for such shorter period that the registrant was required to file such reports), and (2) has been subject to such filing requirements for the past 90 days. YES ☒ NO ☐
Indicate by check mark if disclosure of delinquent filers pursuant to Item 405 of Regulation S-K is not contained herein, and will not be contained, to the best of the registrant’s knowledge, in definitive proxy or information statements incorporated by reference in Part III of this Form 10-K or any amendment of this Form 10-K. ☐
Indicate by check mark whether the registrant has submitted electronically and posted on its corporate Web site, if any, every Interactive Data File required to be submitted and posted pursuant to Rule 405 of Regulation S-T (§ 232.405 of this chapter) during the preceding 12 months (or for such shorter period that the registrant was required to submit and post such files). YES ☒ NO ☐
Indicate by check mark whether the registrant is a large accelerated filer, an accelerated filer, a non-accelerated filer, or a smaller reporting company. See the definitions of “large accelerated filer”, “accelerated filer” and “smaller reporting company” in Rule 12b-2 of the Exchange Act.:
| Large accelerated filer | ☐ | Accelerated filer | ☒ | |||
| Non-accelerated filer | ☐ (Do not check if a smaller reporting company) | Smaller reporting company | ☐ | |||
Indicate by check mark whether the registrant is a shell company (as defined in Rule 12b-2 of the Act). YES ☐ NO ☒
The aggregate market value of the registrant’s common stock held by non-affiliates of the registrant as of June 30, 2016 was $169.0 million, based on the closing price of $14.05 per share on the Nasdaq Global Market.
As of February 24, 2017, there were 12,400,614 shares of the registrant’s common stock outstanding.
DOCUMENTS INCORPORATED BY REFERENCE
| Documents | Part of Form 10-K | |
| Portions of the registrant’s definitive Proxy Statement for the 2017 annual meeting of stockholders to be filed pursuant to Regulation 14A within 120 days of the end of the registrant’s fiscal year ended December 31, 2016. | Part III |
Table of Contents
FREIGHTCAR AMERICA, INC.
2
Table of Contents
OVERVIEW
We are a diversified manufacturer of railcars and railcar components. We design and manufacture a broad variety of railcar types for transportation of bulk commodities and containerized freight products primarily in North America, including open top hoppers, covered hoppers, and gondolas along with intermodal and non-intermodal flat cars. We and our predecessors have been manufacturing railcars since 1901. Over the last several years, we have introduced a number of new or redesigned railcar types as we continue to diversify our product portfolio away from coal cars. We believe we are the leading manufacturer of aluminum-bodied railcars including coal cars in North America, based on the number of railcars delivered.
Our railcar manufacturing facilities are located in Cherokee, Alabama (“Shoals”), Danville, Illinois and Roanoke, Virginia. Our Shoals facility is an important part of our long-term growth strategy as we continue to expand our railcar product and service offerings. Our Shoals facility delivered its first railcars during the fourth quarter of 2013 and additional production capacity became operational during the second quarter of 2015. Our Roanoke facility has the capacity to build a variety of railcar types in a cost effective manner and will continue to support our coal car products when market conditions improve. Our Danville facility resumed production in June 2014 after being idled for 14 months and, given the challenged coal market, operations there were again significantly curtailed in 2016. In light of the current cyclical downturn in the railcar industry and the challenged coal market, we will be idling our Danville facility for railcar production effective March 31, 2017.
We lease freight cars through our JAIX Leasing Company subsidiary. Although we continually look for opportunities to package our leased assets for sale to our leasing company partners, these leased assets may not be converted to sales, and may remain revenue producing assets into the foreseeable future. We also refurbish and rebuild railcars and sell forged, cast and fabricated parts for all of the railcars we produce, as well as those manufactured by others.
Our primary customers are railroads, shippers and financial institutions, which represented 45%, 30% and 23%, respectively, of our total sales attributable to each type of customer for the year ended December 31, 2016. In the year ended December 31, 2016, we delivered 5,559 railcars, including 43 coal cars, which compared to 8,980 railcars, including 3,395 coal cars, delivered in the year ended December 31, 2015. Our deliveries for the year ended December 31, 2016 included 227 rebuilt railcars compared to 2,600 rebuilt railcars delivered in 2015. Our total backlog of firm orders for railcars decreased from 9,840 railcars as of December 31, 2015 to 4,259 railcars as of December 31, 2016. Our backlog as of December 31, 2016 includes a variety of railcar types, all of which were orders for non-coal cars. The estimated sales value of our backlog is $419 million as of December 31, 2016.
Our Internet website is www.freightcaramerica.com. We make available, free of charge, on or through our website items related to Corporate governance, including, among other things, our Corporate governance guidelines, charters of various committees of the Board of Directors and our code of business conduct and ethics. Our annual reports on Form 10-K, quarterly reports on Form 10-Q and current reports on Form 8-K, and amendments thereto, are available on our website and on the SEC’s website at www.sec.gov. Any stockholder of our company may also obtain copies of these documents, free of charge, by sending a request in writing to Investor Relations at FreightCar America, Inc., Two North Riverside Plaza, Suite 1300, Chicago, Illinois 60606.
OUR PRODUCTS AND SERVICES
We design and manufacture a broad variety of freight cars including covered hoppers, open top hoppers, gondolas, intermodal and non-intermodal flat cars that transport numerous types of dry bulk and containerized freight products.
In the last five years, we have added 33 new or redesigned products to our portfolio, including various covered hopper car products with cubic capacities from 3,282 cubic foot to 6,250 cubic foot; 52’ and 66’ mill gondolas; coil gondolas; triple hoppers and hybrid aluminum/stainless steel railcars; ore hopper and gondola railcars; ballast hopper cars; aggregate hopper cars (with manual, independent or fully automatic transverse or longitudinal door
3
Table of Contents
systems); intermodal flats (including the 3-unit, 53-foot well cars) and non-intermodal flat cars (including slab, hot slab, ribbon rail and bulkhead flats). Focused product development activity continues in areas where we can leverage our technical knowledge base and capabilities to realize market opportunities.
The types of railcars listed below include the major types of railcars that we are capable of manufacturing; however, some of the types of railcars listed below have not been ordered by any of our customers or manufactured by us in a number of years. We rebuild railcars and sell forged, cast and fabricated parts for all of the railcars we produce, as well as those manufactured by others. Many of our railcars are produced using a patented one-piece center sill, the main longitudinal structural component of the railcar. The one-piece center sill provides a higher carrying capacity, but weighs significantly less than traditional multiple-piece center sills. In addition to railcars designed for use in North America, we have manufactured railcars for export to Latin America and the Middle East. Railroads outside of North America are constructed with a variety of track gauges that are sized differently than in North America, which requires us, in some cases, to alter our manufacturing specifications accordingly.
Any of the railcar types listed below may be further developed to meet the characteristics of the materials being transported and customer specifications.
| • | VersaFlood Hopper Cars. The VersaFlood™ product series offers versatile design options for transportation of aggregates, sand or minerals. Our VersaFlood™ series open-top hopper railcars include steel, stainless steel or hybrid steel and aluminum-bodied designs equipped with three-pocket (transverse gate) or two-pocket (longitudinal gate) discharge door systems with manual, independent or fully automatic door operation. |
| • | Covered Hopper Cars. Our covered hopper railcar product offerings encompass a wide range of cubic foot (cf) capacity designs for shipping dry bulk commodities of varying densities including: 3,282 cf covered hopper cars for cement, sand and roofing granules; 4,300 cf covered hopper cars for potash or similar commodities; 5,200 cf and 5,400 cf covered hopper cars for grain and other agricultural products; and 5,800 cf and 6,250 cf covered hopper cars for plastic pellets. |
| • | Dynastack Series. Our intermodal doublestack railcar product offerings include a stand-alone 40 foot well car, the DynaStack® articulated, 5-unit, 40 foot and the DynaStack® articulated 3-unit, 53 foot well cars for transportation of international and domestic containers. |
| • | Boxcars. Our high capacity boxcar railcar product offerings, featuring inside length of 50’ and 60’9”, double plug doors, galvanized steel roof panels and nailable steel floors, primarily designed for transporting paper products, paper rolls, lumber and wood products and foodstuffs. |
| • | Aluminum Coal Cars. The BethGon® is the leader in the aluminum-bodied coal gondola railcar segment. Since we introduced the steel BethGon railcar in the late 1970s and the aluminum BethGon railcar in 1986, the BethGon railcar has become the most widely used coal car in North America. Our current BethGon II features lighter weight, higher capacity and increased durability suitable for long-haul coal carrying railcar service. We have received several patents on the features of the BethGon II and continue to explore ways to increase the BethGon II’s capacity and reliability. |
Our aluminum bodied open-top hopper railcar, the AutoFlood™, is a five-pocket coal car equipped with a bottom discharge gate mechanism. We began manufacturing AutoFlood railcars in 1984, and introduced the AutoFlood II and AutoFlood III designs in 1996 and 2002, respectively. Both the AutoFlood II and AutoFlood III designs incorporate the automatic rapid discharge system, the MegaFlo™ door system, a patented mechanism that uses an over-center locking design, enabling the cargo door to close with tension rather than by compression. Further, AutoFlood railcars can be equipped with rotary couplers to permit rotary unloading.
| • | Stainless Steel and Hybrid Stainless Steel/Aluminum Coal Cars. We manufacture a series of stainless steel and hybrid stainless steel and aluminum AutoFlood and BethGon coal cars designed to serve the Eastern railroads. These coal cars are designed to withstand the rigors of Eastern coal transportation service. They offer a unique balance of maximized payload, light weight, efficient unloading and long service life. Our coal car product offerings include aluminum-bodied flat-bottom gondola railcars and steel or stainless steel-bodied triple hopper railcars for coal, metallurgical coke and petroleum coke service. |
4
Table of Contents
| • | Steel Products Cars. Our portfolio of railcar types also includes 52’ and 66’ mill gondola railcars used to transport steel products and scrap; slab, hot slab and coil steel railcars designed specifically for transportation of steel slabs and coil steel products, respectively. |
| • | Other Railcar Types. Our other railcar types include non-intermodal flat railcars and bulkhead flat railcars designed to transport a variety of products, including machinery and equipment, steel and structural steel components (including pipe), wood and forest products and other bulk industrial products; woodchip hopper and gondola railcars designed to haul woodchips and municipal waste or other low-density commodities; and a variety of non-coal carrying open top hopper railcars designed to carry ballast, iron ore, taconite pellets and other bulk commodities; the AVC™ Aluminum Vehicle Carrier design used to transport commercial and light vehicles (automobiles and trucks) from assembly plants and ports to rail distribution centers; and the articulated bulk container railcar designed to carry dense bulk products such as waste products in 20 foot containers. |
MANUFACTURING
We have railcar production facilities in Cherokee, Alabama, Danville, Illinois and Roanoke, Virginia. Our facilities are each certified or approved for certification by the Association of American Railroads (the “AAR”), which sets railcar manufacturing industry standards for quality control. Our Shoals manufacturing facility delivered its first railcars during the fourth quarter of 2013 and provides a solid platform from which to pursue a broad range of non-coal car business including intermodal well cars, non-intermodal flat cars and various open-top hopper, covered hopper and gondola cars. During 2015, we expanded our Shoals facility to add additional production capacity to meet demand for our new types of railcars. On February 27, 2017, we announced that our Danville facility would be idled for railcar production effective March 31, 2017.
Our manufacturing process involves four basic steps: fabrication, assembly, finishing and inspection. Each of our facilities has numerous checkpoints at which we inspect products to maintain quality control, a process that our operations management continuously monitors. In our fabrication processes, we employ standard metal working tools, many of which are computer controlled. Each assembly line typically involves 15 to 20 manufacturing positions, depending on the complexity of the particular railcar design. We use mechanical fastening in the fitting and assembly of our aluminum-bodied railcar parts, while we typically use welding for the assembly of our steel-bodied railcars. For aluminum-bodied railcars, we begin the finishing process by cleaning the railcar’s surface and then applying the decals. In the case of steel-bodied railcars, we begin the finishing process by blasting the surface area of the railcar, painting it and then applying decals. Once we have completed the finishing process, our employees, along with representatives of the customer purchasing the particular railcars, inspect all railcars for adherence to specifications.
CUSTOMERS
We have strong long-term relationships with many large purchasers of railcars. Long-term customer relationships are particularly important in the railcar industry, given the limited number of buyers of railcars.
Our customer base consists mostly of North American railroads, shippers and financial institutions. We believe that our customers’ preference for reliable, high-quality products, the relatively high cost for customers to switch manufacturers, our technological leadership in developing and enhancing innovative products and the competitive pricing of our railcars have helped us maintain our long-standing relationships with our customers.
In 2016, revenue from three customers, CIT Rail, Norfolk Southern Railway Company and ECN Capital Corporation, accounted for approximately 23%, 16% and 15%, respectively, of total revenue. In 2016, sales to our top five customers accounted for approximately 73% of total revenue. In 2015, revenue from three customers, Norfolk Southern Railway Company, CSX Transportation Inc. and CIT Rail, accounted for approximately 22%, 19% and 10%, respectively, of total revenue. In 2015, sales to our top five customers accounted for approximately 64% of total revenue. Our railcar sales to customers outside the United States were $34.0 million and $62.6 million in 2016 and 2015, respectively. Many of our customers do not purchase railcars every year since railcar fleets are not necessarily replenished or augmented every year. The size and frequency of railcar orders often results in a small number of customers representing a significant portion of our sales in a given year.
5
Table of Contents
SALES AND MARKETING
Our direct sales group is organized geographically and consists of regional sales managers and contract administrators, a manager of customer service and support staff. The regional sales managers are responsible for managing customer relationships. Our contract administrators are responsible for preparing proposals and other inside sales activities. Our manager of customer service is responsible for after-sale follow-up and in-field product performance reviews.
RESEARCH AND DEVELOPMENT
We utilize the latest engineering methods, tools and processes to ensure that new products and processes meet our customers’ requirements and are delivered in a timely manner. We develop and introduce new railcar designs as a result of a combination of customer feedback and close observation of developing market trends. We work closely with our customers to understand their expectations and design railcars that meet their needs. New product designs are tested and validated for compliance with AAR standards prior to introduction. This comprehensive approach provides the criteria and direction that ensure we are developing products that our customers desire and perform as expected. Costs associated with research and development are expensed as incurred and totaled $0.4 million, $0.4 million and $0.3 million for the years ended December 31, 2016, 2015 and 2014, respectively.
BACKLOG
We define backlog as the value of those products or services which our customers have committed in writing to purchase from us or lease from us when built, but which have not yet been recognized as sales. Our contracts may include cancellation clauses under which customers are required, upon cancellation of the contract, to reimburse us for costs incurred in reliance on an order and in some cases, to compensate us for lost profits. However, customer orders may be subject to customer requests for delays in railcar deliveries, inspection rights and other customary industry terms and conditions, which could prevent or delay backlog from being converted into sales.
The following table depicts our reported railcar backlog in number of railcars and estimated future sales value attributable to such backlog, for the periods shown.
| Year Ended December 31, | ||||||||||||
| 2016 | 2015 | 2014 | ||||||||||
| Railcar backlog at start of period |
9,840 | 14,791 | 6,826 | |||||||||
| Railcars delivered |
(5,559 | ) | (8,980 | ) | (7,102 | ) | ||||||
| Net railcar orders (canceled) received |
(22 | ) | 4,029 | 15,067 | ||||||||
|
|
|
|
|
|
|
|||||||
| Railcar backlog at end of period (1) |
4,259 | 9,840 | 14,791 | |||||||||
|
|
|
|
|
|
|
|||||||
| Estimated revenue from backlog at end of period (in thousands) (2) |
$ | 419,381 | $ | 925,977 | $ | 1,268,907 | ||||||
| (1) | Railcar backlog includes 0, 0 and 2,600 rebuilt railcars as of December 31, 2016, 2015 and 2014, respectively. |
| (2) | Estimated revenue from backlog reflects the total revenue attributable to the backlog reported at the end of the period as if such backlog were converted to actual sales. Estimated revenue from backlog does not reflect potential price increases and decreases under customer contracts that provide for variable pricing based on changes in the cost of raw materials. Although we continually look for opportunities to package our leased assets for sale to our leasing company partners, these leased assets may not be converted to sales. |
Although our reported backlog is typically converted to sales within two years, our reported backlog may not be converted to sales in any particular period, if at all, and the actual sales from these contracts may not equal our reported backlog estimates. See Item 1A. “Risk Factors—Risks Related to Our Business—The level of our reported backlog may not necessarily indicate what our future sales will be and our actual sales may fall short of the estimated sales value attributed to our backlog.” In addition, due to the large size of railcar orders and variations in the mix of railcars, the size of our reported backlog at the end of any given period may fluctuate significantly. See Item 1A. “Risk Factors—Risks Related to the Railcar Industry—The variable purchase patterns of our customers and the timing of completion, delivery and customer acceptance of the railcar may cause our revenues and income from operations to vary substantially each quarter, which will result in significant fluctuations in our quarterly results.”
6
Table of Contents
SUPPLIERS AND MATERIALS
The cost of raw materials and components represents a substantial majority of the manufacturing costs of most of our railcar product lines. As a result, the management of raw materials and components purchasing is critical to our profitability. We enjoy generally strong relationships with our suppliers, which helps to ensure access to supplies when railcar demand is high.
Our primary aluminum suppliers are Sapa Extrusions and Constellium N.V. (formerly Alcan Inc.). Aluminum prices generally are fixed at the time a railcar order is accepted, mitigating the effect of future fluctuations in prices. Our primary stainless steel supplier is Crompion International, L.L.C. and our primary carbon steel suppliers are International Truck and Engine Investments Corporation, an affiliate of Navistar, Inc., O’Neal Steel Inc. and Roll Form Group.
Our primary component suppliers include Amsted Industries, Inc., which supplies us with truck components, brake components, couplers and bearings, and Summit Railroad Products, Inc., which supplies us with axles and wheels. Roll Form Group is the sole supplier of our roll-formed center sills, which were used in 73% and 77% of our new railcars produced in 2016 and 2015, respectively. A center sill is the primary structural component of a railcar. In addition, International Truck and Engine Investments Corporation, an affiliate of Navistar, Inc., supplies us with various fabricated parts, components and subassemblies as well as providing truck and wheel and axle assembly services and blast and paint finishing services primarily for our Shoals facility. Other suppliers provide brake systems, castings, bearings, fabrications and various other components. The railcar industry is periodically subject to supply constraints for some of the key railcar components. See Item 1A. “Risk Factors—Risks Related to the Railcar Industry—Limitations on the supply of railcar components could adversely affect our business because they may limit the number of railcars we can manufacture.”
Except as described above, there are usually at least two suppliers for each of our raw materials and specialty components. No single supplier accounted for more than 24% and 16% of our total purchases in 2016 and 2015, respectively. Our top ten suppliers accounted for 67% and 58% of our total purchases in 2016 and 2015, respectively.
COMPETITION
We operate in a highly competitive marketplace especially in periods of low market demand resulting in excess manufacturing capacity. See Item 1A Risk Factors. Competition is based on price, delivery timing, product design, reputation for product quality and customer service and support.
We have four principal competitors in the North American railcar market that primarily manufacture railcars for third-party customers, which are Trinity Industries, Inc., The Greenbrier Companies, Inc., American Railcar Industries, Inc. and National Steel Car Limited.
Competition in the North American market from railcar manufacturers located outside of North America is limited by, among other factors, high shipping costs and familiarity with the North American market.
INTELLECTUAL PROPERTY
We have several U.S. and international patents and pending applications, registered trademarks, copyrights and trade names. Key patents include our one-piece center sill, our hopper railcar with automatic individual door system and our railroad car tub. The protection of our intellectual property is important to our business.
EMPLOYEES
As of December 31, 2016, we had 1,529 employees, of whom 241 were salaried and 1,288 were hourly wage earners, and approximately 537, or 35%, of our employees were members of unions. As of December 31, 2015, we had 1,662 employees, of whom 233 were salaried and 1,429 were hourly wage earners, and approximately 381, or 23%, of our employees were members of unions. See Item 1A. “Risk Factors—Risks Related to Our Business—Labor disputes could disrupt our operations and divert the attention of our management and may have a material adverse effect on our operations and profitability.”
7
Table of Contents
REGULATION
The Federal Railroad Administration, or FRA, administers and enforces U.S. federal laws and regulations relating to railroad safety. These regulations govern equipment and safety compliance standards for freight railcars and other rail equipment used in interstate commerce. The AAR promulgates a wide variety of rules and regulations governing safety and design of equipment, relationships among railroads with respect to freight railcars in interchange and other matters. The AAR also certifies freight railcar manufacturers and component manufacturers that provide equipment for use on railroads in the United States as well as providers of railcar repair and maintenance services. New products must generally undergo AAR testing and approval processes. As a result of these regulations, we must maintain certifications with the AAR as a freight railcar manufacturer and products that we sell must meet AAR and FRA standards.
We are also subject to oversight in other jurisdictions by foreign regulatory agencies and to the extent that we expand our business internationally, we will increasingly be subject to the regulations of other non-U.S. jurisdictions.
ENVIRONMENTAL MATTERS
We are subject to comprehensive federal, state, local and international environmental laws and regulations relating to the release or discharge of materials into the environment, the management, use, processing, handling, storage, transport or disposal of hazardous materials, or otherwise relating to the protection of human health and the environment. These laws and regulations not only expose us to liability for our own negligent acts, but also may expose us to liability for the conduct of others or for our actions that were in compliance with all applicable laws at the time these actions were taken. In addition, these laws may require significant expenditures to achieve compliance, and are frequently modified or revised to impose new obligations. Civil and criminal fines and penalties may be imposed for non-compliance with these environmental laws and regulations. Our operations that involve hazardous materials also raise potential risks of liability under the common law.
Environmental operating permits are, or may be, required for our operations under these laws and regulations. These operating permits are subject to modification, renewal and revocation. We regularly monitor and review our operations, procedures and policies for compliance with these laws and regulations. Despite these compliance efforts, risk of environmental liability is inherent in the operation of our businesses, as it is with other companies engaged in similar businesses. We believe that our operations and facilities are in substantial compliance with applicable laws and regulations and that any noncompliance is not likely to have a material adverse effect on our operations or financial condition.
Future events, such as changes in or modified interpretations of existing laws and regulations or enforcement policies, or further investigation or evaluation of the potential health hazards of products or business activities, may give rise to additional compliance and other costs that could have a material adverse effect on our financial condition and operations. In addition, we have in the past conducted investigation and remediation activities at properties that we own to address historic contamination. To date, such costs have not been material. Although we believe we have satisfactorily addressed all known material contamination through our remediation activities, there can be no assurance that these activities have addressed all historic contamination. The discovery of historic contamination or the release of hazardous substances into the environment could require us in the future to incur investigative or remedial costs or other liabilities that could be material or that could interfere with the operation of our business.
In addition to environmental laws, the transportation of commodities by railcar raises potential risks in the event of a derailment or other accident. Generally, liability under existing law in the United States for a derailment or other accident depends on the negligence of the party, such as the railroad, the shipper or the manufacturer of the railcar or its components. However, for the shipment of certain hazardous commodities, strict liability concepts may apply.
8
Table of Contents
The factors described below are the principal risks that could materially adversely affect our operating results and financial condition. Other factors may exist that we do not consider significant based on information that is currently available. In addition, new risks may emerge at any time, and we cannot predict those risks or estimate the extent to which they may affect us.
RISKS RELATED TO THE RAILCAR INDUSTRY
We operate in a highly cyclical industry, and our industry and markets are influenced by factors that are beyond our control, including U.S. and international economic conditions. Such factors could adversely affect demand for our railcar offerings.
Historically, the North American railcar market has been highly cyclical and we expect it to continue to be highly cyclical. During the most recent industry cycle, industry-wide railcar deliveries increased from a low of 16,535 railcars in 2010 to a peak of 82,296 railcars in 2015. During this period, our railcar production increased from approximately 2,229 railcars in 2010 to 8,980 railcars in 2015. Our industry and the markets for which we supply railcars are influenced by factors that are beyond our control, including U.S. and international economic conditions. Downturns in economic conditions could result in lower sales volumes, lower prices for railcars and a loss of profits. The cyclicality of the markets in which we operate may adversely affect our operating results and cash flow. In addition, fluctuations in the demand for our railcars may cause comparisons of our sales and operating results between different fiscal years to be less meaningful as indicators of our future performance.
We operate in a competitive industry and we may be unable to compete successfully against other railcar manufacturers.
We operate in a competitive marketplace especially in periods of low market demand resulting in excess manufacturing capacity and face substantial competition from established competitors in the railcar industry in North America. We have four principal competitors that primarily manufacture railcars for third-party customers. Some of these manufacturers have greater financial and technological resources than us, and they may increase their participation in the railcar segments in which we compete. In addition to price, competition is based on delivery timing, product performance and technological innovation, quality, customer service and other factors. In particular, technological innovation by any of our existing competitors, or new competitors entering any of the markets in which we do business, could put us at a competitive disadvantage and impair our ability to compete successfully against other railcar manufacturers or retain our market share in our established markets. Increased competition for the sales of our railcar products could result in price reductions, reduced margins and loss of market share, which could negatively affect our prospects, business, financial condition and results of operations.
We depend upon a small number of customers that represent a large percentage of our sales. The loss of any single customer, or a reduction in sales to any such customer, could have a material adverse effect on our business, financial condition and results of operations.
Since railcars are typically sold pursuant to large, periodic orders, a limited number of customers typically represent a significant percentage of our railcar sales in any given year. Over the last five years, our top five customers in each year based on sales accounted for, in the aggregate, approximately 58% of our total sales for the five-year period. In 2016, sales to our top three customers accounted for approximately 23%, 16% and 15%, respectively, of our total sales. In 2015, sales to our top three customers accounted for approximately 22%, 19% and 10%, respectively, of our total sales. Although we have long-standing relationships with many of our major customers, the loss of any significant portion of our sales to any major customer, the loss of a single major customer or a material adverse change in the financial condition of any one of our major customers could have a material adverse effect on our business, financial condition and results of operations.
The variable purchase patterns of our customers and the timing of completion, delivery and customer acceptance of orders may cause our revenues and income from operations to vary substantially each quarter, which will result in significant fluctuations in our quarterly results.
Most of our individual customers do not make purchases every year, since they do not need to replace, replenish or increase their railcar fleets on a yearly basis. Many of our customers place orders for products on an as-needed basis, sometimes only once every few years. As a result, the order levels for railcars, the mix of railcar types ordered and
9
Table of Contents
the railcars ordered by any particular customer have varied significantly from quarterly period to quarterly period in the past and may continue to vary significantly in the future. Therefore, our results of operations in any particular quarterly period may be significantly affected by the number of railcars delivered and product mix of railcars delivered in any given quarterly period. Additionally, because we record the sale of a new and rebuilt railcar at the time (1) we complete production, (2) the railcar is accepted by the customer following inspection, (3) the risk for any damage or loss with respect to the railcar passes to the customer, and (4) title to the railcar transfers to the customer, and not when the order is taken, the timing of the completion, delivery and acceptance of significant customer orders will have a considerable effect on fluctuations in our quarterly results. As a result of these quarterly fluctuations, we believe that comparisons of our sales and operating results between quarterly periods may not be meaningful and, as such, these comparisons should not be relied upon as indicators of our future performance.
Our ability to sell new railcars may be limited by other factors, including the availability and price of used railcars offered for sale and new or used railcars offered for lease by leasing companies and others.
Our customers may consider alternatives to the purchase of new railcars, including the purchase of used railcars, refurbishment of existing railcars or the lease of new or used railcars. Our competitors may also be able to offer railcar leases at favorable lease rates, negatively impacting our ability to sell new railcars, which may result in price reductions, reduced margins and loss of market share. These additional competitive factors could negatively affect our prospects, business, financial condition and results of operations.
The potential cost volatility of the raw materials that we use to manufacture railcars, especially aluminum and steel, and delivery delays associated with these raw materials may adversely affect our financial condition and results of operations.
The production of railcars and our operations require substantial amounts of steel and aluminum. The cost of steel, aluminum and all other materials (including scrap metal) used in the production of our railcars represents a significant majority of our direct manufacturing costs. Our business is subject to the risk of price increases and periodic delays in the delivery of aluminum, steel and other materials, all of which are beyond our control. Any fluctuations in the price or availability of aluminum or steel, or any other material used in the production of our railcars, may have a material adverse effect on our business, results of operations or financial condition. In addition, if any of our suppliers were unable to continue its business or were to seek bankruptcy relief, the availability or price of the materials we use could be adversely affected. Deliveries of our materials may also fluctuate depending on supply and demand for the material or governmental regulation relating to the material, including regulation relating to the importation of the material.
Limitations on the supply of railcar components could adversely affect our business because they may limit the number of railcars we can manufacture.
We rely upon third-party suppliers for various components for our railcars. In the future, suppliers of railcar components may be unable to meet the short-term or longer-term demand of our industry for certain railcar components. In the event that any of our suppliers of railcar components were to stop or reduce their production, go out of business, refuse to continue their business relationships with us, become subject to work stoppages or ration their supply of components, our business could be disrupted. During periods of high or rapidly increasing railcar demand, we have in the past experienced challenges sourcing certain railcar components to meet our production requirements. In addition, our ability to increase our railcar production to expand our business and/or meet any increase in demand, with new or additional manufacturing capabilities, depends on our ability to obtain an adequate supply of these railcar components. While we believe that we could secure alternative sources for these components, we may incur substantial delays and significant expense in doing so, the quality and reliability of these alternative sources may not be the same and our operating results may be significantly affected. In an effort to secure a supply of components, we have developed foreign sources that require deposits on some occasions. In the event of a material adverse business condition, such deposits may be forfeited. In addition, if one of our competitors entered into a preferred supply arrangement with, or was otherwise favored by, a particular supplier, we would be at a competitive disadvantage, which could negatively affect our operating results. Furthermore, alternative suppliers might charge significantly higher prices for railcar components than we currently pay. Such circumstances could have a material adverse impact on our customer relationships, financial condition and results of operations.
10
Table of Contents
RISKS RELATED TO OUR BUSINESS
Lack of acceptance of our new railcar offerings by our customers could adversely affect our business.
Our growth strategy depends in part on our continued development and sale of new railcar designs and design changes to existing railcars to penetrate railcar markets in which we currently do not compete and to expand or maintain our market share in the railcar markets in which we currently compete. We have dedicated significant resources to the development, manufacturing and marketing of new railcar designs. We typically make decisions to develop and market new railcars and railcars with modified designs without firm indications of customer acceptance. New or modified railcar designs may require customers to alter their existing business methods or threaten to displace existing equipment in which our customers may have a substantial capital investment. Many railcar purchasers prefer to maintain a standardized fleet of railcars and railcar purchasers with established railcar fleets are generally resistant to railcar design changes. Therefore, any new or modified railcar designs that we develop may not gain widespread acceptance in the marketplace and any such products may not be able to compete successfully with existing railcar designs or new railcar designs that may be introduced by our competitors.
The level of our reported backlog may not necessarily indicate what our future sales will be and our actual sales may fall short of the estimated sales value attributed to our backlog.
We define backlog as the sales value of products or services to which our customers have committed in writing to purchase from us or lease from us when built, that have not yet been recognized as revenue. In this annual report on Form 10-K, we have disclosed our backlog, or the number of railcars for which we have purchase orders or firm operating leases for railcars to be built, in various periods and the estimated sales value (in dollars) that would be attributable to this backlog once the backlog is converted to actual sales. We consider backlog to be an indicator of future sales of railcars. However, our reported backlog may not be converted into sales in any particular period, if at all, and the actual sales (including any compensation for lost profits and reimbursement for costs) from such contracts may not equal our reported estimates of backlog value. Customer orders may be subject to cancellation, inspection rights and other customary industry terms, and delivery dates may be subject to delay, thereby extending the date on which we will deliver the associated railcars and realize revenues attributable to such railcar backlog or could prevent the backlog from being converted to sales.
Our warranties may expose us to potentially significant claims, which may damage our reputation and adversely affect our business, financial condition and results of operations.
We generally warrant that new railcars produced by us will be free from defects in material and workmanship under normal use and service identified for a period of up to five years from the time of sale. Accordingly, we may be subject to a risk of product liability or warranty claims in the event that the failure of any of our products results in property damage, personal injury or death, or does not conform to our customers’ specifications. Although we currently maintain product liability insurance coverage, product liability claims, if made, may exceed our insurance coverage limits or insurance may not continue to be available on commercially acceptable terms, if at all. These types of product liability and warranty claims may result in costly product recalls, significant repair costs and damage to our reputation, all of which could adversely affect our results of operations. This risk may increase over the short-term due to our limited warranty claim experience for our new product offerings.
To the extent we expand our sales of products and services internationally, we will increase our exposure to international economic and political risks.
Conducting business outside the United States, for example through our sales to other countries, subjects us to various risks, including changing economic, legal and political conditions, work stoppages, currency fluctuations, terrorist activities directed at U.S. companies, armed conflicts and unexpected changes in the United States and the laws of other countries relating to tariffs, trade restrictions, transportation regulations, foreign investments and taxation. If we fail to obtain and maintain certifications of our railcars and railcar parts in the various countries where we may operate, we may be unable to market and sell our railcars in those countries.
In addition, more stringent rules relating to labor or the environment, adverse tax consequences and price exchange controls could limit our operations and make the distribution of our products internationally more difficult. Furthermore, any material changes in the quotas, regulations or duties on imports imposed by the U.S. government and agencies or on exports by non-U.S. governments and their respective agencies could affect our ability to export the railcars that we manufacture in the United States. The uncertainty of the legal environment could limit our ability to enforce our rights effectively.
11
Table of Contents
Business that we may acquire in the future may fail to perform to expectations or we may be unable to successfully integrate acquired business with our existing business.
We may engage in future acquisitions, which in each case could materially affect our business, operating results, and financial condition. However, we may not be able to find suitable acquisition candidates, and we may not be able to complete such acquisitions on favorable terms, if at all. Future acquisitions may not strengthen our competitive position or achieve our desired goals and may disrupt our ongoing operations, divert management from day-to-day responsibilities, increase our expenses and reduce our cash available for operations and other uses. There can be no assurance that we will be able to effectively manage the integration of businesses we may acquire in the future, or be able to retain and motivate key personnel from those businesses.
If we lose key personnel, our operations and ability to manage the day-to-day aspects of our business may be adversely affected.
We believe our success depends to a significant degree upon the continued contributions of our executive officers and key employees, both individually and as a group. Our future performance will substantially depend on our ability to retain and motivate them. If we lose key personnel or are unable to recruit qualified personnel, our ability to manage the day-to-day aspects of our business may be adversely affected.
The loss of the services of one or more members of our senior management team could have a material adverse effect on our business, financial condition and results of operations. Because our senior management team has many years of experience in the railcar industry and other manufacturing and capital equipment industries, it could be difficult to replace any of them without adversely affecting our business operations. Our future success will also depend in part upon our continuing ability to attract and retain highly qualified personnel. We do not currently maintain “key person” life insurance.
Shortages of skilled labor may adversely impact our operations.
We depend on skilled labor in the manufacture of railcars. Some of our facilities are located in areas
where demand for skilled laborers often exceeds supply. Shortages of some types of skilled laborers may restrict our ability to maintain or increase production rates and could cause our labor costs to increase.
Labor disputes could disrupt our operations and divert the attention of our management and may have a material adverse effect on our operations and profitability.
As of December 31, 2016, we had a collective bargaining agreement with a union representing approximately 26% of our total active labor force that expires on March 31, 2017 and a collective bargaining agreement with a union representing approximately 10% of our total active labor force that expires on October 31, 2018. Disputes with the unions representing our employees could result in strikes or other labor protests which could disrupt our operations and divert the attention of management from operating our business. If we were to experience a strike or work stoppage, it could be difficult for us to find a sufficient number of employees with the necessary skills to replace these employees. Any such labor disputes could have a material adverse effect on our financial condition, results of operations or cash flows.
We rely upon a single supplier to supply us with all of our roll-formed center sills for our railcars, and any disruption of our relationship with this supplier could adversely affect our business.
We rely upon a single supplier to manufacture all of our roll-formed center sills for our railcars, which are based upon our proprietary and patented process. A center sill is the primary longitudinal structural component of a railcar, which helps the railcar withstand the weight of the cargo and the force of being pulled during transport. Our center sill is formed into its final shape without heating by passing steel plate through a series of rollers. Of the new railcars that we produced in 2016 and 2015, 73% and 77%, respectively, were manufactured using this roll-formed center sill. Although we have a good relationship with our supplier and have not experienced any significant delays, manufacturing shortages or failures to meet our quality requirements and production specifications in the past, our supplier could stop production of our roll-formed center sills, go out of business, refuse to continue its business relationship with us or become subject to work stoppages. While we believe that we could secure alternative
12
Table of Contents
manufacturing sources, our present supplier is currently the only manufacturer of our roll-formed center sills for our railcars. We may incur substantial delays and significant expense in finding an alternative source, our results of operations may be significantly affected and the quality and reliability of these alternative sources may not be the same. Moreover, alternative suppliers might charge significantly higher prices for our roll-formed center sills than we currently pay.
Equipment failures, delays in deliveries or extensive damage to our facilities could lead to production or service curtailments or shutdowns.
We have railcar production facilities in Cherokee, Alabama, Danville, Illinois and Roanoke, Virginia. An interruption in railcar production capabilities at these facilities, as a result of equipment failure or other factors, could reduce or prevent our production of railcars. A halt of production at any of our manufacturing facilities could severely affect delivery times to our customers. Any significant delay in deliveries to our customers could result in the termination of contracts, cause us to lose future sales and negatively affect our reputation among our customers and in the railcar industry and our results of operations. Our facilities are also subject to the risk of catastrophic loss due to unanticipated events, such as fires, explosions, floods or weather conditions. We may experience plant shutdowns or periods of reduced production as a result of equipment failures, delays in deliveries or extensive damage to any of our facilities, which could have a material adverse effect on our business, results of operations or financial condition.
The Company may be unable to renew its lease arrangements at its manufacturing facilities at commercially acceptable terms
Two of our manufacturing facilities are leased from third parties. As each lease expires, we may be unable to negotiate renewals on commercially acceptable terms. Failure to renew our leases at commercially acceptable terms could have a potential adverse impact on our operations.
We might fail to adequately protect our intellectual property, which may result in our loss of market share, or third parties might assert that our intellectual property infringes on their intellectual property, which would be costly to defend and divert the attention of our management.
The protection of our intellectual property is important to our business. We rely on a combination of trademarks, copyrights, patents and trade secrets to protect our intellectual property. However, these protections might be inadequate. For example, we have patents for portions of our railcar designs that are important to our market leadership in the coal car segment. Our pending or future trademark, copyright and patent applications might not be approved or, if allowed, might not be sufficiently broad. Conversely, third parties might assert that our technologies or other intellectual property infringe on their proprietary rights. In either case, litigation may result, which could result in substantial costs and diversion of our management team’s efforts. Regardless of whether we are ultimately successful in any litigation, such litigation could adversely affect our business, results of operations and financial condition.
Our information technology and other systems are subject to cybersecurity risk, including the misappropriation of customer information and other breaches of information security. Security breaches and other disruptions could compromise our information, expose us to liability and harm our reputation and business.
In the ordinary course of our business, we collect and store sensitive data on our networks, including intellectual property, our proprietary business information and that of our customers, suppliers and business partners and personally identifiable information and other personal information of our customers and employees. While we continually work to safeguard our systems and to mitigate potential security risks, our information and processes are exposed to increasing global information security threats and more sophisticated and targeted computer crime, which may result in our data being subject to a security breach, a system failure, a computer virus, malicious software or unauthorized or fraudulent use by our employees or other third parties. Any compromise of our data security and access to or public disclosure or loss of personal or confidential business information could result in legal claims or proceedings with third parties, liability or regulatory penalties under the laws that protect the privacy of personal information, disruption of our operations, damage to our reputation, loss of business or remediation costs, any of which could have a material adverse effect on our prospects, business, financial condition and results of operations.
13
Table of Contents
We are subject to risks with respect to changes in U.S. tax law and rates.
As a result of recent changes in the U.S. government, tax reform may be enacted in the near future. These changes could include a reduction in the U.S. corporate tax rate, elimination of certain deductions and a border tax adjustment. We cannot predict whether or not any of these tax reform proposals will ultimately be adopted and, until the details of each proposal have been developed and reviewed, we cannot determine the impact of the proposed legislation on our tax expense. However, any changes could have a significant impact on the Company’s business and financial results depending upon the final legislation.
We are subject to a variety of environmental laws and regulations and the cost of complying with environmental requirements or any failure by us to comply with such requirements may have a material adverse effect on our business, financial condition and results of operations.
We are subject to a variety of federal, state and local environmental laws and regulations, including those governing air quality and the handling, disposal and remediation of waste products, fuel products and hazardous substances. Although we believe that we are in material compliance with all of the various regulations and permits applicable to our business, we may not at all times be in compliance with such requirements. The cost of complying with environmental requirements may also increase substantially in future years. If we violate or fail to comply with these regulations, we could be fined or otherwise sanctioned by regulators. In addition, these requirements are complex, change frequently and may become more stringent over time, which could have a material adverse effect on our business. We have in the past conducted investigation and remediation activities at properties that we own to address historic contamination. However, there can be no assurance that these remediation activities have addressed all historic contamination. Environmental liabilities that we incur, including those relating to the off-site disposal of our wastes, if not covered by adequate insurance or indemnification, will increase our costs and have a negative impact on our profitability.
The agreement governing our revolving credit facility contains various covenants that, among other things, limit our discretion in operating our business and provide for certain minimum financial requirements.
The agreement governing our revolving credit facility contains various covenants that, among other things, limit our management’s discretion by restricting our ability to incur additional debt, enter into certain transactions with affiliates, make investments and other restricted payments and create liens. Our failure to comply with these financial covenants and other covenants under our revolving credit facility could lead to an event of default under the agreement governing any other indebtedness that we may have outstanding at the time, permitting the lenders to accelerate all borrowings under such agreement and to foreclose on any collateral. In addition, any such events may make it more difficult or costly for us to borrow additional funds in the future. Our failure to raise capital if and when needed could have a material adverse effect on our results of operations and financial condition.
The market price of our securities may fluctuate significantly, which may make it difficult for stockholders to sell shares of our common stock when desired or at attractive prices.
Since our initial public offering in April 2005 until December 31, 2016, the trading price of our common stock ranged from a low of $10.87 per share to a high of $78.34 per share. The price for our common stock may fluctuate in response to a number of events and factors, such as quarterly variations in operating results and our reported backlog, the cyclical nature of the railcar market, announcements of new products by us or our competitors, changes in financial estimates and recommendations by securities analysts, the operating and stock price performance of other companies that investors may deem comparable to us, and news reports relating to trends in our markets or general economic conditions. Additionally, volatility or a lack of positive performance in our stock price may adversely affect our ability to retain key employees, all of whom have been granted stock options or other stock awards.
14
Table of Contents
Item 1B. Unresolved Staff Comments.
None.
The following table presents information on our leased and owned operating properties as of December 31, 2016:
| Use |
Location |
Size |
Leased or |
Lease Expiration Date | ||||
| Corporate headquarters | Chicago, Illinois | 15,540 square feet | Leased | March 31, 2022 | ||||
| Railcar assembly and component manufacturing | Danville, Illinois | 308,665 square feet on 36.5 acres of land | Owned | — | ||||
| Railcar assembly and component manufacturing | Roanoke, Virginia | 383,709 square feet on 15.5 acres of land | Leased | December 31, 2024 | ||||
| Railcar assembly and component manufacturing | Cherokee, Alabama | 772,828 square feet | Leased | December 31, 2021 | ||||
| Administrative | Johnstown, Pennsylvania | 29,500 square feet on 1.02 acres of land | Owned | — | ||||
| Parts warehouse | Johnstown, Pennsylvania | 86,000 square feet | Leased | December 31, 2023 | ||||
The information in response to this item is included in Note 17, Risks and Contingencies, to our Consolidated Financial Statements included in Part II, Item 8 of this Form 10-K
Item 4. Mine Safety Disclosures.
Not applicable
15
Table of Contents
Item 5. Market for Registrant’s Common Equity, Related Stockholder Matters and Issuer Purchases of Equity Securities.
Our common stock has been quoted on the Nasdaq Global Market under the symbol “RAIL” since April 6, 2005. As of February 7, 2017, there were approximately 91 holders of record of our common stock, which does not include persons whose shares of common stock are held by a bank, brokerage house or clearing agency. The following table sets forth quarterly high and low closing prices of our common stock since January 1, 2015, as reported on the Nasdaq Global Market.
| Common Stock Price | Dividend | |||||||||||
| High | Low | Declared | ||||||||||
| 2016 |
||||||||||||
| Fourth Quarter |
$ | 15.35 | $ | 10.90 | $ | 0.09 | ||||||
| Third Quarter |
$ | 15.42 | $ | 13.47 | $ | 0.09 | ||||||
| Second Quarter |
$ | 17.64 | $ | 13.09 | $ | 0.09 | ||||||
| First Quarter |
$ | 19.83 | $ | 14.87 | $ | 0.09 | ||||||
| 2015 |
||||||||||||
| Fourth Quarter |
$ | 24.48 | $ | 16.93 | $ | 0.09 | ||||||
| Third Quarter |
$ | 22.94 | $ | 16.99 | $ | 0.09 | ||||||
| Second Quarter |
$ | 31.59 | $ | 20.88 | $ | 0.09 | ||||||
| First Quarter |
$ | 31.78 | $ | 22.67 | $ | 0.09 | ||||||
Dividend Policy
The declaration and payment of future dividends will be at the discretion of our board of directors and will depend on, among other things, general economic and business conditions, our strategic plans, our financial results, contractual and legal restrictions on the payment of dividends by us and our subsidiaries and such other factors as our board of directors considers to be relevant. The ability of our board of directors to declare a dividend on our common stock is limited by Delaware law. On February 6, 2017, our board of directors declared a cash dividend of $0.09 per share of our common stock, payable on February 22, 2017, to shareholders of record at the close of business on February 16, 2017.
16
Table of Contents
Performance Graph
The following performance graph and related information shall not be deemed “soliciting material” or to be “filed” with the Securities and Exchange Commission, nor shall such information be incorporated by reference into any future filing under the Securities Act of 1933, as amended, or the Securities Exchange Act of 1934, as amended, except to the extent that the Company specifically incorporates it by reference into such filing.
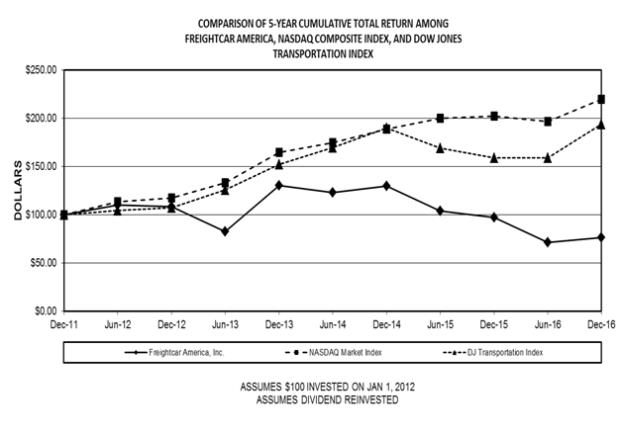
The following graph illustrates the cumulative total stockholder return on our common stock during the period from January 1, 2012 through December 31, 2016 and compares it with the cumulative total return on the NASDAQ Composite Index and DJ Transportation Index. The comparison assumes $100 was invested on January 1, 2012 in our common stock and in each of the foregoing indices and assumes reinvestment of dividends, if any. The performance shown is not necessarily indicative of future performance.
| Dec 31, | Jun 30, | Dec 31, | Jun 30, | Dec 31, | Jun 30, | Dec 31, | Jun 30, | Dec 31, | Jun 30, | Dec 31, | ||||||||||||||||||||||||||||||||||
| 2011 | 2012 | 2012 | 2013 | 2013 | 2014 | 2014 | 2015 | 2015 | 2016 | 2016 | ||||||||||||||||||||||||||||||||||
| FreightCar America, Inc. |
100.00 | 110.21 | 108.24 | 82.52 | 130.06 | 122.97 | 129.74 | 103.67 | 97.25 | 71.12 | 76.49 | |||||||||||||||||||||||||||||||||
| NASDAQ Market Index |
100.00 | 113.28 | 117.45 | 133.23 | 164.57 | 174.75 | 188.84 | 199.97 | 201.98 | 196.62 | 219.89 | |||||||||||||||||||||||||||||||||
| DJ Transportation Index |
100.00 | 104.62 | 107.49 | 125.90 | 151.96 | 169.54 | 190.07 | 169.33 | 158.82 | 158.97 | 193.53 | |||||||||||||||||||||||||||||||||
17
Table of Contents
Item 6. Selected Financial Data.
The selected financial data presented for each of the years in the five-year period ended December 31, 2016 was derived from our audited consolidated financial statements and other operational information reported on Form 10-K. The selected financial data should be read in conjunction with Management’s Discussion and Analysis of Financial Condition and Results of Operations and the Consolidated Financial Statements and Notes thereto included in Item 7 and Item 8, respectively, of this annual report on Form 10-K. (in thousands, except for share and per share data and railcar amounts)
| Year Ended December 31, | ||||||||||||||||||||
| Statements of Operations Data | 2016 | 2015 | 2014 | 2013 | 2012 | |||||||||||||||
| Revenues |
$ | 523,731 | $ | 772,854 | $ | 598,518 | $ | 290,393 | $ | 677,449 | ||||||||||
| Gross profit |
40,179 | 82,661 | 42,343 | 13,225 | 64,986 | |||||||||||||||
| Selling, general and administrative expense |
36,376 | 41,663 | 35,317 | 27,464 | 32,736 | |||||||||||||||
| Gain on sale of railcars available for lease |
— | (1,187 | ) | (1,403 | ) | (604 | ) | (989 | ) | |||||||||||
| Gain on sale of railcar repair and maintenance services business and facility |
— | (4,578 | ) | (1,078 | ) | — | — | |||||||||||||
| Gain on settlement of postretirement benefit obligation, net of plaintiffs’ attorneys’ fees |
(14,306 | ) | — | — | — | — | ||||||||||||||
| Restructuring and impairment charges |
2,261 | — | — | 10,452 | — | |||||||||||||||
| Net income (loss)(1)(2)(3)(4)(5) |
$ | 12,324 | $ | 31,805 | $ | 5,904 | $ | (19,295 | ) | $ | 19,095 | |||||||||
| Weighted average common shares outstanding—basic |
12,262,275 | 12,175,955 | 12,001,587 | 11,954,238 | 11,932,926 | |||||||||||||||
| Weighted average common shares outstanding—diluted |
12,262,275 | 12,217,755 | 12,103,520 | 11,954,238 | 11,969,337 | |||||||||||||||
| Per share data: |
||||||||||||||||||||
| Net income (loss) per common share —basic |
$ | 1.00 | $ | 2.59 | $ | 0.49 | $ | (1.61 | ) | $ | 1.60 | |||||||||
| Net income (loss) per common share —diluted |
$ | 1.00 | $ | 2.58 | $ | 0.49 | $ | (1.61 | ) | $ | 1.60 | |||||||||
| Dividends declared per common share |
$ | 0.36 | $ | 0.36 | $ | 0.24 | $ | 0.24 | $ | 0.24 | ||||||||||
| Other financial and operating data: |
||||||||||||||||||||
| Investment in property, plant and equipment and railcars on operating leases |
$ | 13,846 | $ | 16,699 | $ | 11,802 | $ | 17,317 | $ | 9,088 | ||||||||||
| Railcars delivered |
5,559 | 8,980 | 7,102 | 3,821 | 8,325 | |||||||||||||||
| Net railcar (cancellations) orders |
(22 | ) | 4,029 | 15,067 | 7,766 | 2,903 | ||||||||||||||
| Railcar backlog at period end |
4,259 | 9,840 | 14,791 | 6,826 | 2,881 | |||||||||||||||
| Estimated revenue from backlog at period end |
$ | 419,381 | $ | 925,977 | $ | 1,268,907 | $ | 492,018 | $ | 197,597 | ||||||||||
| Balance sheet data (at period end): |
||||||||||||||||||||
| Cash and cash equivalents |
$ | 92,750 | $ | 83,068 | $ | 113,532 | $ | 145,506 | $ | 98,509 | ||||||||||
| Restricted cash and restricted certificates of deposit |
5,970 | 6,896 | 6,015 | 7,780 | 14,700 | |||||||||||||||
| Marketable securities |
— | 26,951 | 47,961 | 38,988 | 41,978 | |||||||||||||||
| Total assets |
339,255 | 406,904 | 385,252 | 417,719 | 388,565 | |||||||||||||||
| Total debt, including capital leases |
— | — | — | — | — | |||||||||||||||
| Total stockholders’ equity |
256,914 | 235,111 | 198,695 | 202,535 | 211,331 | |||||||||||||||
| (1) | For the year ended December 31, 2016, we recorded a pre-tax gain on a settlement of a postretirement benefit plan obligation, net of plaintiffs’ attorneys’ fees of $14.3 million. |
| (2) | For the year ended December 31, 2016, we recorded pre-tax restructuring and impairment charges of $2.3 million. See Note 7 to our consolidated financial statements. |
| (3) | For the year ended December 31, 2015, we recorded a pre-tax gain on the sale of our railcar repair and maintenance services business of $4.6 million. |
| (4) | For the year ended December 31, 2014, we recorded a pre-tax gain on the sale of our closed railcar repair and maintenance facility of $1.1 million. |
| (5) | For the year ended December 31, 2013, we recorded pre-tax impairment charges to write down assets at our idled Danville manufacturing facility of $7.6 million, impairment charges to write down assets at our closed Clinton, Indiana maintenance and repair shop of $1.6 million, other charges related to the closure of our Clinton maintenance and repair shop of $303,000 and Corporate severance charges of $1.6 million. |
18
Table of Contents
Item 7. Management’s Discussion and Analysis of Financial Condition and Results of Operations.
OVERVIEW
You should read the following discussion in conjunction with our consolidated financial statements and related notes included elsewhere in this annual report on Form 10-K. This discussion contains forward-looking statements that are based on management’s current expectations, estimates and projections about our business and operations. Our actual results may differ materially from those currently anticipated and expressed in such forward-looking statements. See “Forward-Looking Statements.”
We are a diversified manufacturer of railcars and railcar components. We design and manufacture a broad variety of railcar types for transportation of bulk commodities and containerized freight products primarily in North America.
We rebuild railcars and sell forged, cast and fabricated parts for all of the railcars we produce, as well as those manufactured by others. Between November 2010, when we acquired the business assets of DTE Rail Services, Inc., and September 2015, when we sold our repair and maintenance services business, we provided railcar repair and maintenance for all types of freight railcars. We also lease freight cars. Our primary customers are railroads, shippers and financial institutions.
On August 1, 2016, we announced a cost reduction program whereby approximately 15% of our salaried administrative workforce would be eliminated, our Johnstown, Pennsylvania administrative facility would be closed and certain discretionary spending would be reduced. The total estimated costs of implementing this program are approximately $2.7 million, including approximately $1.1 million of employee-related costs and approximately $1.3 million of long-lived asset impairments. We currently estimate that the annualized cost savings resulting from this restructuring program will be approximately $5.0 million when fully implemented.
In connection with our cost reductions program during 2016, we recorded restructuring and impairment charges of $2.3 million, which consisted primarily of non-cash impairment charges of $1.3 million for property, plant and equipment at our Johnstown administrative facility and employee severance and other employment termination costs of $1.0 million.
Our railcar manufacturing facilities are located in Cherokee, Alabama (“Shoals”), Danville, Illinois and Roanoke, Virginia. Our Shoals facility is an important part of our long-term growth strategy as we continue to expand our railcar product and service offerings. Our Shoals facility delivered its first railcars during the fourth quarter of 2013 and additional production capacity became operational during the second quarter of 2015. Our Roanoke facility has the capacity to build a variety of railcar types in a cost effective manner and will continue to support our coal car products when market conditions improve. Our Danville facility resumed production in June 2014 after being idled for 14 months and, given the challenged coal market, operations there were again significantly curtailed in 2016. Our Danville facility will be idled for railcar production effective March 31, 2017.
In light of the current cyclical downturn in the railcar industry and the challenged coal market, on February 27, 2017 we announced further reductions to our salaried workforce and initiatives to reduce discretionary spending. These actions are expected to be completed by the end of the second quarter of 2017. Total estimated costs to implement these actions are approximately $1.0 million of employee-related costs. We currently estimate that the annualized cost savings resulting from these actions will be approximately $3.0 million when fully implemented.
Railcar deliveries totaled 5,559 units, consisting of 5,332 new railcars and 227 rebuilt railcars, for the year ended December 31, 2016, compared to 8,980 units, consisting of 6,280 new railcars, 2,600 rebuilt railcars and 100 railcars leased, for the year ended December 31, 2015. Our total backlog of firm orders for railcars decreased from 9,840 railcars as of December 31, 2015 to 4,259 railcars as of December 31, 2016.
The Company’s operations comprise two operating segments, Manufacturing and Parts, and one reportable segment, Manufacturing. The Company’s Manufacturing segment includes new railcar manufacturing, used railcar sales, railcar leasing and major railcar rebuilds. The Company’s Parts operating segment is not significant for reporting purposes and has been combined with corporate and other non-operating activities as Corporate and Other.
19
Table of Contents
FINANCIAL STATEMENT PRESENTATION
Revenues
Our Manufacturing segment revenues are generated primarily from sales of the railcars that we manufacture. Our Manufacturing segment sales depend on industry demand for new railcars, which is driven by overall economic conditions and the demand for railcar transportation of various products, such as coal, steel products, minerals, cement, motor vehicles, forest products and agricultural commodities. Our Manufacturing segment sales are also affected by competitive market pressures that impact our market share, the prices for our railcars and by the types of railcars sold. Our Manufacturing segment revenues also include revenues from major railcar rebuilds and lease rental payments received with respect to railcars under operating leases. Our Corporate and Other revenue sources include parts sales and, through September 30, 2015, revenues from our repair and maintenance business that was sold in September 2015.
We generally manufacture railcars under firm orders from our customers. We recognize revenue, when (1) we complete the individual railcars, (2) the railcars are accepted by the customer following inspection, (3) the risk of any damage or other loss with respect to the railcars passes to the customer and (4) title to the railcars transfers to the customer. Deliveries include new and used cars sold, cars built and contracted under operating leases and rebuilt cars. We value used railcars received at their estimated fair market value. Revenues derived from a single sales contract that contains multiple products and services are allocated based on the relative fair value of each item to be delivered and recognized in accordance with the applicable revenue recognition criteria for the specific unit of accounting. The variable purchase patterns of our customers and the timing of completion, delivery and customer acceptance of railcars may cause our revenues and income from operations to vary substantially each quarter, which will result in significant fluctuations in our quarterly results.
Cost of sales
Our cost of sales includes the cost of raw materials such as aluminum and steel, as well as the cost of finished railcar components, such as castings, wheels, truck components and couplers, and other specialty components. Our cost of sales also includes labor, utilities, freight, manufacturing depreciation and other operating costs. Factors that have affected our cost of sales include the cost of steel and aluminum and the cost of railcar components, which have been impacted by the increase in industry demand. As we expanded, although we strove to reduce manufacturing costs at our manufacturing facilities, our cost of sales has been negatively impacted by production inefficiencies and idle capacity as we entered into new railcar markets and invested in diversifying our product portfolio. A portion of the contracts covering our backlog at December 31, 2016 are fixed-rate contracts. Therefore, if material costs were to increase, we will likely not be able to pass on these increased costs to our customers. We manage material price increases by locking in prices where possible.
Operating income (loss)
Operating income (loss) represents revenues less cost of sales, gain on sale of railcars available for lease, gain on sale of railcar repair and maintenance services business, selling, general and administrative expenses, and restructuring and impairment charges.
RESULTS OF OPERATIONS
Year Ended December 31, 2016 compared to Year Ended December 31, 2015
Revenues
Our consolidated revenues for the year ended December 31, 2016 were $523.7 million compared to $772.9 million for the year ended December 31, 2015. Manufacturing segment revenues for the year ended December 31, 2016 were $516.1 million compared to $745.7 million for the year ended December 31, 2015. The decrease in Manufacturing segment revenues for 2016 compared to 2015 reflects the 38% decrease in the number of railcars delivered, partially offset by a higher mix of new versus rebuilt railcars. Corporate and Other revenues for the year ended December 31, 2016 were $7.7 million compared to $27.1 million for the year ended December 31, 2015, which for the year ended December 31, 2015 included revenue from our repair and maintenance business that was sold in September 2015.
20
Table of Contents
Gross Profit
Our consolidated gross profit margin was 7.7% for the year ended December 31, 2016 compared to 10.7% for the year ended December 31, 2015. Our consolidated gross profit for the year ended December 31, 2016 was $40.2 million compared to $82.7 million for the year ended December 31, 2015, reflecting a decrease in gross profit from our Manufacturing segment of $39.8 million and a decrease in gross profit from Corporate and Other of $2.7 million. The 38% decline in railcar deliveries in 2016 contributed a $38.3 million decrease in gross profit in our Manufacturing segment and production inefficiencies, net of a favorable sales mix of cars sold, contributed to a $2.8 million decrease in gross profit in our Manufacturing segment. Product warranty expense was $1.4 million lower for the year ended December 31, 2016 compared to the same period last year. The decrease in gross profit for Corporate and Other for the year ended December 31, 2016 compared to the year ended December 31, 2015 reflects the sale of the Company’s repair and maintenance business, which was partially offset by a $2.6 million decrease in postretirement benefit plan costs due to the settlement with our hourly retirees.
Selling, General and Administrative Expenses
Consolidated selling, general and administrative expenses for the year ended December 31, 2016 were $36.4 million compared to $41.7 million for the year ended December 31, 2015. Manufacturing segment selling, general and administrative expenses for the year ended December 31, 2016 were $11.5 million compared to $12.3 million for the year ended December 31, 2015 primarily due to lower third-party sales commissions of $0.3 million and lower allocation of certain corporate costs of $0.5 million. Corporate and Other selling, general and administrative expenses were $24.8 million for the year ended December 31, 2016 compared to $29.3 million for the year ended December 31, 2015. The decrease in Corporate and Other selling, general and administrative expenses reflected $4.6 million in lower incentive compensation and $1.0 million in lower stock-based compensation, partially offset by $0.5 million in higher state franchise taxes.
Gain on Sale of Railcars Available for Lease
Gain on sale of railcars available for lease for the year ended December 31, 2015 was $1.2 million and represented the gain on sale of leased railcars with a net book value of $6.4 million. We did not sell any railcars available for lease during 2016.
Gain on Sale of Railcar Repair and Maintenance Services Business and Facility
On September 30, 2015, we sold our railcar repair and maintenance services business for an aggregate purchase price of $20.0 million. As a result of the sale, we recorded a pre-tax gain of $4.6 million for the year ended December 31, 2015.
Gain on Settlement of Postretirement Benefit Obligation
On March 25, 2016, we made a one-time payment of $31.7 million to settle our postretirement benefit obligation for our hourly retirees resulting in a pre-tax gain of $14.3 million (net of plaintiffs’ attorneys’ fees of $1.3 million) and a reduction in our postretirement benefit obligation of approximately $68.8 million. See Note 14 to the consolidated financial statements.
Restructuring and Impairment Charges
On August 1, 2016, we announced a cost reduction program whereby approximately 15% of the Company’s salaried administrative workforce would be eliminated, its Johnstown, Pennsylvania administrative facility would be closed and certain discretionary spending would be reduced. The total estimated costs of implementing this program are approximately $2.7 million, including approximately $1.1 million of employee-related costs and approximately $1.3 million of long-lived asset impairments. The Company currently estimates that the annualized cost savings resulting from this restructuring program will be approximately $5.0 million when fully implemented.
In connection with our cost reduction program during 2016, we recorded restructuring and impairment charges of $2.3 million, which are reported as a separate line item on our consolidated statements of operations. These charges consisted primarily of non-cash impairment charges of $1.3 million for property, plant and equipment at our Johnstown administrative facility and employee severance and other employment termination costs of $1.0 million.
21
Table of Contents
In the first quarter of 2017, in response to lower order trends in the industry, we announced further reductions to our salaried workforce and initiatives to reduce discretionary spending. These actions are expected to be completed by the end of the second quarter of 2017. Total estimated costs to implement these actions are approximately $1.0 million of employee-related costs. We currently estimate that the annualized cost savings resulting from these actions will be approximately $3.0 million when fully implemented.
Operating Income (Loss)
Our consolidated operating income for the year ended December 31, 2016 was $15.8 million compared to $46.8 million for the year ended December 31, 2015. Operating income for the Manufacturing segment was $29.0 million for the year ended December 31, 2016 compared to $69.2 million for the year ended December 31, 2015, reflecting the decrease in Manufacturing segment gross profit described above and the decrease in Manufacturing segment gain on sale of railcars available for lease, which were partially offset by the decrease in Manufacturing segment selling, general and administrative expenses. Corporate and Other operating loss was $13.2 million for the year ended December 31, 2016 compared to $22.4 million for the year ended December 31, 2015, reflecting the gain on settlement of postretirement benefit obligation and the decrease in Corporate and Other selling and administrative expenses, which were partially offset by the decreases in Corporate and Other gross profit and restructuring and impairment charges.
Income Taxes
Our income tax provision was $3.5 million for the year ended December 31, 2016 compared to $14.8 million for the year ended December 31, 2015. The effective tax rate for the year ended December 31, 2016 was 21.9% compared to 31.8% for the year ended December 31, 2015. The decrease in our effective tax rate was primarily due to decreases in prior period tax positions, partially offset by certain tax credits not recurring at the same level in 2016 as in 2015.
Net Income
As a result of the foregoing, our net income was $12.3 million for the year ended December 31, 2016 compared to $31.8 million for the year ended December 31, 2015. For the year ended December 31, 2016, our diluted net income per share were $1.00 compared to $2.58 for the year ended December 31, 2015.
Year Ended December 31, 2015 compared to Year Ended December 31, 2014
Revenues
Our consolidated revenues for the year ended December 31, 2015 were $772.9 million compared to $598.5 million for the year ended December 31, 2014. Manufacturing segment revenues for the year ended December 31, 2015 were $745.7 million compared to $562.7 million for the year ended December 31, 2014. The increase in Manufacturing segment revenues reflects the increase in the number of railcars delivered, a higher mix of new versus rebuilt railcars and changes in the product mix of new railcars. Our Manufacturing segment delivered 8,980 units, consisting of 6,280 new railcars, 2,600 rebuilt railcars and 100 railcars leased, for the year ended December 31, 2015, compared to 7,102 units, consisting of 3,937 new railcars, 3,090 rebuilt railcars and 75 railcars leased, for the year ended December 31, 2014. Manufacturing segment revenues for the year ended December 31, 2014 included the sale of 274 leased railcars, of which 74 were delivered during 2014 and 200 were delivered in 2013. Corporate and Other revenues for the year ended December 31, 2015 were $27.1 million compared to $35.8 million for the year ended December 31, 2014. The decrease in Corporate and other revenues for 2015 compared to 2014 reflects the sale of our repair and maintenance business on September 30, 2015.
Gross Profit
Our consolidated gross profit margin was 10.7% for the year ended December 31, 2015 compared to 7.1% for the year ended December 31, 2014. Our consolidated gross profit for the year ended December 31, 2015 was $82.7 million compared to $42.3 million for the year ended December 31, 2014, reflecting increases in gross profit from our Manufacturing segment of $38.5 million and gross profit from Corporate and other of $1.8 million. The increase in gross profit for our Manufacturing segment reflected the increase in deliveries, a higher mix of new versus rebuilt railcars, changes in the product mix of new railcars and improvement in production efficiencies. Gross profit for our Manufacturing segment for the year ended December 31, 2015 included approximately $2.3
22
Table of Contents
million of costs associated with the ramp up of the additional production capacity at our Shoals facility. Manufacturing segment gross profit for the year ended December 31, 2014 included costs associated with the ramp up of production volumes at Shoals, carrying costs associated with our idled Danville facility and incremental costs associated with the restart of production at Danville, which together totaled $6.5 million. Manufacturing segment gross profit for the year ended December 31, 2014 also included the impact of multiple weather-related production shutdowns, supply disruptions and related inefficiencies totaling $1.9 million and a $0.8 million expense recorded to settle a warranty claim.
Selling, General and Administrative Expenses
Consolidated selling, general and administrative expenses for the year ended December 31, 2015 were $41.7 million compared to $35.3 million for the year ended December 31, 2014. Selling, general and administrative expenses for the year ended December 31, 2015 included increases in third-party sales commissions, salaries and wages, incentive compensation and legal costs. Manufacturing segment selling, general and administrative expenses for the year ended December 31, 2015 were $12.3 million compared to $11.0 million for the year ended December 31, 2014 primarily due to higher third-party sales commissions and salaries and wages. Corporate and Other selling, general and administrative expenses were $29.3 million for the year ended December 31, 2015 compared to $24.3 million for the year ended December 31, 2014. The increase in Corporate and Other selling, general and administrative expenses for the year ended December 31, 2015 compared to the year ended December 31, 2014, reflected increases in incentive compensation, salaries and wages and legal costs, which were partially offset by decreases in selling, general and administrative expenses due to the sale of our repair and maintenance business.
Gain on Sale of Railcars Available for Lease
Gain on sale of railcars available for lease for the year ended December 31, 2015 was $1.2 million and represented the gain on sale of leased railcars with a net book value of $6.4 million. Gain on sale of railcars available for lease for the year ended December 31, 2014 was $1.4 million and represented the gain on sale of leased railcars with a net book value of $12.2 million.
Gain on Sale of Railcar Repair and Maintenance Services Business and Facility
On September 30, 2015, we sold our railcar repair and maintenance services business for an aggregate purchase price of $20.0 million. The sale included assets of FreightCar Rail Services, LLC (“FCRS”), which operated our railcar repair and maintenance services business, and FreightCar Short Line, Inc. (“FCSL”), which owned a short-line railway. On September 30, 2015, $2.0 million of the aggregate purchase price was placed into escrow in order to secure the indemnification obligations of FCRS and FCSL under the asset purchase agreement relating to the sale and $0.4 million was used to pay certain liabilities of FCRS and FCSL, resulting in cash proceeds to us of $17.6 million. As a result of the sale, we recorded a pre-tax gain of $4.6 million for the year ended December 31, 2015.
In December 2013, we closed our underperforming maintenance and repair shop in Clinton, Indiana, reduced the carrying values of repair shop assets to their estimated fair market value, representing the estimated salvage values of building, equipment and rail at the facility and the estimated sales value of the associated land, and recorded restructuring and impairment charges of $1.7 million. As a result of the sale of the repair shop assets to a strategic buyer in September 2014, we recorded a pre-tax gain of $1.1 million for the year ended December 31, 2014.
Operating Income (Loss)
Our consolidated operating income for the year ended December 31, 2015 was $46.8 million compared to $9.5 million for the year ended December 31, 2014. Operating income for the Manufacturing segment was $69.2 million for the year ended December 31, 2015 compared to $32.2 million for the year ended December 31, 2014, reflecting the increase in Manufacturing segment gross profit, which was partially offset by the increase in Manufacturing segment selling, general and administrative expenses and the decrease in Manufacturing segment gain on sale of railcars available for lease. Corporate and Other operating loss was $22.4 million for the year ended December 31, 2015 compared to an operating loss of $22.6 million for the year ended December 31, 2014 reflecting an increase in operating income from repair and maintenance services of $5.1 million (primarily related to the gain on sale or our repair and maintenance business), which was partially offset by an increase in corporate costs of $5.0 million (primarily increases in incentive compensation, salaries and wages and legal costs).
23
Table of Contents
Interest Expense and Deferred Financing Costs
Interest expense and the amortization of deferred financing costs were $0.2 million for the year ended December 31, 2015 compared to $1.1 million for the year ended December 31, 2014. In addition to commitment fees on our revolving credit facility, letter of credit fees and amortization of deferred financing costs, results for 2014 included non-cash imputed interest on a customer advance for leased railcars delivered for which revenue could not be recognized until all contingencies had been resolved.
Income Taxes
The income tax provision was $14.8 million for the year ended December 31, 2015 compared to $2.6 million for the year ended December 31, 2014. The effective tax rates for the years ended December 31, 2015 and 2014, were 31.8% and 30.3%, respectively.
Net Income
As a result of the foregoing, our net income was $31.8 million for the year ended December 31, 2015 compared to $5.9 million for the year ended December 31, 2014. For the year ended December 31, 2015, our diluted net income per share was $2.58 compared to $0.49 for the year ended December 31, 2014.
LIQUIDITY AND CAPITAL RESOURCES
Our primary sources of liquidity for the years ended December 31, 2016 and 2015, were our cash provided by operations, cash and cash equivalent balances on hand, our securities held to maturity and our revolving credit facilities.
On June 13, 2016, we entered into a First Amendment to Credit Agreement (the “First Amendment”) by and among us and certain of our subsidiaries, as borrowers and guarantors (together, the “Borrowers”), and Bank of America, N.A., as lender, administrative agent, swingline lender and letter of credit issuer (the “Bank”). The First Amendment amended the Credit Agreement, dated as of July 26, 2013 (the “Original Credit Agreement”), by and among the Borrowers and the Bank in order to, among other things: (1) extend the term of the Original Credit Agreement to July 26, 2019; and (2) replace the negative covenant requiring a minimum consolidated net liquidity of $35.0 million with a negative covenant requiring a maximum consolidated net leverage ratio of 2.50:1.00. The Original Credit Agreement, as amended by the First Amendment (the “Credit Agreement”), contains a $50.0 million senior secured revolving credit facility (the “Revolving Credit Facility”) and a sub-facility for letters of credit not to exceed the lesser of $30.0 million and the amount of the senior secured revolving credit facility at such time. The Revolving Credit Facility can be used for general corporate purposes, including working capital. Under the Credit Agreement, revolving loans outstanding will bear interest at a rate of LIBOR plus an applicable margin of between 1.25% and 1.75% depending on our consolidated leverage ratio or at a base rate, as selected by us. Base rate loans will bear interest at the highest of (a) the federal funds rate plus 0.50%, (b) the prime rate or (c) LIBOR plus 1.00%. We are required to pay a non-utilization fee of between 0.10% and 0.25% on the unused portion of the revolving loan commitment depending on our quarterly average balance of unrestricted cash and our consolidated leverage ratio. Borrowings under the Revolving Credit Facility are secured by a first priority perfected security interest in substantially all of the Borrowers’ assets excluding railcars held by our railcar leasing subsidiary, JAIX. The Borrowers also have pledged all of the equity interests in our direct and indirect domestic subsidiaries as security for the Revolving Credit Facility. The Credit Agreement has both affirmative and negative covenants, including, without limitation, the maximum consolidated net leverage ratio requirement and limitations on indebtedness, liens and investments. The Credit Agreement also provides for customary events of default. As of December 31, 2016 and 2015, we had no borrowings under the Revolving Credit Facility (as in effect on such date). As of December 31, 2016 and 2015, we had $5.7 million and $6.9 million, respectively, in outstanding letters of credit under the Revolving Credit Facility (as in effect on such date) and therefore had $44.3 million and $43.1 million, respectively, available for borrowing under the Revolving Credit Facility.
Our restricted cash and restricted certificates of deposit balance was $6.0 million as of December 31, 2016 and $6.9 million as of December 31, 2015, and consisted of cash and certificates of deposit used to collateralize standby letters of credit with respect to performance guarantees and to support our worker’s compensation insurance claims. The decrease in restricted cash balances as of December 31, 2016 compared to December 31, 2015 was a result of decreases in standby letters of credit with respect to performance guarantees and our corresponding obligation to collateralize them. The standby letters of credit outstanding as of December 31, 2016 are scheduled to expire at
24
Table of Contents
various dates through January 31, 2018. We expect to establish restricted cash balances and restricted certificates of deposit in future periods to minimize bank fees related to standby letters of credit.
Based on our current level of operations and known changes in planned volume based on our backlog, we believe that our operating cash flows and our cash balances, together with amounts available under our revolving credit facility, will be sufficient to meet our expected liquidity needs. Our long-term liquidity is contingent upon future operating performance and our ability to continue to meet financial covenants under our revolving credit facility and any other indebtedness. We may also require additional capital in the future to fund working capital as demand for railcars increases, payments for contractual obligations, organic growth opportunities, including new plant and equipment and development of railcars, joint ventures, international expansion and acquisitions, and these capital requirements could be substantial.
We historically provided pension and retiree welfare benefits to certain salaried and hourly employees upon their retirement. Benefits under our pension plans are now frozen and will not be impacted by increases due to future service and compensation increases. The most significant assumptions used in determining our net periodic benefit costs are the discount rate used on our pension and postretirement welfare obligations and expected return on pension plan assets. As of December 31, 2016, our benefit obligation under our defined benefit pension plans was $53.3 million, which exceeded the fair value of plan assets by $6.8 million. We made no contributions to our defined benefit pension plans during 2016 and are not required to make any contributions to our defined benefit pension plans in 2017. The Pension Protection Act of 2006 provides for changes to the method of valuing pension plan assets and liabilities for funding purposes as well as minimum funding levels. Our defined benefit pension plans are in compliance with the minimum funding levels established in the Pension Protection Act. Funding levels will be affected by future contributions, investment returns on plan assets, growth in plan liabilities and interest rates. Assuming that the plans are fully funded as that term is defined in the Pension Protection Act, we will be required to fund the ongoing growth in plan liabilities on an annual basis.
A substantial portion of our $72.9 million postretirement benefit plan obligation as of December 31, 2015 related to an expired settlement agreement with the union representing employees at our and our predecessors’ Johnstown manufacturing facilities. On March 25, 2016, we made a one-time payment of $31.7 million to settle our postretirement benefit obligation for our hourly retirees, resulting in a pre-tax gain of $14.3 million (net of plaintiffs’ attorneys’ fees of $1.3 million). As of December 31, 2016, our benefit obligation under our postretirement benefit plan was $6.2 million, which exceeded the fair value of plan assets by $6.2 million. We made contributions to our postretirement benefit plan of $0.5 million for salaried retirees during 2016 and expect to make $0.4 million in contributions to our postretirement benefit plan in 2017 for salaried retirees. As a result of the settlement payment, we have no further postretirement benefit obligation for hourly retirees.
Based upon our operating performance and capital requirements, we may, from time to time, be required to raise additional funds through additional offerings of our common stock and through long-term borrowings. There can be no assurance that long-term debt, if needed, will be available on terms attractive to us, or at all. Furthermore, any additional equity financing may be dilutive to stockholders and debt financing, if available, may involve restrictive covenants. Our failure to raise capital if and when needed could have a material adverse effect on our results of operations and financial condition.
Contractual Obligations
The following table summarizes our contractual obligations as of December 31, 2016, and the effect that these obligations would be expected to have on our liquidity and cash flow in future periods:
| Payments Due by Period | ||||||||||||||||||||
| 2-3 | 4-5 | After | ||||||||||||||||||
| Contractual Obligations |
Total | 1 Year | Years | Years | 5 Years | |||||||||||||||
| (In thousands) | ||||||||||||||||||||
| Operating leases |
$ | 59,411 | $ | 9,167 | $ | 20,006 | $ | 20,557 | $ | 9,681 | ||||||||||
| Material and component purchases |
8,048 | 8,048 | — | — | — | |||||||||||||||
|
|
|
|
|
|
|
|
|
|
|
|||||||||||
| Total |
$ | 67,459 | $ | 17,215 | $ | 20,006 | $ | 20,557 | $ | 9,681 | ||||||||||
|
|
|
|
|
|
|
|
|
|
|
|||||||||||
25
Table of Contents
Material and component purchases consist of non-cancelable agreements with suppliers to purchase materials used in the manufacturing process. The estimated amounts above may vary based on the actual quantities and price.
The above table excludes $1.5 million related to a reserve for unrecognized tax benefits and accrued interest and penalties at December 31, 2016 because the timing of the payout of these amounts cannot be determined. We are also required to make minimum contributions to our pension plans and postretirement welfare plan as described above.
Cash Flows
The following table summarizes our net cash provided by or used in operating activities, investing activities and financing activities for the years ended December 31, 2016, 2015 and 2014:
| 2016 | 2015 | 2014 | ||||||||||
| (In thousands) | ||||||||||||
| Net cash provided by (used in): |
||||||||||||
| Operating activities |
$ | 215 | $ | (65,685 | ) | $ | (6,026 | ) | ||||
| Investing activities |
14,083 | 35,732 | (3,206 | ) | ||||||||
| Financing activities |
(4,616 | ) | (511 | ) | (22,742 | ) | ||||||
|
|
|
|
|
|
|
|||||||
| Total |
$ | 9,682 | $ | (30,464 | ) | $ | (31,974 | ) | ||||
|
|
|
|
|
|
|
|||||||
Operating Activities. Our net cash provided by or used in operating activities reflects net income or loss adjusted for non-cash charges and changes in operating assets and liabilities. Cash flows from operating activities are affected by several factors, including fluctuations in business volume, contract terms for billings and collections, the timing of collections on our contract receivables, processing of bi-weekly payroll and associated taxes, and payments to our suppliers. As some of our customers accept delivery of new railcars in train-set quantities, variations in our sales lead to significant fluctuations in our operating profits and cash from operating activities. We do not usually experience business credit issues, although a payment may be delayed pending completion of closing documentation.
Our net cash provided by operating activities for the year ended December 31, 2016 was $0.2 million compared to net cash used in operating activities of $65.7 million for the year ended December 31, 2015. Our net cash provided by operating activities for the year ended December 31, 2016 reflects decreases in working capital, including a $17.1 million decrease in inventory and a $15.9 million decrease in accounts receivable, which were offset by the cash payment of $31.6 million and payment of plaintiffs’ attorneys’ fees of $1.3 million for settlement of the postretirement benefit obligation for our hourly retirees. Additionally, at December 31, 2016 we had an income tax receivable of $13.3 million, most of which related to the carryback claim of our 2016 federal net taxable loss, which will be carried back against the 2015 tax year. This amount is expected to be received by the third quarter of 2017. Our net cash used in operating activities for the year ended December 31, 2015 included decreases in customer deposits and other liabilities, increases in accounts receivable and increases in inventory, which were partially offset by our net income and depreciation and amortization charges. Our net cash used in operating activities for the year ended December 31, 2014 included decreases in customer deposits which were partially offset by changes in working capital and our net income and depreciation and amortization charges.
Investing Activities. Net cash provided by investing activities for the year ended December 31, 2016 was $14.1 million and included proceeds from maturity of securities of $27.0 million and proceeds from maturity of restricted certificates of deposit (net of purchases) of $1.0 million, which were partially offset by purchases of property, plant and equipment of $13.8 million.
Net cash provided by investing activities for the year ended December 31, 2015 was $35.7 million and included proceeds from maturity of securities (net of purchases) of $21.0 million, proceeds from the sale of our railcar repair and maintenance services business and facility of $17.6 million, state and local incentives received of $15.7 million and proceeds from sale of railcars available for lease of $7.6 million, which were partially offset by purchases of property, plant and equipment of $16.7 million (including $10.9 million of equipment purchases for our Shoals facility), purchases of restricted certificates of deposit of $0.9 million (net of maturities) and the cost of railcars available for lease of $8.7 million.
26
Table of Contents
Net cash used in investing activities for the year ended December 31, 2014 included purchases of securities held to maturity of $9.0 million (net of proceeds from redemptions) and purchases of property, plant and equipment of $11.8 million (including purchases of equipment of $9.4 million for our Shoals facility), which were partially offset by proceeds from sale of property, plant and equipment, assets held for sale and railcars available for lease totaling $15.8 million. Net cash used in investing activities for the year ended December 31, 2014 also included restricted cash withdrawals (net of deposits and purchases of restricted certificates of deposit) of $1.8 million related to decreases in collateralization obligations with respect to letters of credit for performance guarantees.
Financing Activities. Net cash used in financing activities for the year ended December 31, 2016 was $4.6 million compared to $0.5 million for the year ended December 31, 2015. Net cash used in financing activities for the year ended December 31, 2016 primarily consisted of $4.5 million of cash dividends paid to our stockholders. Net cash used in financing activities for the year ended December 31, 2015 included $4.4 million of cash dividends paid to our stockholders and a $1.1 million impact of the settlement of employee taxes on stock-based compensation awards, which were partially offset by $4.9 million of proceeds from stock option exercises. Net cash used in financing activities for the year ended December 31, 2014 included the $19.8 million net decrease in a customer advance for production of leased railcars delivered during 2013 for which revenue could not be recognized until all contingencies had been resolved in 2014. Financing activities for 2014 also included $2.9 million of cash dividends paid to our stockholders.
Capital Expenditures
Our capital expenditures were $13.8 million for the year ended December 31, 2016 compared to $16.7 million for the year ended December 31, 2015. Capital expenditures were primarily capital investments related to the ramp up of production at our Shoals facility during 2015 and continued investment in equipment and infrastructure for production of new railcar products during 2015 and 2016.
Excluding unforeseen expenditures, we expect that total capital expenditures to maintain our facilities will be between $4 million and $5 million for 2017.
CRITICAL ACCOUNTING POLICIES
We prepare our consolidated financial statements in accordance with accounting principles generally accepted in the United States. The preparation of our financial statements requires us to make estimates and assumptions that affect the reported amounts of assets and liabilities and disclosure of contingent assets and liabilities at the date of the financial statements and the reported amounts of sales and expenses during the reporting period. Significant estimates include long-lived assets, goodwill, pension and postretirement benefit assumptions, the valuation reserve on net deferred tax assets, warranty accrual and contingencies and litigation. Actual results could differ from those estimates.
Our critical accounting policies include the following:
Long-lived assets
We evaluate long-lived assets, including property, plant and equipment, under the provisions of ASC 360, Property, Plant and Equipment, which addresses financial accounting and reporting for the impairment of long-lived assets and for long-lived assets to be disposed of. For assets to be held or used, we group a long-lived asset or assets with other assets and liabilities at the lowest level for which identifiable cash flows are largely independent of the cash flows of other assets and liabilities. An impairment loss for an asset group reduces only the carrying amounts of a
long-lived asset or assets of the group being evaluated. Our estimates of future cash flows used to test the recoverability of a long-lived asset group include only the future cash flows that are directly associated with and that are expected to arise as a direct result of the use and eventual disposition of the asset group. Our future cash flow estimates exclude interest charges.
We test long-lived assets for recoverability whenever events or changes in circumstances indicate that the carrying amount of an asset may not be recoverable. These changes in circumstances may include a significant decrease in the market price of an asset group, a significant adverse change in the manner in or extent to which an asset group is used, a current year operating loss combined with a history of operating losses or a current expectation that, more likely than not, a long-lived asset group will be sold or otherwise disposed of significantly before the end of its previously estimated useful life. If indicators of impairment are present, we then determine if the carrying value of
27
Table of Contents
the asset group is recoverable by comparing the carrying value of the asset group to total undiscounted future cash flows of the asset group. If the carrying value of the asset group is not recoverable, an impairment loss is measured based on the excess of the carrying amount of asset group over the estimated fair value of the asset group.
Due to the closure of our Johnstown, Pennsylvania administrative facility, we tested the long-lived assets at our Johnstown facility for impairment as of August 1, 2016. The carrying values of property, plant and equipment at our Johnstown facility were reduced to their estimated fair market values, resulting in a pre-tax impairment charge of $1.3 million for the year ended December 31, 2016. Fair market value was estimated using the market approach using market data such as recent sales of comparable assets in active markets and estimated salvage values.
We did not perform an impairment analysis of long-lived assets during 2015 or 2014 because we did not identify any impairment indicators that we believe would have required long-lived assets at our facilities to be tested for recoverability during 2015 or 2014.
Impairment of goodwill
We assess the carrying value of goodwill for impairment annually or more frequently whenever events occur and circumstances change indicating potential impairment. During our annual goodwill impairment assessments as of August 1, 2016 and 2015, management estimated the value of our Manufacturing reporting unit using a combination of the income approach, utilizing the discounted cash flow method and the market approach using the guideline company method. Fair value based on the income approach was given a 60% weighting and fair value based on the market approach was given a 40% weighting.
On August 1, 2016, management performed its annual assessment of its Manufacturing reporting unit, the only reporting unit carrying goodwill on that date, and concluded that the estimated fair value of the Manufacturing reporting unit exceeded the carrying value as of the testing date. In 2015, there were three reporting units for the purposes of testing goodwill: Manufacturing, Repairs and Maintenance and Parts. For each reporting unit with goodwill (Manufacturing with $21.5 million and Repairs and Maintenance with $0.6 million as of August 1, 2015), we concluded that the estimated fair value of each reporting unit’s net assets exceeded the carrying value as of the dates of our impairment tests for 2015. Additional steps, including an allocation of the estimated fair value to our assets and liabilities, would be necessary to determine the amount, if any, of goodwill impairment if the fair value of our net assets were less than their carrying value.
The discounted cash flow method involves management making estimates with respect to a variety of factors that will significantly impact the future performance of the business, including:
| • | future railcar volume projections based on an industry-specific outlook for railcar demand; |
| • | estimated margins on railcar sales and maintenance and repair services; |
| • | estimated growth rate for selling, general and administrative costs; |
| • | future effective tax rate for our Company; and |
| • | weighted-average cost of capital (“WACC”) used to discount future performance of our Company. |
Because these estimates form a basis for the determination of whether or not an impairment charge should be recorded, these estimates are considered to be critical accounting estimates.
We use industry data to estimate volume projections in our discounted cash flow method. We believe that this independent industry data is the best indicator of expected future performance assuming that we maintain a consistent market share, which management believes is supportable based on historical performance. Our estimated margins used in the discounted cash flow method are based primarily on historical margins. Management estimated a WACC of 14% for our August 1, 2016 and 2015, goodwill impairment valuation analyses for our Manufacturing reporting unit. The market approach was used in evaluating goodwill impairment for our Repair and Maintenance reporting unit as of August 1, 2015.
During our annual goodwill impairment assessment as of August 1, 2016, in addition to estimating the fair value of the net assets of our Manufacturing reporting unit using the discounted cash flow method in the base case scenario,
28
Table of Contents
we also estimated the fair value of the net assets in our Manufacturing reporting unit using the discounted cash flow method for alternate scenarios. From a sensitivity perspective, the estimated fair value of the net assets in our Manufacturing reporting unit exceeded the carrying value even if the WACC used in the discounted cash flow method was increased by one hundred basis points. If market conditions further deteriorate or the Manufacturing reporting unit performance is worse than is currently projected over an extended period of time, the reporting unit could potentially be at risk of an impairment charge. As of December 31, 2016, the total goodwill balance of the Manufacturing reporting unit was $21.5 million.
During our annual goodwill impairment assessment as of August 1, 2015, in addition to estimating the fair value of the net assets of our Manufacturing reporting unit using the discounted cash flow method in the base case scenario, we also estimated the fair value of the net assets in our Manufacturing reporting unit using the discounted cash flow method for alternate scenarios, including the impact of a decrease in earnings before income tax margin of one hundred basis points or the impact of a one hundred basis point increase in the WACC used in the discounted cash flow method. We compared the estimated fair value of the net assets in our Manufacturing reporting unit using the discounted cash flow method in the base case scenario to the alternate scenarios. Each of these alternate scenarios reduced the estimated fair value of the net assets in our Manufacturing reporting unit using the discounted cash flow method compared to the estimated fair value of the net assets in our Manufacturing reporting unit in the base case. However, in all scenarios, the estimated fair value of the net assets in our Manufacturing reporting unit exceeded the carrying value.
The guideline company method values a business by comparing the subject company to similar publicly traded companies. The application of the guideline company method consists of several steps including:
| • | identifying the most similar publicly traded companies to the reporting unit; |
| • | reviewing financial and supplemental data, such as market prices and business descriptions for the selected companies; |
| • | calculating valuation multiples for the selected publicly traded guideline companies; |
| • | performing comparative analysis to select valuation multiples and then applying them to the financial data of the reporting unit to arrive at a preliminary indication of the value of the reporting units invested capital on a marketable, minority basis; |
| • | applying a control premium to the indicated equity values on a marketable, minority basis to arrive at the indicated value of common equity on a marketable, controlling basis; and |
| • | where appropriate, making adjustments to add the appropriate balances related to cash and short-term investments, excess working capital and the benefits of net operating loss carryforwards. |
Pensions and postretirement benefits
We historically provided pension and retiree welfare benefits to certain salaried and hourly employees upon their retirement. Benefits under our pension plans are now frozen and will not be impacted by increases due to future service. The most significant assumptions used in determining our net periodic benefit costs are the discount rate used on our pension and postretirement welfare obligations and expected return on pension plan assets.
In 2016, we assumed that the expected long-term rate of return on pension plan assets on a plan by plan basis would range from 5.30% to 6.12%. As permitted under ASC 715, the assumed long-term rate of return on assets is applied to a calculated value of plan assets, which recognizes changes in the fair value of plan assets in a systematic manner over five years. This produces the expected return on plan assets that is included in our net periodic benefit cost. The difference between this expected return and the actual return on plan assets is deferred. The net deferral of past asset gains (losses) affects the calculated value of plan assets and, ultimately, future net periodic benefit cost. We review the expected return on plan assets annually and would revise it if conditions should warrant. A change of one hundred basis points in the expected long-term rate of return on plan assets would have the following effect:
29
Table of Contents
| 1% Increase | 1% Decrease | |||
| (in thousands) | ||||
| Effect on net periodic benefit cost |
$(449) | $449 | ||
At the end of each year, we determine the discount rate to be used to calculate the present value of our pension and postretirement welfare plan liabilities. The discount rate is an estimate of the current interest rate at which our pension liabilities could be effectively settled at the end of the year. In estimating this rate, we look to rates of return on high-quality, fixed-income investments that receive one of the two highest ratings given by a recognized ratings agency. At December 31, 2016, we determined this rate on our postretirement welfare plan to be 4.21%, a decrease of 0.18% from the 4.39% rate used at December 31, 2015. At December 31, 2016, we determined this rate on our pension plans on a consolidated plan basis to be 4.21%. A change of one hundred basis points in the discount rate would have the following effect:
| 1% Increase | 1% Decrease | |||
| (in thousands) | ||||
| Effect on net periodic benefit cost |
$67 | $(99) | ||
In October 2016, the Society of Actuaries published updated mortality improvement assumptions for U.S. plans, scale (MP-2016), which reflects additional data that the Social Security Administration has released since prior assumptions (MP-2015) were developed. Scale (MP-2016) results in lower projected mortality improvement than scale (MP-2015). We have historically utilized the Society of Actuaries’ published mortality data in our plan assumptions. Accordingly, we adopted MP-2016 for purposes of measuring our pension and postretirement obligations at December 31, 2016.
For the years ended December 31, 2016, 2015 and 2014, we recognized consolidated pre-tax pension (benefit) cost of $0.2 million, $(0.3) million and $0.2 million, respectively. We are not required to make any contributions to our pension plans during 2017. However, we may elect to adjust the level of contributions based on a number of factors, including performance of pension investments and changes in interest rates. The Pension Protection Act of 2006 provided for changes to the method of valuing pension plan assets and liabilities for funding purposes as well as requiring minimum funding levels. Our defined benefit pension plans are in compliance with minimum funding levels established in the Pension Protection Act. Funding levels will be affected by future contributions, investment returns on plan assets, growth in plan liabilities and interest rates. Once the plan is Fully Funded as that term is defined within the Pension Protection Act, we will be required to fund the ongoing growth in plan liabilities on an annual basis. We anticipate funding pension contributions with cash from operations.
For the years ended December 31, 2016, 2015 and 2014, we recognized a consolidated pre-tax postretirement benefit cost (income) of $(14.7) million, $3.7 million and $3.7 million, respectively. Postretirement benefit income includes the pre-tax gain of $15.6 million resulting from the settlement of our postretirement benefit obligation for our hourly retirees by making a one-time payment of $31.7 million during 2016.
Income taxes
We account for income taxes under the asset and liability method prescribed by ASC 740, Income Taxes. We provide for deferred income taxes based on differences between the book and tax bases of our assets and liabilities and for items that are reported for financial statement purposes in periods different from those for income tax reporting purposes. The deferred tax liability or asset amounts are based upon the enacted tax rates expected to apply to taxable income in the periods in which the deferred tax liability or asset is expected to be settled or realized.
Our income tax expense, deferred tax assets and liabilities and reserves for unrecognized tax benefits reflect our best assessment of estimated future taxes to be paid. Management judgment is required in developing our provision for income taxes, including the determination of deferred tax assets, liabilities and any valuation allowances recorded against the deferred tax assets. We record net deferred tax assets to the extent we believe these assets will more likely than not be realized. In evaluating whether it is more likely than not that our net deferred tax assets will be realized, we consider both positive and negative evidence including the reversal of existing taxable temporary differences, taxable income in prior carryback years if carryback is permitted under the tax law and such taxable income has not previously been used for carryback, future taxable income exclusive of reversing temporary
30
Table of Contents
differences and carryforwards based on near-term and longer-term projections of operating results and the length of the carryforward period. We evaluate the realizability of our net deferred tax assets and assess the valuation allowance on a quarterly basis, adjusting the amount of such allowance, if necessary. Failure to achieve forecasted taxable income might affect the ultimate realization of the net deferred tax assets. Factors that may affect our ability to achieve sufficient forecasted taxable income include, but are not limited to, increased competition, a decline in sales or margins and loss of market share.
At December 31, 2016, we had total net deferred tax assets of $4.2 million. Although realization of our net deferred tax assets is not certain, management has concluded that, based on the positive and negative evidence considered, we will more likely than not realize the full benefit of the deferred tax assets except for our deferred tax assets in certain states in which we operate. At December 31, 2016, we had a valuation allowance of $5.2 million against the tax benefit of net operating loss carryforwards in certain states in which we operate.
Product warranties
Warranty terms are based on the negotiated railcar sales contracts. We generally warrant that new railcars produced by us will be free from defects in material and workmanship under normal use and service identified for a period of up to five years from the time of sale. The Company also provides limited warranties with respect to certain rebuilt railcars. With respect to parts and materials manufactured by others and incorporated by us in our products, such parts and materials may be covered by the warranty provided by the original manufacturer. We establish a warranty reserve at the time of sale to account for future warranty charges. The warranty reserve consists of two categories: assigned claims and unassigned claims. The unassigned warranty reserve is calculated based on historical warranty costs adjusted for estimated material price changes and other factors. Once a warranty claim is filed for railcars under warranty, the estimated cost to correct the defect is moved from the unassigned reserve to the assigned reserve and tracked separately.
Revenue recognition
We recognize revenues on new and rebuilt railcars when (1) individual cars are completed, (2) the railcars are accepted by the customer following inspection, (3) the risk for any damage or other loss with respect to the railcars passes to the customer and (4) title to the railcars transfers to the customer. We do not record any returns or allowances against sales. Revenues derived from a single sales contract that contains multiple products and services are allocated based on the relative fair value of each item to be delivered and recognized in accordance with the applicable revenue recognition criteria for the specific unit of accounting. We value used railcars received at their estimated fair market value at the date of receipt less a normal profit margin.
When we retain substantial risk of ownership in railcars sold to customers, the proceeds received by us are not treated as a sale but are accounted for as a customer advance by recording the proceeds as a liability. Customer advances on our consolidated balance sheets are reported net of any repayments made by us and include imputed interest that is included in interest expense on our consolidated statements of operations.
Through September 30, 2015, we recognized service-related revenue from maintenance and repairs and inspections when all significant maintenance or repair or inspections services have been completed, quality accepted and delivery has occurred. We recognize revenue from parts sales when the risk of any damage or loss and title passes to the customer and delivery has occurred.
We recognize operating lease revenue on Inventory on Lease on a contractual basis and recognize operating lease revenue on Railcars Available for Lease on a straight-line basis over the life of the lease. We recognize revenue from the sale of Inventory on Lease on a gross basis in manufacturing sales and cost of sales if the manufacture of the railcars and the sales process is completed within 12 months. We recognize revenue from the sale of Railcars Available for Lease on a net basis as Gain (Loss) on Sale of Railcars Available for Lease since the sale represents the disposal of a long-term operating asset.
We recognize a loss when we have a contractual commitment to manufacture railcars at an estimated cost in excess of the contractual selling price.
We report amounts billed to customers for shipping and handling as part of sales in accordance with ASC 605-45, Revenue Recognition – Principal Agent Consideration, and reports related costs in cost of sales.
31
Table of Contents
RECENT ACCOUNTING PRONOUNCEMENTS
In January 2017, the Financial Accounting Standards Board (the “FASB”) issued Accounting Standards Update (“ASU”) 2017-04, Intangibles – Goodwill and Other (Topic 350): Simplifying the Test for Goodwill Impairment. Topic 350 currently requires an entity to perform a two-step test to determine the amount, if any, of goodwill impairment. The amendment in ASU 2017-04 removes the second step of the test. An entity will apply a one-step quantitative test and record the amount of goodwill impairment as the excess of a reporting unit’s carrying amount over its fair value, not to exceed the total amount of goodwill allocated to the reporting unit. This standard is effective for annual or interim goodwill impairment tests in fiscal years beginning after December 15, 2019 and early adoption is permitted.
In November 2016, the FASB issued ASU 2016-18, Statement of Cash Flows (Topic 230) Restricted Cash. The ASU requires that a statement of cash flows explain the change during the period in the total of cash, cash equivalents, restricted cash and restricted cash equivalents. As a result, restricted cash and restricted cash equivalents will be included in beginning-of-period and end-of-period total amounts shown on the statement of cash flows and changes in restricted cash and restricted cash equivalents will no longer be included in cash flows from investing activities. This standard is effective for fiscal years beginning after December 15, 2017 and interim periods within those fiscal years. The Company does not expect the adoption of this standard to have a material impact on its financial statements.
In March 2016, the FASB issued ASU 2016-09, Compensation – Stock Compensation (Topic 718) Improvements to Employee Share-Based Payment Accounting, to simplify the accounting for stock compensation. The ASU focuses on income tax accounting, award classification, estimating forfeitures and cash flow presentation. This standard is effective for fiscal years, and interim periods within those fiscal years, beginning after December 15, 2016 and early adoption is permitted. We do not expect the adoption of this standard to have a material impact on our financial statements.
In February 2016, the FASB issued ASU 2016-02, Leases (Topic 842), which requires a lessee to record a right-of-use asset and a lease liability for all leases with a term greater than twelve months regardless of whether the lease is classified as an operating lease or a financing lease. Leases with a term of twelve months or less will be accounted for in a similar manner to existing guidance for operating leases. This standard is effective for fiscal years beginning after December 15, 2018, including interim periods within those fiscal years. Early adoption is permitted. Entities are required to use a modified retrospective approach for leases that exist or are entered into after the beginning of the earliest comparative period in the financial statements. We are currently assessing the impact of this standard on our financial position, results of operations and cash flows.
In July 2015, the FASB issued ASU 2015-11, Inventory (Topic 330), which requires entities to measure most inventory at the lower of cost and net realizable value, thereby simplifying the current guidance under which an entity must measure inventory at the lower of cost or market. Under ASU 2015-11, inventory is measured at the lower of cost and net realizable value, which eliminates the need to determine replacement cost and evaluate whether it is above the ceiling (net realizable value) or below the floor (net realizable value less normal profit margin). ASU 2015-11 defines net realizable value as the estimated selling prices in the ordinary course of business, less reasonably predictable costs of completion, disposal and transportation. This standard is effective prospectively for annual reporting periods beginning after December 15, 2016 and early adoption is permitted. We do not expect the adoption of this standard to have a material impact on our financial statements.
In May 2014, the FASB issued ASU No. 2014-09, Revenue from Contracts with Customers, which was further clarified in March 2016. The ASU outlines a single comprehensive model for entities to use in accounting for revenue arising from contracts with customers and supersedes most prior revenue recognition guidance, including industry-specific guidance. The ASU is based on the principle that an entity should recognize revenue to depict the transfer of goods or services to customers in an amount that reflects the consideration to which the entity expects to be entitled in exchange for those goods or services. The ASU also requires additional disclosure about the nature, amount, timing and uncertainty of revenue and cash flows arising from customer contracts, including significant judgments and changes in judgments and assets recognized from costs incurred to fulfill a contract. Entities have the option of using either a full retrospective or a modified retrospective approach for the adoption of the new standard. The ASU is effective for annual reporting periods beginning after December 15, 2017 and early adoption for annual reporting periods beginning after December 15, 2016 is permitted.
32
Table of Contents
We plan to adopt ASU 2014-09 effective January 1, 2018 using the modified retrospective method of adoption. Under this method, the guidance will be applied only to the most current period presented in the financial statements and the cumulative effect of initially applying the standard will result in an adjustment to the opening balance of retained earnings as of the date of adoption. We continue to evaluate the requirements of the standard and their application to our business. We expect revenue recognition policies to remain substantially unchanged as a result of adopting ASU 2014-09, although this could change based on our continued evaluation.
FORWARD-LOOKING STATEMENTS
This annual report on Form 10-K contains certain forward-looking statements including, in particular, statements about our plans, strategies and prospects. We have used the words “may,” “will,” “expect,” “anticipate,” “believe,” “estimate,” “plan” and similar expressions in this prospectus to identify forward-looking statements. We have based these forward-looking statements on our current views with respect to future events and financial performance. Our actual results could differ materially from those projected in the forward-looking statements.
Our forward-looking statements are subject to risks and uncertainties, including:
| • | the cyclical nature of our business; |
| • | the competitive nature of our industry; |
| • | our reliance upon a small number of customers that represent a large percentage of our sales; |
| • | the variable purchase patterns of our customers and the timing of completion, delivery and customer acceptance of orders; |
| • | the availability and price of used railcars offered for sale and new or used railcars offered for lease; |
| • | fluctuating costs of raw materials, including steel and aluminum, and delays in the delivery of raw materials; |
| • | limitations on the supply of railcar components; |
| • | international economic and political risks to the extent we expand our sales of products and services internationally; |
| • | the risk of lack of acceptance of our new railcar offerings by our customers; |
| • | our reported backlog may not indicate what our future sales will be; |
| • | potential significant warranty claims; |
| • | acquisitions may fail to perform to expectations or we may fail to successfully integrate acquired businesses into our existing business; |
| • | the risk of losing key personnel; |
| • | shortages of skilled labor; |
| • | risks relating to our relationship with our unionized employees and their unions; |
| • | our reliance on a single supplier for our roll-formed center sills; |
| • | the risk of equipment failures, delays in deliveries or extensive damage to our facilities; |
| • | the risk that we are unable to renew our lease arrangements at our manufacturing facilities at commercially acceptable terms; |
| • | the risk of failing to adequately protect our intellectual property; |
| • | cybersecurity risks relating to our information technology and other systems; |
| • | our ability to maintain relationships with our suppliers of railcar components; |
| • | the risk of changes in U.S. tax law and rates; |
| • | the cost of complying with environmental laws and regulations; and |
| • | various covenants in the agreements governing our indebtedness that limit our management’s discretion in the operation of our businesses. |
Our actual results could be different from the results described in or anticipated by our forward-looking statements due to the inherent uncertainty of estimates, forecasts and projections and may be better or worse than anticipated. Given these uncertainties, you should not rely on forward-looking statements. Forward-looking statements represent our estimates and assumptions only as of the date that they were made. We expressly disclaim any duty to provide updates to forward-looking statements, and the estimates and assumptions associated with them, in order to reflect changes in circumstances or expectations or the occurrence of unanticipated events except to the extent required by applicable securities laws. All of the forward-looking statements are qualified in their entirety by reference to the factors discussed under Item 1A, “Risk Factors.”
33
Table of Contents
Item 7A. Quantitative and Qualitative Disclosures About Market Risk.
We have a $50 million senior secured revolving credit facility, the proceeds of which can be used for general corporate purposes, including working capital. On an annual basis, a 1% change in the interest rate in our revolving credit facility will increase or decrease our interest expense by $10,000 for every $1.0 million of outstanding borrowings. As of December 31, 2016, we had $5.7 million in outstanding letters of credit under the Revolving Credit Facility and therefore had $44.3 million available for borrowing under the Revolving Credit Facility.
The production of railcars and our operations require substantial amounts of aluminum and steel. The cost of aluminum, steel and all other materials (including scrap metal) used in the production of our railcars represents a significant majority of our direct manufacturing costs. Our business is subject to the risk of price increases and periodic delays in the delivery of aluminum, steel and other materials, all of which are beyond our control. Any fluctuations in the price or availability of aluminum or steel, or any other material used in the production of our railcars, may have a material adverse effect on our business, results of operations or financial condition. In addition, if any of our suppliers were unable to continue its business or were to seek bankruptcy relief, the availability or price of the materials we use could be adversely affected. When market conditions permit us to do so, we negotiate contracts with our customers that allow for variable pricing to protect us against future changes in the cost of raw materials. When raw material prices increase rapidly or to levels significantly higher than normal, we may not be able to pass price increases through to our customers, which could adversely affect our operating margins and cash flows.
We are not exposed to any significant foreign currency exchange risks as our general policy is to denominate foreign sales and purchases in U.S. dollars.
34
Table of Contents
Item 8. Financial Statements and Supplementary Data.
REPORT OF INDEPENDENT REGISTERED PUBLIC ACCOUNTING FIRM
To the Board of Directors and Stockholders of
FreightCar America, Inc.
Chicago, Illinois
We have audited the accompanying consolidated balance sheets of FreightCar America, Inc. and subsidiaries (the “Company”) as of December 31, 2016 and 2015, and the related consolidated statements of operations, comprehensive income (loss), stockholders’ equity, and cash flows for each of the three years in the period ended December 31, 2016. Our audits also included the financial statement schedule listed in the Index at Item 15. These financial statements and financial statement schedule are the responsibility of the Company’s management. Our responsibility is to express an opinion on the financial statements and financial statement schedule based on our audits.
We conducted our audits in accordance with the standards of the Public Company Accounting Oversight Board (United States). Those standards require that we plan and perform the audit to obtain reasonable assurance about whether the financial statements are free of material misstatement. An audit includes examining, on a test basis, evidence supporting the amounts and disclosures in the financial statements. An audit also includes assessing the accounting principles used and significant estimates made by management, as well as evaluating the overall financial statement presentation. We believe that our audits provide a reasonable basis for our opinion.
In our opinion, such consolidated financial statements present fairly, in all material respects, the financial position of FreightCar America, Inc. and subsidiaries as of December 31, 2016 and 2015, and the results of their operations and their cash flows for each of the three years in the period ended December 31, 2016, in conformity with accounting principles generally accepted in the United States of America. Also, in our opinion, such financial statement schedule, when considered in relation to the basic consolidated financial statements taken as a whole, present fairly, in all material respects, the information set forth therein.
We have also audited, in accordance with the standards of the Public Company Accounting Oversight Board (United States), the Company’s internal control over financial reporting as of December 31, 2016, based on the criteria established in Internal Control — Integrated Framework (2013) issued by the Committee of Sponsoring Organizations of the Treadway Commission and our report dated March 3, 2017 expressed an unqualified opinion on the Company’s internal control over financial reporting.
/s/ DELOITTE & TOUCHE LLP
Chicago, Illinois
March 3, 2017
35
Table of Contents
REPORT OF INDEPENDENT REGISTERED PUBLIC ACCOUNTING FIRM
To the Board of Directors and Stockholders of
FreightCar America, Inc.
Chicago, Illinois
We have audited the internal control over financial reporting of FreightCar America, Inc. and subsidiaries (the “Company”) as of December 31, 2016, based on criteria established in Internal Control — Integrated Framework (2013) issued by the Committee of Sponsoring Organizations of the Treadway Commission. The Company’s management is responsible for maintaining effective internal control over financial reporting and for its assessment of the effectiveness of internal control over financial reporting, included in the accompanying Management’s Report on Internal Control over Financial Reporting. Our responsibility is to express an opinion on the Company’s internal control over financial reporting based on our audit.
We conducted our audit in accordance with the standards of the Public Company Accounting Oversight Board (United States). Those standards require that we plan and perform the audit to obtain reasonable assurance about whether effective internal control over financial reporting was maintained in all material respects. Our audit included obtaining an understanding of internal control over financial reporting, assessing the risk that a material weakness exists, testing and evaluating the design and operating effectiveness of internal control based on the assessed risk, and performing such other procedures as we considered necessary in the circumstances. We believe that our audit provides a reasonable basis for our opinion.
A company’s internal control over financial reporting is a process designed by, or under the supervision of, the company’s principal executive and principal financial officers, or persons performing similar functions, and effected by the company’s board of directors, management, and other personnel to provide reasonable assurance regarding the reliability of financial reporting and the preparation of financial statements for external purposes in accordance with generally accepted accounting principles. A company’s internal control over financial reporting includes those policies and procedures that (1) pertain to the maintenance of records that, in reasonable detail, accurately and fairly reflect the transactions and dispositions of the assets of the company; (2) provide reasonable assurance that transactions are recorded as necessary to permit preparation of financial statements in accordance with generally accepted accounting principles, and that receipts and expenditures of the company are being made only in accordance with authorizations of management and directors of the company; and (3) provide reasonable assurance regarding prevention or timely detection of unauthorized acquisition, use, or disposition of the company’s assets that could have a material effect on the financial statements.
Because of inherent limitations of internal control over financial reporting, including the possibility of collusion or improper management override of controls, material misstatements due to error or fraud may not be prevented or detected on a timely basis. Also, projections of any evaluation of the effectiveness of the internal control over financial reporting to future periods are subject to the risk that the controls may become inadequate because of changes in conditions, or that the degree of compliance with the policies or procedures may deteriorate.
In our opinion, the company maintained, in all material respects, effective internal control over financial reporting as of December 31, 2016, based on criteria established in Internal Control — Integrated Framework (2013) issued by the Committee of Sponsoring Organizations of the Treadway Commission.
We have also audited, in accordance with the standards of the Public Company Accounting Oversight Board (United States), the consolidated financial statements and financial statement schedule as of and for the year ended December 31, 2016 of the Company and our report dated March 3, 2017 expressed an unqualified opinion on those financial statements and financial statement schedule.
/s/ DELOITTE & TOUCHE LLP
Chicago, Illinois
March 3, 2017
36
Table of Contents
FreightCar America, Inc. and Subsidiaries
CONSOLIDATED BALANCE SHEETS
(in thousands, except for share and per share data)
| December 31, 2016 |
December 31, 2015 |
|||||||
| Assets |
||||||||
| Current assets |
||||||||
| Cash and cash equivalents |
$ | 92,750 | $ | 83,068 | ||||
| Restricted cash and restricted certificates of deposit |
5,970 | 6,896 | ||||||
| Marketable securities |
— | 26,951 | ||||||
| Accounts receivable, net of allowance for doubtful accounts of $22 and $82, respectively |
25,207 | 39,708 | ||||||
| Inventories, net |
97,904 | 115,354 | ||||||
| Income taxes receivable |
13,283 | — | ||||||
| Other current assets |
6,056 | 8,704 | ||||||
|
|
|
|
|
|||||
| Total current assets |
241,170 | 280,681 | ||||||
| Property, plant and equipment, net |
46,347 | 42,596 | ||||||
| Railcars available for lease, net |
24,018 | 24,729 | ||||||
| Goodwill |
21,521 | 21,521 | ||||||
| Deferred income taxes, net |
4,221 | 34,722 | ||||||
| Other long-term assets |
1,978 | 2,655 | ||||||
|
|
|
|
|
|||||
| Total assets |
$ | 339,255 | $ | 406,904 | ||||
|
|
|
|
|
|||||
| Liabilities and Stockholders’ Equity |
||||||||
| Current liabilities |
||||||||
| Accounts and contractual payables |
$ | 34,536 | $ | 34,304 | ||||
| Accrued payroll and other employee costs |
3,117 | 8,708 | ||||||
| Reserve for worker’s compensation |
4,444 | 4,165 | ||||||
| Accrued warranty |
8,324 | 9,239 | ||||||
| Customer deposits and deferred revenue |
371 | 8,615 | ||||||
| Income taxes payable |
9 | 4,180 | ||||||
| Other current liabilities |
3,334 | 3,346 | ||||||
|
|
|
|
|
|||||
| Total current liabilities |
54,135 | 72,557 | ||||||
| Accrued pension costs |
6,821 | 6,673 | ||||||
| Accrued postretirement benefits, less current portion |
5,769 | 72,497 | ||||||
| Deferred income state and local incentives, long-term |
11,380 | 12,190 | ||||||
| Accrued taxes and other long-term liabilities |
4,236 | 7,876 | ||||||
|
|
|
|
|
|||||
| Total liabilities |
82,341 | 171,793 | ||||||
|
|
|
|
|
|||||
| Stockholders’ equity |
||||||||
| Preferred stock, $0.01 par value, 2,500,000 shares authorized (100,000 shares each designated as Series A voting and Series B non-voting, 0 shares issued and outstanding at December 31, 2016 and 2015) |
— | — | ||||||
| Common stock, $0.01 par value, 50,000,000 shares authorized, 12,731,678 shares issued at December 31, 2016 and 2015 |
127 | 127 | ||||||
| Additional paid in capital |
92,025 | 93,939 | ||||||
| Treasury stock, at cost, 351,746 and 402,166 shares at December 31, 2016 and 2015, respectively |
(14,583 | ) | (17,516 | ) | ||||
| Accumulated other comprehensive loss |
(8,163 | ) | (21,078 | ) | ||||
| Retained earnings |
187,508 | 179,639 | ||||||
|
|
|
|
|
|||||
| Total stockholders’ equity |
256,914 | 235,111 | ||||||
|
|
|
|
|
|||||
| Total liabilities and stockholders’ equity |
$ | 339,255 | $ | 406,904 | ||||
|
|
|
|
|
|||||
See notes to the consolidated financial statements
37
Table of Contents
FreightCar America, Inc. and Subsidiaries
CONSOLIDATED STATEMENTS OF OPERATIONS
(in thousands, except for share and per share data)
| Year Ended December 31, | ||||||||||||
| 2016 | 2015 | 2014 | ||||||||||
| Revenues |
$ | 523,731 | $ | 772,854 | $ | 598,518 | ||||||
| Cost of sales |
483,552 | 690,193 | 556,175 | |||||||||
|
|
|
|
|
|
|
|||||||
| Gross profit |
40,179 | 82,661 | 42,343 | |||||||||
| Selling, general and administrative expenses |
36,376 | 41,663 | 35,317 | |||||||||
| Gain on sale of railcars available for lease |
— | (1,187 | ) | (1,403 | ) | |||||||
| Gain on sale of railcar repair and maintenance services business and facility |
— | (4,578 | ) | (1,078 | ) | |||||||
| Gain on settlement of postretirement benefit obligation, net of plaintiffs’ attorneys’ fees |
(14,306 | ) | — | — | ||||||||
| Restructuring and impairment charges |
2,261 | — | — | |||||||||
|
|
|
|
|
|
|
|||||||
| Operating income |
15,848 | 46,763 | 9,507 | |||||||||
| Interest expense and deferred financing costs |
(171 | ) | (243 | ) | (1,077 | ) | ||||||
| Other income |
111 | 116 | 42 | |||||||||
|
|
|
|
|
|
|
|||||||
| Income before income taxes |
15,788 | 46,636 | 8,472 | |||||||||
| Income tax provision |
3,464 | 14,831 | 2,568 | |||||||||
|
|
|
|
|
|
|
|||||||
| Net income |
$ | 12,324 | $ | 31,805 | $ | 5,904 | ||||||
|
|
|
|
|
|
|
|||||||
| Net income per common share—basic |
$ | 1.00 | $ | 2.59 | $ | 0.49 | ||||||
|
|
|
|
|
|
|
|||||||
| Net income per common share—diluted |
$ | 1.00 | $ | 2.58 | $ | 0.49 | ||||||
|
|
|
|
|
|
|
|||||||
| Weighted average common shares outstanding—basic |
12,262,275 | 12,175,955 | 12,001,587 | |||||||||
|
|
|
|
|
|
|
|||||||
| Weighted average common shares outstanding—diluted |
12,262,275 | 12,217,755 | 12,103,520 | |||||||||
|
|
|
|
|
|
|
|||||||
| Dividends declared per common share |
$ | 0.36 | $ | 0.36 | $ | 0.24 | ||||||
|
|
|
|
|
|
|
|||||||
See notes to the consolidated financial statements
38
Table of Contents
FreightCar America, Inc. and Subsidiaries
CONSOLIDATED STATEMENTS OF COMPREHENSIVE INCOME (LOSS)
(in thousands)
| Year Ended December 31, | ||||||||||||
| 2016 | 2015 | 2014 | ||||||||||
| Net income |
$ | 12,324 | $ | 31,805 | $ | 5,904 | ||||||
|
|
|
|
|
|
|
|||||||
| Other comprehensive income (loss) net of tax: |
||||||||||||
| Pension liability adjustments, net of tax |
43 | 154 | (4,160 | ) | ||||||||
| Postretirement liability adjustments, net of tax |
12,872 | 2,785 | (4,725 | ) | ||||||||
|
|
|
|
|
|
|
|||||||
| Other comprehensive income (loss) |
12,915 | 2,939 | (8,885 | ) | ||||||||
|
|
|
|
|
|
|
|||||||
| Comprehensive income (loss) |
$ | 25,239 | $ | 34,744 | $ | (2,981 | ) | |||||
|
|
|
|
|
|
|
|||||||
See notes to the consolidated financial statements
39
Table of Contents
FreightCar America, Inc. and Subsidiaries
CONSOLIDATED STATEMENTS OF STOCKHOLDERS’ EQUITY
(in thousands, except for share data)
| Accumulated | ||||||||||||||||||||||||||||||||
| Additional | Other | Total | ||||||||||||||||||||||||||||||
| Common Stock | Paid In | Treasury Stock | Comprehensive | Retained | Stockholders’ | |||||||||||||||||||||||||||
| Shares | Amount | Capital | Shares | Amount | Loss | Earnings | Equity | |||||||||||||||||||||||||
| Balance, January 1, 2014 |
12,731,678 | $ | 127 | $ | 99,265 | (682,264 | ) | $ | (30,970 | ) | $ | (15,132 | ) | $ | 149,245 | $ | 202,535 | |||||||||||||||
| Net income |
— | — | — | — | — | — | 5,904 | 5,904 | ||||||||||||||||||||||||
| Other comprehensive loss |
— | — | — | — | — | (8,885 | ) | — | (8,885 | ) | ||||||||||||||||||||||
| Stock options exercised |
— | — | (148 | ) | 6,610 | 299 | — | — | 151 | |||||||||||||||||||||||
| Restricted stock awards |
— | — | (1,093 | ) | 24,212 | 1,093 | — | — | — | |||||||||||||||||||||||
| Employee stock settlement |
— | — | — | (8,770 | ) | (225 | ) | — | — | (225 | ) | |||||||||||||||||||||
| Forfeiture of restricted stock awards |
— | — | 168 | (5,657 | ) | (168 | ) | — | — | — | ||||||||||||||||||||||
| Stock-based compensation recognized |
— | — | 2,084 | — | — | — | — | 2,084 | ||||||||||||||||||||||||
| Excess tax benefit from stock-based compensation |
— | — | 27 | — | — | — | — | 27 | ||||||||||||||||||||||||
| Cash dividends |
— | — | — | — | — | — | (2,896 | ) | (2,896 | ) | ||||||||||||||||||||||
|
|
|
|
|
|
|
|
|
|
|
|
|
|
|
|
|
|||||||||||||||||
| Balance, December 31, 2014 |
12,731,678 | $ | 127 | $ | 100,303 | (665,869 | ) | $ | (29,971 | ) | $ | (24,017 | ) | $ | 152,253 | $ | 198,695 | |||||||||||||||
| Net income |
— | — | — | — | — | — | 31,805 | 31,805 | ||||||||||||||||||||||||
| Other comprehensive income |
— | — | — | — | — | 2,939 | — | 2,939 | ||||||||||||||||||||||||
| Stock options exercised |
— | — | (5,772 | ) | 240,410 | 10,697 | — | — | 4,925 | |||||||||||||||||||||||
| Restricted stock awards |
— | — | (2,955 | ) | 66,017 | 2,955 | — | — | — | |||||||||||||||||||||||
| Employee stock settlement |
— | — | — | (35,989 | ) | (1,052 | ) | — | — | (1,052 | ) | |||||||||||||||||||||
| Forfeiture of restricted stock awards |
— | — | 145 | (6,735 | ) | (145 | ) | — | — | — | ||||||||||||||||||||||
| Stock-based compensation recognized |
— | — | 2,183 | — | — | — | — | 2,183 | ||||||||||||||||||||||||
| Excess tax benefit from stock-based compensation |
— | — | 35 | — | — | — | — | 35 | ||||||||||||||||||||||||
| Cash dividends |
— | — | — | — | — | — | (4,419 | ) | (4,419 | ) | ||||||||||||||||||||||
|
|
|
|
|
|
|
|
|
|
|
|
|
|
|
|
|
|||||||||||||||||
| Balance, December 31, 2015 |
12,731,678 | $ | 127 | $ | 93,939 | (402,166 | ) | $ | (17,516 | ) | $ | (21,078 | ) | $ | 179,639 | $ | 235,111 | |||||||||||||||
| Net income |
— | — | — | — | — | — | 12,324 | 12,324 | ||||||||||||||||||||||||
| Other comprehensive income |
— | — | — | — | — | 12,915 | — | 12,915 | ||||||||||||||||||||||||
| Restricted stock awards |
— | — | (3,431 | ) | 80,096 | 3,431 | — | — | — | |||||||||||||||||||||||
| Employee stock settlement |
— | — | — | (4,343 | ) | (78 | ) | — | — | (78 | ) | |||||||||||||||||||||
| Forfeiture of restricted stock awards |
— | — | 420 | (25,333 | ) | (420 | ) | — | — | — | ||||||||||||||||||||||
| Stock-based compensation recognized |
— | — | 1,149 | — | — | — | — | 1,149 | ||||||||||||||||||||||||
| Deficiency of tax benefit from stock-based compensation |
— | — | (52 | ) | — | — | — | — | (52 | ) | ||||||||||||||||||||||
| Cash dividends |
— | — | — | — | — | — | (4,455 | ) | (4,455 | ) | ||||||||||||||||||||||
|
|
|
|
|
|
|
|
|
|
|
|
|
|
|
|
|
|||||||||||||||||
| Balance, December 31, 2016 |
12,731,678 | $ | 127 | $ | 92,025 | (351,746 | ) | $ | (14,583 | ) | $ | (8,163 | ) | $ | 187,508 | $ | 256,914 | |||||||||||||||
|
|
|
|
|
|
|
|
|
|
|
|
|
|
|
|
|
|||||||||||||||||
See notes to the consolidated financial statements
40
Table of Contents
FreightCar America, Inc. and Subsidiaries
CONSOLIDATED STATEMENTS OF CASH FLOWS
| (in thousands) | Year Ended December 31, | |||||||||||
| 2016 | 2015 | 2014 | ||||||||||
| Cash flows from operating activities |
||||||||||||
| Net income |
$ | 12,324 | $ | 31,805 | $ | 5,904 | ||||||
| Adjustments to reconcile net income to net cash flows provided by (used in) operating activities: |
||||||||||||
| Depreciation and amortization |
9,736 | 10,028 | 10,069 | |||||||||
| Recognition of deferred income from state and local incentives |
(2,129 | ) | (1,415 | ) | — | |||||||
| Gain on sale of railcars available for lease |
— | (1,187 | ) | (1,403 | ) | |||||||
| Gain on sale of railcar repair and maintenance services business and facility |
— | (4,578 | ) | (1,078 | ) | |||||||
| Gain on settlement of postretirement benefit plan obligation |
(15,606 | ) | — | — | ||||||||
| Deferred income taxes |
22,723 | (2,679 | ) | 1,991 | ||||||||
| Stock-based compensation recognized |
1,149 | 2,183 | 2,084 | |||||||||
| Other non-cash items, net |
1,800 | 1,465 | 996 | |||||||||
| Changes in operating assets and liabilities: |
||||||||||||
| Accounts receivable |
15,911 | (38,398 | ) | (52 | ) | |||||||
| Inventories |
17,056 | (36,927 | ) | 591 | ||||||||
| Other assets |
2,992 | (1,642 | ) | (1,142 | ) | |||||||
| Accounts and contractual payables |
260 | 137 | 16,379 | |||||||||
| Accrued payroll and employee benefits |
(5,589 | ) | 2,033 | 2,465 | ||||||||
| Income taxes receivable/payable |
(12,746 | ) | 6,374 | (3,957 | ) | |||||||
| Accrued warranty |
(915 | ) | 497 | 1,785 | ||||||||
| Customer deposits and other liabilities |
(8,690 | ) | (34,802 | ) | (48,757 | ) | ||||||
| Payment for settlement of postretirement benefit plan obligation |
(31,616 | ) | — | — | ||||||||
| Accrued pension costs and accrued postretirement benefits |
(6,445 | ) | 1,421 | 8,099 | ||||||||
|
|
|
|
|
|
|
|||||||
| Net cash flows provided by (used in) operating activities: |
215 | (65,685 | ) | (6,026 | ) | |||||||
|
|
|
|
|
|
|
|||||||
| Cash flows from investing activities |
||||||||||||
| Restricted cash deposits |
— | — | (1,017 | ) | ||||||||
| Restricted cash withdrawals |
— | — | 4,192 | |||||||||
| Purchase of restricted certificates of deposit |
(6,370 | ) | (2,165 | ) | (1,410 | ) | ||||||
| Maturity of restricted certificates of deposit |
7,296 | 1,284 | — | |||||||||
| Purchase of securities held to maturity |
— | (32,944 | ) | (68,956 | ) | |||||||
| Proceeds from maturity of securities |
27,001 | 54,004 | 60,002 | |||||||||
| Purchase of property, plant and equipment |
(13,846 | ) | (16,699 | ) | (11,802 | ) | ||||||
| Proceeds from sale of property, plant and equipment and railcars available for lease |
2 | 7,654 | 13,661 | |||||||||
| Proceeds from sale of railcar repair and maintenance services business and facility |
— | 17,589 | 2,124 | |||||||||
| Cost of railcars available for lease |
— | (8,724 | ) | — | ||||||||
| State and local incentives received |
— | 15,733 | — | |||||||||
|
|
|
|
|
|
|
|||||||
| Net cash flows provided by (used in) investing activities: |
14,083 | 35,732 | (3,206 | ) | ||||||||
|
|
|
|
|
|
|
|||||||
| Cash flows from financing activities |
||||||||||||
| Deferred financing costs |
(83 | ) | — | — | ||||||||
| Stock option exercise |
— | 4,925 | 151 | |||||||||
| Employee stock settlement |
(78 | ) | (1,052 | ) | (225 | ) | ||||||
| Excess tax benefit from stock-based compensation |
— | 35 | 27 | |||||||||
| Cash dividends paid to stockholders |
(4,455 | ) | (4,419 | ) | (2,896 | ) | ||||||
| Reduction in customer advance for production of leased railcars |
— | — | (19,799 | ) | ||||||||
|
|
|
|
|
|
|
|||||||
| Net cash flows used in financing activities: |
(4,616 | ) | (511 | ) | (22,742 | ) | ||||||
|
|
|
|
|
|
|
|||||||
| Net increase (decrease) in cash and cash equivalents |
9,682 | (30,464 | ) | (31,974 | ) | |||||||
| Cash and cash equivalents at beginning of year |
83,068 | 113,532 | 145,506 | |||||||||
|
|
|
|
|
|
|
|||||||
| Cash and cash equivalents at end of year |
$ | 92,750 | $ | 83,068 | $ | 113,532 | ||||||
|
|
|
|
|
|
|
|||||||
| Supplemental cash flow information |
||||||||||||
| Interest paid |
$ | 83 | $ | 109 | $ | 78 | ||||||
|
|
|
|
|
|
|
|||||||
| Income tax refunds received |
$ | 4,096 | $ | 646 | $ | 573 | ||||||
|
|
|
|
|
|
|
|||||||
| Income taxes paid |
$ | 4,668 | $ | 13,371 | $ | 220 | ||||||
|
|
|
|
|
|
|
|||||||
See notes to the consolidated financial statements
41
Table of Contents
FreightCar America, Inc. and Subsidiaries
NOTES TO CONSOLIDATED FINANCIAL STATEMENTS
For the Years Ended December 31, 2016, 2015 and 2014
(in thousands, except for share and per share data)
Note 1 – Description of the Business
FreightCar America, Inc. (“FreightCar”) operates primarily in North America through its direct and indirect subsidiaries, JAC Operations, Inc., Johnstown America, LLC, Freight Car Services, Inc., JAIX Leasing Company (“JAIX”), FreightCar Roanoke, LLC, FreightCar Mauritius Ltd. (“Mauritius”), FreightCar Rail Services, LLC (“FCRS”), FreightCar Short Line, Inc. (“FCSL”), FreightCar Alabama, LLC and FreightCar (Shanghai) Trading Co., Ltd. (herein collectively referred to as the “Company”), and manufactures a wide range of railroad freight cars, supplies railcar parts and leases freight cars. The Company designs and builds high-quality railcars, including coal cars, bulk commodity cars, covered hopper cars, intermodal and non-intermodal flat cars, mill gondola cars, coil steel cars and boxcars. The Company is headquartered in Chicago, Illinois and has facilities in the following locations: Cherokee, Alabama; Danville, Illinois; Grand Island, Nebraska; Johnstown, Pennsylvania; Roanoke, Virginia; and Shanghai, People’s Republic of China.
The Company and its direct and indirect subsidiaries are all Delaware corporations or Delaware limited liability companies except Mauritius, which is incorporated in Mauritius, and FreightCar (Shanghai) Trading Co., Ltd., which is organized in the People’s Republic of China. The Company’s direct and indirect subsidiaries are all wholly owned.
Note 2 – Summary of Significant Accounting Policies
Principles of Consolidation
The accompanying consolidated financial statements include the accounts of FreightCar America, Inc. and all of its direct and indirect subsidiaries. All intercompany accounts and transactions have been eliminated in consolidation.
Use of Estimates
The preparation of financial statements in conformity with accounting principles generally accepted in the United States (“GAAP”) requires management to make estimates and assumptions that affect the reported amounts of assets and liabilities and disclosure of contingent assets and liabilities at the date of the financial statements and the reported amounts of revenues and expenses during the reporting period. Significant estimates include the valuation of used railcars received in sale transactions, useful lives of long-lived assets, warranty, workers’ compensation accruals, pension and postretirement benefit assumptions, stock compensation, evaluation of goodwill, other intangibles and property, plant and equipment for impairment and the valuation of deferred taxes. Actual results could differ from those estimates.
Cash and Cash Equivalents
On a daily basis, cash in excess of current operating requirements is invested in various highly liquid investments. The Company considers all unrestricted short-term investments with maturities of three months or less when acquired to be cash equivalents. The amortized cost of cash equivalents approximate fair value because of the short maturity of these instruments.
The Company’s cash and cash equivalents are primarily deposited with one U.S. financial institution. Such deposits are in excess of federally insured limits.
Restricted Cash and Restricted Certificates of Deposit
The Company establishes restricted cash balances and restricted certificates of deposit to collateralize certain standby letters of credit with respect to purchase price payment guarantees and performance guarantees and to support the Company’s worker’s compensation insurance claims. The restrictions expire upon completing the Company’s related obligation.
42
Table of Contents
FreightCar America, Inc. and Subsidiaries
NOTES TO CONSOLIDATED FINANCIAL STATEMENTS (continued)
For the Years Ended December 31, 2016, 2015 and 2014
(in thousands, except for share and per share data)
Financial Instruments
Management estimates that all financial instruments (including cash equivalents, restricted cash and restricted certificates of deposit, marketable securities, accounts receivable and accounts payable) as of December 31, 2016 and 2015, have fair values that approximate their carrying values.
Upon purchase, the Company categorizes debt securities as securities held to maturity, securities available for sale or trading securities. Debt securities that the Company has the positive intent and ability to hold to maturity are classified as securities held to maturity and are reported at amortized cost adjusted for amortization of premium and accretion of discount on a level yield basis. Debt securities that are bought and held principally for the purpose of selling them in the near term are classified as trading securities and reported at fair value, with unrealized gains and losses included in earnings. Debt securities not classified as either held-to-maturity or trading securities are classified as securities available for sale and are reported at fair value, with unrealized gains and losses excluded from earnings and reported as a component of other comprehensive income, which is included in stockholders’ equity, net of deferred taxes.
Fair Value Measurements
Financial assets and liabilities are classified in their entirety based on the lowest level of input that is significant to the fair value measurement. The Company’s assessment of the significance of a particular input to the fair value measurement requires judgment, and may affect the valuation of assets and liabilities and the placement within the fair value hierarchy levels.
The Company classifies the inputs to valuation techniques used to measure fair value as follows:
| Level 1 — | Quoted prices (unadjusted) in active markets for identical assets and liabilities. | |
| Level 2 — | Inputs other than quoted prices for Level 1 inputs that are either directly or indirectly observable for the asset or liability including quoted prices for similar assets or liabilities in active markets, quoted prices for identical or similar assets or liabilities in inactive markets, inputs other than quoted prices that are observable for the asset or liability, and inputs that are derived from observable market data by correlation or other means. | |
| Level 3 — | Unobservable inputs for the asset or liability, including situations where there is little, if any, market activity for the asset or liability. | |
Inventories
Inventories are stated at the lower of cost or market value. Cost is determined on a first-in, first-out basis and includes material, labor and manufacturing overhead. The Company’s inventory consists of work in progress and finished goods for individual customer contracts, used railcars acquired upon trade-in and railcar parts retained for sale to external parties.
Leased Railcars
The Company offers railcar leases to its customers at market rates with terms and conditions that have been negotiated with the customers. It is the Company’s strategy to actively market these leased assets for sale to leasing companies and financial institutions rather than holding them to maturity. If, as of the date of the initial lease, management determines that the sale of the leased railcars is probable, and transfer of the leased railcars is expected to qualify for recognition as a completed sale within one year, then the leased railcars are classified as current assets on the balance sheet (Inventory on Lease). In determining whether it is probable that the leased railcars will be sold within one year, management considers general market conditions for similar railcars and considers whether market conditions are indicative of a potential sales price that will be acceptable to the Company to sell the cars within one year. Inventory on Lease is carried at the lower of cost or market value and is not depreciated. At the one-year
43
Table of Contents
FreightCar America, Inc. and Subsidiaries
NOTES TO CONSOLIDATED FINANCIAL STATEMENTS (continued)
For the Years Ended December 31, 2016, 2015 and 2014
(in thousands, except for share and per share data)
anniversary of the initial lease or such earlier date when management no longer believes the leased railcars will be sold within one year of the initial lease, the leased railcars are reclassified from current assets (Inventory on Lease) to long-term assets (Railcars Available for Lease). Railcars Available for Lease are depreciated over 40 years from the date the railcars are placed in service under the initial lease and evaluated for impairment on a quarterly basis.
Property, Plant and Equipment
Property, plant and equipment are stated at acquisition cost less accumulated depreciation. Depreciation is provided using the straight-line method over the original estimated useful lives of the assets or lease term if shorter, which are as follows:
| Description of Assets | Life | |||
| Buildings and improvements |
15-40 years | |||
| Leasehold improvements |
6-10 years | |||
| Machinery and equipment |
3-7 years | |||
| Software |
3-7 years | |||
Maintenance and repairs are charged to expense as incurred, while major refurbishments and improvements are capitalized. The cost and accumulated depreciation of items sold or retired are removed from the property accounts and any gain or loss is recorded in the consolidated statement of operations upon disposal or retirement.
Long-Lived Assets
The Company tests long-lived assets for recoverability whenever events or changes in circumstances indicate that the carrying amount of an asset may not be recoverable. These changes in circumstances may include a significant decrease in the market price of an asset group, a significant adverse change in the manner or extent in which an asset group is used, a current year operating loss combined with history of operating losses, or a current expectation that, more likely than not, a long-lived asset group will be sold or otherwise disposed of significantly before the end of its previously estimated useful life.
For assets to be held and used, the Company groups a long-lived asset or assets with other assets and liabilities at the lowest level for which identifiable cash flows are largely independent of the cash flows of other assets and liabilities. Estimates of future cash flows used to test the recoverability of a long-lived asset group include only the future cash flows that are directly associated with and that are expected to arise as a direct result of the use and eventual disposition of the asset group. Recoverability of the carrying value of the asset group is determined by comparing the carrying value of the asset group to total undiscounted future cash flows of the asset group. If the carrying value of the asset group is not recoverable, an impairment loss is measured based on the excess of the carrying amount of asset group over the estimated fair value of the asset group. An impairment loss for an asset group reduces only the carrying amounts of a long-lived asset or assets of the group being evaluated.
Research and Development
Costs associated with research and development are expensed as incurred and totaled approximately $386, $379 and $332 for the years ended December 31, 2016, 2015 and 2014, respectively. Such costs are reported within selling, general and administrative expenses in the consolidated statements of operations.
Goodwill and Intangible Assets
The Company assesses the carrying value of goodwill for impairment as required by ASC 350, Intangibles – Goodwill and Other, annually or more frequently whenever events occur and circumstances change indicating potential impairment. During its annual goodwill impairment assessments as of August 1, 2016, 2015 and 2014, management estimated the value of the Company’s reporting units that carry goodwill using the income approach,
44
Table of Contents
FreightCar America, Inc. and Subsidiaries
NOTES TO CONSOLIDATED FINANCIAL STATEMENTS (continued)
For the Years Ended December 31, 2016, 2015 and 2014
(in thousands, except for share and per share data)
which indicates the fair value of a business based on the present value of the cash flows that the business can be expected to generate in the future, and the market approach, which uses the price at which shares of similar companies are exchanged to estimate the fair value of a company’s equity. Within the income approach, the discounted cash flow method was used, and within the market approach, the guideline company method was used. Fair value based on the income approach was given a 60% weighting and fair value based on the market approach was given a 40% weighting. Only the market approach was used in evaluating goodwill impairment for the Services reporting unit as of August 1, 2015. Management concluded that the estimated fair value of the Company’s reporting units exceeded the carrying value as of the dates of the Company’s impairment tests for 2016, 2015 and 2014, and therefore no impairment charges were recorded. If market conditions further deteriorate or the Manufacturing reporting unit performance is worse than is currently projected over an extended period of time, the reporting unit could potentially be at risk of an impairment charge. As of December 31, 2016, the total goodwill balance of the Manufacturing reporting unit was $21.5 million.
Patents are amortized on a straight-line method over their remaining legal lives from the date of acquisition. Customer related intangible assets are amortized from the date of acquisition based on the estimated cash flows to be generated from the intangibles. The Company assesses the carrying value of patents and customer related intangible assets for impairment whenever events occur and circumstances change indicating potential impairment.
Income Taxes
For federal income tax purposes, the Company files a consolidated federal tax return. The Company also files state tax returns in states where the Company has operations. In conformity with ASC 740, Income Taxes, the Company provides for deferred income taxes on differences between the book and tax bases of its assets and liabilities and for items that are reported for financial statement purposes in periods different from those for income tax reporting purposes.
Management evaluates net deferred tax assets and provides a valuation allowance when it believes that it is more likely than not that some portion of these assets will not be realized. In making this determination, management evaluates both positive evidence, such as cumulative pre-tax income for previous years, the projection of future taxable income, the reversals of existing taxable temporary differences and tax planning strategies, and negative evidence, such as any recent history of losses and any projected losses. Management also considers the expiration dates of net operating loss carryforwards in the evaluation of net deferred tax assets. Management evaluates the realizability of the Company’s net deferred tax assets and assesses the valuation allowance on a quarterly basis, adjusting the amount of such allowance as necessary.
Tax benefits related to uncertain tax positions taken or expected to be taken on a tax return are recorded when such benefits meet a more likely than not threshold. Otherwise, these tax benefits are recorded when a tax position has been effectively settled, which means that the appropriate taxing authority has completed its examination even though the statute of limitations remains open, or the statute of limitation expires. Interest and penalties related to uncertain tax positions are recognized as part of the provision for income taxes and are accrued beginning in the period that such interest and penalties would be applicable under relevant tax law until such time that the related tax benefits are recognized.
Product Warranties
Warranty terms are based on the negotiated railcar sales contracts. The Company generally warrants that new railcars produced by it will be free from defects in material and workmanship under normal use and service identified for a period of up to five years from the time of sale. The Company also provides limited warranties with respect to certain rebuilt railcars. With respect to parts and materials manufactured by others and incorporated by the Company in its products, such parts and materials may be covered by the warranty provided by the original manufacturer. The Company establishes a warranty reserve at the time of sale to account for future warranty charges. The warranty reserve consists of two categories: assigned claims and unassigned claims. The unassigned warranty reserve is calculated based on historical warranty costs adjusted for estimated material price changes and other factors. Once a warranty claim is filed for railcars under warranty, the estimated cost to correct the defect is moved from the unassigned reserve to the assigned reserve and tracked separately.
45
Table of Contents
FreightCar America, Inc. and Subsidiaries
NOTES TO CONSOLIDATED FINANCIAL STATEMENTS (continued)
For the Years Ended December 31, 2016, 2015 and 2014
(in thousands, except for share and per share data)
State and Local Incentives
The Company records state and local incentives when there is reasonable assurance that the incentive will be received and the Company is able to comply with the conditions attached to the incentives received. State and local incentives related to assets are recorded as deferred income and recognized on a straight-line basis over the useful life of the related long-lived assets of seven to sixteen years.
Revenue Recognition
Revenues on new and rebuilt railcars are recognized when (1) individual cars are completed, (2) the railcars are accepted by the customer following inspection, (3) the risk for any damage or other loss with respect to the railcars passes to the customer and (4) title to the railcars transfers to the customer. There are no sales returns or allowances.
Revenues derived from a single sales contract that contains multiple products and services are allocated based on the relative fair value of each item to be delivered and recognized in accordance with the applicable revenue recognition criteria for the specific unit of accounting. When the Company retains substantial risk of ownership in railcars sold to customers, the proceeds received by the Company are not treated as a sale but are accounted for as a customer advance by recording the proceeds as a liability. Customer advances on the Company’s consolidated balance sheets are reported net of any repayments made by the Company and include imputed interest that is included in interest expense on the Company’s consolidated statements of operations. The Company recognizes revenue from parts sales when the risk of any damage or loss and title passes to the customer and delivery has occurred.
The Company recognizes operating lease revenue on Inventory on Lease on a contractual basis and recognizes operating lease revenue on Railcars Available for Lease on a straight-line basis over the life of the lease. The Company recognizes revenue from the sale of Inventory on Lease on a gross basis in manufacturing sales and cost of sales if the manufacture of the railcars and the sales process is completed within 12 months. The Company recognizes revenue from the sale of Railcars Available for Lease on a net basis as Gain (Loss) on Sale of Railcars Available for Lease since the sale represents the disposal of a long-term operating asset.
The Company reports amounts billed to customers for shipping and handling as part of sales in accordance with ASC 605-45, Revenue Recognition – Principal Agent Consideration, and reports related costs in cost of sales.
Earnings Per Share
The Company computes earnings (loss) per share using the two-class method, which is an earnings (loss) allocation formula that determines earnings (loss) per share for common stock and participating securities. The Company’s participating securities are its grants of restricted stock which contain non-forfeitable rights to dividends. Basic earnings (loss) per share attributable to common shareholders is computed by dividing net income (loss) attributable to common shareholders by the weighted average common shares outstanding. The calculation of diluted earnings per share includes the effect of any dilutive equity incentive instruments. The Company uses the treasury stock method to calculate the effect of outstanding dilutive equity incentive instruments, which requires the Company to compute total proceeds as the sum of (1) the amount the employee must pay upon exercise of the award, (2) the amount of unearned stock-based compensation costs attributed to future services and (3) the amount of tax benefits, if any, that would be credited to additional paid-in capital assuming exercise of the award. Equity incentive instruments for which the total employee proceeds from exercise exceed the average fair value of the same equity incentive instrument over the period have an anti-dilutive effect on earnings per share during periods with net income from continuing operations, and accordingly, the Company excludes them from the calculation.
46
Table of Contents
FreightCar America, Inc. and Subsidiaries
NOTES TO CONSOLIDATED FINANCIAL STATEMENTS (continued)
For the Years Ended December 31, 2016, 2015 and 2014
(in thousands, except for share and per share data)
Recent Accounting Pronouncements
In January 2017, the Financial Accounting Standards Board (the “FASB”) issued Accounting Standards Update (“ASU”) 2017-04, Intangibles – Goodwill and Other (Topic 350): Simplifying the Test for Goodwill Impairment. Topic 350 currently requires an entity to perform a two-step test to determine the amount, if any, of goodwill impairment. The amendment in ASU 2017-04 removes the second step of the test. An entity will apply a one-step quantitative test and record the amount of goodwill impairment as the excess of a reporting unit’s carrying amount over its fair value, not to exceed the total amount of goodwill allocated to the reporting unit. This standard is effective for annual or interim goodwill impairment tests in fiscal years beginning after December 15, 2019 and early adoption is permitted.
In November 2016, the FASB issued ASU 2016-18, Statement of Cash Flows (Topic 230) Restricted Cash. The ASU requires that a statement of cash flows explain the change during the period in the total of cash, cash equivalents, restricted cash and restricted cash equivalents. As a result, restricted cash and restricted cash equivalents will be included in beginning-of-period and end-of-period total amounts shown on the statement of cash flows and changes in restricted cash and restricted cash equivalents will no longer be included in cash flows from investing activities. This standard is effective for fiscal years beginning after December 15, 2017, and interim periods within those fiscal years. The Company does not expect the adoption of this standard to have a material impact on its financial statements.
In March 2016, the FASB issued ASU 2016-09, Compensation – Stock Compensation (Topic 718) Improvements to Employee Share-Based Payment Accounting, to simplify the accounting for stock compensation. The ASU focuses on income tax accounting, award classification, estimating forfeitures and cash flow presentation. This standard is effective for fiscal years, and interim periods within those fiscal years, beginning after December 15, 2016 and early adoption is permitted. The Company does not expect the adoption of this standard to have a material impact on its financial statements.
In February 2016, the FASB issued ASU 2016-02, Leases (Topic 842), which requires a lessee to record a right-of-use asset and a lease liability for all leases with a term greater than twelve months regardless of whether the lease is classified as an operating lease or a financing lease. Leases with a term of twelve months or less will be accounted for in a similar manner to existing guidance for operating leases. This standard is effective for fiscal years beginning after December 15, 2018, including interim periods within those fiscal years. Early adoption is permitted. Entities are required to use a modified retrospective approach for leases that exist or are entered into after the beginning of the earliest comparative period in the financial statements. The Company is currently assessing the impact of this standard on the Company’s financial position, results of operations and cash flows.
In July 2015, the FASB issued ASU 2015-11, Inventory (Topic 330), which requires entities to measure most inventory at the lower of cost and net realizable value, thereby simplifying the current guidance under which an entity must measure inventory at the lower of cost or market. Under ASU 2015-11, inventory is measured at the lower of cost and net realizable value, which eliminates the need to determine replacement cost and evaluate whether it is above the ceiling (net realizable value) or below the floor (net realizable value less normal profit margin). ASU 2015-11 defines net realizable value as the estimated selling prices in the ordinary course of business, less reasonably predictable costs of completion, disposal and transportation. This standard is effective prospectively for annual reporting periods beginning after December 15, 2016 and early adoption is permitted. The Company does not expect the adoption of this standard to have a material impact on its financial statements.
In May 2014, the FASB issued ASU No. 2014-09, Revenue from Contracts with Customers, which was further clarified in March 2016. The ASU outlines a single comprehensive model for entities to use in accounting for revenue arising from contracts with customers and supersedes most prior revenue recognition guidance, including industry-specific guidance. The ASU is based on the principle that an entity should recognize revenue to depict the transfer of goods or services to customers in an amount that reflects the consideration to which the entity expects to be entitled in exchange for those goods or services. The ASU also requires additional disclosure about the nature, amount, timing and uncertainty of revenue and cash flows arising from customer contracts, including significant judgments and changes in judgments and assets recognized from costs incurred to fulfill a contract. Entities have the option of using either a full retrospective or a modified retrospective approach for the adoption of the new standard. The ASU is effective for annual reporting periods beginning after December 15, 2017 and early adoption for annual reporting periods beginning after December 15, 2016 is permitted.
47
Table of Contents
FreightCar America, Inc. and Subsidiaries
NOTES TO CONSOLIDATED FINANCIAL STATEMENTS (continued)
For the Years Ended December 31, 2016, 2015 and 2014
(in thousands, except for share and per share data)
The Company plans to adopt ASU 2014-09 effective January 1, 2018 using the modified retrospective method of adoption. Under this method, the guidance will be applied only to the most current period presented in the financial statements and the cumulative effect of initially applying the standard will result in an adjustment to the opening balance of retained earnings as of the date of adoption. The Company continues to evaluate the requirements of the standard and their application to our business. We expect revenue recognition policies to remain substantially unchanged as a result of adopting ASU 2014-09, although this could change based on our continued evaluation.
Note 3 – Fair Value Measurements
The following table sets forth by level within the ASC 820 fair value hierarchy the Company’s financial assets that were recorded at fair value on a recurring basis and the Company’s non-financial assets that were recorded at fair value on a non-recurring basis.
| Recurring Fair Value Measurements |
As of December 31, 2016 | |||||||||||||||
| Level 1 | Level 2 | Level 3 | Total | |||||||||||||
| ASSETS: |
||||||||||||||||
| Cash equivalents |
$ | 15,156 | $ | — | $ | — | $ | 15,156 | ||||||||
| Restricted certificates of deposit |
$ | 5,970 | $ | — | $ | — | $ | 5,970 | ||||||||
| Escrow receivable |
$ | — | $ | — | $ | 1,910 | $ | 1,910 | ||||||||
| Recurring Fair Value Measurements |
As of December 31, 2015 | |||||||||||||||
|
|
|
|||||||||||||||
| Level 1 | Level 2 | Level 3 | Total | |||||||||||||
| ASSETS: |
||||||||||||||||
| Cash equivalents |
$ | 33,150 | $ | — | $ | — | $ | 33,150 | ||||||||
| Restricted certificates of deposit |
$ | 6,896 | $ | — | $ | — | $ | 6,896 | ||||||||
| Escrow receivable |
$ | — | $ | — | $ | 1,910 | $ | 1,910 | ||||||||
The sale of the Company’s railcar repair and maintenance services business on September 30, 2015 resulted in $1,960 of the aggregate purchase price being placed into escrow in order to secure the indemnification obligations of FCRS and FCSL. The fair market value of the escrow receivable above represents the $1,960 escrow balance, net of the fair value of the indemnification obligations, which was estimated using the discounted probability-weighted cash flow method.
The carrying value of property, plant and equipment at the Company’s Johnstown, Pennsylvania administrative facility was reduced to its estimated fair market value during the third quarter of 2016, resulting in a non-cash impairment charge of $1,255. Fair market value was estimated using the market approach using market data such as recent sales of comparable assets in active markets and estimated salvage values. No non-financial assets were recorded at fair value on a non-recurring basis as of December 31, 2015.
Note 4 – Marketable Securities
The Company’s current investment policy is to invest in cash, certificates of deposit, U.S. treasury securities, U.S. government agency obligations and money market funds invested in U.S. government securities. Marketable securities as of December 31, 2015 of $26,951 consisted of U.S. treasury securities held to maturity and certificates of deposit with original maturities of greater than 90 days and up to one year. Due to the short-term nature of these securities and their low interest rates, there is no material difference between their fair market values and amortized costs. The Company owned no marketable securities as of December 31, 2016.
Note 5 – Inventories
Inventories, net of reserve for excess and obsolete items, consist of the following:
48
Table of Contents
FreightCar America, Inc. and Subsidiaries
NOTES TO CONSOLIDATED FINANCIAL STATEMENTS (continued)
For the Years Ended December 31, 2016, 2015 and 2014
(in thousands, except for share and per share data)
| December 31, | ||||||||
| 2016 | 2015 | |||||||
| Work in process |
$ | 83,576 | $ | 108,099 | ||||
| Finished new railcars |
11,858 | 2,538 | ||||||
| Parts inventory |
2,470 | 4,717 | ||||||
|
|
|
|
|
|||||
| Total inventories, net |
$ | 97,904 | $ | 115,354 | ||||
|
|
|
|
|
|||||
Inventory on the Company’s consolidated balance sheets includes reserves of $4,307 and $3,793 relating to excess or slow-moving inventory for parts and work in process at December 31, 2016 and 2015, respectively.
Note 6 – Leased Railcars
Railcars available for lease at December 31, 2016 was $24,018 (cost of $27,954 and accumulated depreciation of $3,936) and at December 31, 2015 was $24,729 (cost of $27,954 and accumulated depreciation of $3,225). The Company’s lease utilization rate for railcars in its lease fleet was 73% as of each of December 31, 2016 and 2015. Depreciation expense on railcars available for lease was $711, $499 and $986 for the years ended December 31, 2016, 2015 and 2014, respectively.
Leased railcars at December 31, 2016 are subject to lease agreements with external customers with remaining terms of up to four and a half years and are accounted for as operating leases.
Future minimum rental revenues on leases at December 31, 2016 are as follows:
| Year ending December 31, 2017 |
$ | 1,706 | ||
| Year ending December 31, 2018 |
1,118 | |||
| Year ending December 31, 2019 |
1,001 | |||
| Year ending December 31, 2020 |
1,001 | |||
| Year ending December 31, 2021 |
275 | |||
| Thereafter |
— | |||
|
|
|
|||
| $ | 5,101 | |||
|
|
|
Note 7 – Restructuring and Impairment Charges
On August 1, 2016, the Company announced a cost reduction program whereby approximately 15% of the Company’s salaried administrative workforce would be eliminated, its Johnstown, Pennsylvania administrative facility would be closed and certain discretionary spending would be reduced. The total estimated costs of implementing this program are approximately $2,700, including approximately $1,100 of employee-related costs and approximately $1,255 of long-lived asset impairments.
In connection with the Company’s cost reduction program during 2016, the Company recorded restructuring and impairment charges of $2,261, which are reported as a separate line item on the Company’s consolidated statements of operations. These charges consisted primarily of non-cash impairment charges of $1,255 for property, plant and equipment at the Company’s Johnstown administrative facility and employee severance and other employment termination costs of $1,006, of which $371 is outstanding as of December 31, 2016.
In the first quarter of 2017, in response to lower order trends in the industry, the Company announced further reductions to its salaried workforce and initiatives to reduce discretionary spending. These actions are expected to be completed by the end of the second quarter of 2017. Total estimated costs to implement these actions are approximately $1,000 of employee-related costs.
49
Table of Contents
FreightCar America, Inc. and Subsidiaries
NOTES TO CONSOLIDATED FINANCIAL STATEMENTS (continued)
For the Years Ended December 31, 2016, 2015 and 2014
(in thousands, except for share and per share data)
Note 8 – Property, Plant and Equipment
Property, plant and equipment consists of the following:
| December 31, | ||||||||
| 2016 | 2015 | |||||||
| Land (including easements) |
$ | 151 | $ | 151 | ||||
| Buildings and improvements |
1,398 | 2,370 | ||||||
| Leasehold improvements |
14,888 | 8,994 | ||||||
| Machinery and equipment |
69,960 | 62,217 | ||||||
| Software |
9,034 | 9,018 | ||||||
| Construction in process |
640 | 940 | ||||||
|
|
|
|
|
|||||
| Total cost |
96,071 | 83,690 | ||||||
| Less: Accumulated depreciation and amortization |
(49,724 | ) | (41,094 | ) | ||||
|
|
|
|
|
|||||
| Total property, plant and equipment, net |
$ | 46,347 | $ | 42,596 | ||||
|
|
|
|
|
|||||
Depreciation expense for the years ended December 31, 2016, 2015 and 2014, was $8,666, $8,858 and $8,363, respectively. The table above reflects the impairment charge of $1,255 to property, plant and equipment described in Note 7.
Note 9 – Intangible Assets and Goodwill
Intangible assets, which are included in other long-term assets on the consolidated balance sheet, consist of the following:
| December 31, | ||||||||
| 2016 | 2015 | |||||||
| Patents |
$ | — | $ | 13,097 | ||||
| Accumulated amortization |
— | (12,738 | ) | |||||
|
|
|
|
|
|||||
| Patents, net of accumulated amortization |
— | 359 | ||||||
|
|
|
|
|
|||||
| Total amortizing intangibles |
$ | — | $ | 359 | ||||
|
|
|
|
|
|||||
Amortization expense related to patents, which is included in cost of sales, was $359, $591 and $590 for the years ended December 31, 2016, 2015 and 2014, respectively.
The Company had $21,521 of goodwill associated with its Manufacturing segment as of each of December 31, 2016 and 2015.
Note 10 – Product Warranties
Warranty terms are based on the negotiated railcar sales contracts. The Company generally warrants that new railcars produced by it will be free from defects in material and workmanship under normal use and service identified for a period of up to five years from the time of sale. The changes in the warranty reserve for the years ended December 31, 2016, 2015 and 2014, are as follows:
50
Table of Contents
FreightCar America, Inc. and Subsidiaries
NOTES TO CONSOLIDATED FINANCIAL STATEMENTS (continued)
For the Years Ended December 31, 2016, 2015 and 2014
(in thousands, except for share and per share data)
| December 31, | ||||||||||||
| 2016 | 2015 | 2014 | ||||||||||
| Balance at the beginning of the year |
$ | 9,239 | $ | 8,742 | $ | 6,957 | ||||||
| Current year provision |
2,394 | 3,209 | 2,259 | |||||||||
| Reductions for payments, costs of repairs and other |
(1,812 | ) | (1,611 | ) | (748 | ) | ||||||
| Adjustments to prior warranties |
(1,497 | ) | (1,101 | ) | 274 | |||||||
|
|
|
|
|
|
|
|||||||
| Balance at the end of the year |
$ | 8,324 | $ | 9,239 | $ | 8,742 | ||||||
|
|
|
|
|
|
|
|||||||
Adjustments to prior warranties includes changes in the warranty reserve for warranties issued in prior periods due to expiration of the warranty period, revised warranty cost estimates and other factors.
Note 11 – State and Local Incentives
During the year ended December 31, 2015, the Company received cash payments of $15,733 for Alabama state and local incentives related to the Company’s capital investment and employment levels at its Cherokee, Alabama (“Shoals”) facility. Under the incentive agreements, a certain portion of the incentives may be repayable by the Company if targeted levels of employment are not maintained for a period of six years from the date of the incentive. The Company’s level of employment at its Shoals facility currently exceeds and is expected to continue to exceed the minimum targeted levels of employment. In the event that any portion of the incentives is required to be paid back, the amount is unlikely to exceed the deferred liability balance at December 31, 2016.
In December 2016, the Company also qualified for an additional $1,410 in incentives at the Shoals facility. This amount was received in January 2017.
The changes in deferred income from these incentives for the years ended December 31, 2016 and 2015, are as follows:
| December 31, | ||||||||
| 2016 | 2015 | |||||||
| Balance at the beginning of the year |
$ | 14,318 | $ | — | ||||
| State and local incentives received during the year |
1,410 | 15,733 | ||||||
| Recognition of state and local incentives as a reduction of cost of sales |
(2,129 | ) | (1,415 | ) | ||||
|
|
|
|
|
|||||
| Balance at the end of the year, including current portion |
$ | 13,599 | $ | 14,318 | ||||
|
|
|
|
|
|||||
Note 12 – Revolving Credit Facility
On June 13, 2016, the Company entered into a First Amendment to Credit Agreement (the “First Amendment”) by and among FreightCar and certain of its subsidiaries, as borrowers and guarantors (together, the “Borrowers”), and Bank of America, N.A., as lender, administrative agent, swingline lender and letter of credit issuer (the “Bank”). The First Amendment amended the Credit Agreement, dated as of July 26, 2013 (the “Original Credit Agreement”), by and among the Borrowers and the Bank in order to, among other things: (1) extend the term of the Original Credit Agreement to July 26, 2019; and (2) replace the negative covenant requiring a minimum consolidated net liquidity of $35,000 with a negative covenant requiring a maximum consolidated net leverage ratio of 2.50:1.00.
The Original Credit Agreement, as amended by the First Amendment (the “Credit Agreement”), contains a $50,000 senior secured revolving credit facility (the “Revolving Credit Facility”) and a sub-facility for letters of credit not to exceed the lesser of $30,000 and the amount of the senior secured revolving credit facility at such time. The Revolving Credit Facility can be used for general corporate purposes, including working capital. Under the Credit Agreement, revolving loans outstanding will bear interest at a rate of LIBOR plus an applicable margin of between
51
Table of Contents
FreightCar America, Inc. and Subsidiaries
NOTES TO CONSOLIDATED FINANCIAL STATEMENTS (continued)
For the Years Ended December 31, 2016, 2015 and 2014
(in thousands, except for share and per share data)
1.25% and 1.75% depending on the Company’s consolidated leverage ratio or at a base rate, as selected by the Company. Base rate loans will bear interest at the highest of (a) the federal funds rate plus 0.50%, (b) the prime rate or (c) LIBOR plus 1.00%. The Company is required to pay a non-utilization fee of between 0.10% and 0.25% on the unused portion of the revolving loan commitment depending on the Company’s quarterly average balance of unrestricted cash and the Company’s consolidated leverage ratio. Borrowings under the Revolving Credit Facility are secured by a first priority perfected security interest in substantially all of the Borrowers’ assets excluding railcars held by the Company’s railcar leasing subsidiary, JAIX. The Borrowers also have pledged all of the equity interests in the Company’s direct and indirect domestic subsidiaries as security for the Revolving Credit Facility. The Credit Agreement has both affirmative and negative covenants, including, without limitation, the maximum consolidated net leverage ratio requirement and limitations on indebtedness, liens and investments. The Credit Agreement also provides for customary events of default.
As of December 31, 2016 and 2015, the Company had no borrowings under the Revolving Credit Facility (as in effect on such date). As of December 31, 2016 and 2015, the Company had $5,720 and $6,896, respectively, in outstanding letters of credit under the Revolving Credit Facility and therefore had $44,280 and $43,104, respectively, available for borrowing under the Revolving Credit Facility (as in effect on such date).
Note 13 – Accumulated Other Comprehensive Income (Loss)
The changes in accumulated other comprehensive income (loss) consist of the following:
| Pre-Tax | Tax | After-Tax | ||||||||||
| Year ended December 31, 2016 |
||||||||||||
| Pension liability activity: |
||||||||||||
| Actuarial loss |
$ | (433 | ) | $ | (154 | ) | $ | (279 | ) | |||
| Reclassification adjustment for amortization of net loss (pre-tax cost of sales of $279 and selling, general and administrative expenses of $220) |
499 | 177 | 322 | |||||||||
| Postretirement liability activity: |
||||||||||||
| Actuarial loss |
(1,586 | ) | (563 | ) | (1,023 | ) | ||||||
| Settlement gain |
37,190 | 13,202 | 23,988 | |||||||||
| Reclassification adjustment for settlement income (pre-tax gain on settlement of postretirement benefit obligation) |
(15,606 | ) | (5,540 | ) | (10,066 | ) | ||||||
| Reclassification adjustment for prior service curtailment cost |
38 | 14 | 24 | |||||||||
| Reclassification adjustment for amortization of net gain (pre-tax cost of sales ($80), selling, general and administrative expenses of ($17)) |
(97 | ) | (34 | ) | (63 | ) | ||||||
| Reclassification adjustment for amortization of prior service cost (pre-tax cost of sales of $14 and selling, general and administrative expenses of $4) |
18 | 6 | 12 | |||||||||
|
|
|
|
|
|
|
|||||||
| $ | 20,023 | $ | 7,108 | $ | 12,915 | |||||||
|
|
|
|
|
|
|
|||||||
52
Table of Contents
FreightCar America, Inc. and Subsidiaries
NOTES TO CONSOLIDATED FINANCIAL STATEMENTS (continued)
For the Years Ended December 31, 2016, 2015 and 2014
(in thousands, except for share and per share data)
| Pre-Tax | Tax | After-Tax | ||||||||||
| Year ended December 31, 2015 |
||||||||||||
| Pension liability activity: |
||||||||||||
| Actuarial loss |
$ | (190 | ) | $ | (67 | ) | $ | (123 | ) | |||
| Reclassification adjustment for amortization of net loss (pre-tax cost of sales of $333 and selling, general and administrative expenses of $107) |
440 | 163 | 277 | |||||||||
| Postretirement liability activity: |
||||||||||||
| Actuarial gain |
3,621 | 1,273 | 2,348 | |||||||||
| Reclassification adjustment for amortization of net loss (pre-tax cost of sales of $567 and selling, general and administrative expenses of $80) |
647 | 237 | 410 | |||||||||
| Reclassification adjustment for amortization of prior service cost (pre-tax cost of sales of $37 and selling, general and administrative expenses of $5) |
42 | 15 | 27 | |||||||||
|
|
|
|
|
|
|
|||||||
| $ | 4,560 | $ | 1,621 | $ | 2,939 | |||||||
|
|
|
|
|
|
|
|||||||
| Year ended December 31, 2014 |
||||||||||||
| Pension liability activity: |
||||||||||||
| Actuarial loss |
$ | (7,608 | ) | $ | (2,687 | ) | $ | (4,921 | ) | |||
| Reclassification adjustment for amortization of net loss (pre-tax cost of sales of $977 and selling, general and administrative expenses of $200) |
1,177 | 416 | 761 | |||||||||
| Postretirement liability activity: |
||||||||||||
| Actuarial loss |
(7,917 | ) | (2,796 | ) | (5,121 | ) | ||||||
| Reclassification adjustment for amortization of net loss (pre-tax cost of sales of $332 and selling, general and administrative expenses of $39) |
371 | 131 | 240 | |||||||||
| Reclassification adjustment for amortization of prior service cost (pre-tax cost of sales of $215 and selling, general and administrative expenses of $26) |
241 | 85 | 156 | |||||||||
|
|
|
|
|
|
|
|||||||
| $ | (13,736 | ) | $ | (4,851 | ) | $ | (8,885 | ) | ||||
|
|
|
|
|
|
|
|||||||
The components of accumulated other comprehensive loss consist of the following:
| December 31, | ||||||||
| 2016 | 2015 | |||||||
| Unrecognized pension cost, net of tax of $6,405 and $6,429 |
$ | (10,441 | ) | $ | (10,484 | ) | ||
| Unrecognized postretirement income (cost), net of tax of $623 and $6,461 |
2,278 | (10,594 | ) | |||||
|
|
|
|
|
|||||
| $ | (8,163 | ) | $ | (21,078 | ) | |||
|
|
|
|
|
|||||
Note 14 – Employee Benefit Plans
The Company has qualified, defined benefit pension plans that were established to provide benefits to certain employees. These plans are frozen and participants are no longer accruing benefits. Generally, contributions to the plans are not less than the minimum amounts required under the Employee Retirement Income Security Act of 1974, as amended (“ERISA”), and not more than the maximum amount that can be deducted for federal income tax purposes. The plans’ assets are held by independent trustees and consist primarily of equity and fixed income securities.
53
Table of Contents
FreightCar America, Inc. and Subsidiaries
NOTES TO CONSOLIDATED FINANCIAL STATEMENTS (continued)
For the Years Ended December 31, 2016, 2015 and 2014
(in thousands, except for share and per share data)
The Company also historically provided certain postretirement health care benefits for certain of its salaried and hourly retired employees. Generally, employees may become eligible for health care benefits if they retire after attaining specified age and service requirements. These benefits are subject to deductibles, co-payment provisions and other limitations.
A substantial portion of the Company’s postretirement benefit plan obligation as of December 31, 2015 related to an expired settlement agreement with the union representing employees at the Company’s and its predecessors’ Johnstown manufacturing facilities. The terms of that settlement agreement required the Company to pay until November 30, 2012 certain monthly amounts toward the cost of retiree health care coverage. The Company terminated, effective November 1, 2013, its contributions for medical coverage and life insurance benefits to affected retirees. On August 20, 2015, the Company reached a settlement agreement with the union and the other plaintiffs in connection with the disputed retiree medical and life insurance benefits. The Company’s recorded postretirement benefit plan obligation through December 31, 2015 assumed for accounting purposes a continuation of those monthly payments after November 30, 2012 because the status of the settlement had not yet met the requirements for settlement accounting. A transaction meets the criteria to be accounted for as a settlement when a transaction is irrevocable, relieves the employer of primary responsibility for the benefit obligation, and eliminates significant risks related to the obligation and the assets used to effect the settlement. Settlement accounting was triggered when the Company made the cash settlement payment of $31,616 (including $166 of interest) on March 25, 2016. The settlement resulted in a pre-tax gain of $14,306 (net of plaintiffs’ attorneys’ fees of $1,300) and a reduction in the postretirement benefit obligation of approximately $68,806. Additionally, as a result of the announced cost reduction program (see Note 7), certain employees participating in the salaried pension and postretirement benefit plans were impacted, which triggered a curtailment of the respective plans.
The changes in benefit obligation, change in plan assets and funded status as of December 31, 2016 and 2015, are as follows:
| Pension Benefits | Postretirement Benefits | |||||||||||||||
| 2016 | 2015 | 2016 | 2015 | |||||||||||||
| Change in benefit obligation |
||||||||||||||||
| Benefit obligation – Beginning of year |
$ | 53,440 | $ | 58,017 | $ | 72,902 | $ | 73,883 | ||||||||
| Service cost |
— | — | 60 | 70 | ||||||||||||
| Interest cost |
2,329 | 2,319 | 934 | 2,970 | ||||||||||||
| Actuarial loss (gain) |
1,222 | (2,800 | ) | 1,586 | (3,621 | ) | ||||||||||
| Benefits paid |
(3,778 | ) | (4,096 | ) | (488 | ) | (400 | ) | ||||||||
| Lump-sum settlement payment |
— | — | (31,616 | ) | — | |||||||||||
| Settlement gain |
— | — | (37,190 | ) | — | |||||||||||
| Plan curtailment |
(51 | ) | — | (32 | ) | — | ||||||||||
| Special termination benefits |
131 | — | 16 | — | ||||||||||||
|
|
|
|
|
|
|
|
|
|||||||||
| Benefit obligation – End of year |
53,293 | 53,440 | 6,172 | 72,902 | ||||||||||||
|
|
|
|
|
|
|
|
|
|||||||||
| Change in plan assets |
||||||||||||||||
| Plan assets – Beginning of year |
46,767 | 50,807 | — | — | ||||||||||||
| Return on plan assets |
3,483 | 56 | — | — | ||||||||||||
| Employer contributions |
— | — | 32,104 | 400 | ||||||||||||
| Benefits paid |
(3,778 | ) | (4,096 | ) | (488 | ) | (400 | ) | ||||||||
| Lump-sum settlement payment |
— | — | (31,616 | ) | — | |||||||||||
|
|
|
|
|
|
|
|
|
|||||||||
| Plan assets at fair value – End of year |
46,472 | 46,767 | — | — | ||||||||||||
|
|
|
|
|
|
|
|
|
|||||||||
| Funded status of plans – End of year |
$ | (6,821 | ) | $ | (6,673 | ) | $ | (6,172 | ) | $ | (72,902 | ) | ||||
|
|
|
|
|
|
|
|
|
|||||||||
54
Table of Contents
FreightCar America, Inc. and Subsidiaries
NOTES TO CONSOLIDATED FINANCIAL STATEMENTS (continued)
For the Years Ended December 31, 2016, 2015 and 2014
(in thousands, except for share and per share data)
| Pension Benefits | Postretirement Benefits | |||||||||||||||
| 2016 | 2015 | 2016 | 2015 | |||||||||||||
| Amounts recognized in the Consolidated Balance Sheets |
||||||||||||||||
| Current liabilities |
$ | — | $ | — | $ | (403 | ) | $ | (405 | ) | ||||||
| Noncurrent liabilities |
(6,821 | ) | (6,673 | ) | (5,769 | ) | (72,497 | ) | ||||||||
|
|
|
|
|
|
|
|
|
|||||||||
| Net amount recognized at December 31 |
$ | (6,821 | ) | $ | (6,673 | ) | $ | (6,172 | ) | $ | (72,902 | ) | ||||
|
|
|
|
|
|
|
|
|
|||||||||
Amounts recognized in accumulated other comprehensive loss but not yet recognized in earnings at December 31, 2016 and 2015, are as follows:
| Pension Benefits | Postretirement Benefits |
|||||||||||||||
| 2016 | 2015 | 2016 | 2015 | |||||||||||||
| Net actuarial loss (gain) |
$ | 16,847 | $ | 16,913 | $ | (3,089 | ) | $ | 16,813 | |||||||
| Prior service cost |
— | — | 187 | 242 | ||||||||||||
|
|
|
|
|
|
|
|
|
|||||||||
| $ | 16,847 | $ | 16,913 | $ | (2,902 | ) | $ | 17,055 | ||||||||
|
|
|
|
|
|
|
|
|
|||||||||
During the fourth quarter of 2014, the Company offered certain of its former employees the option to receive a lump-sum pension payment or annuity in order to satisfy in full the Company’s future pension liabilities to such former employees, with payments beginning in the fourth quarter of 2014. Payments of $3,294 to eligible former employees who elected to participate in the offer were paid in December 2014 from existing pension plan assets and constituted a complete settlement of the Company’s pension liabilities with respect to such former employees. The discount rates and actuarial assumptions used to calculate the payouts were determined according to federal regulations and approximated those used to calculate our pension obligation for financial reporting purposes as of December 31, 2014. A non-cash settlement charge of $966 was recognized in the fourth quarter of 2014 in connection with the settlement payments. This charge resulted from the recognition in earnings of a portion of the losses recorded in accumulated other comprehensive loss based on the portion of the obligation settled.
The estimated net loss for the defined benefit pension plan that will be amortized from accumulated other comprehensive loss into net periodic benefit cost in 2017 is $487. The estimated net gain and prior service cost for the postretirement benefit plan that will be amortized from accumulated other comprehensive loss into net periodic benefit cost in 2017 are $(259) and $14, respectively.
Components of net periodic benefit cost for the years ended December 31, 2016, 2015 and 2014, are as follows:
| Pension Benefits | Postretirement Benefits | |||||||||||||||||||||||
| 2016 | 2015 | 2014 | 2016 | 2015 | 2014 | |||||||||||||||||||
| Components of net periodic benefit cost |
||||||||||||||||||||||||
| Service cost |
$ | — | $ | — | $ | — | $ | 60 | $ | 70 | $ | 63 | ||||||||||||
| Interest cost |
2,329 | 2,319 | 2,642 | 934 | 2,970 | 2,999 | ||||||||||||||||||
| Expected return on plan assets |
(2,745 | ) | (3,046 | ) | (3,620 | ) | — | — | — | |||||||||||||||
| Amortization of unrecognized prior service cost |
— | — | — | 18 | 42 | 241 | ||||||||||||||||||
| Amortization of unrecognized net loss (gain) |
499 | 440 | 211 | (97 | ) | 647 | 371 | |||||||||||||||||
| Lump-sum settlement cost (gain) |
— | — | 966 | (15,606 | ) | — | — | |||||||||||||||||
| Curtailment recognition |
— | — | — | 6 | — | — | ||||||||||||||||||
| Contractual benefit charge |
131 | — | — | 16 | — | — | ||||||||||||||||||
|
|
|
|
|
|
|
|
|
|
|
|
|
|||||||||||||
| Total net periodic benefit cost |
$ | 214 | $ | (287 | ) | $ | 199 | $ | (14,669 | ) | $ | 3,729 | $ | 3,674 | ||||||||||
|
|
|
|
|
|
|
|
|
|
|
|
|
|||||||||||||
55
Table of Contents
FreightCar America, Inc. and Subsidiaries
NOTES TO CONSOLIDATED FINANCIAL STATEMENTS (continued)
For the Years Ended December 31, 2016, 2015 and 2014
(in thousands, except for share and per share data)
The increase (decrease) in accumulated other comprehensive loss (pre-tax) for the years ended December 31, 2016 and 2015, are as follows:
| 2016 | 2015 | |||||||||||||||
| Pension Benefits |
Postretirement Benefits |
Pension Benefits |
Postretirement Benefits |
|||||||||||||
| Net actuarial loss (gain) |
$ | 433 | $ | 1,586 | $ | 190 | $ | (3,621 | ) | |||||||
| Settlement gain |
— | (37,190 | ) | — | — | |||||||||||
| Curtailment—prior service cost |
— | (38 | ) | — | — | |||||||||||
| Net actuarial loss settlement expense |
— | 15,606 | — | — | ||||||||||||
| Amortization of net actuarial loss (gain) |
(499 | ) | 97 | (440 | ) | (647 | ) | |||||||||
| Amortization of prior service cost |
— | (18 | ) | — | (42 | ) | ||||||||||
|
|
|
|
|
|
|
|
|
|||||||||
| Total recognized in accumulated other comprehensive loss (gain) |
$ | (66 | ) | $ | (19,957 | ) | $ | (250 | ) | $ | (4,310 | ) | ||||
|
|
|
|
|
|
|
|
|
|||||||||
The following benefit payments, which reflect expected future service, as appropriate, are expected to be paid as of December 31, 2016:
| Pension Benefits |
Postretirement Benefits |
|||||||
| 2017 |
$ | 3,541 | $ | 403 | ||||
| 2018 |
3,441 | 392 | ||||||
| 2019 |
3,384 | 381 | ||||||
| 2020 |
3,451 | 382 | ||||||
| 2021 |
3,312 | 387 | ||||||
| 2022 through 2026 |
16,247 | 2,003 | ||||||
The Company is not required to make any contributions to its pension plans in 2017 to meet its minimum funding requirements. The postretirement benefits in the table above represent benefit payments for the Company’s salaried retirees.
The assumptions used to determine end of year benefit obligations are shown in the following table:
| Pension Benefits | Postretirement Benefits | |||||||||||||||
| 2016 | 2015 | 2016 | 2015 | |||||||||||||
| Discount rates |
4.21 | % | 4.47 | % | 4.21 | % | 4.39 | % | ||||||||
The discount rate is determined using a yield curve model that uses yields on high quality corporate bonds (AA rated or better) to produce a single equivalent rate. The yield curve model excludes callable bonds except those with make-whole provisions, private placements and bonds with variable rates.
In October 2016, the Society of Actuaries published updated mortality improvement assumptions for U.S. plans, scale (MP-2016), which reflects additional data that the Social Security Administration has released since prior assumptions (MP-2015) were developed. Scale (MP-2016) results in lower projected mortality improvement than scale (MP-2015). The Company has historically utilized the Society of Actuaries’ published mortality data in its plan assumptions. Accordingly, the Company adopted MP-2016 for purposes of measuring its pension and postretirement obligations at December 31, 2016.
The assumptions used in the measurement of net periodic cost are shown in the following table:
56
Table of Contents
FreightCar America, Inc. and Subsidiaries
NOTES TO CONSOLIDATED FINANCIAL STATEMENTS (continued)
For the Years Ended December 31, 2016, 2015 and 2014
(in thousands, except for share and per share data)
| Pension Benefits | Postretirement Benefits | |||||||||||||||||||||||
| 2016 | 2015 | 2014 | 2016 | 2015 | 2014 | |||||||||||||||||||
| Discount rate |
4.47 | % | 4.15 | % | 4.91 | % | 4.39 | % | 4.03 | % | 4.75 | % | ||||||||||||
| Expected return on plan assets |
6.11 | % | 6.24 | % | 6.76 | % | N/A | N/A | N/A | |||||||||||||||
As benefits under these postretirement healthcare plans have been capped, assumed health care cost trend rates have no effect on the amounts reported for the health care plans.
The Company’s pension plans’ weighted average asset allocations at December 31, 2016 and 2015, and target allocations for 2017, by asset category, are as follows:
| Plan Assets at December 31, | Target Allocation | |||||||||||
| 2016 | 2015 | 2016 | ||||||||||
| Asset Category |
||||||||||||
| Cash and cash equivalents |
1 | % | 2 | % | 0% –5 | % | ||||||
| Equity securities |
55 | % | 55 | % | 45% – 65 | % | ||||||
| Fixed income securities |
39 | % | 38 | % | 30% – 50 | % | ||||||
| Real estate |
5 | % | 5 | % | 4% – 6 | % | ||||||
|
|
|
|
|
|
|
|||||||
| 100 | % | 100 | % | 100 | % | |||||||
|
|
|
|
|
|
|
|||||||
The basic goal underlying the pension plan investment policy is to ensure that the assets of the plans, along with expected plan sponsor contributions, will be invested in a prudent manner to meet the obligations of the plans as those obligations come due under a broad range of potential economic and financial scenarios, maximize the long-term investment return with an acceptable level of risk based on such obligations, and broadly diversify investments across and within the capital markets to protect asset values against adverse movements in any one market. The Company’s investment strategy balances the requirement to maximize returns using potentially higher return generating assets, such as equity securities, with the need to manage the risk of such investments with less volatile assets, such as fixed-income securities. Investment practices must comply with the requirements of ERISA and any other applicable laws and regulations. The Company, in consultation with its investment advisors, has determined a targeted allocation of invested assets by category and it works with its advisors to reasonably maintain the actual allocation of assets near the target. The long term return on assets was estimated based upon historical market performance, expectations of future market performance for debt and equity securities and the related risks of various allocations between debt and equity securities. Numerous asset classes with differing expected rates of return, return volatility and correlations are utilized to reduce risk through diversification.
The Company’s pension plan assets are invested in one mutual fund for each fund classification. The following table presents the fair value of pension plan assets classified under the appropriate level of the ASC 820 fair value hierarchy (see Note 2 for a description of the fair value hierarchy) as of December 31, 2016 and 2015:
| Pension Plan Assets | As of December 31, 2016 | |||||||||||||||
| Level 1 | Level 2 | Level 3 | Total | |||||||||||||
| Mutual funds: |
||||||||||||||||
| Fixed income funds |
$ | 18,051 | — | — | $ | 18,051 | ||||||||||
| Large cap funds |
14,864 | — | — | 14,864 | ||||||||||||
| Small cap funds |
3,970 | — | — | 3,970 | ||||||||||||
| International funds |
6,554 | — | — | 6,554 | ||||||||||||
| Real estate funds |
2,273 | — | — | 2,273 | ||||||||||||
| Cash and equivalents |
760 | — | — | 760 | ||||||||||||
|
|
|
|
|
|
|
|
|
|||||||||
| Total |
$ | 46,472 | $ | — | $ | — | $ | 46,472 | ||||||||
|
|
|
|
|
|
|
|
|
|||||||||
57
Table of Contents
FreightCar America, Inc. and Subsidiaries
NOTES TO CONSOLIDATED FINANCIAL STATEMENTS (continued)
For the Years Ended December 31, 2016, 2015 and 2014
(in thousands, except for share and per share data)
| Pension Plan Assets | As of December 31, 2015 | |||||||||||||||
| Level 1 | Level 2 | Level 3 | Total | |||||||||||||
| Mutual funds: |
||||||||||||||||
| Fixed income funds |
$ | 17,926 | — | — | $ | 17,926 | ||||||||||
| Large cap funds |
14,718 | — | — | 14,718 | ||||||||||||
| Small cap funds |
4,371 | — | — | 4,371 | ||||||||||||
| International funds |
6,538 | — | — | 6,538 | ||||||||||||
| Real estate funds |
2,520 | — | — | 2,520 | ||||||||||||
| Cash and equivalents |
694 | — | — | 694 | ||||||||||||
|
|
|
|
|
|
|
|
|
|||||||||
| Total |
$ | 46,767 | $ | — | $ | — | $ | 46,767 | ||||||||
|
|
|
|
|
|
|
|
|
|||||||||
The Company also maintains qualified defined contribution plans, which provide benefits to their employees based on employee contributions and employee earnings, with discretionary contributions allowed. Expenses related to these plans were $2,062, $2,857 and $1,649 for the years ended December 31, 2016, 2015 and 2014, respectively.
Note 15 – Income Taxes
The provision (benefit) for income taxes for the periods indicated includes current and deferred components as follows:
| Year Ended December 31, | ||||||||||||
| 2016 | 2015 | 2014 | ||||||||||
| Current taxes |
||||||||||||
| Federal |
$ | (15,747 | ) | $ | 16,709 | $ | 325 | |||||
| State |
(486 | ) | 751 | 93 | ||||||||
|
|
|
|
|
|
|
|||||||
| (16,233 | ) | 17,460 | 418 | |||||||||
|
|
|
|
|
|
|
|||||||
| Deferred taxes |
||||||||||||
| Federal |
23,869 | (2,767 | ) | 1,394 | ||||||||
| State |
(1,146 | ) | 88 | 325 | ||||||||
|
|
|
|
|
|
|
|||||||
| 22,723 | (2,679 | ) | 1,719 | |||||||||
|
|
|
|
|
|
|
|||||||
| Tax expense (benefit) related to an increase (decrease) in unrecognized tax benefits |
(1,120 | ) | 59 | 272 | ||||||||
| Interest expense, gross of related tax effects |
(1,906 | ) | (9 | ) | 159 | |||||||
|
|
|
|
|
|
|
|||||||
| Total provision |
$ | 3,464 | $ | 14,831 | $ | 2,568 | ||||||
|
|
|
|
|
|
|
|||||||
The provision (benefit) for income taxes for the periods indicated differs from the amounts computed by applying the federal statutory rate as follows:
58
Table of Contents
FreightCar America, Inc. and Subsidiaries
NOTES TO CONSOLIDATED FINANCIAL STATEMENTS (continued)
For the Years Ended December 31, 2016, 2015 and 2014
(in thousands, except for share and per share data)
| Year Ended December 31, | ||||||||||||
| 2016 | 2015 | 2014 | ||||||||||
| Statutory U.S. federal income tax rate |
35.0 | % | 35.0 | % | 35.0 | % | ||||||
| State income taxes, net of federal tax benefit |
3.4 | % | 3.2 | % | 5.8 | % | ||||||
| Valuation allowance |
(2.6 | )% | (1.0 | )% | (2.4 | )% | ||||||
| Domestic manufacturing deduction |
7.6 | % | (3.6 | )% | 0.0 | % | ||||||
| Nondeductible expenses |
1.0 | % | 0.2 | % | 1.0 | % | ||||||
| State rate and other changes on deferred taxes |
(1.9 | )% | 0.4 | % | 2.1 | % | ||||||
| Federal and state credits |
(4.8 | )% | (2.7 | )% | (9.4 | )% | ||||||
| Uncertain tax positions |
(16.1 | )% | 0.4 | % | 1.3 | % | ||||||
| Other |
0.3 | % | (0.1 | )% | (3.1 | )% | ||||||
|
|
|
|
|
|
|
|||||||
| Effective income tax rate |
21.9 | % | 31.8 | % | 30.3 | % | ||||||
|
|
|
|
|
|
|
|||||||
Deferred income taxes result from temporary differences in the financial and tax basis of assets and liabilities. Components of deferred tax assets (liabilities) consisted of the following:
| December 31, 2016 | December 31, 2015 | |||||||||||||||
| Description | Assets | Liabilities | Assets | Liabilities | ||||||||||||
| Accrued postretirement and pension benefits |
$ | 4,624 | $ | — | $ | 28,033 | $ | — | ||||||||
| Intangible assets |
— | (2,838 | ) | — | (2,832 | ) | ||||||||||
| Accrued expenses |
6,961 | — | 10,385 | — | ||||||||||||
| Deferred gain |
(761 | ) | — | (741 | ) | |||||||||||
| Deferred state and local incentive revenue |
4,733 | — | 5,417 | — | ||||||||||||
| Inventory valuation |
2,621 | — | 2,810 | — | ||||||||||||
| Property, plant and equipment and railcars on operating leases |
— | (14,897 | ) | — | (11,204 | ) | ||||||||||
| Net operating loss carryforwards |
5,731 | — | 5,873 | — | ||||||||||||
| Stock-based compensation expense |
2,825 | — | 2,618 | — | ||||||||||||
| Other |
419 | — | 160 | — | ||||||||||||
|
|
|
|
|
|
|
|
|
|||||||||
| 27,914 | (18,496 | ) | 55,296 | (14,777 | ) | |||||||||||
| Valuation allowance |
(5,197 | ) | — | (5,797 | ) | |||||||||||
|
|
|
|
|
|
|
|
|
|||||||||
| Deferred tax assets (liabilities) |
$ | 22,717 | $ | (18,496 | ) | $ | 49,499 | $ | (14,777 | ) | ||||||
|
|
|
|
|
|
|
|
|
|||||||||
| Decrease in valuation allowance |
$ | (600 | ) | $ | (422 | ) | ||||||||||
|
|
|
|
|
|||||||||||||
A valuation allowance is provided when it is more likely than not that some portion or all of the deferred tax assets will not be realized. Although realization of our net deferred assets is not certain, management has concluded that, based on the positive and negative evidence considered, we will more likely than not realize the full benefit of the deferred tax assets except for our deferred tax assets in certain states. The Company has certain pretax state net operating loss carryforwards of $100,261, which will expire between 2020 and 2036, of which $86,892 have a full valuation allowance recorded.
A reconciliation of the beginning and ending gross amounts of unrecognized tax benefits for the years ended December 31, 2016, 2015 and 2014, were as follows:
59
Table of Contents
FreightCar America, Inc. and Subsidiaries
NOTES TO CONSOLIDATED FINANCIAL STATEMENTS (continued)
For the Years Ended December 31, 2016, 2015 and 2014
(in thousands, except for share and per share data)
| 2016 | 2015 | 2014 | ||||||||||
| Beginning of year balance |
$ | 2,503 | $ | 2,444 | $ | 2,172 | ||||||
| Increases in prior period tax positions |
13 | — | 272 | |||||||||
| Decreases in prior period tax positions |
(1,924 | ) | — | — | ||||||||
| Increases in current period tax positions |
980 | 59 | — | |||||||||
|
|
|
|
|
|
|
|||||||
| End of year balance |
$ | 1,572 | $ | 2,503 | $ | 2,444 | ||||||
|
|
|
|
|
|
|
|||||||
The total estimated unrecognized tax benefit that, if recognized, would affect the Company’s effective tax rate was approximately $465, $1,581 and $1,523 as of December 31, 2016, 2015 and 2014, respectively. Due to the nature of the Company’s unrecognized tax benefits, the Company does not expect changes in its unrecognized tax benefit reserve in the next twelve months to have a material impact on its financial statements. The Company’s income tax provision included $1,419 of benefit (net of a federal tax expense of $667), $110 of expense (net of a federal tax benefit of $60) and $110 of expense (net of a federal tax benefit of $60) related to interest and penalties for the years ended December 31, 2016, 2015 and 2014, respectively. The Company records interest and penalties as a component of income tax expense. Such expenses brought the balance of accrued interest and penalties to $0, $2,086 and $1,916 at December 31, 2016, 2015 and 2014, respectively.
The Company and/or its subsidiaries file income tax returns with the U.S. federal government and in various state and foreign jurisdictions. The Company is currently under examination of its 2014 federal income tax return by the Internal Revenue Service. A summary of tax years that remain subject to examination is as follows:
| Jurisdiction |
Earliest Year Open to Examination |
|||
| U.S. federal |
2010 | |||
| States: |
||||
| Pennsylvania |
2000 | |||
| Texas |
2008 | |||
| Illinois |
2009 | |||
| Virginia |
2013 | |||
| Colorado |
2010 | |||
| Indiana |
2010 | |||
| Nebraska |
2010 | |||
| Alabama |
2013 | |||
| Foreign: |
||||
| China |
2015 | |||
Note 16 – Stock-Based Compensation
The Company’s incentive compensation plan, titled “The 2005 Long Term Incentive Plan” (as restated to incorporate all amendments, the “Incentive Plan”), was approved by the Company’s board of directors and ratified by the stockholders. The Incentive Plan provides for the grant to eligible persons of stock options, share appreciation rights, or SARs, restricted shares, restricted share units, or RSUs, performance shares, performance units, dividend equivalents and other share-based awards, referred to collectively as the awards. Option awards generally vest based on one to three years of service and have 10 year contractual terms. Share awards generally vest over one to three years. Certain option and share awards provide for accelerated vesting if there is a change in control (as defined in the Incentive Plan). The Incentive Plan will terminate as to future awards on May 17, 2023. Under the Incentive Plan, 2,459,616 shares of common stock have been reserved for issuance (from either authorized but unissued shares or treasury shares), of which 871,594 were available for issuance at December 31, 2016.
60
Table of Contents
FreightCar America, Inc. and Subsidiaries
NOTES TO CONSOLIDATED FINANCIAL STATEMENTS (continued)
For the Years Ended December 31, 2016, 2015 and 2014
(in thousands, except for share and per share data)
The Company recognizes stock-based compensation expense for stock option awards based on the fair value of the award on the grant date using the Black-Scholes option valuation model. Expected life in years for all stock options awards was determined using the simplified method. The Company believes that it is appropriate to use the simplified method in determining the expected life for options because the Company does not have sufficient historical exercise data to provide a reasonable basis upon which to estimate the expected term for stock options. Expected volatility was based on the historical volatility of the Company’s stock. The risk-free interest rate was based on the U.S. Treasury bond rate for the expected life of the option. The expected dividend yield was based on the latest annualized dividend rate and the current market price of the underlying common stock on the date of the grant. The Company recognizes stock-based compensation for restricted stock awards over the vesting period based on the fair market value of the stock on the date of the award, calculated as the average of the high and low trading prices for the Company’s common stock on the award date.
In January 2015 and 2016, the Company granted performance shares with performance measurement periods from January 1, 2015 through December 31, 2017 and January 1, 2016 through December 31, 2018, respectively. The shares will vest and be earned at the end of each performance measurement period, if at all, based on the Company’s three-year cumulative basic earnings per share, provided that a minimum three-year average return on invested capital goal is also met or exceeded. The earnings per share thresholds and return on invested capital goals were established by the Company’s board of directors on the grant dates. The Company recognizes stock-based compensation cost for performance shares over the vesting period based on the fair market value of the Company’s stock on the award date multiplied by the estimated number of shares to be awarded based on the probable outcome of the performance conditions. As of December 31, 2016, the probable outcome of the performance conditions was estimated to be below the threshold level.
There were no stock option awards granted in 2016 or 2015. Grant date fair values of stock option awards granted in 2014 were estimated using the Black-Scholes option valuation model with the following assumptions:
| Grant Year |
Grant Date | Estimated Life | Expected Volatility |
Expected Dividend Yield |
Risk Free Interest Rate |
Grant Date Fair Value Per Share |
||||||||||||||||||
| 2014 |
1/15/2014 | 6 years | 51.03 | % | 0.94 | % | 1.68 | % | $ | 11.58 | ||||||||||||||
Stock-based compensation expense of $1,149, $2,183 and $2,084 is included within selling, general and administrative expense for the years ended December 31, 2016, 2015 and 2014, respectively. The total income tax benefit recognized on the consolidated statements of operations for share-based compensation arrangements was $405, $768 and $735 for the years ended December 31, 2016, 2015 and 2014, respectively.
A summary of the Company’s stock options activity and related information at December 31, 2016 and 2015, and changes during the years then ended, is presented below:
| December 31, | ||||||||||||||||
| 2016 | 2015 | |||||||||||||||
| Weighted- | Weighted- | |||||||||||||||
| Average | Average | |||||||||||||||
| Exercise | Exercise | |||||||||||||||
| Options | Price | Options | Price | |||||||||||||
| Outstanding | (per share) | Outstanding | (per share) | |||||||||||||
| Outstanding at the beginning of the year |
507,783 | $ | 24.80 | 794,978 | $ | 19.41 | ||||||||||
| Granted |
— | — | — | — | ||||||||||||
| Exercised |
— | — | (240,410 | ) | 20.48 | |||||||||||
| Forfeited or expired |
(128,793 | ) | 26.20 | (46,785 | ) | 19.47 | ||||||||||
|
|
|
|
|
|
|
|
|
|||||||||
| Outstanding at the end of the year |
378,990 | $ | 24.32 | 507,783 | $ | 24.80 | ||||||||||
|
|
|
|
|
|
|
|
|
|||||||||
| Exercisable at the end of the year |
341,194 | $ | 24.18 | 364,306 | $ | 24.91 | ||||||||||
|
|
|
|
|
|
|
|
|
|||||||||
61
Table of Contents
FreightCar America, Inc. and Subsidiaries
NOTES TO CONSOLIDATED FINANCIAL STATEMENTS (continued)
For the Years Ended December 31, 2016, 2015 and 2014
(in thousands, except for share and per share data)
The weighted-average grant-date fair value per share of stock options granted during the year ended December 31, 2014 was $11.58. There were no stock options granted during 2016 or 2015.
A summary of the Company’s stock options outstanding as of December 31, 2016 is presented below:
| Weighted- | ||||||||||||||||
| Average | Weighted- | |||||||||||||||
| Remaining | Average | |||||||||||||||
| Contractual | Exercise | Aggregate | ||||||||||||||
| Options | Term | Price | Intrinsic | |||||||||||||
| Outstanding | (in years) | (per share) | Value | |||||||||||||
| Options outstanding |
378,990 | 5.7 | $ | 24.32 | $ | — | ||||||||||
| Vested or expected to vest |
368,498 | 5.7 | $ | 24.28 | $ | — | ||||||||||
| Options exercisable |
341,194 | 5.6 | $ | 24.18 | $ | — | ||||||||||
The intrinsic value of stock options exercised during the year ended December 31, 2015 was $2,258. Cash received from exercise of stock options during the year ended December 31, 2015 was $4,925. There were no stock options exercised during 2016.
A summary of the Company’s nonvested restricted shares as of December 31, 2016 and 2015, and changes during the years then ended is presented below:
| December 31, | ||||||||||||||||
| 2016 | 2015 | |||||||||||||||
| Weighted- | Weighted- | |||||||||||||||
| Average | Average | |||||||||||||||
| Grant Date | Grant Date | |||||||||||||||
| Fair Value | Fair Value | |||||||||||||||
| Shares | (per share) | Shares | (per share) | |||||||||||||
| Nonvested at the beginning of the year |
85,317 | $ | 23.75 | 56,875 | $ | 24.04 | ||||||||||
| Granted |
84,353 | 16.57 | 66,017 | 24.04 | ||||||||||||
| Vested |
(28,531 | ) | 24.49 | (30,840 | ) | 24.47 | ||||||||||
| Forfeited or expired |
(29,590 | ) | 19.90 | (6,735 | ) | 23.99 | ||||||||||
|
|
|
|
|
|||||||||||||
| Nonvested at the end of the year |
111,549 | $ | 19.19 | 85,317 | $ | 23.75 | ||||||||||
|
|
|
|
|
|||||||||||||
| Expected to vest |
102,962 | $ | 18.94 | 77,024 | $ | 23.59 | ||||||||||
|
|
|
|
|
|||||||||||||
The weighted-average grant-date fair value per share of stock awards granted during the years ended December 31, 2016, 2015 and 2014, was $16.57, $24.04 and $25.48, respectively. The fair value of stock awards vested during the years ended December 31, 2016, 2015 and 2014, was $486, $754 and $903, respectively, based on the value at vesting date. As of December 31, 2016, there was $975 of total unrecognized compensation expense related to nonvested restricted stock awards, which will be recognized over the average remaining requisite service period of 22 months.
Note 17 – Risks and Contingencies
The Company is involved in various warranty and repair claims and, in certain cases, related pending and threatened legal proceedings with its customers in the normal course of business. In the opinion of management, the Company’s potential losses in excess of the accrued warranty and legal provisions, if any, are not expected to be material to the Company’s consolidated financial condition, results of operations or cash flows.
62
Table of Contents
FreightCar America, Inc. and Subsidiaries
NOTES TO CONSOLIDATED FINANCIAL STATEMENTS (continued)
For the Years Ended December 31, 2016, 2015 and 2014
(in thousands, except for share and per share data)
On April 17, 2015 and September 30, 2015, National Steel Car Limited (“NSC”) filed Complaints for Patent Infringement against the Company in the United States District Court for the Northern District of Illinois (Eastern Division) in Chicago, Illinois. The complaints assert five United States patents against certain aggregate gondola freight cars sold to certain customers. The complaints seek injunctive relief and an unspecified amount of damages. The Court consolidated both cases on November 12, 2015. On January 29, 2016, NSC filed an amended complaint, alleging that 18 offers to sell made by the Company also infringed NSC’s patents. The Company filed its answer to NSC’s amended complaint on February 16, 2016, responding to NSC’s newly raised allegations and adding new affirmative defenses as well as counterclaims for non-infringement and invalidity. The Company also filed inter partes review (“IPR”) petitions in March 2016 with the U.S. Patent and Trademark Office’s Patent Trial and Appeal Board (“PTAB”) for two of the five asserted patents. In June 2015, the parties began conducting the first phase of fact discovery, which concluded on August 9, 2016. On September 26 and 28, 2016, the PTAB granted the IPR petitions and instituted trials on all asserted claims for both patents. Both trials are expected to conclude on or before September 30, 2017. On October 5, 2016, The Company filed a motion to stay the district court litigation in order to allow the IPR trials to run their course, which the district court denied. A claim construction hearing before the district court took place on for January 31, 2017. The Company believes that the complaints are without merit and intends to vigorously defend against the allegations. While the ultimate outcome of these proceedings cannot be determined at this time, it is the opinion of management that the resolution of these actions will not have a material adverse effect on the Company’s financial position, results of operations or cash flows.
In addition to the foregoing, the Company is involved in certain other pending and threatened legal proceedings, including commercial disputes and workers’ compensation and employee matters arising out of the conduct of its business. While the ultimate outcome of these other legal proceedings cannot be determined at this time, it is the opinion of management that the resolution of these other actions will not have a material adverse effect on the Company’s financial condition, results of operations or cash flows.
Note 18 – Other Commitments
The Company leases certain property and equipment under long-term operating leases expiring at various dates through 2024. The leases generally contain specific renewal options at lease-end at the then fair market amounts.
Future minimum lease payments at December 31, 2016 are as follows:
| Year ending December 31, 2017 |
$ | 9,167 | ||
| Year ending December 31, 2018 |
9,966 | |||
| Year ending December 31, 2019 |
10,040 | |||
| Year ending December 31, 2020 |
10,356 | |||
| Year ending December 31, 2021 |
10,201 | |||
| Thereafter |
9,681 | |||
|
|
|
|||
| $ | 59,411 | |||
|
|
|
The Company is liable for maintenance, insurance and similar costs under most of its leases and such costs are not included in the future minimum lease payments. Total rental expense for the years ended December 31, 2016, 2015 and 2014, was $10,048, $10,413 and $9,583, respectively.
The Company is party to certain non-cancelable fixed price agreements to purchase fixed amounts of materials used in the manufacturing process. These purchase commitments are typically entered into after a customer places an order for railcars. The Company expects to take delivery of such materials during 2017. In addition, the Company has other non-cancelable agreements with its suppliers to purchase certain materials used in the manufacturing process. The commitments may vary based on the actual quantities ordered and be subject to the actual price when ordered. At December 31, 2016, the Company had purchase commitments totaling $8,048 under these agreements.
63
Table of Contents
FreightCar America, Inc. and Subsidiaries
NOTES TO CONSOLIDATED FINANCIAL STATEMENTS (continued)
For the Years Ended December 31, 2016, 2015 and 2014
(in thousands, except for share and per share data)
Purchases related to these agreements were approximately $14,400, $24,537 and $18,188 for the years ended December 31, 2016, 2015 and 2014, respectively.
Note 19 – Earnings Per Share
The weighted average common shares outstanding are as follows:
| Year Ended December 31, | ||||||||||||
| 2016 | 2015 | 2014 | ||||||||||
| Weighted average common shares outstanding |
12,262,275 | 12,175,955 | 12,001,587 | |||||||||
| Dilutive effect of employee stock options and nonvested share awards |
— | 41,800 | 101,933 | |||||||||
|
|
|
|
|
|
|
|||||||
| Weighted average diluted common shares outstanding |
12,262,275 | 12,217,755 | 12,103,520 | |||||||||
|
|
|
|
|
|
|
|||||||
The Company computes earnings per share using the two-class method, which is an earnings allocation formula that determines earnings per share for common stock and participating securities. The Company’s participating securities are its grants of restricted stock which contain non-forfeitable rights to dividends. The Company computes basic earnings per share by dividing net income allocated to common shareholders by the weighted average number of shares outstanding during the year. Diluted earnings per share is calculated to give effect to all potentially dilutive common shares that were outstanding during the year. Weighted average diluted common shares outstanding include the incremental shares that would be issued upon the assumed exercise of stock options and the assumed vesting of nonvested share awards. For the years ended December 31, 2016, 2015 and 2014, 545,541, 475,847 and 397,697 shares, respectively, were not included in the weighted average common shares outstanding calculation as they were anti-dilutive.
Note 20 – Revenue Sources and Concentration of Sales
The following table sets forth the Company’s sales resulting from various revenue sources for the periods indicated below:
| Year ended December 31, | ||||||||||||
| 2016 | 2015 | 2014 | ||||||||||
| Railcar sales |
$ | 513,543 | $ | 743,135 | $ | 556,584 | ||||||
| Parts sales |
7,573 | 9,845 | 15,758 | |||||||||
| Leasing revenues |
2,605 | 2,654 | 6,069 | |||||||||
| Maintenance and repair revenues |
10 | 17,020 | 19,612 | |||||||||
| Other sales |
— | 200 | 495 | |||||||||
|
|
|
|
|
|
|
|||||||
| $ | 523,731 | $ | 772,854 | $ | 598,518 | |||||||
|
|
|
|
|
|
|
|||||||
Due to the nature of its operations, the Company is subject to significant concentration of risks related to business with a few customers. Sales to the Company’s top three customers accounted for 23%, 17% and 15%, respectively, of revenues for the year ended December 31, 2016. Sales to the Company’s top three customers accounted for 22%, 19% and 10%, respectively, of revenues for the year ended December 31, 2015. Sales to the Company’s top three customers accounted for 36%, 20% and 13%, respectively, of revenues for the year ended December 31, 2014. The Company’s sales to customers outside the United States were $34,039, $62,589 and $18,331 in 2016, 2015 and 2014, respectively.
64
Table of Contents
FreightCar America, Inc. and Subsidiaries
NOTES TO CONSOLIDATED FINANCIAL STATEMENTS (continued)
For the Years Ended December 31, 2016, 2015 and 2014
(in thousands, except for share and per share data)
Note 21 – Labor Agreements
A collective bargaining agreement at one of the Company’s facilities that covers approximately 26% and 11% of the Company’s active labor force at December 31, 2016 and 2015, respectively, expires on March 31, 2017.
A collective bargaining agreement at a facility that covers approximately 10% and 12% of the Company’s active labor force at December 31, 2016 and 2015, respectively, expires on October 31, 2018.
Note 22 – Selected Quarterly Financial Data (Unaudited)
Quarterly financial data is as follows:
| First | Second | Third | Fourth | |||||||||||||
| 2016 |
Quarter | Quarter | Quarter | Quarter | ||||||||||||
| Revenues |
$ | 148,590 | $ | 126,157 | $ | 113,461 | $ | 135,523 | ||||||||
| Gross profit |
$ | 15,887 | $ | 8,077 | $ | 9,489 | $ | 6,726 | ||||||||
| Net income (loss) (1) (2) |
$ | 12,667 | $ | (468 | ) | $ | 51 | $ | 74 | |||||||
| Net income (loss) per common share-basic |
$ | 1.03 | $ | (0.04 | ) | $ | — | $ | 0.01 | |||||||
| Net income (loss) per common share-diluted |
$ | 1.03 | $ | (0.04 | ) | $ | — | $ | 0.01 | |||||||
| 2015 |
||||||||||||||||
| Revenues |
$ | 92,804 | $ | 235,637 | $ | 241,114 | $ | 203,299 | ||||||||
| Gross profit |
$ | 4,553 | $ | 21,806 | $ | 29,050 | $ | 27,252 | ||||||||
| Net (loss) income (3) |
$ | (2,073 | ) | $ | 7,397 | $ | 14,827 | $ | 11,654 | |||||||
| Net (loss) income per common share-basic |
$ | (0.17 | ) | $ | 0.60 | $ | 1.20 | $ | 0.95 | |||||||
| Net (loss) income per common share-diluted |
$ | (0.17 | ) | $ | 0.60 | $ | 1.20 | $ | 0.94 | |||||||
| (1) | Results for the first quarter of 2016 include a $14,306 pre-tax gain on settlement of a postretirement benefit plan obligation, net of plaintiffs’ attorneys’ fees. |
| (2) | Results for the third and fourth quarters of 2016 include pre-tax restructuring and impairment charges of $1,531 and $730, respectively. See note 7. |
| (3) | Results for the third quarter of 2015 include a $4,578 pre-tax gain on the sale of the Company’s railcar repair and maintenance services business. |
Note 23 – Segment Information
The Company’s operations comprise two operating segments, Manufacturing and Parts, and one reportable segment, Manufacturing. The Company’s Manufacturing segment includes new railcar manufacturing, used railcar sales, railcar leasing and major railcar rebuilds. The Company’s Parts operating segment is not significant for reporting purposes and has been combined with corporate and other non-operating activities as Corporate and Other.
Segment operating income is an internal performance measure used by the Company’s Chief Operating Decision Maker to assess the performance of each segment in a given period. Segment operating income includes all external revenues attributable to the segments as well as operating costs and income that management believes are directly
65
Table of Contents
FreightCar America, Inc. and Subsidiaries
NOTES TO CONSOLIDATED FINANCIAL STATEMENTS (continued)
For the Years Ended December 31, 2016, 2015 and 2014
(in thousands, except for share and per share data)
attributable to the current production of goods and services. The Company’s management reporting package does not include interest revenue, interest expense or income taxes allocated to individual segments and these items are not considered as a component of segment operating income. Segment assets represent operating assets and exclude intersegment accounts, deferred tax assets and income tax receivables. The Company does not allocate cash and cash equivalents to its operating segments as the Company’s treasury function is managed at the corporate level. Intersegment revenues were not material in any period presented.
| Year Ended December 31, | ||||||||||||
| 2016 | 2015 | 2014 | ||||||||||
| Revenues: |
||||||||||||
| Manufacturing |
$ | 516,063 | $ | 745,723 | $ | 562,719 | ||||||
| Corporate and Other |
7,668 | 27,131 | 35,799 | |||||||||
|
|
|
|
|
|
|
|||||||
| Consolidated Revenues |
$ | 523,731 | $ | 772,854 | $ | 598,518 | ||||||
|
|
|
|
|
|
|
|||||||
| Operating Income: |
||||||||||||
| Manufacturing |
$ | 29,012 | $ | 69,165 | $ | 32,150 | ||||||
| Corporate and Other |
(13,164 | ) | (22,402 | ) | (22,643 | ) | ||||||
|
|
|
|
|
|
|
|||||||
| Consolidated Operating Income |
15,848 | 46,763 | 9,507 | |||||||||
| Consolidated interest expense and deferred financing costs |
(171 | ) | (243 | ) | (1,077 | ) | ||||||
| Consolidated other income |
111 | 116 | 42 | |||||||||
|
|
|
|
|
|
|
|||||||
| Consolidated Income Before Income Taxes |
$ | 15,788 | $ | 46,636 | $ | 8,472 | ||||||
|
|
|
|
|
|
|
|||||||
| Depreciation and Amortization: |
||||||||||||
| Manufacturing |
$ | 8,328 | $ | 7,170 | $ | 6,858 | ||||||
| Corporate and Other |
1,408 | 2,858 | 3,211 | |||||||||
|
|
|
|
|
|
|
|||||||
| Consolidated Depreciation and Amortization |
$ | 9,736 | $ | 10,028 | $ | 10,069 | ||||||
|
|
|
|
|
|
|
|||||||
| Capital Expenditures: |
||||||||||||
| Manufacturing |
$ | 13,079 | $ | 15,176 | $ | 10,952 | ||||||
| Corporate and Other |
767 | 1,523 | 850 | |||||||||
|
|
|
|
|
|
|
|||||||
| Consolidated Capital Expenditures |
$ | 13,846 | $ | 16,699 | $ | 11,802 | ||||||
|
|
|
|
|
|
|
|||||||
| December 31, 2016 | December 31, 2015 | |||||||
| Assets: |
||||||||
| Manufacturing |
$ | 211,043 | $ | 238,841 | ||||
| Corporate and Other |
110,708 | 133,341 | ||||||
|
|
|
|
|
|||||
| Total Operating Assets |
321,751 | 372,182 | ||||||
| Consolidated income taxes receivable |
13,283 | — | ||||||
| Consolidated deferred income taxes, long-term |
4,221 | 34,722 | ||||||
|
|
|
|
|
|||||
| Consolidated Assets |
$ | 339,255 | $ | 406,904 | ||||
|
|
|
|
|
|||||
Note 24 – Sale of Repair and Maintenance Services Business
On September 30, 2015, the Company sold its railcar repair and maintenance services business for an aggregate purchase price of $20,000. The sale included assets of FCRS, which operated the Company’s railcar repair and maintenance services business, and FCSL, which owned a short-line railway. The net book value of assets that were sold was $14,283, which included accounts receivable of $2,776, inventory of $2,537, property plant and equipment of $7,740 and intangible assets of $1,230. The asset purchase agreement relating to the sale (the “Asset Purchase
66
Table of Contents
FreightCar America, Inc. and Subsidiaries
NOTES TO CONSOLIDATED FINANCIAL STATEMENTS (continued)
For the Years Ended December 31, 2016, 2015 and 2014
(in thousands, except for share and per share data)
Agreement”) contains customary representations, warranties, covenants and indemnities. On September 30, 2015, $1,960 of the aggregate purchase price was placed into escrow (which is recorded as a long-term receivable) in order to secure the indemnification obligations of FCRS and FCSL under the Asset Purchase Agreement and $451 was used to settle certain liabilities of FCRS and FCSL, resulting in cash proceeds to the Company of $17,589. Twenty-five percent (25%) of the escrow amount, reduced by the amount of any pending claims, will be released to FCRS on each of the dates that are 18 months and three years after the closing date of the transaction and the remaining amount, reduced by the amount of any pending claims, will be released to FCRS on the fifth anniversary of the closing date of the transaction. As a result of the sale, the Company recorded a pre-tax gain of $4,578.
In December 2013, the Company closed its underperforming maintenance and repair shop in Clinton, Indiana, reduced the carrying values of repair shop assets to their estimated fair market value, representing the estimated salvage values of building, equipment and rail at the facility and the estimated sales value of the associated land, and recorded restructuring and impairment charges of $1,741. Sale of the repair shop assets to a strategic buyer in September 2014 resulted in a pre-tax gain of $1,078.
67
Table of Contents
Item 9. Changes in and Disagreements With Accountants on Accounting and Financial Disclosure.
None.
Item 9A. Controls and Procedures.
Evaluation of Disclosure Controls and Procedures
Under the supervision and with the participation of our Chief Executive Officer and Chief Financial Officer, management evaluated the effectiveness of the design and operation of our disclosure controls and procedures (as defined in Rule 13a-15(e) and 15d-15(e) under the Securities Exchange Act of 1934, as amended (the “Exchange Act”)), as of the end of the period covered by our annual report on Form 10-K for the fiscal year ended December 31, 2016 (the “Evaluation Date”). Based upon that evaluation, the Chief Executive Officer and Chief Financial Officer have concluded that, as of the Evaluation Date, our disclosure controls and procedures were effective to ensure that information required to be disclosed in the reports that we file or submit under the Exchange Act is recorded, processed, summarized and reported, within the time periods specified in the Securities and Exchange Commission’s rules and forms.
MANAGEMENT’S REPORT ON INTERNAL CONTROL OVER FINANCIAL REPORTING
Management, under the supervision of the Chief Executive Officer and the Chief Financial Officer, is responsible for establishing and maintaining adequate internal control over financial reporting. Internal control over financial reporting, as defined in Rules 13a-15(f) and 15d-15(f) promulgated under the Exchange Act, is a process designed by, or under the supervision of, the Chief Executive Officer and Chief Financial Officer and effected by the board of directors, management, and other personnel to provide reasonable assurance regarding the reliability of financial reporting and the preparation of financial statements for external reporting purposes in accordance with GAAP. Internal control over financial reporting includes those policies and procedures that:
| • | Pertain to the maintenance of records that, in reasonable detail, accurately and fairly reflect the transactions and dispositions of the assets of the Company; |
| • | Provide reasonable assurance that transactions are recorded as necessary to permit preparation of financial statements in accordance with GAAP; |
| • | Provide reasonable assurance that receipts and expenditures of the Company are being made only in accordance with appropriate authorization of management and the board of directors; and |
| • | Provide reasonable assurance regarding prevention or timely detection of unauthorized acquisition, use, or disposition of the Company’s assets that could have a material effect on the financial statements. |
As of the end of the Company’s 2016 fiscal year, management conducted an evaluation of the effectiveness of the Company’s internal control over financial reporting based on the framework established in Internal Control-Integrated Framework (2013) issued by the Committee of Sponsoring Organizations of the Treadway Commission (COSO). The Company’s system of internal control over financial reporting is designed to provide reasonable assurance to the Company’s management and board of directors regarding the reliability of financial records used in preparation of the Company’s published financial statements. As all internal control systems have inherent limitations, even systems determined to be effective can provide only reasonable assurance with respect to financial statement preparation and presentation. Based on its assessment, management has concluded that the Company’s internal control over financial reporting was effective as of December 31, 2016.
The effectiveness of the Company’s internal control over financial reporting as of December 31, 2016 has been audited by Deloitte & Touche LLP, an independent registered public accounting firm, as stated in their report appearing herein.
CHANGES IN INTERNAL CONTROL OVER FINANCIAL REPORTING
There has been no change in our internal control over financial reporting during the last fiscal quarter of 2016 that has materially affected, or is reasonably likely to materially affect, our internal control over financial reporting.
68
Table of Contents
None.
Item 10. Directors, Executive Officers and Corporate Governance.
Information required to be disclosed by this item is hereby incorporated by reference to the information under the captions “Governance of the Company,” “Stock Ownership,” “Section 16(a) Beneficial Ownership Reporting Compliance,” “Executive Officers,” “Compensation Discussion and Analysis” and “Executive Compensation” in our definitive Proxy Statement to be filed pursuant to Regulation 14A, which Proxy Statement is anticipated to be filed with the Securities and Exchange Commission within 120 days after the end of our fiscal year ended December 31, 2016.
Item 11. Executive Compensation.
Information required to be disclosed by this item is hereby incorporated by reference to the information under the captions “Executive Compensation,” “Board of Directors,” “Compensation Discussion and Analysis” and “Director Compensation” in our definitive Proxy Statement to be filed pursuant to Regulation 14A, which Proxy Statement is anticipated to be filed with the Securities and Exchange Commission within 120 days after the end of our fiscal year ended December 31, 2016.
Item 12. Security Ownership of Certain Beneficial Owners and Management and Related Stockholder Matters.
Information required to be disclosed by this item is hereby incorporated by reference to the information under the captions “Stock Ownership” and “Equity Compensation Plan Information” in our definitive Proxy Statement to be filed pursuant to Regulation 14A, which Proxy Statement is anticipated to be filed with the Securities and Exchange Commission within 120 days after the end of our fiscal year ended December 31, 2016.
Item 13. Certain Relationships and Related Transactions, and Director Independence.
Information required to be disclosed by this item is hereby incorporated by reference to the information under the captions “Certain Transactions” and “Board of Directors” in our definitive Proxy Statement to be filed pursuant to Regulation 14A, which Proxy Statement is anticipated to be filed with the Securities and Exchange Commission within 120 days after the end of our fiscal year ended December 31, 2016.
Item 14. Principal Accounting Fees and Services.
Information required to be disclosed by this item is hereby incorporated by reference to the information under the caption “Fees of Independent Registered Public Accounting Firm and Audit Committee Report” in our definitive Proxy Statement to be filed pursuant to Regulation 14A, which Proxy Statement is anticipated to be filed with the Securities and Exchange Commission within 120 days after the end of our fiscal year ended December 31, 2016.
69
Table of Contents
Item 15. Exhibits, Financial Statement Schedules.
Exhibits
| (a) | Documents filed as part of this report: |
The following financial statements are included in this Form10-K:
1. Consolidated Financial Statements of FreightCar America, Inc. and Subsidiaries
Reports of Independent Registered Public Accounting Firm.
Consolidated Balance Sheets as of December 31, 2016 and 2015.
Consolidated Statements of Operations for the years ended December 31, 2016, 2015 and 2014.
Consolidated Statements of Comprehensive Income (Loss) for the years ended December 31, 2016, 2015 and 2014.
Consolidated Statements of Stockholders’ Equity for the years ended December 31, 2016, 2015 and 2014.
Consolidated Statements of Cash Flows for the years ended December 31, 2016, 2015 and 2014.
Notes to Consolidated Financial Statements.
2. Financial Statement Schedule
The following financial statement schedule is a part of this Form 10-K and should be read in conjunction with our audited consolidated financial statements.
Schedule II — Valuation and Qualifying Accounts
All other financial statement schedules are omitted because such schedules are not required or the information required has been presented in the aforementioned financial statements.
3. The exhibits listed on the “Exhibit Index” to this Form 10-K are filed with this Form 10-K or incorporated by reference as set forth below.
| (b) | The exhibits listed on the “Exhibit Index” to this Form 10-K are filed with this Form 10-K or incorporated by reference as set forth below. |
| (c) | Additional Financial Statement Schedules |
None.
70
Table of Contents
Pursuant to the requirements of Section 13 or 15(d) of the Securities Exchange Act of 1934, the registrant has duly caused this report to be signed on its behalf by the undersigned, thereunto duly authorized.
| FREIGHTCAR AMERICA, INC. | ||||
| Date: March 3, 2017 | By: | /s/ JOSEPH E. MCNEELY | ||
| Joseph E. McNeely, President and | ||||
| Chief Executive Officer | ||||
Pursuant to the requirements of the Securities Exchange Act of 1934, this report has been signed below by the following persons on behalf of the registrant and in the capacities and on the dates indicated.
| Signature |
Title |
Date | ||
| s/ JOSEPH E. MCNEELY Joseph E. McNeely |
President and Chief Executive Officer (principal executive officer) and Director | March 3, 2017 | ||
| /s/ MATTHEW S. KOHNKE Matthew S. Kohnke |
Vice President, Finance, Chief Financial Officer and Treasurer (principal financial officer) | March 3, 2017 | ||
| /s/ JOSEPH J. MALIEKEL Joseph J. Maliekel |
Vice President and Corporate Controller (principal accounting officer) | March 3, 2017 | ||
| /s/ WILLIAM D. GEHL William D. Gehl |
Chairman of the Board and Director |
March 3, 2017 | ||
| /s/ JAMES D. CIRAR James D. Cirar |
Director | March 3, 2017 | ||
| /s/ THOMAS A. MADDEN Thomas A. Madden |
Director | March 3, 2017 | ||
| /s/ MALCOLM F. MOORE Malcolm F. Moore |
Director | March 3, 2017 | ||
| /s/ ANDREW B. SCHMITT Andrew B. Schmitt |
Director | March 3, 2017 | ||
| /s/ S. CARL SODERSTROM, JR. S. Carl Soderstrom, Jr. |
Director | March 3, 2017 | ||
71
Table of Contents
FreightCar America, Inc. and Subsidiaries
Schedule II – Valuation and Qualifying Accounts
For the Years Ended December 31, 2016, 2015 and 2014
(in thousands)
| Balance at Beginning of Period |
Additions Charged to Costs and Expenses |
Deductions, Accounts Charged Off and Recoveries of Amounts Previously Written Off |
Balance at End of Period |
|||||||||||||
| Year Ended December 31, 2016 |
||||||||||||||||
| Allowance for doubtful accounts |
$ | 82 | $ | — | $ | (60 | ) | $ | 22 | |||||||
| Deferred tax assets valuation allowance |
5,797 | — | (600 | ) | 5,197 | |||||||||||
| Inventory reserve |
3,793 | 2,344 | (1,830 | ) | 4,307 | |||||||||||
| Year Ended December 31, 2015 |
||||||||||||||||
| Allowance for doubtful accounts |
$ | 188 | $ | — | $ | (106 | ) | $ | 82 | |||||||
| Deferred tax assets valuation allowance |
6,219 | — | (422 | ) | 5,797 | |||||||||||
| Inventory reserve |
2,381 | 1,458 | (46 | ) | 3,793 | |||||||||||
| Year Ended December 31, 2014 |
||||||||||||||||
| Allowance for doubtful accounts |
$ | 221 | $ | — | $ | (33 | ) | $ | 188 | |||||||
| Deferred tax assets valuation allowance |
6,616 | — | (397 | ) | 6,219 | |||||||||||
| Inventory reserve |
1,793 | 1,252 | (664 | ) | 2,381 | |||||||||||
72
Table of Contents
EXHIBIT INDEX
| 2.1 | Asset Purchase Agreement, dated September 30, 2015, by and among FreightCar Rail Services, LLC, FreightCar Short Line, Inc. and ARS Nebraska, LLC. (incorporated by reference to Exhibit 2.1 to the Company’s Quarterly Report on Form 10-Q for the quarterly period ended September 30, 2015 filed with the Commission on November 3, 2015). | |
| 3.1 | Certificate of Ownership and Merger of FreightCar America, Inc. into FCA Acquisition Corp., as amended (incorporated by reference to Exhibit 3.1 to the Company’s Current Report on Form 8-K filed with the Commission on September 7, 2006). | |
| 3.2 | Third Amended and Restated By-laws of FreightCar America, Inc. (incorporated by reference to Exhibit 3.1 to the Company’s Current Report filed on Form 8-K filed with the Commission on September 28, 2007). | |
| 4.1 | Form of Registration Rights Agreement, by and among FreightCar America, Inc., Hancock Mezzanine Partners, L.P., John Hancock Life Insurance Company, Caravelle Investment Fund, L.L.C., Trimaran Investments II, L.L.C., Camillo M. Santomero, III, and the investors listed on Exhibit A attached thereto (incorporated by reference to Exhibit 4.3 to Registration Statement Nos. 333-123384 and 333-123875 filed with the Commission on April 4, 2005). | |
| 10.1 | Letter agreement regarding Terms of Employment dated August 27, 2010 by and between FreightCar America, Inc. and Joseph E. McNeely (incorporated by reference to Exhibit 10.1 to the Company’s Current Report on Form 8-K filed with the Commission on August 27, 2010). | |
| 10.2 | Letter agreement regarding Terms of Employment dated April 30, 2013 by and between FreightCar America, Inc. and Joseph E. McNeely (incorporated by reference to Exhibit 10.1 to the Company’s Current Report on Form 8-K filed with the Commission on May 2, 2013). | |
| 10.3 | Letter agreement regarding Terms of Employment dated October 4, 2013 by and between FreightCar America, Inc. and Joseph E. McNeely (incorporated by reference to Exhibit 10.1 to the Company’s Current Report on Form 8-K filed with the Commission on October 4, 2013). | |
| 10.4 | Letter agreement regarding Terms of Employment dated July 9, 2013 by and between FreightCar America, Inc. and Charles F. Avery, Jr. (incorporated by reference to Exhibit 10.1 to the Company’s Current Report on Form 8-K filed with the Commission on July 22, 2013) | |
| 10.5 | Employment agreement of Thomas P. McCarthy dated as of June 4, 2007, by and between FreightCar America, Inc. and Thomas P. McCarthy (incorporated by reference to Exhibit 10.2 to the Company’s Annual Report on Form 10-K for the year ended December 31, 2010) | |
| 10.6 | Amendment to employment agreement of Thomas P. McCarthy dated as of December 29, 2008. (incorporated by reference to Exhibit 10.4 to the Company’s Annual Report on Form 10-K for the year ended December 31, 2010) | |
| 10.7 | Letter agreement regarding Terms of Employment dated November 17, 2015 by and between FreightCar America, Inc. and Georgia L. Vlamis (incorporated by reference to Exhibit 10.1 to the Company’s Current Report on Form 8-K filed with the Commission on December 2, 2015). | |
| 10.8 | Letter agreement regarding Terms of Employment dated January 19, 2016 by and between FreightCar America, Inc. and Matthew S. Kohnke (incorporated by reference to Exhibit 10.1 to the Company’s Current Report on Form 8-K filed with the Commission on January 25, 2016). | |
| 10.9 | Letter agreement regarding Terms of Employment dated May 25, 2016 by and between FreightCar America, Inc. and Theodore W. Baun (incorporated by reference to Exhibit 10.1 to the Company’s Current Report on Form 8-K filed with the Commission on May 27, 2016). | |
| 10.10 | FreightCar America, Inc. 2005 Long Term Incentive Plan (Restated to incorporate all Amendments) (incorporated by reference to Appendix I to the Company’s Proxy Statement for the annual meeting of stockholders held on May 17, 2013 filed with the Commission on April 12, 2013). | |
73
Table of Contents
| 10.11 | Form of Restricted Share Award Agreement for the Company’s independent directors (incorporated by reference to Exhibit 10.1 to the Company’s Current Report on Form 8-K filed with the Commission on January 27, 2006). | |
| 10.12 | Form of Restricted Share Award Agreement for the Company’s employees (incorporated by reference to Exhibit 10.1 to the Company’s Current Report on Form 8-K filed with the Commission on January 15, 2008). | |
| 10.13 | Form of Stock Option Award Agreement for the Company’s employees (incorporated by reference to Exhibit 10.1 to the Company’s Current Report on Form 8-K filed with the Commission on January 15, 2008). | |
| 10.14 | Form of Performance Share Award Agreement for the Company’s employees (incorporated by reference to Exhibit 10.1 to the Company’s Current Report on Form 8-K filed with the Commission on January 16, 2015). | |
| 10.15 | Lease Agreement, dated as of December 20, 2004, by and between Norfolk Southern Railway Company and Johnstown America Corporation (the “Lease Agreement”) (incorporated by reference to Exhibit 10.27 to Registration Statement Nos. 333-123384 and 333-123875 filed with the Commission on April 4, 2005).* | |
| 10.16 | Amendment to the Lease Agreement, dated as of December 1, 2005 (incorporated by reference to Exhibit 10.11 to the Company’s Annual Report on Form 10-K for the year ended December 31, 2005).* | |
| 10.17 | Second Amendment to the Lease Agreement, dated as of February 1, 2008, by and between Norfolk Southern Railway Company and Johnstown America Corporation (incorporated by reference to Exhibit 10.1 to the Company’s Quarterly Report on Form 10-Q for the quarterly period ended March 31, 2008 filed with the Commission on May 12, 2008). | |
| 10.18 | Amendment to Lease, dated as of October 12, 2012, by and between Norfolk Southern Railway Company and Johnstown America Corporation (incorporated by reference to Exhibit 10.1 to the Company’s Quarterly Report on Form 10-Q for the quarterly period ended September 30, 2012 filed with the Commission on November 9, 2012).* | |
| 10.19 | Amendment to Lease Agreement, dated as of November 23, 2015, by and between Norfolk Southern Railway Company and Johnstown America Corporation (incorporated by reference to Exhibit 10.20 to the Company’s Annual Report on Form 10-K for the year ended December 31, 2015).* | |
| 10.20 | Sublease, dated as of February 19, 2013, by and between Navistar, Inc. and FreightCar Alabama, LLC (incorporated by reference to Exhibit 10.1 to the Company’s Quarterly Report on Form 10-Q for the quarterly period ended March 31, 2013 filed with the Commission on May 10, 2013).* | |
| 10.21 | Amendment to Sublease, dated as of March 11, 2013, by and among Teachers’ Retirement Systems of Alabama, Employees’ Retirement System of Alabama, Navistar, Inc. and FreightCar Alabama, LLC (incorporated by reference to Exhibit 10.2 to the Company’s Quarterly Report on Form 10-Q for the quarterly period ended March 31, 2013 filed with the Commission on May 10, 2013).* | |
| 10.22 | Second Amendment to Sublease and Consent to Sublease, dated October 27, 2014, by and among Teachers’ Retirement Systems of Alabama, Employees’ Retirement System of Alabama, Navistar, Inc. and FreightCar Alabama, LLC (incorporated by reference to Exhibit 10.23 to the Company’s Annual Report on Form 10-K for the year ended December 31, 2015).* | |
| 10.23 | Third Amendment to Sublease and Consent to Sublease, dated as of February 1, 2016, by and among Teachers’ Retirement Systems of Alabama, Employees’ Retirement System of Alabama, Navistar, Inc. and FreightCar Alabama, LLC. (incorporated by reference to Exhibit 10.1 to the Company’s Quarterly Report on Form 10-Q for the quarterly period ended March 31, 2016 filed with the Commission on May 3, 2016).* | |
| 10.24 | Credit Agreement, dated as of July 26, 2013, by and among FreightCar America, Inc. and certain of its subsidiaries and Bank of America, N.A. (incorporated by reference to Exhibit 10.1 to the Company’s Current Report on Form 8-K filed with the Commission on August 1, 2013). | |
74
Table of Contents
| 10.25 | Security and Pledge Agreement, dated as of July 26, 2013, by and among FreightCar America, Inc. and certain of its subsidiaries and Bank of America, N.A. (incorporated by reference to Exhibit 10.2 to the Company’s Current Report on Form 8-K filed with the Commission on August 1, 2013). | |
| 10.26 | First Amendment to Credit Agreement, dated as of June 13, 2016, by and among FreightCar America, Inc. and certain of its subsidiaries and Bank of America, N.A. (incorporated by reference to Exhibit 10.1 to the Company’s Quarterly Report on Form 10-Q for the quarterly period ended June 30, 2016 filed with the Commission on August 2, 2016). | |
| 10.27 | FreightCar America, Inc. Executive Severance Plan (As Amended and Restated Effective December 1, 2016) (and Summary Plan Description). | |
| 10.28 | Form of Letter of Resignation (incorporated by reference to Exhibit 10.1 to the Company’s Current Report on Form 8-K filed with the Commission on December 19, 2006). | |
| 10.29 | Form of Letter of Resignation (incorporated by reference to Exhibit 10.1 to the Company’s Current Report on Form 8-K filed with the Commission on December 20, 2009). | |
| 10.30 | Form of Indemnification Agreement between FreightCar America, Inc. and each of its current directors (incorporated by reference to Exhibit 10.1 to the Company’s Current Report on Form 8-K filed with the Commission on March 24, 2010). | |
| 21 | Subsidiaries of FreightCar America, Inc. | |
| 23 | Consent of Independent Registered Public Accounting Firm. | |
| 31.1 | Certification of Chief Executive Officer pursuant to Rule 13a-14(a), as adopted pursuant to Section 302 of the Sarbanes-Oxley Act of 2002. | |
| 31.2 | Certification of Chief Financial Officer pursuant to Rule 13a-14(a), as adopted pursuant to Section 302 of the Sarbanes-Oxley Act of 2002. | |
| 32 | Certification of Chief Executive Officer and Chief Financial Officer pursuant to 18 U.S.C. Section 1350, as adopted pursuant to Section 906 of the Sarbanes-Oxley Act of 2002. | |
| 101.INS | XBRL Instance Document | |
| 101.SCH | XBRL Taxonomy Extension Schema Document | |
| 101.CAL | XBRL Taxonomy Extension Calculation Linkbase Document | |
| 101.DEF | XBRL Taxonomy Extension Definition Linkbase Document | |
| 101.LAB | XBRL Taxonomy Extension Label Linkbase Document | |
| 101PRE | XBRL Taxonomy Extension Presentation Linkbase Document | |
| * | Confidential treatment has been granted for the redacted portions of this exhibit. A complete copy of the exhibit, including the redacted portions, has been filed separately with the Securities and Exchange Commission. |
75