Attached files
| file | filename |
|---|---|
| 8-K - 8-K - Prestige Consumer Healthcare Inc. | a8-kpressreleaseseptember2.htm |
| EX-99.1 - EXHIBIT - Prestige Consumer Healthcare Inc. | exhibit991fy15-q2earningsr.htm |

P R E S T I G E B R A N D S S e c o n d Q u a r t e r F ’ 1 5 R e s u l t s 1 Review of Second Quarter F’15 Results Matt Mannelly, CEO & President Ron Lombardi, CFO November 6, 2014
P R E S T I G E B R A N D S S e c o n d Q u a r t e r F ’ 1 5 R e s u l t s 2 This presentation contains certain “forward-looking” statements within the meaning of the Private Securities Litigation Reform Act of 1995, such as statements about the Company’s product introductions, investments in brand building, debt reduction, integration of the Insight acquisition, consumption growth and market position of the Company’s brands, M&A market activity, and the Company’s future financial performance. Words such as “continue,” “will,” “expect,” “project,” “anticipate,” “likely,” “estimate,” “may,” “should,” “could,” “would,” and similar expressions identify forward-looking statements. Such forward-looking statements represent the Company’s expectations and beliefs and involve a number of known and unknown risks, uncertainties and other factors that may cause actual results to differ materially from those expressed or implied by such forward-looking statements. These factors include, among others, the failure to successfully integrate the Insight or Hydralyte businesses or future acquisitions, the failure to successfully commercialize new products, the severity of the cold and flu season, general economic and business conditions, competitive pressures, the effectiveness of the Company’s brand building investments, fluctuating foreign exchange rates, and other risks set forth in Part I, Item 1A. Risk Factors in the Company’s Annual Report on Form 10-K for the year ended March 31, 2014 and in Part II, Item 1A. Risk Factors in the Company’s Quarterly Report on Form 10-Q for the quarter ended June 30, 2014. You are cautioned not to place undue reliance on these forward-looking statements, which speak only as of the date this presentation. Except to the extent required by applicable law, the Company undertakes no obligation to update any forward-looking statement contained in this presentation, whether as a result of new information, future events, or otherwise. Safe Harbor Disclosure

P R E S T I G E B R A N D S S e c o n d Q u a r t e r F ’ 1 5 R e s u l t s 3 Agenda for Today’s Discussion I. Second Quarter FY2015: Performance Highlights II. Second Quarter FY2015: Financial Overview III. FY2015 Outlook and the Road Ahead

P R E S T I G E B R A N D S S e c o n d Q u a r t e r F ’ 1 5 R e s u l t s 4 I. Second Quarter FY2015: Performance Highlights

P R E S T I G E B R A N D S S e c o n d Q u a r t e r F ’ 1 5 R e s u l t s 5 Q2 Performance Highlights: Strong Performance in A Challenging Retail Environment Q2 consolidated Total Revenue of $181.3 million, up 8.6% versus the prior year corresponding quarter − 1.0% growth excluding the impact of the recently closed Insight Pharmaceuticals acquisition Adjusted E.P.S. of $0.50(1), up 6.4% versus the prior year corresponding quarter Strong Adjusted Free Cash Flow of $36.5(1) million, up 14.7% versus the prior year corresponding quarter Core OTC consumption growth of 4.9% (excluding products impacted by pediatric and GI category dynamics) Continued investment in brand building efforts − New advertising campaigns − Goody’s sports marketing partnerships − New products, digital marketing and promotions across brands Closed acquisition of Insight Pharmaceuticals in September. Integration well underway On track to continue to deliver strong financial performance in FY2015 − Full year sales growth +15% – 18% − Adjusted E.P.S $1.75 – $1.85(1) − Adjusted Free Cash Flow of approximately $150 million(1) Notes: (1) These Non-GAAP financial measures are reconciled to their most closely related GAAP financial measures in our earnings release in the “About Non-GAAP Financial Measures” section.

P R E S T I G E B R A N D S S e c o n d Q u a r t e r F ’ 1 5 R e s u l t s 6 Building Prestige’s Portfolio: A Platform for Value Creation Focus on Brand Building Create a Diversified OTC Portfolio Leverage Our Financial Model to Build the Portfolio Focus on long-term growth of Core OTC brands Invest behind brand building efforts that result in market share gains Manage through challenging retail environment Build and add to strategic category platforms and geographies Effectively execute and integrate acquisitions Access a larger pool of prospective M&A candidates Efficient operating model Strong margin profile and consistent cash flow conversion Provides capacity for additional, accretive acquisitions

P R E S T I G E B R A N D S S e c o n d Q u a r t e r F ’ 1 5 R e s u l t s 7 Goody’s Headache Relief Shot 500 Victory on the Track and at Retail Dale Will Drive the Goody’s Car #88 in Texas next year and promote “speed” Consumption +2x Category Growth in L-12 Weeks Our Marketing Model at Work: Sports Marketing Events & Partnerships “Drive” Goody’s Sales Source: IRI MULO + C-Store, L12-week period ending October 5, 2014. Note: Data reflects retail dollar sales.

P R E S T I G E B R A N D S S e c o n d Q u a r t e r F ’ 1 5 R e s u l t s 8 Our Marketing Model at Work: New Flavors & Launch Tour Sweeten Consumption Consumer research drives new flavor selections and zeros in on taste preferences of key target audience to grow franchise Watermelon, Blue Raspberry and Sugar-Free Black Cherry on shelf mid-September Launch plan focuses on high profile music events in cities across America to drive sampling, raise awareness, and engage the brand’s demographic Bumbershoot Music Festival Boston Calling Music Festival Source: IRI MULO + C-Store, L4-week period ending October 5, 2014. Note: Data reflects retail dollar sales. New Product Extension Innovative Sampling Efforts Consumption +7.6% Since Launch; +2.8x Category Growth
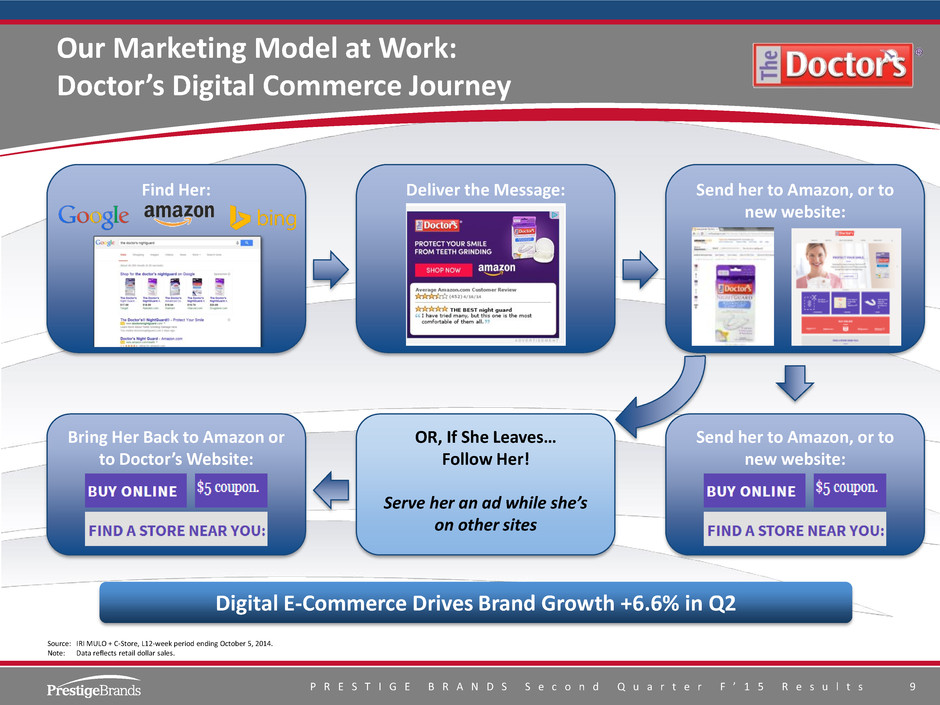
P R E S T I G E B R A N D S S e c o n d Q u a r t e r F ’ 1 5 R e s u l t s 9 Our Marketing Model at Work: Doctor’s Digital Commerce Journey Source: IRI MULO + C-Store, L12-week period ending October 5, 2014. Note: Data reflects retail dollar sales. Digital E-Commerce Drives Brand Growth +6.6% in Q2 Find Her: Deliver the Message: Send her to Amazon, or to new website: Send her to Amazon, or to new website: OR, If She Leaves… Follow Her! Serve her an ad while she’s on other sites Bring Her Back to Amazon or to Doctor’s Website:

P R E S T I G E B R A N D S S e c o n d Q u a r t e r F ’ 1 5 R e s u l t s 1 0 Our Marketing Model at Work: Partnering With Retailers on Portfolio Promotions Trade activation programs leverage scale within categories by partnering core brands with loyalty brands to increase consumer shopping basket Partnering with Retailers Across the Portfolio Eyes & Ear Dermatologicals Digestives

P R E S T I G E B R A N D S S e c o n d Q u a r t e r F ’ 1 5 R e s u l t s 1 1 (1.8%) 1.0% 2.5% 4.9% Source: Latest 12-week IRI multi-outlet retail dollar sales growth for relevant quarter. Data reflects retail dollar sales percentage growth versus prior period. (1) Excludes PediaCare, Little Remedies, Beano and Insight Pharmaceuticals. Excluding Cough/Cold Competitive Returns / GI Category Dynamics(1) (1) Continued Improvement in Retail Consumption Performance Has Contributed to Sustained Market Share Gains Core OTC Consumption Growth Core OTC Market Share(1) 10.6% 10.9% FY’15 Q1 Q2 FY’15 Q1 Q2 Consumption Growth Accelerating Brand Building Leading to Share Gains
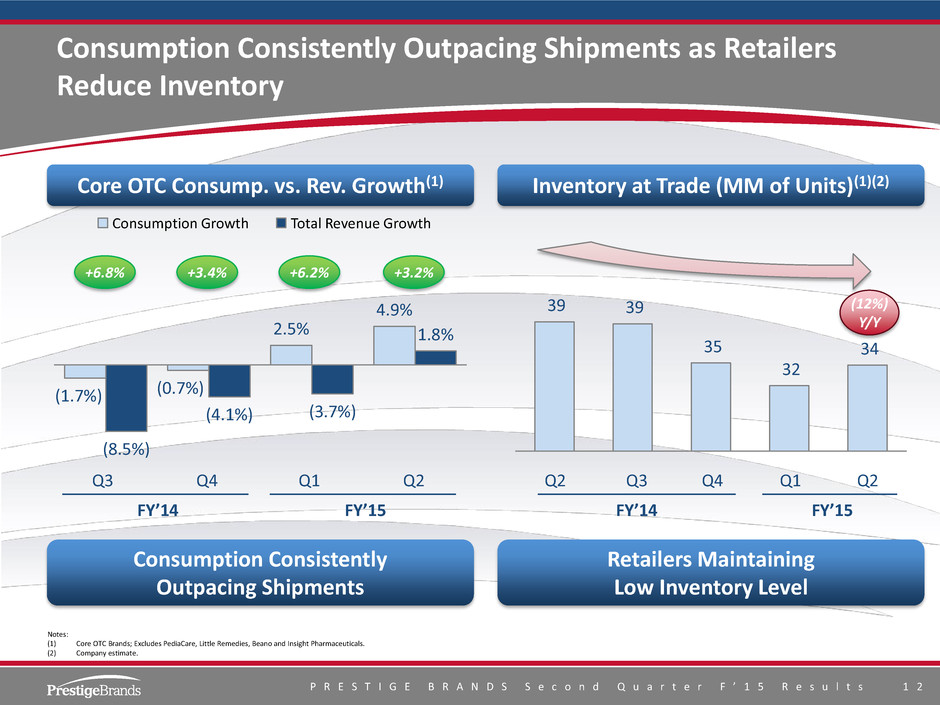
P R E S T I G E B R A N D S S e c o n d Q u a r t e r F ’ 1 5 R e s u l t s 1 2 Consumption Consistently Outpacing Shipments as Retailers Reduce Inventory Notes: (1) Core OTC Brands; Excludes PediaCare, Little Remedies, Beano and Insight Pharmaceuticals. (2) Company estimate. 6.8% 3.4% 6.2% 3.2% Q3 Q4 Q1 Q2 Core OTC Consump. vs. Rev. Growth(1) G rowt h D if fe ren ce FY’14 (1.7%) (0.7%) 2.5% 4.9% (8.5%) (4.1%) (3.7%) 1.8% FY’15 Total Revenue Growth Consumption Growth Consumption Consistently Outpacing Shipments 39 39 35 32 34 Inventory at Trade (MM of Units)(1)(2) Retailers Maintaining Low Inventory Level FY’14 FY’15 +6.8% +3.4% +6.2% +3.2% Q3 Q4 Q1 Q2 Q3 Q4 Q1 Q2 Q2 (12%) Y/Y
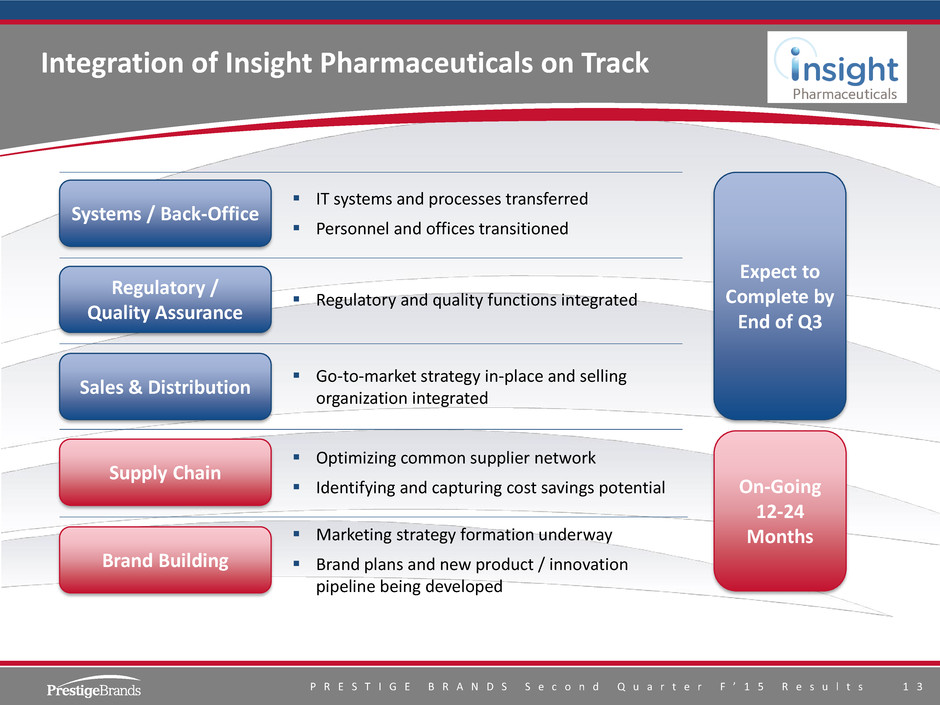
P R E S T I G E B R A N D S S e c o n d Q u a r t e r F ’ 1 5 R e s u l t s 1 3 Integration of Insight Pharmaceuticals on Track Regulatory / Quality Assurance Systems / Back-Office Supply Chain Sales & Distribution IT systems and processes transferred Personnel and offices transitioned Brand Building Expect to Complete by End of Q3 On-Going 12-24 Months Regulatory and quality functions integrated Go-to-market strategy in-place and selling organization integrated Optimizing common supplier network Identifying and capturing cost savings potential Marketing strategy formation underway Brand plans and new product / innovation pipeline being developed

P R E S T I G E B R A N D S S e c o n d Q u a r t e r F ’ 1 5 R e s u l t s 1 4 The Combined Prestige Portfolio Analgesics GI Women’s Health Cough & Cold Oral Care Sleep Aids Skin Care Household Cleaning Eye & Ear Care Care Pharmaceuticals New Brand New Brand New Brand New Brand New Brand New Brand New Brand New Brand New Brand New Brand

P R E S T I G E B R A N D S S e c o n d Q u a r t e r F ’ 1 5 R e s u l t s 1 5 Portfolio Anchored in Multiple Category Platforms of Scale $175 0% 20% 40% 60% 80% 100% $175 $200 $100 $140 $90 $70 ~$10 Women’s Health Cough Cold Analgesics Derm. Eye & Ear Oral Care Sleep Aids Other Insight Other Insight ~$50 Other Prestige PL Other Prestige GI Other Other Prestige Recent Acquisitions North America Australasia Oral Hydration Cough Cold ~$1BN Dollar values in millions Source: North America – IRI MULO + C-Store, L52-week period ending October 5, 2014. Note: Data reflects retail dollar sales.

P R E S T I G E B R A N D S S e c o n d Q u a r t e r F ’ 1 5 R e s u l t s 1 6 Acquisitions Have Strengthened Our OTC Platform Category Breadth(1) International Expansion(1) Brand Scale (Top 4 Brands)(2) Channel Diversity FY2010 FY2015 Food, Drug, Mass Food, Drug, Mass, Convenience, Club and Dollar ~$35MM / ~10% ~$110MM / ~15% Cough & Cold Eye & Ear Derm. Oral Care Women’s Health Cough & Cold Analgesics Eye & Ear GI Derm. Oral Care +3.5x +3.1x +3.0x Expanded Avg.: $38MM Avg.: $113MM Dollar values in millions (1) Based on company estimates. (2) IRI MULO + C-Store data, reflects retail dollar sales.
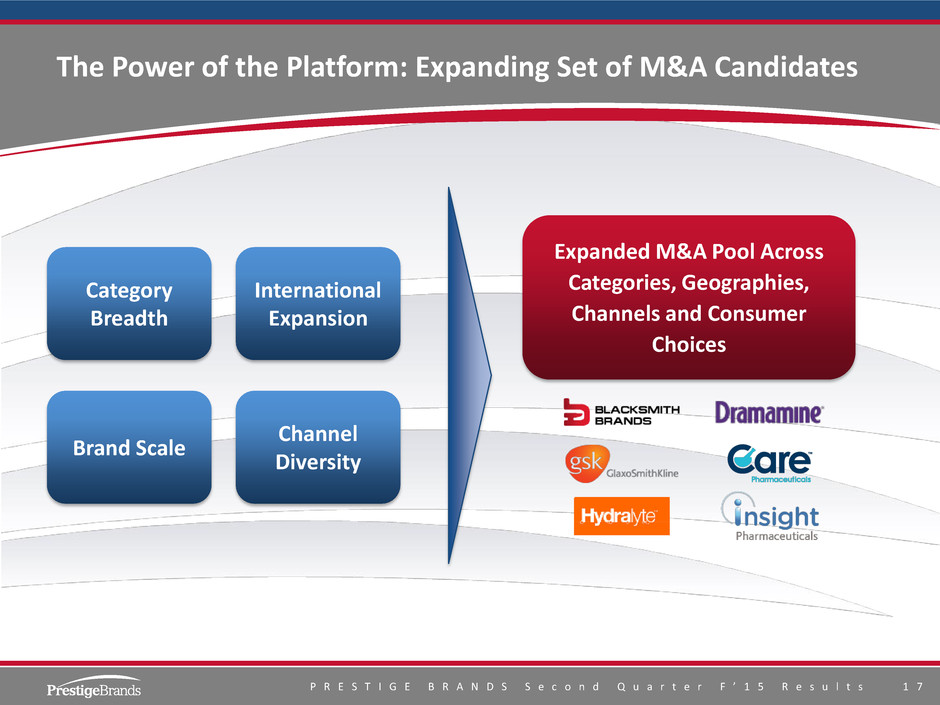
P R E S T I G E B R A N D S S e c o n d Q u a r t e r F ’ 1 5 R e s u l t s 1 7 The Power of the Platform: Expanding Set of M&A Candidates Category Breadth International Expansion Brand Scale Channel Diversity Expanded M&A Pool Across Categories, Geographies, Channels and Consumer Choices

P R E S T I G E B R A N D S S e c o n d Q u a r t e r F ’ 1 5 R e s u l t s 1 8 II. Second Quarter FY2015: Financial Overview

P R E S T I G E B R A N D S S e c o n d Q u a r t e r F ’ 1 5 R e s u l t s 1 9 Selected Observations on Second Quarter Performance Solid overall financial performance in the quarter consistent with expectations − Total Revenue growth of 8.6% based on increasingly diversified portfolio and impact of Insight − Adjusted EPS of $0.50(1) up 6.4% versus the prior year corresponding quarter − Strong adjusted free cash flow of $36.5(1) million, up 14.7% versus the prior year corresponding quarter On track to achieve full year outlook $166.9 $58.1 $31.8 $181.3 $63.2 $36.5 Total Revenue Adjusted EBITDA Adjusted EPS Adjusted Free Cash Flow Q2 FY’15 Q2 FY’14 8.6% 8.8% 6.4% 14.7% $0.47 $0.50 (1) (1) (1) Dollar values in millions, except per share data Notes: (1) These non-GAAP financial measures are reconciled to their most closely related GAAP financial measures in our earnings release in the “About Non-GAAP Financial Measures” section.

P R E S T I G E B R A N D S S e c o n d Q u a r t e r F ’ 1 5 R e s u l t s 2 0 Three Months Ended Six Months Ended Sep '14 Sep '13 % Chg Sep '14 Sep '13 % Chg Total Revenue 181.3$ 166.9$ 8.6% 327.0$ 309.5$ 5.7% Adj. Gross Margin(1) 103.3 94.2 9.7% 185.3 177.3 4.5% % Margin 57.0% 56.4% 56.7% 57.3% A&P 25.0 24.5 2.0% 44.1 43.2 2.1% % Total Revenue 13.8% 14.7% 13.5% 14.0% Adj. G&A (1) 15.0 11.5 30.5% 26.9 22.7 18.7% % Total Revenue 8.3% 6.9% 8.2% 7.3% Adjusted EBITDA (1) 63.2$ 58.1$ 8.8% 114.3$ 111.4$ 2.6% % Margin 34.9% 34.8% 34.9% 36.0% Adjusted Net Income (1) 26.4$ 24.6$ 7.0% 47.9$ 45.7$ 4.7% Adjusted Earnings Per Share(1) 0.50$ 0.47$ 6.4% 0.91$ 0.88$ 3.4% FY’15 Second Quarter and YTD Consolidated Financial Summary Dollar values in millions Notes: (1) These Non-GAAP financial measures are reconciled to their most closely related GAAP financial measures in our earnings release in the “About Non-GAAP Financial Measures” section. Q2 Total Revenue growth of +8.6%; 1.0% growth excluding the impact of the recently closed Insight Pharmaceuticals acquisition Q2 Adjusted Gross Margin expansion of ~60 bps versus the prior year corresponding quarter Q2 Adjusted EBITDA margin consistent at 34.9% Adjusted EPS growth of 6.4% versus the prior year corresponding quarter

P R E S T I G E B R A N D S S e c o n d Q u a r t e r F ’ 1 5 R e s u l t s 2 1 3 Months Ended 3 Months Ended 6 Months Ended 6 Months Ended Q2 FY'15 Q2 FY'14 Q2 FY'15 Q2 FY'14 Net Income EPS Net Income EPS Net Income EPS Net Income EPS As Reported 16.5$ 0.31$ 32.8$ 0.63$ 33.2$ 0.63$ 53.5$ 1.03$ Adjustments: Inventory Step-Up & Other Costs of Sales 0.8 0.01 1.0 0.02 0.9 0.01 1.0 0.02 Legal, Professional & Transaction Fees 8.1 0.15 0.1 - 12.8 0.25 0.7 0.01 Acquisition Integration & Transition Costs 4.0 0.09 - - 4.4 0.09 - - Tax Impact of Adjustments (2.9) (0.06) (0.1) (0.01) (3.5) (0.07) (0.4) (0.01) Impact of State Tax Adjustments - - (9.1) (0.17) - - (9.1) (0.17) Total Adjustments 9.9 0.19 (8.1) (0.16) 14.7 0.28 (7.8) (0.15) Adjusted 26.4$ 0.50$ 24.6$ 0.47$ 47.9$ 0.91$ 45.7$ 0.88$ Net Income and E.P.S. Reconciliation Dollar values in millions, except per share data Note: These Non-GAAP financial measures are reconciled to their reported GAAP amounts in our Earnings Release in the “About Non-GAAP Financial Measures” section. Q2 FY’15 YTD FY’15

P R E S T I G E B R A N D S S e c o n d Q u a r t e r F ’ 1 5 R e s u l t s 2 2 Q2 FY'15 Q2 FY'14 YTD FY'15 YTD FY'14 Net Income - As Reported 16.5$ 32.8$ 33.2$ 53.5$ Depreciation & Amortization 3.9 3.3 6.8 6.6 Other Non-Cash Operating Items 8.0 0.4 18.0 9.6 Working Capital (1.0) (3.7) (1.0) (14.1) Operating Cash Flow(1) 27.4$ 32.8$ 57.1$ 55.6$ Additions to Property and Equipment (0.9) (1.0) (1.4) (2.3) Integration, Transition and Other Payments Associated with Acquisitions 10.0 - 12.4 - Adjusted Free Cash Flow(3) 36.5$ 31.8$ 68.1$ 53.3$ Debt Profile & Financial Compliance: Total Net Debt at 9/30/14 of $1,677 million comprised of: – Cash on hand of $22 million – $1,048 million of term loan and revolver – $650 million of bonds Leverage ratio(2) of ~5.6x Strong Free Cash Flow Generation Dollar values in millions Notes: (1) Operating cash flow is equal to GAAP net cash provided by operating activities. (2) Leverage ratio reflects net debt / covenant defined EBITDA. (3) Adjusted Free Cash Flow is a Non-GAAP financial measure and is reconciled to GAAP net cash provided by operating activities in our earnings release in the “About Non-GAAP Financial Measure” section. Cash Flow Comments

P R E S T I G E B R A N D S S e c o n d Q u a r t e r F ’ 1 5 R e s u l t s 2 3 III. FY2015 Outlook and the Road Ahead

P R E S T I G E B R A N D S S e c o n d Q u a r t e r F ’ 1 5 R e s u l t s 2 4 Strategic Approach Continues to Create Shareholder Value − Improved Core OTC consumption trends leading to market share gains − Challenging retail environment continues to impact retailer inventory − Power of the portfolio provides favorable long term outlook − Continued new product introductions − Investment in brand building communication vehicles ● Typical 2nd half A&P increase ● Promotional spending − Ongoing evolution of marketing vehicles (sports marketing, digital) − Seasoned Integration Team and core competency ● Infrastructure largely in place by Q3 ● Brand building in progress–consumer learning, advertising, health care professionals − Stabilizing the business underway (supply and demand) − Marketing learning and foundation in FY’15 leads to investment in FY’16 − Remain aggressive and disciplined − Effectively integrate and acquisitions − Capitalize on OTC consolidation and major company announcements − Full year revenue growth +15% – 18% − Adjusted E.P.S $1.75 – $1.85(1) − Adjusted Free Cash Flow of approximately $150 million(1) Second Half of Year Brand Building in Focus Prolific M&A Outlook Confident in Full FY2015 Year Outlook Notes: (1) These Non-GAAP financial measures are reconciled to their most closely related GAAP financial measures in our earnings release in the “About Non-GAAP Financial Measures” section. Insight Integration

P R E S T I G E B R A N D S S e c o n d Q u a r t e r F ’ 1 5 R e s u l t s 2 5
